1. Introduction
Understanding individual movement patterns can provide information valuable for species management and conservation [
1,
2]. Knowledge of movement patterns is useful for evaluating a species’ resilience to environmental change [
3,
4], gene flow, demography, and population structure [
5]. Demographic connectivity relies on the survival and successful reproduction of dispersing individuals that ultimately determine the receiving population’s vital rates [
5]. Population connectivity is influenced by many factors controlling species-specific movement by individuals, including the capacity to navigate physical barriers (natural or anthropogenic), sex, seasonality of movement [
6], life-stage [
7], interspecific interactions [
8], and habitat suitability [
9]. Hence, assessment of movement patterns provides critical information on the spatial extent of populations that must be recognized to effectively monitor population dynamics and to inform conservation. Further, understanding the spatial distribution of individuals’ relatedness within the scope of their movement can provide insight into population genetic processes such as propensity to inbreeding [
10].
Fish movement can be associated with daily, seasonal, or occasional behaviors, which may manifest over short or long distances. Fishes exhibit complex life histories, often requiring multiple habitats to complete their life cycle [
11]. For instance, small-scale daily movements may be associated with habitats used for feeding and/or refuge from predators. Labbe and Fausch [
6] documented seasonal movements by Arkansas Darter
Etheostoma cragini between reproductive habitat and overwintering habitat in intermittent streams in Colorado (USA). Spawning by North American darters generally coincides with high spring-time flows that facilitate passive advective transport of larvae downstream (i.e., larval drift; [
12]). The extent of dispersal distances resulting from larval drift varies among species and relates in part to streamflow [
13]. Conversely, adults may move upstream prior to spawning to compensate for drift.
General approaches to studying movement patterns include real-time observation (e.g., radio tags), capture-mark-capture, microchemistry analysis, and DNA markers. The selection of approach depends on study objectives and the spatial and temporal scales of movement meant to be detected [
14]. Each approach has limitations to its application: some require culling individuals to retrieve hard parts, while others may be limited to specific sizes of fish appropriate for implanting tags [
14]. An inherent source of bias in many movement studies is the sampling design. Albanese et al. [
15] found that sampling longer recapture sections increased their ability to detect long-distance movements by stream fishes in Virginia (USA). Marking techniques such as visible implant elastomer (VIE) tags are useful for tagging small-bodied fishes but are subject to observer bias associated with tag colors and/or loss [
16]. Roberts and Angermeier [
17] suggested that VIE tag performance may be species-specific because of the variability in fish and tag color and in tag retention. Given the limitations of any single fish-marking approach, dual-tagging methods may provide more reliable characterizations of fish movement patterns.
Molecular methods, which indirectly measure dispersal over a range of spatial and temporal scales, are increasingly used to describe fish movement patterns. For example, Argentina et al. [
18] found no genetic structuring among populations of Variegate Darter
Etheostoma variatum presumed to be isolated by dams, suggesting that gene flow was mediated by dispersal among watersheds up to 400 km apart. Using molecular data for characterizing movement patterns poses a few disadvantages. Although costs associated with molecular analyses may exceed those of analyses based on traditional methods, recent advances in technology can make genetic markers more cost-effective overall [
19]. The availability of molecular markers for non-game species (those lacking fisheries) may limit some studies, but the conservation value of information gained through molecular data may far outweigh the monetary costs.
The degree to which larval drift and sub-adult movements contribute to within-stream demographic connectivity and population structure remains to be investigated for most fishes. In the absence of immigration and emigration, isolated populations rely on survival and local recruitment for persistence. To understand how movement and recruitment influence a population’s vital rates, it is important to combine genetic data with measures of movement to explain demographic connectivity [
5]. Few studies of stream fishes have combined direct measures of movement with measures of demographic connectivity based on molecular data. Ruppert et al. [
20] used passive integrated transponder (PIT) tags to track adult movements and genetic markers to characterize the population structure of Rocky Mountain Sculpin
Cottus sp. in British Columbia and Alberta (Canada). They concluded that most adults are sedentary and suggested that larval or juvenile dispersal is a main contributor to genetic connectivity but did not explicitly measure movement by sub-adults.
Parentage analysis based on molecular methods has recently been used to estimate the number of spawning adults, number of spawning events [
21], and extent of larval dispersal [
22]. Roberts et al. [
2] used pedigree reconstruction and assignment tests to identify reproductively successful long-distance movements (14–55 km) by Roanoke Logperch
Percina rex in Virginia (USA), revealing the importance of managing the species at the watershed scale. They also assessed natal dispersal distances but were unable to distinguish dispersal direction for many sibling pairs because natal sites could not be determined. Applying parentage analyses in small streams may prove more successful than in rivers, as it is more feasible to capture related individuals and infer natal dispersal in small streams.
Parentage analysis may also advance understanding of reproductive biology and provide insight into population persistence. Throughout a fish’s lifetime, it may move among a mosaic of habitat patches to grow, survive, and reproduce, which contributes to individual fitness. The number of surviving offspring, a measure of reproductive success, varies among individuals and years [
23]. Estimating reproductive success can provide inference regarding effective population size, generally described as the number of individuals contributing to the population gene pool. Understanding which and how many individuals contribute genes to subsequent generations can lead to inferences of susceptibility to inbreeding and the degree of functional habitat connectivity. Kanno et al. [
23] showed the importance of combining measures of movement and reproductive success of Brook Trout
Salvelinus fontinalis to determine connectivity among headwater streams and a mainstem river. An analogous approach may prove useful for understanding relations between temporal variability in reproductive success and the loss of genetic diversity in isolated populations.
Habitat degradation and restricted geographic range are major factors associated with the imperilment of minnows and darters, the most imperiled freshwater fish families in North America [
24]. The lack of knowledge for these species is striking given their degree of imperilment. Enhancing our understanding of the ecology and connectivity of isolated populations of imperiled species can provide information necessary for species management and conservation. The Candy Darter
Etheostoma osburni (
Figure S1a,b) represents a suite of other imperiled fishes in terms of their ecology, life-history traits, and vulnerability to anthropogenic threats. Candy Darter was listed as federally Endangered in response to widespread hybridization with an invasive congener, habitat degradation (increasing fine sediment, water temperature, and fragmentation), catastrophic events, and vulnerability to introduced predators [
25]. Endemic to the upper Kanawha River drainage in Virginia and West Virginia (USA), Candy Darter is restricted to four isolated populations in Virginia but occurs more extensively in West Virginia. Adults are habitat specialists [
26], generally restricted to areas with silt-free substrates and cool temperatures [
27]. Preferred microhabitats range from low-velocity areas used by age-0 fish to swift, shallow areas with complex substrates used by adults [
28]. Basic life-history traits, population demographics, and genetic structure of populations in Virginia are being assessed to inform potential conservation actions.
Despite the extensive literature on stream fish movement, we lack basic information for most species, including Candy Darter [
25]. Understanding movement patterns will increase our ability to identify barriers to dispersal and define the spatiotemporal extent of populations, which can inform future surveys, designation of critical habitat, and translocations. By comparing the results of traditional mark-recapture methods with those of molecular methods, we can evaluate the relative effectiveness of these methods for characterizing adult movements. Additionally, enhancing our understanding of the spatiotemporal distribution of parent-offspring pairs can provide insight into demographic connectivity, early-life movement, and the susceptibility of populations to decreased genetic diversity and increased inbreeding. Finally, understanding aspects of the species’ reproductive biology can provide insight into the mating system and reproductive success of individuals. To that end, our research involving Candy Darter addressed the following objectives: (1) measure and compare spatiotemporal patterns of adult movement based on traditional visual versus molecular marks, (2) describe the spatiotemporal distribution of related pairs to infer movement patterns of sub-adults, and (3) assess the reproductive contribution of adults to subsequent generations.
2. Materials and Methods
2.1. Study Area
We examined the movement of Candy Darter in Stony and Laurel creeks in Virginia in the southeastern United States. These represent two of the four remaining populations in Virginia and 17 populations range-wide. Virginia populations belong to a distinct genetic form (
Figure S1a,b) occurring in the Valley and Ridge physiographic province relative to populations occurring in the Appalachian Plateau physiographic province in West Virginia. Range-wide, many populations are small and/or isolated by physical barriers or long reaches of unsuitable habitat [
25]. Stony Creek supports one of the largest and densest Candy Darter populations in Virginia, while Laurel Creek supports a smaller, less dense population. These streams are the closest pair of populations in Virginia based on fluvial distance but are separated by approximately 50 fluvial kilometers.
Stony and Laurel creeks are third-order tributaries of the New River. Stony Creek is a cold-water, high-gradient stream in Giles County [
29]. Stream widths are 8–15 m. Candy Darter occupy approximately 18.8 km of Stony Creek. Because of underground mining, surface flow in the lower 1.5 km of Stony Creek is intermittent, which may act as a seasonal barrier to fish movement. Laurel Creek is a cool-water, high-gradient stream in Bland County [
28]. Stream widths are 1.2–8 m. Candy Darter occupy the lower 4.25 km, below a series of milldams.
We selected mark-recapture sites based on Candy Darter distributions reported in Dunn [
30]. Two sites were selected in Stony Creek, one near the center of the distribution (Interior) and one just upstream of the intermittent-flow reach near the mouth (Lower Stony;
Figure 1 and
Figure S2). Initial mark sites in Stony Creek included 3–4 riffles in a 150–200-m reach. We selected one site near the center of Candy Darter distribution in Laurel Creek. The initial mark site included five riffles in a 500-m reach (Mark Site;
Figure 1 and
Figure S3). Recapture sites for both streams encompassed the initial mark site(s) plus 7–17 riffles within 500 m upstream and downstream. All detected movements were considered minimum movements because we did not track movements continuously.
2.2. Sampling
We used quadrat-based electrofishing to sample fish. We used pulsed direct current from an LR-24 backpack (Smith-Root, Vancouver, WA, USA) to conduct a single electrofishing pass through all riffles in the mark and recapture sites. Beginning at the downstream end of each site and on either bank, a 1.5- × 3-m weighted seine with 5-mm mesh was held to the stream bottom by two crew members as a third person electro-fished downstream while disturbing the substrate, thereby allowing the streamflow to carry stunned fish into the seine [
31]. Electrofishing was conducted in transects, where a transect consisted of contiguous, non-overlapping seine sets across the stream width. After completing a transect, the crew moved 4 m upstream and began another transect. Each seine set encompassed a quadrat measuring 3 m × 4 m; sampling continued throughout the riffles of the sites. Our sampling protocol was similar to that used for Roanoke Logperch
Percina rex [
31], an-other endangered darter that is similar in habitat use to Candy Darter. We observed low mortality (<5%) for Candy Darter during our sampling. Mark and recapture events were separated by at least four weeks during May–September of 2016–2018.
We identified recaptured fish via data on length, sex, and tags. We measured the length of each captured Candy Darter and assigned a sex if determinable. Candy Darters were anesthetized in an immersion solution of AQUI-S 20E (20 mg/L; Aqua Tactics Fish Health, Kirkland, WA, USA) and stream water. When anesthetized, fish ≥ 55 mm total length received a subcutaneous visual implant elastomer (VIE; Northwest Marine Technology, Inc., Anacortes, WA, USA;
Figure S1c) tag. Riffle-specific batch tags were implanted in combinations of colors (red, black, orange, and yellow) and marking locations (ventral fin, ventral caudal peduncle, first dorsal fin, and second dorsal fin). During recapture events, all Candy Darter were visually inspected for previous tags using an ultraviolet light (
Figure S1c), then given a unique color-locale tag regardless of the presence of a previous tag. Individuals were tagged during two initial mark surveys (spring 2016 and 2017) and two recapture surveys (fall 2016 and 2017). A final recapture survey was conducted in spring 2018, but no new tags were given.
In addition to applying VIE tags, we collected a fin clip from each Candy Darter captured in mark-recapture sites as well as in supplemental sites designated for concurrent studies (
Figure 1,
Figures S2 and S3). Five supplemental sites were established in Stony Creek, approximately evenly distributed along the 18.8-km distribution (
Figure S2): Lower Stony, Below Vims, Pole Bridge, Cherokee Flats, and Glen Alton. Four supplemental sites were established in Laurel Creek (
Figure S3), approximately evenly distributed along the 4.25-km distribution: School, Aker’s Towing, Recapture Site, and Church. Names of supplemental sites refer to landmarks. Supplemental sites included 2–5 riffles within a 150–200-m reach and were sampled during May–June and August–October in 2017–2018. Supplemental sites were included to increase the chances of documenting long-distance movements. We clipped the lower lobe of the caudal fin for every individual upon every capture. Fin clips were placed in a small paper envelope for air-drying and labeled with a unique alphanumeric code corresponding to the capture location. After measuring lengths (standard and total) and weight and collecting a fin clip, we placed fish in a recovery tank with stream water until they resumed normal behaviors, then released them at the site of capture.
2.3. Molecular Analysis
Nine nuclear microsatellite loci were screened for genetic variation using primer pairs developed by Switzer et al. [
32] for Candy Darter. PCR protocols for nuclear markers were adapted from those of Switzer et al. [
32]. DNA was amplified using two multiplex PCR reactions (multiplex 1:
EosC208,
EosC207,
EosC112,
EosC117; multiplex 2:
EosD10,
EosC3,
EosC2,
EosD108,
EosD11). The PCR amplification was performed in a final volume of 10 µL and contained 2.0 µL of DNA extract, 2.0 µL Nanopure water, 2.0 µL 5× GoTaq Flexi Buffer (Promega, Madison, WI, USA), 1.75 µL 25 mM MgCl
2 (Promega, Madison, WI, USA), 1.15 µL 2.5 µM dNTPs (Promega, Madison, WI, USA), 0.5 µL of each primer, and 0.1 units/µL of GoTaq DNA polymerase (Promega, Madison, WI, USA). The PCR protocol consisted of an initial denaturation at 95 °C for 15 min; 25 cycles of: 94 °C denaturation for 30 s, 57 °C annealing for 90 s, and 72 °C extension for 1 min; and a 30-min extension at 60 °C. An aliquot of the PCR product was used for confirmation of amplification of DNA in a 2% agarose gel. PCR products were sent to the Cornell University Core Laboratory (Ithaca, NY, USA) for fragment-size analysis using an ABI 3730XL DNA Analyzer (Applied Biosystems, Waltham, MA, USA). Allele calls were scored using GeneMarker [
33].
We used identity analysis, which identifies matching genotypes within samples, to identify genetic recaptures. Multilocus genotypes were compared across all Candy Darter captured using Cervus v2.0 [
34]. Individuals were considered recaptures if genotypes at all loci matched. Genetic recaptures were then matched with commensurate field data, including date of capture, sex, total length (TL), and site of capture. We used comparisons of TL at initial and subsequent captures as the main criteria to validate genetic recaptures. We assumed fish would exhibit minimal shrinkage during our study, and removed from further analysis any recaptures for which TL at recapture was >5 mm smaller than the TL at initial capture.
Cervus v2.0 [
34] also was used for parentage analysis. The program considers multilocus genotypes among sampled offspring, then assigns putative parents of those individuals. Each Cervus run simulated 100,000 offspring for parentage of known sexes, with 0.15 as the proportion of parents sampled, 0.85 as proportion of loci typed, and 0.01 as proportion of mistyped loci, parameters that we estimated from our data. Following the simulation, the two most likely parent pairs were selected based on the logarithm of the odds (LOD) score.
Three separate parentage analysis runs were conducted. Individuals were assigned to age classes based on TL designations in Dunn [
29]: adults were coded as 1 (females > 60 mm TL, males > 65 mm TL), juveniles as 2 (<60/65 mm and >45 mm TL), and young-of-year (YOY) as 3 (≤45 mm TL). Cohorts for each sampling year (2016–2018) were assigned as previously described. However, for 2017 and 2018 data, juveniles sampled from the previous year were coded as adults and YOY from the previous year were coded as juveniles.
Distances between assigned mothers and fathers and their offspring were estimated from fluvial distances between their respective capture sites. The distance between an offspring found at a different site than the assigned parent was measured from the midpoint of the offspring collection site to the midpoint of the parent collection site. Assigned parents captured downstream or upstream of offspring were given negative or positive distances, respectively. Similar methods were used for measuring distances between members of inferred sib pairs, including pairs captured in the same year and different years. We used Welch’s t-tests to assess differences in distances between mother-offspring pairs and father-offspring pairs. We stratified tests by offspring age (YOY versus juvenile), stream (Stony Creek versus Laurel Creek), and year of capture (same year versus different year). Genetic recaptures from the identity analysis were noted in order to evaluate distances between members of offspring-parent pairs through time. Multiple parent-pair assignments among runs of Cervus were assessed, noting the respective LOD scores.
Sibling relationships were established by observing multiple offspring assignments to a single candidate mother or father. Full-sibs had identical assignments for both parents, while half-sibs had identical assignments for one parent. We estimated spawning periodicity and frequency from inferred ages of offspring and reconstruction of half-sib families. YOY were assumed to be spawned the year of capture (age = 0) and juveniles were assumed to be spawned the previous year (age = 1). For instance, if a candidate mother was assigned to two YOY and one juvenile captured in 2017, the inferred spawning years would be 2017 and 2016, respectively, and we would infer that she had spawned in at least two consecutive years. In addition, if the assigned fathers were different for the YOY, we would infer that the female spawned at least twice in 2017. The number of mothers per father in a given year also was estimated this way.
We applied this analytic approach on a year-by-year basis to infer the number of spawning years for individuals and to assess the dynamics of the spatial distribution of parent-offspring pairs. That is, conducting analyses for year-specific age classes accounts for contributions of additional candidate parents in subsequent years, but does not assume parentage outside of the sampling period (2016–2018). However, we assumed that adults survived throughout the sampling period. Additionally, genotypes belonging to YOY and juveniles with indistinguishable sexes at the time of capture were assigned as appropriate to candidate mother or father pools once sexual maturation was observed (at age 2+) in subsequent years.
2.4. Analysis of Movement Data
Movement distance was characterized in reference to mesohabitat (riffle, run, pool) patches. If individuals were recaptured in the same riffle as initially marked, they were categorized as showing “no movement”. Individuals recaptured in a riffle other than the initial riffle were categorized as exhibiting “movement”. Movement upstream or downstream of the initial riffle was represented by positive or negative values, respectively. Lengths of mesohabitat patches in the mark and recapture sites were measured each year. For within-year recaptures, movement distances were computed from that year’s patch lengths. We used mean patch lengths across recapture years to compute between-year movement distances. A given movement was calculated by assigning zero distance to the midpoint of the initial-capture patch, then adding (for upstream) or subtracting (for downstream) the lengths of all intervening patches up to the midpoint of the recapture patch. We used identical methods to calculate movement distances based on VIE versus molecular marks.
Welch’s t-test for unequal variance and non-parametric Kruskal-Wallis tests were used to compare movement distances between streams, sexes, and recapture methods. Welch’s t-tests were used to evaluate differences in distances moved, while differences in movement direction were evaluated using non-parametric Kruskal-Wallis tests with three options: upstream, none, and downstream. Genetic recaptures were summarized in two ways: including VIE recaptures and excluding VIE recaptures.
3. Results
3.1. Visible Inplant Elastomer Recaptures
Most fish marked with VIE tags were never recaptured. A total of 286 individuals were marked with VIE tags in Stony Creek in 2016 and 2017 (
Table 1,
Figure 1 and
Figure S2); 16% of those were recaptured at least once. Eleven individuals were recaptured at least twice, and a single male was recaptured three times. A total of 200 individuals were marked with VIE tags in Laurel Creek in 2016 and 2017 (
Table 1;
Figure 1 and
Figure S3); 12% of those were recaptured at least once. Nine individuals were recaptured at least twice, and four individuals were recaptured three times. We observed few recaptures (4% of recaptures in Stony Creek, 8% in Laurel Creek) two years after fish were initially tagged.
Overall, fish recaptured with VIE tags exhibited limited movement, especially in Stony Creek. Individuals moved a mean distance of 108 m (range: 0–1060 m) in Stony Creek (
Table 2); the maximum detectable distance was 1350 m. Twenty-three individuals (45%) stayed in the same riffle (
Figure 2). Males and females moved similar distances (
p = 0.97,
df = 46.72). Twenty individuals moved upstream of their initial capture, while nine moved downstream. Directionality of movement was similar between sexes (Kruskal-Wallis test;
p = 0.9,
df = 2). Detected movement distances in Laurel Creek ranged from 0–1300 m across the 1500-m detectable distance (mean = 242 m;
Table 1;
Figure 2). There were no differences between male and female distances moved or directionality (
p = 0.51,
df = 20.62;
p = 0.27,
df = 2). Five individuals (2.5%) stayed in the same riffle. Seventeen of the 24 recaptured individuals (71%) moved upstream from initial capture. Mean movement distances were statistically similar between streams (
p = 0.09,
df = 27.67), but movements exhibited more upstream bias in Laurel Creek compared to Stony Creek (
p = 0.04,
df = 2).
3.2. Molecular Recaptures
Most fish with clipped fins were never recaptured, but all individuals identified as VIE recaptures also were identified as molecular recaptures. We collected 838 fin clips in Stony Creek during 2016–2018 (
Table 1), representing 737 fish. Eighty-four individuals (11%) were recaptured at least once; of those, 15 were recaptured twice, and one was recaptured three times. Molecular recaptures indicated movement distances of 0–4500 m (mean: 216 m) across the 17.3-km detectable distance (
Table 2;
Figure 3). We collected 439 fin clips in Laurel Creek during 2016–2018 (
Table 1), representing 357 fish. Fifty-eight individuals (16%) were recaptured at least once; of those, seven were recaptured twice, four three times, and one four times. We observed few recaptures (5% of all recaptures) in either creek two years after a fish’s initial fin-clipping. While we could often tell that an individual had a regenerated fin, we could not tell how many times we had collected it before; further, by reanalyzing its DNA markers, we could infer how far it had moved. Molecular recaptures indicated movement distances of 0–1550 m (mean: 233 m) across the 3.5-km detectable distance (
Table 2;
Figure 3). Many Candy Darter recaptures (37 and 34 fish in Stony Creek and Laurel Creek, respectively) were identified only via molecular methods (
Table 1).
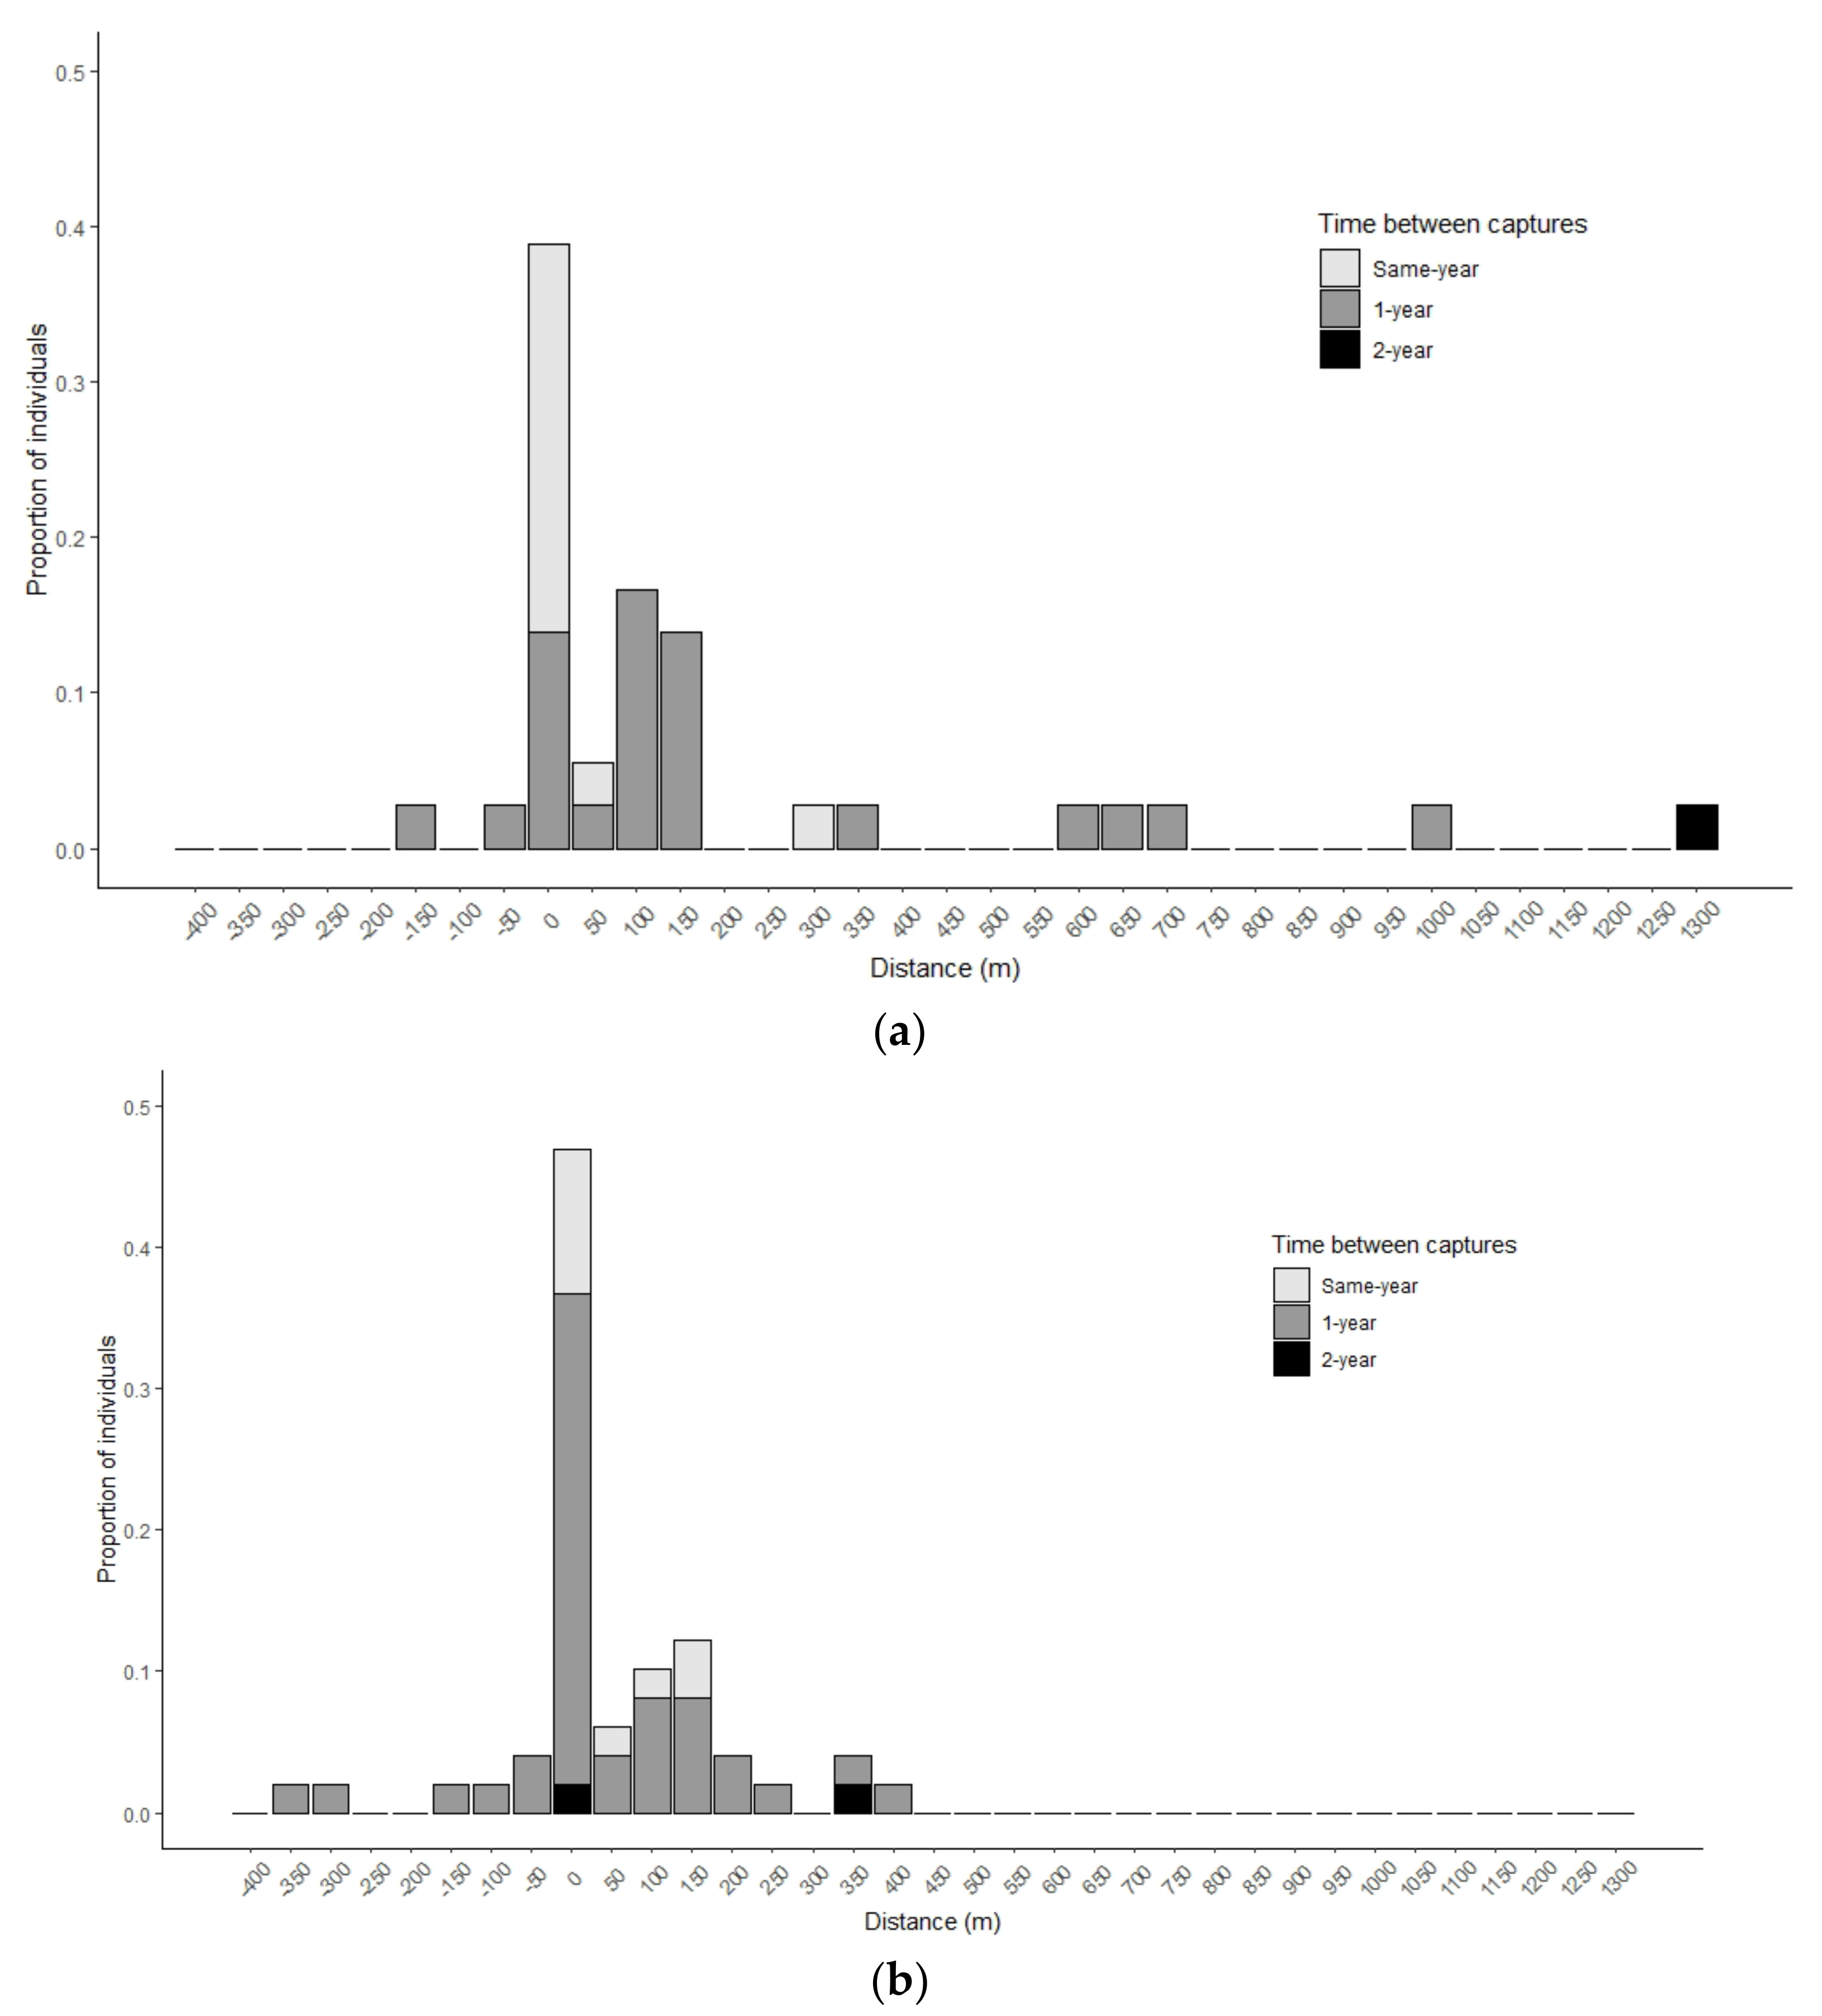
Molecular methods–but not VIE methods–allowed us to indirectly observe young-of-year (YOY) and juvenile movements. Three YOY were recaptured in Stony Creek. One was found 1 km upstream of its original capture two years prior. The other two were initially captured in 2017, then recaptured 200 m and 600 m downstream, respectively, in 2018. One juvenile in Stony Creek was recaptured in 2018, 35 m upstream of its original capture in 2017. In Laurel Creek, six YOY were recaptured. Five were found 40–130 m upstream of their original capture, and the other was recaptured 170 m downstream. Two juveniles were recaptured as adults, found 560 m and 185 m upstream of their original capture. Although our sample sizes were small, movements by Candy Darter sub-adults seemed to trend upstream in Laurel Creek but not in Stony Creek.
Both VIE and molecular recaptures produced similar movement patterns overall. Neither mean distances moved nor directionality of movement differed between recaptures from VIE and molecular recaptures only (p = 0.15, df = 36.12) or all molecular recaptures (p = 0.21, df = 104.4) in Stony Creek. We observed similar patterns in Laurel Creek (p = 0.94, df = 52.15; p = 0.78, df = 46.01). Greater distances were observed for molecular recaptures in Stony Creek (mean = 370 m). However, mean distances for molecular-only recaptures in Laurel Creek were similar to distances for total molecular recaptures, including VIE recaptures (mean = 230 m).
3.3. Spatial Distribution of Related Pairs
Related pairs were common in our dataset. Between 2016 and 2018 we captured 153 offspring in Stony Creek and 46 in Laurel Creek (
Table 2), including juveniles and YOY in all three years. In both steams, most offspring were assigned to parents (
Table 2). In Stony Creek, 371 candidate mothers and 396 candidate fathers were considered for 2018 parentage assignments (
Table 3). Of those, <17% were assigned as parents. In Laurel Creek, 189 candidate mothers and 216 candidate fathers were considered for 2018 parentage assignments, with <23% assigned as parents.
Spatial distributions of adults and sub-adults differed for both streams. Adults were observed at all sampled sites, but YOY and juveniles were not detected at some sites in both streams. No YOY or juveniles were captured in the upper 3.8 km of the Candy Darter distribution in Stony Creek or the upper 1 km of their distribution in Laurel Creek.
Parentage analysis of captured related pairs of Candy Darter revealed complex patterns of post-spawning movement. We documented distances between pair-members but could not distinguish which pair-members moved nor their movement directions. For example, most offspring were not captured at the same locations as their parents. Only 19% of offspring captures occurred in the same site as both parents’ captures in Stony Creek, compared to 15% in Laurel Creek. In Stony Creek, 31% of parents were captured in the same site versus 41% in Laurel Creek. Locations of parent and offspring captures were separated by up to 18.5 km and 1.7 km in Stony Creek and Laurel Creek, respectively. Although mean distances between members of assigned mother-offspring pairs were generally greater than distances between members of assigned father-offspring pairs in both streams, we found no significant differences for any year-specific capture group (p > 0.09). On average, mothers were captured 1.1 km and 200 m further from offspring than fathers in Stony Creek and Laurel Creek, respectively.
Observed distances between members of parent-offspring pairs suggest Candy Darters move substantial distances during early-life stages. Although we did not measure distances that larvae drift, YOY were generally further from parents than were juveniles in both streams. In Stony Creek, average separation distances were significantly greater for YOY-mother pairs compared to juvenile-mother pairs for both same-year and different-year captures (p = 0.05). Additionally, YOY were downstream of assigned mothers more frequently than random based on Kruskal-Wallis tests, but less frequently than random for assigned fathers in Stony Creek (p < 0.0001). Similarly, YOY distances from mothers in Laurel Creek were significantly greater than juvenile distances (p = 0.01), and the analogous pattern for fathers was nearly significant (p = 0.06). Juveniles and YOY were downstream of mothers more frequently than random based on Kruskal-Wallis tests, but less frequently than random for assigned fathers in Laurel Creek (p < 0.0001). In summary, Candy Darter offspring, parents, or both moved in ways that resulted in decreasing separation between offspring and parents during the first two years of life. Further, given that mothers and fathers necessarily co-occur during spawning, their differential juxtapositions relative to offspring indicate sexual dimorphism in post-spawning movements.
Candy Darter siblings were more widely separated in Stony Creek than in Laurel Creek. Capture locations of most sibling pairs (82%) from the same inferred spawning year in Stony Creek were separated by at least 100 m, with distances between full siblings spanning 0.6–10.25 km (
Table 4). Members of three of the four half-sibling pairs from the same inferred spawning year in Laurel Creek were separated by <120 m. Separation distances between half-siblings spawned in different years ranged from 0–13.75 km in Stony Creek, compared to 0.08–0.6 km in Laurel Creek. These differences in separation distances between streams are consistent with differences in Candy Darter distributions (i.e., 18.8 km in Stony Creek versus 4.25 km in Laurel Creek).
3.4. Reproductive Contributions
Individual Candy Darters spawned over multiple years with multiple partners. The inferred number of spawning-years for assigned mothers ranged from one to four in Stony Creek and one to two in Laurel Creek. The inferred number of spawning-years for assigned fathers ranged from one to three in both streams. On average, 1.4 and 1.25 males spawned with each female per year in Stony Creek and Laurel Creek, respectively (
Table 4). We detected up to four males spawning with a given female in a year.
4. Discussion
Improving understanding of fish movement is critical for advancing conservation, for example informing protection of habitats critical for completion of a target species’ life cycle. Our understanding of the ontogenetic movement of stream fishes, is, however, limited. We examined patterns of movement for two populations of Candy Darter using both physical and genetic marking methods. Our results present novel insights into movement and mating patterns for isolated populations of Candy Darter in Virginia, including variation in movement across streams, years, sexes, and life stages. Additionally, we provide evidence that the reproductive lifetime of adult Candy Darter is longer than previously described.
4.1. Spatiotemporal Patterns of Candy Darter Movement
Although the average distances detected for VIE and molecular genetic markers were similar, longer distance movements were detected using molecular methods, likely resulting from the greater spatial frame effectively sampled. However, some VIE markings were misidentified in the field as a result of fading or lost tags. VIE marks were less effective than molecular methods at identifying recaptures. VIE tags have various retention rates among colors and species [
35]. Our study found similar results, with individuals bearing orange, yellow, and red colors mis-assigned to specific riffles. Further, marking with VIE poses stresses to the fish due to anesthesia, injection, extra handling, and more time out of water [
36,
37]. Depending on the objectives of the study, molecular methods for mark-recapture work may be more reliable than VIE methods. Given that there are highly polymorphic loci and existing PCR primer sets for a species, molecular methods may be a more reliable way to “mark” individuals, as marks cannot be lost and are individual-specific. In addition, a great deal of information can be gleaned from molecular methods. For the endangered Candy Darter, individual assignment tests allowed us to infer movements of young and adult life stages. Molecular methods are not confined to use in large fish and are non-lethal, which is of great importance when dealing with species of conservation concern. However, it is important to note that both methods had low recapture rates, which is likely a reflection of our study design. Low recapture rate may have results from the technical impossibility of sampling entire stream lengths and some fish may have died after sampling from handling stress or natural causes.
Our results revealed complex, previously undocumented variations in movement and habitat use between Candy Darter sexes and life stages. Recaptured Candy Darters were generally found in the same riffle during capture and recapture events in one of the streams, while recaptured individuals in the other stream tended to move upstream from the point of initial capture. In both streams, adults were observed in the upper reaches of their known distributions, but neither YOY nor juveniles were observed there. YOY were generally farther from parents compared to juveniles in both streams. Females moved farther than males during the spawning season, perhaps reflecting female searches for and spawning with multiple males, in contrast with males remaining near and defending a particular spawning site. The overall spatiotemporal pattern of behavior emerging from the genetic marking data suggests that spawners avoid the most-upstream reaches, YOY drift or swim downstream of spawning sites, post-spawning, females move further upstream than males, including into non-spawning areas, and as YOY mature, they tend to move upstream, which brings them closer to parents.
We showed that some patterns of Candy Darter movement are similar to those exhibited by other small-bodied stream fishes, but other patterns are new. Studies of other darters have found that most marked fish are never recaptured, most recaptured adults are found within 200 m of where they were marked, and a few marked fish may be recaptured great distances (>2 km) from where they were marked [
38]. Roberts and Angermeier et al. [
35] found movements among microhabitats within riffle-run complexes were common for darter species during summer and fall months.
Our study design offered new insight into how spatial variation in habitat templates, as reflected by stream size and/or separation of suitable habitat patches, may affect fish movement. For example, for Candy Darter, long-distance movements were more common in Laurel Creek (smaller) than in Stony Creek (larger). On average, riffles and intervening runs and pools were larger (in length and width) in Stony Creek than in Laurel Creek, which may have promoted more Candy Darter movement in Laurel Creek. Roberts and Angermeier [
35] showed that the isolation of riffles by intervening in an unsuitable habitat inhibited movements by Fantail Darter
Etheostoma flaballare, Riverweed Darter
Etheostoma podostemone, and Roanoke Darter
Percina roanoka but they did not examine effects of stream size. Beyond the darters living there, movements by individuals of five species in two Arkansas streams were three times greater from pools bounded by “short” riffles than from pools bounded by “long” riffles, and movements from “long-riffle” pools were directed downstream in a higher proportion than from “short-riffle” pools [
39]. Hodges and Magoulik [
40] showed that movement by Creek Chub
Semotilus atromaculatus into pools of an Ozark stream in Arkansas, USA increased their survival and abundance during seasonal drying, supporting the hypothesis that pools act as a refuge habitat for the species. Population dynamics of darters may be driven by processes and habitat juxtapositions that transcend specific stream reaches. For example, Roberts et al. [
2] documented the effects of catchment-wide processes on local habitat use and abundance of Roanoke Logperch
Percina rex, another small benthic fish. Examining ecological correlates of movement for eight fish species in the upper James River watershed in Virginia, USA, Albanese et al. [
3] found that the probability of emigrating from a reach was positively related to stream intermittency (one species) and fish body size (one species), and negatively related to distance from the mainstem creek (two species) and local habitat complexity (one species). Habitats with greater structural complexity may have a higher probability of supplying requirements, thereby obviating the need to move often [
3]; however, exceptions exist [
41]. Further research might explore other influences of the stream habitat template on fish movement to better understand the colonization-extinction dynamics of populations. Reviewing the literature on movement by individual stream fish, Rasmussen and Belk [
42] concluded that future research should focus on interactions among extrinsic ecological factors and intrinsic individual factors to advance understanding of the ecological and evolutionary causes and implications of movement.
Characterization of fish movement is sensitive to the spatiotemporal extent of the study and the detectability of the focal species. Tagged individuals may not be recaptured as a result of emigration from the sampling area, mortality, low sampling effort, or low sampling efficiency. Albanese et al. [
15] found increasing detectability of movements with greater extents of recapture sites, but long-distance movements are inherently less detectable than short-distance movements, and species are not equally detectable. While a majority of VIE and genetic recaptures were within our intended recapture sites, the extent of those sites probably limited our ability to detect long-distance movements. Although our study design provided opportunistic observations of long-distance movements outside of the core recapture areas and the extent of our sampling effort was great than those of most movement studies, the unsampled areas between the additional sites may have contributed to our low recapture rates. As is typically the case, our sampling effort was constrained by time and funding, which forced tradeoffs between sampling intensity (number of electrofishing passes) and sampling extent (length of stream sampled).
Genetic marks were useful as a double-tagging method to understand movement patterns and assess the long-term effectiveness of VIE marks. All individuals identified as recaptures with VIE also were identified as recaptures via genetic analysis, but not all VIE-tagged individuals were identified as recaptures in the field, perhaps due to faded or lost VIE marks. Had these individuals not been identified as recaptures using molecular methods, several long-distance movements would have been missed. Although mean differences in movements detected by VIE versus molecular methods were not statistically significant, the use of a single marking method would have yielded different results. Additionally, sub-adult movements would not have been described, as VIE marks cannot be applied to very small fishes. Given our study objectives, VIE methods offered no advantages over molecular methods.
4.2. Spatiotemporal Distribution of Related Pairs
Although we did not determine spawning locations to directly measure the dispersal of offspring, our data on the spatial distributions of parent-offspring pairs offer new insights into fish movement during and after spawning. In both streams, adults were captured in the upper reaches of known Candy Darter distributions, but sub-adults were not detected there. This pattern suggests that larvae drifted or swam downstream or that spawning does not occur in the upper reaches, or both. For example, we collected 56% of the offspring at our most downstream site in Stony Creek, compared to 37% of assigned mothers and 34% of assigned fathers. This finding supports the general model of downstream dispersal of larvae via drift, followed by upstream movement of post-larval stages. Additionally, this site is just upstream of the intermittent portion of the stream, which may, at different times, serve as a nursery habitat or population sink. Hooley-Underwood et al. [
43] documented larval drift of suckers (Family Catostomidae) in a drying stream, which resulted in stranding and high mortality in pools. Alternatively, Davey and Kelly [
44] observed fish movements to avoid drying reaches.
Spatial patterns in Laurel Creek were similar to those in Stony Creek. We captured 80% of the offspring in the lower 2 km, while 76% of assigned mothers and 50% of assigned fathers were captured in the upper 2 km of the known Candy Darter distribution. The lower number of offspring captured in Laurel Creek compared to Stony Creek probably reflects the smaller Candy Darter population in Laurel Creek but may also reflect offspring dispersal into Wolf Creek downstream. While a few Candy Darter have been observed in Wolf Creek [
30], undocumented movement may occur between these streams. Overall, these patterns reveal high levels of demographic connectivity throughout both streams. Although data on the spatial juxtaposition of offspring (YOY and juveniles) and adults could have been acquired without parentage analysis, the results of this analysis revealed new patterns of gene flow and dispersal distances.
4.3. Reproductive Contribution
Understanding the reproductive biology of a species can inform conservation and management strategies. Kreiser et al. [
45] used sibship analysis to estimate the number of spawning adults in populations of Alligator Gar
Atractosteus spatula in Choke Canyon and the Trinity River, Texas. Ultimately, their results revealed the relative contributions of spawning adults and the spatial distribution of spawning events, which were useful in assessing the risk of population declines due to harvest. We used parentage analysis to characterize parent-offspring and sibling-pair relationships and to infer the periodicity and frequency of spawning. Our results suggest that <25% of captured adults contributed to each year-class. However, these results are limited to the offspring-parent assignments we made and may be regarded as a minimum number of spawning adults within each population; clearly, we did not collect every offspring in the respective systems. Our results suggest that families may use an entire stream network to complete their life history, with spatiotemporal variation in occupancy among life stages. Therefore, parentage analysis may aid in assessing risks of stochastic events or anthropogenic alterations, designating critical habitats, and selecting individuals for translocation.
While many studies have addressed the initiation and duration of the reproductive season [
46,
47], the number of clutches [
47], and fecundity [
48] of darter species, few have focused on the potential reproductive contribution throughout an individual’s lifespan. Jenkins and Burkhead [
49] described Candy Darter as sexually mature at age-2, with a lifespan of three years, thereby implying a maximum of two spawning years. McBaine and Hallerman [
50] recently reported that individuals can live to at least age-5, based on otolith readings. This finding aligns with our evidence that females can reproduce in four consecutive years with multiple males each year, which coincides with sexual maturity at age 2. This was the first study to show that many Candy Darters spawn in two or three years. In addition, parentage assignment provided evidence that both sexes mate with multiple partners. These results are helpful in describing the species’ life history and suggest implications for conservation that would not have been realized without the use of genetic methods. Understanding the number of spawning partners within and across years may provide valuable insight into population persistence and the ability to transmit genetic variation to new generations. For instance, promiscuous species may be less vulnerable to inbreeding, especially if individuals spawn with multiple partners within and throughout the years. Hunter et al. [
22] used sibship analysis and pedigree reconstruction to describe the number of spawning years, events, and locations of Lake Sturgeon
Acipenser fulvescens. They suggested that the reproductive strategy of mating with multiple partners will safeguard against recruitment failure from site-specific mortality and could reduce the risk of losing genetic diversity. Future studies designed to estimate larval survival for Candy Darter could provide valuable information on recruitment dynamics and population persistence.
4.4. Management Implications
Our findings advance knowledge of the spatial structure across Virginia populations of Candy Darter. Analysis of our movement data shows that individuals use multiple complementary and supplementary habitats through their life cycle, involving most of the length of the streams studied. Other studies of darters also have shown that their population dynamics are driven by processes that transcend specific stream reaches. For example, Roberts et al. [
31] doc-umented effects of catchment-wide processes on local habitat use and abundance of Roanoke Logperch (
Percina rex), another small benthic fish. Noting that habitat critical for all life stages must be protected in order to support recruitment and persistence, a key implication for managing imperiled fishes is that focusing management on locations or habitats used by juveniles or adults only may not prove effective for maintaining viable populations or recovering species. Results of our study could prove useful in designating critical habitat for Candy Darter in these two stream systems. We note, however, that additional segments essential for Candy Darter persistence, but still undocumented, may occur elsewhere in our study streams. Unfortunately, we seldom know all the crucial habitats for stream fishes [
11], a knowledge gap that could be targeted by future research. Candy darter offspring were assigned only to parents within their respective streams, which supports the current presumption that each stream is an independent demographic unit. This pattern was corroborated by population genetic structure analyses [
51]. We are unaware of any studies that have compared species movements across isolated populations or metapopulations of stream fishes.
Understanding the distribution of parents and offspring within populations may provide guidance for practical aspects of translocating Candy Darters, such as suitable source and recipient sites and age composition of translocated individuals. This knowledge is timely because managers in Virginia (Mike Pinder, Virginia Department of Wildlife Resources, personal communication, 2021) and West Virginia (Nate Owens, West Virginia Department of Natural Resources, personal communication, 2021) are considering translocations as a central tactic to promote recovery of the species. We showed that Candy Darter parents and offspring may be separated by >10 km and that sub-adult siblings may be separated by >4 km. If a management goal is to maximize genetic diversity in recipient populations while maintaining their genetic signatures, individuals should be collected from throughout the within-stream distribution of source populations. This could reduce the risk of collecting individuals from a limited number of family groups [
52]. Todd and Lintermans [
53] assessed the composition of age-classes to use for translocations and the timeframe for establishing new populations of Macquarie Perch
Macquaria australasica, a long-lived (>25 years) endangered freshwater species. Translocating juveniles and adults over a period of five years was the most successful strategy, with little impact on the source population. However, the risk of sampling from a limited number of families may increase if collections include a range of life stages [
54]. Understanding individual dispersal distances can inform choices of release sites. George et al. [
55] suggested releasing small numbers of individuals in multiple nearby sites for species that are poor dispersers, but more individuals in a single site for species that are good dispersers (i.e., whose larvae drift).
Future studies may be warranted to describe movement patterns in larger, more connected populations of Candy Darter in West Virginia, where we expect dispersal and movement to be more extensive than is possible for Virginia populations. Further, documenting movement patterns in more connected ecosystems may prove useful in identifying recipient streams for the reintroduction of Candy Darter in Virginia, with an eye toward recreating a functional metapopulation maintained via natural movement among subpopulations. That is, reintroductions may prove more successful if recipient streams are near existing populations and the habitat is similar to the source system(s). Reintroductions might be prioritized to restore connectivity among the four Virginia populations, which would likely enhance the long-term viability of the species.


