Article

Optimizing Hard Clam Production in Taiwan by Accounting for Nonlinear Effects of Stocking Density and Feed Costs on Farm Output of Clams

1
Department of Shipping and Transportation Management, National Kaohsiung University of Science and Technology, Kaohsiung 81157, Taiwan
2
Department of International Business, National Kaohsiung University of Science and Technology, Kaohsiung 81157, Taiwan
3
Department of Aquaculture, National Kaohsiung University of Science and Technology, Kaohsiung 81157, Taiwan
4
Department of International Trade, Overseas Chinese University, Taichung 81157, Taiwan
5
Department of Industry Design, National Kaohsiung University of Science and Technology, Kaohsiung 81157, Taiwan
*
Authors to whom correspondence should be addressed.
Submission received: 18 April 2022 / Revised: 21 June 2022 / Accepted: 27 June 2022 / Published: 1 July 2022
(This article belongs to the Special Issue Synergistic Effects of Hydroclimate and Fisheries)

Abstract

:
Despite mass mortality, hard clams remain among the main cultured shellfish in Taiwan. Using cross-sectional data, this study applies threshold regression modeling with stocking density and feed costs as the threshold variables to explore the nonlinear relationship between input and output factors. The findings show that the production output levels may be increased by different combinations of factor inputs and variations in input factors. More specifically, the higher output levels may be achieved by increasing labor input while reducing capital input factors in farming households with a higher stocking density (HSD > 1,087,870 inds/ha) or higher feed cost (HFC > 13,889 NTD/ha). Farming households with a lower stocking density (LSD ≤ 1,087,870 inds/ha) may enhance production output levels by increasing feed input while reducing capital inputs. Moreover, the maximum output level of HSD and HFC farming households was estimated to reach 9255 kg/ha and 9807 kg/ha, respectively. Results of the production output simulation suggest that the feeding cost per hectare in LSD households should not exceed 25,119 NTD to avoid overfeeding, which may cause culture deterioration and lower survival rates. As such, farmers are advised to adjust their feed costs according to the stocking density to maximize production output.

1. Introduction

In 2017, the global clam aquaculture production (clams, cockles, and arkshells) reached 5.658 million mt, worth USD 9.78 billion, accounting for 7.06% of total output and 4.12% of the gross output value of the global aquaculture production [1]. The cultivation of hard clams plays a leading role in aquatic shellfish farming in Taiwan and ranges within the top ten of Taiwan’s overall aquaculture output. In 1985, it amounted to 13,976 mt and increased to 49,100 mt in 2018, with a market value of about NTD 4.15 billion (exchange rate: USD 1 = NTD 30.08). The main cultured hard clam areas in Taiwan are Changhua, Yunlin, Chiayi, and Tainan. The Yunlin area has the highest hard clam output, accounting for about 63% of the island’s total output. The main species of hard clam in Taiwan are Meretrix lusoria and Meretrix meretrix. The domestic hard clam industry is mostly run by small, family-owned businesses. In the past, the hard clam culture survival rate was above 70%, stocking density 1~1.6 million individuals per hectare, and output ranged between 11 mt/ha and 15 mt/ha. However, climate change and increasing disease prevalence have led to lower growth rates and higher incidences of mass mortality [2,3,4,5,6,7]. In recent years, the average culture survival rate has decreased to 50% [8,9]. Farmers may adjust input factors according to changes in the survival rate to reduce culture costs and increase profits [10]. Previous research showed that although farmers made considerable efforts to reduce culture costs, there was a lack of effective cost control [11]. As the hard clam culture survival rate decreases, farmers need to control the stocking density and feed input to avoid excessive feeding and subsequent contamination of the bottom material. The feedstuff for hard clam culture in the Yunlin area is spread feed (powders or oatmeal), algae-laden waters, or organic fermented feed broth. The starch and protein in the feed can be dissolved by the fermentation of probiotics. This process promotes the ingestion of nutrient substances in the feed for hard clam and thus, helps to increase feed digestibility [12,13,14], increase the culture production output and survival rates [15,16], enhance disease resistance and immunity [17,18], as well as compete with pathogens for the growing environment [16,19], consequently inhibiting pathogens and improving the culture environment by stabilizing water quality [20,21]. Bordignon et al. (2021) [22] demonstrated in their study that increases in stocking density lead to reduced clam growth and, depending on the water quality, may also cause mortality [23,24,25,26,27]. Previous studies also reported that decreasing the natural seed stocks of clam cultures may encourage the usage of hatchery-produced seeds [28,29,30,31]. Therefore, risk management for clam cultures plays a crucial role in terms of economic analysis [32,33,34,35].
Early research on the Taiwanese hard clam culture industry mostly addressed issues related to the growth rate, culture environment, and disease control. In recent years, a growing number of studies have focused on the production economy of the industry [8,10,36,37,38]. Huang et al. (2016) [8] analyzed hard clam farmers in Yunlin County and found that the technical efficiency value of the hard clam culture was 0.74. That is, the production input of the hard clam culture industry could be reduced by 26%. In addition, the study found that there were excessive input factors in the culture process. Yeh et al. (2017) [39] divided hard clam cultures into two groups with different stocking densities (≤1,500,000 and >1,500,000 inds/ha) to analyze the economies of scale. The study revealed that farmers with hard clam stocking densities higher than 1,500,000 inds/ha (high-density farmers) generated more output and more profit than farmers with lower stocking densities.
Many scholars have used the Cobb–Douglas production function to analyze fish culture systems [36,37,38]. Previous studies mostly used linear models to estimate the production function structure, which may result in nonlinear relations between input factors and production, as the use of input factors is influenced by the stocking density and feed costs. Yeh et al. (2017) [39] found that in the case of different stocking densities, average costs can be reduced by increasing the production output. However, as the setting of specific cluster values for each of the two groups was too subjective, the variance of the group production volume was not tested.
This study draws on production input, costs, and gross revenue data collected for the years 2018–2020 from 219 hard clam farmers in Yunlin County, Taiwan. Threshold regression modeling is applied with stocking density and feed costs as the threshold variables to analyze the nonlinear relations between input factors and production output. As such, the model can determine how hard clam farmers may adjust the use of input factors for different stocking density and feed cost clusters to maximize production output and optimize costs. The findings can be used as a reference for hard clam farmers to improve culture management.

2. Materials and Methods

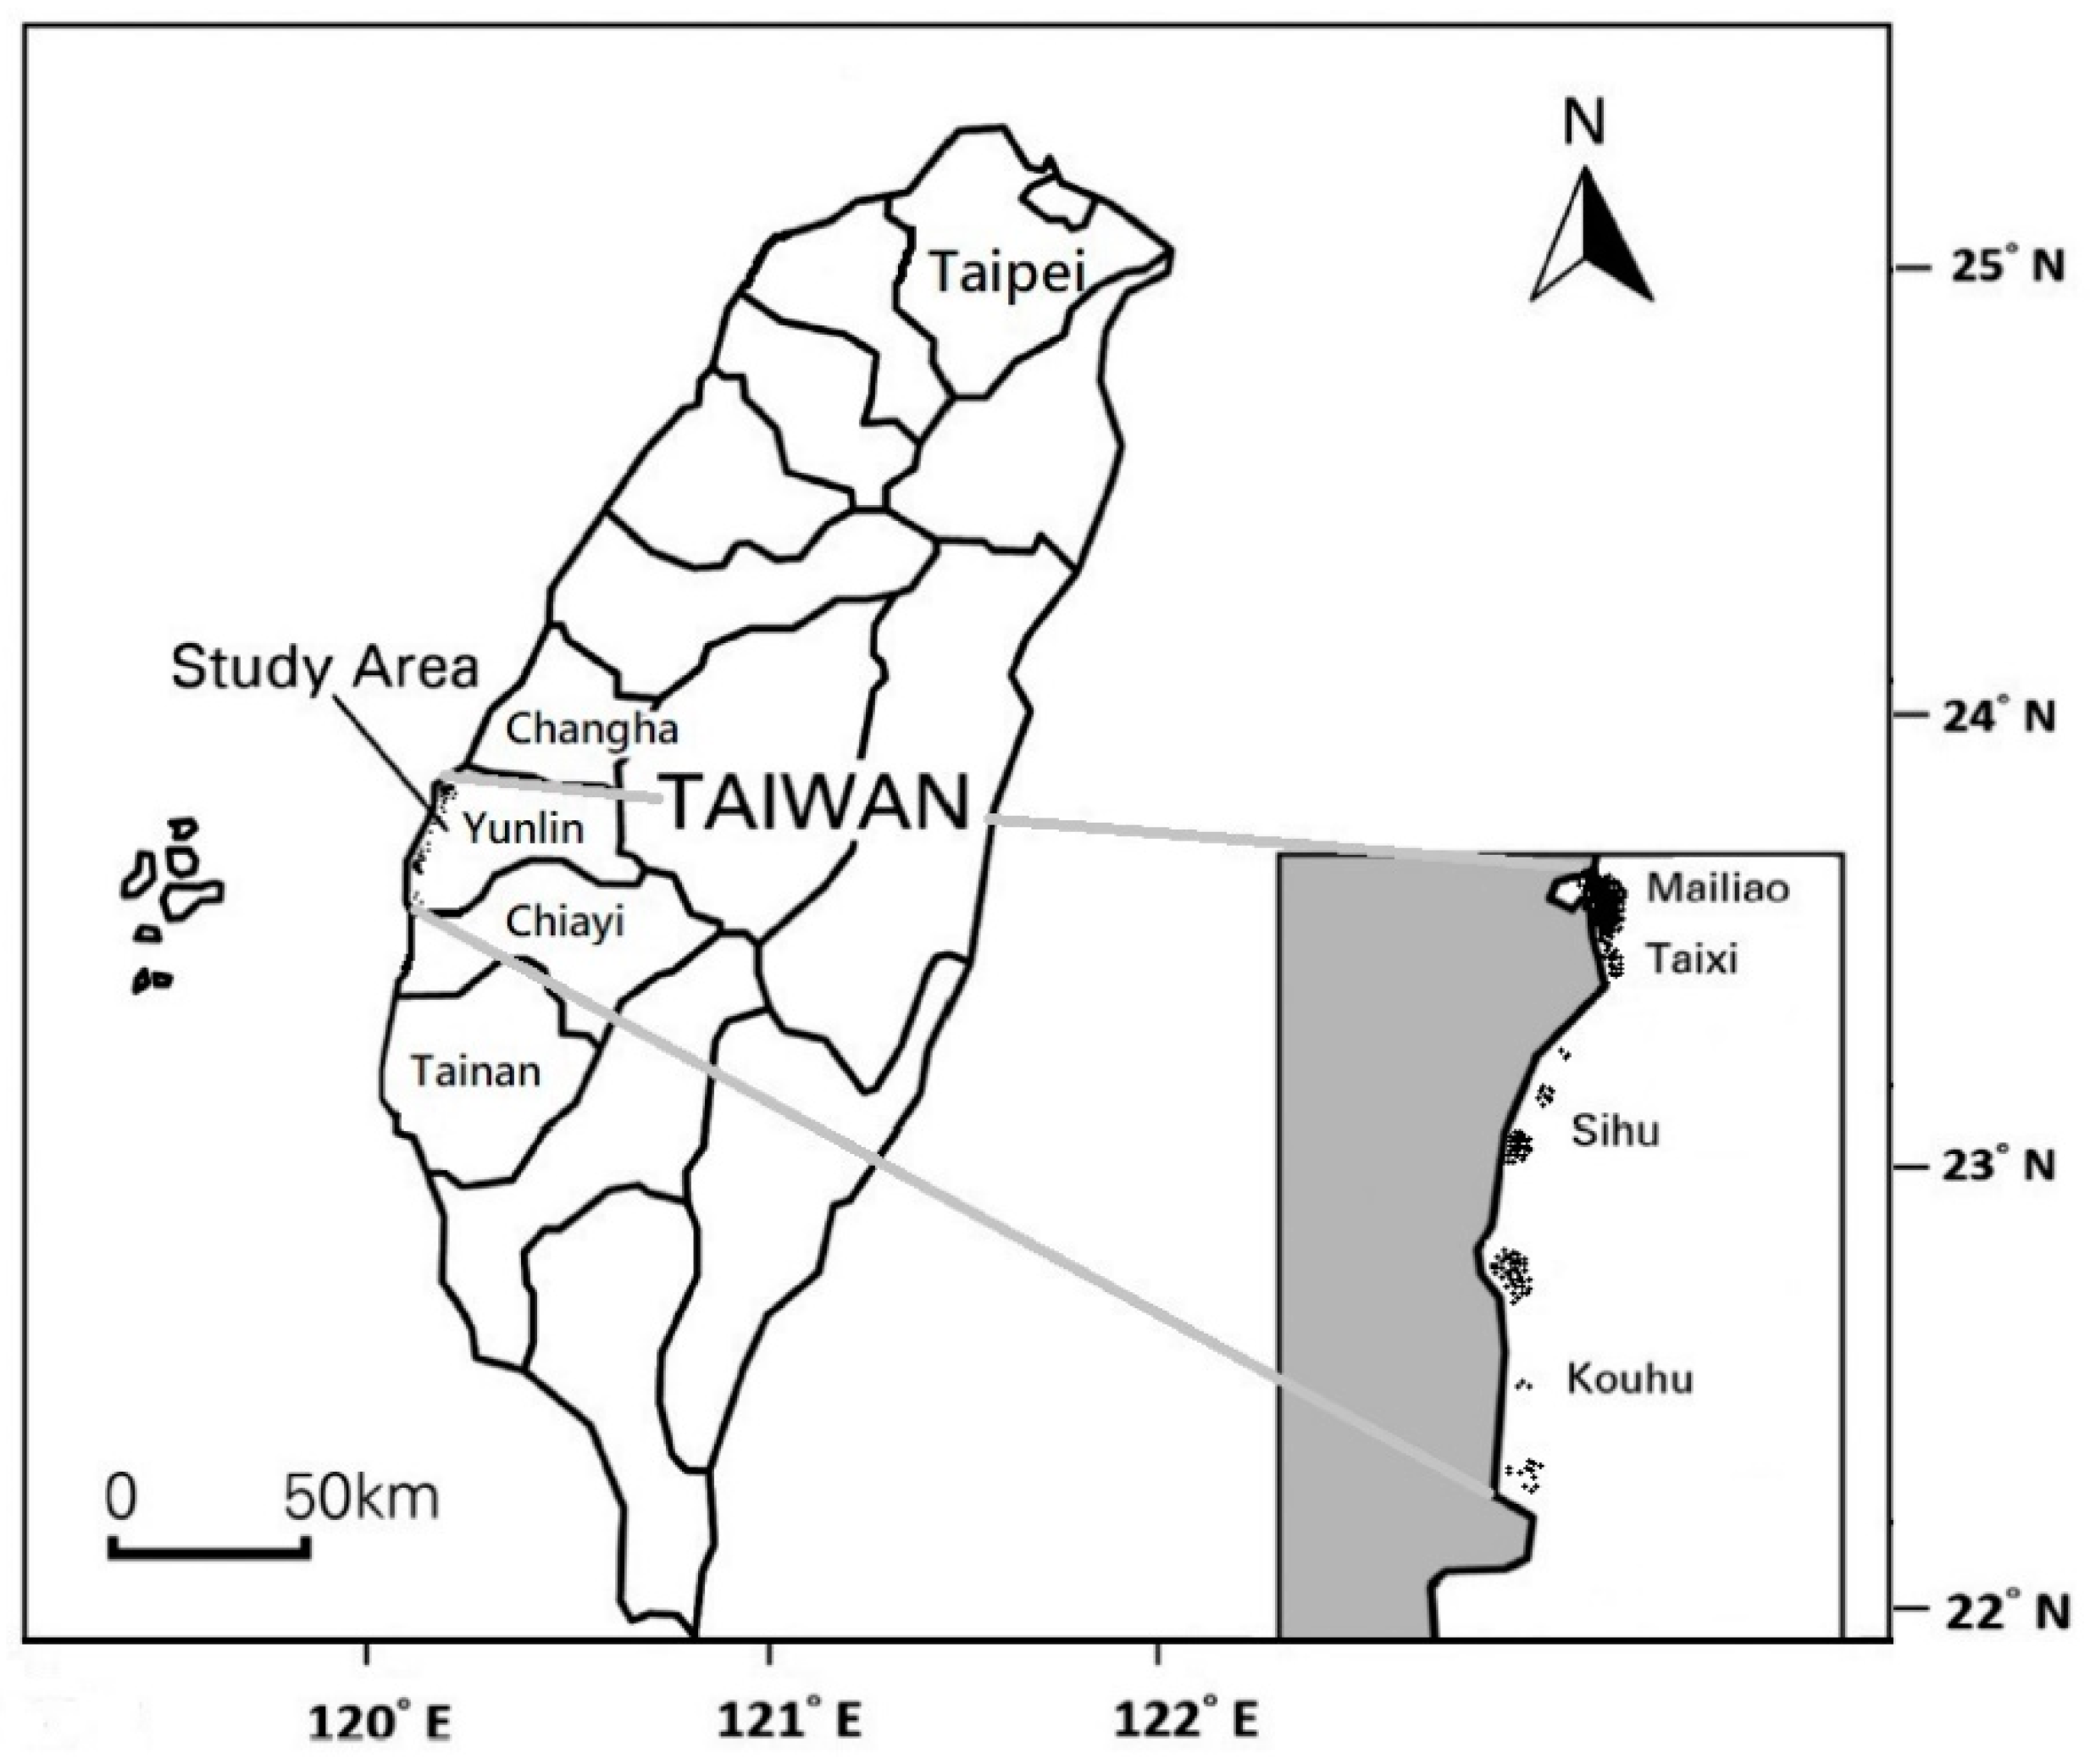
2.1. Study Area and Culture Method

This study focuses on hard clam farmers in Yunlin County, which has the highest culture production of hard clam in Taiwan (Figure 1). The main adult hard clam culture method in Yunlin is the land-based fishpond culture, where farmers culture seedlings above 1600 inds/kg, which they buy from intermediate breeders for stocking. The typical culture pond area ranges between 0.5 and 2 ha, with salinity remaining at about 20 psu and water depth between 50 cm and 120 cm. The water is changed using pumps and rising seawaters. New seedlings are stocked throughout the year. Breeding the seedlings of 1600 inds/kg to the market specification of 66~83 inds/kg requires 12~15 months. However, some farmers breed larger hard clam seedlings (500~800 inds/kg) to shorten the culture period. In the past, the hard clam culture stocking density was 1.5–2 million inds/ha. However, with declining culture survival rates, the stocking density has decreased accordingly. The water in a hard clam culture pond is usually clear and contains macroscopic algae, such as Ulva, which are likely to grow on the bottom of the pond. The mass growth of Ulva has a negative effect on the hard clam. Thus, small quantities of fish and shrimp are cultured together to reduce the labor cost for removing Ulva, balance the ecology, and increase the culture density.
The hard clam usually hides in sand and uses an exhalant/inhalant siphon to ingest the micro algae and organic debris in the water. In a culture pond with a high stocking density, the food supply must be manually supplemented. The feedstuff generally consists of feed powders, oatmeal, algae-laden water, or organic fermented feed broth. With average costs ranging between 70,000 and 90,000 NTD/ha, fermented feed accounts for the second-highest cost. While feed powders are popular, they have higher addition levels as well as inconsistent particle size and suspensibility. Feed powders are thus more likely to cause substrate pollution. Moreover, the cost of feed powders is comparatively high (90,000~130,000 NTD/ha).
Eel flour, fish meal, soya flour, or forage fish is placed in the fermentation tank and decomposed into micromolecules by fermentation. The fermented broth is extracted and put in the culture pond. It is thus unlikely to lead to substrate pollution and is inexpensive. However, the fermented feed may cause pathogens and insufficient stability. In addition, the fermentation tank requires land space. The oatmeal feed is soaked to absorb water and spread into the culture pond. Algae-laden water has the lowest feed cost, ranging between 40,000 and 60,000 NTD/ha. It is extracted from the fishpond, or the organics are added to the algae-laden water pond. When the algae proliferate, the algae-laden water is extracted and put in the culture pond. The advantage of this feed method is that feed costs, as well as the contamination of the pond, can be reduced. On the other hand, algal facies are difficult to be stabilized and may be unavailable when required.
In order to increase output per unit area and overall profit, hard clam farmers often use high stocking densities, which may cause culture deterioration at the bottom of the pond. Thus, probiotics, in addition to feed, are put in the pond to improve water quality as well as to inhibit pathogens [40]. Approximately 15–25% of the observed farmers use probiotics, with the total cost per hectare amounting to NTD 20,000~40,000.

2.2. Data Acquisition Process

The study surveyed hard clam farmers in Yunlin County. The Fisheries Agency, Taiwan’s sole governmental organization in charge of supervising the fishing industry, listed between 2432 and 2637 hard clam farmers in Yunlin County for the years 2018, 2019, and 2020. Our study included 74, 60, and 85 completed surveys, respectively, for those years. At the first stage of the sampling process, the number of farming households to be interviewed in the Mailiao Township, the Taixi Township, the Kouhu Township, and the Sihu Township was determined by assigning quotas to each township in proportion to their share in the total production output. Second, the farming households to be included in the study were selected by the district branches of the local fishermen’s association. Every year, there were ten district branches in charge of selecting the sample households through convenience sampling. Between the years 2018 and 2020, a total of 230 households agreed to take part in the survey. The locations of the farmers’ culture ponds are shown in Figure 1.
Professionally trained interviewers surveyed the selected farmers using structured questionnaires covering culture operations and biologicals, production output, culture input, as well as the farming households’ gross revenue between the years 2018 and 2020. The interviews were conducted in 2019, 2020, and early 2021. As most farmers lacked detailed culture account records, it was difficult to obtain reliable data regarding the farming households’ production output, costs, and gross revenue. Therefore, the obtained survey data had to be supplemented through different qualitative and quantitative data gathering methods. Additional in-depth interviews helped control for potential selection bias and to determine whether the questionnaires contained unreasonable/inconsistent responses. In total, 11 out of the 230 questionnaires were either incomplete or inconsistent and were thus removed from the sample. Finally, a total of 219 farming households were included in the empirical analysis.

2.3. Data Analysis

The statistical software package Stata 16 was used in the study to administer the data analysis and to obtain descriptive statistics. Threshold regression modeling was applied in the analysis [41]. The results of the data analysis show how input factors under different fry stocking density and feed costs could be used to increase total production output. The descriptive analysis of production included culture operation and biologicals, operating costs, and gross revenue data. More specifically, the culture operation and biological data included the farmers’ age, experience, educational status, culture time, culture area, stocking density, survival rate, and production output per hectare. The culture input data included the hard clam larvae stocking rate (costs), feed costs, number of workers (costs), capital costs, and other costs. Data for the hard clam larvae input comprised the quantity and cost of hard clam larvae. The feed costs included feed, fertilizer expenses, and water quality modifier expenses. The labor inputs included the cost of employing family workers and temporary workers. The other costs included water and electricity expenses, fishpond and equipment maintenance costs, and insurance costs. The capital cost was the amortized installation cost, which included the total annual depreciation expense of fishing rafts, water fetchers, water pumps, generators, water quality and bottom soil testing, plants, and the small houses required for cultivation farming. Gross revenue is defined as the production output multiplied by the selling price of hard clam.

2.4. Threshold Regression Model

This study applies a Cobb–Douglas production function to determine whether the fry stocking density and feed costs constitute a nonlinear relationship between input factors and production output. The Cobb–Douglas production function is often used in the breeding industry to analyze the relationship between output and demand of production factor inputs [36,37,38,42]. Hard clam production output was used as the dependent variable, and seedlings, feed, labor, capital, and other inputs as explanatory variables. The threshold regression model proposed by Hansen (2000) [41] is used with the fry stocking density and feed costs as the threshold variables to estimate the function parameters of hard clam production. By denoting the threshold variable as ki for representation, and the optimal threshold value as c1*, the two-regime threshold regression model for cross-section data is expressed as follows:
L o g Q i = ( α 1 T i m e + λ 1 R e g i o n + β 1 L o g S e e d i + γ 1 L o g F e e d i + θ 1 L o g L a b o r i + δ 1 L o g C a p i t a l i + ν 1 L o g O t h e r i ) × f ( k i c 1 * ) + ( α 2 T i m e + λ 2 R e g i o n + β 2 L o g S e e d i + γ 2 L o g F e e d i + θ 2 L o g L a b o r i + δ 2 L o g C a p i t a l i + ν 2 L o g O t h e r i ) × f ( k i > c 1 * )
where Log represents the logarithm, Qi is hard clam outputs (kg ha−1) as a proxy for productions performance; Timei denotes the dummy variable and equals 1 if the year is 2019 and 2020, and 0 otherwise; Regioni represents the dummy variable and equals to 1 if farming households are in Sihu Township and 0 otherwise; Seedi the fry stocking density (inds/ha); Feedi the feeding cost (NTD/ha) including feed, fertilizer, and use of probiotics costs; Labori the labor cost (NTD/ha); Capitali the depreciation expense of the equipment (NTD/ha); Otheri included water and electricity charges, maintenance fees for fishponds and equipment, and medicine and insurance fees (NTD/ha). Moreover, f(.) is an indicator function, ki is the threshold variable, c1* is the optimal threshold value, and εi is an error term. If the relation in (.) is true, then f(.) equals one; otherwise, f(.) is 0. The parameters, α1, α2, λ1, λ1, β1, β2, γ1, γ2, θ1, θ2, δ1, δ2, v1, and v2 are to be estimated. We acknowledge the possible endogeneity problem of our threshold variables (stocking density and feed cost). Thus, two instrumental variables, experiences of hard clam production for farmers and culture survival, are used in the estimation. Based on the result of endogeneity test, we accept that stocking density is endogenous (GMM C statistic χ2 = 13.391, p = 0.000) but find that feed cost is exogenous (GMM C statistic χ2 = 2.551, p = 0.110). Therefore, we used predicted stocking density and feed cost for the threshold model, respectively.
Prior to the estimation, the likelihood ratio test proposed by Hansen (2000) [41] was applied to examine the threshold effect based on the hypothesis H0: λ = λ0. Assuming that the error term of the threshold regression model is iid with N(0,σ2), the likelihood ratio test statistics is defined as L R n ( λ ) = n [ S n ( λ ) S n ( λ ^ ) S n ( λ ^ ) ] , where Sn(λ) is the concentrated sum of squared errors function based on the least square estimate and λ ^ is the value which minimizes the Sn(λ). One can generate the p-value from the test statistics as p n = 1 - ( 1 - exp ( - 1 2 L R n ( λ 0 ) 2 ) ) 2 . The rejection of the test indicates the existence of the threshold effect. Secondly, for robustness, we also follow the procedure proposed by Hansen (2000) [41] for testing the possible multiple threshold effects. We propose the following sequent hypotheses: the single threshold corresponds to H0 (linear model) and Ha (single-threshold model), the double threshold corresponds to H0 (single-threshold) and Ha (double-threshold model), and so forth.

3. Results

3.1. Summary Descriptive Statistics

Table 1 shows the descriptive statistics regarding the annual operating costs, production output, gross revenue, technical specifications as well as demographic data of the observed 219 farming households for the years 2018 to 2020. In terms of the production output, the average output during the three years under study reached 8964 kg/ha. In 2018, the production volume amounted to 8658 kg/ha. In 2019, due to the high average temperature, the quality of water and the bottom sediment of the fish farms deteriorated, reducing the production output to 7309 kg/ha. The output was the highest in 2020, with 10,272 kg/ha. The average gross revenue decreased from NTD 813,852/ha in 2018 to 716,282/ha in 2019. It was the highest in 2020, with 1,056,400 NTD/ha. These fluctuations show that the production and the revenue of hard clam farmers are substantially affected by environmental factors.
In terms of the outlay costs, the average total costs in the three years under study accounted for about 449,570 NTD/ha. In terms of the cost structure, seed costs accounted for 28.73~34.62% of the overall costs. Seed costs are comparatively higher than other costs because the seedling price in recent years has dramatically increased. Other costs make up 24.22~29.08% of the overall costs. Expenditures for labor include employing family workers and temporary workers and account for 23.03~24.6% of the overall costs, ranking third. Feed costs range between 10.67% and 11.97%, and capital costs are between 6.12% and 7.47% of the overall costs.
In terms of the technical specifications of the farming households, the average culture survival rate in the three years under study was 0.54. The culture area decreased from 2.33 ha per farmer in 2018 to 1.44 ha in 2020. The average stocking density in the three years was 1.17 million inds/ha; the lowest value was 1.1 million inds/ha in 2018. The density subsequently increased to 1.2 million inds/ha in 2019 and decreased to 1.19 million inds/ha in the following year.
As for the demographic characteristics of the observed farming households, the average farmer is 54 years of age and has 20.8 years of experience in culturing hard clams. Almost six out of ten farmers graduated from high school or university.

3.2. Parameter Estimation

Table 2 presents the coefficient estimates of the Cobb–Douglas production function using two different threshold variables, namely stocking density and feed cost. In the former case, the 219 observations were clustered into two regimes. Regime 1 covered 23 observations, and Regime 2 covered the remaining 196 observations. The LM test for no threshold was rejected. That is, the stocking density as a threshold variable shows statistically significant nonlinear effects on the overall hard clam production. Furthermore, based on the procedure proposed by Hansen (2000) [41] for testing the threshold effect, we assume that the single threshold corresponds to H0 (linear model) and Ha (single-threshold model), the double threshold corresponds to H0 (single-threshold) and Ha (double-threshold model), and so forth. Our results confirm the single-threshold model with a probability value of 0.18 for the threshold variable of stocking density. The results for Regime 1 (stocking density ≤ 1,087,870 inds/ha) show that hard clam farmers with a higher capital may significantly decrease hard clam production while labor costs are insignificant to production output. The results for Regime 2 (stocking density > 1,087,870 inds/ha), on the other hand, indicate that the farming households with higher labor costs and stocking density may significantly enhance production. In contrast, those farmers with a higher capital are likely to encounter a decrease in production output.
In the case of using feed costs as the threshold variable, Regime 1 consisted of 23 observations, and Regime 2 consisted of 196 observations. Similarly, the LM test for no threshold resulted in the rejection of the null hypothesis. The single-threshold model is accepted with a probability of 0.31 for the threshold variable of feed cost. That is, feed costs used as a threshold variable exhibit significant nonlinear effects on hard clam production. As for Regime 1 (feed costs ≤ 13,889 NTD/ha), both labor costs and capitals for hard clam farmers are insignificant in terms of production output. However, a higher stocking density, as well as higher labor costs, seem to boost the overall production output of farming households in Regime 2 (feed costs > 13,889 NTD/ha), while higher capital costs reduce the production output.

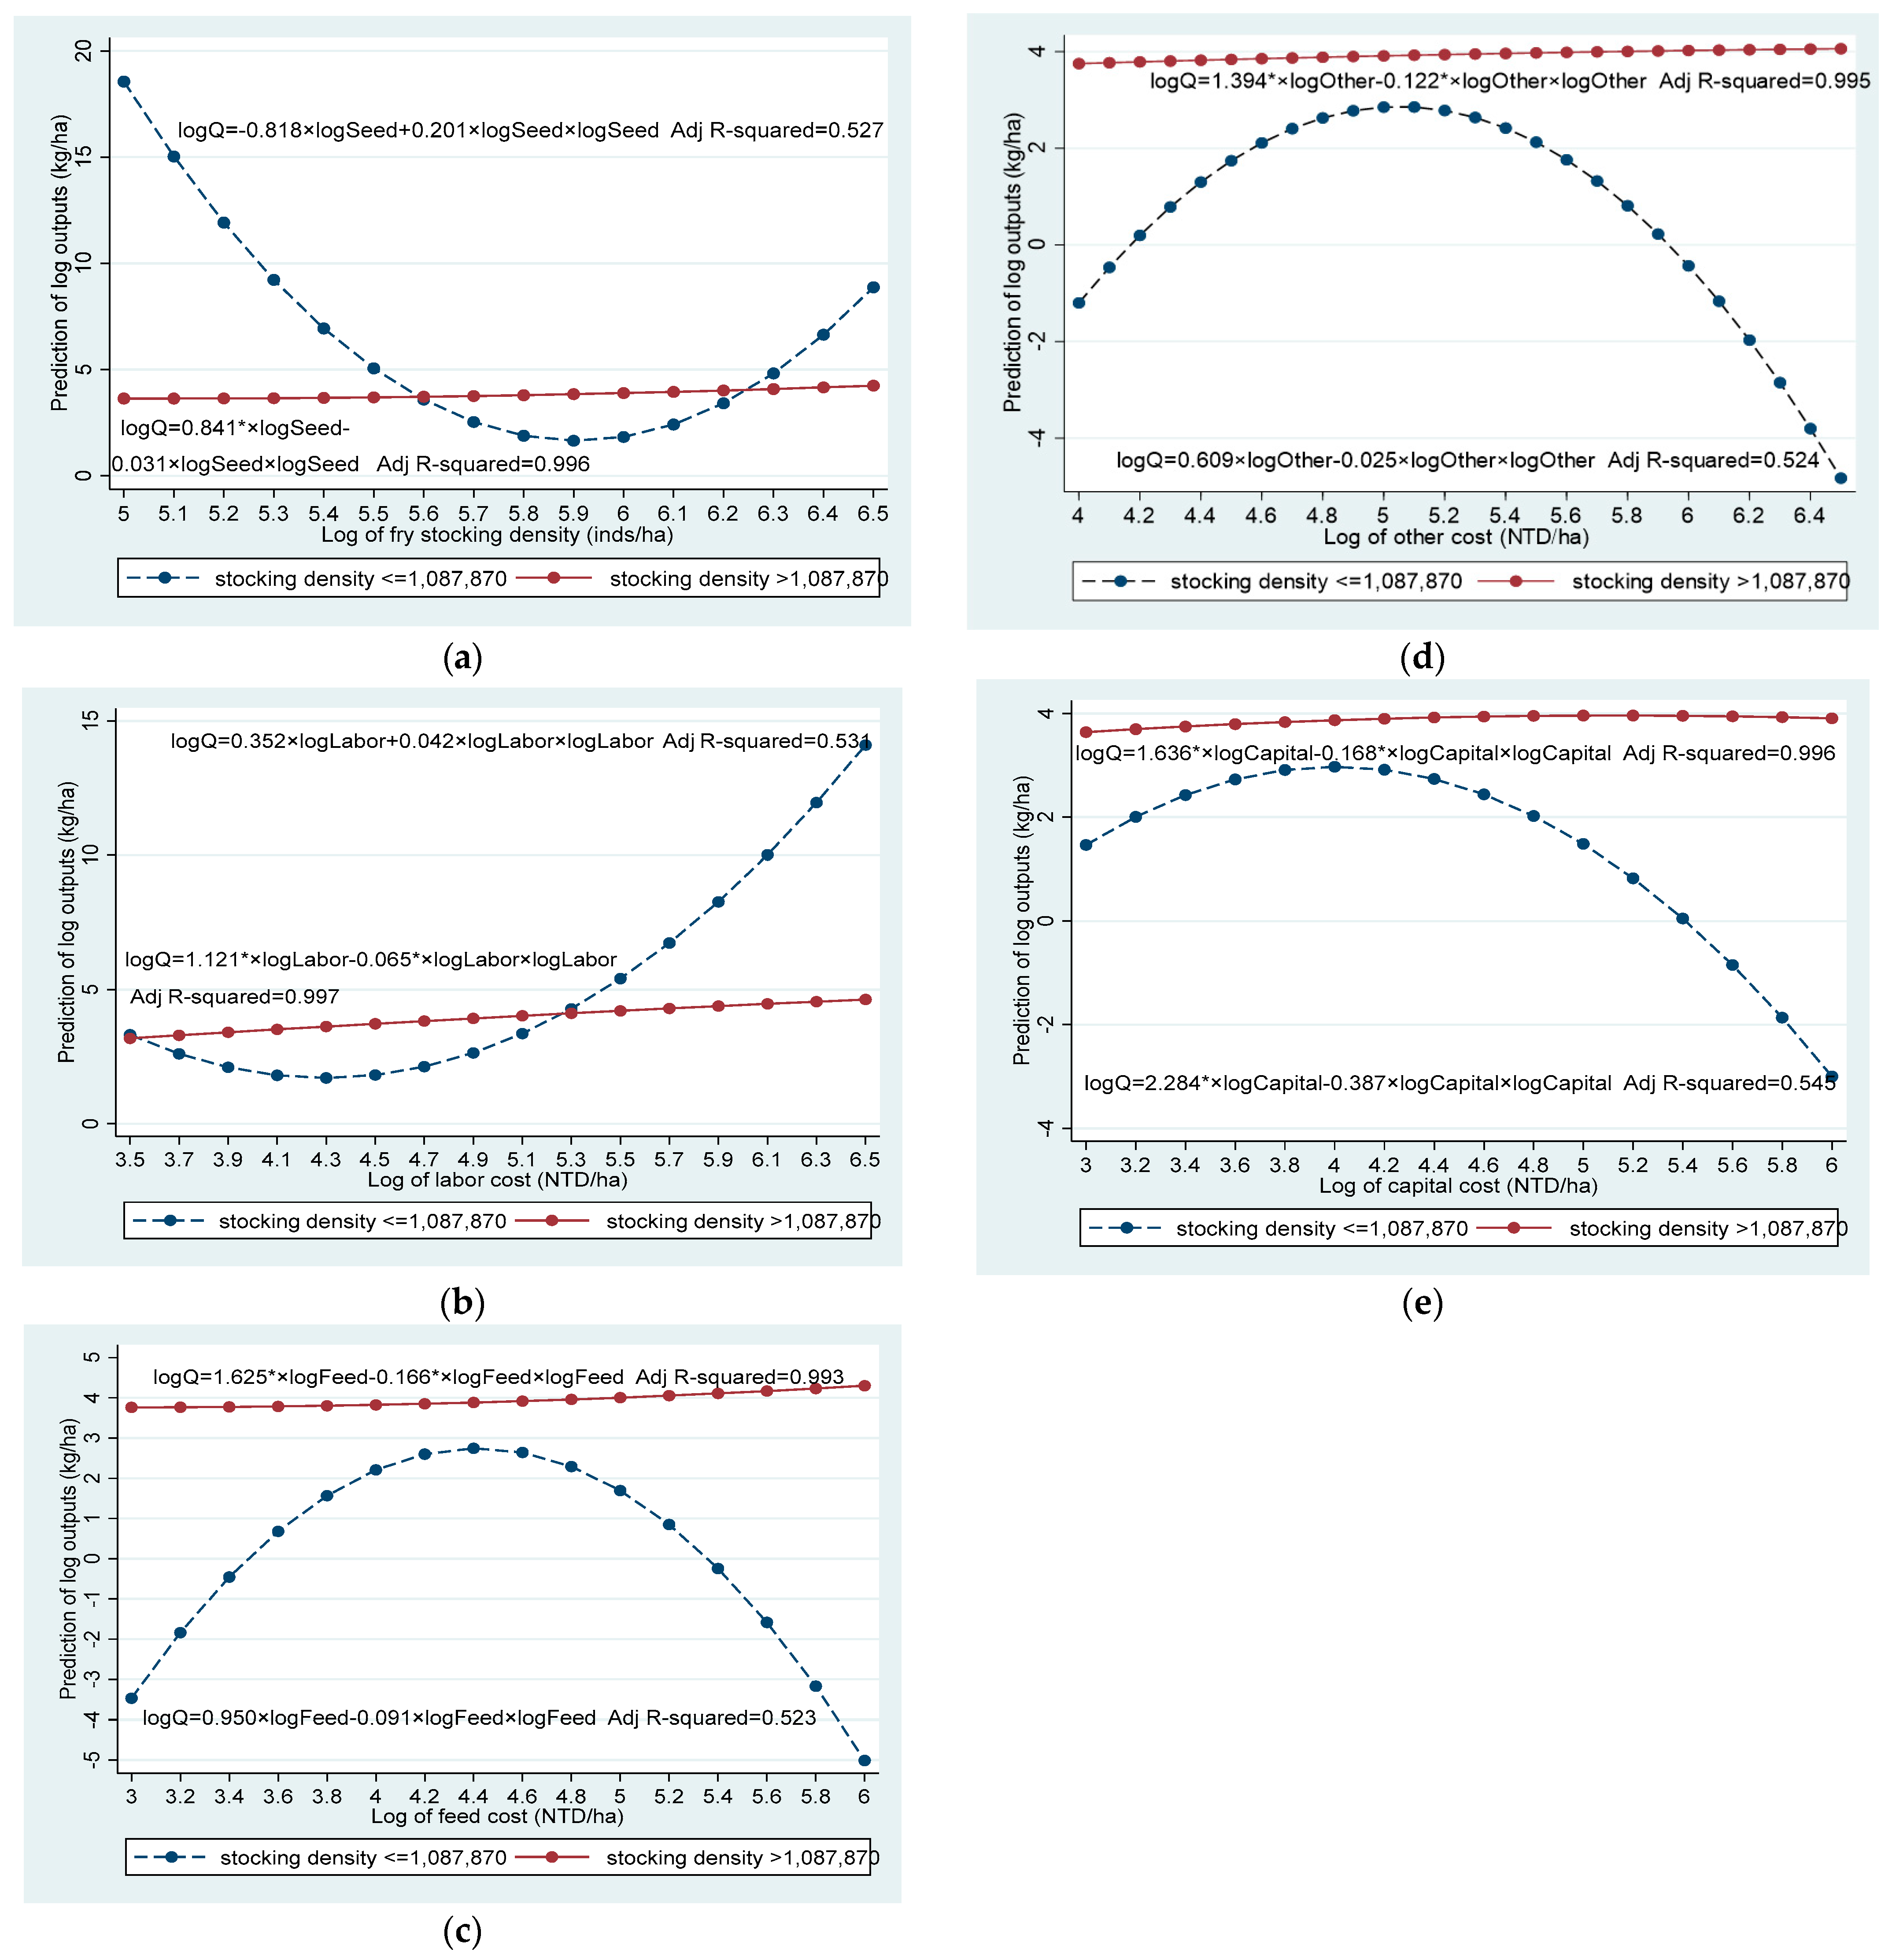
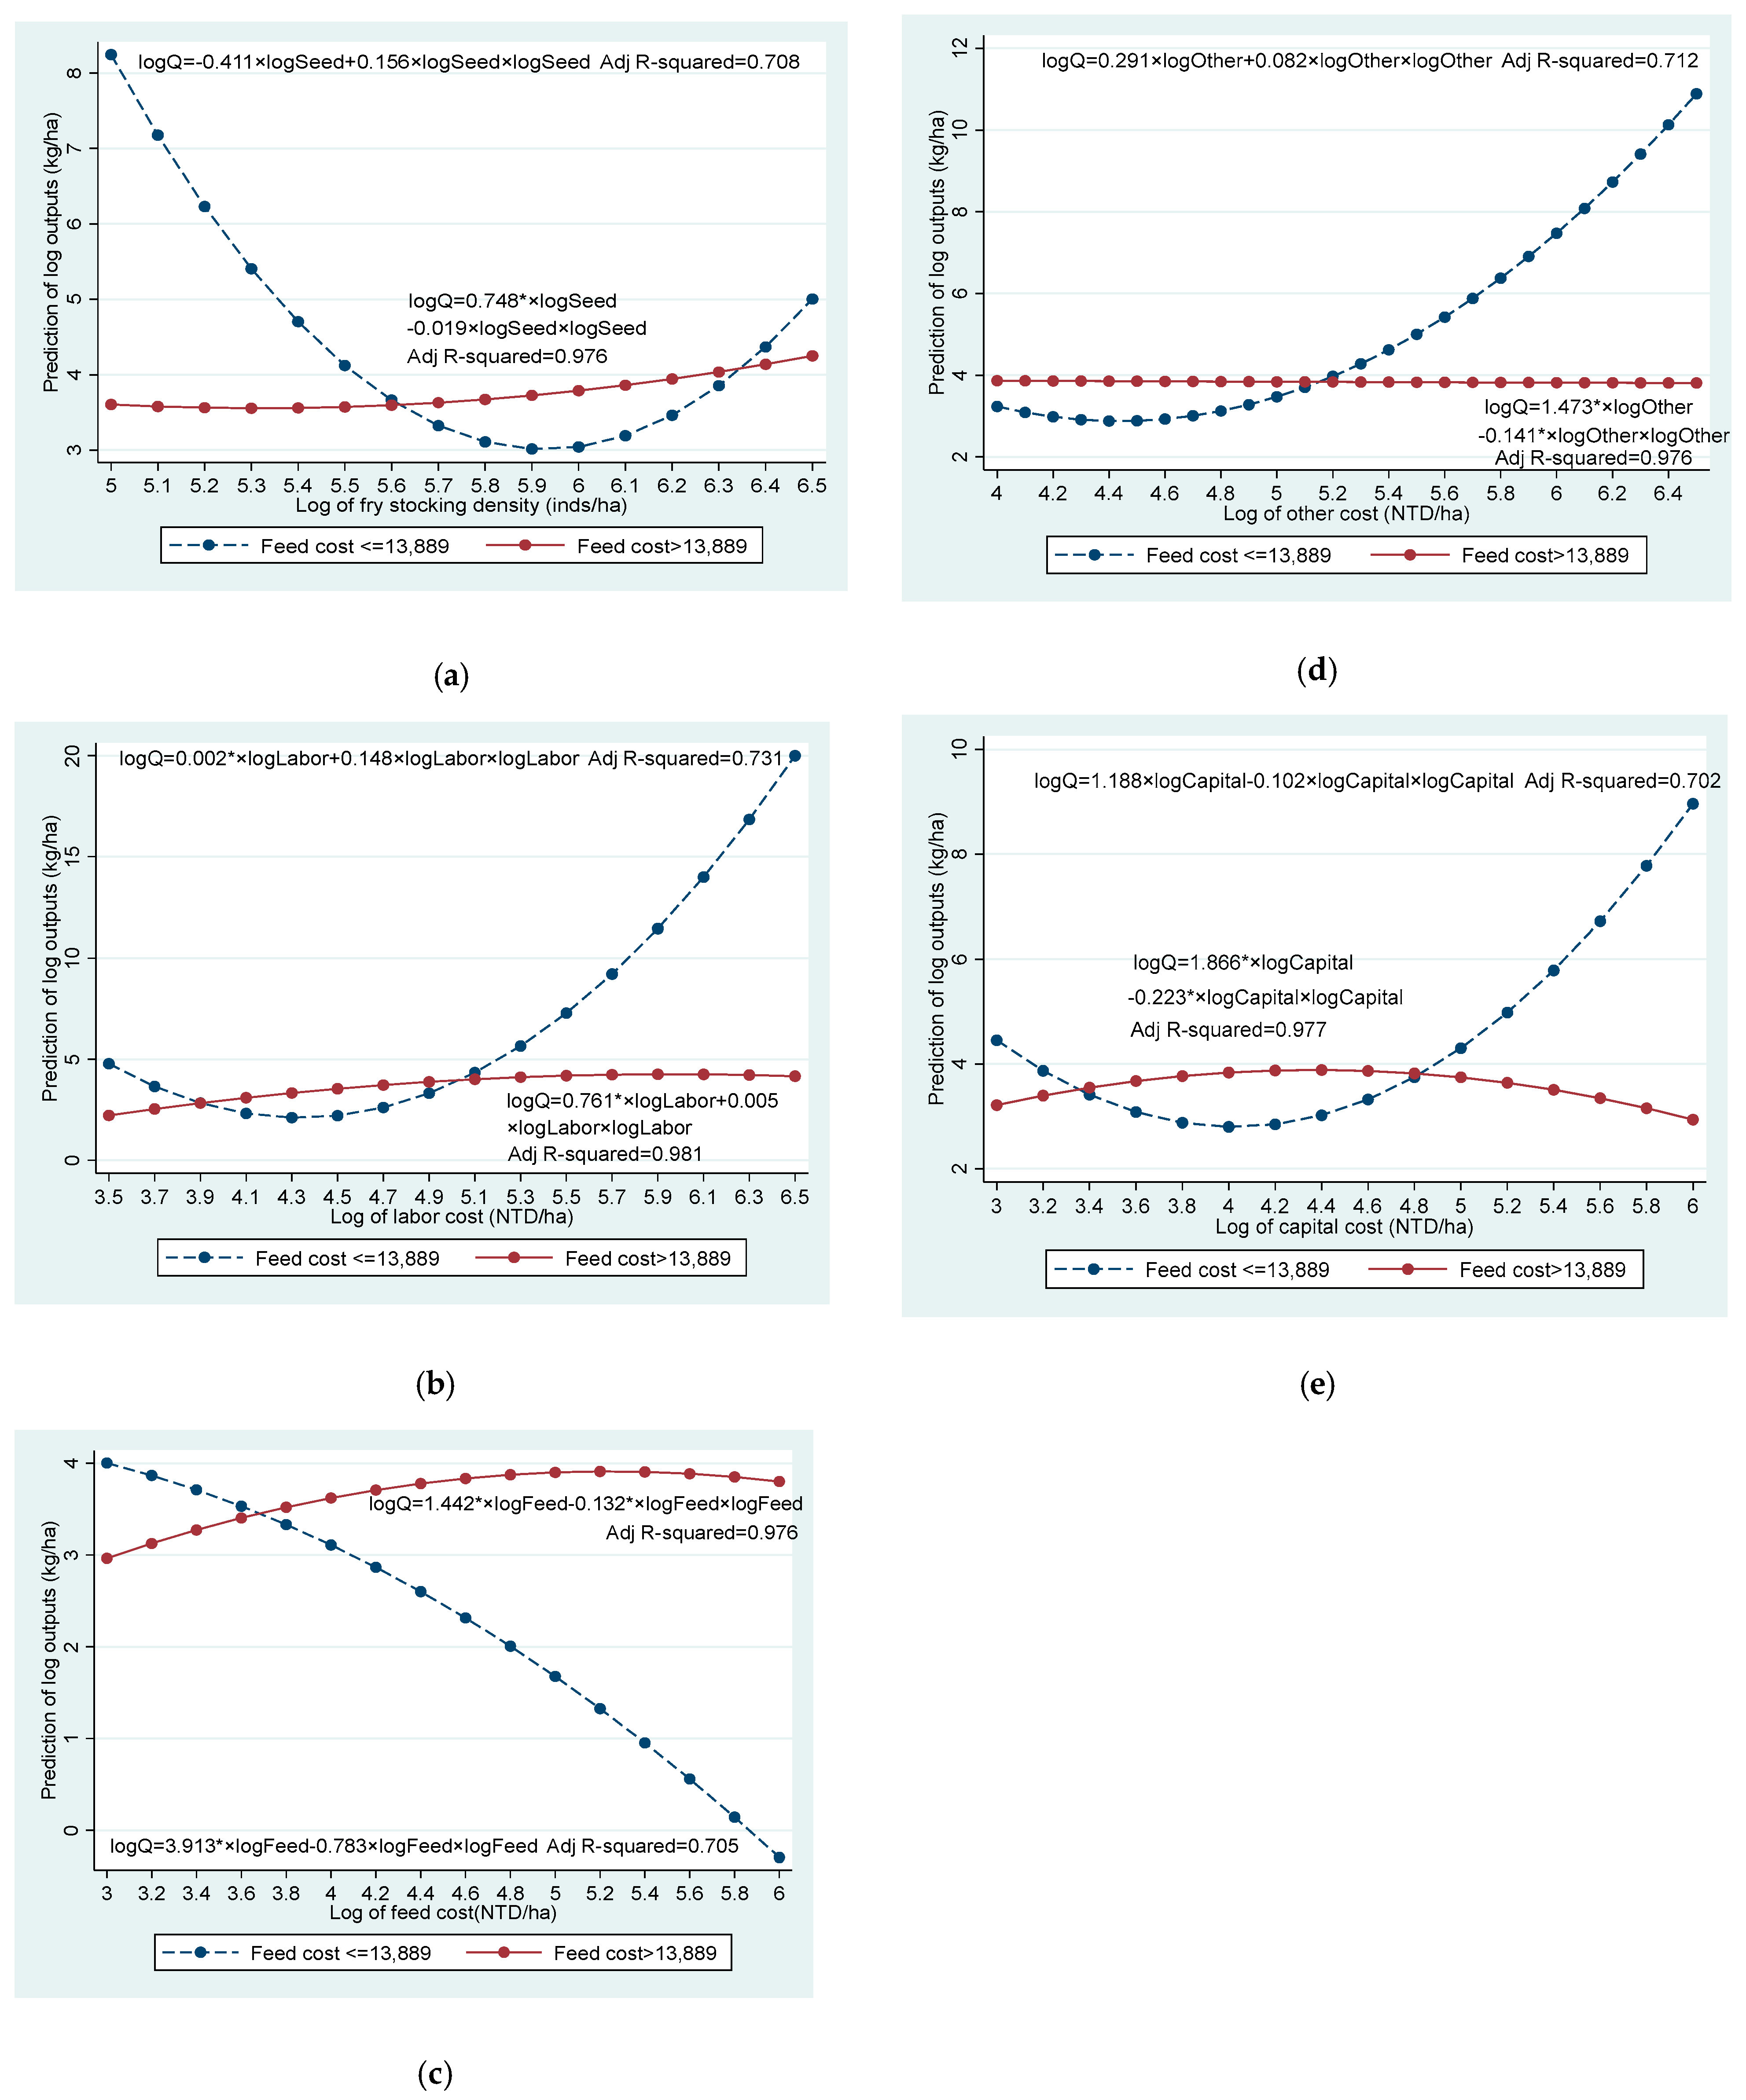
3.3. Simulation Analysis of The Effects of Input Factors on Output

In order to analyze the excessive input of factors, we use regression analysis with individual control variables and their square control variables as the two regressors in our simulation. Figure 2 and Figure 3 show the parameter estimates of the regression model.
Figure 2 displays the threshold effect of the stocking density on simulated hard clam production using different control variables. As shown in Figure 2a, the fry stocking density (inds/ha) has a reverse effect on hard clam production. That is, farming households with a lower stocking density (LSD ≤ 1,087,870 inds/ha) reach the optimal level of log fry stocking density at 5.9 with the minimum production output. In comparison, households with a higher stocking density (HSD > 1,087,870 inds/ha) could further slightly increase the level of fry stocking density to enlarge their production. Similar to fry stocking density, in Figure 2b, we find LSD hard clam farmers reach the optimal level of log labor cost at 4.3 with the minimum production output. In contrast, HSD hard clam farmers experience slight increases in production with increasing labor cost. In Figure 2c, we find that LSD hard clam farmers reach the optimal level of log feed costs at 4.4 with the maximum production output, while HSD households could slightly increase their production by increasing feed inputs. Similar to feed cost, in Figure 2d, we find the optimal levels of log of other cost at 5.1 to capture the maximum production for LSD farmers. There is a positive correlation between other costs and production output in HSD households, which has a small and positive correlation. Moreover, as Figure 2e shows, LSD hard clam farmers exhibit optimal levels of log capital cost at 4 to capture the maximum of production. In contrast, HSD households can keep production levels with increasing levels of capital costs.
Figure 3 exhibits the threshold effect of feed costs on simulated hard clam production for different control variables. As shown in Figure 3a, increasing fry stocking density (inds/ha) has different effects on the production output of farmers with low and high feed costs. That is, the farming households with lower feed costs (LFC ≤ 13,889 NTD/ha) reach the optimal level of log fry stocking density at 5.9 with minimum production output, while those farmers with higher feed costs (HFC > 13,889 NTD/ha) could generate steady production by increasing fry stocking densities (inds/ha). Like fry stocking densities, in Figure 3b, we find that LFC hard clam farmers reach the optimal level of log labor cost at 4.3 with minimum production output. In contrast, HFC hard clam farmers exhibit slight increases in production with increasing labor cost.
There is a negative impact of feed cost on hard clam production in LFC and a positive impact in HFC households (Figure 3c). In addition, LFC farmers reach the optimal level of log other costs at 4.4 with the minimum production output, while HFC farmers may keep hard clam production output constant in case of rising other costs (Figure 3d). As to the impact of capital costs on hard clam production (Figure 3e), LFC hard clam farmers reach the minimum production output when the log capital cost stands at 4. In such a case, the rising capital cost may lead to higher production output levels.
In order to discuss the interaction effect of two regressors of input and input squared terms with the various input factors, this study contains individual control variables and their square control variables and an interaction term between various input factors in the threshold regression model. Figure 4 shows the parameter estimates of feed cost and stocking density, feed cost and other cost, and other cost and feed cost for the HSD regime. Figure 4a shows that in HSD households, increases in stocking density may lead to higher output for the log of feed cost values below 4.5, whereas for other values stocking density exhibits a negative impact on output levels. Figure 4b illustrates a similar relationship for HSD farmers. That is, the input factor other cost has a positive impact on production output levels for the log of feed cost values below 4.5 and a negative impact for other values. Figure 4c shows the positive relationship between feeding cost and production output for the log of other cost values below 5.7 and the opposite effect for other values in HSD households.

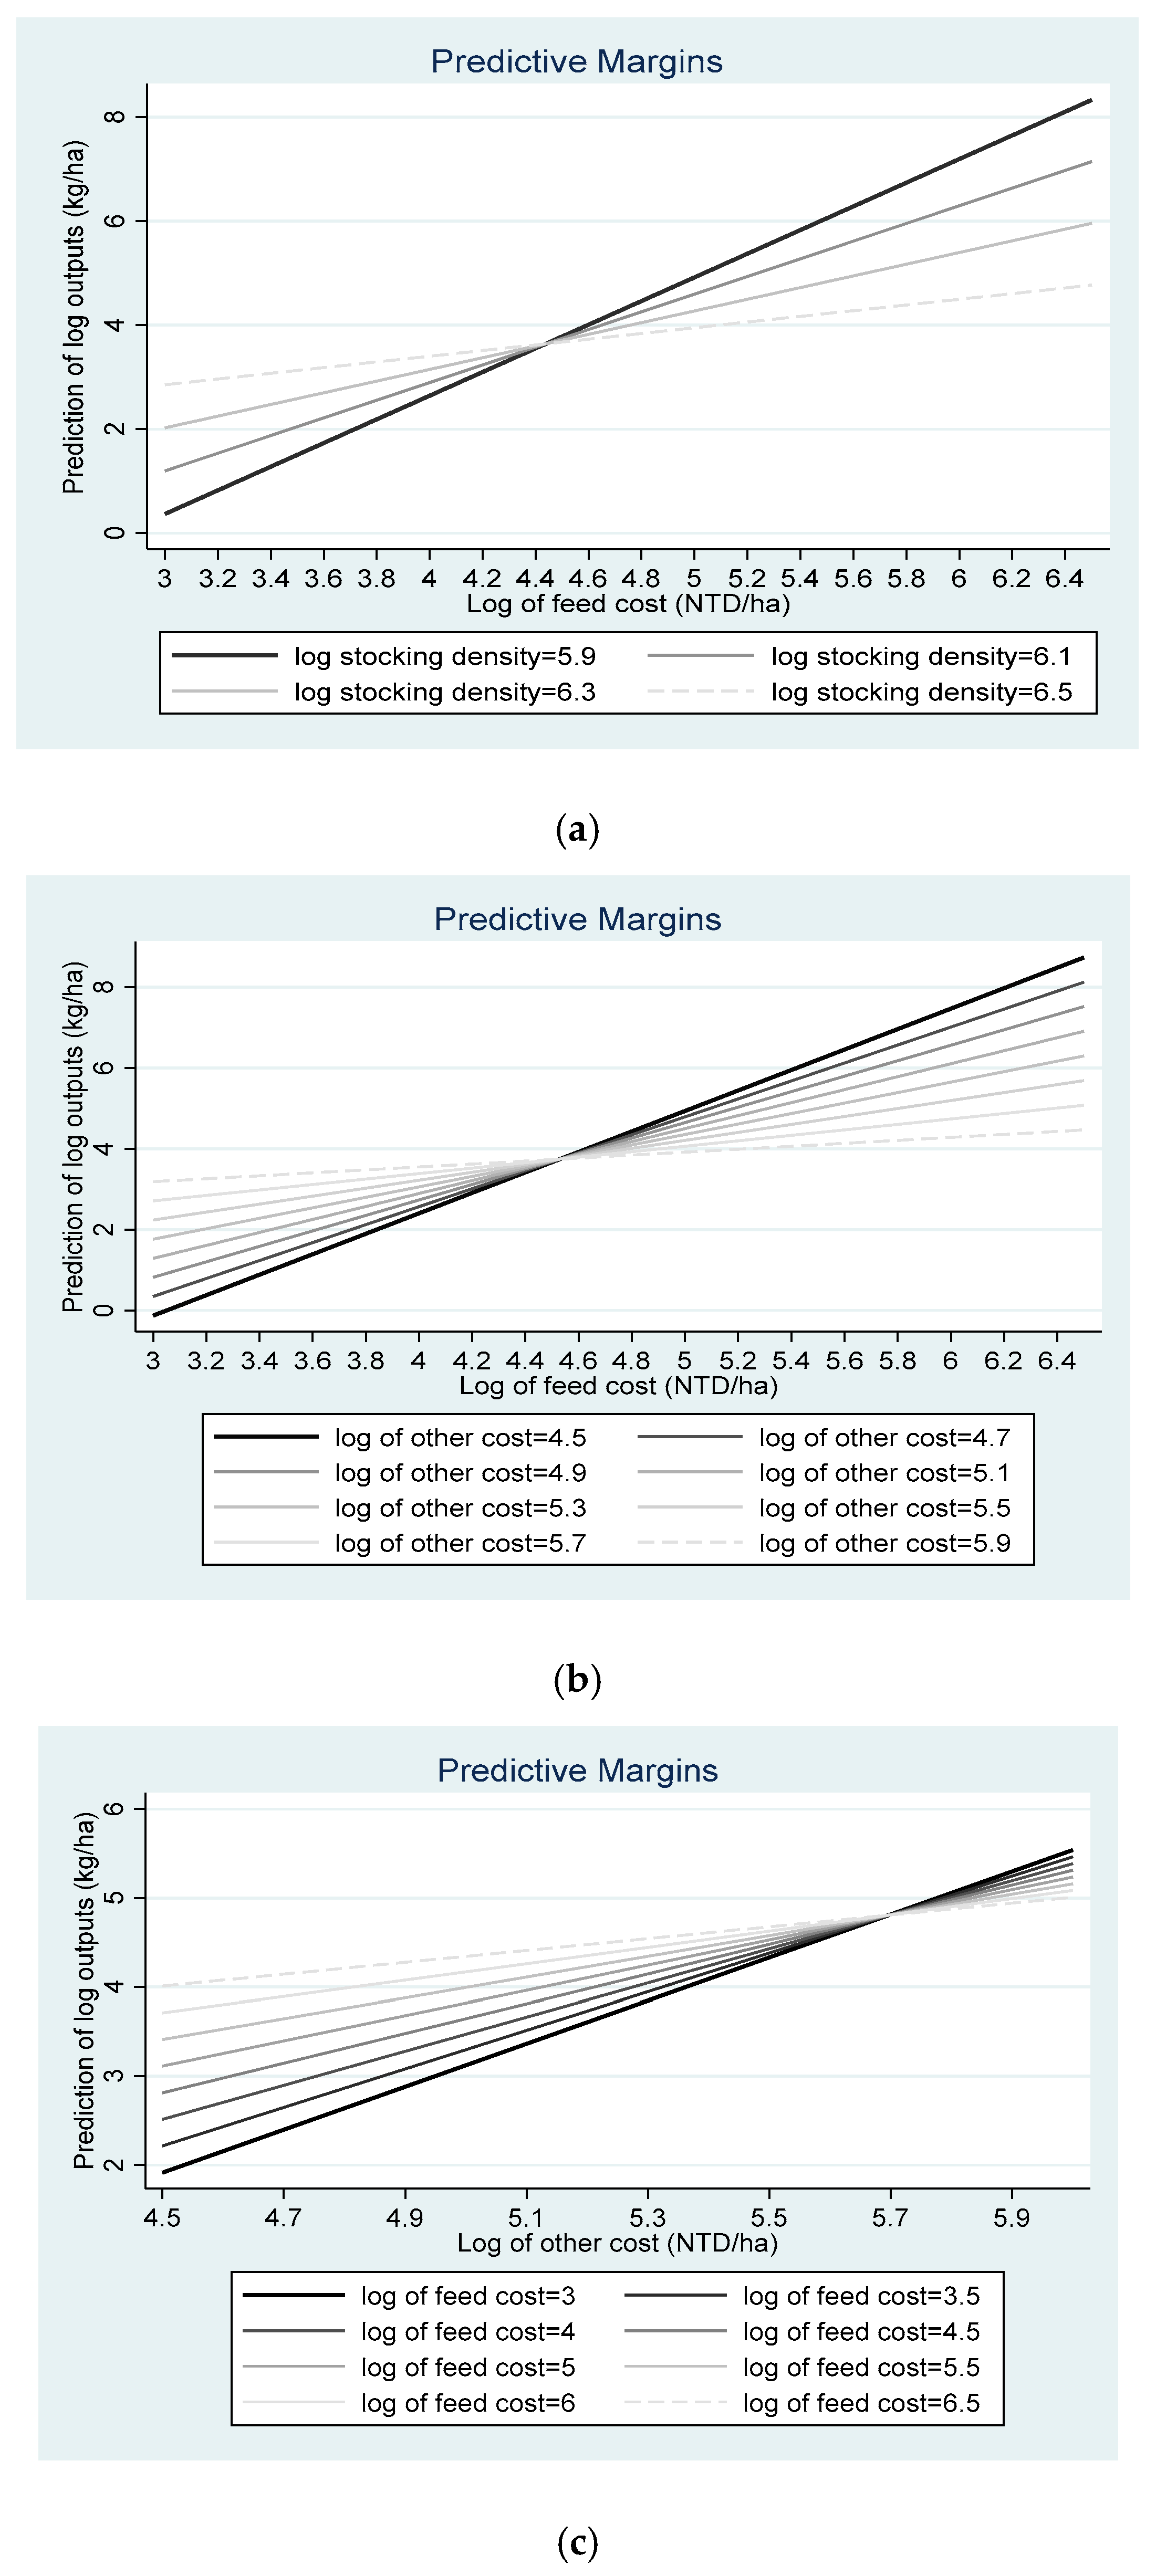
3.4. Analysis of the Economic and Biological Variables by Stocking Density and Feed Cost

For the analysis of economic and biological factors, observations were first clustered according to the threshold intervals of stocking density (≤1,087,870 inds/ha, >1,087,870 inds/ha) and feed cost (≤13,889 NTD/ha, >13,889 NTD/ha). Second, a two-way ANOVA of fry stocking density and feed cost was conducted. The results of the analysis are shown in Table 3.
In terms of the culture area, feed cost, and total cost, the LSD and HSD households exhibit significant differences (Table 3). The survival rate of HSD is 1.9 times higher than that of LSD and accounts for 0.59. The output of HSD is 9807 kg/ha, which is 1.9 times higher than that of the LSD cluster. Moreover, the culture area, feed cost, and total cost of HFC households are comparatively higher (Table 4).

4. Discussion

This study used cross-sectional data and threshold regression modeling to investigate the relationship between hard clam culture input factors and production output. The applied research design thus differs from previous research discussed in the literature. The findings demonstrate the existence of thresholds in terms of stocking density and feed costs. That is, farmers may adjust their input of production factors to increase production output, but the overall impact is affected by the threshold effect. According to the threshold model of the stocking density, the input factor output elasticity of HSD (total input factor parameter estimate) is smaller than 1. As for HSD farmers, any factor input thus presents a decreasing return to scale. More specifically, if the production input factors are increased, the average output will be reduced. The findings of this study differ from previous ones insofar as they suggest that input factor adjustments lead to an increasing return to scale. In other words, the production output can be raised by increasing the input factors [43,44,45,46,47]. Our findings suggest that the effects of input factor adjustments are conditioned by the culture stocking density [39]. Therefore, HSD hard clam farmers must properly manage factor inputs to increase their outputs.
There is a two-regime (nonlinear) relationship between the production input factors and production output. For the HSD and HFC regimes, increasing labor input, seed input, and decreasing capital costs benefit the production output. For the LSD regimes, on the other hand, the production output can be stimulated by reductions in capital input as well as increases in feed input. A similar nonlinear relationship exists in farming households with different stocking densities and feed costs. As such, increasing labor costs have a positive effect on the production output in the HSD and HFC regimes. Similar findings were reported by Khan et al. (2021) [48]. Although the increase in labor input is conducive to productivity, the domestic labor shortage has become a serious issue in recent years. It is thus recommended that more foreign migrant workers be hired to fill the shortage of labor. Moreover, capital increases in the LSD regimes exhibit negative impacts on production. More specifically, under the current scale of production, optimum levels of capital input have been reached in the LSD regimes and excessive input use is imminent. The production output simulation shows that the feed cost of LSD farmers exceeding 25,119 NTD/ha (log of feed cost = 4.4) leads to declines in output. Hard clam farmers usually use algae-laden water, fermented feed broth as well as powders as feedstuff. It is rather difficult to judge whether clams have received the proper amount of feed. From the beginning of stocking seedlings (1600 inds/kg), farmers must start the feeding process with milkfish feed, clam meal, eel meal, or oatmeal. Clams do not ingest food directly. They are filter feeders. That is, clams feed on suspended particles such as micro algae and organic debris. Farmers usually determine the amount of feed by relying on experience and visual assessment of water quality, which is likely to induce excessive feeding and powder deposition, leading to substrate pollution, adverse growth, and low survival rates of hard clam. When the water quality deteriorates (increased algae formation, cloudy water), farmers are advised to reduce the feed and culture medicine costs [49,50] or change the type of feed, such as algae water, photosynthetic bacteria cultured with fish soluble, or the upper layer of fish meal (eel meal) fermented liquid, to reduce the organic matter in the pond and by doing so, enhance water quality management [12,51].
Due to the reciprocal relationship between feeding costs and stocking density, the production output can be expanded by reducing the stocking density in HSD farming households with feeding costs higher than 31,622 NTD/ha (log of feed cost = 4.5). As for HFC households, the production output simulation shows that capital costs exceeding 25,118 NTD/ha (log of capital cost = 4.4) lead to declines in output. The present HFC capital cost of 32,083 NTD/ha is relatively high, and farmers are advised to reduce their capital costs in order to increase production output. The input factor output elasticity of the HFC culture mode is smaller than 1. That is, the culture mode presents a decreasing return to scale, and the aquaculture must adjust the feed input to increase the output. The findings of this study show that HFC has the highest input factor output elasticity at 0.984. As such, raising all input factors by 10% would lead to an overall increase in the output of HFC by 9.84% due to diminishing returns to scale.
The hard clam is a benthic organism, and its survival rate is closely related to the substrate environment and culture management. In the past, mortality was ascribed to climate change and ineffective disease control, while the importance of management was neglected. As pointed out in our research, decreasing survival rates are more likely caused by improper culture management. More specifically, it requires farming households to adjust the input factors to avoid excessively high stocking densities and/or excessive feeding, which may deteriorate the culture environment, increase input factor costs, and significantly reduce the overall production output. Controlling the production factor input according to the characteristics of the two different stocking density and feed cost regimes introduced in this study will help hard clam farmers to increase their production output substantially while reducing input costs.

5. Conclusions

Using cross-sectional data, this study applied threshold regression modeling with stocking density and feed costs as the threshold variables to explore the nonlinear relationship between input and output factors. The study confirmed the existence of a single-threshold effect in terms of the input variables stocking density and feed costs. The threshold effect has several implications for clam farmers in terms of the production output.
The results for Regime 1 (low stocking density) suggest that capital input has a negative impact on production, whereas the opposite effect is the case in terms of feed costs. Regime 2 (high stocking density) farmers may benefit from higher labor and seed inputs. As for the threshold variable feed costs, none of the input factors was significant in terms of production output for Regime 1 (low feed costs) farmers. Seed and labor inputs may, however, boost the overall production output of farming households in Regime 2 (high feed costs).
Furthermore, a simulation analysis was carried out to understand the impact of excessive factor inputs on the regime’s production output. Farming households with high stocking densities (HSD) may slightly raise production levels by increases in factor inputs (feed, seed, capital, labor, other). LSD farmers, on the other hand, first face a steep decline in production output before being able to raise production levels by increasing factor inputs. The simulation analysis for low and high feed cost regimes revealed similar patterns. Farmers with high feed costs (HFC) appear to be less affected by changes in input factor allocations than low feed-cost households (LFC).

Author Contributions

Conceptualization, J.-M.L.; methodology, J.-M.L. and S.-H.C.; software and empirical analysis, J.-F.H.; validation, J.-M.L. and Y.-C.L.; formal analysis, J.-M.L.; investigation, J.-F.H.; resources, T.-W.K.; data curation, C.-Y.Y. and Y.-C.L.; writing—original draft preparation, J.-M.L.; writing—review and editing, J.-M.L. and C.S.; supervision, J.-F.H. and Y.-C.L.; project administration, C.-Y.Y.; funding acquisition, J.-M.L. All authors have read and agreed to the published version of the manuscript.

Funding

This research received no external funding.

Data Availability Statement

Data available on request due to restrictions of privacy or ethical issue.

Acknowledgments

The authors thank anonymous reviewers for their valuable suggestions to improve this study.

Conflicts of Interest

The authors declare no conflict of interest.

References

  1. FAO. FAO Yearbook. In Fishery and Aquaculture Statistics 2017; FAO: Rome, Italy, 2019. [Google Scholar]
  2. Guo, X.; Ford, S.E. Infectious diseases of marine molluscs and host responses as revealed by genomic tools. Philos. Trans. R. Soc. B-Biol. Sci. 2016, 371, 20150206. [Google Scholar] [CrossRef] [PubMed] [Green Version]
  3. Paillard, C.; Le, R.F.; Borrego, J.J. Bacterial disease in marine bivalves, a review of recent studies: Trends and evolution. Aquat. Living Resour. 2004, 17, 477–498. [Google Scholar] [CrossRef] [Green Version]
  4. Rungrassamee, W.; Leelatanawit, R.; Jiravanichpaisal, P.; Klinbunga, S.; Karoonuthaisiri, N. Expression and distribution of three heat shock protein genes under heat shock stress and under exposure to Vibrio harveyi in Penaeus monodon. Dev. Comp. Immunol. 2010, 34, 1082–1089. [Google Scholar] [CrossRef] [PubMed]
  5. Srivastava, P. Roles of heat-shock proteins in innate and adaptive immunity. Nat. Rev. Immunol. 2002, 2, 185–194. [Google Scholar] [CrossRef] [PubMed]
  6. Yue, X.; Liu, B.; Xiang, J.; Jia, J. Identification and characterization of the pathogenic effect of a Vibrio parahaemolyticus-related bacterium isolated from clam Meretrix meretrix with mass mortality. J. Invertebr. Pathol. 2010, 103, 109–115. [Google Scholar] [CrossRef] [PubMed]
  7. Zannella, C.; Mosca, F.; Mariani, F.; Franci, C.; Folliero, V.; Galdiero, M.; Tiscar, P.; Galdiero, M. Microbial diseases of bivalve mollusks: Infections, immunology and antimicrobial defense. Mar. Drugs 2017, 15, 182. [Google Scholar] [CrossRef]
  8. Huang, J.F.; Chou, M.T.; Lee, J.M.; Cheng, Y.H. Effects of culture area, stocking density, and shrimp and fish polyculture on the cost efficiency of hard clam, Meretrix meretrix, culture: A case study of hard clam farms in Yunlin, Taiwan. J. World Aquac. Soc. 2016, 47, 481–495. [Google Scholar] [CrossRef]
  9. Kuo, J. Technical Efficiency Analysis of Hard Clam (Meretrix lusoria) Production in Taiwan. Master’s Thesis, National Taiwan Ocean University, Keelung, Taiwan, 2005. [Google Scholar]
  10. Chang, C.C.; Huang, J.F.; Schafferer, C.; Lee, J.M.; Ho, L.M. Impacts of culture survival rate on culture cost and input factors: Case study of the hard clam (Meretrix meretrix) culture in Yunlin County, Taiwan. J. World Aquac. Soc. 2020, 51, 139–158. [Google Scholar] [CrossRef]
  11. Nga, B.T.; Lebailly, P. Cost Monitoring for Clam Raising Farmers in the Northern Area of Vietnam. Greener J. Agric. Sci. 2014, 4, 378–383. [Google Scholar]
  12. Balcázar, J.L.; De Blas, I.; Ruiz, Z.I.; Cunningham, D.; Vendrell, D.; Múzquiz, J.L. The role of probiotics in aquaculture. Vet. Microbiol. 2006, 114, 173–186. [Google Scholar] [CrossRef]
  13. Lara-Flores, M.; Olvera-Novoa, M.A.; Guzmán-Méndez, B.E.; López-Madrid, W. Use of the bacteria Streptococcus faecium and Lactobacillus acidophilus, and the yeast Saccharomyces cerevisiae as growth promoters in Nile tilapia (Oreochromis niloticus). Aquaculture 2003, 216, 193–201. [Google Scholar] [CrossRef]
  14. Renuka, K.; Venkateshwarlu, M.; Ramachandra, N.A.; Prashantha, K.S. Influence of probiotics on growth performance and digestive enzyme activity of common carp (Cyprinus carpio). Int. J. Curr. Res. 2013, 5, 1696–1700. [Google Scholar]
  15. Far, H.Z.; Saad, C.R.B.; Daud, H.M.; Harmin, S.A.; Shakibazadeh, S. Effect of Bacillus subtilis on the growth and survival rate of shrimp (Litopenaeus vannamei). Afr. J. Biotechnol. 2009, 8, 3369–3376. [Google Scholar]
  16. Nikoskelainen, S.; Salminen, S.; Bylund, G.; Ouwehand, A.C. Characterization of the properties of human-and dairy-derived probiotics for prevention of infectious diseases in fish. Appl. Environ. Microbiol. 2001, 67, 2430–2435. [Google Scholar] [CrossRef] [Green Version]
  17. Demirci, A.; Pometto, A.L.; Cox, D.J. Enhanced organically bound selenium yeast production by fed-batch fermentation. J. Agric. Food Chem. 1999, 47, 2496–2500. [Google Scholar] [CrossRef]
  18. Yang, P.; Lin, J. Aerobic treatment process with by-product utilization for wastewater containing high organic solids. In Proceedings of the 13th Mid-Atlantic Industrial Wastes Conference, Ann Arbor, MI, USA, 29–30 June 1981. [Google Scholar]
  19. Moriarty, D. Control of luminous Vibrio species in penaeid aquaculture ponds. Aquaculture 1998, 164, 351–358. [Google Scholar] [CrossRef]
  20. Martínez, C.P.; Ibáñez, A.L.; Monroy, H.O.A.; Ramírez, S.H.C. Use of probiotics in aquaculture. ISRN Microbiol. 2012, 16, 916845. [Google Scholar] [CrossRef] [Green Version]
  21. Zhan, P.R.; Liu, W. Immobilization and ammonia removal of photosynthetic bacteria. Adv. Mater. Res. 2013, 610–613, 311–314. [Google Scholar] [CrossRef]
  22. Bordignon, F.; Trocino, A.; Rossetti, E.; Zomeño, C.; Pascual, A.; Birolo, M.; Llorens, S.M.; Xiccato, G. Effect of stocking density on growth and survival of juvenile Manila clams (Ruditapes philippinarum) farmed in suspended lanterns in a North Italian lagoon. Aquac. Rep. 2021, 20, 100719. [Google Scholar] [CrossRef]
  23. Pellizzato, M.; Da Ros, L. Clam farming quality as a management tool: A proposal based on recent studies in Northern Adriatic lagoons. Aquac. Int. 2005, 13, 57–66. [Google Scholar] [CrossRef]
  24. Ponti, M.; Castellini, A.; Ragazzoni, A.; Gamba, E.; Ceccherelli, V.U.; Abbiati, M. Decline of the Manila clams stock in the northern Adriatic lagoons: A survey on ecological and socio-economic aspects. Acta Adriat. 2017, 58, 89–104. [Google Scholar] [CrossRef]
  25. Parisi, G.; Centoducati, G.; Gasco, L.; Gatta, P.P.; Moretti, V.M.; Piccolo, G.; Roncarati, A.; Terova, G.; Pais, A. Molluscs and echinoderms aquaculture: Biological aspects, current status, technical progress and future perspectives for the most promising species in Italy. Ital. J. Anim. Sci. 2012, 11, 397–413. [Google Scholar] [CrossRef]
  26. De Oliveira Ramos, C.; da Silva, F.C.; de Miranda Gomes, C.H.A.; Langdon, C.; Takano, P.; Gray, M.W.; de Melo, C.M.R. Effect of larval density on growth and survival of the Pacific oyster Crassostrea gigas in a recirculation aquaculture system. Aquaculture 2021, 540, 736667. [Google Scholar] [CrossRef]
  27. Dethier, M.N.; Kobelt, J.; Yiu, D.; Wentzel, L.; Ruesink, J.L. Ruesink, Context-dependence of abiotic and biotic factors influencing performance of juvenile clams. Estuar. Coast. Shelf Sci. 2019, 219, 201–209. [Google Scholar] [CrossRef]
  28. Cordero, D.; Delgado, M.; Liu, B.; Ruesink, J.; Saavedra, C. Population genetics of the Manila clam (Ruditapes philippinarum) introduced in North America and Europe. Sci. Rep. 2017, 7, 39745. [Google Scholar] [CrossRef] [Green Version]
  29. Jara-Jara, R.; Pazos, A.J.; Abad, M.; García-Martín, L.O.; S’anchez, J.L. Growth of clam seed (Ruditapes decussatus) reared in the wastewater effluent from a fish farm in Galicia (N.W. Spain). Aquaculture 1997, 158, 247–262. [Google Scholar] [CrossRef]
  30. Cigarría, J.; Fernandez, J. Management of Manila clam beds: I. Influence of seed size, type of substratum and protection on initial mortality. Aquaculture 2000, 182, 173–182. [Google Scholar] [CrossRef]
  31. Castagna, M. Aquaculture of the hard clam, Mercenaria Mercenaria. In Biology of the Hard Clam Developments in Aquaculture and Fisheries Science; Chapter 15; Kraeuter, J.N., Castagna, M., Eds.; Elsevier Publication: New York, NY, USA, 2001; Volume 31, pp. 675–699. [Google Scholar]
  32. Ngo, T.T.H.; Azadi, H.; Tran, H.C.; Lebailly, P. Assessment of household risk management strategies for coastal aquaculture: The case of clam farming in Thaibinh Province, Vietnam. Aquac. Int. 2018, 26, 451–468. [Google Scholar] [CrossRef]
  33. Engle, C.R. Risk analysis in production aquaculture research. In Aquaculture Economics and Financing: Management and Analysis; Wiley-Blackwell: Oxford, UK, 2010; pp. 197–206. [Google Scholar]
  34. Handisyde, N.T.; Ross, L.G.; Badjeck, M.-C.; Allison, E.H. The Effects of Climate Change on World Aquaculture: A Global Perspective; Final Technical Report; DFID Aquaculture and Fish Genetics Research Programme Stirling Institute of Aquaculture: Stirling, UK, 2006. [Google Scholar]
  35. De Silva, S.S.; Soto, D. Climate change and aquaculture: Potential impacts, adaptation and mitigation. Climate change implications for fisheries and aquaculture: Overview of current scientific knowledge. FAO Fish. Aquac. Tech. Pap. 2009, 530, 151–212. [Google Scholar]
  36. Asamoah, E.K.; Nunoo, F.K.E.; Osei-Asare, Y.B.; Addo, S.; Sumaila, U.R. A production function analysis of pond aquaculture in Southern Ghana. Aquac. Econ. Manag. 2012, 16, 183–201. [Google Scholar] [CrossRef]
  37. Boonchuwong, P.; Boonchuwong, K.; Noorit, K. Economics of aquaculture feeding practices: Thailand. In Economics of Aquaculture Feeding Practices in Selected Asian Countries; Hasan, M.R., Ed.; FAO Fisheries Technical Paper 505; FAO: Rome, Italy, 2007; pp. 159–181. [Google Scholar]
  38. Phuong, N.T.; Sinh, L.; Thinh, N.; Chau, H.; Anh, C.; Hau, N. Economics of aquaculture feeding practices: Viet Nam. In Economics of Aquaculture Feeding Practices in Selected Asian Countries; Hasan, M.R., Ed.; FAO Fisheries Technical Paper 505; FAO: Rome, Italy, 2007; pp. 183–205. [Google Scholar]
  39. Yeh, C.Y.; Huang, J.F.; Lee, J.M.; Schafferer, C. An economic analysis of hard clam (Meretrix meretrix) farmer polyculture with milkfish (Chanos chanos), silver sea bream (Rhabdosargus sarba), and shrimps at different hard clam stocking densities: A case study of Yunlin County, Taiwan. Aquac. Int. 2017, 25, 1039–1055. [Google Scholar] [CrossRef]
  40. Wang, Y.; Wang, Y. Advance in the mechanisms and application of microecologics in aquaculture. Prog. Vet. Med. 2008, 29, 72–75. [Google Scholar]
  41. Hansen, B.E. Sample splitting and threshold estimation. Econometrica 2000, 68, 575–603. [Google Scholar] [CrossRef] [Green Version]
  42. Ali, H.; Murshed-e-Jahan, K.; Belton, B.; Dhar, G.C.; Rashid, H.O. Factors determining the productivity of mola carplet (Amblypharyngodon mola, Hamilton, 1822) in carp polyculture systems in Barisal district of Bangladesh. Aquaculture 2016, 465, 198–208. [Google Scholar] [CrossRef]
  43. Dey, M.M.; Paraguas, F.J.; Bimbao, G.B.; Regaspi, P.B. Technical efficiency of tilapia growout pond operations in the Philippines. Aquac. Econ. Manag. 2000, 4, 33–47. [Google Scholar] [CrossRef]
  44. Golez, N.V. Formation of acid sulfate soil and its implications to brackishwater ponds. Aquac. Eng. 1995, 14, 297–316. [Google Scholar] [CrossRef]
  45. Nunoo, F.K.E.; Asamoah, E.K.; Osei-Asare, Y.B. Economics of aquaculture production: A case study of pond and pen culture in southern G hana. Aquac. Res. 2014, 45, 675–688. [Google Scholar] [CrossRef]
  46. Reddy, G.; Reddy, M.; Sontakki, B.; Prakash, D.B. Measurement of efficiency of shrimp (Penaeus monodon) farmers in Andhra Pradesh. Indian, J. Agric. Econ. 2008, 63, 653–657. [Google Scholar]
  47. Tho, N.; Vromant, N.; Hung, N.T.; Hens, L. Soil salinity and sodicity in a shrimp farming coastal area of the Mekong Delta, Vietnam. Environ. Geol. 2008, 54, 1739–1746. [Google Scholar] [CrossRef]
  48. Khan, M.A.; Begum, R.; Nielsen, R.; Hoff, A. Production risk, technical efficiency, and input use nexus: Lessons from Bangladesh aquaculture. J. World Aquac. Soc. 2021, 52, 57–72. [Google Scholar] [CrossRef]
  49. Lara-Flores, M. The use of probiotic in aquaculture: An overview. Int. Res. J. Microbiol. 2011, 2, 471–478. [Google Scholar]
  50. Sayed, S.; Zakaria, A.; Mohamed, G.; Mohamed, K. Use of probiotics as growth promoter, anti-bacterial and their effects on the physiological parameters and immune response of Oreochromis niloticus Lin. fingerlings J. Arab. Aquac. Soc. 2011, 6, 201–222. [Google Scholar]
  51. Kumar, R.; Mukherjee, S.C.; Prasad, K.P.; Pal, A.K. Evaluation of Bacillus subtilis as a probiotic to Indian major carp Labeo rohita (Ham.). Aquac. Res. 2006, 37, 1215–1221. [Google Scholar] [CrossRef]
Figure 1. Geographical locations of the hard clam farms in Yunlin County, Taiwan.
Fishes 07 00160 g001
Figure 2. The threshold effect of stocking density on simulated hard calm productions with respect to control variables (Note: * significant at 5%; Source: Authors’ own calculations are based on the estimation of the threshold regression model). (a) Log of fry stocking density (inds/ha). (b) Log of labor cost (NTD/ha). (c) Log of feed cost (NTD/ha). (d) Log of other cost (NTD/ha). (e) Log of capital cost (NTD/ha).
Fishes 07 00160 g002
Figure 3. The threshold effect of feed cost on simulated hard calm productions with respect to control variables (Note: * significant at 5%; Source: Authors’ own calculations are based on the estimation of the threshold regression model). (a). Log of fry stocking density (inds/ha). (b). Log of labor cost (NTD/ha). (c). Log of feed cost (NTD/ha). (d). Log of other cost (NTD/ha). (e). Log of capital cost (NTD/ha).
Fishes 07 00160 g003
Figure 4. The interaction effect of stocking density, feed cost, and other cost on simulated hard calm productions with control variables in a higher stocking density (HSD) regression regime. (a) Interaction of feed cost and stocking density on prediction of outputs. (b) Interaction of feed cost and other cost on prediction of outputs. (c) Interaction of other cost and feed cost on the prediction of outputs.
Fishes 07 00160 g004
Table 1. Summary of hard clam culture farming profits and cost in Yunlin County, Taiwan (2018–2020).
Years
201820192020Total
No. of farms746085219
VariablesMean%Standard DeviationMean%Standard DeviationMean%Standard DeviationMean%Standard Deviation
Outputs (kg/ha)
Hard clam8658 59677309 541510,272 41308964 5293
Inputs (NTD/ha)
Seed costs115,54128.73193,151145,51231.67192,914167,53734.62101,127143,93332.02164,317
Feed costs48,14211.9780,47949,03010.6743,01653,22511.0029,74850,35811.2054,945
Other costs116,91429.08349,281117,55125.59147,329117,19924.2265,087117,19926.07222,543
Labor costs92,61023.03152,897112,99824.6088,358116,35524.0424,876107,41223.89101,460
Capital costs28,8857.1848,28834,3217.4730,11129,6426.1227,29030,6686.8236,311
Costs, returns, and profitability (NTD/ha)
Total costs402,092 494,116459,412 561,274483,953 496,737449,570 513,533
Gross revenue813,852 816,333716,282 102,1061,056,400 910,552908,993 908,993
Net profit411,760 322,217256,870 459,792572,447 413,815459,423 395,461
Average cost (NTD/kg)46.44 87.5562.86 18.4047.11 89.2350.15 50.34
Technical and farmer characteristics
Culture area (ha)2.33 1.991.77 1.211.44 0.991.83 1.50
Culture period (months)10.1 9.3811.9 15.6412.1 29.7411.7 54.94
Fry stocking density (Million inds/ha)110 30.48120 44.36119 21.09117 32.15
Culture survival0.51 0.230.45 0.250.62 0.230.54 0.25
Experience of household head (years)21.5 11.3422.9 11.8018.5 10.0120.8 11.06
Age of household head (years)54 9.0053 9.6855 9.4254 9.33
High school or above education level (%)56.1 37.2358.7 38.7861.6 32.5458.2 35.13
Note: ha = hectare; inds = individuals; NTD = New Taiwan Dollar, 1 USD = 30.08 NTD.
Table 2. Coefficient estimates of Cobb–Douglas production function for hard clam farming using different threshold variables.
VariablesThreshold Variable = Stocking DensityVariablesThreshold Variable = Feed Inputs
Coefficients(t-Statistics)Coefficients(t-Statistics)
Regime 1 (Stocking Density ≤ 1,087,870 inds/ha)Regime 1 (Feed Cost ≤ 13,889 NTD/ha)
Constant−8.674(−1.026)Constant−3.228(−0.253)
Year2019 (1 = 2019)−1.570(−1.428)Year2019 (1 = 2019)−1.878 *(−1.759)
Year2020 (1 = 2020)1.994(1.469)Year2020 (1 = 2020)−0.406(−0.369)
Region (1= Sihu Township)1.292(1.313)Region (1= Sihu Township)0.019(0.032)
Log(Seed)2.106(1.466)Log(Seed)0.885(0.416)
Log(Labor)−1.773(−1.050)Log(Labor)1.343(0.859)
Log(Feed)2.803 *(1.862)Log(Feed)−0.068(−0.690)
Log(Other)2.105(1.064)Log(Other)−0.499(−0.384)
Log(Capital)−3.668 **(−2.556)Log(Capital)−0.390(−0.474)
Observations23Observations23
R20.375R20.268
Shapiro-Wilk W test for Normality0.93
[0.13]
Shapiro-Wilk W test for Normality0.89
[0.15]
Breusch-Pagan/Cook-Weisberg test for heteroskedasticity [p-value]16.89 ***
[0.00]
Breusch-Pagan/Cook-Weisberg test for heteroskedasticity [p-value]3.16 *
[0.08]
Regime 2 (Stocking Density > 1,087,870 inds/ha)Regime 2 (Feed Cost > 13,889 NTD/ha)
Constant0.009(0.013)Constant−1.637(−1.304)
Year2019 (1 = 2019)0.108 *(1.845)Year2019 (1 = 2019)0.428 ***(3.763)
Year2020 (1 = 2020)−0.007(−0.129)Year2020 (1 = 2020)−0.071(−0.883)
Region(1 = Sihu Township)0.004(0.074)Region(1 = Sihu Township)0.060(0.659)
Log(Seed)0.275 **(2.539)Log(Seed)0.401 *(1.713)
Log(Labor)0.595 ***(6.089)Log(Labor)1.210 ***(3.309)
Log(Feed)−0.004(−0.110)Log(Feed)0.225(0.892)
Log(Other)−0.013(−0.162)Log(Other)−0.176(−0.970)
Log(Capital)−0.133 *(−1.787)Log(Capital)−0.676 ***(−3.009)
Observations196Observations196
R20.329R20.273
Shapiro-Wilk W test for Normality0.96
[0.18]
Shapiro-Wilk W test for Normality0.95
[0.13]
Breusch-Pagan/Cook-Weisberg test for heteroskedasticity [p-value]20.70 ***
[0.00]
Breusch-Pagan/Cook-Weisberg test for heteroskedasticity [p-value]427.76 ***
[0.00]
Threshold effect testThreshold effect test
LM test for no threshold
[Bootstrapped p-value]
57.236 ***
[0.000]
LM test for no threshold
[Bootstrapped p-value]
24.792 ***
[0.000]
ThresholdF-statistics[Bootstrapped p-value]ThresholdF-statistics[Bootstrapped p-value]
Single22.630 **[0.020]Single14.700 **[0.043]
Double13.130[0.180]Double8.020[0.310]
Triple2.460[0.900]Triple24.020[0.280]
Note: ***, **, and * indicate statistical significance at the 1%, 5%, and 10% levels, respectively.
Table 3. Two-way ANOVA analysis of stocking density and feed cost for hard clam aquafarms in Taiwan (output, profitability, and input intensities).
Factor(s)Culture AreaFry Stocking DensityCulture SurvivalOutputsGross RevenueNet Profit
F ValuePr > FF ValuePr > FF ValuePr > FF ValuePr > FF ValuePr > FF ValuePr > F
Threshold of stocking density (SD)1.590.2081.810.18075.57 **0.00032.98 **0.0002.73 *0.0970.230.629
Threshold of feed cost (FC)8.81 **0.0032.94 *0.0880.250.6180.650.4200.010.9482.360.125
SD × FC2.200.1392.150.1440.180.6730.100.7470.090.7680.110.736
Factor(s)Seed CostFeed CostLabor CostOthers CostCapital CostsTotal Costs
F valuePr > FF valuePr > FF valuePr > FF valuePr > FF valuePr > FF valuePr > F
Threshold of stocking density (SD)1.900.1690.340.5581.800.1810.290.5880.500.4810.900.342
Threshold of feed cost (FC)3.00 *0.0846.81 **0.0093.75 *0.0543.32 *0.0693.30 *0.0774.18 **0.042
SD × FC0.050.8150.320.5690.110.7370.010.9300.540.4640.020.877
Note: ** and * indicate statistical significance at the 5% and 10% levels, respectively.
Table 4. Summary of hard clam culture farming profits and cost structure in the two fry stocking density and feed input groups in Yunlin county, Taiwan.
Stocking Density ≤ 1,087,870 (inds/ha)
[Standard Deviation]
Stocking Density > 1,087,870
(inds/ha)
[Standard Deviation]
Feed Cost ≤13,889 (NTD/ha)
[Standard Deviation]
Feed Cost > 13,889 (NTD/ha)
[Standard Deviation]
No. of farms2319623196
Variables
Outputs (kg/ha)
Hard clam5155 (1332)9807 (4933)6892 (4726]9255 (5314)
Inputs (NTD/ha)
Seed costs85,268 (62,330)150,888 (171,149)72,547 (73,614)152,381 (170,002)
Feed costs33,293 (26,189)52,870 (57,072)10,234 (4132)55,655 (56,115)
Other costs127,052 (107,897)171,235 (232,050)124,056 (59,106)178,546 (231,529)
Labor costs73,266 (44,767)111,444 (105,491)60,124 (46,555)112,986 (104,732)
Capital costs26,699 (24,943)31,042 (37,441)26,254 (30,995)32,083 (36,663)
Costs, Returns, and Profitability (NTD/ha)
Total costs345,578 (253,131)517,479 (578,539)293,215 (163,683)531,651 (575,581)
Gross revenue663,321 (424,063)937,821 (530,634)746,348 (453,285)916,334 (534,899)
Net profit317,743 (518,851)420,342 (728,837)453,133 (403,817)384,683 (733,371)
Average cost (NTD/kg)67.04 (18.2)52.77 (88.34)42.54 (34.50)57.44 (62.57)
Technical and Farmer Characteristics
Culture area (ha)2.05 (1.89)1.80 (1.45)2.61 (2.02)1.73 (1.40)
Fry stocking density (inds/ha)1,124,730 (26,189)1,174,170 (57,072)1,098,656 (4,132)1,177,229 (56,115)
Culture survival0.31 (0.07)0.59 (0.20)0.45 (0.28)0.55 (0.24)
Note: ha = hectare; inds = individuals; NTD = New Taiwan Dollar, 1 USD = 30.08 NTD.
Publisher’s Note: MDPI stays neutral with regard to jurisdictional claims in published maps and institutional affiliations.

