Article

Production Performances and Profitability of Stocking Homestead Ponds with Advanced Carp Fingerlings for Maximizing Family Nutrition and Income Generation

by
Mohammad Belal Hossain
1,2,*,
As-Ad Ujjaman Nur
1,
Md. Milon Sarker
1,
Partho Banik
1,
Md. Monirul Islam
3,
Mohammed Fahad Albeshr
4 and
Takaomi Arai
5
1
Department of Fisheries and Marine Science, Noakhali Science and Technology University, Noakhali 3814, Bangladesh
2
School of Engineering and Built Environment, Griffith University, Brisbane, QLD 4111, Australia
3
Nutrition Unit, Bangladesh Agricultural Research Council, Farmgate, Dhaka 1200, Bangladesh
4
Department of Zoology, College of Science, King Saud University, P.O. Box 2455, Riyadh 11451, Saudi Arabia
5
Environmental and Life Sciences Programme, Faculty of Science, Universiti Brunei Darussalam, Gadong, BE 1410, Brunei
*
Author to whom correspondence should be addressed.
Submission received: 14 September 2022 / Revised: 7 October 2022 / Accepted: 12 October 2022 / Published: 15 October 2022
(This article belongs to the Special Issue Synergistic Effects of Hydroclimate and Fisheries)

Abstract

:
Coastal homestead ponds are flooded during the rainy season and only hold water for five to six months. For coastal rural people, these ponds have a substantial impact on household nutrition and income generation. However, choosing the right culture techniques, stocking density, and seed size are necessary for fish aquaculture to be effective in this sort of seasonal pond. Hence, an adaptive field experiment was conducted to reveal the growth performance, yield and cost–benefit using advanced carp fingerling at different stocking densities in homestead ponds. Advanced fingerlings of Gibelion catla, Labeo rohita, Cirrhinus cirrhosus, and Labeo calbasu with the mean individual stocking weight of 243 ± 1.87 g, 223.56 ± 2.35 g, 155.89 ± 1.69 g, and 158.72 ± 1.35 g, respectively, were stocked at three different stocking densities, e.g., 825 kg ha−1 in T1, 560 kg ha−1 in T2 and 370 kg ha−1 in T3 and reared for 5 months. Homemade supplementary feed with protein content of 24.25% was supplied twice daily. The specific growth rate (SGR) was recorded highest at T3 for all the cultured species as L. rohita (1.15 ± 0.01% day−1), followed by G. catla (1.12 ± 0.004% day−1), L. calbasu (1.09 ± 0.01% day−1), and C. cirrhosus (0.98 ± 0.002% day−1), respectively. An inverse relationship was detected between fish growth and stocking density for all treatments. A similar pattern was observed in the survival rate, where reduced survival rates were recorded at T1 for all species. Significant variation (p < 0.05) was found among the treatments in terms of final weight, SGR, and survival rate. Economics of the carp polyculture also showed the highest net benefit (2609.77 ± 2.02 USD ha−1) and benefit–cost ratio (2.06 ± 0.002) at T3. Rearing of fish at 370 kg ha−1 stocking density yielded 129.21% and 110.96% higher production in T3 than T1 and T2, respectively. Overall, T3 treatment was more appropriate than T1 and T2 due to its low FCR, low investment but high survival rate, and net return. Therefore, stocking homestead ponds with advanced carp fingerling with a density of 370 kg per ha can be suggested as for increasing fish production and benefit in the homestead ponds of coastal rural area. In addition, further research is recommended to find out the effects of feeding and sources of seeds on the production performances.

1. Introduction

Fish production is greatly influenced by culture management, stocking density and size. Stocking density affects growth, space utilization, feed consumption, and fish health. [1]. A species’ stocking density can be optimized by increasing both productivity and profitability at various stocking densities. In this instance, larger cost–benefit ratios and lower feed conversion ratios are taken into account when choosing an appropriate stocking density within the framework of the carp polyculture system’s economic sustainability. [2,3,4]. Even if there is a negative correlation between growth and stocking density because of the competition for food and space, for example, fish placed at higher density typically have lower growth [2,5], and production [3,6], researchers are still working on optimizing the stocking densities of different aquatic species to maximize their global production. However, complete utilization of space and natural resources in a production system can improve fish production and profitability [7]. In contrast, improper stocking can also lead to lower fish production [8]. The economics of fish culture depend upon stocking density as optimal stocking is more economical than the minimum and maximum considering the cost–benefit analysis [2,3]. Therefore, the optimization of stocking density is indispensable for the improvement of culture technology for fruitful aquaculture in Bangladesh.
In rural Bangladesh, about 4.27 million households (20%) have a small pond close to their homestead that is used for aquaculture nationwide. This pond covers an area of 266,259 ha [9,10]. These ponds are under-utilized due to traditional fish culture. These homestead ponds can play an important role in household nutrition and income generation by fish culture through proper utilization with optimum stocking density and proper culture management [11]. Pond fish culture in Bangladesh indicates mainly the culture of carps as well as some exotic fish species and thus the scientific practice of polyculture is of great importance [12]. The basic principle of carp polyculture is the stocking of compatible fish species of diverse feeding habits (herbivores, carnivores, omnivores) and layers (surface, middle, bottom) and cultured together in the same pond to utilize all the natural resources and spaces properly [13].
Homestead ponds are typically small, seasonal bodies of water that flood during the rainy season and dry out throughout the summer. [14]. The majority of these temporary ponds are used for polyculture of fast-growing fishes, primarily Chinese and Indian major carps, which contribute 3% to 15% of total household income and 25% to 50% of fish consumption [9,15]. Thousands of homestead ponds covering an area of 1079 ha in Noakhali district, produce only 1486 MT of fish per year [16]. This suggests that extensive fish culture is being practiced there without maintaining the proper stocking density, as indicated by the lower fish production. In addition, these ponds comprise substantial silt, sludge, and domestic wastes which release organic toxic that reduce the fish growth and increase the mortality rate during the culture period [17]. In additon, water quality can rapidly turn down in fishponds due to using the water in personal hygiene, bathing of cattle, washing dishes, and other utensils, etc. However, the optimal production of fish totally relies upon the physical, chemical, and biological qualities of water [18], along with the density and ratio of fishes [19].
Since carp polyculture is one of the most widely used culture techniques in Bangladesh, it is nearly impossible to achieve the desired results in carp polyculture farming and justify the cost–benefit ratio without the appropriate knowledge, in particular concerning stocking density, stocking size and species selection. The carp species, Gibelion catla, Labeo rohita, Cirrhinus cirrhosus, and Labeo calbasu are frequently used in polyculture systems in Bangladesh. Although a few experiments have been conducted to optimize the stocking density of each of these species [19,20,21,22], studies’ regarding the stocking density using the advanced fingerlings for combined rearing of these species has not been conducted yet in the homestead ponds. Therefore, the goal of this study was to know the growth performance, yield and benefit–cost using advanced carp fingerling with an aim to inform further research to optimize (or maximize) income generation (and nutrient availability) in the coastal area of Bangladesh.

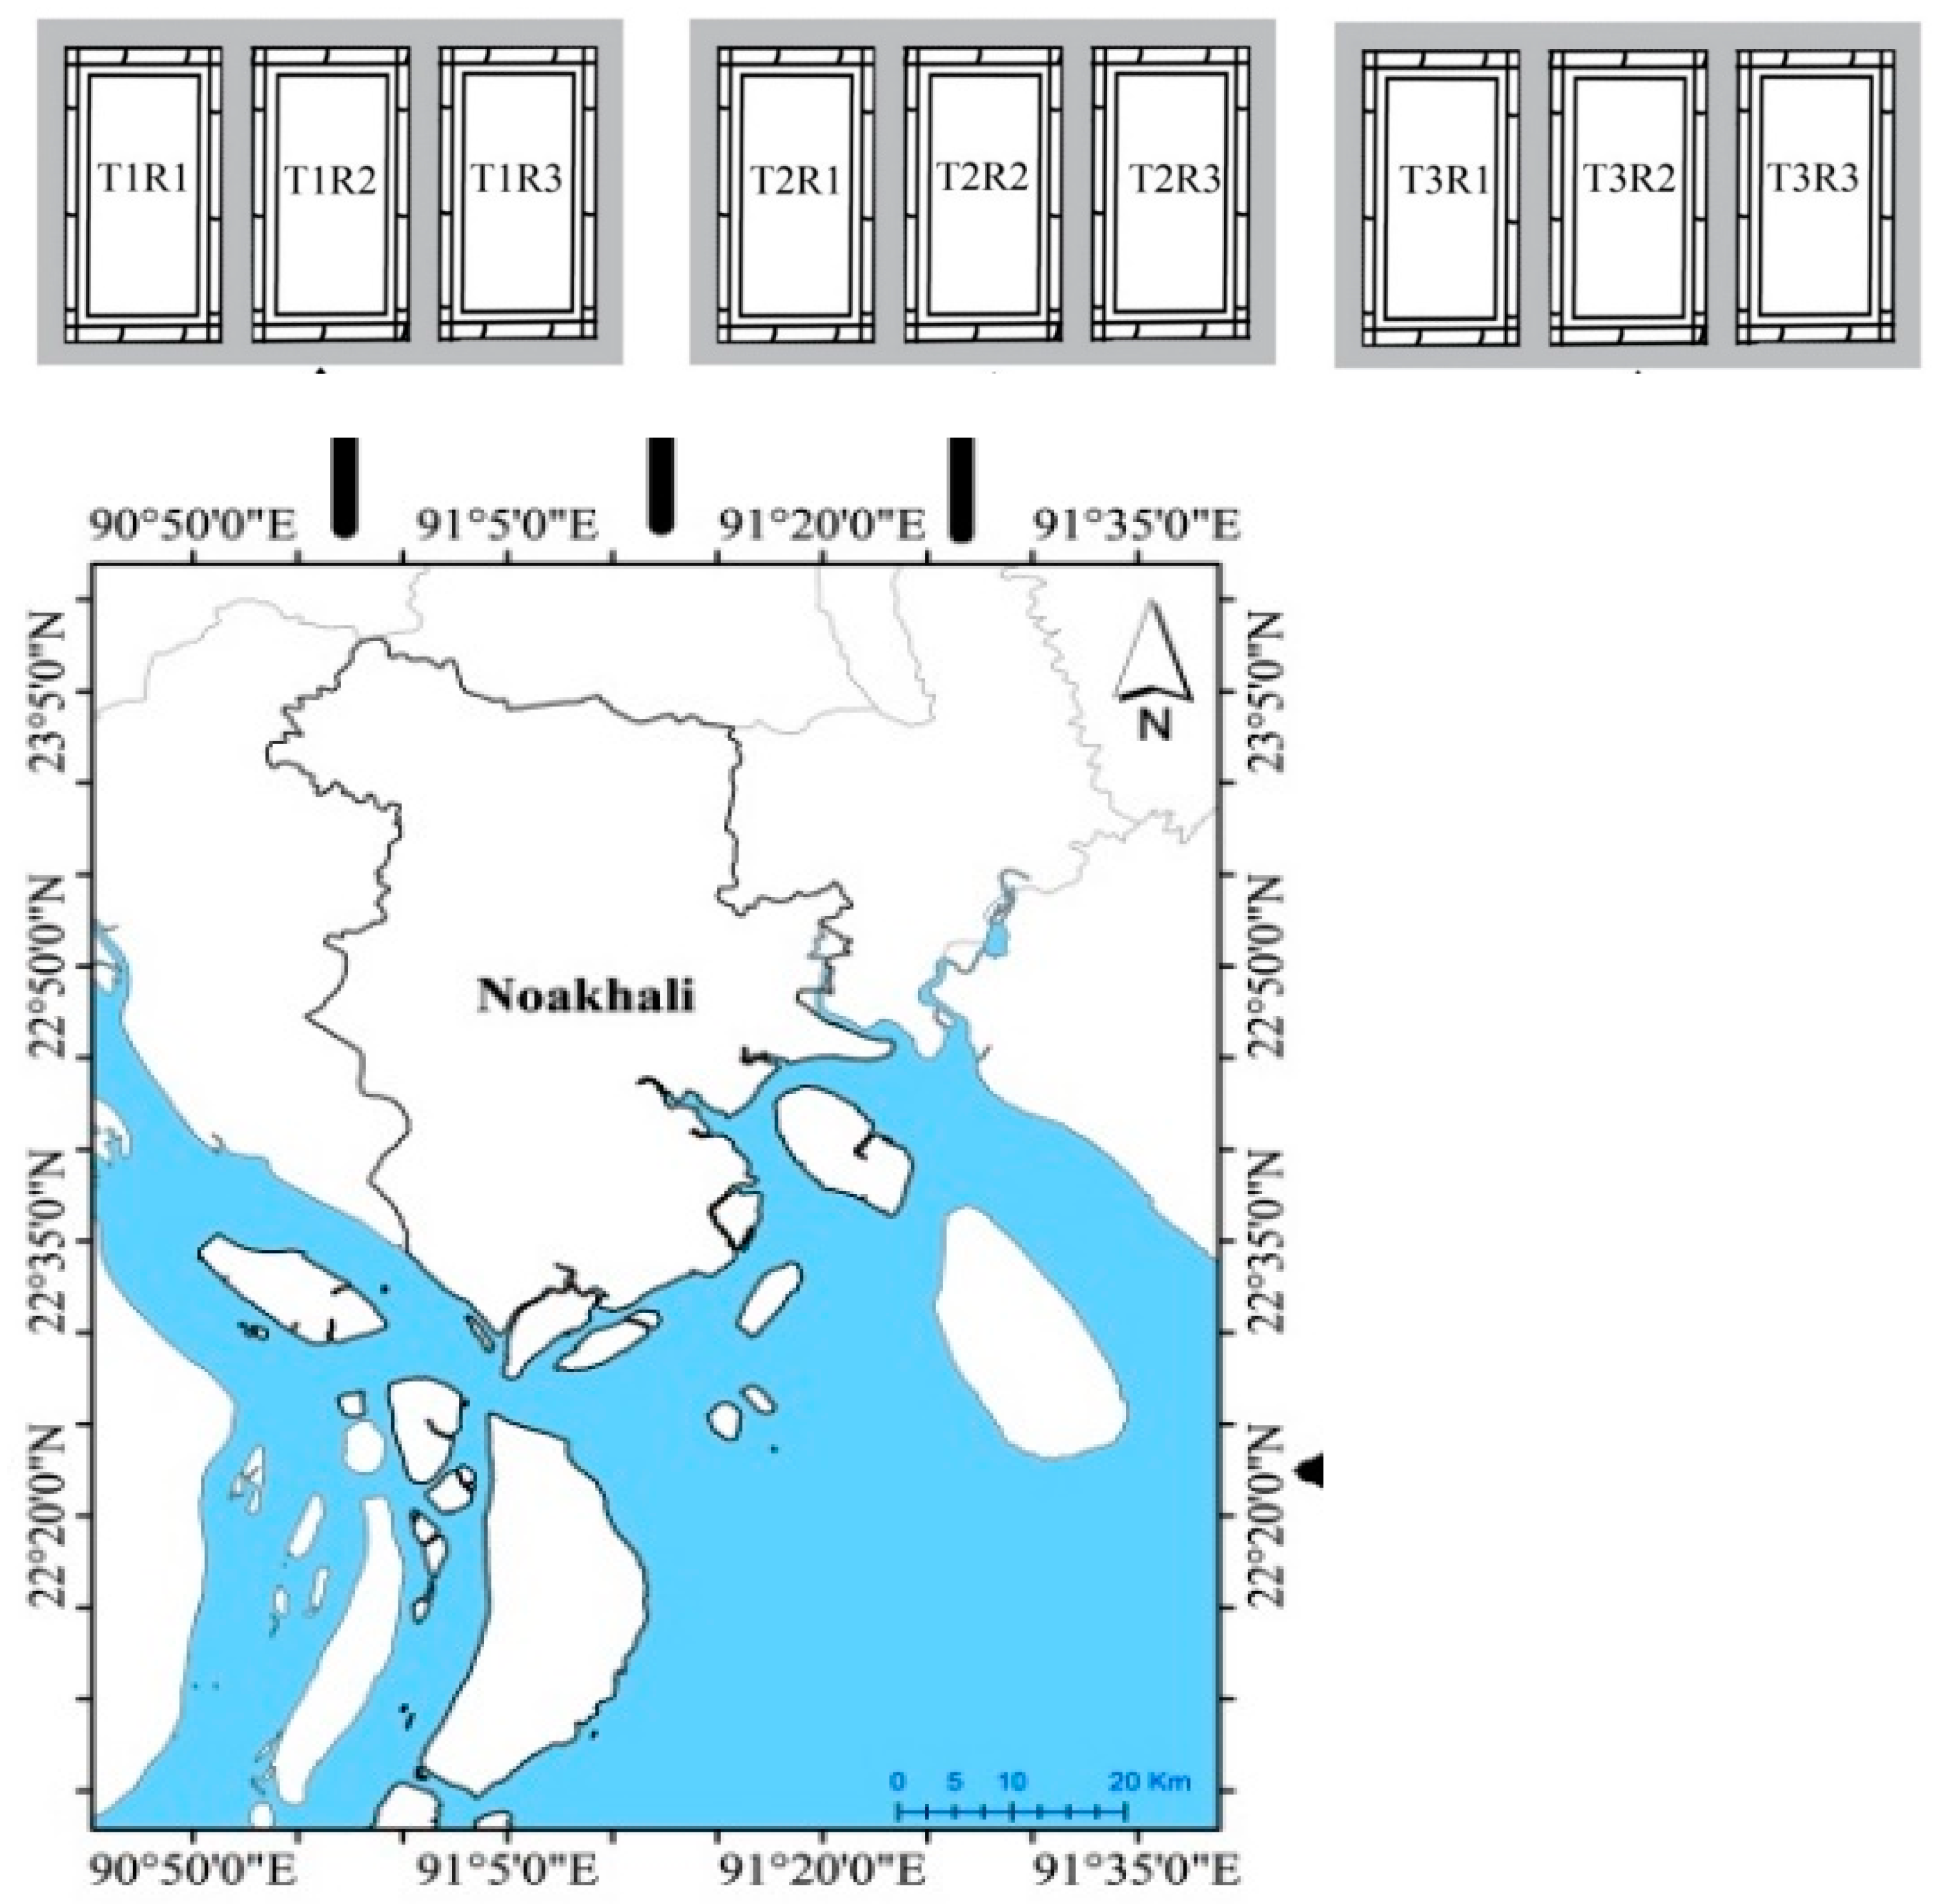
2. Materials and Methods

2.1. Experimental Design

Experimental design was prepared following the size, depth and physiographic condition of the local homestead ponds. Homestead ponds can be categorized into three categories, small pond (1–4 decimal), medium pond (5–8 decimal) and large pond (>8 decimal). However, 80% of them are smaller (1–4 decimal) with a depth of 1–2 m. It was observed that the highest number of ponds (75%) was occupied by the single owner and the rest (25%) by joint or multiple owners. The ponds are mainly seasonal and used polyculture system for their own consumption. This experiment was performed on the growth performance of advanced carp fingerlings using different stocking density suitable for homestead ponds between July 2019 and December 2019. Four advanced fingerlings of carps viz. Catla (G. catla), Rohu (L. rohita), Mrigal (C. cirrhosus), and Kalbasu (L. calbasu) were used as experimental species and stocked at 825 kg (T1), 560 kg (T2) and 370 kg (T3) fish seed per ha in nine earthen ponds (Figure 1). To set up the experiment, indigenous knowledge, local polyculture practice, and climatic conditions of the Noakhlai floodplain were considered. This design was also chosen mimicking the local homestead ponds so that local fish farmers could easily follow these culture techniques. All ponds were rectangular in size (16.1 × 10.8 m) with a maximum depth of 1.5 m. The ponds were individually supplied with groundwater from an adjacent deep tube-well and completely exposed to sunlight at an average of 8 h per day. Experimental ponds were prepared according to the methods described by Chakraborty and Mirza [4]. The mean stocking weight of G. catla, L. rohita, C. cirrhosus, and L. calbasu was 243 ± 1.87 g, 223.56 ± 2.35 g, 155.89 ± 1.69 g, and 158.72 ± 1.35 g, respectively.

2.2. Feeding Management

Feeding began immediately after stocking. Supplementary feed was used in all three treatments and applied twice daily at 8:00 am and 5:00 pm with a mixture of rice bran (25%), wheat bran (25%), fish meal (25%), and mustard oil cake (25%). The ratio of the ingredients was calculated using Pearson square method and mentioned in Table 1. Supplementary feeding was done at the rate of 2% to 6% of fish body weight (6% for the first month, 5% for the next three months, and 2% for the last two months). The quantity of feed was adjusted every month according to the total biomass of fish obtained from the sampling as part of monitoring fish growth.

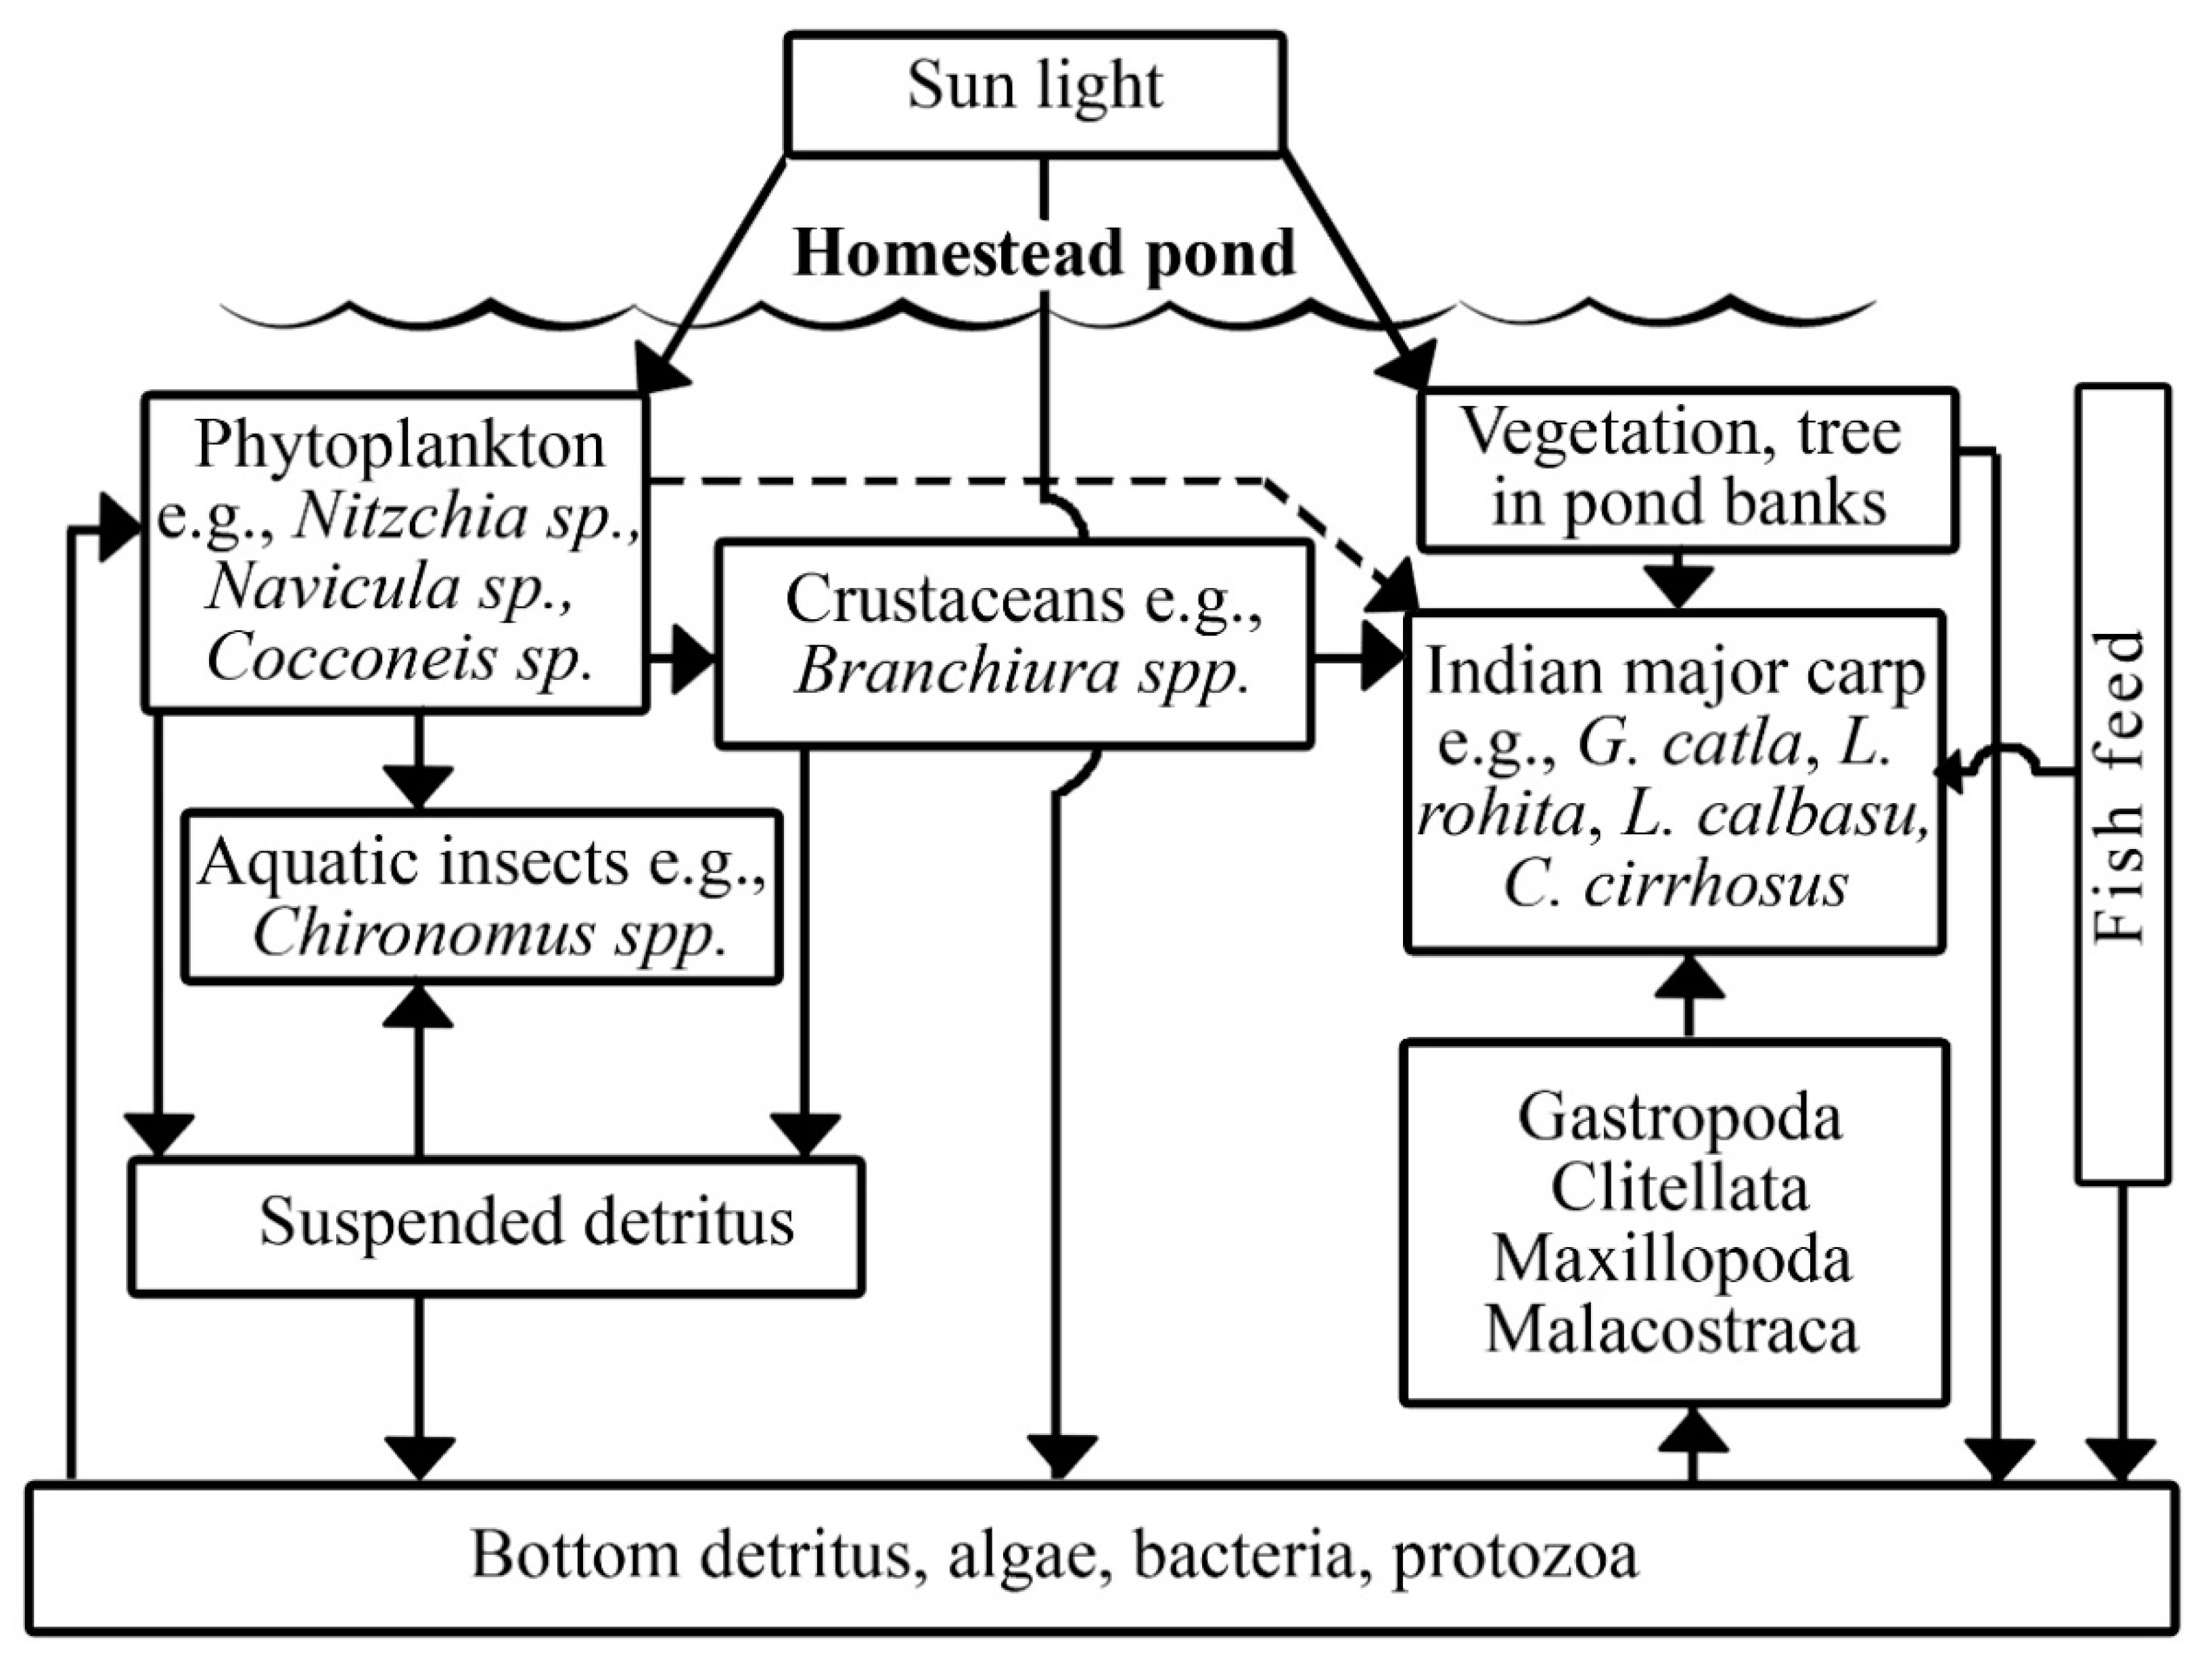
2.3. Nutrient Cycle in the Polyculture Ponds

Generally, accumulation of the nutrients in bottom sediments occurs in both organic and inorganic forms [23]. Sediment can accumulate 100 to 1000 times more nutrients than water. The resuspension method of sediment can transfer nutrients back into the water and thus influence the pond limnology [24]. In this study, C. cirrhosus and L. calbasu were used which helped to transfer nutrients from bottom sediment to the water column via bioturbation of benthic organic matter [23,24]. In this experiment, nutrients basically enter into the homestead ponds from the sun and fish feed. Most of the feeds were consumed by the fish and the rest were deposited in the bottom which eventually resuspended in phytoplankton and benthic organisms (Figure 2).

2.4. Water Quality Monitoring

The important physico-chemical parameters of water viz., pH, salinity (psu), dissolved oxygen (mg/L), and water temperature (°C) were monitored every seven days interval between 9.00 to 10.00 a.m. using Hannah Multi-parameters (Model: H198194). Water transparency (cm) was measured using a Secchi-disc. Nitrates (NO3), phosphates (PO43), and sulphates (SO42) were also documented monthly by with a Spectrophotometer (Model: UV 1800, Shimadzu Europa) following the method described in APHA [25].

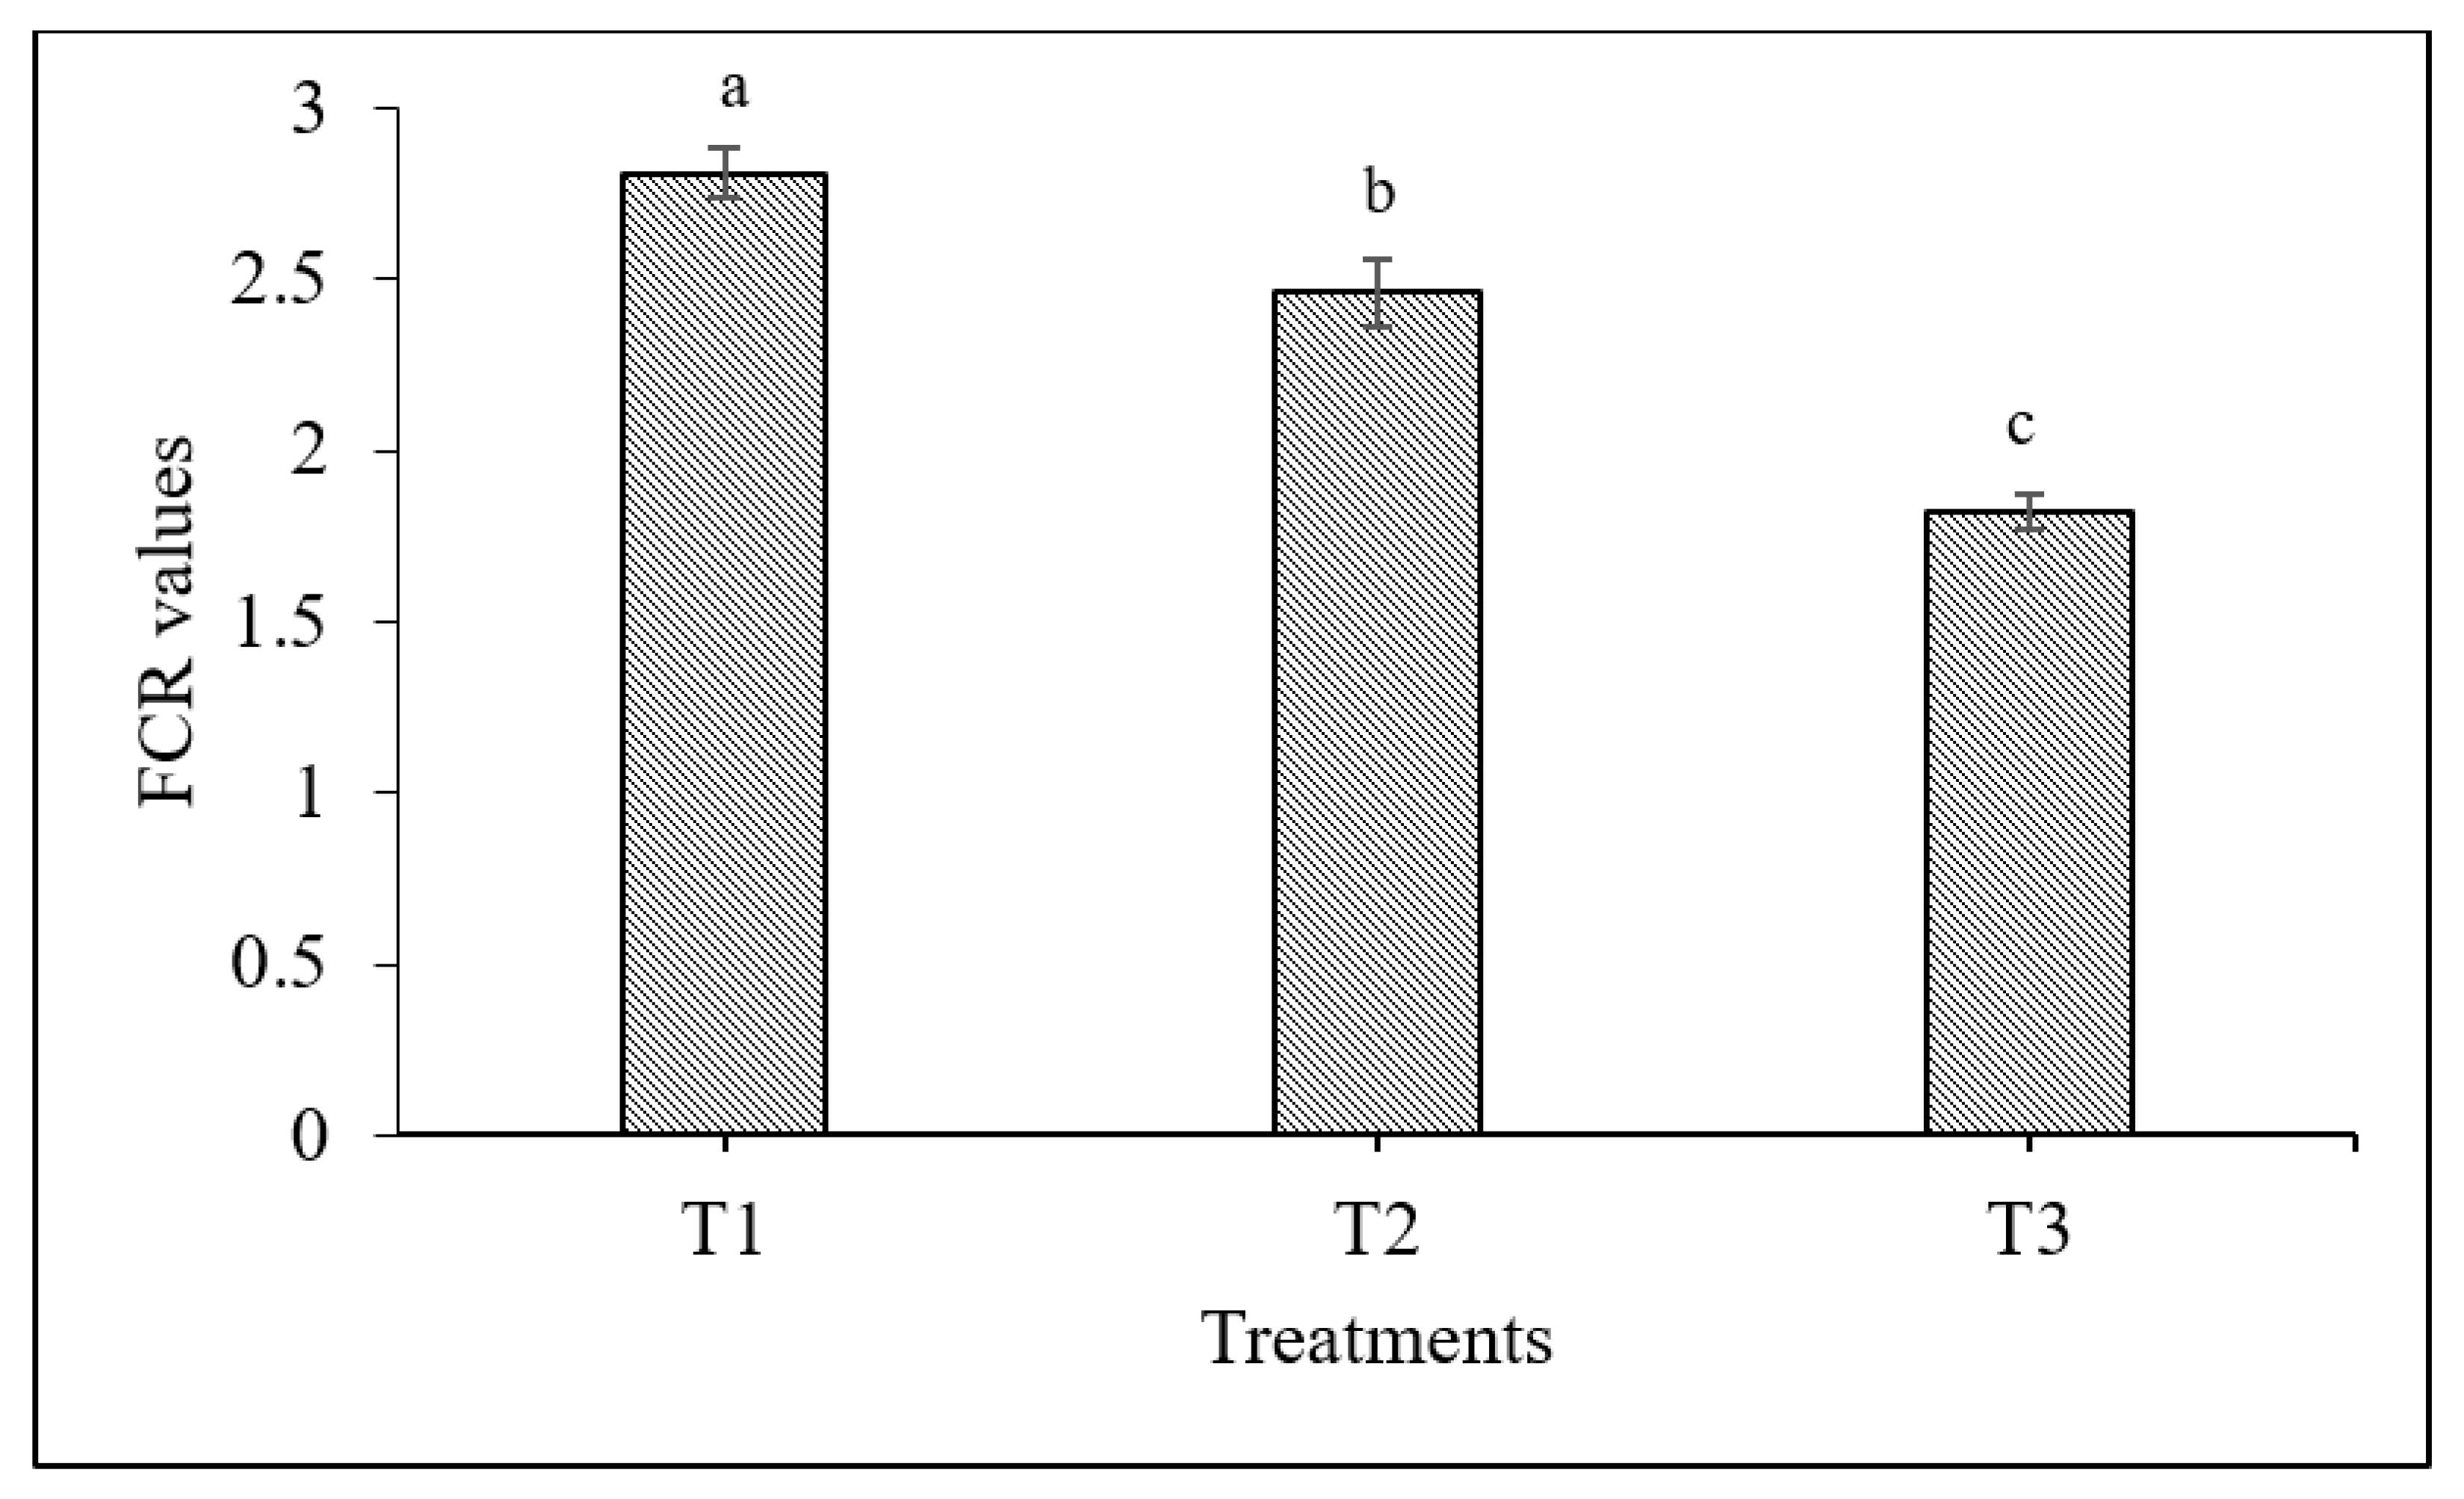
2.5. Survival Rate, Weight Gain and Feed Conversion Ratio

The fishes were sampled at monthly intervals to assess the growth rate of fishes using a cast net. At least 10% of the stocked fishes were caught for each sampling from each experimental pond. The survival rate, specific growth rate (SGR), feed conversion ratio (FCR), and gross yield (GY) were measured at the end of the experiment as:
Survival   rate   ( % ) = Number   of   fish   harvested   Number   of   fish   stocked × 100
Weight gain (g) = [Mean final weight (g) – Mean initial weight (g)]
SGR   ( % / day ) = l n   ( Final   weight )     l n   ( Initial   weight ) Culture   period   in   days × 100
FCR = Feed   given   ( dry   weight ) Body   weight   gain   ( wet   weight )
GY = [Average final weight × total number of survivors]

2.6. Plankton and Macro-Benthic Invertebrate Enumeration

Water and sediment samples from each pond were collected monthly to estimate quantitative and qualitative plankton in the experimental ponds. Details of sample collection and processing are defined in Sarker et al. [15] and Hossain and Hossain, [17]. The samples were identified using a Carl Zeiss Axiostar microscope and a stereomicroscope (Leica EZ4E, Wetzlar, Germany) with 8× to 35× magnification with the help of standard manuals and published scientific articles [26,27,28,29,30,31,32,33,34,35].

2.7. Economics of Carp Culture

An elementary cost–benefit analysis was followed to disclose the economics of carp polyculture under diverse treatments. At the termination of the experiment, fishes were harvested and sold to the local market. Cost–benefit analysis of different treatments was figured based on variable costs (the cost of lime, organic and inorganic fertilizer, fish seed, and feed), fixed cost (land lease), and the revenue from the sale of fishes. The prices were expressed in the United States currency (84 BDT = 1 USD). Total income determined from the market price of the fish sale was expressed as USD ha–1. Prices of inputs and fish resembled to wholesale market prices in 2019 of Noakhali, Bangladesh. Net return (R), return on investment (ROI), and cost–benefit ratio (CBR) were reckoned following Shamsuddin et al. [36] as:
R = I – (FC + VC)
where R refers to net return; I is income from fish sold; FC and VC stand for fixed cost and variable cost, respectively.
ROI = N I T C × 100
where NI refers to net income and TC is total cost
BCR = T o t a l   n e t   r e t u r n T o t a l   i n p u t   c o s t
when the BCR is > 1.0, the project is anticipated to have a positive net present value; when it is < 1.0, the project’s expenses outweigh its benefits [36].

2.8. Statistical Analysis

Collected data was subjected to one-way analysis of variance (ANOVA). Significant difference among the mean values of the treatments in this experiment was tested by using PAST (Paleontological Statistics; Version 4.03, Palaeontological Association. Oslo, Norway) software [37]. Other analyses were done by computer software Microsoft Excel 2016.

3. Results

3.1. Water Quality Parameters

Water quality parameters varied slightly across the treatments (Table 2). The mean values of water pH, salinity, DO, transparency, and temperature ranged from 8.02 ± 0.15 to 8.09 ± 0.13, 0.14 ± 0.02 psu to 0.15 ± 0.04 psu, 5.08 ± 0.26 mg L−1 to 5.2 ± 0.25 mg L−1, 35.74 ± 1.36 cm to 36.54 ± 1.76 cm, and 26.35 ± 0.63 °C to 26.67 ± 0.49 °C, respectively, among the treatments. During the 5-month culture period, the pH of water varied within a range of 7.50−8.28 with higher values (>8.00) recorded from the middle of November to December (4th to 5th month of culture). Water temperature along with dissolved oxygen in each pond varied monthly. The concentration of nitrate varied from 5.51 ± 3.56 mg L−1 to 5.93 ± 3.54 mg L−1 among the treatments whereas phosphate and sulphate differ from 0.3 ± 0.03 to 0.35 ± 0.07, and 0.14 ± 0.02 to 0.27 ± 0.41, respectively (Table 2). However, no significant differences (p > 0.05) were found in the mean values of water quality parameters among treatments which denoted no improvement or decline in water quality due to different stocking in diverse treatments.

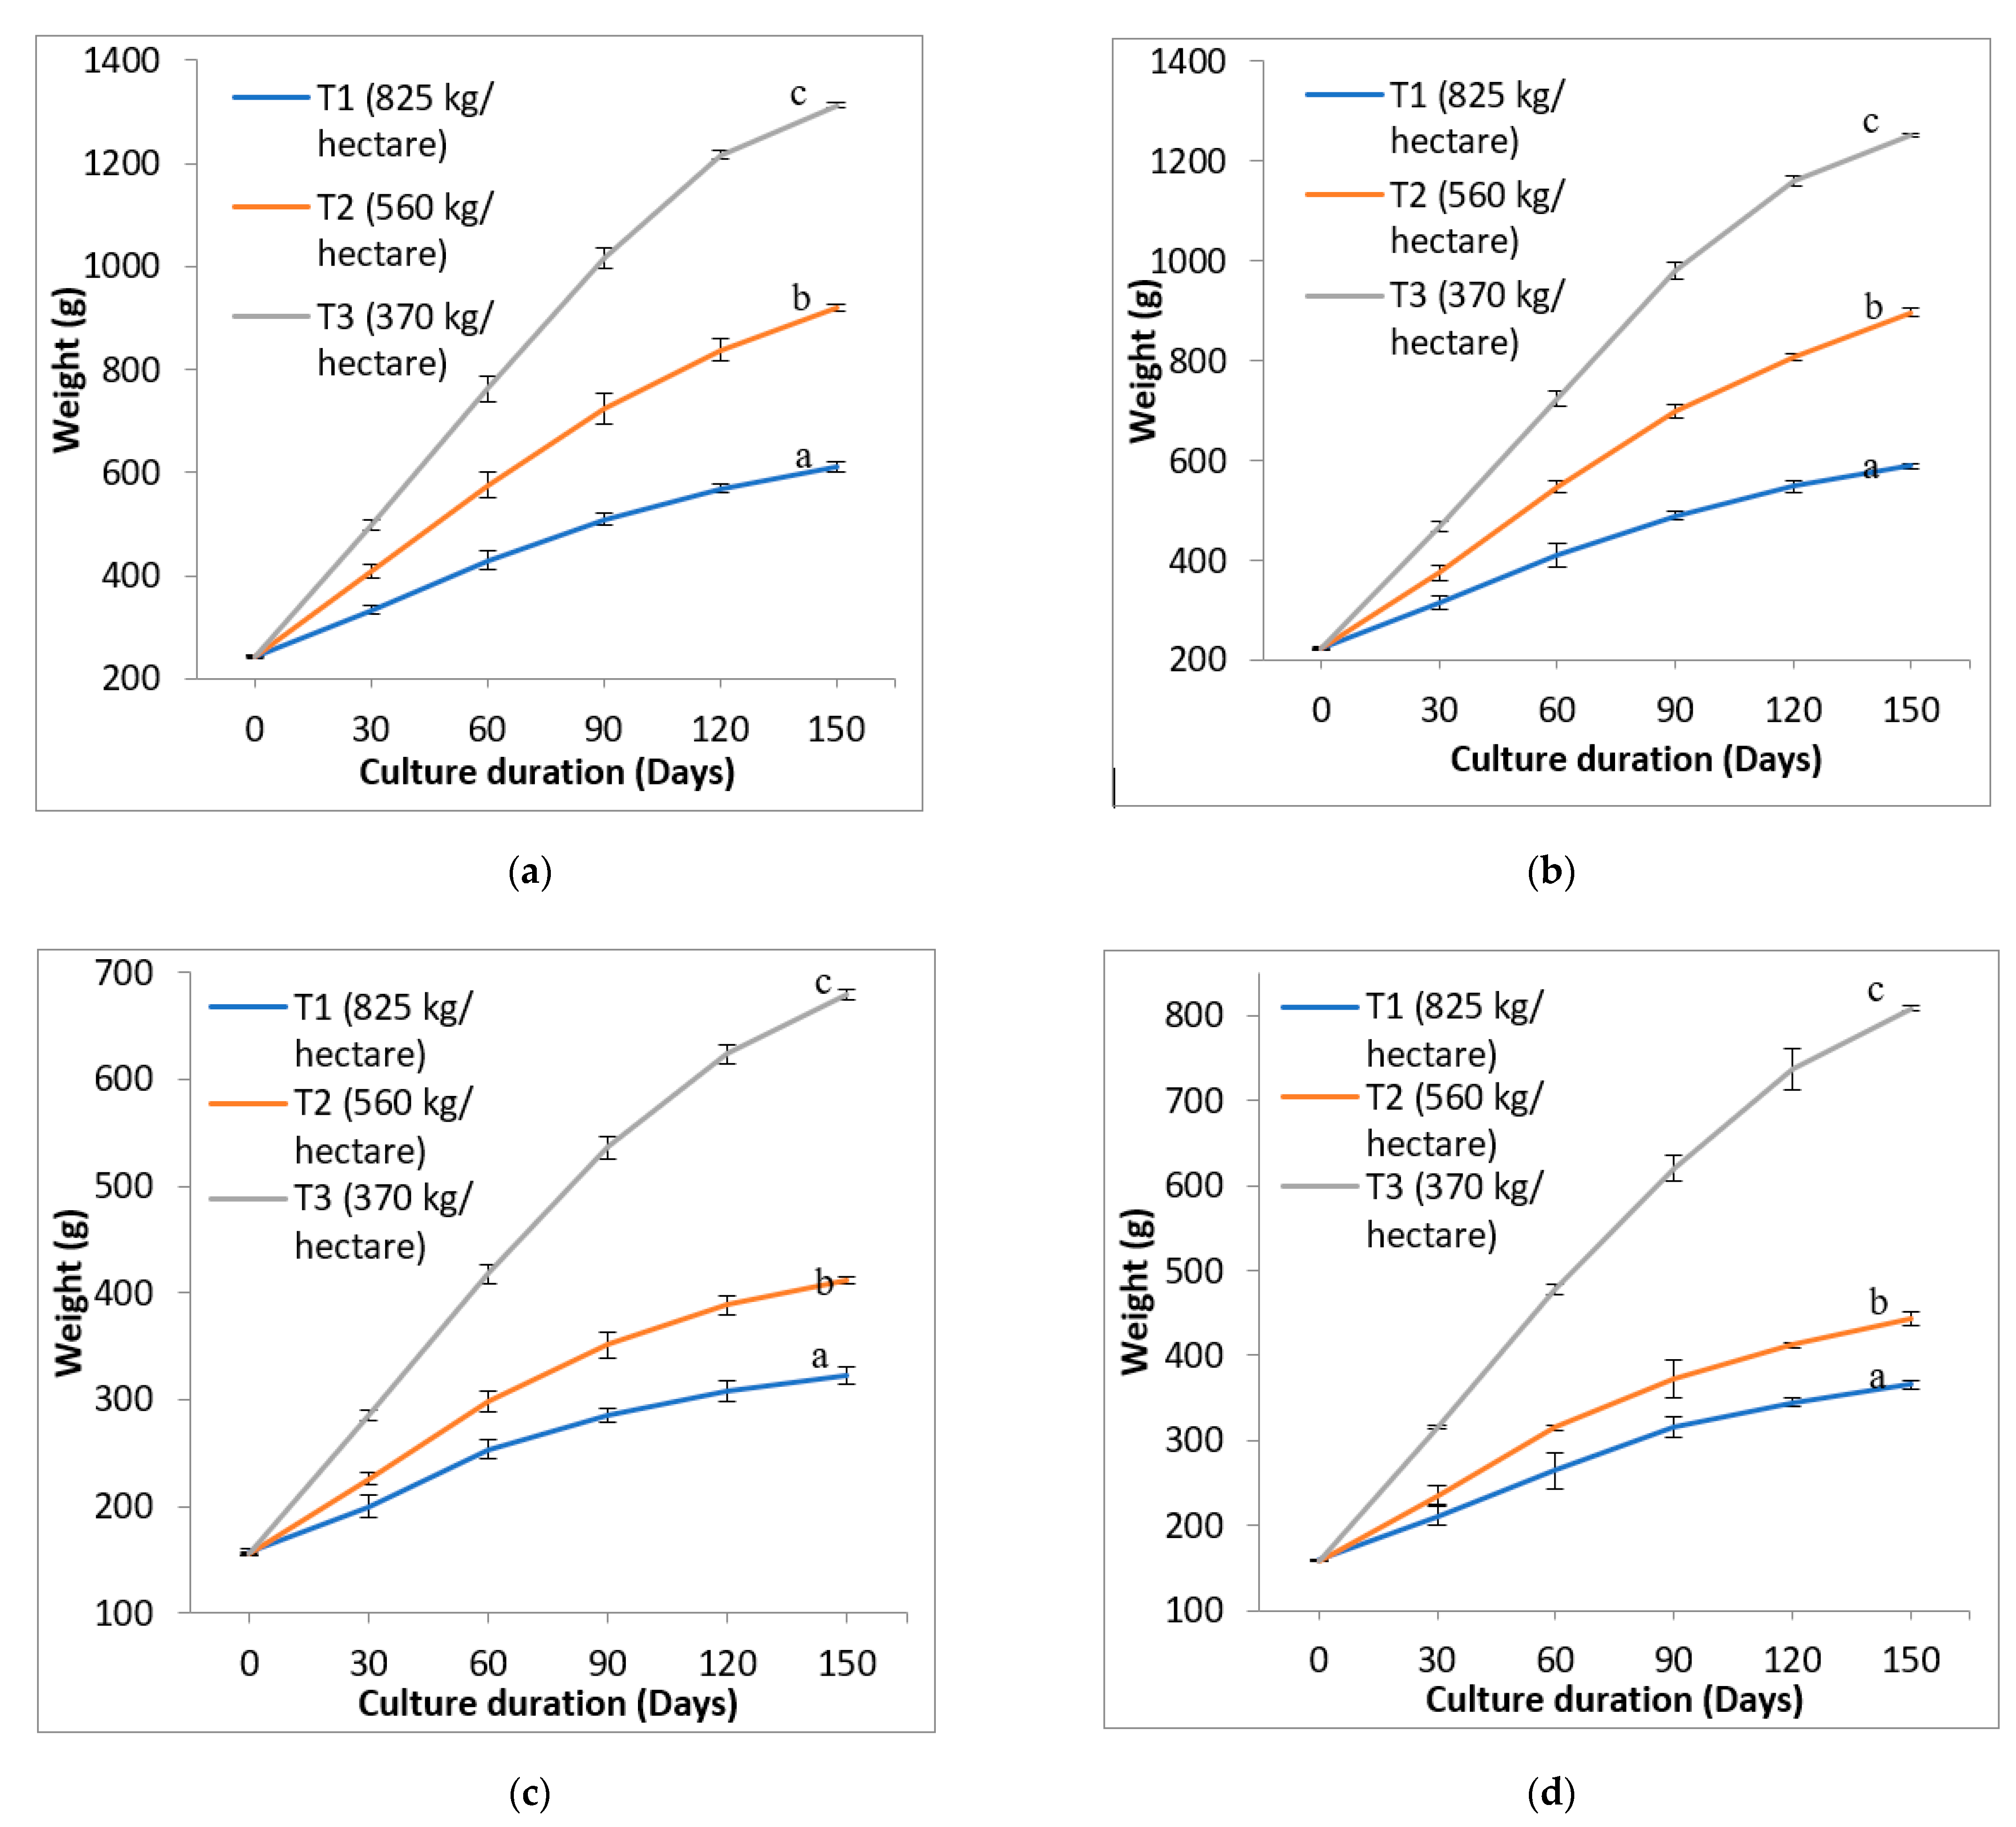
3.2. Fish Growth Assessment

Of the three treatments assessed, treatment T3 had the highest carp production than in T1 or T2 (Table 3). In case of G. catla, fish production was maximum in T3 (846.17 ± 18.32 kg ha−1 5 month−1) which varied significantly (p < 0.05) from T1 (658.16 ± 37.16 kg ha−1 5 month−1) and T2 (791.31 ± 28.56 kg ha−1 5 month−1). In case of L. rohita, fish production was higher in T3 (805.98 ± 11.16 kg ha−1 5 month−1) which differ significantly (p < 0.05) from T1 (623.1 ± 32.51 kg ha−1 5 month−1). A similar trend was noticed in the production of C. cirrhosus and L. calbasu where T3 had the highest carp production rate (Table 3).
The species-wise growth trend curve under different treatments was shown in Figure 3. The growth curve showed significant variations (p < 0.05) among the treatments at 30 days and thereafter. The maximum weight gain was found in G. catla (1313.0 ± 3.61 g) and then L. rohita (1252.0 ± 6.24 g) in T3 and minimum weight gained in C. cirrhosus (322.00 ± 7.94 g) in T1. Significant variation (p < 0.05) was found among the treatments in terms of final weight, SGR, and survival rate (Table 3). The trend of higher survival rate was found with decreasing stocking density. It was observed that the survival rates were significantly higher (p < 0.05) in treatment T3 compared to treatment T1 and T2, which contributed to higher yield. The yield under treatment T3 was 129.21% and 110.96% higher than yield under treatment T1 and T2, respectively. This study elucidated that the feed conversion ratio (FCR) followed the decreasing order of T1 (2.81 ± 0.07) > T2 (2.46 ± 0.1) > T3 (1.82 ± 0.05) and significantly differ (p < 0.05) among the treatments (Figure 4).

3.3. Plankton Enumeration

A total of twenty-one phytoplankton genera representatives of five classes namely Chlorophyceae (33%, 7 genera), Bacillariophyceae (24%, 5 genera), Euglenophyceae (19%, 4 genera), Cyanophyceae (14%, 3 genera), Dinophyceae (10%, 2 genera), and eight zooplankton genera of Copepoda (50%, 4 genera), Rotifera (37.5%, 3 genera), Bivalvia (12.5%, 1 genera) were recorded in the experimental ponds. The most frequently occurred phytoplankton genera were Navicula sp., Cocconeis sp., Nitzchia sp., Euglena spp., Phacus spp., Strombomonas spp., Tracelomonas spp., Ankyra sp., Asterionella sp., Botryococcus sp., Chlorella spp. and zooplankton were Copepod nauplii, Microcyclops spp., Thermocyclops spp., Keratella spp. in the experimental ponds. The average abundance of phytoplankton and zooplankton were 24.33 ± 9.33 × 10⁴ cells L−1 and 138.89 ± 26.98 ind. L−1 in T1 (825 kg ha−1), 46.33 ± 9.69 × 10⁴ cells L−1 and 75.56 ± 29.35 ind. L−1 in T2 (560 kg ha−1), 26.56 ± 9.47 × 10⁴ cells L−1 and 95.00 ± 73.74 ind. L−1 in T3 (370 kg ha−1) in the experimental ponds (Table 2). Significant differences were found among three different treatments in the abundance phytoplankton (F = 29.26, p = 3.44 × 10⁻⁹) and zooplankton (F = 8.09, p = 0.0009). A significant positive correlation (r = 0.78) was observed between zooplankton abundance and fish weight gain, but no correlation was found between phytoplankton abundance and fish weight gain.

3.4. Benthos Enumeration

The nine experimental ponds yielded eight taxa of five classes namely Gastropoda (41.2%, 4 genera), Clitellata (51.5%, 1 genera), Maxillopoda (4.3%, 1 genera), Malacostraca (1.1%, 1 genera), and Insecta (1.9%, 1 genera). Abundance and species variety differed from ponds to ponds at the taxonomic level. The average abundance of benthic invertebrates ranged from 8450 ± 1651.36 ind. m−2 to 11,500 ± 3454.27 ind. m−2 among the treatments (Table 2). No significant differences were found among three different treatments in the abundance of benthic infauna (p > 0.05). Among the eight taxa, Tubifex spp. were dominant contributing 51.5% of the total abundance with an average of 5955.56 ± 1278.43 ind. m−2, followed by 28.6% Melanoides spp. (2794.44 ± 1490.55 ind. m−2), 7.1% Filopaludina spp. (688.89 ± 380.23 ind. m−2), 4.5% Pila spp. (438.89 ± 392.79 ind. m−2), 4.3% Branchiura spp. (416.67 ± 576.25 ind. m−2), 1.9% Chironomus spp. (183.33 ± 257.25 ind. m−2), 1.1% Macrobrachium spp. (105.56 ± 105.56 ind. m−2), and 1% Clenchiella spp. (100 ± 76.7 ind. m−2), respectively. There was a significant positive correlation (r = 0.8) between benthic infauna abundance and fish weight gain.

3.5. Economics of the Fish Culture

The detailed economics of the present study was shown in Table 4. During the study period (150 days), total cost significantly (p < 0.05) varied from 2466.84 ± 6.26 (T3) to 3578.82 ± 15.14 (T1) USD ha−1. Similar trend was followed in terms of total income, and net income that differed from 3928.82 ± 110.54 (T1) to 5076.61 ± 8.28 (T3) USD ha−1, and 171.42 ± 95.35 (T1) to 2609.77 ± 2.02 (T3) USD ha−1, respectively. In case of CBR, the values ranged from 1.05 ± 0.03 in T1 to 2.06 ± 0.002 in T3. Total cost was found to be the lowest in treatment T3; however, net benefit, ROI, and BCR were found to be the highest in treatment T3.

4. Discussion

In this work, we attempted to develop an adaptive culture system for the rural homestead pond fish farmers using advanced carp fingerling (150–250 g) with three different stocking densities because homestead ponds are small, seasonal, and unused for fish culture. This type of study has rarely been carried out in the rural coastal area of Bangladesh to be compared with.
Although there was a little variation in the water quality (pH, salinity, DO, transparency, water temperature, NO3, PO43−, SO42−) of different treatments with diversified stocking densities, the differences were not statistically (p > 0.05) significant during the same time. The use of the same water sources, periodic water replenishment, and careful adherence to the required amount of feed could all be contributing factors. However, the water quality parameters in experimental varied due to the temporal variations [38,39]. The water temperature was recorded highest in October and lowest in December which supported the findings of Yengkokpam et al. [3]. Again, the observed water quality parameters were found to be non-toxic and acceptable for tropical fish culture [40,41,42]. Apart from this, the development and metabolic activities of phytoplankton depend on the nutrients content in water, e.g., nitrate, phosphate, sulphate, etc. Further, no eutrophication was observed in the experimental ponds during the culture period indicating that the amount of these nutrients recorded in this study represented good water quality and fertility [43,44].
The overall growth performance of carp is influenced by the environment, culture method, density of the stock, and quality of the fish seed [45]. A physical assessment was done while packing the seeds for this experiment, which were procured from a nearby hatchery. A negative association between fish growth and increasing stocking densities was found in this study. A decrease in ultimate fish production resulted from a fall in average weight gain as a result of increased density. This occurs as a result of a reduction in the amount of space that is available for individuals, which stresses fish and causes them to consume more energy. In addition, overstocking density can distress feed uptake as well as conversion efficiencies in fish [46]. These phenomena were also proven in the experiment of Chattopadhyay et al. [47]; Mane et al. [19]; Yengkokpam et al. [3] which fully supported our findings. Nevertheless, some air-breathing catfish, e.g., Clarias gariepinus, Pangasius bocourtiI, Pangasius sutchi can cope with extremely high stocking density [6,8,48]. However, the cultured species in this experiment do not have the ability to exploit air oxygen and adapt to poor water quality. Hence, these species are sensitive to overstocking density which inversely affects fish growth and feed efficiencies at higher stocking densities [19,49].
The survival rate was higher (>80%) in the majority of the trial because the experimental ponds were stocked with larger-sized fingerlings (relatively hardy and more disease resistant) and maintained acceptable water quality (replenished the water routinely). Fish mortality typically results from an increase in temperature during the midday hours (summer months), a sudden drop in oxygen levels or a rise in oxygen levels, and an algal bloom. As is well known, waste materials and uneaten food supplying nutrients can promote massive plankton blooms, which can be fatal. Once more, the death of plankton reduces oxygen levels.
The values of SGR were found to be statistically significant (p < 0.05) among the treatments which also specified that increased density inversely affects the fish growth rate. Maximum weight gain was seen in this study at lower stocking densities, which may be related to fewer fishes fighting for food and space. After 150 days of the culture phase in the current experiment, lower stocking densities showed the highest carp survival rates. A reduced survival rate, however, was recorded in T1, which clearly clarifies the impact of feed competition and stocking abundance on the survival percentage. Higher stocking density of carps indicated reduced SGR and survival, according to Mane et al. [19], Marengoni [50], and Sharma and Chakrabarti [51]. The survival percentage of this experiment was comparatively better than the study conducted by Kohli et al. [52].
Present findings specified that the value of FCR was increased with the increasing stocking density. Similar phenomena have also been reported by Chattopadhyay et al. [47]; Sharma and Chakrabarti [51]. At an over-concentrated place, fish could not uptake feed well. This was proved in the case of the average final weight of fish that was significantly lower in T2 and T1 than T3. This might be due to excessive competition between stocked fish for food, oxygen, and space which could create stress on fish [53,54,55]. In stressed fish, blood glucose as well as plasma-free fatty acid are exploited to produce energy [56,57]. In addition, glucose and lipid become mobilized from deposited reserves of lipid and glycogen of the liver [58,59,60,61]. Therefore, less energy remains accessible for fish physiological activities including metabolism for growth [62,63].
The abundance of plankton was recorded during the culture period where we found Chlorophyceae and Bacillariophyceae as dominating phytoplankton. This present finding was supported by Iqbal et al. [64]; Kohli et al. [52]; Mane et al. [19]; and Sharma and Tiwari [51]. In addition, in the case of zooplankton, Copepoda and Rotifera were found dominating the experimental ponds. Similar results were recorded in the investigation of Parvez et al. [65]; Haque et al. [66]; Shil et al. [67]. The plankton diversity and qualitative abundance of the present study specified that the study area was productive and suitable for carp production [19].
Fish can be classified as herbivores, carnivores, omnivores, and detritivores based on the type of food they consume [68]. In this experiment, fish of different feeding behavior were chosen. G. catla is a surface feeder and feed mostly on zooplankton whereas L. rohita is a column feeder and omnivorous in nature as its food preference varies in different life stages. Basically, this species feed on zooplankton, but as it grows, it frequently feeds on phytoplankton [69]. In contrast, C. cirrhosus and L. calbasu are bottom feeders. Though C. cirrhosus is detritivores and feeds on dead animals, plants, and even feces that deposited in the pond bottom, but L. calbasu is herbivore as well as detritivore in nature and feeds on plants, decaying organic matter, rotifer, diatom and mollusks [69,70]. However, lowest number of zooplankton and benthos in T2 of the present study indicated that G. catla, C. cirrhosus and L. calbasu of this treatment consume more natural feed than T1 and T3. In contrast, the highest amount of phytoplankton in T2 can be explained by the higher nutrient content in that treatment as the occurrence of phytoplankton relies on nutrients in water [15].
This study revealed that the total cost was enhanced with the increasing stocking density. This may occur due to a higher operating cost (mostly for fingerlings and feed prices). On the other hand, the higher yield was recorded from lower stocking density which may be attributed to a higher survival rate and growth at lower stocking density [23,24]. Among the three treatments, results of economics analyses showed the highest net benefit (2788.35 ± 10.26 USD ha−1) was at T3. Rearing of fish at 370 kg ha−1 stocking density at T3, yielded 129.21% and 110.96% higher production than T1 and T2, respectively. T3 was more suitable and could be the best model of culturing advanced carp fingerlings to boost up the income of homestead pond fish farmers than other treatments (T1 and T2) because of its low FCR (1.82 ± 0.05) and investment (2466.84 ± 6.26 USD ha−1) but high survival rate (>90%), total income (5076.61 ± 8.28 USD ha−1), net income (2609.77 ± 2.02 USD ha−1), ROI (105.79 ± 0.19%) and BCR. Low FCR significantly reduces the operating cost as feed is one of the major costs for fish culture. In addition, the economics of carp culture can also be determined by fish size, the bigger the fish, the greater the price is [36]. Contrastingly, the net benefit was reported higher at over stocking density of Pangasius bocourti [48] and Clarias gariepinus [6]. As the catfishes can tolerate much crowding stress with poor water quality compared to carps, these can grow in overstocking density.
According to the United Nations Food and Agricultural Organization, the demand for food would increase by 23% by 2030. By 2030, there will be 30 million tons of fish consumed worldwide. Aquaculture production must therefore double globally to keep up with demand. Aquaculture could be a good solution to this issue because it is the food animal industry sector with the fastest rate of growth and farmed finfish are more efficient at converting feed than poultry and beef. However, a significant obstacle to its effectiveness is the establishment of appropriate culture practices depending on local needs and geographic regions. In Noakhali district (the central coastal region of Bangladesh), there are thousands of homestead ponds occupying an area of 1079 ha with fish production of only 1486 MT [16] indicating very lower fish production. It also denotes the practice of extensive fish culture without maintaining proper stocking density and size. If these ponds could be utilized using advanced culture techniques, the production would have been doubled or more than that. In this experiment, we have proposed a modified culture system which can easily be adopted by the local farmers and industries to enhance the fish production, income generation and also minimize malnourishment.
Malnutrition of people remarkably hinders the economic and social developmental process in the coastal rural area of Bangladesh. Fish is an ample source of essential nutrients which can reduce the malnutrition if can be included in their diets. As major nutrients, major carps contain protein, fat, carbohydrates, minerals, and vitamins. It is contemplated as quickly digestible that contains a notable amount of vitamin A and D. The fish Catla, Rohu, Mrigal and Kalbasu have a comparatively high amount of protein and lipid (protein—15.32%, lipid—2.34% in Catla, protein—15.56%, lipid—2.56% in Rohu, protein—15.20%, and lipid—2.67% in Mrigal and protein—15.66%, lipid—2.77% in Kalbasu). These fish also contain minerals which are crucial for the formation of skin, bones, teeth, and eyes. In addition, these fishes are highly priced due to their taste and larger size. Therefore, homestead pond fish farmers can fulfill their dietary nutrient requirements and earn money culturing these fishes with advanced carp fingerlings.

5. Conclusions

Homestead ponds can retain water for only 5–6 months and if these ponds are stocked with fish fry, they do not grow as much as table or market size. To solve this problem, in this study we established that larger table fish can be produced in coastal homestead ponds by culturing advanced carp fingerling with suitable stocking density. Considering the SGR, survival rate, total production, and net benefit of this experiment, it can be concluded that advanced fingerlings weighing 150−250 g with stocking density of 370 kg ha−1 could be the best solution for carp polyculture in homestead ponds of coastal areas of Bangladesh. By adopting this culture system, coastal rural farmers can utilize their unused seasonal ponds and partially fulfill their protein requirements and can also earn some money.

Author Contributions

Conceptualization, supervision, project administration, resources, M.B.H.; methodology, investigation, data collection, formal analysis, writing original draft, A.-A.U.N.; methodology, investigation, formal analysis, writing original draft, M.M.S.; data collection, writing original draft, P.B.; reviewing and editing: M.B.H., M.F.A., M.M.I. and T.A., funding: M.B.H., M.M.I., M.F.A. and T.A. All authors have read and agreed to the published version of the manuscript.

Funding

This study was supported by Food Based Project, PIU, NATP-2, BARC (Grant ID-011), Bangladesh. This study was financially supported by University Brunei Darussalam under the Faculty/Institute/Center Research Grant (No. UBD/RSCH/1.4/FICBF(b)/2020/029) and (No. UBD/RSCH/1.4/FICBF(b)/2021/037). It was also funded by the Researchers Supporting Project Number (RSP2022R436), King Saud University, Riyadh, Saudi Arabia.

Institutional Review Board Statement

Not applicable.

Data Availability Statement

All the relevant data are included in the article.

Acknowledgments

The authors extends their sincere gratitude to the Researchers Supporting Project number (RSP2022R436), King Saud University, Riyadh, Saudi Arabia.

Conflicts of Interest

The authors declare no conflict of interest.

References

  1. Hasenbein, M.; Fangue, N.A.; Geist, J.P.; Komoroske, L.M.; Connon, R.E. Physiological stress biomarkers reveal stocking density effects in late larval Delta Smelt (Hypomesus transpacificus). Aquaculture 2016, 450, 108–115. [Google Scholar] [CrossRef] [Green Version]
  2. Karnatak, G.; Das, B.K.; Mishal, P.; Tayung, T.; Kumari, S.; Sarkar, U.K.; Das, A.K.; Ali, Y. Impact of stocking density on growth, feed utilization and survival of cage reared minor carp, Labeo bata (Hamilton, 1822) in Maithon reservoir, India. Aquaculture 2021, 532, 736078. [Google Scholar] [CrossRef]
  3. Yengkokpam, S.; Das, B.K.; Debnath, D.; Das, P.; Yadav, A.K.; Sharma, N.; Borah, S.; Singh, N.S.; Sarma, K.K.; Ray, B.C.; et al. Effect of stocking density on growth and yield of Labeo bata fingerlings reared in cages. Aquac. Rep. 2020, 18, 100506. [Google Scholar] [CrossRef]
  4. Chakraborty, B.K.; Mirza, M.J.A. Effect of stocking density on survival and growth of endangered bata, Labeo bata (Hamilton–Buchanan) in nursery ponds. Aquaculture 2007, 265, 156–162. [Google Scholar] [CrossRef]
  5. El-Sayed, A.F.M. Effects of stocking density and feeding levels on growth and feed efficiency of Nile tilapia (Oreochromis niloticus L.) fry. Aquac. Res. 2002, 33, 621–626. [Google Scholar] [CrossRef]
  6. Hengsawat, K.; Ward, F.J.; Jaruratjamorn, P. The effect of stocking density on yield, growth and mortality of African catfish (Clarias gariepinus Burchell 1822) cultured in cages. Aquaculture 1997, 152, 67–76. [Google Scholar] [CrossRef]
  7. Khattab, Y.; Abdel-Tawwab, M.; Ahmad, M.H. Effect of protein level and stocking density on growth performance, survival rate, feed utilization and body composition of Nile tilapia fry (Oreochromis niloticus L.). Egypt. J. Aquat. Biol. Fish. 2001, 5, 195–212. [Google Scholar] [CrossRef] [Green Version]
  8. Rahman, M.M.; Islam, M.S.; Halder, G.C.; Tanaka, M. Cage culture of sutchi catfish, Pangasius sutchi (Fowler 1937): Effects of stocking density on growth, survival, yield and farm profitability. Aquac. Res. 2006, 37, 33–39. [Google Scholar] [CrossRef]
  9. Belton, B.; Azad, A. The characteristics and status of pond aquaculture in Bangladesh. Aquaculture 2012, 358, 196–204. [Google Scholar] [CrossRef]
  10. Little, D.C.; Karim, M.; Turongruang, D.; Morales, E.J.; Murray, F.J.; Barman, B.K.; Haque, M.M.; Kundu, N.; Belton, B.; Faruque, G.; et al. Livelihood impacts of ponds in Asia-opportunities and constraints. In Fish Ponds in Farming Systems; van der Zijpp, A.J., Verreth, J.A.J., van Mensvoort, M.E.F., Bosma, R.H., Beveridge, M.C.M., Eds.; Wageningen Academic Publishers: Wageningen, The Netherlands, 2007; pp. 177–202. [Google Scholar]
  11. Castine, S.A.; Bogard, J.R.; Barman, B.K.; Karim, M.; Hossain, M.M.; Kunda, M.; Haque, A.B.M.M.; Phillips, M.J.; Thilsted, S.H. Homestead pond polyculture can improve access to nutritious small fish. Food Secur. 2017, 9, 785–801. [Google Scholar] [CrossRef]
  12. Rahman, M.M.; Das, M.S.; Samad, A.; Tanu, I.A.; Shiadul, M. Growth, production and economics of carp polyculture in fertilizer and feed-based ponds. Int. J. Nat. Soc. Sci. 2017, 4, 01–09. [Google Scholar]
  13. Khan, M.R.I.; Parvez, M.T.; Talukder, M.G.S.; Hossain, M.A.; Karim, M.S. Production and economics of carp polyculture in ponds stocked with wild and hatchery produced seeds. J. Fish. 2018, 6, 541–548. [Google Scholar] [CrossRef]
  14. Zacharias, I.; Zamparas, M. Mediterranean temporary ponds. A disappearing ecosystem. Biodivers. Conserv. 2010, 19, 3827–3834. [Google Scholar] [CrossRef]
  15. Sarker, M.M.; Hossain, M.B.; Islam, M.M.; Kamal, A.H.M.; Idris, M.H. Unravelling the diversity and assemblage of phytoplankton in homestead ponds of central coastal belt, Bangladesh. Aquac. Res. 2020, 52, 167–184. [Google Scholar] [CrossRef]
  16. FRSS (Fisheries Resources Survey System). Yearbook of Fisheries Statistics of Bangladesh, 2018–19; Department of Fisheries, Bangladesh, Ministry of Fisheries and Livestock: Dhaka, Bangladesh, 2019; Volume 36, 135p. [Google Scholar]
  17. Hossain, I.; Hossain, M.B. Community structure of macrobenthos in homestead ponds of Noakhali coast, Bangladesh. Acta Ecol. Sin. 2021, 41, 611–619. [Google Scholar] [CrossRef]
  18. Bhatnagar, A.; Devi, P. Water quality guidelines for the management of pond fish culture. Int. J. Environ. Sci. 2013, 3, 1980. [Google Scholar] [CrossRef]
  19. Mane, A.M.; Dube, K.; Varghese, T.; Chavan, B.R.; Kamble, M.T. Effects of stocking density on growth performance, survival and production of Catla catla and Labeo rohita during nursery rearing in cages. Proc. Natl. Acad. Sci. India Sect. B Biol. Sci. 2019, 89, 275–281. [Google Scholar] [CrossRef]
  20. Alam, M.J.; Kohinoor, A.H.M.; Islam, M.S.; Mazid, M.A. Polyculture of carps using over-wintered fingerlings under different stocking densities. Bangladesh J. Fish. Res. 2002, 6, 117–124. [Google Scholar]
  21. Alim, M.A.; Wahab, M.A.; Milstein, A. Effects of increasing the stocking density of large carp by 20% on ‘cash’ carp-small fish polyculture of Bangladesh. Aquac. Res. 2005, 36, 317–325. [Google Scholar] [CrossRef]
  22. Basak, S.S.; Rahman, M.M.; Bashar, M.A.; Khan, M.M.H.; Mahmud, M.Y. Production and growth performance under carps polyculture with different stocking densities in hilly creeks of Kaptai Lake, Rangamati. MOJ Ecol. Environ. Sci. 2017, 2, 00029. [Google Scholar]
  23. Rahman, M.M.; Jo, Q.; Gong, Y.G.; Miller, S.A.; Hossain, M.Y. A comparative study of common carp (Cyprinus carpio L.) and calbasu (Labeo calbasu Hamilton) on bottom soil resuspension, water quality, nutrient accumulations, food intake and growth of fish in simulated rohu (Labeo rohita Hamilton) ponds. Aquaculture 2008, 285, 78–83. [Google Scholar] [CrossRef]
  24. Rahman, M.M.; Kadowaki, S.; Balcombe, S.R.; Wahab, M.A. Common carp (Cyprinus carpio L.) alters its feeding niche in response to changing food resources: Direct observations in simulated ponds. Ecol. Res. 2010, 25, 303–309. [Google Scholar] [CrossRef] [Green Version]
  25. APHA. Standard Methods for the Examination of Water and Wastewater; American Public Health Association (APHA): Washington, DC, USA, 2005; p. 21. [Google Scholar]
  26. Ali, S.; Chakrabarty, T. Bangladesher Mitha Panir Amerudandi Prani (A Book of Freshwater Invertebrates of Bangladesh); Bangla Academy: Dhaka, Bangladesh, 1992; p. 207. [Google Scholar]
  27. Anderson, D.T. Invertebrate Zoology; Oxford University Press: Oxford, UK, 2002. [Google Scholar]
  28. Battish, S.K. Freshwater Zooplankton of India; Oxford & IBH Publishing Company: New Delhi, India, 1992. [Google Scholar]
  29. Belcher, H.; Swale, E. A Beginner’s Guide to Freshwater Algae; Her Majesty’s Stationary Office: London, UK, 1976. [Google Scholar]
  30. Bellinger, E.G.; Sigee, D.C. Freshwater Algae: Identification, Enumeration and Use as Bioindicators; John Wiley & Sons: Hoboken, NJ, USA, 2015. [Google Scholar]
  31. Bhouyain, A.M.; Asmat, G.S. Freshwater Zooplankton from Bangladesh; Nilufer Begum: Labiba, Laila, 1992. [Google Scholar]
  32. Fauchald, K. The Polychaetes Worms. Definition and Key to the Order, Family and Genera. In Natural History Museum of Los Angeles City Science Series; Natural History Museum of Los Angeles: Los Angeles, CA, USA, 1977; Volume 28, pp. 1–88. [Google Scholar]
  33. Gosner, K.L. Guide to Identification of Marine and Estuarine Invertebrates; John Wiley & Sons, Inc.: New York, NY, USA, 1971. [Google Scholar]
  34. Rao, N.V.S.; Rao, K.V.S.; Maitra, S. Marine molluscs. State Fauna Ser. 1991, 1, 1–175. [Google Scholar]
  35. Witty, L.M. Practical Guide to Identifying Freshwater Crustacean Zooplankton; Cooperative Freshwater Ecology Unit: Sudbury, ONT, Canada, 2004. [Google Scholar]
  36. Shamsuddin, M.; Hossain, M.B.; Rahman, M.; Kawla, M.S.; Tazim, M.F.; Albeshr, M.F.; Arai, T. Effects of stocking larger-sized fish on water quality, growth performance, and the economic yield of nile tilapia (Oreochromis niloticus L.) in floating cages. Aquaculture 2022, 12, 942. [Google Scholar] [CrossRef]
  37. Hammer, O. PAST: Paleontological statistics software package for education and data analysis. Palaeontol. Electron. 2001, 4, 9. [Google Scholar]
  38. Nybakken, J.W. Marine Biology: An Ecological Approach. In Translation of Marine Biology: An Ecological Approach; Gramedia: Jakarta, Indonesia, 1992; p. 443. [Google Scholar]
  39. Fachrul, M.F.; Haeruman, H.; Sitepu, L.C. Phytoplankton community as bio-indicator of Jakarta Bay water quality. In National Seminar on Mathematics and Natural Sciences; University of Indonesia: Jakarta, Indonesia, 2005. [Google Scholar]
  40. Das, P.; Borah, S.; Yadav, A.K.; Bhattacharjya, B.K.; Das, B.K. Open water fisheries of Assam and strategies for its development. Fish. Chimes 2018, 38, 17–28. [Google Scholar]
  41. Yengkokpam, S.; Bhattacharjya, B.K.; Debnath, D.; Das, P.; Yadav, A.K.; Sarma, K.K.; Sharma, N.; Borah, S.; Kakati, A.; Singh, N.S. Effect of stocking practices and riverine connectivity on fish productivity of beels of Assam. CIFRI NEWS 2017, 22, 8. Available online: www.cifri.res.in/newsletter1.html (accessed on 13 July 2020).
  42. Alabaster, J.S.; Lloyd, R. Water Quality Criteria for Freshwater Fish, 2nd ed.; Butterworth’s: London, UK, 1982. [Google Scholar]
  43. Boyd, C.E.; Tucker, C.S. Water Quality and Pond Soil Analyses for Aquaculture; Alabama Agricultural Experiment Station: City, AL, USA, 1998. [Google Scholar]
  44. Dulic, Z.; Subakov-Simic, G.; Ciric, M.; Relic, R.; Lakic, N.; Stankovic, M.; Markovic, Z. Water quality in semi-intensive carp production system using three different feeds. Bulg. J. Agric. Sci. 2010, 16, 266–274. [Google Scholar]
  45. Rai, A.K.; Bista, J.D. Effect of different feed ingredients on the growth of caged common carp. Nepal Agric. Res. J. 2001, 4, 60–62. [Google Scholar] [CrossRef]
  46. Ellis, T.; North, B.; Scaott, A.P.; Bromage, N.R.; Porter, M.; Gadd, D. The relationship between stocking density and welfare in farmed rainbow trout. J. Fish. Biol. 2002, 61, 493–531. [Google Scholar] [CrossRef]
  47. Chattopadhyay, D.N.; Mohapatra, B.C.; Adhikari, S.; Pani, K.C.; Jena, J.K.; Eknath, A.E. Effects of stocking density of Labeo rohita on survival, growth and production in cages. Aquac. Int. 2013, 21, 19–29. [Google Scholar] [CrossRef]
  48. Jiwyam, W. The effect of stocking density on yield, growth and survival of Asian river catfish (Pangasius bocourti Sauvage, 1880) cultured in cages. Aquac. Int. 2011, 19, 987–997. [Google Scholar] [CrossRef]
  49. Biswas, P.; Kohli, M.P.S.; Chadha, N.K.; Bhattacharjya, B.K.; Debnath, D.; Yengkokpam, S.; Sarma, K.K.; Gogoi, P.; Kakati, A.; Sharma, A.P. Optimizing stocking density of Labeo rohita fry in cage aquaculture system as a tool for floodplain wetland fisheries management. Proc. Natl. Acad. Sci. India Sect. B. 2015, 85, 181–190. [Google Scholar] [CrossRef]
  50. Marengoni, N.G. Production of the Nile tilapia Oreochromis niloticus (Chitralada strain) reared in cages with different stocking densities. Arch. Zootec. 2006, 55, 127–138. [Google Scholar]
  51. Sharma, J.; Chakrabarti, R. Role of stocking density on growth and survival of Catla, Catla catla, and Rohu, Labeo rohita, larvae and water quality in a recirculating system. J. Appl. Aquac. 2003, 14, 171–178. [Google Scholar] [CrossRef]
  52. Kohli, M.P.S.; Ayyappan, S.; Langer, R.K.; Dube, K.; Prakash, C.; Reddy, A.K.; Deshmukhe, G. Cage culture of carps, Labeo rohita and Cyprinus carpio at Powai lake, Mumbai, Maharashtra. Appl. Fish. Aquac. 2002, II, 1–4. [Google Scholar]
  53. Barton, B.A.; Iwama, G.K. Physiological changes in fish from stress in aquaculture with emphasis on the response and effects of corticosteroids. Annu. Rev. Fish Dis. 1991, 1, 3–26. [Google Scholar] [CrossRef]
  54. Vijayan, M.M.; Leatherland, J.F. Effect of stocking density on the growth and stress-response in brook charr, Salvelinus fontinalis. Aquaculture 1988, 75, 159–170. [Google Scholar] [CrossRef]
  55. Wedemeyer, G.A. Effects of rearing conditions on the health and physiological quality of fish in intensive culture. In Fish Stress and Health in Aquaculture; Iwama, G.K., Pickering, A.D., Sumpter, J.P., Schreck, C.B., Eds.; Cambridge University Press: Cambridge, UK, 1997; pp. 35–71. [Google Scholar]
  56. Leatherland, J.F.; Cho, C.Y. Effect of rearing density on thyroid and interrenal gland activity and plasma and hepatic metabolite levels in rainbow trout, Salmo gairdneri Richardson. J. Fish. Biol. 1985, 27, 583–592. [Google Scholar] [CrossRef]
  57. Wedemeyer, G.A.; Barton, B.A.; McLeay, D.J. Stress and acclimation. In Methods for Fish Biology; Schreck, C.B., Moyle, P.B., Eds.; American Fish. Soc.: Bethesda, MD, USA, 1990; pp. 451–489. [Google Scholar]
  58. Janssens, P.A.; Waterman, J. Hormonal regulation of gluconeogenesis and glycogenolisis in carp (Cyprinius carpio) liver pieces cultures in vitro. Comp. Biochem. Physiol. 1988, 91, 451–455. [Google Scholar] [CrossRef]
  59. Morales, A.E.; Garcia-Rejon, L.; Higuera, M.D.L. Influence of handling and/or anesthesia on stress response in rainbow trout: Effects on liver primary metabolism. Comp. Biochem. Physiol. 1990, 95, 87–93. [Google Scholar] [CrossRef]
  60. Vijayan, M.M.; Ballantyne, J.S.; Leatherland, J.F. High stocking density alters the energy metabolism of brook charr, Salvelinus fontinalis. Aquaculture 1990, 88, 371–381. [Google Scholar] [CrossRef]
  61. Pankhurst, N.W.; Van Der Kraak, G. Effects of stress on reproduction and growth of fish. In Fish Stress and Health in Aquaculture; Iwama, G.K., Pickering, A.D., Sumpter, J.P., Schreck, C.B., Eds.; Cambridge University Press: Cambridge, UK, 1997; pp. 73–93. [Google Scholar]
  62. Pickering, A.D. Rainbow trout husbandry: Management of the stress response. Aquaculture 1992, 100, 125–139. [Google Scholar] [CrossRef]
  63. Schreck, C.B. Stress and rearing of salmonids. Aquaculture 1982, 28, 241–249. [Google Scholar] [CrossRef]
  64. Iqbal, M.M.; Billah, M.M.; Haider, M.N.; Islam, M.S.; Payel, H.R.; Bhuiyan, M.K.A.; Dawood, M.A.O. Seasonal distribution of phytoplankton community in a subtropical estuary of the south-eastern coast of Bangladesh. Zool. Ecol. 2017, 27, 304–310. [Google Scholar] [CrossRef]
  65. Parvez, M.A.; Uddin, M.M.; Islam, M.K.; Kibria, M.M. Physicochemical and Biological Monitoring of Water Quality of Halda River, Bangladesh. Int. J. Environ. Sci. Educ. 2019, 14, 169–181. [Google Scholar]
  66. Haque, M.A.; Nabi, M.R.U.; Billah, M.M.; Al Asif, A.; Rezowan, M.; Mondal, M.A.I.; Siddiqui, A.A.M.; Mahmud, S.S.; Khan, M.R. Effect of water parameters on temporal distribution and abundance of zooplankton at Kaptai lake reservoir, Rangamati, Bangladesh. Asian J. Med. Biol. Res. 2018, 4, 389–399. [Google Scholar] [CrossRef] [Green Version]
  67. Shil, J.; Ghosh, A.K.; Rahaman, S.B. Abundance and diversity of zooplankton in semi-intensive prawn (Macrobrachium rosenbergii) farm. SpringerPlus 2013, 2, 1–8. [Google Scholar] [CrossRef] [PubMed] [Green Version]
  68. Moyle, P.B.; Cech, J.J. Fishes: An Introduction to Ichthyology, 4th ed.; Prentice Hall: Hoboken, NJ, USA, 2000; p. 612. [Google Scholar]
  69. Mandal, S.; Ghosh, K. Accumulation of tannin in different tissues of Indian major carps and exotic carps. Aquac. Res. 2010, 41, 945–948. [Google Scholar] [CrossRef]
  70. Imran, S.; Nagar, S.; Jha, D.N. A review: Food and feeding habit of Labeo calbasu (Hamilton, 1822) from different habitat. J. Kalash Sci. 2014, 2, 71–73. [Google Scholar]
Figure 1. Study site with sampling design.
Fishes 07 00289 g001
Figure 2. Simplified schematic diagram of a ponds’ nutrient transfer system in Indian major carp culture.
Fishes 07 00289 g002
Figure 3. Growth trend of (a) G. catla, (b) L. rohita, (c) C. cirrhosis, (d) L. calbasu in different treatments. Different superscripts denoted significant difference at 95% confidence interval (p < 0.05).
Fishes 07 00289 g003
Figure 4. Feed conversion ratio (FCR) of (a) G. catla, (b) L. rohita, (c) C. cirrhosis, (d) L. calbasu in different treatments. Different superscripts denote significant statistical differences at 95% confidence level (p < 0.05).
Fishes 07 00289 g004
Table 1. Nutritional composition of used feed in this experiment.
Test ParameterMain Source% of Ingredients
Crude protein (minimum%)Fish meal, rice bran, wheat bran24.25
Crude fat (minimum%)Fish meal, mustard oil cake4.00
Crude fiber (minimum%)Rice bran, wheat bran11.00
Crude ash (minimum%)Fish meal14.80
Moisture (maximum%)Water11.00
Table 2. Summary of water quality parameters, plankton and benthos abundance in different treatments (mean ± SD; range in parentheses). Figures bearing common letter (a, b) in a row as superscript do not differ significantly (p < 0.05).
ParameterUnitTreatmentsFp -Value
T1T2T3
pH-8.05 ± 0.09 a
(7.87–8.17)
8.09 ± 0.13 a
(7.75–8.28)
8.02 ± 0.15 a
(7.5–8.21)
2.4860.089
Salinitypsu0.14 ± 0.03 a
(0.09–0.2)
0.15 ± 0.04 a
(0.07–0.21)
0.14 ± 0.02 a
(0.10–0.18)
2.540.08
DOmg L−15.08 ± 0.26 a
(4.65–5.61)
5.1 ± 0.23 a
(4.7–5.56)
5.2 ± 0.25 a
(4.68–5.59)
2.0310.1386
Transparencycm36.2 ± 1.51 a
(32–38.5)
35.74 ± 1.36 a
(32–37.8)
36.54 ± 1.76 a
(32–38.5)
2.1940.117
Water temperature°C26.35 ± 0.63 a
(25.3–27.3)
26.67 ± 0.49 a
(25.58–27.23)
26.53 ± 0.67 a
(25.38–27.5)
2.3340.1023
Nitratemg L−15.75 ± 3.39 a
(1.23–8.90)
5.93 ± 3.54 a
(1.25–8.8)
5.51 ± 3.56 a
(0.71–7.95)
0.030.97
Phosphatemg L−10.3 ± 0.03 a
(0.27–0.36)
0.35 ± 0.07 a
(0.29–0.45)
0.33 ± 0.03 a
(0.29–0.35)
2.160.14
Sulphatemg L−10.14 ± 0.02 a
(0.12–0.16)
0.27 ± 0.41 a
(0.12–1.35)
0.19 ± 0.1 a
(0.13–0.42)
0.720.5
Phytoplankton ×104 cells L−124.06 ± 9.61 a
(11.67–39)
46.33 ± 9.69 b
(29.67–57)
26.56 ± 8.72 a, b
(12–34.67)
10.220.002
Zooplanktonind. L−1138.89 ± 20.52 a
(110–173.33)
75.56 ± 23.54 b
(50–110)
94.99 ± 77.72 a, b
(23.33–196.67)
2.700.1
Benthosind. m−29316 ± 1570.24 a
(7200–11,500)
8450 ± 1651.36 a
(6900–11,300)
11,500 ± 3454.27 a
(7100–15,700)
2.600.11
Table 3. Growth and production of carp polyculture under different treatments. Figures bearing common letter (a, b, c) in a column as superscript do not differ significantly (p <0.05).
SpeciesTreatmentNo. of
Individual/Hectare
Average Initial Weight (g)Average
Final Weight (g)
SGR (% day−1)Fish Production
Kg/Hectare/ 5 Month
Survival Rate (%)
G. catlaT11300242.00 ± 2.65 a611.33 ± 9.45 a0.62 ± 0.01 a658.16 ± 37.16 a82.78 ± 3.52 a
T21000243.67 ± 1.53 a920.00 ± 7.00 b0.89 ± 0.01 b791.31 ± 28.56 b86.02 ± 3.49 a
T3700243.33 ± 1.53 a1313.0 ± 3.61 c1.12 ± 0.01 c846.17 ± 18.32 c92.07 ± 1.15 b
F-0.67355222437.147.729
P-0.579<0.001<0.001<0.0010.022
L. rohitaT11300222.67 ± 2.08 a589.33 ± 6.03 a0.65 ± 0.01 a623.1 ± 32.51 a81.31 ± 3.61 a
T21000224.67 ± 3.51 a896.33 ± 8.08 b0.92 ± 0.01 b763.22 ± 51.45 b85.19 ± 6.42 a, b
T3700223.33 ± 1.53 a1252.0 ± 6.24 c1.15 ± 0.01 c805.98 ± 11.16 b91.94 ± 1.21 b
F-0.49129174154921.514.677
P-0.635<0.001<0.0010.0020.06
C. cirrhosusT1650156.67 ± 2.89 a322.00 ± 7.94 a0.48 ± 0.02 a167.93 ± 2.8 a80.25 ± 0.94 a
T2500155.33 ± 0.58 a411.89 ± 3.75 b0.65 ± 0.004 b170.5 ± 4.34 a82.8 ± 2.33 a
T3350155.67 ± 1.15 a675.33 ± 4.51 c0.98 ± 0.002 c216.63 ± 1.63 b91.13 ± 0.78 b
F-0.43330871889230.742.16
p-0.667<0.001<0.001<0.001<0.001
L.calbasuT1650159.00 ± 1.73 a365.67 ± 5.03 a0.56 ± 0.01 a200.91 ± 2.72 a84.53 ± 0.87 a
T2500158.67 ± 1.53 a443.42 ± 7.42 b0.69 ± 0.02 b196.55 ± 18.78 a88.58 ± 7.23 a, b
T3350158.50 ± 1.32 a808.67 ± 3.51 c1.09 ± 0.01 c263.4 ± 2.63 b93.07 ± 1.25 b
F-0.082355433199034.293.003
p-0.922<0.001<0.001<0.0010.125
Table 4. Economics of carp polyculture at different treatments (USD ha−1 5 month−1). Figures bearing common letter (a, b, c) in a row as superscript do not differ significantly (p < 0.05).
ParametersTreatmentFp Value
T1T2T3
Variable cost
Lime 71.43 a71.43 a71.43 a
Fertilizer47.62 a47.62 a47.62 a
Fish seed1505.41 ± 2.79 a1411.11 ± 4.9 b977.15 ± 2.43 c18,500<0.001
Feed1954.37 ± 12.4 a1597.22 ± 9.09 b1192.07 ± 3.83 c5221<0.001
Total variable cost3578.83 ± 15.19 a3127.38 ± 13.99 b2288.27 ± 6.26 c8290<0.001
Fixed cost
Land lease178.57178.57178.57
Total cost3757.4 ± 15.19 a3305.95 ± 13.99 b2466.84 ± 6.26 c8290<0.001
Return
Selling price (USD/kg)3.03 ± 0.01 a3.24 ± 0.01 b3.34 ± 0.02 c617.5<0.001
Total income3928.82 ± 110.54 a4575.2 ± 156.41 b5076.61 ± 8.28 c81.08<0.001
Net income171.42 ± 95.35 a1269.25 ± 142.42 b2609.77 ± 2.02 c456.8<0.001
Return on investment (%)4.56 ± 2.52 a38.38 ± 4.15 b105.79 ± 0.19 c1014<0.001
Benefit—Cost ratio1.05 ± 0.03 a1.38 ± 0.04 b2.06 ± 0.002 c1014<0.001
Publisher’s Note: MDPI stays neutral with regard to jurisdictional claims in published maps and institutional affiliations.

