Effects of Mean Inflow Velocity and Droplet Diameter on the Propagation of Turbulent V-Shaped Flames in Droplet-Laden Mixtures


School of Engineering, Newcastle University, Newcastle-Upon-Tyne NE1 7RU, UK
*
Author to whom correspondence should be addressed.
Fluids 2021, 6(1), 1; https://0-doi-org.brum.beds.ac.uk/10.3390/fluids6010001
Submission received: 23 November 2020
/
Revised: 15 December 2020
/
Accepted: 17 December 2020
/
Published: 22 December 2020
(This article belongs to the Special Issue Modelling of Reactive and Non-reactive Multiphase Flows)
Abstract
:Three-dimensional carrier phase Direct Numerical Simulations of V-shaped n-heptane spray flames have been performed for different initially mono-sized droplet diameters to investigate the influence of mean flow velocity on the burning rate and flame structure at different axial locations from the flame holder. The fuel is supplied as liquid droplets through the inlet and an overall (i.e., liquid + gaseous) equivalence ratio of unity is retained in the unburned gas. Additionally, turbulent premixed stoichiometric V-shaped n-heptane flames under the same turbulent flow conditions have been simulated to distinguish the differences in combustion behaviour of the pure gaseous phase premixed combustion in comparison to the corresponding behaviour in the presence of liquid n-heptane droplets. It has been found that reacting gaseous mixture burns predominantly under fuel-lean mode and the availability of having fuel-lean mixture increases with increasing mean flow velocity. The extent of flame wrinkling for droplet cases has been found to be greater than the corresponding gaseous premixed flames due to flame-droplet-interaction, which is manifested by dimples on the flame surface, and this trend strengthens with increasing droplet diameter. As the residence time of the droplets within the flame decreases with increasing mean inflow velocity, the droplets can survive for larger axial distances before the completion of their evaporation for the cases with higher mean inflow velocity and this leads to greater extents of flame-droplet interaction and droplet-induced flame wrinkling. Mean inflow velocity, droplet diameter and the axial distance affect the flame brush thickness. The flame brush thickens with increasing droplet diameter for the cases with higher mean inflow velocity due to the predominance of fuel-lean gaseous mixture within the flame. However, an opposite behaviour has been observed for the cases with lower mean inflow velocity where the smaller extent of flame wrinkling due to smaller values of integral length scale to flame thickness ratio arising from higher likelihood of fuel-lean combustion for larger droplets dominates over the thickening of the flame front. It has been found that the major part of the heat release arises due to premixed mode of combustion for all cases but the contribution of non-premixed mode of combustion to the total heat release has been found to increase with increasing mean inflow velocity and droplet diameter. The increase in the mean inflow velocity yields an increase in the mean values of consumption and density-weighted displacement speed for the droplet cases but leads to a decrease in turbulent burning velocity. By contrast, an increase in droplet diameter gives rise to decreases in turbulent burning velocity, and the mean values of consumption and density-weighted displacement speeds. Detailed physical explanations have been provided to explain the observed mean inflow velocity and droplet diameter dependences of the flame propagation behaviour.
1. Introduction
V-shaped flames are often used as a laboratory scale experimental configuration for the analysis of turbulent flames [1,2,3,4,5,6,7,8,9,10,11]. The advancements of computational resources have made it possible to carry out Direct Numerical Simulations (DNS) of V-shaped flames [12,13,14,15,16,17,18,19,20] due to its geometrical simplicity. The V-shaped flame offers a convenient configuration for the evaluation of turbulent flame speed, flame brush thickness and Flame Surface Density (FSD) in turbulent premixed flames [1,2,3,4,5,6,7,11,12,13,14,15,16,17,18,19]. However, most of the above-mentioned analyses have been conducted for turbulent premixed [1,2,3,4,5,6,7,11,12,13,14,15,16,17,18,19] and stratified [8,9] flames and this configuration received relatively limited experimental [10] and computational [20] attention for turbulent spray flames despite the importance of flame propagation in droplet-laden mixtures in automotive engines, gas turbines and accidental explosions.
Vena et al. [8,9] considered turbulent stratified V-flames for iso-octane-air mixtures and indicated that the mixture inhomogeneity plays a key role in the burning rate characteristics and flame propagation rate. These aspects are further strengthened in turbulent droplet-laden combustion due to localised mixture inhomogeneities induced by the evaporation of droplets [10,20]. The mixture inhomogeneity in spray flames is determined by the number density and droplet diameter, which has been demonstrated in several analytical [21,22,23], experimental [24,25,26,27,28,29] and computational [30,31,32,33,34,35,36,37,38,39,40,41,42,43,44,45,46,47,48,49,50] analyses, and this aspect is also valid for turbulent V-flames propagating into droplet-laden mixtures, as demonstrated in a recent analysis by Ozel-Erol et al. [20]. The analysis of Ozel-Erol et al. [20] concentrated on the effects of droplet diameter of the mono-sized droplets supplied ahead of the flame holder for an overall (considering fuel in both gaseous and liquid phases) equivalence ratio of unity (i.e., ). It was revealed by Ozel-Erol et al. [20] that combustion in spray V-flames with takes place predominantly under fuel-lean premixed mode and the probability of fuel-lean combustion increases with increasing droplet diameter. Moreover, the propensity of fuel-lean combustion decreases with increasing axial distance from the flame holder. It has been found that the influence of the droplet diameter on the density-weighted displacement speed and consumption speed in V-shaped flames is weaker than in the case of spherically expanding flames propagating into droplet-laden mixtures [20].
It is worth noting that most carrier-phase DNS analyses of combustion of droplet-laden mixtures [30,31,32,33,34,36,37,40,41,42,43,44,45,46,47] have been carried out for canonical configurations and only a handful of studies [20,48,49,50] concentrated on DNS of non-canonical configurations which are realised in laboratory-scale experiments (e.g., V-shaped flame, jet flows, etc.) and out of these only Ref. [20] focussed on V-shaped flames in droplet-laden mixtures with different mono-sized droplets. The present analysis extends the previous analysis by Ozel-Erol et al. [20] by considering turbulent V-shaped spray flames for different mean inflow velocities for an overall equivalence ratio of unity for different mono-sized droplet diameters.
It is well-known that a variation of the mean inflow velocity changes the flame angle and flame brush in V-shaped flames. Furthermore, a change in mean inflow velocity also alters the ratio of the residence time to the evaporation time of the droplets within V-shaped flames, which is likely to have influences on the mixture composition within the flame. This, in turn, affects the burning rate and flame surface area in turbulent V-shaped flames propagating into droplet-laden mixtures. However, this aspect is yet to be addressed in the existing literature and this paper aims to fill this gap by carrying out carrier-phase DNS of turbulent V-shaped flames propagating into mono-sized n-heptane droplet-laden mixtures corresponding to an overall equivalence ratio of unity (i.e., ) for different mean inflow velocities and initial droplet diameters . In this respect, the main objectives of this paper are:
- (a)
- to analyse the effects of mean inflow velocity and initial droplet diameters on the flame structure at different axial locations from the flame holder for turbulent V-shaped flames propagating into droplet-laden mixtures with mono-sized droplet diameters.
- (b)
- to explain the effects of mean inflow velocity and initial droplet diameter on consumption speed, density-weighted displacement speed and turbulent burning velocity at different axial locations from the flame holder.
The rest of this paper will be organised in the following manner. The necessary mathematical background is provided in the next section of this paper. This will be followed by a brief discussion on the numerical implementation related to this analysis. The results will be presented and subsequently discussed in Section 4 before the main findings are summarised and conclusions are drawn in the final section of this paper.
2. Mathematical Background
In the interest of an extensive parametric analysis, a modified single-step Arrhenius-type chemical reaction [51] is considered for n-heptane-air combustion. This modified single-step chemical reaction provides a realistic gaseous phase equivalence ratio dependence of the unstrained laminar burning velocity and adiabatic flame temperature in hydrocarbon-air flames, and therefore has been chosen to keep the computational cost within reasonable limits. In this chemical mechanism both the activation energy and the heat of combustion are taken to be functions of gaseous phase equivalence ratio and interested readers are referred to Refs. [20,52] where it was shown that the variations of the normalised unstrained laminar burning velocity and adiabatic flame temperature with for the present thermo-chemistry agree well with both previously reported experimental data and detailed chemistry simulations. It is worth noting that several previous DNS analyses [30,31,33,34,35,36,37,40,43,44,45,46,47,48,49,50] used simple chemistry for simulating combustion of droplet-laden mixtures and the same approach has been adopted in this analysis. For the purpose of simplicity, the Lewis numbers of all species are assumed to be unity and all species in the gaseous phase are taken to be perfect gases following several previous studies. The ratio of specific heats (, where and are the gaseous specific heats at constant pressure and constant volume, respectively) and Prandtl number ( 0.7 where is the dynamic viscosity and is the thermal conductivity of the gaseous phase) are taken to have standard values. A Lagrangian approach has been adopted to transport the position , velocity , diameter and temperature of the individual droplets in the following manner [30,31,33,34,35,36,37,40,43,44,45,46,47]:
where is the gaseous phase temperature, is the latent heat of vaporization and , and stand for the relaxation timescales for droplet velocity, diameter and temperature, respectively, and they are given by [30,31,33,34,35,36,37,40,43,44,45,46,47]:
In Equation (2), represents the droplet density, is the Schmidt number, is the specific heat for the liquid phase, is the correction to the drag coefficient, is the droplet Reynolds number, is the Spalding number, is the corrected Sherwood number and is the corrected Nusselt number. The expressions for , and are given as [30,31,33,34,35,36,37,40,43,44,45,46,47]:
Here, is the value of fuel mass fraction at the droplet surface, which needs the knowledge of the partial pressure of the fuel vapour at the droplet surface . This is achieved by using the Clausius–Clapeyron equation which leads to the following expressions [30,31,33,34,35,36,37,40,43,44,45,46,47]:
In Equation (4), is the gas constant, is the boiling point of the fuel at the reference pressure and is assumed to be , and and are the molecular weights of gaseous mixture and fuel, respectively. The knowledge of is necessary to calculate the Spalding number .
The Lagrangian tracking of liquid fuel droplets are coupled with the Eulerian treatment of the carrier gaseous mixture with additional source terms in the gaseous transport equations in the following manner [20,36,37,40,43,44,45,46,47]:
In the context of Equation (5), and for the conservation equations of mass, momentum, energy, and mass fractions, respectively and is the generalised diffusion coefficient (where is the kinematic viscosity, and is an appropriate Schmidt number corresponding to ) associated with whereas is given by for , and is the component of fluid velocity. The term in Equation (5) is the reaction rate contribution, is an appropriate source term and refers to the term associated with the coupling between Lagrangian particulate and Eulerian carrier phases. A tri-linear interpolation has been employed for the purpose of the evaluation of from the droplet location to the eight surrounding nodes [20,36,37,40,41,42,43,44,45,46,47].
It is useful to define a reaction progress variable , based on oxygen mass fraction, and mixture fraction, , in the following manner in order to identify the reaction zone [20,36,37,40,41,42,43,44,45,46,47]:
Here, represents the oxygen mass fraction in air, whereas is the fuel mass fraction in the pure fuel stream. For n-heptane, as the fuel in the analysis, denotes the stoichiometric mass ratio of oxygen to fuel and and represent the corresponding stoichiometric fuel mass fraction and stoichiometric mixture fraction, respectively. The transport equation of the reaction progress variable takes the following form [20,43,45,46,47]:
where represents the molecular diffusivity, is the reaction rate of reaction progress variable, is the source/sink term arising due to droplet evaporation and represents the cross-scalar dissipation term arising due to mixture inhomogeneity. The reaction rate of the reaction progress variable is given by [20,43,45,46,47]:
In Equation (8), is the reaction rate of oxygen and in Equation (7) is calculated as [20,43,45,46,47]:
Here, is the source/sink term in the mixture fraction transport equation with and being the droplet source/sink terms in the mass fraction transport equations for fuel and oxygen, respectively and is the source term in the mass conservation equation due to evaporation [20,43,45,46,47]. The term associated with mixture inhomogeneity is expressed as [20,43,45,46,47]:
Equation (7) can alternatively be written in the kinematic form for a given isosurface in the following manner [20,43,45,46,47]:
Equation (12) suggests that the density-weighted displacement speed can be defined as where is the unburned gas density. Another alternative flame speed, known as the consumption speed , is often used in the combustion literature, which is defined as [20,47]:
where is the elemental distance in the local flame normal direction.
3. Numerical Implementation
The simulations for the present analysis are carried out using a well-known three-dimensional compressible code SENGA+ [20,36,37,40,41,42,43,44,45,46,47]. This DNS code (i.e., SENGA+) was used for the analysis of spray flames under different flow conditions for various flame configurations with simple [36,40,43,44,45,46,47,55] and detailed [42] chemical mechanisms. The flame structure and burning rate statistics in turbulent flames propagating in droplet-laden mixtures have been extensively investigated in the past using SENGA+ for planar [43,44] and spherical [45,46] flames under different droplet size, overall equivalence ratios and turbulence intensities. The simulation results obtained from SENGA+ were also found to be qualitatively consistent with experimental studies [26,29]. Additionally, localised forced ignition behaviour of droplet-laden mixtures obtained from SENGA+ with detailed [42] and modified single step mechanisms [55] was found to be in good qualitative agreement with experimental studies [56,57,58,59].
In SENGA+, the governing equations of mass, momentum, energy and species of the gaseous phase are solved in non-dimensional form. The spatial discretisation for the internal grid points is carried out using a 10th order central difference scheme, but the order of differentiation gradually decreases to a one-sided 2nd order scheme at the non-periodic boundaries. An explicit low-storage 3rd order Runge-Kutta scheme [60] is used for explicit time-advancement. The boundaries in the stream-wise direction (-direction) are taken to be inflow and outflow and are specified using to the Navier-Stokes Characteristic Boundary Conditions (NSCBC) technique [61]. The remaining transverse directions (i.e., and ) are considered to be periodic and thus no explicit boundary conditions are needed for and directions. The simulation domain is taken to be a cube of with being the thermal flame thickness of the unstrained stoichiometric laminar premixed flame. A uniform Cartesian grid of is used to discretise the aforementioned computational domain, which ensures about 10 grid points within . A commercial software COSILAB (Rotexo-Softpredict-Cosilab) [62] is utilised to obtain steady-state planar spray flame solutions as previously done by Neophytou and Mastorakos [63], and these laminar flame solutions are utilised to initialise density, species mass fractions, temperature, flame normal velocity and droplet properties for three different initial values of droplet diameter (i.e., , 0.05 and 0.06) for an overall equivalence ratio of unity (i.e., ). All the V-flame cases taken to have a moderate level of inlet turbulence intensity (i.e., 2.0), and a normalised longitudinal integral length scale of . Two different normalised values of mean inflow velocity 5.0 and 10 are considered for this analysis. Although the turbulent Reynolds number (where is the integral length scale based on turbulent kinetic energy and its dissipation rate ) for the flames considered here remains moderate, the value of remains comparable to that used in experiments by Vena et al. [8,9] and previous V-premixed flame DNS analyses by Dunstan et al. [15,16]. A small value of is chosen for this study, as it allows for the analysis of flame-droplet interaction, and this aspect is eclipsed by flame-turbulence interaction for large values of [26,29,45].
A frozen field of homogeneous isotropic turbulence is scanned by a plane in order to specify turbulent velocity fluctuations at the inlet plane following Taylor’s hypothesis [64], as done in several previous analyses [15,16,20,65,66]. The flame holder is located at approximately 10 from the inlet plane. Three different axial distances (i.e., position A, B and C) from the flame holder (i.e., , and ) are considered for the statistics presented in this paper, which are taken after where is the flow through time. A Gaussian weighting function following Dunstan et al. [5,16] is used to impose the reactant mass fractions (i.e., and ) and the non-dimensional temperature of gaseous phase within the flame holder volume, where and are adjustable constants to obtain the desired flame holder radius (i.e., ).
The initial droplet number density is estimated to be in the unburned gas for the cases considered here and the liquid volume fraction is well below . Individual droplets are tracked using a Lagrangian approach in the context of point-source assumption which is extensively used for DNS of diluted spray flames [30,31,32,33,34,36,37,40,41,42,43,44,45,46,47]. The point source formulation is valid when the droplet diameter is smaller than both the Kolmogorov length scale and the grid size used in DNS. For the inlet turbulence intensity (i.e., ) considered here, the ratio of initial droplet diameter to the Kolmogorov length scale is for the cases of , respectively. This ratio of the initial droplet diameter to grid spacing remains comparable to several previous analyses [31,34,36,39,40,41,42]. Furthermore, the diameter of the droplets interacting with the flame in the reaction zone reduces significantly (i.e., at least 50% smaller than the initial size) due to the relatively high volatility of n-heptane. The sub-grid evaporation model assumption is not expected to have an important impact on the analysis of flame-droplet interaction, as flame-droplet interaction occurs at larger scales than the initial size of the droplets. Therefore, it can be expected that the qualitative nature of the findings is not sensitive to the evaporation modelling used in this analysis. Additionally, validity of the point source assumption for droplets with sizes smaller than the Kolmogorov length scale is supported by a recent comparative analysis by Haruki et al. [67] with respect to the evaporation characteristics obtained from fully resolved multi-phase simulations. Carrier phase DNS with point source and fully Eulerian phase-DNS were considered by de Chaisemartin et al. [68] to compare their performance in terms of polydispersity and droplet crossing. The results by de Chaisemartin et al. [68] showed a good agreement between gaseous fuel mass fraction fields obtained from these two approaches. They [68] also reported that the simulations with the full Eulerian approach were 10 times more expensive than those with the point source approach and a large-scale parallelisation capability for 3D simulations is needed for the Eulerian phase DNS for sprays. Moreover, combustion simulations involving fully resolved dispersed phase are currently in a primitive stage and need further validation to be used on a routine basis. Thus, a point source assumption for the dispersed phase (i.e., droplets) has been considered in this analysis.
The Stokes number for this problem can be estimated based on turbulent flow timescale (where is the particle time scale and is the turbulent time scale) and it has been found that remains smaller than 0.13 for the cases considered here. An alternative Stokes number can be defined based on the chemical time scale (where is the thermal diffusivity in the unburned gas) as , and the maximum value of remains smaller than for the largest droplets considered in this analysis. The mean normalised inter-droplet distance varies from 1.64 to 2.47 for the inlet turbulence intensity of . Furthermore, the droplet Reynolds number is either of the order of unity or smaller than unity (i.e., ≤ 1.0) in most (~95%) locations (especially in the vicinity of the flame) for the cases considered here. Thus, the combination of small Stokes number and droplet Reynolds number indicates that the exact nature of Lagrangian modelling of the dispersed phase is not expected to play a significant role on the results of the current analysis.
The group number helps to categorise combustion process of droplet-laden mixtures as individually burning droplets () and external sheath combustion () [69]. According to Chiu and Liu [69] the group number is expressed as where and are the Lewis and Schmidt numbers, respectively, is the number of droplets in a specified volume. For all droplet cases, is estimated to much greater than unity which is indicative of the external sheath combustion [30,70]. A recent analysis by Zhao et al. [70] indicated that external sheath combustion is the most likely mode of burning under the conditions analysed in this paper.
4. Results and Discussion
4.1. Reacting Mixture Composition
A comparison of gaseous mixture composition for droplet cases with 5.0 and 10 can be made for different initial droplet diameters (i.e., ) from the distributions of gaseous phase equivalence ratio in the mid-plane presented in Figure 1. The droplets residing on the plane are illustrated by grey dots. Inlet boundary on the left side of the domain supplies the fuel in the form of liquid droplets with a temperature of K. The mass flux of liquid fuel at the inlet plane is determined based on the values of and . Evaporation of the liquid droplets provides gaseous fuel to maintain the V-shaped flame. Figure 1 shows that gaseous equivalence ratio in the unburned gas region can reach at the stoichiometric value (i.e., ) for small droplet cases with initial due to their high evaporation rates, however, mostly remains smaller than unity (i.e., ) for large droplet cases with initial as a result of their slow evaporation rates. Furthermore, in case of 5.0, small droplets mostly complete their evaporation by halfway in the streamwise direction, but the residence time of small droplets is not sufficient for a completed evaporation for the case of 10.0. As residence time of droplets is inversely linked with the mean flow velocity, mixture composition for all droplet sizes tends to be leaner for a higher due to shorter mean advection time in comparison to the evaporation timescale.
The effects of mean flow velocity on the composition of the gaseous phase mixture within the flame can be illustrated by the probability density functions (PDFs) of the gaseous phase equivalence ratio within the flame characterised by . The statistics are presented at three different axial locations from the flame holder (i.e., at distances , 13 and 17 from the flame holder, which are illustrated as locations A, B and C, respectively) in Figure 2. It can be seen from Figure 2 that combustion predominantly occurs under fuel lean mode at all locations for both mean flow velocities. Although, evaporation of small droplets (i.e., initial case) yields comparable distributions at locations B and C for both mean flow velocities, the PDF of at location A shows a higher probability of obtaining for the case with 10.0 than in the case of 5.0. The differences in distributions of between the cases with 5.0 and 10.0 become prominent for large droplet cases with initial and 0.06. The probability of finding gaseous mixtures with has been found to be greater for the 10.0 case than in the 5.0 case, whereas the probability of finding remain comparable for both mean inflow velocity conditions. This behaviour is a result of combined effect of shorter residence time of droplets for large mean velocities, and the evaporation characteristics of droplets within the flame. It can be seen from Figure 1 that droplets can be found in the unburned gas throughout the simulation domain for the initial case for 10.0, whereas the droplets with the same initial diameter almost complete their evaporation process almost by the middle of the simulation domain for 5.0. This tendency is less prominent in the large droplet cases (e.g., initial and 0.06 cases) due to their slow evaporation rates. An increase in mean flow velocity reduces the residence time of the droplets in comparison to their evaporation time, and therefore the droplets can traverse farther in the axial direction without completing their evaporation process for large values of , and consequently in these cases less fuel vapour becomes available in the gaseous phase than in the cases with smaller mean flow velocity. Furthermore, large droplets, which reach at the flame and escape through the flame without complete evaporation, eventually evaporate completely in the high temperature zone in the burned gas (i.e., ). The resulting evaporated fuel vapour diffuses from the high temperature burned gas region into the flame and mixes with excess air diffusing from the unburned gas side to give rise to local pockets of stoichiometric mixture (i.e., where diffusion mode of combustion is obtained. The predominance of fuel-lean combustion in the gaseous phase for higher mean inflow velocity cases can be verified by comparing the time-averaged values of . These values for with 5 (10) are 0.88 (0.84), 0.89 (0.87) and 0.90 (0.88), for with 5 (10) are 0.83 (0.75), 0.85 (0.77) and 0.87 (0.79), for with 5 (10) are 0.74 (0.66), 0.77 (0.69) and 0.79 (0.70), at locations A, B and C, respectively. The aforementioned values further indicate that tendency of fuel-lean nature of combustion decreases in the downstream direction due to increased availability of fuel vapour as a result of evaporation of droplets, which is consistent with the observations of a previous analysis [20].
The Damköhler and Karlovitz numbers for the stoichiometric homogeneous gaseous mixture based on the inlet values of and are given by 1.25 and 1.79 (i.e., and ), respectively. The Karlovitz (Damköhler) number of the underlying combustion process is expected to increase (decrease) in comparison to () due to the predominance of fuel lean mixture in these droplet V-flame cases. Alternatively, the local Damköhler number can be estimated by with and denoting the local turbulent length scale and root-mean-square velocity (where and represent the Favre-averaged turbulent kinetic energy and its dissipation rate, respectively). Here stands for the laminar burning velocity corresponding to . The local values of the Damköhler number are exemplarily given at the location corresponding to , which for with 5 (10) are 0.79 (0.75), 0.92 (0.94) and 1.09 (1.27), for with 5 (10) are 0.49 (0.26), 0.71 (0.57) and 1.00 (0.73), for with 5 (10) are 0.27 (0.07), 0.40 (0.14) and 0.62 (0.26) at locations A, B and C, respectively. The local Damköhler number for the premixed case with 5 (10) are 3.66 (0.73), 3.93 (0.93), 3.99 (1.14) at locations A, B and C, respectively. Similarly, the corresponding values of the local Karlovitz number () based on , and values at the location corresponding to for with 5 (10) are 1.79 (1.16), 1.74 (1.09) and 1.79 (1.06), for with 5 (10) are 2.60 (3.05), 2.18 (2.08) and 1.87 (1.96), for with 5 (10) are 4.12 (7.98), 3.33 (5.37) and 2.75 (3.96) at locations A, B and C, respectively. The corresponding values for the premixed case with 5 (10) are 3.77 (1.82), 3.39 (1.82), 2.91 (1.82) at locations A, B and C, respectively. According to these estimated values of and , the gaseous phase combustion nominally takes places in the thin reaction zones regime [71]. The predominance of low Damköhler number combustion can be substantiated from the PDFs of reaction progress variable for different values of Favre-averaged reaction progress variable . Figure 3 shows the PDFs of reaction progress variable for the Favre-averaged reaction progress variable values and 0.9 at locations A, B and C, whereas the contours of and 0.9 for the cases considered here are shown in Figure 4. In this paper, the Favre averaging is conducted by averaging in time (i.e., over one flow-through time ) and space (i.e., spanwise z-direction). The PDFs of are supposed to show a bimodal distribution with peaks at and for high values of Damköhler number [72]. However, Figure 3 reveals that the PDFs of do not exhibit bimodal distribution for the most cases considered in this study. The departure of PDF of from bimodal distribution with impulses at and shows the tendency of low Damköhler number combustion for the cases considered in this study. Figure 3 further demonstrates that the PDFs of for the cases considered here show mostly mono-modal distributions and this tendency strengthens with increasing mean flow velocity.
4.2. Flame Brush Thickness and Flame Angle
The small values of Damköhler number and high values of Karlovitz number are indicative of the thickened flame regime of combustion [71] and local occurrences of flame thickening can be discerned from the contours of in Figure 1. This along with the flame wrinkling determines the flame brush thickness in the V-flame cases considered in this analysis. The flame brush thickness can be defined as the distance between and 0.9 isosurfaces for a given location, as shown in Figure 4. The values of flame brush thickness, for V-flame cases under droplet-laden mixtures are presented and compared to the corresponding stoichiometric turbulent premixed gaseous flame cases in Table 1. It can be seen from Table 1 that the flame brush thickness increases in the downstream and decreases with increasing droplet diameter for the cases with low mean flow velocity. On the contrary, flame brush becomes wider for large droplets for the cases with 10.0. According to turbulent diffusion velocity, flame brush thickness for a V-shaped flame is correlated with the distance from flame holder and flow parameters (i.e., bulk mean velocity , root-mean-square and integral length scale ) [11,64,73]. Kheirkhah and Gulder [11] demonstrated the effects of equivalence ratio on flame brush thickness under different flow conditions (i.e., ) for V-shaped premixed flames. The flame brush thickness can alternatively be estimated using the expressions: and . Reported values of and in Table 1 exhibit qualitatively similar trends as that of in response to the changes in flow conditions and droplet diameter. The values of flame brush thickness of gaseous premixed V-shaped flames with 10.0 remain comparable to those of small droplet case while gaseous premixed flame has a thinner flame brush than in the droplet cases for 5.0.
The flame brush thickness depends both on the Zel’dovich thickness , and also on the flame wrinkling which is dependent on [74]. This suggests that (resp. ) is expected to increase (resp. decrease) with increasing droplet diameter due to greater likelihood of fuel-lean combustion (where and ) for larger droplets. The smaller extent of flame wrinkling due to smaller values of as a result of higher likelihood of fuel-lean combustion for larger droplets overcomes the effects of the thickening of the flame front for small values of . This gives rise to a decrease in flame brush thickness with increasing for 5.0. However, the greater likelihood of the thickening of flame front due to the predominance of fuel-lean combustion in the case of large diameters overcomes the effects of weakened flame wrinkling for small values of for 10.0 cases, which is reflected in the increasing trend of flame brush thickness with increasing droplet diameter.
The changes in flame brush thickness in the flow direction lead to the variation of flame angle for V-shaped flames. Furthermore, slightly curved nature of isosurfaces yields to significant differences in flame angle in the mean flow direction from location A to C. The contours of Favre averaged reaction progress variable presented in Figure 4 also demonstrate that the variations of mean flow velocity and droplet diameter give rise to significant differences in the angles made by the tangent on the and 0.9 contours with the mean flow direction (i.e., x-direction). The angles , and for and 0.9 isosurfaces are provided in Table 2 for locations A, B and C where these angles are calculated using the slopes of the tangent on the respective isosurfaces at a given axial location. It can be seen from Figure 4 that flame angles decrease with increasing mean inflow velocity, as expected, and the flame angles , and for gaseous premixed flame are greater than those for droplet cases for 10.0 but the opposite trend is mostly observed for 5.0 except for the flame angle in the case of small droplet diameters. This behaviour originates due to differences in the evolution of the flame brush thickness in the flow direction (see Table 1). The flame angles at a given plane remain comparable for different droplet diameters for both mean inlet velocities considered here.
4.3. Reaction Zone Structure
The variation of flame angle in the mean flow direction for different droplet sizes is consistent with the evolution of the distribution of reacting mixture composition at various isosurfaces. Figure 5 shows the PDFs of gaseous equivalence ratio on and 0.9 isosurfaces at different axial locations for both mean inflow velocities. Figure 5 indicates that the variation of the mean flow velocity causes significant differences in the PDFs of at . Evaporated fuel in droplet cases with higher mean flow velocity burns leaner mixture at than that with lower mean flow velocity and the differences between the PDF profiles for different mean velocities decrease in the mean flow direction from A to C for . Additionally, distribution for becomes comparable for a given droplet diameter with different mean flow velocities at all locations considered here. On the contrary, PDFs of for higher mean flow velocity cases attain a peak value at towards the burned gas side of the flame brush (e.g., ) which implies that spray flames with 10.0 show greater probabilities of having stoichiometric mixture towards the burned gas side of the flame brush than in 5.0 cases. Droplets with a mean flow velocity 10.0 travel greater distances within the flame brush before completing their evaporation than in the case of 5.0. As a result, the droplets for 10.0 cases on average are bigger in size towards the unburned gas side of the flame brush than in the cases with 5.0. Therefore, droplets can penetrate further into flame brush before their complete evaporation in the high temperature region for 10.0 cases than in the corresponding 5.0 cases. Consequently, 10.0 cases exhibit higher probability of towards the burned gas than in the corresponding 5.0 cases.
The droplets, which penetrate the flame, give rise to droplet-induced wrinkling on the flame surface. In order to demonstrate this, isosurfaces coloured by local values of flame curvature are exemplarily shown in Figure 6. The local curvature can be expressed as where is the local flame normal vector. In relation to these definitions, the flame normal vector points towards the reactants and a positive (negative) curvature value indicates an element of the flame surface, which is convex (concave) to the reactants. It is evident from Figure 6 that flame surfaces for the gaseous premixed flames remain smooth irrespective of the mean inflow velocity and exhibit wrinkles induced by the turbulent fluid motion. Furthermore, small droplets with 5.0 rarely interact with the flame because they mostly evaporate before reaching the flame surface. However, a decrease in advection time in comparison to the evaporation timescale with increasing enhances the number of droplets interacting with the flame farther in the mean flow direction. This leads to greater propensity to obtain dimples on the flame surface for cases with higher mean inflow velocity. Moreover, flame wrinkling as a result of the dimples arising from flame-droplet interaction increases with increasing droplet diameter due to the slow evaporation rate of large droplets for a given mean inflow velocity. The larger droplets survive longer in the mean flow direction because of their slower evaporation rate and thus the dimples become denser for larger droplet diameters and higher mean inflow velocities. This behaviour is consistent with previous experimental [29] and numerical [45,46,47] findings for spherically expanding flames propagating into droplet-laden mixtures.
The aforementioned droplet-induced flame surface deformation can be quantified with the help of PDFs of flame surface curvature . Figure 7 shows the PDFs of local normalised flame curvature on the isosurface at different planes (i.e., A, B and C) for all droplet cases and the corresponding gaseous premixed flame cases considered here. The reaction rate of reaction progress variable reaches its maximum value close to isosurface for the present thermo-chemistry [20], therefore this -isosurface is assumed as the flame surface for the rest of this study. Although the PDFs of local normalised flame curvature are shown only for isosurface in Figure 7, they show qualitatively similar behaviour for other values of and thus are not presented for the sake of brevity. Figure 7 reveals that the PDFs of assume peak value at zero curvature at all locations for both gaseous premixed and droplet-laden flames. For droplet cases, the PDF profiles of broaden both for negative and positive values in comparison to the corresponding gaseous premixed flames due to flame-droplet interactions. The PDFs of for droplet cases widen with increasing mean inflow velocity, whereas an opposite trend is observed for gaseous premixed flames because the flame becomes increasingly narrow for increasing mean inflow velocity. It can be seen from Figure 1 and Figure 4, and Table 2 that the flame angle shrinks with increasing and thus the gaseous premixed flames shows greater range of both positive and negative curvature values in the case of smaller mean velocity because of greater likelihood of the flame interaction with a range of different turbulent flow conditions. It has already been explained earlier that the greater availability of droplet within the flame brush increases the possibility flame-droplet interaction for higher mean inlet velocities and this yields wider distributions of for all the droplet cases at all locations (i.e., A, B and C) with a higher possibility of finding long negative and positive tails. Differences in PDF of between two mean flow velocities for a given droplet diameter increase in the streamwise direction from A to C, since some of the droplets complete their evaporation before reaching the flame, especially farther in the streamwise direction for lower mean flow velocity cases. Moreover, the widening of of droplet flame cases in comparison to the corresponding gaseous premixed flames increases with increasing droplet diameter because these droplets survive longer within the flame due to their slower evaporation rates and thus induce greater extents of flame-droplet interaction.
The wrinkling of isosurfaces in these flames, in turn, have implications on the burning rate statistics in premixed flames. The mode of combustion can be characterised by the Flame index [75]. The takes a positive value for a premixed mode of combustion while FI is negative for non-premixed combustion mode. Figure 8 shows the percentages of heat release rate arising from premixed and non-premixed modes of combustion for all droplet cases considered here. It is evident from Figure 8 that premixed mode of combustion is the dominant contributor to the total heat release for all droplet cases at all locations considered in this analysis. However, the percentage of heat release associated with non-premixed combustion reaches non-negligible levels for large droplet cases particularly at higher mean flow velocity. The slow evaporation of large droplets gives rise to high extent of mixture inhomogeneity in the gaseous phase and this increases the likelihood of non-premixed combustion for large droplet cases. In the case of higher mean flow velocity, larger number of droplets pass through the flame and eventually evaporate in the burned gas region (i.e., 1.0) generating locally fuel rich regions. Unburned fuel vapour from these fuel-rich pockets in the burned gas region eventually diffuses into the flame and mixes with the air diffusing from the predominantly fuel-lean unburned gas side to give rise to local diffusion mode of burning. Therefore, the extent of heat release due to non-premixed mode of combustion increases with increasing . As non-premixed combustion occurs where stoichiometric mixture is obtained, the mild peaks at 1.0 in the PDFs of in Figure 2 are predominantly associated with non-premixed mode of combustion in these droplet cases.
4.4. Statistical Analysis of Flame Speeds
With the information that heat release predominantly takes place in premixed mode, it is worthwhile to analyse the flame propagation statistics in terms of density-weighted displacement speed and consumption speed . Therefore, it is instructive to analyse the mean behaviour of the terms, which drive the statistical behaviour of density-weighted displacement speed . Figure 9 shows the mean values of the terms , , and conditional on for locations A, B and C for the cases with different mean inflow velocities. Figure 9 indicates that the mean molecular diffusion term assumes positive values towards the preheat zone (i.e., ) but becomes negative in the reaction zone (i.e., ) in contrast with the positive mean values of for all cases considered here. Furthermore, since stratified mixtures with and burn slower in the droplet cases than in the stoichiometric (i.e., ) premixed flame, the mean values of for droplets cases is expected to be smaller than the gaseous premixed case. Overwhelmingly leaner combustion trend in the case of larger droplets reduces to the mean values of with increasing and the differences in the mean values of between the gaseous premixed and droplet cases are greater for than those of the cases with due to the predominance of fuel-lean combustion for higher inflow velocities (see Figure 2 and Figure 5). Although, the mean values of terms associated with droplet evaporation and mixture inhomogeneity are negligible compared with the magnitudes of the mean values of and throughout the flame in the cases with lower mean flow velocity, these mean values (i.e., and ) slightly increase for higher mean flow velocity cases. Figure 9 further shows that the mean value of remains comparable with the mean value of for the gaseous premixed V-flames with different mean flow velocities. However, the mean values of have been found to be smaller than those of for all droplet cases considered in this analysis. It can also be observed from Figure 9 that the statistical behaviours of and are not significantly influenced by the variation of the mean flow velocity for V-shaped flames. As the inverse of the maximum value of can be taken to be a measure of the flamelet thickness (i.e., ) [43,45,76], a decreasing trend of with increasing droplet diameter and mean inflow velocity for droplet cases suggests that the flame thickens with increasing droplet diameter and mean inflow velocity due to increased propensity for fuel-lean combustion. As the premixed combustion takes place in the flamelet regime, the background turbulent motion does not affect the flame structure and as a result the mean values of , and are not affected by the mean inflow velocity.
Although the statistical behaviour of density-weighted displacement speed is strongly linked with the evolution of the aforementioned terms (i.e., ), consumption speed is dependent only on and the flame thickness. Figure 10 shows the normalised mean consumption speed and density-weighted displacement speed, calculated on isosurface at locations A, B and C for both mean inflow velocities. A decreasing trend in is observed for increasing droplet diameter for both inflow velocities. In addition, for the premixed gaseous flame cases is found to be greater than the droplet cases for both mean inflow velocities, which is consistent with the behaviour of the mean presented in Figure 9. However, the mean value of for droplet cases increases with increasing mean inflow velocity. It is important to note from Figure 9 that the mean value of and conditional upon do not change with increasing irrespective of the location for premixed flames and therefore remains mostly unaffected by the location and mean inflow velocity for gaseous premixed flame cases. It has already been demonstrated in the context of the discussion of Figure 9 that the flame thickens and the mean value of decreases with increasing and droplet diameter, and this reduction in mean reaction rate magnitude with increasing droplet diameter is responsible for the decreasing trend of with increasing . Although the mean value of conditional upon for droplet cases decreases with increasing as a result of greater likelihood of obtaining fuel-lean mixture in the gaseous phase (see Figure 2 and Figure 5), the increase in flamelet thickness for fuel-lean combustion contributes to the increase in the value of the integral , which is reflected in the increase in with increasing the mean inflow velocity. The mean values of and for the gaseous premixed flames remain identical at close to unity for different mean flow velocities. Moreover, the mean values of for the droplet cases with 5.0 remain comparable. By contrast, the mean values of for droplet cases with 10.0 slightly increase with increasing droplet diameter at locations A and B.
The time-averaged values of flame surface area , the normalised volume-integrated fuel reaction rate magnitude (the volume integrated reaction progress variable reaction rate shows the same qualitative trend and thus is not shown here) and the normalised ratio of volume-integrated product formation rate to the flame surface area are reported in Table 3 for V-shaped flames with 5.0 and 10.0. Table 3 reveals that increases with increasing droplet diameter for the cases with higher mean inflow velocity while values remain comparable for droplet cases with lower mean flow velocity. It can further be observed that for lower mean flow velocity case, of the gaseous premixed case is larger than those of the droplet cases with initial and 0.05, however, this value remains smaller than that for the case with initial in the case of 10.0. This behaviour originates due to greater extent of droplet-induced flame wrinkling for large droplet cases. The relative magnitudes of flame area of a given isosurfaces for droplet and gaseous premixed flame cases follow the same qualitative trend as that of irrespective of the mean inflow velocity. The increase in the mean flow direction yields smaller values of for all droplet cases due to higher probability of finding in the reacting mixture composition in these cases. Furthermore, changes in proportion to that of flame surface area for the gaseous premixed flames according to Damköhler’s first hypothesis [77] and therefore remains close to unity in these cases. A marginal change is observed in values when the mean flow velocity increases. However, in the droplet cases is indicative of fuel-lean combustion because a laminar stoichiometric premixed flame is expected to have . The increased propensity of fuel-lean combustion leads to a slight decrease in with increasing .
The turbulent burning velocity can be defined as: where denotes the flame area of the isosurface with respect to which is estimated. Table 3 presents the normalised values of and for the and 0.5 isosurfaces. Table 3 clearly reveals that the values of remain comparable to those of for different mean flow velocity cases. Turbulent burning velocities for the and 0.5 isosurfaces decrease with increasing depending upon the decrease in . Moreover, it can be seen from Table 3 that the turbulent burning velocity for droplet cases decreases with increasing mean inflow velocity and this behaviour arises due to increased probability of fuel-lean combustion with an increase in (see Figure 2 and Figure 5). Furthermore, it can be seen that the gaseous premixed flame cases exhibit higher values of than the droplet cases and an increase in the mean inflow velocity leads to a marginal decrease in turbulent burning velocity as a result of small changes in values.
5. Conclusions
The influence of mean flow velocity on the flame structure, droplet-induced flame wrinkling, mean behaviours of different terms of the reaction progress variable transport equation, and flame propagation statistics has been investigated using three-dimensional direct numerical simulation data considering a modified single-step Arrhenius chemical reaction. The V-shaped spray flame simulations have been carried out under various mean inflow velocity conditions for different droplet diameters for an overall (i.e., liquid + gaseous) equivalence ratio of unity. A comparison on the flame evolution has been conducted based on the corresponding turbulent gaseous premixed V-shaped flames under the same flow conditions. It has been found that reacting mixture composition in the flame becomes leaner due to the shorter residence time of droplets in case of higher mean inflow velocities. Mean inflow velocity, alongside droplet diameter and the axial distance, affects the flame brush thickness. The flame front thickens with increasing droplet diameter for the cases with higher mean flow velocity due to the predominance of fuel-lean gaseous mixture within the flame. However, an opposite behaviour has been observed for the cases with lower mean inflow velocity where the smaller extent of flame wrinkling dominates over the effects of the thickening of the flame front.
Liquid droplets interact with the flame and lead to dimples on the flame surface. Under higher mean flow velocity conditions, the PDFs of local curvature values broaden as a result of the significantly increased droplet-induced flame wrinkling. It has been demonstrated that the major part of total heat release arises from the premixed mode of combustion. However, the contribution of non-premixed combustion to the total heat release becomes stronger for larger droplets with higher mean flow velocity and this trend is relatively strong at the locations closer to the flame holder due to the greater availability of droplets interacting with the flame. The mean values of the terms which govern the statistical characteristic of displacement speed exhibit comparable magnitudes for different mean flow velocities irrespective of the distance from flame holder. The mean values of consumption speed diminish with increasing droplet diameters irrespective of the mean inflow velocity. Furthermore, under small mean inflow velocity conditions, the mean values of density weighted displacement speed have been found to be comparable for different droplet diameters at all locations. This trend changes under higher mean inflow conditions and the mean values of density weighted displacement speed increase for larger droplet cases at the locations close to the flame holder. The increased probability of fuel-lean combustion leads to a decrease in turbulent burning velocity with increasing mean inflow velocity.
The present analysis has been conducted using a single step chemistry and thus the investigation carried out in this paper needs to be extended for detailed chemistry DNS for further validation of the current findings although several previous analyses demonstrated that the flame speed statistics and flame structure obtained from simple chemistry simulations [36,65,78,79] remain at least qualitatively consistent with detailed chemistry computations [41,53,54,80] for premixed turbulent flames. Moreover, the physical mechanisms, which are responsible for the variations observed based on two mean inlet velocities in this analysis are unlikely to change for a different value of , and thus, the qualitative trends in response to the changes in can be inferred from the results presented here. However, further analyses for different mean inlet velocities will be necessary for deeper physical understanding.
Author Contributions
Conceptualization, N.C.; simulation, G.O.E.; Postprocessing code development, G.O.E., N.C.; formal analysis, G.O.E., N.C.; writing—original draft preparation, G.O.E., N.C.; writing—review and editing, N.C., G.O.E.; visualization, G.O.E., N.C.; supervision, N.C.; funding acquisition, N.C. All authors have read and agreed to the published version of the manuscript.
Funding
This research was funded by EPSRC (EP/R029369/1, EP/S025154/1) and the Republic of Turkey Ministry of National Education.
Acknowledgments
We received computational support from ARCHER and Rocket HPC.
Conflicts of Interest
The authors declare no conflict of interest.
References
- Smith, K.O.; Gouldin, F.C. Experimental investigation of flow turbulence effects on premixed methane-air flames. Prog. Astronaut. Aeronaut. 1978, 58, 37–54. [Google Scholar]
- Veynante, D.; Duclos, J.M.; Piana, J. Experimental analysis of flamelet models for premixed turbulent combustion. Proc. Combust. Inst. 1994, 25, 1249–1256. [Google Scholar] [CrossRef]
- Veynante, D.; Piana, J.; Duclos, J.M.; Martel, C. Experimental analysis of flame surface density models for premixed turbulent combustion. Proc. Combust. Inst. 1996, 26, 413–420. [Google Scholar] [CrossRef]
- Gouldin, F.C. Combustion intensity and burning rate integral of premixed flames. Proc. Combust. Inst. 1996, 26, 381–388. [Google Scholar] [CrossRef]
- Shepherd, I.G. Flame surface density and burning rate in premixed turbulent flames. Proc. Combust. Inst. 1996, 26, 373–379. [Google Scholar] [CrossRef] [Green Version]
- Sattler, S.S.; Knaus, D.S.; Gouldin, F.C. Determination of three-dimensional flamelet orientation distributions in turbulent v-flames from two-dimensional image data. Proc. Combust. Inst. 2002, 29, 1785–1792. [Google Scholar] [CrossRef]
- Sponfeldner, T.; Boxx, I.; Beyrau, F.; Hardalupas, Y.; Meier, W.; Taylor, A.M.K.P. On the alignment of fluid-dynamic principal strain-rates with the 3D flamelet-normal in a premixed turbulent V-flame. Proc. Combust. Inst. 2015, 35, 1269–1276. [Google Scholar] [CrossRef] [Green Version]
- Vena, P.C.; Deschamps, B.; Smallwood, G.J.; Johnson, M.R. Equivalence ratio gradient effects on flame front topology in a stratified iso-octane/air turbulent V-flame. Proc. Combust. Inst. 2011, 33, 1551–1558. [Google Scholar] [CrossRef]
- Vena, P.C.; Deschamps, B.; Guo, H.; Smallwood, G.J.; Johnson, M.R. Heat release rate variations in a globally stoichiometric, stratified iso-octane/air turbulent V-flame. Combust. Flame 2015, 162, 944–959. [Google Scholar] [CrossRef]
- Letty, C.; Renou, B.; Reveillon, J.; Saengkaew, S.; Grehan, G. Experimental study of droplet temperature in a two-phase heptane/air V-flame. Combust. Flame 2013, 160, 1803–1881. [Google Scholar] [CrossRef]
- Kheirkhah, S.; Gulder, O.L. Topology and brush thickness of turbulent premixed V-shaped flame. Flow Turb. Combust. 2014, 93, 439–459. [Google Scholar] [CrossRef]
- Alshaalan, T.M.; Rutland, C.J. Turbulence, scalar transport, and reaction rates in flame-wall interaction. Proc. Combsut. Inst. 1998, 28, 793–799. [Google Scholar] [CrossRef]
- Bell, J.B.; Day, M.S.; Shepherd, I.G.; Johnson, M.R.; Cheng, R.K.; Grcar, J.F.; Beckner, V.E.; Lijewski, M. Numerical simulation of a laboratory-scale turbulent V-flame. Proc. Natl. Acad. Sci. USA 2005, 102, 10006–10011. [Google Scholar] [CrossRef] [PubMed] [Green Version]
- Domingo, P.; Vervisch, L.; Payet, S.; Hauguel, R. DNS of a premixed turbulent V flame and LES of a ducted flame using a FSD-PDF subgrid scale closure with FPI-tabulated chemistry. Combust. Flame 2005, 143, 566–586. [Google Scholar] [CrossRef]
- Wu, Y.Y.; Chan, C.K.; Zhou, L.X. Large eddy simulation of an ethylene–air turbulent premixed V-flame. J. Comput. Methods Appl. Math. 2011, 235, 3768–3774. [Google Scholar] [CrossRef] [Green Version]
- Dunstan, T.D.; Swaminathan, N.; Bray, K.N.C.; Cant, R.S. Geometrical Properties and Turbulent Flame Speed Measurements in Stationary Premixed V-flames Using Direct Numerical Simulation. Flow Turb. Combust. 2011, 87, 237–259. [Google Scholar] [CrossRef]
- Dunstan, T.D.; Swaminathan, N.; Bray, K.N.C. Influence of flame geometry on turbulent premixed flame propagation: A DNS investigation. J. Fluid Mech. 2012, 709, 191–222. [Google Scholar] [CrossRef]
- Lai, J.; Chakraborty, N.; Zhao, P.; Wang, L. Heat flux and flow topology statistics in oblique and head-on quenching of turbulent premixed flames by isothermal inert walls. Combust. Sci. Technol. 2019, 191, 353–381. [Google Scholar] [CrossRef] [Green Version]
- Ahmed, U.; Chakraborty, N.; Klein, M. Scalar gradient and strain rate statistics in oblique premixed flame-wall interaction within turbulent channel flows. Flow Turb. Combust. 2020. [Google Scholar] [CrossRef]
- Ozel-Erol, G.; Hasslberger, J.; Klein, M.; Chakraborty, N. A Direct Numerical Simulation analysis of turbulent V-shaped flames propagating into droplet-laden mixtures. Int. J. Multiph. Flow 2020, 133, 103455. [Google Scholar] [CrossRef]
- Polymeropoulos, C.E. Flame propagation in aerosols of fuel droplets, fuel vapor and air. Combust. Sci. Technol. 1984, 40, 217–232. [Google Scholar] [CrossRef]
- Silverman, I.; Greenberg, J.B.; Tambour, Y. Stoichiometry and polydisperse effects in premixed spray flames. Combust. Flame 1993, 93, 97–118. [Google Scholar] [CrossRef]
- Greenberg, J.B.; Silverman, I.; Tambour, Y. On droplet enhancement of the burning velocity of laminar premixed spray flames. Combust. Flame 1998, 113, 271–273. [Google Scholar] [CrossRef]
- Burgoyne, J.H.; Cohen, L. The effect of drop size on flame propagation in liquid aerosols. Proc. R. Soc. Lond. Ser. A 1954, 225, 375–392. [Google Scholar]
- Mizutani, Y.; Nishimoto, T. Turbulent flame velocities in premixed sprays part i. experimental study. Combust. Sci. Technol. 1972, 6, 1–10. [Google Scholar] [CrossRef]
- Hayashi, S.; Kumarevgai, S.; Sakai, T. Propagation velocity and structure of flames in droplet-vapor-air mixtures. Combust. Sci. Technol. 1977, 15, 169–177. [Google Scholar] [CrossRef]
- Szekely, G.A.; Faeth, G.M. Effects of envelope flames on drop gasification rates in turbulent diffusion flames. Combust. Flame 1983, 49, 255–259. [Google Scholar] [CrossRef]
- Ballal, D.R.; Lefebvre, A.H. Flame propagation in heterogeneous mixtures of fuel droplets, fuel vapor and air. Proc. Combust. Inst. 1981, 18, 321–328. [Google Scholar] [CrossRef]
- Lawes, M.; Saat, A. Burning rates of turbulent iso-octane aerosol mixtures in spherical flame explosions. Proc. Combust. Inst. 2011, 33, 2047–2054. [Google Scholar] [CrossRef]
- Reveillon, J.; Vervisch, L. Analysis of weakly turbulent dilute-spray flames and spray combustion regimes. J. Fluid Mech. 2005, 537, 317–347. [Google Scholar] [CrossRef]
- Wang, Y.; Rutland, C.J. Effects of temperature and equivalence ratio on the ignition of n-heptane fuel spray in turbulent flow. Proc. Combust. Inst. 2005, 30, 893–900. [Google Scholar] [CrossRef]
- Nakamura, M.; Akamatsu, F.; Kurose, R.; Katsuki, M. Combustion mechanism of liquid fuel spray in a gaseous flame. Phys. Fluids. 2005, 17, 1–14. [Google Scholar] [CrossRef]
- Reveillon, J.; Demoulin, F.X. Evaporating droplets in turbulent reacting flows. Proc. Combust. Inst. 2007, 31, 2319–2326. [Google Scholar] [CrossRef]
- Sreedhara, S.; Huh, K.Y. Conditional statistics of nonreacting and reacting sprays in turbulent flows by direct numerical simulation. Proc. Combust. Inst. 2007, 31, 2335–2342. [Google Scholar] [CrossRef]
- Watanabe, H.; Kurose, R.; Hwang, S.M.; Akamatsu, F. Characteristics of flamelets in spray flames formed in a laminar counterflow. Combust. Flame 2007, 148, 234–248. [Google Scholar] [CrossRef]
- Wandel, A.P.; Chakraborty, N.; Mastorakos, E. Direct numerical simulations of turbulent flame expansion in fine sprays. Proc. Combust. Inst. 2009, 32, 2283–2290. [Google Scholar] [CrossRef]
- Schroll, P.; Wandel, A.P.; Cant, R.S.; Mastorakos, E. Direct numerical simulations of autoignition in turbulent two-phase flows. Proc. Combust. Inst. 2009, 32, 2275–2282. [Google Scholar] [CrossRef]
- Xia, J.; Luo, K.H. Direct numerical simulation of inert droplet effects on scalar dissipation rate in turbulent reacting and non-reacting shear layers. Flow Turbul. Combust. 2010, 84, 397–422. [Google Scholar] [CrossRef]
- Fujita, A.; Watanabe, H.; Kurose, R.; Komori, S. Two-dimensional direct numerical simulation of spray flames-Part 1: Effects of equivalence ratio, fuel droplet size and radiation, and validity of flamelet model. Fuel 2013, 104, 515–525. [Google Scholar] [CrossRef] [Green Version]
- Wandel, A.P. Influence of scalar dissipation on flame success in turbulent sprays with spark ignition. Combust. Flame 2014, 161, 2579–2600. [Google Scholar] [CrossRef]
- Neophytou, A.; Mastorakos, E.; Cant, R.S. DNS of spark ignition and edge flame propagation in turbulent droplet-laden mixing layers. Combust. Flame 2010, 157, 1071–1086. [Google Scholar] [CrossRef]
- Neophytou, A.; Mastorakos, E.; Cant, R.S. The internal structure of igniting turbulent sprays as revealed by complex chemistry DNS. Combust. Flame 2012, 159, 641–664. [Google Scholar] [CrossRef]
- Wacks, D.; Chakraborty, N.; Mastorakos, E. Flame structure and propagation in turbulent flame-droplet interaction: A Direct Numerical Simulation analysis. Flow Turbul. Combust. 2016, 96, 573–607. [Google Scholar] [CrossRef] [Green Version]
- Wacks, D.; Chakraborty, N. Flow topology and alignments of scalar gradients and vorticity in turbulent spray flames: A Direct Numerical Simulation analysis. Fuel 2016, 184, 922–947. [Google Scholar] [CrossRef] [Green Version]
- Ozel Erol, G.; Hasslberger, J.; Klein, M.; Chakraborty, N. A direct numerical simulation analysis of spherically expanding turbulent flames in fuel droplet-mists for an overall equivalence ratio of unity. Phys. Fluids 2018, 30, 086104. [Google Scholar] [CrossRef] [Green Version]
- Ozel Erol, G.; Hasslberger, J.; Klein, M.; Chakraborty, N. A Direct Numerical Simulation investigation of spherically expanding flames propagating in fuel droplet-mists for different droplet diameters and overall equivalence ratios. Combust. Sci. Technol. 2019, 191, 833–867. [Google Scholar] [CrossRef]
- Ozel Erol, G.; Hasslberger, J.; Klein, M.; Chakraborty, N. Propagation of spherically expanding turbulent flames into fuel droplet-mists. Flow Turb. Combust. 2019, 103, 913–941. [Google Scholar] [CrossRef]
- Pillai, A.L.; Kurose, R. Combustion noise analysis of a turbulent spray flame using a hybrid DNS/APE-RF approach. Combust. Flame 2019, 200, 168–191. [Google Scholar] [CrossRef]
- Turquand-d’Auzay, C.; Ahmed, U.; Pillai, A.; Chakraborty, N.; Kurose, R. Statistics of progress variable and mixture fraction gradients in an open turbulent jet spray flame. Fuel 2019, 247, 198–208. [Google Scholar] [CrossRef]
- Malkeson, S.; Ahmed, U.; Pillai, A.L.; Chakraborty, N.; Kurose, R. Evolution of Surface Density Function in an open turbulent jet spray flame. Flow Turbul. Combust. 2020. [Google Scholar] [CrossRef]
- Tarrazo, E.F.; Sánchez, A.L.; Liñán, A.; Williams, F.A. A simple one-step chemistry model for partially premixed hydrocarbon combustion. Combust. Flame 2006, 147, 32–38. [Google Scholar]
- Malkeson, S.P.; Chakraborty, N. Statistical analysis of displacement speed in turbulent stratified flames: A direct numerical simulation study. Combust. Sci. Technol. 2010, 182, 1841–1883. [Google Scholar] [CrossRef]
- Peters, N.; Terhoeven, P.; Chen, J.H.; Echekki, T. Statistics of Flame Displacement Speeds from Computations of 2-D Unsteady Methane-Air Flames. Proc. Combust. Inst. 1998, 27, 833–839. [Google Scholar] [CrossRef] [Green Version]
- Echekki, T.; Chen, J.H. Analysis of the Contribution of Curvature to Premixed Flame Propagation. Combust. Flame 1999, 118, 303–311. [Google Scholar] [CrossRef]
- Papapostolou VOzel-Erol, G.; Turquand d’Auzay, C.; Chakraborty, N. A Numerical Investigation of the Minimum Ignition Energy Requirement for Forced Ignition of Turbulent Droplet-laden Mixtures. Combust. Sci. Technol. 2020. [Google Scholar] [CrossRef]
- Ballal, D.R.; Lefebvre, A. Ignition and flame quenching of quiescent fuel mists. Proc. R. Soc. A Math. Phys. Eng. Sci. 1978, 364, 277–294. [Google Scholar]
- Ballal, D.R.; Lefebvre, A. Ignition and flame quenching of flowing heterogeneous fuel-air mixtures. Combust. Flame 1978, 35, 155–168. [Google Scholar] [CrossRef]
- Danis, A.M.; Namer, I.; Cernansky, N.P. Droplet size and equivalence ratio effects on spark ignition of monodisperse N-heptane and methanol sprays. Combust. Flame 1988, 74, 285–294. [Google Scholar] [CrossRef]
- Mikami, M.; Oyagi, H.; Kojima, N.; Wakashima, Y.; Kikuchi, M.; Yoda, S. Microgravity experiments on flame spread along fuel-droplet arrays at high temperatures. Combust. Flame 2006, 146, 391–406. [Google Scholar] [CrossRef]
- Wray, A.A. Minimal Storage Time Advanced Schemes for Spectral Methods; Report No. MS 202; NASA Ames Research Centre: Mountain View, CA, USA, 1990. [Google Scholar]
- Poinsot, T.; Lele, S.K. Boundary conditions for direct simulation of compressible viscous flows. J. Comp. Phys. 1992, 101, 104–129. [Google Scholar] [CrossRef]
- Rotexo-Softpredict-Cosilab, GmbH & Co. KG, Bad Zwischenahn. Germany, Cosilab. Collection, Version 3.0. 2009. Available online: www.SoftPredict.com (accessed on 15 June 2020).
- Neophytou, A.; Mastorakos, E. Simulations of laminar flame propagation in droplet mists. Combust. Flame 2009, 156, 1627–1640. [Google Scholar] [CrossRef]
- Taylor, G.I. Diffusion by continuous movements. Proc. Lond. Math. Soc. 1922, 20, 196–212. [Google Scholar] [CrossRef]
- Chakraborty, N.; Cant, S. Unsteady effects of strain rate and curvature on turbulent premixed flames in an inlet-outlet configuration. Combust. Flame 2004, 137, 129–147. [Google Scholar] [CrossRef]
- Chakraborty, N.; Hesse, H.; Mastorakos, E. Numerical investigation of edge flame propagation behaviour in an igniting turbulent planar jet. Combust. Sci. Technol. 2010, 182, 1747–1781. [Google Scholar] [CrossRef]
- Haruki, Y.; Pillai, A.L.; Kitano, T.; Kurose, R. Numerical investigation of flame propagation in fuel droplet arrays. At. Sprays 2018, 28, 357–388. [Google Scholar] [CrossRef]
- De Chaisemartin, S.; Fréret, L.; Kah, D.; Laurent, F.; Fox, R.; Reveillon, J. Eulerian models for turbulent spray combustion with polydispersity and droplet crossing. C R Mec. 2009, 337, 438–448. [Google Scholar] [CrossRef]
- Chiu, H.H.; Liu, T.M. Group combustion of liquid droplets. Combust. Sci. Technol. 1977, 17, 127–142. [Google Scholar] [CrossRef]
- Zhao, S.; Bouali, Z.; Mura, A. Computational investigation of weakly turbulent flame kernel growths in iso-octane droplet clouds in CVC conditions. Flow Turb. Combust. 2020, 104, 139–177. [Google Scholar] [CrossRef]
- Peters, N. Turbulent Combustion, Cambridge Monograph on Mechanics; Cambridge University Press: Cambridge, UK, 2000. [Google Scholar]
- Bray, K.N.C. Turbulent Flows with Premixed Reactants. In Turbulent Reacting Flows; Libby, P.A., Williams, F.A., Eds.; Springer: Berlin/Heidelberg, Germany, 1980; pp. 115–183. [Google Scholar]
- Lipatnikov, A.N.; Chomiak, J. Turbulent flame speed and thickness: Phenomenology, evaluation, and application in multi-dimensional simulations. Prog. Energy Combust. Sci. 2002, 28, 1–74. [Google Scholar] [CrossRef]
- Meneveau, C.; Poinsot, T. Stretching and quenching of flamelets in premixed turbulent combustion. Combust. Flame 1991, 86, 311–332. [Google Scholar] [CrossRef]
- Yamashita, H.; Shimada, M.; Takeno, T. A numerical study on flame stability at the transition point of jet diffusion flames. Proc. Combust. Inst. 1996, 26, 27–34. [Google Scholar] [CrossRef]
- Sanakaran, R.; Hawkes, E.R.; Chen, J.H.; Law, C.K. Structure of a spatially developing turbulent lean methane–air Bunsen flame. Proc. Combust. Inst. 2006, 31, 1291–1298. [Google Scholar] [CrossRef]
- Damköhler, G. Zeitschrift fur Elektrochemie und angewante physikalische. Chemie 1940, 46, 601–626. [Google Scholar]
- Chakraborty, N.; Cant, R. S Influence of Lewis Number on curvature effects in turbulent premixed flame propagation in the thin reaction zones regime. Phys. Fluids 2005, 17, 105105. [Google Scholar] [CrossRef]
- Chakraborty, N. Comparison of displacement speed statistics of turbulent premixed flames in the regimes representing combustion in corrugated flamelets and thin reaction zones. Phys. Fluids 2007, 19, 105109. [Google Scholar] [CrossRef]
- Echekki, T.; Chen, J.H. Unsteady strain rate and curvature effects in turbulent premixed methane-air flames. Combust. Flame 1996, 106, 184–202. [Google Scholar] [CrossRef]
Figure 1.
Instantaneous fields of gaseous equivalence ratio, on the central x-y midplane for initial with 5.0 (1st row) and 10 (2nd row) at . White lines illustrate = 0.1, 0.5 and 0.9 contours from outer to inner periphery and the droplets residing on the plane are indicated by grey dots (not to the scale).

Figure 2.
PDFs of in the region corresponding to 0.01 0.99 at different locations A, B and C (top to bottom) for initial ( ![Fluids 06 00001 i001]() ), 0.05 (
), 0.05 ( ![Fluids 06 00001 i002]() ) and 0.06 (
) and 0.06 ( ![Fluids 06 00001 i003]() ) with 5.0 (continuous line) and 10.0 (dashed line).
) with 5.0 (continuous line) and 10.0 (dashed line).
 ), 0.05 (
  ) and 0.06 (
  ) with 5.0 (continuous line) and 10.0 (dashed line).
Figure 2.
PDFs of in the region corresponding to 0.01 0.99 at different locations A, B and C (top to bottom) for initial ( ![Fluids 06 00001 i001]() ), 0.05 (
), 0.05 ( ![Fluids 06 00001 i002]() ) and 0.06 (
) and 0.06 ( ![Fluids 06 00001 i003]() ) with 5.0 (continuous line) and 10.0 (dashed line).
) with 5.0 (continuous line) and 10.0 (dashed line).
), 0.05 ( ) and 0.06 ( ) with 5.0 (continuous line) and 10.0 (dashed line).
Figure 3.
PDFs of conditional on at different locations A, B and C (top to bottom) for initial ( ![Fluids 06 00001 i004]() ), 0.05 (
), 0.05 ( ![Fluids 06 00001 i005]() ) and 0.06 (
) and 0.06 ( ![Fluids 06 00001 i006]() ) with 5.0 (solid line) and 10.0 (dashed line).
) with 5.0 (solid line) and 10.0 (dashed line).
 ), 0.05 (
  ) and 0.06 (
  ) with 5.0 (solid line) and 10.0 (dashed line).
Figure 3.
PDFs of conditional on at different locations A, B and C (top to bottom) for initial ( ![Fluids 06 00001 i004]() ), 0.05 (
), 0.05 ( ![Fluids 06 00001 i005]() ) and 0.06 (
) and 0.06 ( ![Fluids 06 00001 i006]() ) with 5.0 (solid line) and 10.0 (dashed line).
) with 5.0 (solid line) and 10.0 (dashed line).
), 0.05 ( ) and 0.06 ( ) with 5.0 (solid line) and 10.0 (dashed line).
Figure 4.
Contours of 0.1 (solid line), 0.5 (dashed line) and 0.9 (dotted line) contours for gaseous premixed ( ![Fluids 06 00001 i007]() ) case and droplet cases with initial droplet diameter (
) case and droplet cases with initial droplet diameter ( ![Fluids 06 00001 i008]() ), 0.05 (
), 0.05 ( ![Fluids 06 00001 i009]() ) and 0.06 (
) and 0.06 ( ![Fluids 06 00001 i010]() ) with 5.0 (left) and 10.0 (right). The dashed grey lines show the sampling locations (A, B, C from left to right), and the dotted black line shows the flame centre.
) with 5.0 (left) and 10.0 (right). The dashed grey lines show the sampling locations (A, B, C from left to right), and the dotted black line shows the flame centre.
 ) case and droplet cases with initial droplet diameter (
  ), 0.05 (
  ) and 0.06 (
  ) with 5.0 (left) and 10.0 (right). The dashed grey lines show the sampling locations (A, B, C from left to right), and the dotted black line shows the flame centre.
Figure 4.
Contours of 0.1 (solid line), 0.5 (dashed line) and 0.9 (dotted line) contours for gaseous premixed ( ![Fluids 06 00001 i007]() ) case and droplet cases with initial droplet diameter (
) case and droplet cases with initial droplet diameter ( ![Fluids 06 00001 i008]() ), 0.05 (
), 0.05 ( ![Fluids 06 00001 i009]() ) and 0.06 (
) and 0.06 ( ![Fluids 06 00001 i010]() ) with 5.0 (left) and 10.0 (right). The dashed grey lines show the sampling locations (A, B, C from left to right), and the dotted black line shows the flame centre.
) with 5.0 (left) and 10.0 (right). The dashed grey lines show the sampling locations (A, B, C from left to right), and the dotted black line shows the flame centre.
) case and droplet cases with initial droplet diameter ( ), 0.05 ( ) and 0.06 ( ) with 5.0 (left) and 10.0 (right). The dashed grey lines show the sampling locations (A, B, C from left to right), and the dotted black line shows the flame centre.
Figure 5.
PDFs of conditional on isosurfaces at different locations A, B and C (top to bottom) for initial ( ![Fluids 06 00001 i011]() ), 0.05 (
), 0.05 ( ![Fluids 06 00001 i012]() ) and 0.06 (
) and 0.06 ( ![Fluids 06 00001 i013]() ) with 5.0 (solid line) and 10.0 (dashed line).
) with 5.0 (solid line) and 10.0 (dashed line).
 ), 0.05 (
  ) and 0.06 (
  ) with 5.0 (solid line) and 10.0 (dashed line).
Figure 5.
PDFs of conditional on isosurfaces at different locations A, B and C (top to bottom) for initial ( ![Fluids 06 00001 i011]() ), 0.05 (
), 0.05 ( ![Fluids 06 00001 i012]() ) and 0.06 (
) and 0.06 ( ![Fluids 06 00001 i013]() ) with 5.0 (solid line) and 10.0 (dashed line).
) with 5.0 (solid line) and 10.0 (dashed line).
), 0.05 ( ) and 0.06 ( ) with 5.0 (solid line) and 10.0 (dashed line).
Figure 6.
Instantaneous views of isosurface coloured with values for gaseous premixed and spray flames with initial for 5.0 (1st row) and 10.0 (2nd row) at .
Figure 6.
Instantaneous views of isosurface coloured with values for gaseous premixed and spray flames with initial for 5.0 (1st row) and 10.0 (2nd row) at .

Figure 7.
PDFs of of the isosurface at locations A, B and C (top to bottom) for gaseous premixed ( ![Fluids 06 00001 i014]() ) and V-shaped spray flames with initial (
) and V-shaped spray flames with initial ( ![Fluids 06 00001 i015]() ), 0.05 (
), 0.05 ( ![Fluids 06 00001 i016]() ) and 0.06 (
) and 0.06 ( ![Fluids 06 00001 i017]() ) for 5.0 (continuous line) and 10.0 (dashed line). The y-axis is shown in log-scale.
) for 5.0 (continuous line) and 10.0 (dashed line). The y-axis is shown in log-scale.
 ) and V-shaped spray flames with initial (
  ), 0.05 (
  ) and 0.06 (
  ) for 5.0 (continuous line) and 10.0 (dashed line). The y-axis is shown in log-scale.
Figure 7.
PDFs of of the isosurface at locations A, B and C (top to bottom) for gaseous premixed ( ![Fluids 06 00001 i014]() ) and V-shaped spray flames with initial (
) and V-shaped spray flames with initial ( ![Fluids 06 00001 i015]() ), 0.05 (
), 0.05 ( ![Fluids 06 00001 i016]() ) and 0.06 (
) and 0.06 ( ![Fluids 06 00001 i017]() ) for 5.0 (continuous line) and 10.0 (dashed line). The y-axis is shown in log-scale.
) for 5.0 (continuous line) and 10.0 (dashed line). The y-axis is shown in log-scale.
) and V-shaped spray flames with initial ( ), 0.05 ( ) and 0.06 ( ) for 5.0 (continuous line) and 10.0 (dashed line). The y-axis is shown in log-scale.
Figure 8.
Percentage of heat release arising from premixed (for initial ( ![Fluids 06 00001 i018]() ), 0.05 (
), 0.05 ( ![Fluids 06 00001 i019]() ), 0.06 (
), 0.06 ( ![Fluids 06 00001 i020]() )) and non-premixed (for initial (
)) and non-premixed (for initial ( ![Fluids 06 00001 i021]() ), 0.05 (
), 0.05 ( ![Fluids 06 00001 i022]() ), 0.06 (
), 0.06 ( ![Fluids 06 00001 i023]() )) modes of combustion for 5.0 (1st row) and 10.0 (2nd row) at locations A, B and C (left to right).
)) modes of combustion for 5.0 (1st row) and 10.0 (2nd row) at locations A, B and C (left to right).
 ), 0.05 (
  ), 0.06 (
  )) and non-premixed (for initial (
  ), 0.05 (
  ), 0.06 (
  )) modes of combustion for 5.0 (1st row) and 10.0 (2nd row) at locations A, B and C (left to right).
Figure 8.
Percentage of heat release arising from premixed (for initial ( ![Fluids 06 00001 i018]() ), 0.05 (
), 0.05 ( ![Fluids 06 00001 i019]() ), 0.06 (
), 0.06 ( ![Fluids 06 00001 i020]() )) and non-premixed (for initial (
)) and non-premixed (for initial ( ![Fluids 06 00001 i021]() ), 0.05 (
), 0.05 ( ![Fluids 06 00001 i022]() ), 0.06 (
), 0.06 ( ![Fluids 06 00001 i023]() )) modes of combustion for 5.0 (1st row) and 10.0 (2nd row) at locations A, B and C (left to right).
)) modes of combustion for 5.0 (1st row) and 10.0 (2nd row) at locations A, B and C (left to right).
), 0.05 ( ), 0.06 ( )) and non-premixed (for initial ( ), 0.05 ( ), 0.06 ( )) modes of combustion for 5.0 (1st row) and 10.0 (2nd row) at locations A, B and C (left to right).
Figure 9.
Variations of mean values of (solid line), (line with circle marker), (dotted line), (triangle marker), (dashed line) and (cross) conditional on for premixed gaseous ( ![Fluids 06 00001 i024]() ) and droplet cases with initial (
) and droplet cases with initial ( ![Fluids 06 00001 i025]() ), 0.05 (
), 0.05 ( ![Fluids 06 00001 i026]() ) and 0.06 (
) and 0.06 ( ![Fluids 06 00001 i027]() ) for 5.0 (1st column) and 10.0 (2nd column) at locations A, B, C (top to bottom). All terms are normalised by .
) for 5.0 (1st column) and 10.0 (2nd column) at locations A, B, C (top to bottom). All terms are normalised by .
 ) and droplet cases with initial (
  ), 0.05 (
  ) and 0.06 (
  ) for 5.0 (1st column) and 10.0 (2nd column) at locations A, B, C (top to bottom). All terms are normalised by .
Figure 9.
Variations of mean values of (solid line), (line with circle marker), (dotted line), (triangle marker), (dashed line) and (cross) conditional on for premixed gaseous ( ![Fluids 06 00001 i024]() ) and droplet cases with initial (
) and droplet cases with initial ( ![Fluids 06 00001 i025]() ), 0.05 (
), 0.05 ( ![Fluids 06 00001 i026]() ) and 0.06 (
) and 0.06 ( ![Fluids 06 00001 i027]() ) for 5.0 (1st column) and 10.0 (2nd column) at locations A, B, C (top to bottom). All terms are normalised by .
) for 5.0 (1st column) and 10.0 (2nd column) at locations A, B, C (top to bottom). All terms are normalised by .
) and droplet cases with initial ( ), 0.05 ( ) and 0.06 ( ) for 5.0 (1st column) and 10.0 (2nd column) at locations A, B, C (top to bottom). All terms are normalised by .
Figure 10.
The mean values of and on the isosurface at locations A–C for the cases with 5.0 (1st column) and 10.0 (2nd column).
Figure 10.
The mean values of and on the isosurface at locations A–C for the cases with 5.0 (1st column) and 10.0 (2nd column).


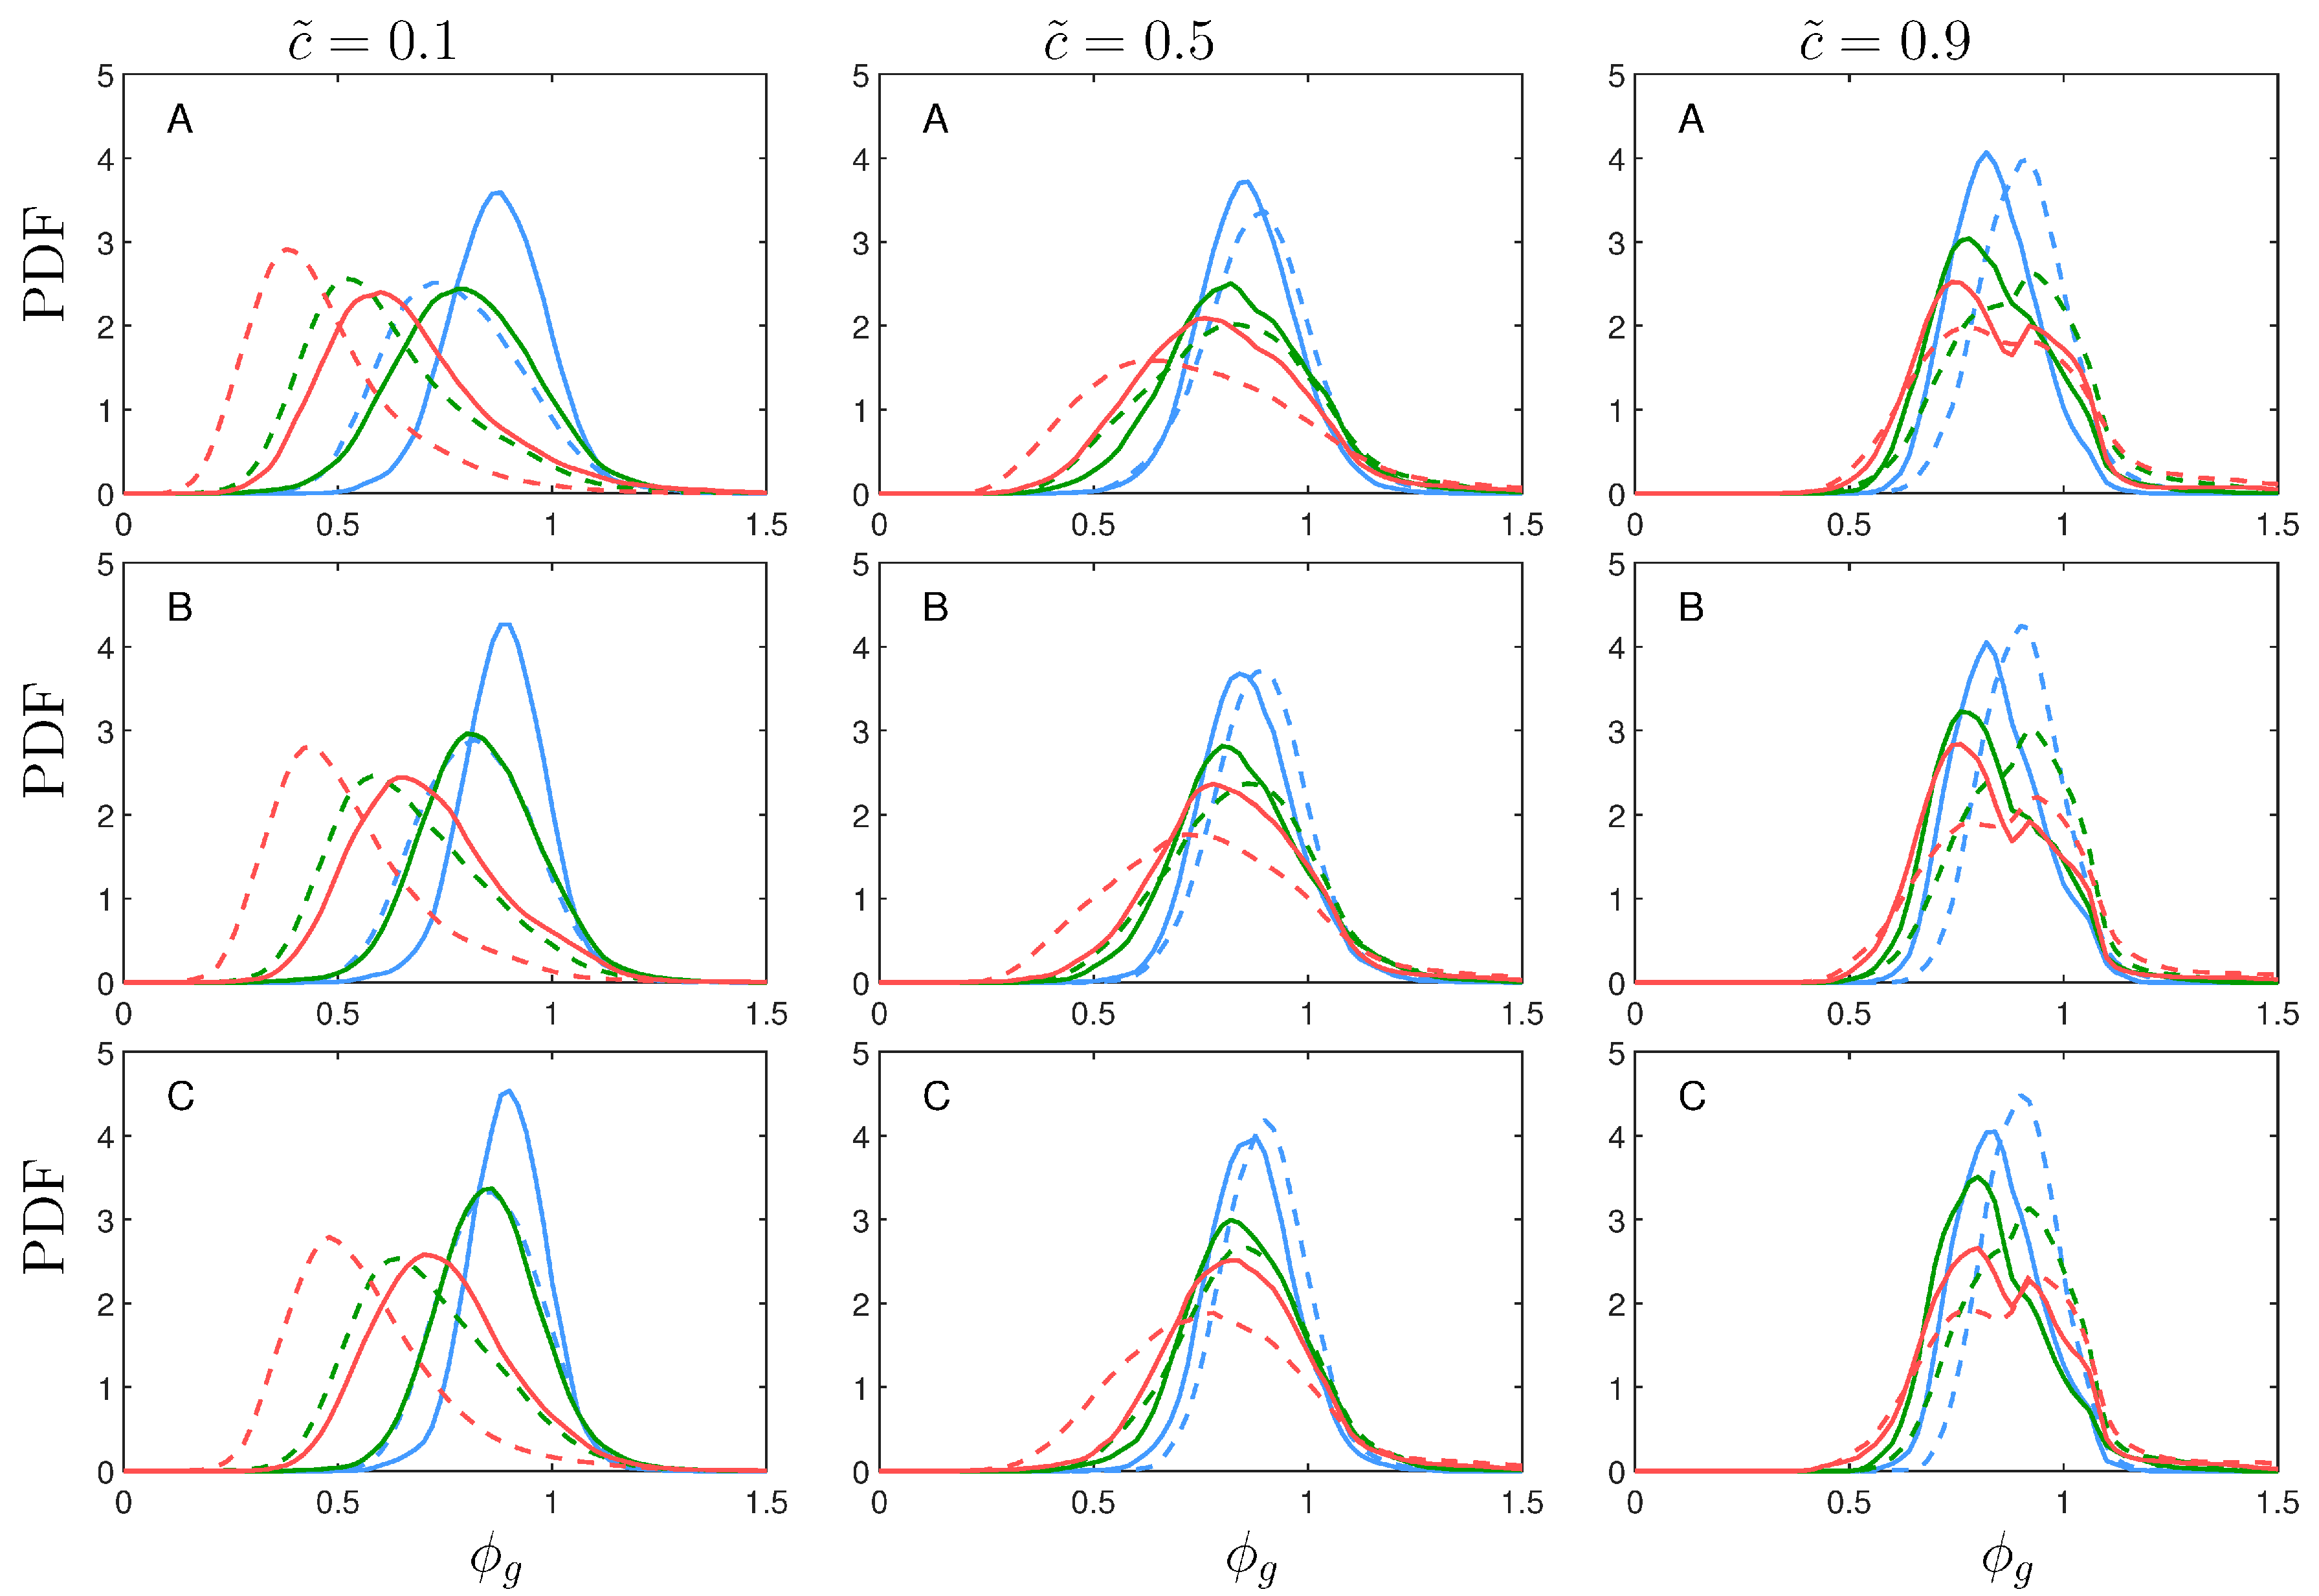
Table 1.
Flame brush thickness at locations A, B and C.
| Case | Gaseous Premixed Flame | ||||
|---|---|---|---|---|---|
| 5.0 | at A | 3.14 | 3.45 | 3.38 | 3.23 |
| at B | 3.34 | 4.13 | 4.00 | 3.75 | |
| at C | 3.70 | 4.50 | 4.40 | 4.06 | |
| at A | 3.04 | 3.50 | 3.33 | 3.18 | |
| at B | 3.12 | 4.27 | 4.12 | 3.83 | |
| at C | 3.35 | 4.79 | 4.97 | 4.35 | |
| at A | 2.47 | 2.82 | |||
| at B | 2.34 | 3.28 | |||
| at C | 2.37 | 3.84 | |||
| 10.0 | at A | 2.01 | 2.08 | 2.35 | 2.45 |
| at B | 2.27 | 2.31 | 2.66 | 2.77 | |
| at C | 2.51 | 2.56 | 2.84 | 2.93 | |
| at A | 1.90 | 1.96 | 2.19 | 2.29 | |
| at B | 2.28 | 2.21 | 2.62 | 2.63 | |
| at C | 2.63 | 2.46 | 2.85 | 2.84 | |
| at A | 1.62 | 1.72 | |||
| at B | 1.87 | 1.90 | |||
| at C | 2.13 | 2.09 |
Table 2.
Flame angle (i.e., the angle the tangent on the isosurface at a given location makes with the midline) for isosurfaces.
Table 2.
Flame angle (i.e., the angle the tangent on the isosurface at a given location makes with the midline) for isosurfaces.
| Case | Gaseous Premixed Flame | ||||
|---|---|---|---|---|---|
| 5.0 | Flame angle for at A | 16.1° | 20.5° | 20.4° | 18.9° |
| Flame angle for at B | 13.6° | 15.8° | 16.1° | 14.8° | |
| Flame angle for at C | 17.1° | 15.5° | 16.6° | 17.0° | |
| Flame angle for at A | 14.7° | 14.7° | 14.4° | 11.7° | |
| Flame angle for at B | 7.2° | 12.1° | 12.1° | 15.4° | |
| Flame angle for at C | 11.0° | 13.0° | 14.4° | 15.0° | |
| Flame angle for at A | 13.5° | 9.8° | 11.2° | 11.6° | |
| Flame angle for at B | 10.6° | 9.3° | 10.0° | 9.5° | |
| Flame angle for at C | 10.5° | 9.6° | 10.2° | 12.2° | |
| 10.0 | Flame angle for at A | 16.7° | 13.8° | 14.1° | 13.4° |
| Flame angle for at B | 12.0° | 9.9° | 10.1° | 9.5° | |
| Flame angle for at C | 12.7° | 11.9° | 10.1° | 9.7° | |
| Flame angle for at A | 14.0° | 11.5° | 11.0° | 10.7° | |
| Flame angle for at B | 9.7° | 8.2° | 8.1° | 7.3° | |
| Flame angle for at C | 11.0° | 9.7° | 9.4° | 8.6° | |
| Flame angle for at A | 12.4° | 9.8° | 8.8° | 8.8° | |
| Flame angle for at B | 8.7° | 7.2° | 6.8° | 6.3° | |
| Flame angle for at A | 9.4° | 7.7° | 7.9° | 6.8° |
Table 3.
Time averaged normalised values of , and S and turbulent burning velocity based on the surface area for and 0.5 isosurfaces.
Table 3.
Time averaged normalised values of , and S and turbulent burning velocity based on the surface area for and 0.5 isosurfaces.
| Gaseous Premixed Flame | 0.04 | 0.05 | 0.06 | ||
|---|---|---|---|---|---|
| 5.0 | / | 1797 | 1722 | 1684 | 1708 |
| / | 1600 | 1494 | 1499 | 1498 | |
| / | 1495 | 1404 | 1408 | 1413 | |
| / | 1432 | 1350 | 1354 | 1358 | |
| 118 | 75 | 68 | 58 | ||
| 1.06 | 0.77 | 0.71 | 0.60 | ||
| 1.19 | 0.88 | 0.80 | 0.69 | ||
| 1.27 | 0.94 | 0.85 | 0.73 | ||
| 10.0 | / | 1554 | 1490 | 1526 | 1665 |
| / | 1487 | 1419 | 1422 | 1425 | |
| / | 1436 | 1370 | 1372 | 1374 | |
| / | 1385 | 1336 | 1336 | 1337 | |
| 102 | 64 | 59 | 53 | ||
| 1.05 | 0.74 | 0.68 | 0.56 | ||
| 1.10 | 0.78 | 0.73 | 0.65 | ||
| 1.14 | 0.80 | 0.76 | 0.68 |
Publisher’s Note: MDPI stays neutral with regard to jurisdictional claims in published maps and institutional affiliations. |
© 2020 by the authors. Licensee MDPI, Basel, Switzerland. This article is an open access article distributed under the terms and conditions of the Creative Commons Attribution (CC BY) license (http://creativecommons.org/licenses/by/4.0/).
Share and Cite
MDPI and ACS Style
Ozel Erol, G.; Chakraborty, N. Effects of Mean Inflow Velocity and Droplet Diameter on the Propagation of Turbulent V-Shaped Flames in Droplet-Laden Mixtures. Fluids 2021, 6, 1. https://0-doi-org.brum.beds.ac.uk/10.3390/fluids6010001
AMA Style
Ozel Erol G, Chakraborty N. Effects of Mean Inflow Velocity and Droplet Diameter on the Propagation of Turbulent V-Shaped Flames in Droplet-Laden Mixtures. Fluids. 2021; 6(1):1. https://0-doi-org.brum.beds.ac.uk/10.3390/fluids6010001
Chicago/Turabian StyleOzel Erol, Gulcan, and Nilanjan Chakraborty. 2021. "Effects of Mean Inflow Velocity and Droplet Diameter on the Propagation of Turbulent V-Shaped Flames in Droplet-Laden Mixtures" Fluids 6, no. 1: 1. https://0-doi-org.brum.beds.ac.uk/10.3390/fluids6010001