1. Introduction
Droplet impingement onto a target surface is a fundamental approach to mimicking modern and sophisticated engineering applications in thermal-fluid engineering, such as thermal management of electronic packaging [
1], data center cooling [
2], spray cooling and jet impingement [
3,
4], fuel spraying [
5], and drop-on-demand studies [
6,
7]. There are two types of droplet impingement techniques, which are single droplet impingement and droplet train impingement [
8]. Single droplet impingement is the established way to observe rebounding, oscillation, wettability (on the target surface), the impact of coating, and the impact of the surface slope and elevation by focusing on the boiling behaviors related to the heat fluxes, evaporation rate, etc. [
9,
10,
11]. However, the real interactions between the liquid and the target surface are more complicated than the represented cases of single droplet impingement as the liquid flow is continuous and multiple, which results in different scenarios, such as steady, transient, and pseudo-transient flows. Therefore, droplet train impingement has a wider perspective to consider the mentioned complex interactions because it provides multiple and continuous flows on the target surface. Thereby, more detailed investigations, such as observing the spreading diameter, crown rim formation, and splashing angle, can be performed [
12,
13,
14]. Regarding this fact, there is a considerable amount of work related to droplet train impingement.
There are two main flow characteristics in droplet train impingement studies: the Weber number (
) and the Reynolds number (
). The Weber number is the ratio of inertia to surface tension. The inertia is defined by the liquid density, characteristic velocity, and characteristic length. Using the
, the break-up and coalescence of the droplets can be quantified to help with the parametric settings of experimental studies. The Reynolds number is the ratio of the inertial forces to viscous forces for quantifying the turbulent flows. Both
and
are defined in Equations (1) and (2), respectively.
where
is the liquid density,
is the surface tension,
is the average diameter of the droplet in the air,
is the surface tension of the liquid, and
is the dynamic viscosity of the liquid.
One of the cornerstones in this area was presented by Yarin and Weiss [
8], who described the experimental behavior of ethanol droplet train impingement on a hot surface while explaining the theoretical fundamentals of the boiling phenomenon. It was seen that the experimental results were in good agreement with the defined theory. The reason behind selecting the ethanol was its lower surface tension and boiling point compared to water, which made the boiling observation more observable at lower surface temperatures. However, water is also one of the most preferred liquids in droplet train impingement studies. Gradeck et al. [
15] focused on the surface temperature range of 250.00–675.00 °C to observe the boiling behavior of water droplet train impingement above the Leidenfrost point. They preferred a very low
value: lower than 30.00. Li et al. [
16] also preferred a low
study, below 200.00, by focusing on the impact of different droplet frequencies and
values. The impact of frequency was found to be negligible, but changes in the contact angle and the
values were found to be noteworthy in the boiling trends of water droplet train impingement. Another low
(<200.00) study was conducted by Dunand et al. [
17] by impinging a water droplet train onto a surface that had a temperature value above the Leidenfrost point. Besides the hydrodynamic trends (e.g., splashing, crater formation, etc.), the temperature field was also observed via a thermographic camera within the impinging area and for the splashed droplets. That study was one of the first works aimed at the combined investigation of the thermal and hydrodynamic behaviors of a droplet train.
HFE-7100 is another preferred liquid in droplet train applications as it is widely used in the thermal management of electronic packaging and data center cooling, where the droplet train impingement method can closely mimic the heat transfer characteristics. Zhang et al. carried out single droplet train [
18] and multiple droplet train [
19] impingement studies to observe the crater and crown formation together. In a single droplet train impingement study with a
range of 270.00–600.00 [
18], they were able to improve the given theory by Yarin and Weiss [
8] by adding the velocity distribution and the liquid film thickness, which became more prominent at higher
values, into the theory. In the multiple droplet train impingement study [
19], the surface temperature was lower than the boiling point, and the main focus was the hydrodynamic patterns of the multiple droplet train. Considering that each train impingement created a unique crater, a hump was observed between craters. The heat transfer rate increased when the spacing between the craters became greater. The heat transfer rate calculations were performed by analyzing the thermographic camera data. When the number of droplet trains increased from two to six, hydrodynamic pattern observation became more difficult as the supplied liquid amount significantly increased. The main outcome was that the global heat transfer rate increased by raising the spacing between the craters, whilst the local heat transfer rate showed the opposite trends in hexagonal-arranged droplet train studies. In the
range of 262.00–850.00, droplet train impingement studies were performed with high-frequency values [
20,
21]. It was deduced that the droplets produced radial momentum; hereby, the maximum heat transfer rate was observed in the crown propagation region. Compared to low-frequency and low-
studies, the high-frequency and high-
experiments have more complicated hydrodynamic trends and droplet–surface interactions. Thermal investigations were not only performed with thermographic cameras but also with numerical studies. Trujillo et al. [
22,
23] presented a numerical model for thermal boundary layer analysis during the droplet train impingement of HFE-7100. Computational simulations were designed for
values below 300.00, and the main focus was a better understanding of heat transfer trends. The numerical simulations showed that the crater walls behaved like barriers between the inside and outside regions of the crater, where the inside region had a higher heat transfer rate. Additionally, it was obtained that the heat transfer was a single-phase mechanism between the wall surface and the accumulated liquid (also called liquid film) at the current conditions. The increase in the surface temperature can provide a two-phase heat transfer mechanism between the wall surface and the liquid film.
In addition to the above-mentioned efforts, several studies were performed in our research group via water and ethanol droplet train impingement setups. Liu et al. [
24,
25,
26] applied water droplet train impingement on a hot surface up to 246.00 °C for observing the spreading diameter, splashing angles, and jumps of the secondary droplets on the target surface. Another study by Liu et al. [
27] developed a statistical analysis approach for the main droplet and the splashed droplets from the hot surface. Kanbur et al. [
28,
29] observed the transient hydrodynamic patterns of ethanol droplet train impingement at high-
values. They defined the spreading diameter and the splashing angle trends on a glass surface during the transient period. Shen et al. [
30] also applied ethanol droplet train impingement, but the main focus was to see the impact of a nanotube coating on a titanium surface under steady conditions. The vast majority of those studies were vertical water droplet train impingement studies, except for a small section in Ref. [
26] that applied the droplet train with three different impact angles. It was seen that there were no significant changes in the spreading diameter when the impact angles changed, but the decrease in the impact angle increased the splashing angle and made the splashing phenomenon observable even at high surface temperatures. Recently, Kanbur et al. [
31,
32] experimentally observed the hydrodynamic patterns and thermal gradients of inclined ethanol droplet train impingement on an aluminum target surface and then compared it with the gradients on a glass surface. It was inferred that the aluminum surface had a significantly better evaporation rate than the glass surface, so that the thermal gradients were more uniform on the aluminum surface as the thermal conductivity of aluminum is dramatically higher than the thermal conductivity of glass, which also provided smaller spreading lengths. In those studies [
31,
32], the aim was also to create a non-uniform temperature distribution on a hot aluminum surface before the impingement, but it was not very successful as the aluminum had a very high thermal conductivity and therefore the surface quickly became uniform.
Following recent trends and applications in the area, the main contribution of this study is to create a temperature non-uniformity on the target surface by investigating the hydrodynamic patterns and the thermal gradients when droplet train impingement is applied with an inclined flow at steady conditions. The following contributions can be given as follows: (i) inclined ethanol droplet train impingement is applied with three different values at high frequency, which has not been performed previously as far as we know; (ii) hydrodynamic patterns and thermal gradients are observed at the same time using an optical camera and a thermographic camera together; (iii) a small temperature gradient is achieved on the glass surface before the impingement, which is preferred because many real applications have temperature non-uniformity on the target surface.
2. Experimental Setup
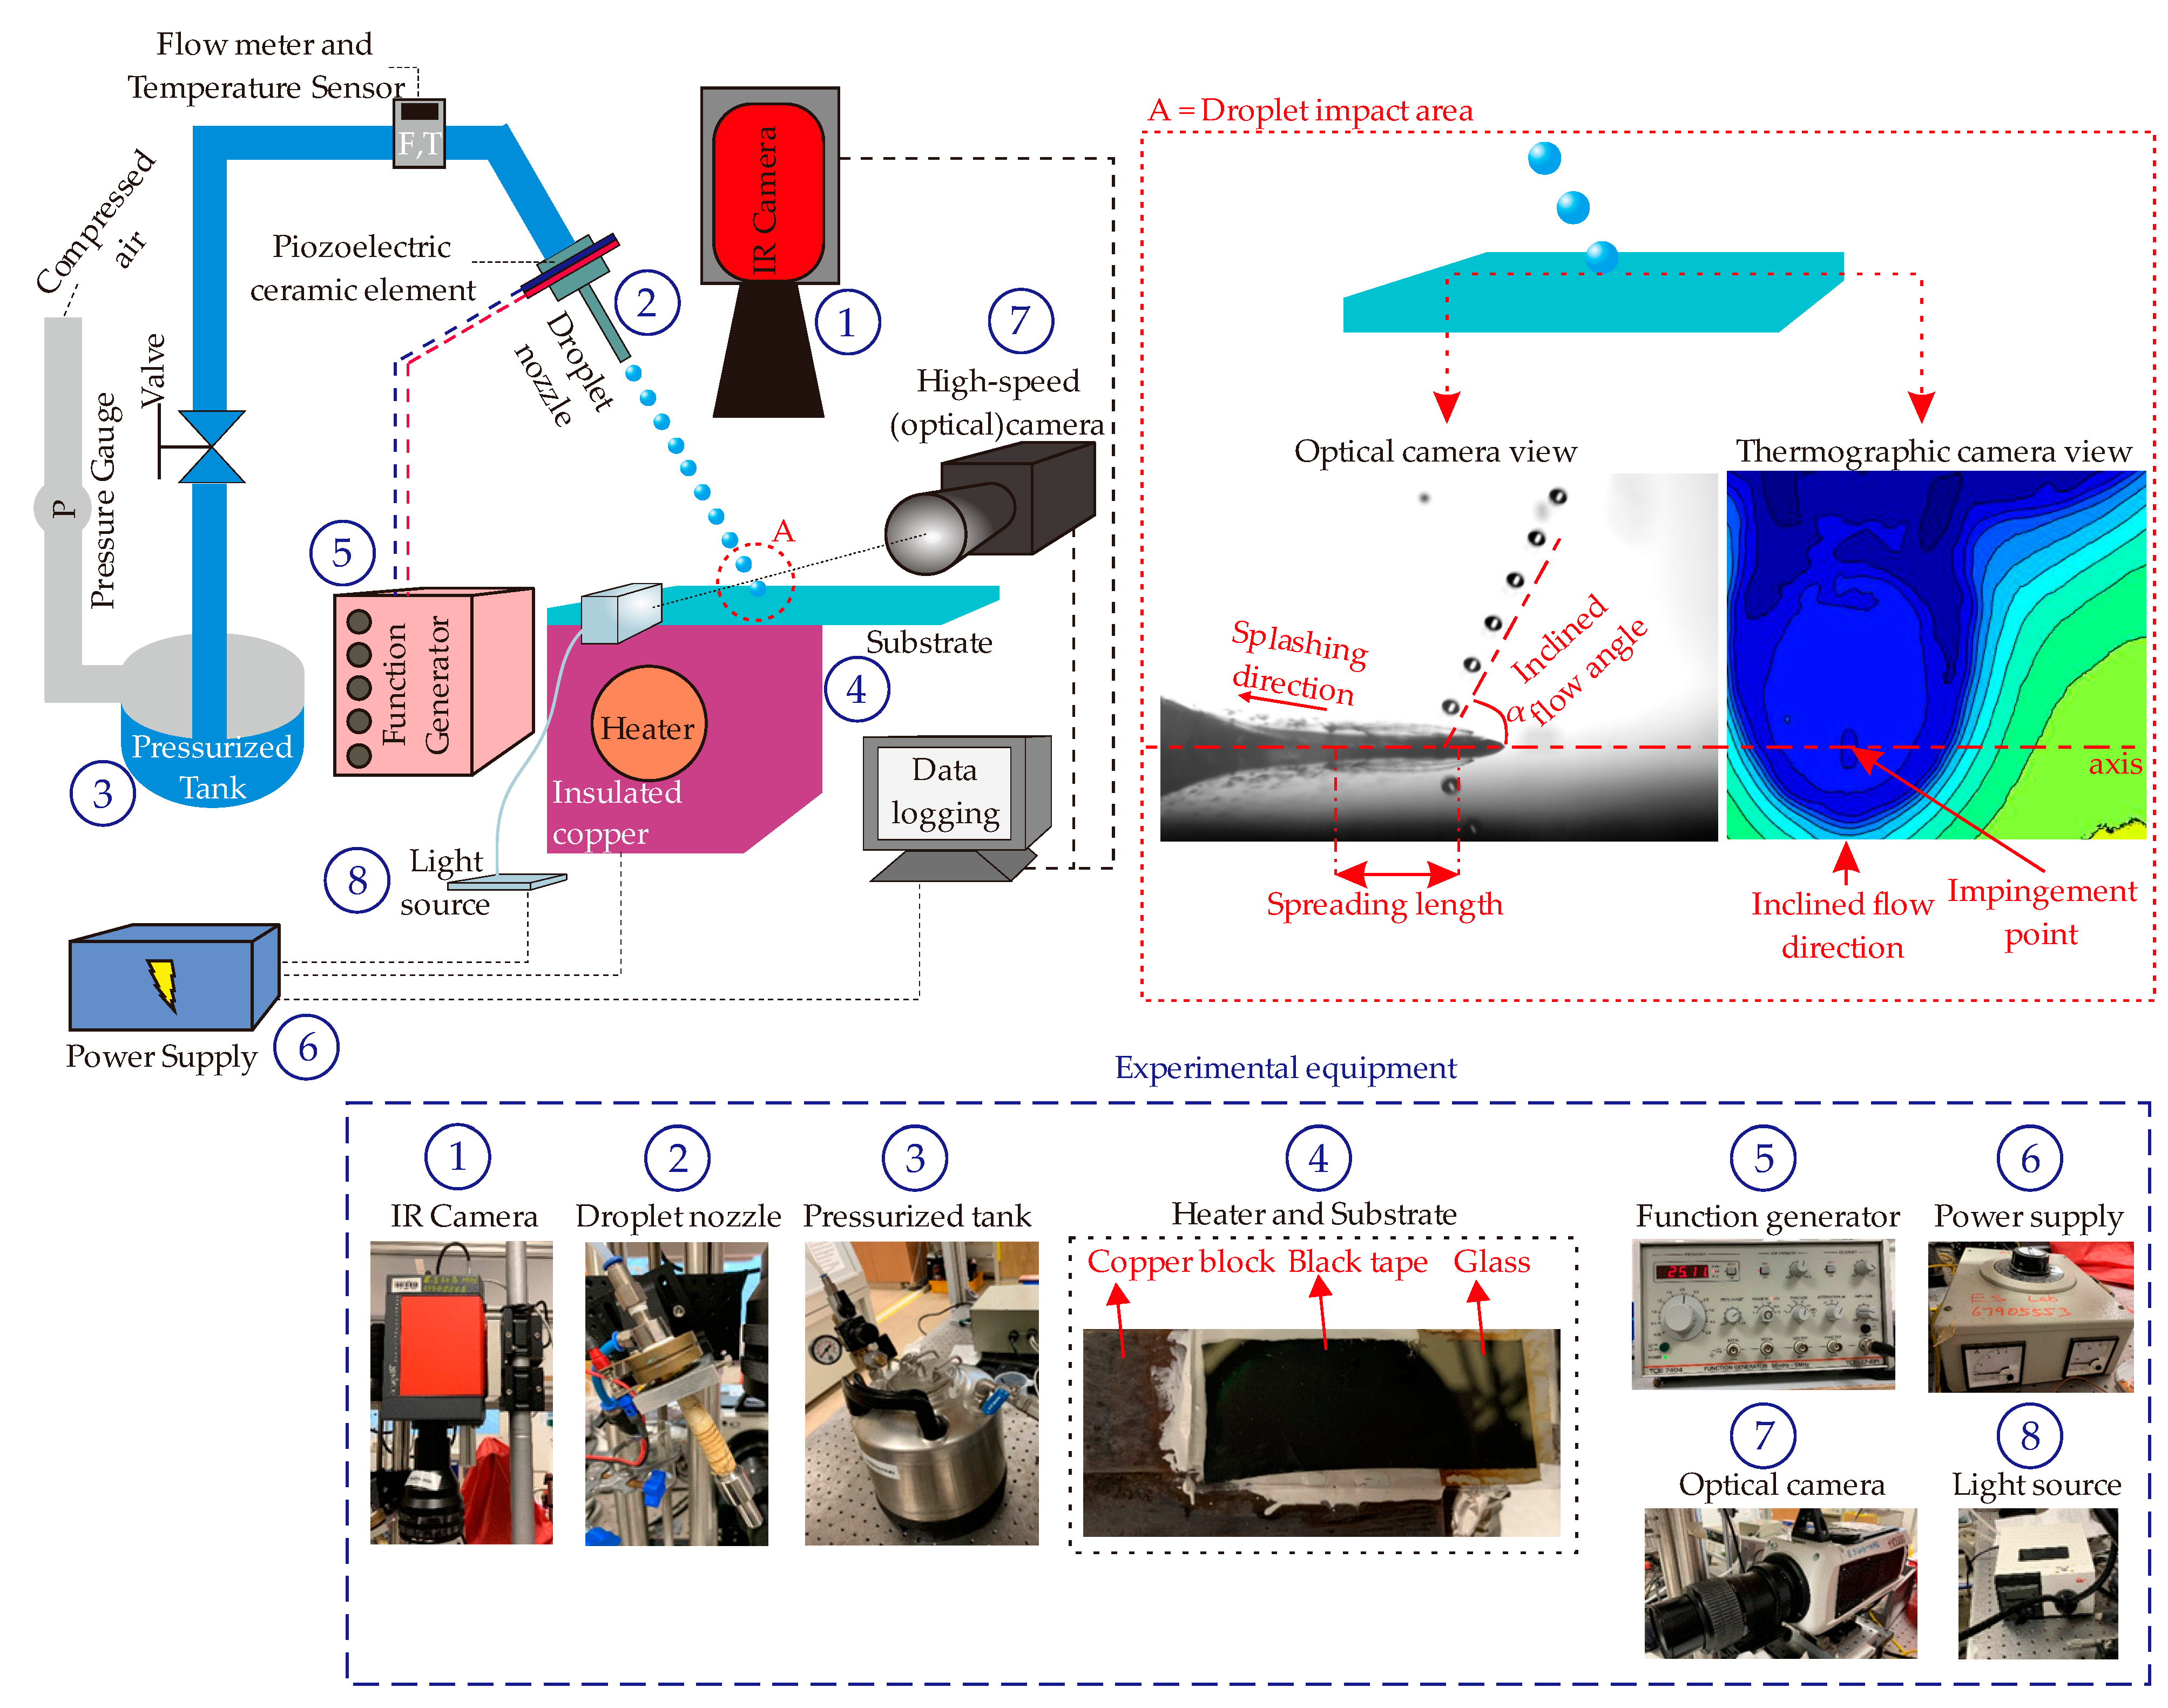
A simplified view of the experimental setup is shown in
Figure 1. The ethanol liquid was stored in a stainless-steel tank. It was pressurized via a compressed air stream up to 10 bar. In the experiments, compressed air with a pressure of 2 bar was used to send the ethanol (purity ≥ 99.9%; density 789.00 kg/m
3; surface tension 0.022 N/m; dynamic viscosity 0.012 Pa·s; saturation temperature 78.40 °C, Sigma-Aldrich, St. Louis, MO, USA) from the tank to the droplet generator. A flow meter and a temperature sensor were located between the droplet generator and the tank to continuously measure the flow rate and the temperature. The ethanol temperature was kept constant at 26.00 °C, which was also the room temperature where the experiments were conducted. The droplet generator (FMP Technology GmbH, Erlangen, Germany) was coupled with a piezoelectric element that was connected to a function generator. The generated high frequencies in the generator produced successive ethanol droplets from the coupled droplet generator–piezoelectric element component. The nozzle part of the droplet generator was stainless-steel, and the size of the generated droplet was controlled by an orifice-like element called a pinhole. Different from previous studies in the literature, the droplet train impinged on the surface with an incline of 63.00 degrees. The inclined droplet train impingement process became steady after the first 100 ms. A glass substrate was selected as a target surface because there are a considerable amount of engineering cases where the ethanol and the glass are coupled as the liquid and the surface [
28,
29,
30]. The inclined droplet train impinged on a single point, where it behaved like a point heat sink in the experiments. The droplet impact area and the inclined flow direction are also shown in
Figure 1.
Furthermore, to create a temperature gradient on the target surface, the glass was heated from one side while the other side was open to the ambient environment. There was no uniform temperature on the glass surface, which was one of our main goals, as temperature gradients on the target surface are a reality in many engineering applications. The heating of the glass was performed by using a copper block with a cartridge heater inside. The copper block was well insulated. The impingement was monitored via an optical camera (Phantom V711, 1024 × 512 resolution, images with 14,000 frames per second, 1 μs exposure time, and Canon MP-E 65 lens with 2× magnification) and a thermographic camera (ImageIR
® 8300, Infratech, Dresden, Germany, 640 × 512 resolution) at the same time. It is worth noting that the thermographic camera was not a high-speed camera, unlike the optical camera, so the optical camera recorded the video while the thermographic camera captured images when the impingement point (on the surface) reached the target temperature. To collect accurate surface temperature data on the glass surface, the bottom side of the glass was covered with black tape, which minimized the reflection. Additionally, focusing on the droplet train impingement point, the temperature data were collected via the thermographic camera and a thermocouple; the temperature values were then compared to each other to avoid misreading and minimize uncertainty. The thermographic camera was calibrated before using it in the experiments. For the experimental investigation, the spreading length and the splashing angle were selected as the main focuses. When the droplet train impinged onto the target surface, an impact area (crater region) occurred. In vertical droplet train impingement studies, that area can be characterized by the spreading diameter as the impact area has a circular shape [
28,
29,
33]. However, in the inclined flows, the impact area becomes more elliptical so that the spreading length is preferred to characterize the impact of the droplet train [
31,
32]. In addition, a splashing phenomena occurs when the surface energy levels become high enough; thus, splashing trends are also focused on in this study. Both the spreading length and the splashing can be seen in
Figure 1. Following the experimental procedure, three different droplet trains were generated; each train type was titled as a unique experiment (Exp.), and their characteristics can be seen in
Table 1.
Image and Data Analysis
The experimental setup provided two different media: (i) a video record of the droplet train impingement using an optical camera and (ii) a thermal image of the moment the droplet train impinged on the target surface at the desired surface temperature. In the study, an experimental investigation was performed with a surface temperature of 85.00 °C to 200.00 °C. Unlike the previous works performed at uniform surface temperatures, the current study aimed to create a thermal gradient on the target surface by heating the glass only from one side while the other side was open to the environment. Hence, the above-mentioned surface temperature term refers to the surface temperature at the droplet train impact point, which created an impact area (crater formation) around it. The procedure of image and data analysis is illustrated in
Figure 2.
The main steps of the procedure are explained as follows: once the temperature at the impact point reached more than the target temperature (e.g., 85.00 °C, 110.00 °C), the thermographic camera captured a thermal image. In parallel to this, the corresponding optical camera view was captured from the recorded video at the same time. The optical camera images allowed us to measure the spreading length and observe the existence of the splashing phenomenon, whilst the thermal images presented the changes in the temperature gradient and the impact of the droplet train on the target surface. The thermographic camera defined the surface with 640 × 512 pixels, which was equal to the thermographic camera resolution. Each pixel had a temperature value, and all pixel data were transferred to the MATLAB environment for pixel-based thermal gradient analysis. In the thermographic analysis, we realized that the temperature value at each pixel point was not exactly the same as in the repeated experiment, although the experimental conditions were exactly the same. The deviation for each pixel-based temperature was found to be nearly (and sometimes above) 5% between the performed and the repeated experiments. In the current study, we aimed to observe the deviation of 1% for pixel-based temperature values, but surface temperatures did not provide the desired deviation value. To overcome this in future works, some potential solutions are given in the last paragraph of the Results and Discussion section. In the MATLAB environment, each pixel-based temperature corresponded to an element in a 640 × 512 matrix, therefore we were able to analyze, measure, and plot the thermographic data. Similar to the thermographic observations, the captured image from the recorded video was analyzed in the MATLAB environment for measuring the spreading length. In addition to the experimental procedure, it is worth noting that the observed surface temperature values were different from one another between Exp. I, II, and III due to the fact that the thermal image was manually captured (via hand), while the optical image was easily captured thanks to its high time frame value (14,000 frames per second). Although we tried to capture the thermal images at the same surface temperatures for each experimental set (e.g., 85.00 °C, 110.00 °C, 140.00 °C, 170.00 °C, 185.00 °C, and 200.00 °C), we could not catch the desired surface temperature due to the rapid changes in temperature values at the droplet impact point. Nevertheless, the obtained temperature values were sufficient to plot the spreading length trends for boiling investigation.
Table 2 presents the obtained surface temperature values for the experimental sets. Optical and thermal images were collected for some of the obtained surface temperature values for observational analysis.
3. Results and Discussion
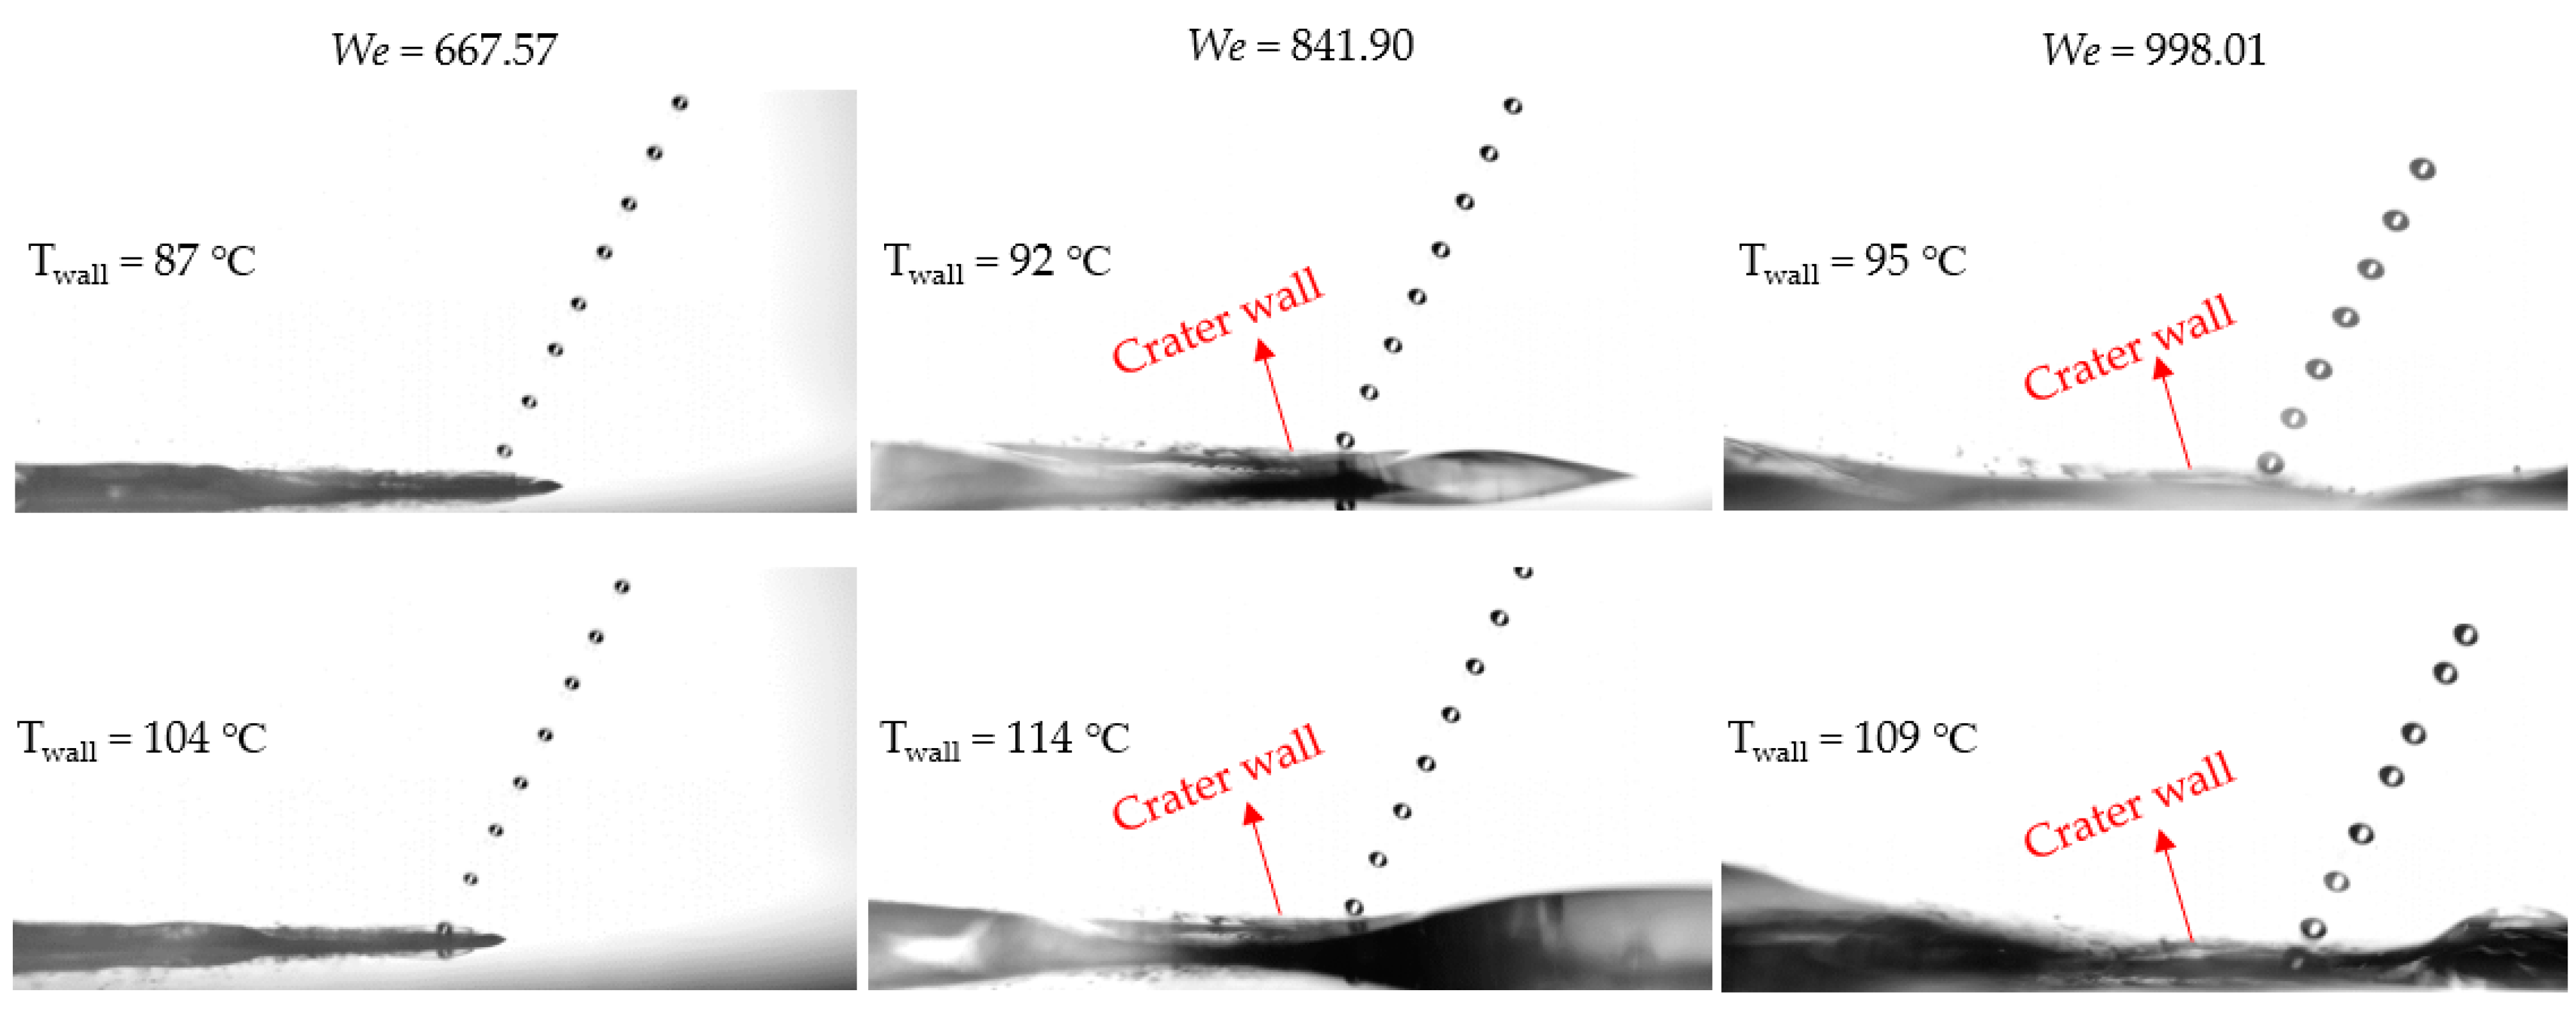
The optical images of droplet train impingement between the surface temperatures of 85.00 °C and 115.00 °C are shown for Experiments I–III in
Figure 3. For all experimental sets, liquid pool accumulations were observed around the droplet impact area and were mostly opposite the inclined droplet train direction. The minimum accumulated liquid pool was seen for Experiment I, which had the lowest Weber number and the lowest droplet diameter and pinhole diameter (see
Table 1). When the droplet diameter and Weber number increased, the accumulated liquid pool became more chaotic and difficult to observe, which was in agreement with the outcomes of Refs. [
20,
21]. Additionally, the crater wall became more visible at higher Weber numbers.
The first row of
Figure 3 represents the lower surface temperature values when compared to the second row. Compared to the lower surface temperatures, the volume of the accumulated liquid pool was slightly smaller at higher surface temperature values. The reason behind that observation is the energy balance on the target glass surface. That is, if the droplet impinging on the surface had a lower temperature value than the ethanol boiling point, the mass of the supplied ethanol (via droplet impingement) would be equal to the mass of the accumulated liquid on the target surface. Because the surface temperature values were higher than the ethanol boiling point, there was a certain amount of ethanol evaporation from the surface. Following this, the mass and energy balance show that the supplied ethanol rate was equal to the sum of the evaporated ethanol and the accumulated liquid on the target surface. Nevertheless,
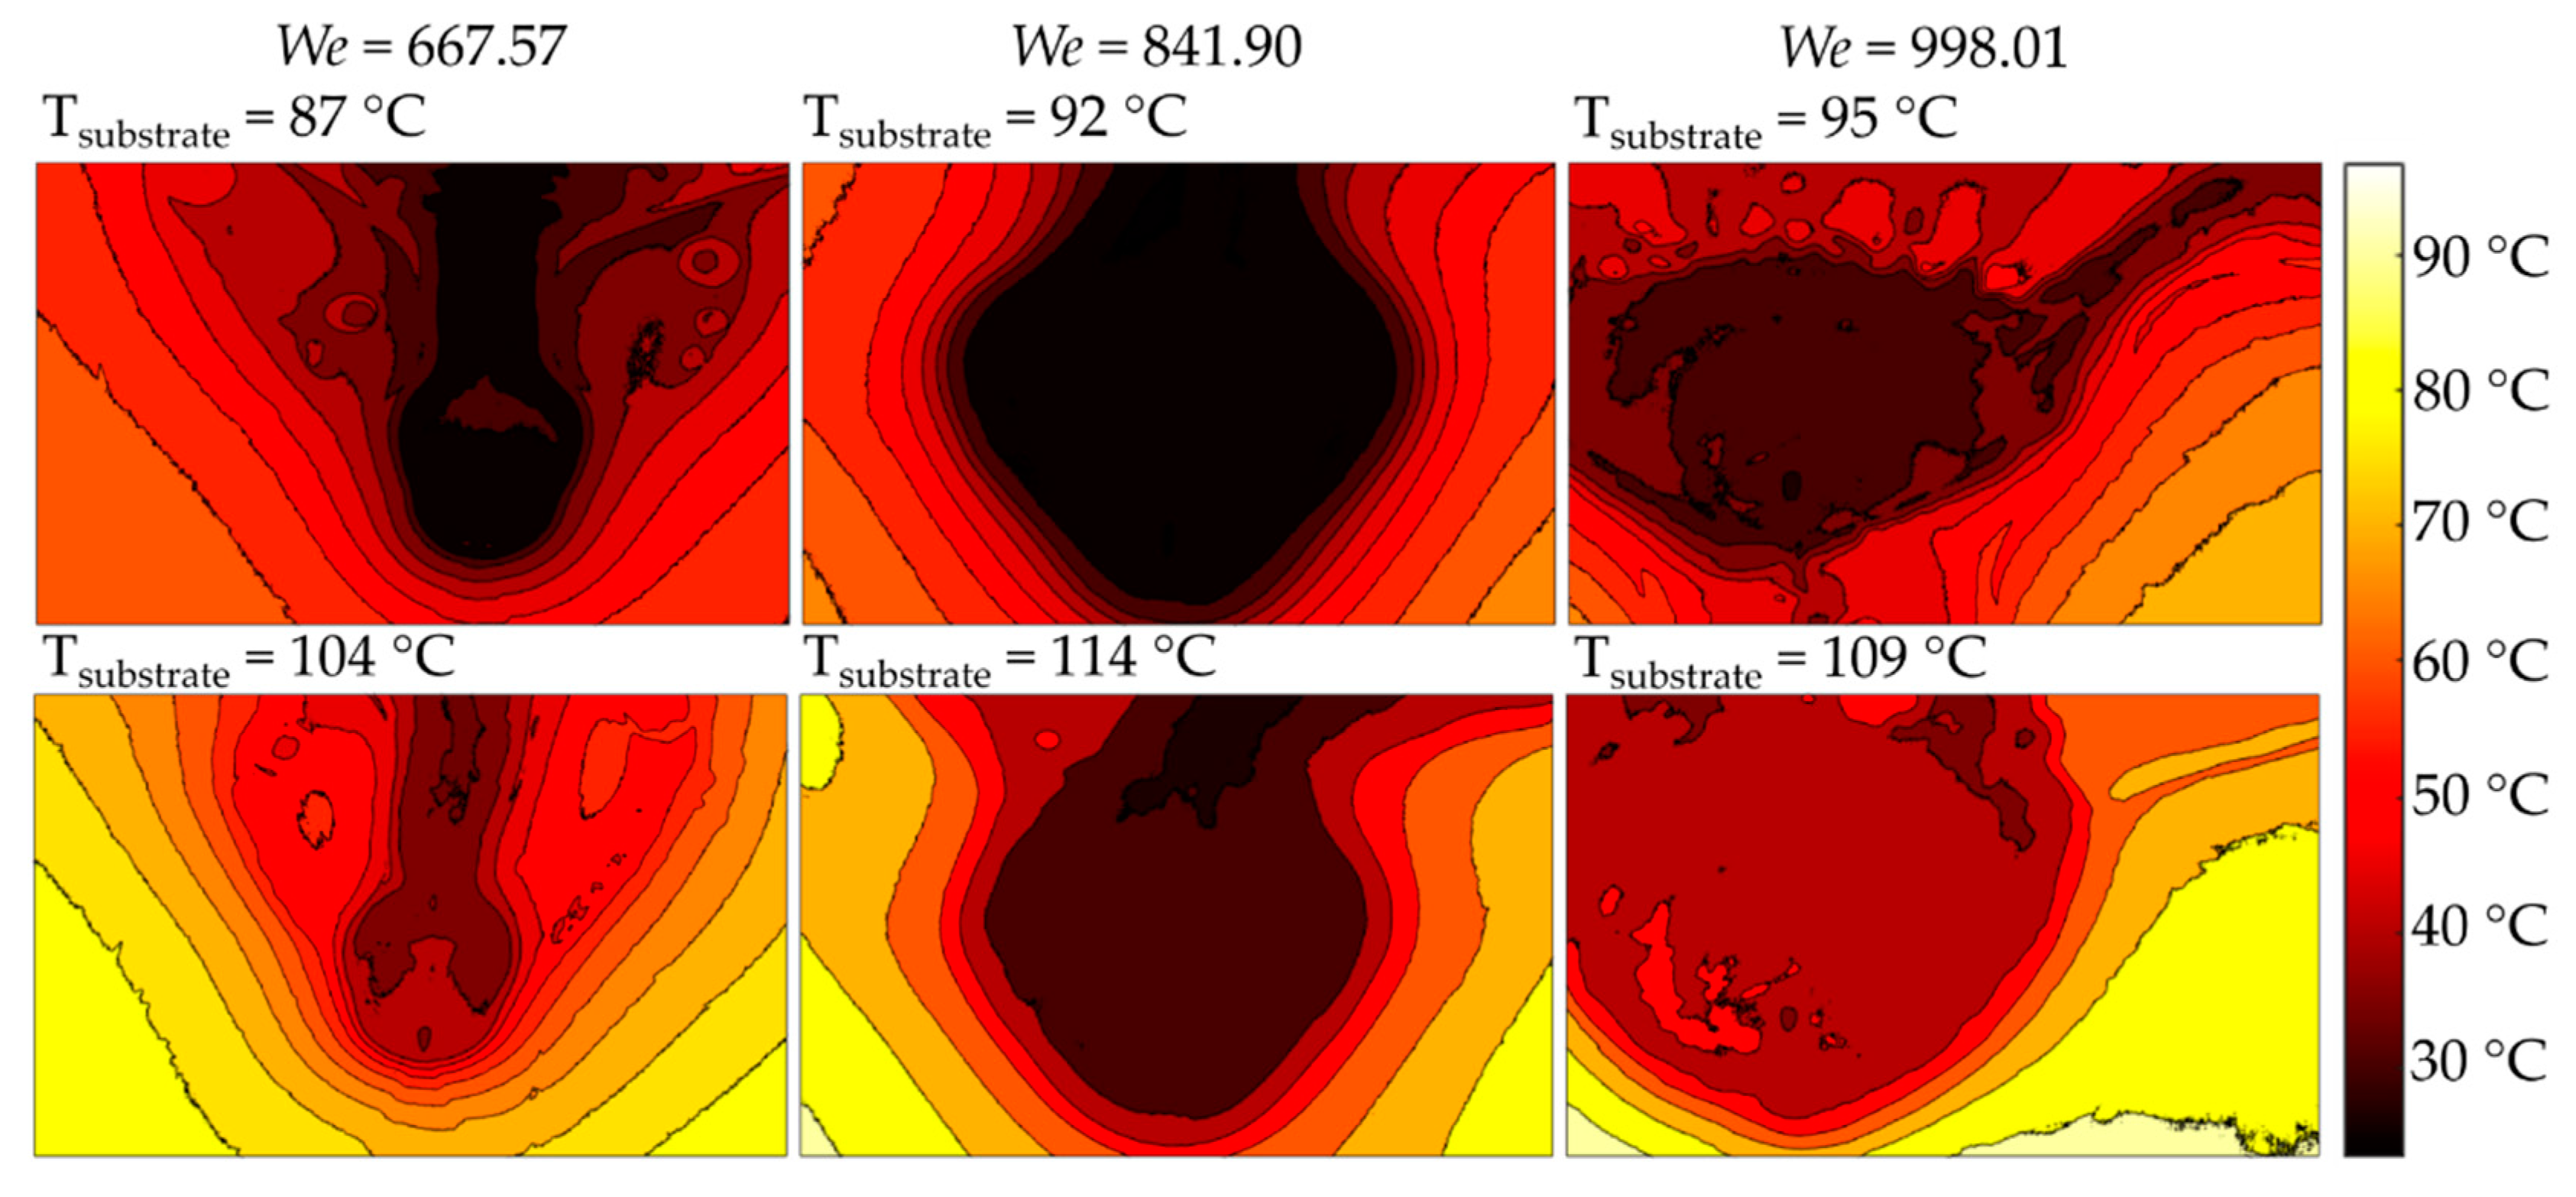
Figure 3 infers that the evaporation rate was small at the observed surface temperature values; hence, the accumulated liquid pool was large for all experimental sets. The accumulated pool formation and the impact of the Weber number and droplet diameter (in the air) were also observed during the thermographic analysis, as shown in
Figure 4.
Figure 4 shows that a smaller droplet diameter has a smaller impact area, which is in good agreement with the observed hydrodynamic patterns in
Figure 3; therefore, it cooled down a limited area around and resulted in a higher thermal gradient on the surface. In real applications, to overcome high thermal gradients, the number of droplet trains should be increased, as also observed in Ref. [
19]. In parallel to the discussion in
Figure 3, the accumulated liquid pool became smaller at higher surface temperature values for all the experimental sets. Moreover, as also shown in
Figure 3, the accumulated liquid flow was more chaotic at higher Weber numbers. In addition, similar to the outcomes in Refs. [
22,
23], thermographic images showed that the crater walls behaved like barriers between the inside and outside regions of the droplet impact area, which most probably resulted in different heat transfer coefficients in those regions.
Figure 5 shows the steady-state hydrodynamic patterns of ethanol train impingements at higher surface temperature values: from 135.00 °C to 200.00 °C.
Compared to the lower surface temperature values in
Figure 3, it can be clearly seen that the spreading length became smaller, and the volume of the accumulated ethanol liquid decreased at higher surface temperatures. The reason for this is related to the increment in the surface energy level of the glass, which resulted in a higher evaporation rate and therefore a smaller droplet impact area for all Weber number cases. Unlike (i) the vertical droplet train impingement studies that had Weber numbers higher than 1100 [
28,
29] and (ii) the inclined droplet train impingement studies at similar Weber numbers but on the aluminum surface that had significantly higher thermal conductivity than the glass, nucleate bubbles, which represents the nucleate boiling regime, were not observed near the droplet impact area. The reason for this might be the lower thermal conductivity value of the glass substrate, which was not able to provide sufficiently high surface energy levels, even though the surface temperatures were close to the inclined droplet train impingement on the aluminum surface [
31]. The low thermal conductivity inherently affected the surface energy level so that the existing accumulated liquid prevented the formation of nucleate bubbles.
Figure 5 also presents non-uniformly splashed microdroplets from the crown of the droplet impact area in the first row (surface temperatures of 136.00–142.00 °C). When the splashed droplets are observed, it can be assumed that the surface energy level was significantly high enough to break the main droplet into microdroplets from its crown. It must be noted that the nucleate bubbles were not observed in this range, unlike the vertical droplet train impingement studies [
28,
29]. The reason for this might be the above-mentioned facts: the glass substrate had lower thermal conductivity, and thus the accumulated ethanol droplet was in the opposite direction to the inclined flow.
By increasing the surface temperature above 170.00 °C, it was seen that the splashed microdroplets had a uniform direction opposite to the inclined flow direction. As already stated in Refs. [
25,
28,
29,
31], observing the splashing in a single direction can be assumed to be a sign of the transition regime. However, differently from previous ethanol droplet train impingement works [
28,
29,
31], the splashing angle was slightly higher than zero and the increment/decrement in the angle value was negligible when the surface temperature continued to increase up to 200.00 °C; thus, we were not able to detect the exact initial moment of the transition regime. Therefore, it can be said that the nucleate boiling was in the surface temperature range of 100.00–135.00 °C, whereas the sign of the transition regime and the transition regime were observed in the temperature range of 170.00 °C–200.00 °C. To better visualize the flow trends,
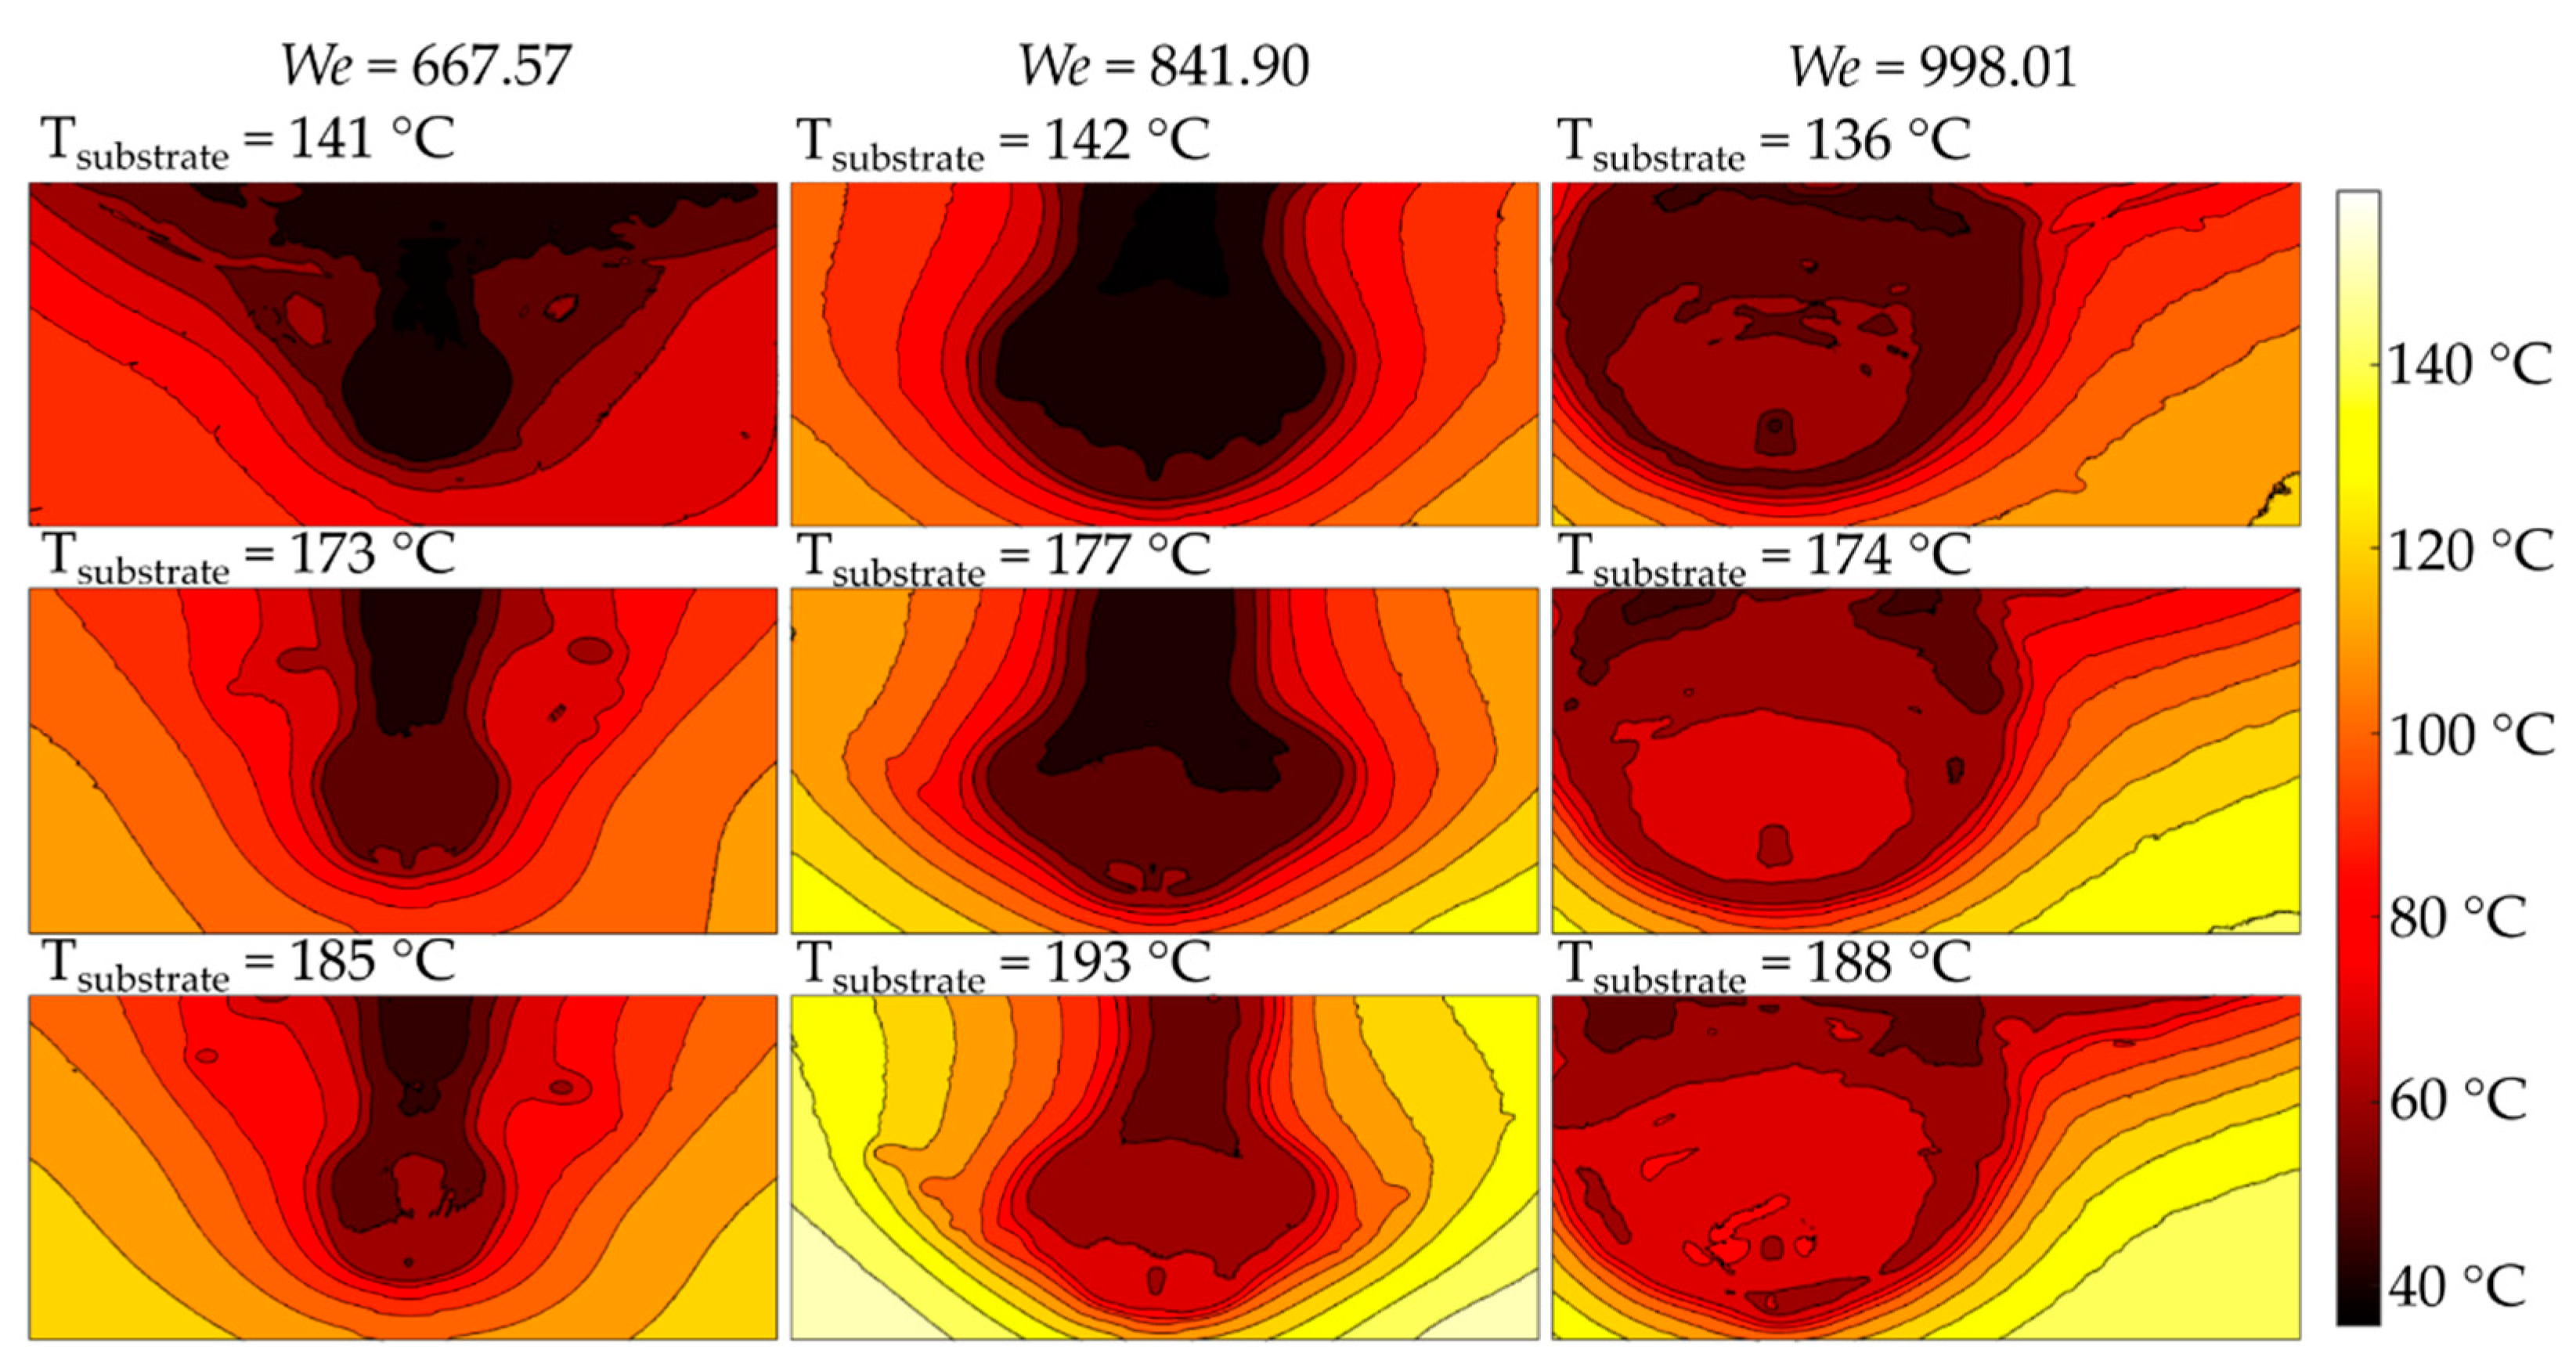
Figure 6 projects the thermographic camera measurements from the surface temperature of 135.00 °C to 200.00 °C.
Thermographic images support the observations performed in
Figure 5, which stated that the spreading length became smaller by the rising of the surface temperature for all experiments. It was also seen that the crater wall continued to behave like a barrier between the inside and outside regions of the droplet impact area. Compared to the thermographic observations in
Figure 4, the amount of accumulated liquid was notably decreased due to the high energy level and the high temperature of the surface, which provided a higher evaporation rate. At high temperatures, especially above 170.00 °C, which corresponded to the sign of transition regime referring to
Figure 5, it was observed that Experiment I (minimum droplet diameter and Weber number) had a very local cooling impact on the plate, while greater Weber numbers (Experiments II and III) achieved a larger impact area that can be considered as a heat sink.
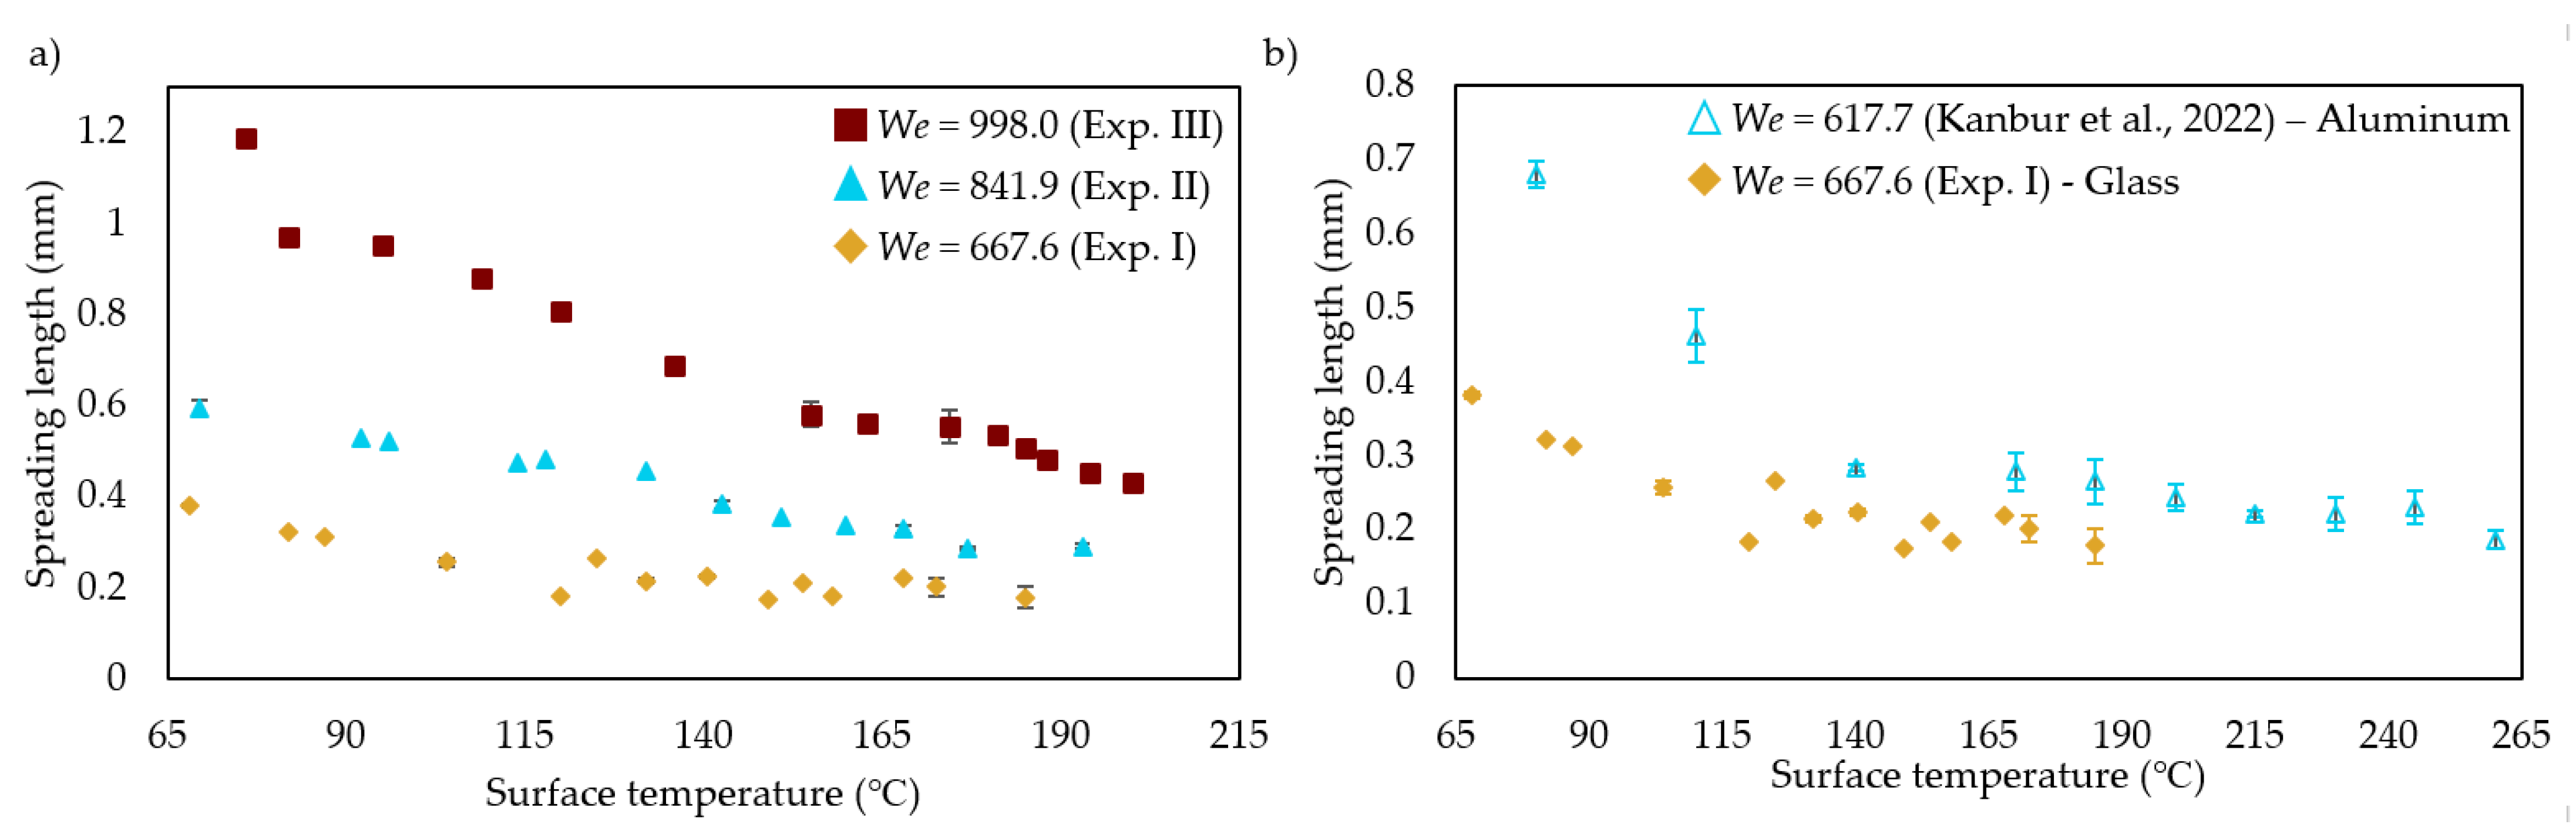
Hydrodynamic pattern evaluation allowed us to measure the spreading length of the droplet impact areas via optical camera images.
Figure 7a shows the measured spreading length values of Experiments I–III. Apart from the experiments above the boiling point of ethanol, an additional experiment was performed for surface temperature lower than the ethanol boiling point to see the spreading length before the boiling step. For Experiments I, II, and III, the lowest surface temperatures were 68.00 °C, 69.50 °C, and 76.00 °C, with the corresponding spreading length values of 0.38 mm, 0.59 mm, and 1.19 mm, respectively. When the surface temperature was increased above the ethanol boiling point, there was a notable decrement with the ratio of 15.67%, 10.77%, and 18.32% for Experiments I–III, respectively. The measured decrements showed the importance of substrate surface temperature when it was higher than the boiling point of the liquid compared to the operations below the boiling point. The decrease of the spreading length continued with the rising of the surface temperature, as observed in
Figure 3,
Figure 4,
Figure 5 and
Figure 6, which supports the reason given due to the thermal energy balance between the supplied ethanol liquid and the surface energy level of the glass. From the surface temperature range of 85.00–90.00 °C to 140.00 °C, the decrease in the spreading length was found to be nearly 30.00% for all the experiments. From the surface temperature of 140.00 °C to 172.50 °C, the spreading length did not change significantly, but it fluctuated in Experiment I (Weber number of 667.57). Considering the fact that the increase in surface temperature provided a high surface energy level that meant a high evaporation rate, the splashed microdroplets might balance the thermal energy between the surface and the supplied liquid ethanol; therefore, the spreading length fluctuated in a specific range of 0.20–0.22 mm but did not decrease until a surface temperature of 172.50 °C. However, for the surface temperature of 172.50 °C to 185.00 °C, which was most probably in the transition regime regarding the discussion in
Figure 5, the spreading length decreased from 0.20 mm to 0.18 mm.
For other experiments (Experiments I and II), the spreading length decreased continuously without any fluctuation, which indicated the micro-splashed droplets were not able to achieve the thermal balance between the supplied ethanol liquid and the glass surface. The minimum spreading lengths were 0.26 mm and 0.30 mm for Experiments II and III, respectively. The comparative spreading length analysis among different Weber numbers deduced that the glass surface temperature was critical for observing different boiling behaviors, but it was not the only critical factor because the supplied ethanol rate was also critical for manipulating the boiling behaviors at different (higher or lower) surface temperature values.
In addition to the current discussion,
Figure 7b compares the spreading length values of two different experiments with very close Weber numbers to each other: (i) Experiment I of this study, and (ii) an inclined ethanol droplet train impingement (with the same angle) on an aluminum surface in Ref. [
31]. The experiment in Ref. [
31] was performed with a pinhole diameter of 100 µm, which is the same diameter as Experiment II, but the Weber number is close to Experiment I of the current study. When the spreading lengths of Experiments I and II are compared in
Figure 7a, it can be seen that the greater pinhole diameter generated a higher ethanol liquid supply on the surface, which affected the evaporation behaviors and the accumulated liquid on the target surface; this can also be seen in
Figure 3,
Figure 4,
Figure 5 and
Figure 6. However,
Figure 7b shows that the spreading length values of the droplet train impingement in Ref. [
31] were very close to the spreading length values of Experiment I of the current study, although the experiment in Ref. [
31] had higher supplied ethanol liquid on the surface. To this end, it can be said that the higher thermal conductivity of the substrate significantly improves the evaporation rate and the boiling performance, which has also been discussed in
Figure 5 above.
Following the given discussions above, the main limitations and potential future improvements can be mentioned. One of the main limitations is related to the experimental conditions. In the current work, we wanted to work with a non-uniformly heated surface, so the glass substrate was heated from a single side while the other side was open to the environment. A temperature gradient was achieved, but the repeated experiments (for each experimental set, Exp. I, II, or III) showed that the pixel-based temperature values were not the same in the repeated experiments, and the deviation between them was above 5%, whilst we preferred a deviation of 1% from the point of view of accuracy. To overcome this limitation, a better thermographic camera resolution could be used, or the target of thermal gradient creation could be sacrificed and the glass substrate uniformly heated by the heater block in
Figure 1. Another limitation is the strong accumulated liquid flow in the opposite direction of the inclined ethanol flow, which made observation of the droplet impact area difficult, especially for higher Weber numbers. By decreasing the Weber number values, the boiling behaviors near the droplet impact area can be observed, or the inclined flow angle could be changed to higher values (closer to 90 degrees represents the vertical droplet train impingement). Alternatively, without changing the thermographic camera resolution or the inclined flow angle, a substrate with better thermal conductivity (such as aluminum in Ref. [
32]) could be preferred; however, it must be noted that substrates with higher thermal conductivity can rapidly reach the uniform temperature distribution, and that can block the purpose of investigating the non-uniformly heated surface. Besides the limitations and their potential solutions, near-future insights could be related to the efficient and smart analysis of the camera data, particularly for thermographic camera images. Our recent works [
7,
33] showed that both thermal and optical images and videos can be used to analyze and predict the future steps of the flow (via extrapolation). For the current case, thermographic image-related extrapolation studies could be performed, but the hydrodynamic-related images will most probably need additional effort due to the moving pixels related to the droplet train movements before impinging the surface.


