Citrinin in Foods and Supplements: A Review of Occurrence and Analytical Methodologies


LAQV, REQUIMTE, Laboratory of Bromatology and Pharmacognosy, Faculty of Pharmacy, University of Coimbra, Polo III, Azinhaga de Sta Comba, 3000-548 Coimbra, Portugal
*
Author to whom correspondence should be addressed.
Foods 2021, 10(1), 14; https://0-doi-org.brum.beds.ac.uk/10.3390/foods10010014
Submission received: 9 November 2020
/
Revised: 14 December 2020
/
Accepted: 18 December 2020
/
Published: 23 December 2020
(This article belongs to the Special Issue The Future of Foods: Recent Advances and Perspectives on Food Quality and Safety)
Abstract
:Citrinin (CIT) deserves attention due to its known toxic effects in mammalian species and its widespread occurrence in food commodities, often along with ochratoxin A, another nephrotoxic mycotoxin. Human exposure, a key element in assessing risk related to food contaminants, depends upon mycotoxin contamination levels in food and on food consumption. Commercial supplements, commonly designated as red rice, usually used in daily diets in Asiatic countries due to their medicinal properties, may pose a health problem as a result of high CIT levels. In addition to the worldwide occurrence of CIT in foods and supplements, a wide range of several analytical and detection techniques with high sensitivity, used for evaluation of CIT, are reviewed and discussed in this manuscript. This review addresses the scientific literature regarding the presence of CIT in foods of either vegetable or animal origin, as well as in supplements. On what concerns analytical methodologies, sample extraction methods, such as shaking extraction and ultrasonic assisted extraction (UAE), clean-up methods, such as liquid-liquid extraction (LLE), solid phase extraction (SPE) and Quick, Easy, Cheap, Effective, Rugged and Safe (QuECHERS), and detection and quantification methods, such as thin layer chromatography (TLC), high performance liquid chromatography (HPLC), capillary electrophoresis (CE), biosensors, and ELISA, are also reviewed.
1. Introduction
Mycotoxins, toxic secondary metabolites, are produced by some fungal species, which readily colonize crops, contaminating them in the field or after harvest, and processed foods under certain favourable conditions of moisture, water activity, and temperature. They co-contaminate an array of agricultural products (e.g., cereals, legumes, nuts, oilseeds and spices) and their complementary goods worldwide [1].
More than 400 mycotoxins have been identified and reported. The most common toxins that attract notable attention in the contaminated agro-food products are aflatoxins (AFs), ochratoxin A (OTA), trichothecenes (deoxynivalenol (DON) and nivalenol (NIV)), fumonisins (FBs), zearalenone (ZEN), citrinin (CIT) and patulin (PAT) [1,2]. They are produced by some species of toxigenic fungi such as Aspergillus, Penicillium, Fusarium, Alternaria and Monascus [3,4].
CIT was first isolated by Hetherington and Raistrick from a culture of Penicillium citrinum Thom, prior to World War II in 1931. Later, it was identified in more than a dozen species of Penicillium (P. citrinum, P. expansum, P. radicicola, P. verrucosum), as well as certain strains of Penicillium camemberti (used to produce cheese), and numerous species of Aspergillus (e.g., Aspergillus terreus and Aspergillus niveus), including Aspergillus oryzae used to produce sake, miso, and soy sauce. CIT has also been isolated from Monascus ruber and Monascus purpureus, industrial species used to produce pigments [5,6]. These strains are traditionally used in China to produce red and yellow pigments for food [7]. These Monascus species have been used in food production and preservation in the Orient for centuries. Traditional applications included red wine brewing, red soybean cheese processing, food colouring and meat preservation. In addition, Monascus products have been used in medicinal therapy, being prescribed in several circumstances [8].
In an experiment in 1987 nearly 1400 Penicillium isolates were collected from several cultures, isolated directly from food and feed, and it was concluded that CIT was produced by the three species above mentioned [9]. P. citrinum is a mesophile growing in the temperature range of 5 to 40 °C, with an optimum between 26 and 30 °C. It grows over the pH range of 2 to 10, with an optimum pH between 5.0 to 7.0. It is a xerophile, with a minimum aw for growth between 0.8 and 0.84 [10]. It is the main mycotoxigenic fungal species described in rice (25–30 °C, humidity 30–35%) [11]. CIT is produced at temperatures ranging from 15 to 37°C with an optimum at 30 °C, but no information exists regarding the effect of aw on toxin production [10].
CIT is rapidly absorbed and distributed, namely to the liver and kidney [12]. A recent CIT toxicokinetic study in humans showed that 40% of CIT was excreted in urine [13], so its absorption was ≥40% [12].
CIT, although discovered due to its antibiotic properties against Gram-positive bacteria, has never been used as a drug due to its high mammalian nephrotoxicity [7,14]. The kidney is the major target organ of CIT toxicity, but other target organs such as liver and bone marrow have also been reported [7]. CIT is connected to yellow rice disease in Japan and it is a potent nephrotoxin in animals [9]. It has been implicated in several disease outbreaks in animals and humans [15]. Its acute toxicity varies with different species [9]. The 50% lethal dose is 57 mg/kg, 95 mg/kg, and 134 mg/kg for ducks, for chickens, and for rabbits, respectively [5]. It affects monogastric domestic animals such as pigs and dogs [10]. CIT results in necrosis of the distal tubule epithelium in the kidneys, alters the function, and degenerates the processes of the renal tubules [12]. CIT is a known hepatonephrotoxin, which causes functional and structural kidney damage as well as alterations in liver metabolism. It inhibits several enzymes linked to the respiratory chain of the kidney cortex and the liver mitochondria [16].
The effects of CIT can synergize with other mycotoxins, namely OTA and PAT, to inflict more pernicious effects on tissues and organs [17]. It can act synergistically with OTA to depress RNA synthesis in murine kidneys; however, it appears to be considerably less toxic than OTA [5]. CIT causes necrotic changes of parenchyma organs [18] and also increases the toxicity of OTA, whether additively, synergistically, or antagonistically, causing nephrotoxicity, gastrointestinal ailments, fetal malformations, and lymphoid tissue damage [7,19]. Other additive and synergistic interactions have occurred together with fumonisin B1 (FB1) and OTA, manifesting in cytotoxicity in human peripheral blood mononuclear cells [19].
CIT and OTA can trigger porcine nephropathy and have been implicated in the etiology of Balkan endemic nephropathy (BEN) in humans. It is implicated that CIT acts synergistically with OTA to cause BEN in humans, CIT being a clearly less potent nephrotoxin than OTA. Co-exposure to CIT and OTA has resulted in the modification of DNA adduct formation with development of C-C8dG-OTA DNA adduct [6,19]. In humans, CIT and OTA have also been reported to be causative agents of hepatic and renal carcinogenesis [19]. Nonetheless, CIT is classified by IARC in group 3 because of its non-ability to be carcinogenic to humans, and because of limited evidence in animals [20].
The studies undertaken in Bulgaria, Croatia, and Serbia addressed mixtures involving OTA, CIT, and FB1 due to their possible involvement in endemic nephropathy (EN). Higher co-contaminations with OTA and CIT or OTA and FB1 were found in EN villages than in non-EN villages. These studies confirmed that EN populations were more frequently exposed to OTA and CIT due to microclimatic conditions, such as high humidity, and specific dietary habits [21].
Citrinin might even be a more common contaminant all over the world since it can be synthesized by the same fungus which produces the globally found mycotoxin OTA [22].
The descriptions in the scientific literature reveal the presence of CIT in foods of either vegetable or animal origin, whether natural or resulting from fermentative processes. In the first, it is generally formed after harvest and occurs mainly in stored grains, being most relevantly in cereals and derivatives, though others, such as olives, apples, spices, fruit and vegetable juices, and beers, may also be contaminated, with lower contents [23,24,25,26]. With regard to foods of animal origin, most relevant are cheese [27], infant formulas, or dry meat products such as fermented sausages [5]. CIT is also found in red yeast rice, widely used in Asia as a food additive or in the production of wine [22].
In addition to CIT′s worldwide occurrence in foods of either vegetable or animal origin and in supplements, this manuscript presents a review of extraction methods, such as shaking extraction and ultrasonic assisted extraction (UAE), clean-up procedures, such as liquid-liquid extraction (LLE), solid phase extraction (SPE), Quick, Easy, Cheap, Effective, Rugged and Safe (QuEChERS), and detection and quantification procedures, such as thin layer chromatography (TLC), high performance liquid chromatography (HPLC), and capillary electrophoresis (CE), and others such as biosensor-based techniques and still enzyme-linked immunoassays (ELISA).
2. Physicochemical Properties
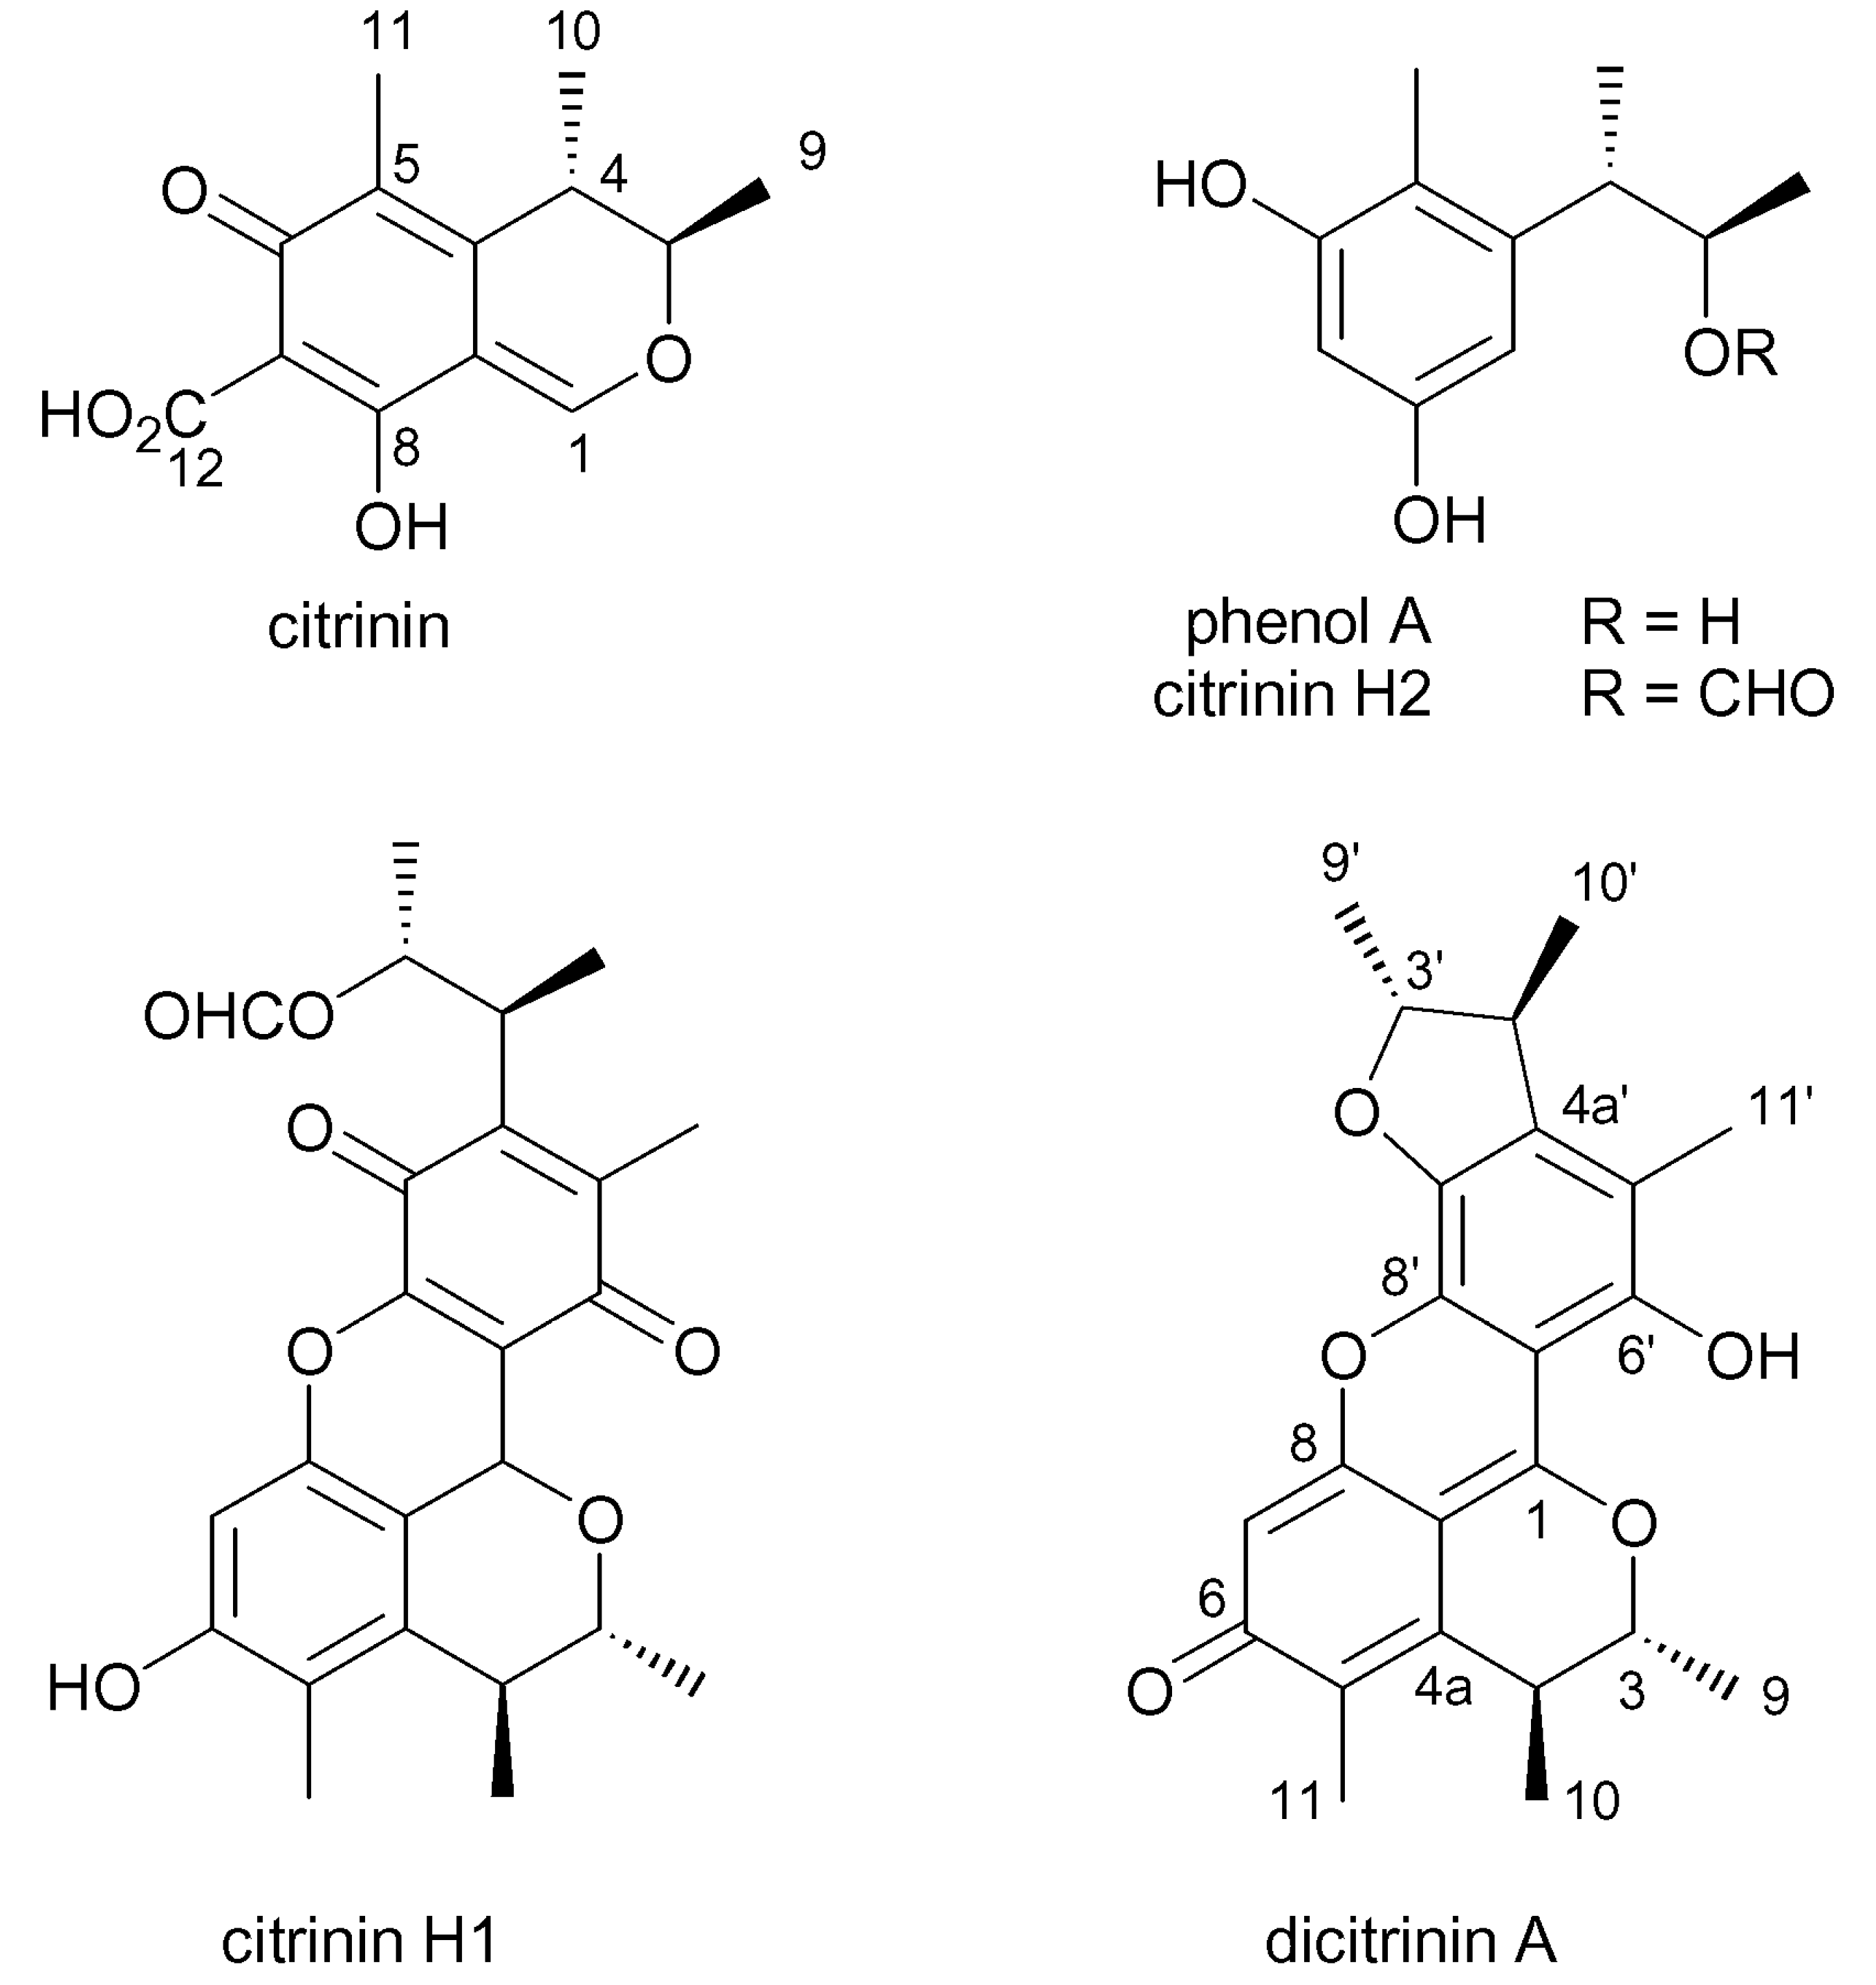
CIT (Figure 1) is a quinone methide with two intramolecular hydrogen bonds (Doughari, 2015). Its IUPAC Name is (3R,4S)-8-hydroxy-3,4,5-trimethyl-6-oxo-4,6-dihydro-3H-isochromene-7-carboxylic acid, the chemical formula is C13H14O5 (CAS Number: 518-75-2), and the molecular weight 250.25 g/mol [28].
Citrinin is an acidic lemon-yellow crystalline substance with maximal UV absorption at 250 nm and 333 nm in methanol solution. Its solution changes color, from lemon-yellow at pH 4.6 to cherry red at pH 9.9. It is sparingly soluble in water but soluble in dilute sodium hydroxide, sodium carbonate, or sodium acetate, and in methanol, acetonitrile, ethanol, chloroform, acetone, ethyl acetate, and most of other polar organic solvents [23,29,30]. It has a melting point of 172 °C/178.5 °C and can form chelate complexes and be degraded in acidic or alkaline solution or by heating [29,30]. Its pKa and log P values are 2.3 and 1.23, respectively [16].
3. Degradation Products
Degradation of CIT depends on the temperature and humidity conditions. Decomposition occurs at >100 °C in the presence of water, and >175 °C under dry conditions. Known decomposition products include citrinin H2 (CIT H2) (Figure 1), which shows much weaker cytotoxicity to HeLa cells than CIT and citrinin H1 (CIT H1), which is made up of two citrinin molecules, at 100 °C for 30 min or at temperatures above 100°C, and shows an increase in cytotoxicity as compared to the parent CIT. In 2006, another decomposition product was also reported, the cytotoxic citrinin dimer, dicitrinin A, together with other monomeric and dimeric degradation products [30,31,32]. It was found that after boiling in water, concentration of citrinin in Monascus dramatically decreased; 20 min of heating could decrease the concentration of CIT by 50%. These facts indicate that CIT is unstable and thermolabile in aqueous solution [30]. So, due to heat sensitivity CIT, is considered unstable, and its presence in processed foods is probably at lower levels.
4. Occurrence in Foods
The last report of the European Commission (2018) showed that about 96% of notifications of mycotoxins in the Rapid Alert System for Food and Feed (RASFF) concerned food, and notifications of citrinin are below 0.5% [33]. Table 1 presents the worldwide incidence and occurrence of CIT in different foods and supplements.
4.1. Cereals and Derivatives
CIT occurrence in food has been described worldwide, in Europe, Asia, North America, and Africa, as shown in Table 1. Usually, cereals are the most reported contaminated foods, rice being one of the most often evaluated. In addition, wheat and maize have also been mentioned as containing CIT.
4.1.1. Rice
Rice cultivation is carried out in subtropical environments with sufficient warmth and high humidity levels (35–50%), resulting in invasion by CIT producing fungal spores in the field, during harvest and storage [36,55].
CIT has been found as a natural mycotoxin contaminant of rice grains. This cereal is essential for human diet and the main nutritional source for a third of the world’s population [11], being a very important foodstuff for billions of people. It is the dominant grain for half of the world’s population and provides 20% of the world’s dietary energy supply, being the major staple food in Asia, whereas wheat and maize supply 19% and 5%, respectively [36,55].
The natural occurrence of CIT in rice has been described in different countries [11], mainly in Asia [36]. As shown in Table 1, CIT was detected from the central region of Vietnam [34], Japan [11], and India [36]. In the first, 13% of the analysed samples (n = 100) were contaminated with levels between the limit of detection (LOD) (0.11 µg/kg) and 0.42 µg/kg, with mean levels of 0.38 µg/kg [34]. In Japan, 13.3% of the samples contained CIT ranging from 49 to 92 µg/kg [11]. In India, rice samples exhibited a frequency of detection and range identical to those found in Japan. In parboiled rice, 33.3% of the samples presented CIT in a range of 12 to 55 µg/kg [36]. The highest CIT levels were found in two samples from Canada, 700 and 1130 µg/kg [11]. On the contrary, in Spain, in 21 rice samples CIT was not detected (LOD < 1.5 μg/kg) [35].
Red rice, so-called red fermented rice (RFR), red mold rice (RMR) or red yeast rice (RYR), is traditionally prepared by fermenting normal rice grain with a fungal starter from the genus Monascus, notably M. purpureus, M. pilosus, or M. ruber [39]. This type of rice has been a mainstay in traditional Chinese medicine for thousands of years and, based on its medicinal properties, has been included by the Chinese in their daily diet as commercial food supplement, defined by The European Food Safety Authority (EFSA) as concentrated sources of nutrients or other substances with a nutritional or physiological effect that are marketed in “dose” form [16,38,39,56]. Its anti-hypertensive properties [39] and ability to reduce blood-lipid levels in humans, such as lowering total cholesterol, low-density lipoprotein (LDL), and triglycerides in the plasma of hyperlipidemic patients [16] are known, being appropriate in the primary and secondary prevention of heart disease and other complications of atherosclerosis, due to its main component, the monacolin K. Anti-diabetic [39,57] and antioxidant properties [35] were also reported.
Although RYR and products may be beneficial to health, reports exist of some Monascus species, principally M. purpureus, producing CIT during fermentation. Thus, contamination of rice fermented products with CIT has attracted attention and is a public health concern. CIT discovery in M. purpureus fermented red rice has cause much controversy about the safety of red mold rice products because up to 80% may contain this mycotoxin [38].
CIT was responsible for the so-called “moldy rice poisoning” case that occurred in Japan in 1953–54 [23]. Once the natural occurrence of CIT exists in widely-consumed-traditional RFR, to ensure safety it is important to accurately determine it in the RFR as well as in its related products [58].
M. purpureus YY-1 is widely used in food colorant production in China. Its pigments have been used as natural food colorants for over 1000 years worldwide, especially in China [59]. Recently, an increasing number of investigations have shown that Monascus pigments exhibit biological activities, such as anti-inflammatory, anticancer on colon cancer cells, and antihyperlipidemic activities [59,60]. RFR had also been long used as a natural food colorant in East Asia, and recently had also been used as a food additive and a dietary supplement in Europe and the U.S. [58].
CIT is a frequent contaminant in RFR products, and the contamination levels are often higher than those of other mycotoxins [37]. Contamination of RFR with this secondary metabolite has been reported in different studies in China [2,37,40,41,42,48,58], Croatia [16,38], Malaysia [39], Vietnam [11,34], and Taiwan [42].
In RFR from China, a level of 2903 μg/kg was detected [48]. The occurrence of CIT contamination in 12 RFR products collected from the major production areas of China was also studied, and 10 samples were found contaminated with high levels ranging between 140 and 44,240 µg/kg [37]. Moreover, traditional Chinese food red yeast rice, medicinal plants and their related products, accepted as functional foods or drugs or as dietary supplements worldwide, were analysed in order to evaluate the natural occurrence of CIT, whose presence has already become a threat to human health. Out of a total of 109 widely consumed samples analysed, CIT was detected in 31 (28%) ranging from 16.6 to 5253 μg/kg, all of them derived from 59 RYR and related products. None of the 50 medicinal plant samples analysed showed the presence of CIT [40].
In red rice samples from Malaysia (n = 50), the highest amount of CIT was at 20,650 μg/kg and lowest at 230 μg/kg, with a mean level of 4030 ± 4620 μg/kg [39].
In Croatia, six dietary supplements with RFR were analysed, two of which were contaminated with 95 and 98 µg/kg. In two grains of RFR, CIT was not detected [38]. In the same country, seven different commercially available cholesterol lowering products containing red yeast rice extract presented a frequency of detection of 28.6%, with levels oscillating between not detected (nd) and 98 µg/kg [16]. A level as high as 27,000 µg/kg was found in Taiwan [42].
4.1.2. Maize
As concerns maize, among the 26 samples evaluated from Burkina Faso and Mozambique, CIT was quantified in three samples (12%), with a median of 1780 μg/kg and range between 531 and 5074 µg/kg [45].
CIT and dihydro-citrinone (DH-CIT) levels were evaluated in 204 maize samples harvested in Serbia in maize growing seasons with extreme drought (year 2012), extreme precipitation and flood (year 2014) and moderate drought conditions (years 2013 and 2015). The highest mean levels were observed in 2015 for both compounds, with 950 ± 2872 µg/kg, and 18 ± 33 µg/kg, respectively. CIT frequency was at 23% ranging from 7 to 10 058 µg/kg [46].
4.1.3. Wheat
In Tunisia, a Mediterranean country characterized by warm temperature and prolonged wetness which promotes fungal proliferation and mycotoxins production, 200 samples of wheat were collected during 2010 and analyzed for CIT contamination. The results showed that its incidence was 50%, with contamination levels ranging between 0.1 and 170 μg/kg, in an average of 28 μg/kg [43].
CIT was also evaluated in wheat samples (n = 37) from the Canadian Great Lakes Region between 2011 and 2014, and, accordingly, its levels oscillated between <0.6 and 175.2 μg/kg [44].
In dusts of stored wheat grains from a loamy region in central Belgium, CIT was found at higher levels of between 137.0 and 343.9 µg/kg [61].
Cereals [47] and cereal products [48] were also evaluated in Croatia and Germany, respectively. The levels found in wheat and maize from Croatia varied according to the studied areas. In the Vukovar-Srijem region, the levels ranged between <1 and 103 μg/kg, with a mean level of 14.6 μg/kg, and in Osijek-Baranja area the range was <1–52.4 μg/kg, and the mean level 19.63 μg/kg [47]. In Germany, 61.1% of the samples, including wheat samples, were contaminated, with levels ranging between <1–2.7 μg/kg [48].
4.1.4. Derivatives
In Nigeria, CIT and its metabolite, DH-CIT, were found in at least 61% and 4%, respectively, of the cereal-based food samples (family cereal, ogi and Tom bran) although as many as 53% of Tom bran samples contained DH-CIT. Only one sample of infant formula with milk and maize as constituents contained CIT [1]. It was found that the mean concentrations of CIT and DH-CIT were significantly higher (p < 0.05) in household-formulated complementary foods than in the industrially-processed foods [50]. In this country, the calculated range of margin of exposure (MOE) for CIT was 0–100 for chronic exposures of 0.002–102 μg/kg bw per day compared to the level of 0.2 μg/kg bw per day at which no concern for nephrotoxicity exists [1]. Later, studies showed that the percentage of the infants and young children (IYC) population (n = 110) at risk of adverse effects from dietary CIT exposures through complementary foods consumption was 19% [50]. One should note that in some countries, such as Nigeria, complementary foods are typically included in the diet of IYC when breast milk is no longer enough to meet nutritional needs. Cereals and nuts together with milk and their products are the major components of complementary foods for IYC. Consequently, they may be exposed to contaminated diets at the weaning stage, being the most vulnerable population in terms of mycotoxin exposure due to their young age, high intake of food and water per kilogram of body weight, fairly restricted diet, rapid rate of metabolism and growth, and a lower detoxification capacity [1].
In France, between 45 samples of breakfast cereals, 18%, were contaminated with CIT in the range of 1.5 to 42 µg/kg [49].
4.2. Other Foods
Beyond cereals, CIT was also found in other foodstuffs of vegetable origin (apples, black olives, nuts, spices), and also in foodstuffs of animal origin (e.g., cheese, cured meat) [6].
4.2.1. Olives
Olives are grown mainly in southern European countries, such as Spain, Italy, Greece, and in Turkey. They are used to produce olive oil or to be directly consumed. Fermented olives are an important product worldwide [52]. During conventional olive production, the surface of the brine may be covered with a thick layer of mold. Despite the mold growth presenting the advantage of causing softening of the olive tissue, besides communicating a moldy taste and appearance, reducing the acceptable quality of olives and their shelf life, it produces mycotoxins. Some fungus, P. citrinum and P. crustosum, have been isolated from the surface of olives during fermentation [52]. During drying and storage of olives, Aspergillus and/or Penicillium strains are also able to develop on olive and produce OTA and/or CIT and/or aflatoxins type B [62]. In Turkey, CIT was detected in 20 of the 27 (74%) black olive samples from the Aegean Region, with levels oscillating between ND to 100 µg/kg, while in Marmara Region 81% were contaminated in a range of 75 to 350 µg/kg [52]. In black olive samples (n = 10) purchased from supermarkets and retail markets in Morocco, the amount of CIT found in 80% of the samples was between >LOD (0.2 µg/kg) and <LOQ (0.5 µg/kg) [51].
4.2.2. Apples
A total of 351 apples of seven varieties were analyzed in Portugal including 14 samples (3.9%) contaminated with CIT, with mean levels comprised between 320 ± 680 µg/kg, for Richard variety, and 920 ± 630 µg/kg for Rome Beauty [24].
4.2.3. Beer
Forty-nine samples of lager beers from Czech Republic were analysed for CIT and the results showed that the number of contaminated samples was very low. In this survey, only three beers were positive. CIT was not detected in 92% of the samples owing to its low stability and degradation during the brewing process [26]. Accordingly, there are few studies reporting CIT contamination of this beverage probably because CIT is destroyed during the mashing and wort boiling process. However, there was some reported contamination at trace levels, showing that insignificant levels of CIT remained after the short-term brewing process. According to Xu et al., after boiling in water, the concentration decreased by about 50% after 20 min of heating, indicating its instability and thermolability in aqueous solution [26,30].
4.2.4. Spices
Regarding spices, Jeswal and Kumar, in 2015, analysed 311 samples of different spices, including red chili, black pepper, turmeric, coriander, cumin, fennel, caraway, fenugreek, and dry ginger, collected from local markets in rural and urban areas of the district of Bihar, India. Red chili samples showed the highest detection frequency, 47.2%, while dry ginger samples presented the highest mean concentrations, 85.1 µg/kg [54].
4.2.5. Sufu, Cooked Foods, Ham, and Snacks
In China, sufu (n = 12), cooked foods (n = 15), ham (n = 23) and snacks (n = 7) samples were studied for content of CIT. The results showed positive in 40.4% of the analysed samples, with sufu samples presenting the highest frequency, 91.7%, and ham samples the highest mean concentration, 190 µg/kg [29].
4.2.6. Cheese
Cheese is contaminated by CIT, where CIT-producing toxigenic strains directly grow in the cheese mass [6].
Cheeses, very sensitive products, are interesting foods which can be contaminated both naturally and artificially by CIT-producing fungi. Different domestic strains of Penicillium are used to produce cheeses, such as Camembert-type, French cheeses and various goat’s milk cheeses. P. roqueforti and P. camemberti, the most commonly used and studied species, do not appear to be able to produce CIT in cheese, however, accidental contamination of cheese by a wide variety of other wild strains of Penicillium can happen. On the other hand, P. citrinum and P. expansum do not produce CIT at 4 °C but do so at 20 °C, being able to produce quantities of up to 600 mg/kg after 10 days of incubation. Although contamination is mainly superficial, 33% of the toxin remains in cheese after trimming. Bailly et al. also verified that, for the evaluated cheeses, 50% of CIT still remains after eight days of storage [27].
By adding CIT to cheeses, the quantity decreased with storage time depending on the type of cheese. A slight decrease (10%) was observed after 6 h of storage for some cheeses (fresh goat, Saint Marcellin, and Soignon). Despite the gradual decrease with increase of storage time, >70% of the CIT was recoverable after eight days at 20 °C. For other cheeses (Roquefort, Raclette, Fourme, and Rouy), there was a rapid decrease after 6 h of storage, >33% at 20 °C, and about 50% of the amount added remained at the end of the assay (192 h). Another group of cheeses (Cantal, Reblochon, and Emmental) presented intermediate stability when compared to the other two groups. The storage temperature appeared to have only a tiny effect on the quantity of CIT recovered in the three types of cheese. This study showed that the stability of CIT in cheese is influenced neither by the temperature of storage nor by prior sterilization of the cheese. So this shows that its loss is a consequence of a chemical reaction with the cheese components, more than of a microbial action. Probably due to the high casein content in cheeses, the reactive groups of this protein interact with CIT causing its disappearance. Differences in pH may explain the differences in stability, as fresh goat’s cheese has a pH of 4.2 and Roquefort cheese has a pH close to 6 [27].
4.2.7. Cured Meat
With regard to meat products, mycotoxins that assume greater importance from a public health perspective are aflatoxin B1 (AFB1), OTA, sterigmatocystin (STC), cyclopiazonic acid (CPA) and CIT. During the ripening period, the surface of dried traditional meat products is covered by fungi of Penicillium spp., Aspergillus spp. and Eurotium spp. whose spores mainly come from the environment in which the ripening chambers are located [18]. Penicillium expansum isolated from meat and apples produced both patulin and CIT [63].
Relatively high amounts of CIT were found on dry meat after a 16-day incubation period with P. citrinum, at 20°C (87 mg/kg) [64]. CIT production by P. citrinum on meat samples was rapidly observed after four days. Levels, as high as 86.9 mg/kg, were obtained after 16 days of culture on dry cured ham. More than 50% of the CIT initial content was lost after only 6 h of incubation at 20 °C, while after 192 h of incubation less than 15% of the toxin remained [64]. The study of CIT stability at 20°C and 4°C demonstrates that the half-life of the toxin is about 6 h, suggesting that it is only partially stable on dry cured ham. This result agrees with those obtained on some cheeses [64].
Few data on CIT content in dry-cured meat products are found across the literature despite CIT-producing fungal strains having been isolated from dry-cured meat products [53]. Markov et al. showed that CIT was not a significant meat products’ contaminant. The fermented dry meat products (n = 50) showed a low frequency, 6%, and levels between <1.0–1.3 µg/kg, while semi-dry sausages (n = 25) presented levels <1.0 µg/kg in 4% of the samples [53].
There is an important need to carry out control on different meat products due to climatic variations over the years of production of cured meat, since, as for any mycotoxin, the CIT content varies. Another factor that can facilitate the diffusion of mycotoxins from the surface into dry fermented products is the damage caused to the outer coating. This fact has already been proven in the OTA entry from the surface into products based on cured meat during long-term ripening [65] and AFB1 during the ripening of dry-fermented meat sausages [66].
4.3. Legislation
In the EU, the Regulation (EU) No. 212/2014, concerning the maximum allowed presence of CIT in food supplements based on rice fermented with red yeast M. purpureus established a maximum value of 2000 μg/kg [67]. China and Japan have set a maximum limit of 50 and 200 μg/kg, respectively, for CIT in fermented red rice [68]. However, the acceptable levels of this mycotoxin in other food and feed commodities have not yet been regulated in different areas of the world, including Europe.
5. Analytical Methods
Since the stability of CIT is affected by different factors, such as temperature, solvent composition used for sample extraction and HPLC mobile phase, the need to use a sensitive methodology becomes evident for its determination in various foodstuffs [30]. Table 2 presents the analytical methodologies for determination of CIT in foods and supplements reported in the scientific literature.
5.1. Extraction
Extraction methods are key factors that influence recovery rates. Commonly, acetonitrile (ACN) and methanol (MeOH) were the most selected extraction solvents for CIT determination in foods (Table 2).
ACN has usually been used in different mixtures: ACN-4% aqueous solution of NaCl (9:1, v/v) with pH adjusted at 1.5 with undiluted HCl [34], ACN-5% formic acid (FAc) [35] in rice analysis; ACN/H2O/acetic acid (79:20:1, v/v/v) used in maize extraction [45,46], wheat [44], and complementary foods for infants and young children [1]. 4% aqueous solution of KCl acidified to pH 1.5 with undiluted H2SO4 and ACN were used in cereals [49] and in olives [51]; ACN (180 mL)/4% KCl (20 mL)/20% H2SO4 (2 mL) in olives [52]. ACN-4% aqueous KCl (9:1) [24] [74]; ACN-KCl (5%; 80:20, v/v) acidified by H2SO4 to pH 3 were applied to cheese [27] while ACN:4% KCl (9:1, v/v) acidified to pH 3 with H2SO4 was used in dry cured ham [64]. Finally, ACN containing 100 mM citric acid was used in fruits’ analysis [75] (Table 2).
The mixture MeOH:H2O has been widely used in different proportions. It has been used in RYR and related products [40], rice [68], spices [54], and fermented meat products [53] at 70:30 (v/v). In various cereals, maize, wheat and rice, it was used in a proportion of 2:8 (v/v) [71], and in grains of red fermented rice, tablets and capsules a proportion of 80:20 was used [38]. Methanol was applied alone in RFR [37].
Other solvent mixtures, such ethanol: H2O (E:W 7:3, v/v) was used in RFR by means of ultrasonic (US) and shaking extraction [58]. Besides these techniques, other extraction methods were also attempted: US extraction with TEF solvent mixtures (toluene:ethyl acetate:formic acid, 7:3:1, v/v/v); shaking extraction with EW; shaking extraction with EF solvent mixtures (ethyl acetate:formic acid, 1:1, v/v); shaking combined with US extraction in EW. It was demonstrated that shaking combined with ultrasonic extraction in EW was the most efficient extraction method. However, this procedure is very time consuming since the extractive process takes 2.5 h. Among several solvents to extract CIT from RMR, E:W (75:25%), at 80 °C, followed by shaking during 30 min, presented the best results [42].
Ultrasonic assisted extraction was employed in sufu, cooked foods, ham, and snacks [29].
Dichloromethane (DCM) with 0.5 M phosphoric acid was also used for CIT extraction of cereals and cereal products [48]. The mixture toluene-ethyl acetate-FAc (7:3:1, v/v/v) was occasionally used for extraction as, for example, in Xuezhikang capsules and other Monascus-fermented products [41].
As mentioned above, some extraction procedures promote acidification. This is done in order to improve recovery and reproducibility. Best results were obtained for pH 1.5 (80.3 ± 5%) than pH 4 (23 ± 1.5%) [49]. Acidification is made using undiluted HCl [34], undiluted H2SO4 [27,49,51,64], or H3PO4 [48].
5.2. Clean-Up
In some procedures, after extraction only centrifugation followed by filtration is used for clean-up. Centrifugation is usually performed at 3000 rpm/5 min [58], 3000 rpm/2 min [46] or 10 min [16], 3000 g/10 min [38], 6793 g/10 min [37]. Filtration through a 0.45 µm pore size filter is usual [16,38,58], however, 0.22 µm filter is also applied [37]. In some procedures, only sedimentation by gravity is used [1].
5.2.1. Liquid-Liquid Extraction (LLE)
Liquid-liquid extraction (LLE) is based on the different solubilities of the toxin and nonpolar contaminants, the former being usually soluble in the aqueous phase and the others in the immiscible organic phase. To remove lipids and cholesterol, n-hexane is usually used. However, this procedure is dependent on the matrix where it is being used, and which compounds are being determined. It is also time consuming and, due to adsorption on the glass material, sample loss may occur [76]. Some procedures use n-hexane for defatting. For example, the oil from some matrices such as black olives [51,52], breakfast cereals [49], and rice [34,43] was extracted with n-hexane preventing it from interfering with the assay.
5.2.2. QuEChERS
One fast and non-laborious method, Quick, Easy, Cheap, Effective, Rugged and Safe (QuEChERS), based on the extraction/partitioning process, was developed with H2O and ACN containing 5% Fac, avoiding the need for further rice extract clean-up. Afterwards, ultra-high-performance liquid chromatography (UHPLC) coupled with fluorescence detection was used for detection and quantification [35]. The used partitioning salts were MgSO4, NaCl, tri-sodium citrate dehydrate and sodium hydrogen citrate sesquihydrate (an extraction step based on partitioning via salting-out, involving the equilibrium between an aqueous and an organic layer) [35]. MgSO4 and NaCl salts with a citrate buffer improved the overall recoveries and the addition of water to the sample before extraction to hydrate and swell the rice matrix positively affected extraction efficiency [77].
5.2.3. SPE
Nowadays SPE is by far the most popular technique used in routine analysis of mycotoxins. Immunoaffinity columns (IAC) have been applied to extracts of different matrices, such as RYR and related products [40], corn and wheat [47], and fermented meat products [53] for the determination of CIT.
The use of polyamide columns for clean-up of cereals and cereal products was highly applied to RFR, regarded as a difficult matrix because of the very high content of coloring agents [48].
Molecularly imprinted polymer (MIP) columns were introduced as an alternative to IAC, as they can be recycled in order to reduce costs [78]. One novel magnetic MIP (m-MIP) was synthesized for clean-up of rice sample extracts containing CIT prior to its determination by HPLC with UV-DAD [68]. The m-MIPs can be reused for sample analysis in at least 30 extraction cycles, without significant loss in performance or reproducibility [68]. Besides, the method is faster, avoiding the need of SPE column packing or filtration operations, and operationally simple thanks to the ease with which the magnetic particles can be removed. Therefore, it provides a promising choice for the determination of CIT in food matrices [68]. MIPs have been previously proposed for selective SPE of CIT in rice with recoveries in the range of 86.7–97.7% [79]. A disposable evanescent wave fiber optic sensor coated with a MIP (composed of a naphthylamide-based fluorescent monomer, which exhibits fluorescence enhancement upon binding with carboxyl-containing molecules) containing a fluorescent signaling group on a 4-cm long polystyrene optical waveguide was used for determination of CIT and 2,4-dichlorophenoxyacetic acid (2,4-D) [80].
In order to clean-up crude extracts of different fruits (apples, oranges, sweet cherries and tomatoes), a self-made SPE column containing aminopropyl (NH2) and mixed-mode cationic exchange (MCX) adsorbents was used for UHPLC-MS/MS determination [75]. This column offered an important advantage, a single-step clean-up instead of expensive IAC and MycoSep multi-functional clean-up column, which can significantly shorten the sample preparation time, with superior recoveries and minimum matrix effects, compared to the conventional method [75].
For beer samples, Lhotská et al. [26], after filtration with a 0.45 um filter, used direct injection of 100 μL filtered beer samples into an on-line SPE (fused-core Ascentis Express RP C18)-HPLC system. This procedure enabled fast and effective sample extraction including separation in less than 6 min.
Some researchers opted, after extraction, for methodologies based on the dilute and shoot (DaS) approach. Malachová et al. [73] proposed this, followed by LC-MS/MS for quantitative determination of 295 fungal and bacterial metabolites, including CIT, in four types of different food matrices, apple puree, hazelnuts, maize and green pepper. The repeatability of the method was acceptable (RSD ≤ 20) for 97% of all analytes in apple puree and hazelnuts, for 95% in maize and for 89% in green pepper. Previously, this method was used for the quantification of 87 analytes, in breadcrumbs and moldy food samples [69], there being a need to lower the pH from 4 to 1.5 in order to increase the extraction from 23% to 80%. Hajnal et al. [46], following the method recommended by Malachová et al. [73] and Kos et al. [72], after extraction with a mixture (ACN/water/acetic acid 79:20:1, v/v/v), shaking and centrifugation, also used DaS to evaluate different mycotoxins, including CIT, in maize harvested in Serbia during 2012–2015. The same methodology was employed in complementary foods for infants and young children consumed in Nigeria [1], and for maize [45]. The obtained results concluded that this approach is also possible in the case of complex matrices.
5.3. Detection and Quantification
Instrumental selection is one of the most important factors influencing the sensitivity of quantification [37]. Common methods for CIT analysis are thin-layer chromatography (TLC) and high-performance liquid chromatography (HPLC) with UV diode-array (UV-DAD), fluorescence detection (FD), and mass spectrometry (MS) detection. Ultra-performance liquid chromatography (UPLC) is also used. Enzyme immunoassays (EIA), capillary electrophoresis (CE) biosensor-based and voltammetry techniques are rarely or occasionally used.
5.3.1. TLC
5.3.2. LC-FD and UPLC-FD
Due to poor sensitivity, TLC was replaced by HPLC-FD, with numerous advantages such as simplicity, high sensitivity [23,35] and adequate recoveries, due to the acidic nature of CIT molecule which exhibits native fluorescence [23]. According to Arévalo et al. [81], the weak fluorescence of CIT can be greatly enhanced in acidic media.
CIT has a conjugated, planar structure which provides its natural fluorescence (the highest fluorescence is produced by a non-ionized citrinin molecule at pH 2.5) [23]. Compared to UV detection, FD is about 100 times more sensitive, thus becoming the preferred choice for routine determination [30,35]. So CIT fluorescence detection has been intensively adopted considering that this technique shows a greater sensitivity than HPLC with UV-Vis detection. CIT has an absorption maximum at λ = 332 nm and an emission maximum at λ = 521 nm [81].
As depicted in Table 2, HPLC-FD has been successfully applied for the analysis of CIT in cereals, which includes rice and dietary supplements derived therefrom, derivatives, olives, beers, fermented meat products, sufu, ham or snacks. HPLC-FD has been used in extracts of rice [34], RFR and related products [37,38,40,41,42,58], wheat [43], corn and wheat [47], breakfast cereals [49], black olives [51], lager beers [26], fermented meat products [53], sufu, cooked foods, ham, and snacks [29].
The λ ecx vary between 330 nm and 350 nm and λ em between 495 and 500 nm (Table 2), despite that some authors consider that CIT has an absorption maximum at λ exc = 332 nm and an λ em maximum at 521 nm [81]. HPLC-with UV DAD at 331 nm was used for rice [68]. For beers, preconcentration of OTA and CIT from beer samples was performed on an Ascentis Express RP C18 guard column (5 × 4.6 mm), particle size 2.7 μm. Fluorescence λ exc/em were set at 335/497 nm. The choice of the λ exc/em was carried out as a compromise between the fluorescence spectra of OTA and CIT in mobile phase and sensitivity of determination for both mycotoxins [26].
As shown in Table 2, reverse phase columns, such as C18, were usually used in CIT detection and quantification. The column temperatures used are variable, usually between 25 °C [82] and 50 °C [83]. Regarding flow rates, the oscillations are comprised between 0.4 mL/min [48] and 1 mL/min, the most frequently used [29,37,38,40,41,42,43,53,58]. According to the chromatographic conditions, retention times for CIT oscillated between 1.25 [82] and 19 min [84]. When UPLC-FD was used, temperature and flow rate were at 45 °C and 0.5 mL/min, respectively [35].
Due to the acidic nature of CIT, and since its anion is not fluorescent, the mobile phase in reverse phase (usually C18 column) must be acidic in order to obtain a high analytical signal. This acidification is usually obtained using phosphoric acid (H3PO4) in different proportions, in mixture with ACN [47], H2O: ACN [37,40,41,53,58], or ACN: propan-2-ol [34,43,49,51]. The molarity of the H3PO4 influences the peak form, once the decrease in pH improves its form and the retention time increases [48].
ACN is also used in mixture with FAc [38], acetic acid [26], or trifluoroacetic acid (TFA) [42]. Acetic acid and FAc were added to water (solvent A) and ACN (solvent B) at different concentrations. The fluorescent signal of CIT increased with concentration, achieving a maximum and remaining constant from 1% acetic acid and 2% formic acid, the latter providing higher sensitivity [35]. Huiqin et al. [29] used only ACN:H2O (35:65).
Usually ACN, used as an organic eluting solvent in the mobile phase, is preferred over MeOH as CIT shows higher fluorescence in it [35] and, as in MeOH, the molecule is much more solvated [85].
However, some researchers use MeOH instead of ACN. MeOH has been used in mixture with ethyl acetate and H3PO4 [48], or with acetic acid [26]. Meister et al. [48] verified that the CIT peak form was influenced by the molarity of the phosphoric acid in the mobile phase as well as by the mixing proportion of the organic and aqueous components (55% methanol, 10% ethyl acetate). The peak form improved with pH decrease, and the CIT retention increased with increasing aqueous H3PO4 content [48].
When HPLC-FD is used, LODs, expressed in ng/g, vary between 0.11 ng/g for rice [34] and 2.8 ng/g for rye [48]. For supplements, LODs oscillated between 0.8 ng/g [40] and 1.0 ng/g [37], however when the results are presented in mg/mL the values were comprised, between 0.187 [41] and 0.5 [38]. The lowest values were obtained for lager beer, 0.006 ng/mL [26]. Regarding LOQs, the values oscillated between 0.35 ng/g [34] and 10.3 ng/g [48] for rice. Regarding supplements, the only value found for LOQ, expressed in ng/g, was 3 ng/g [37]. These values expressed in ng/mL were between 0.6 [41] and 1.0 [38]. Like LODs, beers also showed the lowest LOQs, 0.02 ng/mL [26] (Table 2).
UPLC-FD is an interesting alternative for determination of CIT, since it provides faster separations with better resolutions. So UPLC coupled to fluorescence detection was used for rice extracts and the obtained LOD and LOQ were 1.5 and 5.0 ng/g, respectively [35].
5.3.3. LC-MS/MS and UPLC-MS/MS
In spite of the high specificity and sensitivity of FD, there is an increased interest in MS detection, once it allows an unambiguous analyte identification, regardless of its high cost and matrix effects such as ion suppression or enhancement phenomena [85]. So alternative LC systems have been proposed such as LC-MS/MS, for complementary foods for infants and young children [1], maize extracts [45,46], RFR [37,40], wheat [44], and spices [54]. UPLC-MS/MS determination was used for extracts of fruits (apples, oranges, sweet cherries, and tomatoes) [75].
The column temperatures used are variable, usually between 20 °C [82] and 30 °C [54]. The flow rates were between 0.25 mL/min and 1 mL/min [1,42,44,45,46].
Regarding the mobile phase composition for LC-MS/MS, inversely to what happens with LC-FD, MeOH seems to deserve the preference of researchers. For example, MeOH has been used in mixture with H2O, acetic acid, and ammonium acetate [1,45,46], with H2O, ammonium acetate, and FAc [54], ammonium acetate and Fac [54]. ACN has also been employed with FAc [40].
The majority of authors use multiple reaction monitoring (MRM) with electron spray ionization (ESI) in positive mode (+) when UPLC [75] or HPLC [37,40,54] were used. Some researchers did not specify the ESI mode [1,42,44,45,46].
The precursor ions selected were 251.0 (m/z) [1,37], 251.1 (m/z) [40,44,46,72,73] or 251.2 (m/z) [75]. The product ions were 205 (m/z) and 233 (m/z) [37], 233.0 m/z and 205.1 m/z [40], 191.0/205.2/233.1 [44], 233.2/205.21 [46], 233.0/205.2 [1].
The LODs values varied between 0.16 ng/g for maize [46], and 250 ng/g also for maize [45]. The LOQ values were between 1.4 ng/g for wheat [44] and 3.0 ng/g for RFR [37].
The matrix effect can be compensated using different quantification strategies such as matrix-matched calibration or external calibration using isotopically labelled internal standards [85].
5.3.4. Immunoassays
Enzyme-linked immunoassays (ELISA), indirect competitive-ELISA (ic-ELISA), and enzyme immunoassay (EIA) have been employed in spices [54], cereals such as maize, wheat, and rice [48,71], and cereal products [48].
ELISA is a sensitive and high-throughput method usually used for sample screening and quantification due to its low cost. However, due to cross-reactivity, false negatives are generated, which require confirmation by LC-MS/MS [54] or LC-FD [48]. Kong et al. [71] prepared a monoclonal antibody (mAb)1F2 and developed an indirect competitive ELISA (ic-ELISA) and a lateral-flow immunochromatographic assay (ICA) strip for the detection of CIT in maize, wheat, and rice. Li et al. [86] developed a microsphere-based flow cytometric immunoassay for the determination of CIT in RYR.
On rare occasions mycotoxin determination employs capillary electrophoresis (CE) and biosensor-based techniques [18]. CE is a powerful analytical technique which is designed to separate the species, based on their charge to size ratio in an electric field in a small capillary. The main advantages of CE over the HPLC technique include the low sample volume required, the low solvent consumption of solvents and reagents, the environmental friendliness, cost efficiency, simplicity, high resolution and the short time analysis [16]. Nigović et al. [16] developed, for the first time, a simple micellar electrokinetic chromatography (MEKC) method to achieve simultaneous quantification of lovastatin in the red yeast rice existing in lactone and hydroxy acid forms, as well as CIT, as toxic fermentation by-product, compounds present in various commercial formulations of RYR [16].
Capillary zone electrophoresis (CZE) separation coupled to a UV detector (at 319 nm) was used as the determination method of CIT in red yeast powder, after clean-up by IAC, because of its simplicity, high speed, highly efficient separation and minimal solvent and reagent consumption. Adequate recoveries were obtained [87].
Novel sensors have also been developed, such as quartz crystal microbalance sensor with recoveries ranging from 85.8%, for rice, and 94.5%, for white rice vinegar, fortified at 10 and 100 μg/kg, respectively [88]. A molecular imprinted voltametric biosensor was applied to rye samples (recoveries between 96.30% and 101.35%) [89], and a molecular imprinted surface plasmon resonance (SPR) biosensor was used in RYR [90]. Electrochemistry offers the portability of a miniaturized sensor of CIT. Nasir and Pumera [91] showed that voltammetry on edge-plane pyrolytic graphite (EPPG) electrode offers excellent selectivity and sensitivity towards simultaneous detection of zearalenone and CIT. However, these costly methods require trained personnel, sophisticated instruments and complex sample preparation steps [71].
A fast, selective and very sensitive methodology based on an electrochemical immunosensor incorporated in a micro fluidic cell was developed for CIT in rice samples [81]. A microsphere-based flow cytometric immunoassay (MFCIA) [86] and a MIP-based biosensor were also reported for determination of CIT in RYR, with recoveries between 89% to 94%, and 97.96% to 101.28%, respectively [90].
6. Conclusions
From the different studies carried out on the occurrence of CIT in foods and supplements, a high variability in frequency and detected levels has been observed. These studies also reveal a wide dissemination in different continents, such as Europe, Asia, America, and Africa. Greater attention has been given to foods of vegetable origin, mainly cereals and derivatives. The data obtained so far show that the highest levels of CIT were found in maize in Serbia, with mean levels of 950 ± 2872 µg/kg [46], followed by Tom bran in Nigeria, with 160 ± 313.6 µg/kg [1]. Apples, analysed in Portugal, showed high levels, between 320 and 920 µg/kg [24]. CIT has also been evaluated in foods of animal origin, especially in ham and fermented meat products. While in the first levels these are of the order of 190 µg/kg [29], in the second matrix they are clearly lower, <1.0–1.3 µg/kg [53].
The lack of regulation regarding the CIT content in food creates a void that needs to be urgently filled, in order to avoid its presence in biological fluids with the inevitable harmful effects on human health.
With respect to supplements, usually they presented the highest levels of CIT. These values were 44,240 µg/kg [37], 20,650 µg/kg [39], 5253 µg/kg [40], 27,000 µg/kg and 13,550 µg/kg [42], which exceed the maximum limits regulated by the EU, Japan, and China.
Given the great diversity of matrices, several extraction and clean-up procedures have been proposed to obtain suitable extracts for the analytical instrumentation used in the detection and quantification of CIT. Among the first, different solvents have been used, with preference for ACN, used in mixture with aqueous solution of NaCl or KCl, whose pH is adjusted at 1.5 or 3.0, with undiluted HCl or H2SO4, or in mixture with water and acetic acid, with FAc, or with citric acid. As for the implemented clean-up procedures, centrifugation followed by filtration, liquid-liquid partition, QuEChERS, and solid phase extraction, the most popular procedure, with IAC, polyamide, MIP, and aminopropyl in mixture with MCX columns, have been employed.
More recently, “dilution and shoot” has been experienced. The DaS approach is a promising sample preparation method, especially when the concentration levels of target analyte are relatively high and the matrix components do not co-elute or interfere with ionization of the analyte of interest. However, this technique results in sensitivity sacrifice [92].
Until now, LC-FD has been the most commonly used analytical instrumentation to evaluate CIT in foods and supplements. However, lately LC-MS/MS has received more attention for direct quantification [1,45,46] or for confirmation [37,40,54]. As far as we know, UPLC-FD, HPLC with UV diode array, LC/DAD/FD/MS/MS, UPLC/ESI-MS/MS have been much less used.
Similarly to what occurs with other mycotoxins in foods [93] and medical herbs or traditional medicines [94,95,96] and with CIT in biological fluids, such as urine and plasma [13,20,84,97], the use of stable isotope labelled internal standards in the CIT analysis in complex food matrices is a very promising pathway to overcome the matrix effect.
Author Contributions
Conceptualization, C.M.L.; methodology, C.M.L. and L.J.G.S.; investigation, C.M.L.; writing—original draft preparation, C.M.L. and L.J.G.S.; writing—review and editing, C.M.L., L.J.G.S., A.T.P. and A.P.; supervision, C.M.L.; project administration, C.M.L. All authors have read and agreed to the published version of the manuscript.
Funding
Fundação para a Ciência e a Tecnologia-FCT; project UIDB 50006/2020.
Acknowledgments
The authors gratefully acknowledge the Portuguese governmental Fundação para a Ciência e a Tecnologia-FCT for funding support through the project UIDB 50006/2020.
Conflicts of Interest
The authors declare no conflict of interest.
References
- Ojuri, O.T.; Ezekiel, C.N.; Sulyok, M.; Ezeokoli, O.T.; Oyedele, O.A.; Ayeni, K.I.; Eskola, M.K.; Šarkanj, B.; Hajšlová, J.; Adeleke, R.A.; et al. Assessing the mycotoxicological risk from consumption of complementary foods by infants and young children in Nigeria. Food Chem. Toxicol. 2018, 121, 37–50. [Google Scholar] [CrossRef]
- Selvaraj, J.N.; Wang, Y.; Zhou, L.; Zhao, Y.; Xing, F.; Dai, X.; Liu, Y. Recent mycotoxin survey data and advanced mycotoxin detection techniques reported from China: A review. Food Addit. Contam. Part A 2015, 32, 440–452. [Google Scholar] [CrossRef]
- Abd-Allah, E.F.; Ezzat, S.M. Natural occurrence of citrinin in rice grains and its biocontrol byTrichoderma hamatum. Phytoparasitica 2005, 33, 73–84. [Google Scholar] [CrossRef]
- Coppa, C.F.S.C.; Khaneghah, A.M.; Alvito, P.; Assunção, R.; Martins, C.; Eş, I.; Gonçalves, B.L.; Valganon, D.d.N.; Sant’Ana, A.S.; Corassin, C.H.; et al. The occurrence of mycotoxins in breast milk, fruit products and cereal-based infant formula: A review. Trends Food Sci. Technol. 2019, 92, 81–93. [Google Scholar] [CrossRef]
- Bennett, J.W.; Klich, M. Mycotoxins. Clin. Microbiol. Rev. 2003, 5, 497–516. [Google Scholar] [CrossRef] [Green Version]
- Ostry, V.; Malir, F.; Ruprich, J. Producers and Important Dietary Sources of Ochratoxin A and Citrinin. Toxins 2013, 5, 1574–1586. [Google Scholar] [CrossRef] [Green Version]
- Flajs, D.; Peraica, M. Toxicological properties of citrinin. Arh. Hig. Rada Toksikol. 2009, 60, 457–464. [Google Scholar] [CrossRef] [Green Version]
- Sabater-Vilar, M.; Maas, R.F.M.; Fink-Gremmels, J. Mutagenicity of commercial Monascus fermentation products and the role of citrinin contamination. Mutat. Res. Genet. Toxicol. Environ. Mutagen. 1999, 444, 7–16. [Google Scholar] [CrossRef]
- Adam, M.A.A.; Tabana, Y.M.; Musa, K.B.; Sandai, D.A. Effects of different mycotoxins on humans, cell genome and their involvement in cancer. Oncol. Rep. 2017, 37, 1321–1336. [Google Scholar] [CrossRef] [PubMed] [Green Version]
- Sweeney, M.J.; Dobson, A.D.W. Mycotoxin production by Aspergillus, Fusarium and Penicillium species. Int. J. Food Microbiol. 1998, 43, 141–158. [Google Scholar] [CrossRef]
- Ferre, F.S. Worldwide occurrence of mycotoxins in rice. Food Control 2016, 62, 291–298. [Google Scholar] [CrossRef]
- Vidal, A.; Mengelers, M.; Yang, S.; De Saeger, S.; De Boevre, M. Mycotoxin Biomarkers of Exposure: A Comprehensive Review. Compr. Rev. Food Sci. Food Saf. 2018, 17, 1127–1155. [Google Scholar] [CrossRef] [PubMed] [Green Version]
- Degen, G.H.; Ali, N.; Gundert-Remy, U. Preliminary data on citrinin kinetics in humans and their use to estimate citrinin exposure based on biomarkers. Toxicol. Lett. 2018, 282, 43–48. [Google Scholar] [CrossRef] [PubMed]
- Scott, P.M. Other mycotoxins. In Mycotoxins in Food: Detection and Control; Magan, N., Olsen, M., Eds.; Woodhead Publishing Limited: Cambridge, UK, 2004; pp. 1–471. ISBN 978-1-85573-733-4. [Google Scholar]
- Ediage, E.N.; Diana Di Mavungu, J.; Song, S.; Wu, A.; Van Peteghem, C.; De Saeger, S.; Njumbe Ediage, E.; Di Diana Mavungu, J.; Song, S.; Wu, A.; et al. A direct assessment of mycotoxin biomarkers in human urine samples by liquid chromatography tandem mass spectrometry. Anal. Chim. Acta 2012, 741, 58–69. [Google Scholar] [CrossRef] [PubMed] [Green Version]
- Nigović, B.; Sertić, M.; Mornar, A. Simultaneous determination of lovastatin and citrinin in red yeast rice supplements by micellar electrokinetic capillary chromatography. Food Chem. 2013, 138, 531–538. [Google Scholar] [CrossRef] [PubMed]
- Qin, L.; Jiang, J.Y.; Zhang, L.; Dou, X.W.; Ouyang, Z.; Wan, L.; Yang, M.H. Occurrence and analysis of mycotoxins in domestic Chinese herbal medicines. Mycology 2020, 11, 126–146. [Google Scholar] [CrossRef] [PubMed] [Green Version]
- Zadravec, M.; Markov, K.; Frece, J.; Perković, I.; Jakopović, Ž.; Lešić, T.; Mitak, M.; Pleadin, J. Toxicogenic fungi and the occurrence of mycotoxins in traditional meat products. Croat. J. Food Sci. Technol. 2019, 11, 272–281. [Google Scholar] [CrossRef] [Green Version]
- Patial, V.; Asrani, R.K.; Thakur, M. Food-Borne Mycotoxicoses: Pathologies and Public Health Impact; Elsevier Inc.: Amsterdam, The Netherlands, 2018; Volume 15, ISBN 9780128114964. [Google Scholar]
- Ali, N.; Hossain, K.; Degen, G.H. Blood plasma biomarkers of citrinin and ochratoxin A exposure in young adults in Bangladesh. Mycotoxin Res. 2018, 34, 59–67. [Google Scholar] [CrossRef]
- Klarić, M.Š.; Rašić, D.; Peraica, M. Deleterious Effects of Mycotoxin Combinations Involving Ochratoxin A. Toxins 2013, 5, 1965–1987. [Google Scholar] [CrossRef] [Green Version]
- Pascual-Ahuir, A.; Vanacloig-Pedros, E.; Proft, M. Toxicity mechanisms of the food contaminant citrinin: Application of a quantitative yeast model. Nutrients 2014, 6, 2077–2087. [Google Scholar] [CrossRef] [Green Version]
- Doughari, J. The Occurrence, Properties and Significance of Citrinin Mycotoxin. J. Plant Pathol. Microbiol. 2015, 6. [Google Scholar] [CrossRef] [Green Version]
- Martins, M.L.; Gimeno, A.; Martins, H.M.; Bernardo, F.; Gimeno, A.; Martins, H.M.; Co-occurrence, F.B.; Bernardo, F. Co-occurrence of patulin and citrinin in Portuguese apples with rotten spots. Food Addit. Contam. 2002, 19, 568–574. [Google Scholar] [CrossRef] [PubMed]
- Viegas, S.; Assunção, R.; Nunes, C.; Osteresch, B.; Twarużek, M.; Kosicki, R.; Grajewski, J.; Martins, C.; Alvito, P.; Almeida, A.; et al. Exposure assessment to mycotoxins in a Portuguese fresh bread dough company by using a multi-biomarker approach. Toxins 2018, 10, 342. [Google Scholar] [CrossRef] [PubMed] [Green Version]
- Lhotská, I.; Šatínský, D.; Havlíková, L.; Solich, P. A fully automated and fast method using direct sample injection combined with fused-core column on-line SPE-HPLC for determination of ochratoxin A and citrinin in lager beers. Anal. Bioanal. Chem. 2016, 408, 3319–3329. [Google Scholar] [CrossRef]
- Bailly, J.D.; Querin, A.; Le Bars-Bailly, S.; Benard, G.; Guerre, P. Citrinin Production and Stability in Cheese. J. Food Prot. 2002, 65, 1317–1321. [Google Scholar] [CrossRef]
- Ali, N.; Blaszkewicz, M.; Degen, G.H. Occurrence of the mycotoxin citrinin and its metabolite dihydrocitrinone in urines of German adults. Arch. Toxicol. 2015, 89, 573–578. [Google Scholar] [CrossRef]
- Huiqin, W.; Shufen, Z.; Taifeng, L.; Dawei, Z. Introduction and Safety Evaluation of Citrinin in Foods. J. Food Nutr. Sci. 2017, 5, 179. [Google Scholar] [CrossRef] [Green Version]
- Xu, B.J.; Jia, X.Q.; Gu, L.J.; Sung, C.K. Review on the qualitative and quantitative analysis of the mycotoxin citrinin. Food Control 2006, 17, 271–285. [Google Scholar] [CrossRef]
- Clark, B.R.; Capon, R.J.; Lacey, E.; Tennant, S.; Gill, J.H. Citrinin revisited: From monomers to dimers and beyond. Org. Biomol. Chem. 2006, 4, 1520. [Google Scholar] [CrossRef]
- EFSA. Scientific Opinion on the risks for public and animal health related to the presence of citrinin in food and feed. EFSA J. 2012, 10, 1–82. [Google Scholar] [CrossRef]
- Pigłowski, M. Comparative analysis of notifications regarding mycotoxins in the rapid alert system for food and feed (RASFF). Qual. Assur. Saf. Crop. Foods 2019, 11, 725–735. [Google Scholar] [CrossRef]
- Nguyen, M.T.; Tozlovanu, M.; Tran, T.L.; Pfohl-Leszkowicz, A. Occurrence of aflatoxin B1, citrinin and ochratoxin A in rice in five provinces of the central region of Vietnam. Food Chem. 2007, 105, 42–47. [Google Scholar] [CrossRef]
- Huertas-Pérez, J.F.; Arroyo-Manzanares, N.; García-Campaña, A.M.; Gámiz-Gracia, L. High-throughput determination of citrinin in rice by ultra-high-performance liquid chromatography and fluorescence detection (UHPLC-FL). Food Addit. Contam. Part A Chem. Anal. Control. Expo. Risk Assess. 2015, 32, 1352–1357. [Google Scholar] [CrossRef] [PubMed]
- Ali, N. Co-occurrence of citrinin and ochratoxin A in rice in Asia and its implications for human health. J. Sci. Food Agric. 2018, 98, 2055–2059. [Google Scholar] [CrossRef]
- Ji, X.; Xu, J.; Wang, X.; Qi, P.; Wei, W.; Chen, X.; Li, R.; Zhou, Y. Citrinin Determination in Red Fermented Rice Products by Optimized Extraction Method Coupled to Liquid Chromatography Tandem Mass Spectrometry (LC-MS/MS). J. Food Sci. 2015, 80, T1438–T1444. [Google Scholar] [CrossRef]
- Mornar, A.; Sertić, M.; Nigović, B. Development of a rapid LC/DAD/FLD/MSn method for the simultaneous determination of monacolins and citrinin in red fermented rice products. J. Agric. Food Chem. 2013, 61, 1072–1080. [Google Scholar] [CrossRef]
- Samsudin, N.I.P.; Abdullah, N. A preliminary survey on the occurrence of mycotoxigenic fungi and mycotoxins contaminating red rice at consumer level in Selangor, Malaysia. Mycotoxin Res. 2013, 29, 89–96. [Google Scholar] [CrossRef]
- Li, Y.; Zhou, Y.C.; Yang, M.H.; Ou-Yang, Z. Natural occurrence of citrinin in widely consumed traditional Chinese food red yeast rice, medicinal plants and their related products. Food Chem. 2012, 132, 1040–1045. [Google Scholar] [CrossRef]
- Xue-Mei, L.; Xing-Hai, S.; Lan, X.; Zhen-Wen, D.; Shu-Ren, G. A Validated RP-HPLC Method for the Determination of Citrinin in Xuezhikang Capsule and other Monascus-Fermented Products. J. Chem. 2012, 9, 206–266. [Google Scholar]
- Wu, C.L.; Kuo, Y.H.; Lee, C.L.; Hsu, Y.W.; Pan, T.M. Synchronous high-performance liquid chromatography with a photodiode array detector and mass spectrometry for the determination of citrinin, monascin, ankaflavin, and the lactone and acid forms of monacolin K in red mold rice. J. AOAC Int. 2011, 94, 179–190. [Google Scholar] [CrossRef] [Green Version]
- Zaied, C.; Zouaoui, N.; Bacha, H.; Abid, S. Natural occurrence of citrinin in Tunisian wheat grains. Food Control 2012, 28, 106–109. [Google Scholar] [CrossRef]
- Limay-Rios, V.; Miller, J.D.; Schaafsma, A.W. Occurrence of Penicillium verrucosum, ochratoxin A, ochratoxin B and citrinin in on-farm stored winter wheat from the Canadian Great Lakes Region. PLoS ONE 2017, 12, 1–22. [Google Scholar] [CrossRef] [PubMed]
- Warth, B.; Parich, A.; Atehnkeng, J.; Bandyopadhyay, R.; Schuhmacher, R.; Sulyok, M.; Krska, R. Quantitation of mycotoxins in food and feed from burkina faso and mozambique using a modern LC-MS/MS multitoxin method. J. Agric. Food Chem. 2012, 60, 9352–9363. [Google Scholar] [CrossRef] [PubMed]
- Hajnal, E.J.; Kos, J.; Malachová, A.; Steiner, D.; Stranska, M.; Krska, R.; Sulyok, M. Mycotoxins in maize harvested in Serbia in the period 2012–2015. Part 2: Non-regulated mycotoxins and other fungal metabolites. Food Chem. 2020, 317. [Google Scholar] [CrossRef]
- Čulig, B.; Bevardi, M.; Bošnir, J.; Serdar, S.; Lasić, D.; Racz, A.; Galić, A.; Kuharić, Ž. Presence of Citrinin in Grains and Its Possible Health Effects. Afr. J. Tradit. Complement. Altern. Med. AJTCAM 2017, 14, 22–30. [Google Scholar] [CrossRef] [Green Version]
- Meister, U. New method of citrinin determination by HPLC after polyamide column clean-up. Eur. Food Res. Technol. 2004, 218, 394–399. [Google Scholar] [CrossRef]
- Molinié, A.; Faucet, V.; Castegnaro, M.; Pfohl-Leszkowicz, A. Analysis of some breakfast cereals on the French market for their contents of ochratoxin A, citrinin and fumonisin B1: Development of a method for simultaneous extraction of ochratoxin A and citrinin. Food Chem. 2005, 92, 391–400. [Google Scholar] [CrossRef]
- Ojuri, O.T.; Ezekiel, C.N.; Eskola, M.K.; Šarkanj, B.; Babalola, A.D.; Sulyok, M.; Hajšlová, J.; Elliott, C.T.; Krska, R. Mycotoxin co-exposures in infants and young children consuming household- and industrially-processed complementary foods in Nigeria and risk management advice. Food Control 2019, 98, 312–322. [Google Scholar] [CrossRef]
- El Adlouni, C.; Tozlovanu, M.; Naman, F.; Faid, M.; Pfohl-Leszkowicz, A. Preliminary data on the presence of mycotoxins (ochratoxin A, citrinin and aflatoxin B1) in black table olives “Greek style” of Moroccan origin. Mol. Nutr. Food Res. 2006, 50, 507–512. [Google Scholar] [CrossRef]
- Heperkan, D.; Meric, B.E.; Sismanoglu, G.; Dalkiliç, G.; Güler, F. Mycobiota, mycotoxigenic fungi, and citrinin production in black olives. In Advances in Experimental Medicine and Biology: Advances in Food Mycology; Hocking, A.D., Pitt, J.I., Samson, R.A., Thrane, U., Eds.; Springer Science + Business Media, Inc.: New York, NY, USA, 2006; Volume 571, p. 371. ISBN 9780387283852. [Google Scholar]
- Markov, K.; Pleadin, J.; Bevardi, M.; Vahčić, N.; Sokolić-Mihalak, D.; Frece, J. Natural occurrence of aflatoxin B1, ochratoxin A and citrinin in Croatian fermented meat products. Food Control 2013, 34, 312–317. [Google Scholar] [CrossRef]
- Jeswal, P.; Kumar, D. Mycobiota and Natural Incidence of Aflatoxins, Ochratoxin A, and Citrinin in Indian Spices Confirmed by LC-MS/MS. Int. J. Microbiol. 2015, 2015. [Google Scholar] [CrossRef] [PubMed] [Green Version]
- Aydin, A.; Aksu, H.; Gunsen, U. Mycotoxin levels and incidence of mould in Turkish rice. Environ. Monit. Assess. 2011, 178, 271–280. [Google Scholar] [CrossRef] [PubMed]
- de Oliveira Filho, J.W.G.; Islam, M.T.; Ali, E.S.; Uddin, S.J.; de Santos, J.V.O.; de Alencar, M.V.O.B.; Júnior, A.L.G.; Paz, M.F.C.J.; dos de Brito, M.R.M.; de Sousa, J.M.C.; et al. A comprehensive review on biological properties of citrinin. Food Chem. Toxicol. 2017, 110, 130–141. [Google Scholar] [CrossRef] [PubMed]
- Shi, Y.C.; Pan, T.M. Anti-diabetic effects of monascus purpureus NTU 568 fermented products on streptozotocin-induced diabetic rats. J. Agric. Food Chem. 2010, 58, 7634–7640. [Google Scholar] [CrossRef] [PubMed]
- Wang, W.; Chen, Q.; Zhang, X.; Zhang, H.; Huang, Q.; Li, D.; Yao, J. Comparison of extraction methods for analysis of citrinin in red fermented rice. Food Chem. 2014, 157, 408–412. [Google Scholar] [CrossRef] [PubMed]
- Liang, B.; Du, X.J.; Li, P.; Sun, C.C.; Wang, S. Investigation of citrinin and pigment biosynthesis mechanisms in monascus purpureus by Transcriptomic Analysis. Front. Microbiol. 2018, 9, 1–11. [Google Scholar] [CrossRef] [PubMed]
- Hong, M.Y.; Seeram, N.P.; Zhang, Y.; Heber, D. Anticancer effects of Chinese red yeast rice versus monacolin K alone on colon cancer cells. J. Nutr. Biochem. 2008, 19, 448–458. [Google Scholar] [CrossRef] [Green Version]
- Tangni, E.K.; Pussemier, L. Ochratoxin A and citrinin loads in stored wheat grains: Impact of grain dust and possible prediction using ergosterol measurement. Food Addit. Contam. 2005, 23, 181–189. [Google Scholar] [CrossRef] [Green Version]
- Zinedine, A.; Mañes, J. Occurrence and legislation of mycotoxins in food and feed from Morocco. Food Control 2009, 20, 334–344. [Google Scholar] [CrossRef]
- Ciegler, A.; Vesonder, R.F.; Jackson, L.K. Produciton and biological activity of patulin and citrinin from Penicillium expansum. Appl. Environ. Microbiol. 1977, 33, 1004–1006. [Google Scholar] [CrossRef] [Green Version]
- Bailly, J.D.; Tabuc, C.; Quérin, A.; Guerre, P. Production and Stability of Patulin, Ochratoxin A, Citrinin, and Cyclopiazonic Acid on Dry Cured Ham. J. Food Prot. 2005, 68, 1516–1520. [Google Scholar] [CrossRef] [PubMed]
- Pleadin, J.; Kovačević, D.; Perši, N. Ochratoxin A contamination of the autochthonous dry-cured meat product “Slavonski Kulen” during a six-month production process. Food Control 2015, 57, 377–384. [Google Scholar] [CrossRef]
- Pleadin, J.; Kovačević, D.; Perković, I. Impact of casing damaging on aflatoxin B 1 concentration during the ripening of dry-fermented meat sausages. J. Immunoass. Immunochem. 2015, 36, 655–666. [Google Scholar] [CrossRef] [PubMed]
- European Commission. COMMISSION REGULATION (EU) No 212/2014 of 6 March 2014 amending Regulation (EC) No 1881/2006 as regards maximum levels of the contaminant citrinin in food supplements based on rice fermented with red yeast Monascus purpureus. EFSA J. 2014, 67, 3–4. [Google Scholar]
- Urraca, J.L.; Huertas-Pérez, J.F.; Cazorla, G.A.; Gracia-Mora, J.; García-Campaña, A.M.; Moreno-Bondi, M.C. Development of magnetic molecularly imprinted polymers for selective extraction: Determination of citrinin in rice samples by liquid chromatography with UV diode array detection. Anal. Bioanal. Chem. 2016, 408, 3033–3042. [Google Scholar] [CrossRef]
- Sulyok, M.; Krska, R.; Schuhmacher, R. A liquid chromatography/tandem mass spectrometric multi-mycotoxin method for the quantification of 87 analytes and its application to semi-quantitative screening of moldy food samples. Anal. Bioanal. Chem. 2007, 389, 1505–1523. [Google Scholar] [CrossRef]
- Warth, B.; Sulyok, M.; Fruhmann, P.; Mikula, H.; Berthiller, F.; Schuhmacher, R.; Hametner, C.; Abia, W.A.; Adam, G.; Fröhlich, J.; et al. Development and validation of a rapid multi-biomarker liquid chromatography/tandem mass spectrometry method to assess human exposure to mycotoxins. Rapid Commun. Mass Spectrom. 2012, 26, 1533–1540. [Google Scholar] [CrossRef]
- Kong, D.; Xie, Z.; Liu, L.; Song, S.; Kuang, H. Development of ic-ELISA and lateral-flow immunochromatographic assay strip for the detection of citrinin in cereals. Food Agric. Immunol. 2017, 28, 754–766. [Google Scholar] [CrossRef] [Green Version]
- Kos, J.; Janić Hajnal, E.; Malachová, A.; Steiner, D.; Stranska, M.; Krska, R.; Poschmaier, B.; Sulyok, M. Mycotoxins in maize harvested in Republic of Serbia in the period 2012–2015. Part 1: Regulated mycotoxins and its derivatives. Food Chem. 2020, 312, 126034. [Google Scholar] [CrossRef]
- Malachová, A.; Sulyok, M.; Beltrán, E.; Berthiller, F.; Krska, R. Optimization and validation of a quantitative liquid chromatography-tandem mass spectrometric method covering 295 bacterial and fungal metabolites including all regulated mycotoxins in four model food matrices. J. Chromatogr. A 2014, 1362, 145–156. [Google Scholar] [CrossRef] [Green Version]
- Gimeno, A.; Martins, M. Rapid thin layer chromatographic determination of patulin, citrinin and aflatoxin in apples and pears, and their juices and jams. J. Assoc. Off. Anal. Chem. 1983, 66, 85–91. [Google Scholar] [PubMed]
- Wang, M.; Jiang, N.; Xian, H.; Wei, D.; Shi, L.; Feng, X. A single-step solid phase extraction for the simultaneous determination of 8 mycotoxins in fruits by ultra-high performance liquid chromatography tandem mass spectrometry. J. Chromatogr. A 2016, 1429, 22–29. [Google Scholar] [CrossRef] [PubMed]
- Turner, N.W.; Subrahmanyam, S.; Piletsky, S.A. Analytical methods for determination of mycotoxins: A review. Anal. Chim. Acta 2009, 632, 168–180. [Google Scholar] [CrossRef] [PubMed]
- Berthiller, F.; Cramer, B.; Iha, M.H.; Krska, R.; Lattanzio, V.M.T.; MacDonald, S.; Malone, R.J.; Maragos, C.; Solfrizzo, M.; Stranska-Zachariasova, M.; et al. Developments in mycotoxin analysis: An update for 2016-2017. World Mycotoxin J. 2018, 11, 5–32. [Google Scholar] [CrossRef] [Green Version]
- Zhang, L.; Dou, X.W.; Zhang, C.; Logrieco, A.F.; Yang, M.H. A review of current methods for analysis of mycotoxins in herbal medicines. Toxins 2018, 10, 65. [Google Scholar] [CrossRef] [Green Version]
- Guo, B.Y.; Wang, S.; Ren, B.; Li, X.; Qin, F.; Li, J. Citrinin selective molecularly imprinted polymers for SPE. J. Sep. Sci. 2010, 33, 1156–1160. [Google Scholar] [CrossRef]
- Ton, X.A.; Acha, V.; Bonomi, P.; Tse Sum Bui, B.; Haupt, K. A disposable evanescent wave fiber optic sensor coated with a molecularly imprinted polymer as a selective fluorescence probe. Biosens. Bioelectron. 2015, 64, 359–366. [Google Scholar] [CrossRef]
- Arévalo, F.J.; Granero, A.M.; Fernández, H.; Raba, J.; Zón, M.A. Citrinin (CIT) determination in rice samples using a micro fluidic electrochemical immunosensor. Talanta 2011, 83, 966–973. [Google Scholar] [CrossRef]
- Blaszkewicz, M.; Muñoz, K.; Degen, G.H. Methods for analysis of citrinin in human blood and urine. Arch. Toxicol. 2013, 87, 1087–1094. [Google Scholar] [CrossRef]
- Huybrechts, B.; Martins, J.C.; Debongnie, P.; Uhlig, S.; Callebaut, A. Fast and sensitive LC–MS/MS method measuring human mycotoxin exposure using biomarkers in urine. Arch. Toxicol. 2015, 89, 1993–2005. [Google Scholar] [CrossRef]
- Šarkanj, B.; Ezekiel, C.N.; Turner, P.C.; Abia, W.A.; Rychlik, M.; Krska, R.; Sulyok, M.; Warth, B. Ultra-sensitive, stable isotope assisted quantification of multiple urinary mycotoxin exposure biomarkers. Anal. Chim. Acta 2018, 1019, 84–92. [Google Scholar] [CrossRef] [PubMed]
- Arroyo-Manzanares, N.; Huertas-Pérez, J.F.; García-Campaña, A.M.; Gámiz-Gracia, L. Review of Sample Treatments and the State-of-the-art of Analytical Techniques for Mycotoxins in Food. In Analysis of Food Toxins and Toxicants; John Wiley & Sons, Ltd.: Chichester, UK, 2017; Volume 1–2, pp. 51–102. ISBN 9781118992685. [Google Scholar]
- Li, Y.; Wu, H.; Guo, L.; Zheng, Y.; Guo, Y. Microsphere-based flow cytometric immunoassay for the determination of citrinin in red yeast rice. Food Chem. 2012, 134, 2540–2545. [Google Scholar] [CrossRef] [PubMed]
- Zhu, D.; Zhang, H.; Bing, X. Preparation of an immunoaffinity column for the clean-up of fermented food samples contaminated with citrinin. Food Addit. Contam. Part A Chem. Anal. Control. Expo. Risk Assess. 2013, 30, 389–394. [Google Scholar] [CrossRef] [PubMed]
- Fang, G.; Liu, G.; Yang, Y.; Wang, S. Quartz crystal microbalance sensor based on molecularly imprinted polymer membrane and three-dimensional Au nanoparticles@mesoporous carbon CMK-3 functional composite for ultrasensitive and specific determination of citrinin. Sens. Actuators B Chem. 2016, 230, 272–280. [Google Scholar] [CrossRef] [Green Version]
- Atar, N.; Yola, M.L.; Eren, T. Sensitive determination of citrinin based on molecular imprinted electrochemical sensor. Appl. Surf. Sci. 2016, 362, 315–322. [Google Scholar] [CrossRef]
- Atar, N.; Eren, T.; Yola, M.L. A molecular imprinted SPR biosensor for sensitive determination of citrinin in red yeast rice. Food Chem. 2015, 184, 7–11. [Google Scholar] [CrossRef]
- Nasir, M.Z.M.; Pumera, M. Mycotoxins: Simultaneous detection of zearalenone and citrinin by voltammetry on edge plane pyrolytic graphite electrode. Electroanalysis 2014, 26, 1901–1904. [Google Scholar] [CrossRef]
- Song, S.; Ediage, E.N.; Wu, A.; De Saeger, S. Development and application of salting-out assisted liquid/liquid extraction for multi-mycotoxin biomarkers analysis in pig urine with high performance liquid chromatography/tandem mass spectrometry. J. Chromatogr. A 2013, 1292, 111–120. [Google Scholar] [CrossRef] [Green Version]
- Rychlik, M.; Asam, S. Stable isotope dilution assays in mycotoxin analysis. Anal. Bioanal. Chem. 2008, 390, 617–628. [Google Scholar] [CrossRef]
- Han, Z.; Ren, Y.; Liu, X.; Luan, L.; Wu, Y. A reliable isotope dilution method for simultaneous determination of fumonisins B1, B2 and B3 in traditional Chinese medicines by ultra-high-performance liquid chromatography-tandem mass spectrometry. J. Sep. Sci. 2010, 33, 2723–2733. [Google Scholar] [CrossRef]
- Han, Z.; Zheng, Y.; Luan, L.; Cai, Z.; Ren, Y.; Wu, Y. An ultra-high-performance liquid chromatography-tandem mass spectrometry method for simultaneous determination of aflatoxins B1, B2, G1, G2, M1 and M2 in traditional Chinese medicines. Anal. Chim. Acta 2010, 664, 165–171. [Google Scholar] [CrossRef] [PubMed]
- Hu, L.; Rychlik, M. Occurrence of enniatins and beauvericin in 60 Chinese medicinal herbs. Food Addit. Contam. Part A Chem. Anal. Control. Expo. Risk Assess. 2014, 31, 1240–1245. [Google Scholar] [CrossRef] [PubMed]
- Ouhibi, S.; Vidal, A.; Martins, C.; Gali, R.; Hedhili, A.; De Saeger, S.; De Boevre, M. LC-MS/MS methodology for simultaneous determination of patulin and citrinin in urine and plasma applied to a pilot study in colorectal cancer patients. Food Chem. Toxicol. 2020, 136, 110994. [Google Scholar] [CrossRef] [PubMed]
Figure 1.
Chemical structures of citrinin and its decomposition products citrinin H1, citrinin H2, dicitrinin A and phenol A (based on Clark et al. [31]).
Figure 1.
Chemical structures of citrinin and its decomposition products citrinin H1, citrinin H2, dicitrinin A and phenol A (based on Clark et al. [31]).


Table 1.
Worldwide incidence and occurrence of CIT in foods and supplements.
| Food/Supplement | Country | N° of Samples | Incidence (%) | Range (µg/kg) | Mean ± SD (µg/kg) | Median (µg/kg) | References |
|---|---|---|---|---|---|---|---|
| Rice | Japan | 30 | 13.3 | 49–92 | [11] | ||
| Canada | 2 | 100 | 700–1130 | ||||
| Paddy rice | Egypt | 30 | 33.3 | 4.36–20.36 | [3] | ||
| Rice | Vietnam | 100 | 13 | LOD–0.42 | 0.38 | [34] | |
| White rice | Spain(Granada) | 8 | 0 | nd (<1.5) | [35] | ||
| Brown rice | 8 | 0 | |||||
| Red rice (supplement) | 5 | 0 | |||||
| Rice | Iran, 2010/11 | 65 | 26.6 | 5–21.05 | 10.45 | [36] | |
| Parboiled rice | India | 18 | 33.3 | 12–55 | |||
| Rice | India | 30 | 13 | 49–92 | |||
| Red fermented rice (RFR) (supplement) | China | 12 | 83 | 140–44,240 | [37] | ||
| Grains of RFR (supplement) | Croatia | 2 | 0 | [38] | |||
| Dietary supplement with RFR | 6 | 33.3 | 95–98 | ||||
| Red rice (supplement) | Malaysia | 50 | 100 | 230–20,650 | 4030 ± 4620 | [39] | |
| Red yeast rice (RYR) (supplement) | China | 59 | 28 | 16.6–5253 | [40] | ||
| Red yeast rice (RYR) (supplement) | China | 2 | 100 | 0.97–1.32 | [41] | ||
| Monascus pigment powder | 2 | 100 | 122–594 | ||||
| Functional red yeast rice powder (supplement) | 3 | 100 | 0.10–5.41 | ||||
| Red yeast rice (RYR)-(supplement) | Croatia | 7 | 28.6 | nd–98 | [16] | ||
| Red mold rice (RMR) (supplement) | Taiwan | 2 | 100 | 5742–27,000 | [42] | ||
| China | 3 | 66.6 | 49–13,550 | ||||
| Wheat | Tunisia | 200 | 50 | 0.1–170 | 28 | [43] | |
| Wheat | Canada | 37 | 67.6 | nd-175.2 | [44] | ||
| Maize | Burkina Faso | 26 | 12 | 531–5074 | 1784 | [45] | |
| Mozambique | |||||||
| Maize | Serbia | 204 | Citronone/Dihydrocitronone CIT/DH-CIT | CIT/DH-CIT | CIT/DH-CIT | CIT/DH-CIT | [46] |
| 2012 | 51 | 4/nd | 10–48/nd | 11 ± 3/nd | 11/nd | ||
| 2013 | 51 | 8/nd | 5–547/nd | 175 ± 2/nd | 73/nd | ||
| 2014 | 51 | 4/nd | 2–6/nd | 4 ± 3/nd | 4/nd | ||
| 2015 | 51 | 23/8 | 7–10058/2–68 | 950 ± 2872/18 ± 33 | 61/2 | ||
| Cereals | Croatia | [47] | |||||
| -Međimurje | 20 | - | <1 | ||||
| -Osijek-Baranja | 15 | 80 | <1–52.4 | 19.63 | 15.8 | ||
| -Vukovar-Srijem | 15 | 66.7 | <1–103 | 14.6 | 1.23 | ||
| -Brod-Posavina | 5 | - | <1–23.8 | ||||
| Cereals and derivatives | Germany | 18 | 61.1 | <1–2.7 | [48] | ||
| Breakfast cereals | France | 45 | 18 | 1.5–42 | [49] | ||
| Family Cereal | Nigeria | 26 | 88.5 | 1.2–151 | 32.6 ± 39.8 | 25.1 | [1] |
| Ogi | 23 | 60.9 | 0.8–159 | 20.0 ± 40.8 | 7.0 | ||
| Tom bran | 30 | 73.3 | 1.7–1173 | 160 ± 313.6 | 13.4 | ||
| Infant formula | 17 | 5.9 | 3.6 | 3.6 | 3.6 | ||
| Household-formulated complementary foods (Tom bran) | Nigeria | 53 | 67.9 | 0.8–1173 | 106 ± 25.4 | 9.5 | [50] |
| Industrially-processed complementary foods | Nigeria | 84 | 28.6 | 1.2–151 | 31.4 ± 39.4 | 21.9 | |
| Black olives | Morocco | 10 | 80 | >LOD–<LOQ | [51] | ||
| Black olives | Turkey | [52] | |||||
| -Marmara | 42 | 81 | 75–350 | ||||
| -Aegean | 27 | 74 | nd–100 | ||||
| Apples | Portugal | 351 | 3.9 | 320–920 | [24] | ||
| Lager Beers | Czech Republic | 49 | 8.2 | <LOD–0.19 ug/L | <LOD | [26] | |
| Fermented meat products | Croatia | 90 | 5.55 | [53] | |||
| game sausages | 15 | 1/15 (6.66%) | <1.0–1.0 | ||||
| semi-dry sausages | 25 | 1/25 (4%) | <1.0 | ||||
| fermented dry meat products | 50 | 3/50 (6%) | <1.0–1.3 | ||||
| Sufu | China | 12 | 91.7 | 96–240 | 160 | [29] | |
| Cooked foods | 15 | 6.67 | 110 | 110 | |||
| Ham | 23 | 34.8 | 110–230 | 190 | |||
| Snacks | 7 | 42.8 | 120 | 120 | |||
| TOTAL | 57 | 40.4 | 96–240 | 160 | |||
| Spices | India | [54] | |||||
| red chilli | 55 | 26 (47.2%) | 69 ± 12.5 | ||||
| black pepper | 42 | 19 (45.2%) | 76.9 ± 17.8 | ||||
| turmeric | 35 | 0 | 0 | 0 | |||
| coriander | 30 | 12 (40%) | 81.0 ± 23.0 | ||||
| cumin | 28 | 6 (21.4%) | 33.9 ± 14.7 | ||||
| fennel | 25 | 0 | 0 | 0 | |||
| caraway | 25 | 0 | 0 | 0 | |||
| fenugreek | 35 | 13 (37.1%) | 63.1 ± 17.2 | ||||
| dry ginger | 36 | 16 (44.4%) | 85.1 ± 19.4 |
CIT—Citrinin; nd—not detected; LOD—limit of detection; LOQ—limit of quantification.
Table 2.
Analytical methodologies for determination of CIT in foods and supplements.
| Food/ Supplement | Sample (g) | Extraction Procedure | Clean-Up Procedure | Detection and Quantification | Chromatographic Conditions | LOD (ng/g) | LOQ (ng/g) | References |
|---|---|---|---|---|---|---|---|---|
| Rice | 20 | 100 mL of ACN-4% aqueous solution of NaCl (9:1). pH adjusted at 1.5 with undiluted HCl. Shake for 20 min. Filtration through a Whatman No. 4 paper under vacuum. | LLE: n-hexane (100 + 50 mL)/10 min. Addition of 50 mL H2O and 50 mL ClCH3 to the lower phase. Shaking for 10 min. Collect the lower phase (ClCH3). Re-extract twice the upper phase with 25 mL of ClCH3. Evaporate ClCH3 phase at 40 °C. Add 2 mL MeOH, sonicate, and filter (0.45 μm filter). Evaporate to dryness under nitrogen. For HPLC analysis add 500 μL of MeOH. | HPLC-FD: λ exc. 331 nm λ em. 500 nm | Column: C18 (0.46 × 25 cm, 3 µm) Mobile phase: (0.33 M) H3PO4/ACN/propan-2-ol (650/400/50). Injection volume: 20 µL Flow rate: 0.5 mL/min RT (min): 15 | 0.11 | 0.35 | [34] |
| Rice | 2 | 8 mL of H2O. Shake with vortex, for 2 min. 10 mL of ACN containing 5% FAc were added and the tube was vortexed again for 2 min. | QuEChERS: Add 4 g MgSO4, 1 g NaCl, 1 g tri-sodium citrate dehydrate and 0.5 g sodium hydrogen citrate sesquihydrate. Shake by hand (1 min) and by vortex (2 min). Centrifugation at 6500 rpm for 5 min. Dry under N2 stream 2 mL of the supernatant. Redissolve with 1 mL MeOH:H2O (50:50 v/v). Filtration through 0.2 μm nylon membrane. | UPLC-FD: λ exc. 331 nm λ em. 500 nm | Column: Zorbax Eclipse Plus RRHD (50 × 2.1 mm, 1.8 µm). Temp: 45 °C Mobile phases: A: H2O containing 2% FAc; B: ACN containing 2% FAc. Injection volume: 5 µL Flow rate: 0.5 mL/min | 1.5 | 5.0 | [35] |
| Rice | 1 | 5 mL of MeOH:H2O (7:3) in a sonifier, for 5 min. Filtration through a 10 μm filter. Evaporation in a rotary evaporator at 40 °C. Re-dissolution in 5 mL of HEPES buffer (0.1 M, pH 7.5). | Molecularly imprinted solid-phase extraction (m-MISPE) Elution: 1 mL of a methanolic solution of 0.05 M TBA | HPLC-UV-DAD: λ: 331 nm | Column: ACE Excel 2 C18-PFP (100 × 2.1 mm, 2 μm) Temp: 45 °C Flow rate: 0.4 mL/min Mobile phase: ACN:H2O (40/60) Injection volume: 100 µL | 0.7 | 2.3 | [68] |
| Red fermented rice (RFR) | 0.5–1.0 | 30 mL of EtOH:H22O (7:3); shake at 200 rpm, for 0.5 h, at 40 °C. Ultrasonication at 40 °C, for 30 min. Shaking on a rotary shaker at 200 rpm for 1.5 h. | Centrifuge all of the above suspension with 3000 rpm/5 min at 25 °C. Filter the supernatant with a 0.45 μm filter. | HPLC-FD: λ exc. 331 nm λ em. 500 nm | Column: Zorbax Eclipse XDB C18 (250 × 4.6 mm, 5 µm) Flow rate: 1.0 mL/min Mobile phase: H2O (pH is adjusted to 2.5 with H3PO4) and ACN (50:50) | - | - | [58] |
| Red Mold Rice (RMR) | 1 | 10 mL EtOH:H2O (75:25) at 80 °C for 30 min with shaking | 1 mL suspension is evaporated to dryness in a glass desiccator under vacuum. Add 1 mL ACN. Filtration with a 0.45 µm filter. | HPLC-FD: λ exc. 330 nm λ em. 500 nm LC-MS-ESI | Column: Luna C18 (25 cm × 4.6 mm, 5 µm) Column: Phenomenex Luna C18 Mobile phase: 0.05% TFA in ACN:H2O (62.5:37.5) Flow rate: 1.0 mL/min. | - | - | [42] |
| Red fermented rice (RFR) | 1 | 25 mL MeOH. Vortex for 3 min; Ultrasonication: 30 °C/30 min. | Centrifuge the extraction mixture for 10 min, at 6793× g. Pass 1.0 mL supernatant through 0.22 μm filter. | HPLC-FD: λ exc. 330 nm λ em. 500 nm LC-MS/MS: ESI+ | Column: C18 Waters XTerra RP (4.6 × 250 mm, 5.0 μm); Guard column: Xbridge TM C 18 (4.6 × 20 mm, 5.0 μm); Temp: 30 °C; Mobile phase: acidified H2O (pH 2.5 adjusted by H3PO4) and ACN (v/v, 65:35); Flow rate: 1 mL/min; RT = 18min; Injection volume: 20 µL Column: Phenomenex Luna C 18 (150 × 2.0 mm, 3.0 μm); Temp: 30 °C; Mobile phase: 90% MeOH–10% H2O (containing 2.0 mmol/L NH4AC and 0.1% FAc); Flow rate: 0.25 mL/min; RT = 12 min; Injection volume: 5 µL Parent/daughter ions (m/z): 251/205, 233 (m/z); Collision energy (CE): 27 and 14 eV | 1.0 | 3.0 | [37] |
| Xuezhikang capsule and Monascus-Fermented Products | 1.5 | 10 mL toluene-ethyl acetate- FAc (7:3:1), ultrasonication for 20 min (3 times). | Centrifuge. Evaporate the supernatant. Re-dissolved with 10 mL MeOH and filter through a 0.45 µm membrane filter. | HPLC-FD: λ exc. 331 nm λ em. 500 nm | Column: C18 (250 mm × 4.6 mm i.d., 5 µm); Temp: 25 °C; Mobile phase: A- ACN; B-acidified H2O (pH 2.5 adjusted with H3PO4; Injection volume: 20 µL Flow rate: 1.0 mL/min. | 0.187 ng/mL | 0.6 ng/mL | [41] |
| Red yeast rice (RYR) and related products | 1 | 5 mL of MeOH:H2O (70:30), for 3 min. Centrifugation at 6000 rpm/20 min; dilute 3 mL of supernatant with a PBS to 30 mL. | Filtration through a microfibre filter. SPE: CitriTest™ IAC Elution: 2 mL of MeOH/0.1% H3PO4 (70:30). | HPLC-FD: λ exc. 331 nm λ em. 500 nm Confirmation: LC-MS/MS: ESI+ | Column: Phenomenex Gemini 5u C18 (4.6 mm × 250 mm, 5 µm); Temp: 25 °C; Mobile phase: 0.1% H3PO4 with H2O/ACN (55:45) Flow rate: 1 mL/min; Injection volume: 50 µL; Column: Phenomenex Gemini C 18 (20 mm × 2.00 mm, 3 µm); Temp: 20 °C; Mobile phase: A- 100% H2O; B- 100% ACN both with 0.1% FAc Flow-rate: 0.5 mL/min Injection volume: 10 µL RT (min): 2.18 Parent/daughter ions (m/z): 251.1/205.1, 233.0 CE: 23 and 36 eV. | 0.8 | - | [40] |
| Red yeast rice (RYR) | 1 | 10 mL of MeOH:H2O (80:20, v/v). Vigorous vortex stirring for 3 min. Ultrasound bath at room temperature for 1 h. | Centrifuge at 3000 rpm/10 min, room temperature. Collect and evaporate the supernatant to dryness. Redissolve in 1 mL of MeOH. Filtration through a 0.45 um polyester filter. | MEKC-DAD (Capillary Electrophoresis- micellar electrokinetic capillary chromatography): λ. 216 nm | CE: Uncoated fused-silica capillaries (Agilent) 32.5 cm total length (effective length to detector 24 cm) and 50 µm i. d., with an extended light path of 150 µm. | 0.03 µg/mL | 0.08 µg/mL | [16] |
| Grains of red fermented rice Tablets Capsules | 1 | 10 mL of 80% MeOH/60 min, at room temperature, using an ultrasonic bath. | Centrifugation at 3000 g/10 min at 25 °C. The supernatant is filtered through a 0.45 μm Chromafil membrane filter. | LC-DAD-FD-MSn UV: 237 nm FD: λ exc. 331 nm λ em. 500 nm | Column: XBridge C18 (50 × 3.0 mm, 2.5 μm); Temp: 25°C Mobile phase: A—ACN/H2O/FAc (10:90:0.1, v/v/v); B—ACN/H2O/FAc (90:10:0.05, v/v/v); Flow rate: 1 mL/min; Injection volume: 5 µL; RT (min): 1.25 ± 0.01 | 0.0005 μg/mL | 0.001 μg/mL | [38] |
| Wheat grains | 25 | According to Nguyen et al. [34] | According to Nguyen et al. [34] | HPLC-FD: λ exc. 330 nm λ em. 500 nm | Column: C18 (Spherisorb ODII, 250 × 4 mm, 5 mm); Mobile phase: (0.33 M) H3PO4/ACN/propan-2-ol (650/400/50); Flow rate: 1 mL/min; Injection volume: 50 µL; RT (min): 5.2 | 0.25 | 1.0 | [43] |
| Wheat | 100 | 400 mL ACN/H2O/acetic acid (79/20/1, v/v/v). Shaking for 90 min. Centrifugation for 2 min at 3000 rpm. | Transfer 75 μL of supernatant and dried at 40 °C. Reconstitute in 150 μL of ACN/H2O (50/50). | Eluent from the HPLC is then split by a 50:50 flow splitter, and 25 μL is injected on the ESI MS/MS. | Column: Gemini C18 (150 × 4.6mm, 5 μm) Guard cartridge: C18, 4 × 3 mm i.d. Mobile phases: A- 5 mM of ammonium formate, and 0.1% FAc in H2O. B- 100% ACN Flow rate: 1 mL/min Injection volume: 50 µL; Parent/daughter ions (m/z): 251.1/ 191.0,205.2,233.1 | 0.6 | 1.4 | [44] |
| Corn and wheat | 10 | 50 mL of methenolone (70%) Magnetic stirrer for 30 min. Centrifugation at 4000 rpm/10 min. 1 mL of supernatant was mixed with 49 mL of 10 mM H3PO4 (pH = 7.5). | Filtration through glass fiber filter paper SPE: CitriTest™ IAC | HPLC-FD: λ exc. 350 nm λ em. 500 nm | Column: C18 (50 × 4.6 mm, 2.5 µm) Temperature: 30 °C Mobile phase: 80% 10mM H3PO4 (pH = 2.5) and 20% ACN Flow rate: 0.5 mL/min Injection volume: 50 µL RT (min): 2.3 | <1 | [47] | |
| Maize | 5 | ACN/H2O/acetic acid (79:20:1) in a ratio of 4 mL solvent/g sample. Rotary shaking at 180 rpm, for 90 min. Dilution with an equal volume of ACN/H2O/acetic acid, 20:79:1. | LC-MS/MS: ESI According to [69] | Column: C18 (150 × 4.6 mm, 5 μm) Gemini Phenomenex Mobile phase: A- MeOH/H2O/acetic acid (10:89:1, v/v/v); B- MeOH/H2O/acetic acid (97:2:1) (both phases with 5 mM NH4Ac) Flow rate: 1 mL/min Temperature: 25 °C | 250 | [70] | ||
| Cereals and cereal products | 20 | 100 mL DCM and 10 mL 0.5 M H3PO4. Shaking for 45 min. | Filtration. SPE: Polyamide column (1 g) 50 mL of the extract; Elution: 5 mL 20% FAc in MeOH. Concentration almost to dryness, at 50–55 °C; Redissolve in 1 mL mobile phase. Filtration through a cellulose filter, 0.45 μm | ELISA HPLC-FD: λ ex. 340 nm λ em. 495 nm | Column: LiChrospher 100, RP18, (250 × 3 mm i.d., 5 µm) Temperature: 30 °C; Injection volume 20 µL; Mobile phases: A- 55% MeOH, 10% ethyl acetate, 35% 0.6 M H3PO4; B- 100% MeOH; Flow rate 0.4 mL/min. RT (min): 6.24–6.33 | 0.8 (wheat) 2.8 (rye) | 3.2 (wheat) 10.3 (rye) | [48] |
| Cereals: maize, wheat, and rice | 5 | 20 mL MeOH: H2O (2:8). Shaking, vigorously, for 15 min. Centrifugation at 8000 g for 10 min. | Dilute the supernatant with an equal volume of PBS (NaCl content at 1.6%). | ic-ELISA and lateral-flow ICA strip analyses | Visual: 8 Strip scan reader:1.28–1.86 | [71] | ||
| Maize | 5 | 20 mL of ACN/H2O/acetic acid (79:20:1, v/v/v). Shaking for 90 min with a rotary shaker. | Centrifuge at 3000 rpm, for 2 min. Dilute 350 µL of the extract with the same volume of ACN/H2O/acetic acid, 20:79:1. | LC-MS/MS: ESI | Column: Gemini® C 18-column (150 × 4.6 mm i.d., 5 μm) Guard column: 4 × 3 mm i.d. (all from Phenomenex) Temp: 25 °C Mobile phases: A- MeOH/H2O/acetic acid (10/89/1, v/v/v); B- MeOH/H2O/acetic acid (97/2/1, v/v/v); both containing 5 mM NH4AC. Flow rate: 1 mL/min; Injection volume: 5 µL RT (min): 11.8 Precursor ion (m/z): 251.1; Q3: 233.2/205.21; Collision energy: 25/39 | CIT—0.16 DH-CIT—2.0 | [46] According to [72,73] | |
| Breakfast cereals | 20 | 20 mL of a 4% KCl at pH 1.5 with H2SO4. Homogenize and extract with 180 mL ACN for 20 min. Filtration under vacuum. | LLE: n-hexane (100 + 100 mL)/1 min. Add to the lower phase 50 mL H2O and 100 mL ClCH3. Shake for 10 min. Collect the lower phase (ClCH3). Re-extracted three times the upper phase with 20 mL ClCH3. Pool the extracts, add 50 mL NaHCO3 and shake for 10 min. Collect the upper phase (bicarbonate), acidify to pH 1.5 with HCl and allow to stand about 20 min. Extract 3 times the acidified solution with ClCH3 (100, 50 and 50 mL). Pool the ClCH3 phases. Evaporate at 40 °C. Redissolve in 2 mL MeOH, sonicate and filter through Spartan 0.2 µm cartridges. Evaporate to dryness under N2. Redissolve in 500 µL MeOH. | HPLC-FD: λ exc. 331 nm λ em. 500 nm | Column: C18 spherisorb column (0.46 × 25 cm, 3 µm); Mobile phase: H3PO4 (0.33 M)/ACN/propan2-ol (700/300/50); Flow rate: 0.7 mL/min RT(min): 19 min. | 0.5 | 1.5 | [49] |
| Complementary foods for infants and young children Breadcrumbs and moldy food samples | 5 | Homogenize with 20 mL of ACN/H2O/acetic acid (79:20:1). Extract for 90 min on a rotary shaker and dilute with the same volume of ACN/H2O/acetic acid (79:20:1). | After sedimentation of the diluted extracts by gravity, 5 μL of the diluted extracts are directly injected. | LC-MS/MS: ESI | Column: Gemini® C 18 (150 × 4.6 mm i.d., 5 μm) Temp: 25 °C Mobile phases: A- MeOH/H2O/acetic acid (10/89/1); B- MeOH/H2O/acetic acid (97/2/1); both with 5 mM NH4AC. Flow rate: 1 mL/min; RT (min): 14.56 Precursor/daughter ions (m/z): 251.0/205.2, 233.0; Collision energy: 25 and 39 eV | 30 | [1,69] | |
| Apples | 50 (whole blended apple) | 200 mL ACN: 4% KCl (9:1). | An aliquot of 70 mL is cleaned-up with H2O, acidified, evaporated to dryness and redissolved in 1ml CHCl3. | TLC λ 366 nm | MDM: 15–20 mg/kg | - | [24,74] | |
| Fruits (apples, oranges, sweet cherries and tomatoes) | 5 | Dilute with H2O to 5 mL. Add 20 mL ACN with 100 mM citric acid. Shake at 150 rpm for 30 min. | Add 2.0 g of NaCl and centrifuge at 10,000 rpm, for 5 min at 10 °C. SPE: MCX+NH2 homemade cartridge: pass 4.0 mL of upper ACN layer and collect; evaporate to dryness at 50 °C under N2. Reconstitute with 1 mL of ACN/H2O (3:7) with 5 mM NH4AC. Filter through a 0.22 µm PTFE membrane filter. | UPLC-MS/MS: ESI+ | Column: C18 ACQUITY CORTECS UPLC (2.1 × 100 mm, 1.6 µm) Temp: 40 °C Mobile phases: A-5 mM NH4AC in H2O; B- ACN; Flow rate: 0.3 mL/min; Injection volume: 3 µL RT (min): 2.82; Precursor/daughter ions (m/z): 251.2/205.2,191.1 | - | 1 ng/mL | [75] |
| Black olives | 25 | Blend with 180 mL ACN, 20 mL 4% KCl and 2 mL 20% H2SO4 for 2 min, at high speed. Filtration. | Add 50 mL hexane. Shake for 15 min. Separate the first 100 mL of the lower phase and add 50 mL CHCl3 and 25 mL H2O. Collect the lower phase and evaporate to dryness under N2 at 55 °C. Redissolve in 1 mL CHCl3 and remove the CHCl3 under N2. Before extracts are spotted, TLC plates are dipped into 10% glycolic acid solution in EtOH for 2 min and then dried for 10 min at 110 °C. The dried toxin extracts are dissolved in CHCl3 (100 L and are spotted onto a TLC plate using a micropipette. | TLC-UV: λ 366 nm The plate is developed with toluene: ethyl acetate: ClCH3: 90% FAc (70:50:50:20), dried and treated with ammonia vapour for 10–15 s (Martins et al., 2002). | - | - | [52] | |
| Black olives | 10 (crushed olive paste) | Add 8 mL of a 4% KCl acidified to pH 1.5 with H2SO4. Homogenize and extract with 72 mL ACN, for 20 min. Filtration under vacuum. | Add 40 mL n-hexane to the filtrate, shake for 1 min. Discard the upper phase (n-hexane). Repeat this defatting operation twice. Add 20 mL H2O and 40 mL CHCl3 to the lower phases. Shake for 10 min. Collect the CHCl3 phase. Re-extract the upper phase 3 times with 20 mL of CHCl3. Pool the 4 CHCl3 extracts, extract with 20 mL NaHCO3 and shake for 10 min. After separation, acidify the aqueous phase (NaHCO3) to pH 1.5 with HCl. Extract the acidified aqueous phase 3 times with CHCl3 (40, 10, 10 mL). Evaporate the pooled CHCl3 extracts at 40 °C. Add 1 mL, sonicate, and filter through Spartan 0.2 μm cartridges. Evaporate under N2. Re-suspended in 500 μL of MeOH. | HPLC-FD: λ exc. 331 nm λ em. 500 nm | Column: C18 nucleosil (0.46 × 25 cm, 4 µm,); Mobile phase: H3PO4 (0.33 M)/ACN/propanol 2-ol (600/400/50); Flow rate: 0.7 mL/min. RT (min): was about 16 min. Confirmation: another mobile phase in which the amount of H3PO4 is increased and ACN is decreased as follows H3PO4 (0.33 M)/ACN/propanol 2-ol (700/300/50) RT (min): 25.0 | 0.2 | 0.5 | [51] |
| Lager beer | -- | Filter untreated and undiluted beer samples through a 0.45 μm filter. Direct injection of 100 μL into an on-line SPE (fused-core Ascentis Express RP C18)—HPLC system | HPLC-FD λ exc. 335 nm λ em. 497 nm | Column: Phenyl-Hexyl (100×4.6 mm, 2.7 μm) Temp: 50 °C Mobile phases: mixtures of MeOH or ACN with a 0.5% acetic acid in H2O, pH 2.8 in the range from 35 to 65%; RT (min): 4.63 | 0.006 µg/L | 0.02 µg/L | [26] | |
| Cheese | ACN-KCl solution (5%; 80:20, v/v) acidified with H2SO4 to pH 3. Agitation for 30 min. | Filtration | TLC- fluorodensitome-ter: at 330 nm | Development system: toluene—ethyl acetate–FAc (6/3/1, vol/vol/vol) | [27] | |||
| Spices | 20 g | ELISA: 100 mL of 70% MeOH; blending for 3 min. Filtration. LC-MS/MS confirmation: 10 g of grinded sample. Mix with 40 mL of ACN:H2O (40:10) and vortex vigorously, for 5 min and shake gently for 45 min. | ELISA: 4 mL of extract (supernatant) is transferred through clean-up columns (RIDASCREEN FAST citrinin Assay (6302) for CIT). LC-MS/MS confirmation: Filter the solution through 0.2 μm nylon filter. Dry 2 mL of filtrate under N2. Reconstitute in 1 mL of ACN:H2O (10:40). | ELISA: 450 nm filter with a differential filter of 630 nm Confirmation: LC-MS/MS: ESI+ | Column: Hypersil Golden C18 (100 mm × 2.1 mm, 3 μm) Temp: 30 °C Mobile phase: 0.1% FAc in 5mM NH4Ac and MeOH Flow rate: 0.3 mL/min Injection volume: 0.5 µL | 15 | [54] | |
| Fermented meat products | 10 g | 50 mL of 70% MeOH. Mix at high speed for a minute. Filtration. Dilute 1 mL of filtrate with 49 mL of 10 mM H3PO4 and mixe. Filter through a microfiber filter. | SPE: IAC column: Load 10 mL of the extract. Wash with 5 mL of 10 mM H3PO4. Elute with 1 mL of MeOH:10 mM H3PO4, 70:30. Vortex the eluate and inject. | HPLC-FD: λ exc. 350 nm λ em. 500 nm | Column: Waters Sunfire C18 (4.6 × 20 mm, 2.5 µm); guard column. Mobile phase: H2O: 0.1% H3PO4: ACN (60:40); Flow rate 1.0 mL/min; Injection volume: 50 µL; RT (min): 5 min. | 0.5 | 1.0 | [53] |
| Dry cured ham | ACN–4% KCl aq (9/1, v/v) acidified by H2SO4 to pH 3. | TLC- fluorimetric detection at 330 nm | According [27] | 20 | [64] | |||
| Sufu Cooked foods Ham Snacks | Ultrasonic assisted extraction | Centrifugal separation and nitrogen blowing concentration | HPLC-FD λ exc. 331 nm λ em. 500 nm | Column: Agilent Eclipse Plus C 18 Temperature: 28 °C Mobile phase: ACN:H2O (35:65) Flow rate: 1 mL/min Injection volume: 10 µL | - | - | [29] |
ACN: acetonitrile; ClCH3: chloroform; DAD: diode array detector; DCM: dichloromethane; EIA: Enzyme Immune Assays; ELISA: Enzyme-Linked Immunosorbent Assay; ES: extraction solvent; ESI: electrospray ion; EW: ethanol:water); FAc: formic acid; FLD: fluorimetric detector; HCl: hydrochloric acid; Hex: hexane; HEPES: 2-[4-(2-Hydroxyethyl)-1-piperazinyl] ethane sulphonic acid; H2O: water; H2SO4: sulfuric acid; H3PO4: phosphoric acid; ICA: immunochromatographic assay; ic-ELISA: indirect competitive ELISA; KCl: potassium chlorine; LC-MS/MS: Liquid Chromatography-Mass Spectrometry-Mass Spectrometry; LLE: liquid-liquid extraction; MDM: minimum detectable concentrations; MeOH: methanol; m-MISPE: molecularly imprinted solid-phase extraction; MgSO4: magnesium sulphate; NaCl: sodium chloride; NaHCO3: sodium bicarbonate; N2: nitrogen; NH4AC: ammonium acetate; PBS: phosphate-buffered saline; QuEChERs: Quick, Easy, Cheap, Effective, Rugged and Safe; RP: reverse phase; TBA: tetra-n-butylammonium hydrogen sulphate; TFA- trifluoroacetic acid, US: ultrasonication; UV: ultraviolet. --: this step was not been done.
Publisher’s Note: MDPI stays neutral with regard to jurisdictional claims in published maps and institutional affiliations. |
© 2020 by the authors. Licensee MDPI, Basel, Switzerland. This article is an open access article distributed under the terms and conditions of the Creative Commons Attribution (CC BY) license (http://creativecommons.org/licenses/by/4.0/).
Share and Cite
MDPI and ACS Style
Silva, L.J.G.; Pereira, A.M.P.T.; Pena, A.; Lino, C.M. Citrinin in Foods and Supplements: A Review of Occurrence and Analytical Methodologies. Foods 2021, 10, 14. https://0-doi-org.brum.beds.ac.uk/10.3390/foods10010014
AMA Style
Silva LJG, Pereira AMPT, Pena A, Lino CM. Citrinin in Foods and Supplements: A Review of Occurrence and Analytical Methodologies. Foods. 2021; 10(1):14. https://0-doi-org.brum.beds.ac.uk/10.3390/foods10010014
Chicago/Turabian StyleSilva, Liliana J. G., André M. P. T. Pereira, Angelina Pena, and Celeste M. Lino. 2021. "Citrinin in Foods and Supplements: A Review of Occurrence and Analytical Methodologies" Foods 10, no. 1: 14. https://0-doi-org.brum.beds.ac.uk/10.3390/foods10010014
Note that from the first issue of 2016, this journal uses article numbers instead of page numbers. See further details here.