Article

Biofilm-Forming Ability of Microbacterium lacticum and Staphylococcus capitis Considering Physicochemical and Topographical Surface Properties

1
Institute of Food Technology, University of Natural Resources and Life Sciences Vienna (BOKU), 1190 Vienna, Austria
2
Institute of Food Science, University of Natural Resources and Life Sciences Vienna (BOKU), 1190 Vienna, Austria
3
Institute of Physics and Material Sciences, University of Natural Resources and Life Sciences Vienna (BOKU), 1190 Vienna, Austria
*
Author to whom correspondence should be addressed.
Submission received: 10 February 2021 / Revised: 8 March 2021 / Accepted: 10 March 2021 / Published: 13 March 2021

Abstract

:
Biofilm characteristics of Microbacterium lacticum D84 (M. lacticum) and Staphylococcus capitis subsp. capitis (S. capitis) on polytetrafluoroethylene and AISI-304 stainless steel at early- (24, 48 h) and late-stage (144, 192 h) biofilm formation were investigated. M. lacticum biofilm structure was more developed compared to S. capitis, representing vastly mature biofilms with a strongly developed amorphous matrix, possibly extracellular polymeric substances (EPSs), at late-stage biofilm formation. S. capitis showed faster growth behavior but still resulted in a relatively flat biofilm structure. Strong correlations were found between several roughness parameters and S. capitis surface coverage (r ≥ 0.98), and between total surface free energy ( γ s ) and S. capitis surface coverage (r = 0.89), while M. lacticum remained mostly unaffected. The pronounced ubiquitous biofilm characteristics make M. lacticum D84 a suitable model for biofilm research. Studying biofilm formation of these bacteria may help one understand bacterial adhesion on interfaces and hence reduce biofilm formation in the food industry.

1. Introduction

Biofilms are the most frequent cause of food contamination and thus a leading health and safety concern, as reported by several reviews [1,2,3,4]. They are also linked to chronic infections, as well as foodborne illness outbreaks [5,6]. As biofilms show increased resistance to mechanical, physsical, and chemical treatments, in comparison to their planktonic state [7], it is crucial to select suitable sanitation methods [8]. It is vital to understand that the embedded extracellular matrix of persistent biofilms can protect present potential pathogens and spoilage microorganisms from disinfection treatments [9]. Any persistent microorganism with the ability to form biofilms can lead to human diseases or alteration in sensory characteristics [4].
In biofilm research, also known as “biofilmology” [10], the biofilm-forming ability describes whether the tested microorganism is capable of producing biofilms at the tested growth conditions, including medium composition, temperature, pH and osmolarity [11]. Zou and Liu [12], focusing on bacterial isolates from a milk powder processing facility, classified their tested strains in negative, weak, moderate, and strong biofilm producers.
Staphylococcus spp. are Gram-positive, nonspore-forming, and cocci-shaped bacteria, known for strong biofilm formation [13,14]. Staphylococci belong to the most frequently isolated bacteria from food contact surfaces [15,16]. Like Staphylococcus aureus (S. aureus), S. capitis is a human skin contaminant and a known opportunistic human pathogen [17], being able to grow on the skin or mucous membranes of people. In contact with food, it is a major challenge for the food industry. Different S. capitis strains with biofilm-formation potential were previously isolated from poultry and bakery producing environments and showed high resistance against conventional disinfectants, such as chlorhexidine and quaternary ammonium compounds [18]. Besides staphylococci, Microbacterium spp. were previously isolated from dairy, egg, ready-to-eat, and meat-producing industries [9,19,20], among which M. lacticum is abundant on food contact surfaces in dairy-related facilities [9,19]. Microbacterium spp. are Gram-positive, nonsporulating, rod-shaped bacteria. M. lacticum adherent to abiotic surfaces is not only found to be persistent against cleaning and disinfection [9] but also against pasteurization [20]. The study by Weber, Liedtke, Plattes and Lipski [9] also reported that isolated M. lacticum can lead to contamination and reduced shelf-life of ultra-high-temperature (UHT) processed milk, due to its spoilage- and biofilm-forming potential. Both S. capitis and M. lacticum were previously studied in their planktonic form, but there was no detailed study on their biofilm-related characteristics.
In principle, bacterial adhesion occurs on any liquid/solid interface, including food contact surfaces, liquid pipelines, or gaskets. Biofilm development includes a first phase, where bacteria reversibly and irreversibly adhere to the interface. Subsequently, microcolonies and a three-dimensional shaped architecture embedded in extracellular polymeric substances (EPSs) forms. After the maturing phase, single motile bacteria detach from the biofilm and may colonize in new trenches, pits and crevices [21,22,23,24,25]. Reasons for biofilm dispersion vary and include limited nutrient availability, fluid shear stress, or enzymatic activities [1].
Since stainless steel (SS) and polytetrafluoroethylene (PTFE) are widely used as food contact materials, they have been often applied in biofilm research [26,27]. SS is preferably used for process equipment due to its high mechanical strength, cleanability, and corrosion resistance. The austenitic SS grades AISI-304 and the low carbon type AISI-304L are considered as corrosion-resistant at ambient temperature, with a pH ranging from 6.5 to 8.0, and low chloride levels. Thermoplastic polymers such as PTFE are used as e.g., conveyor and belt coatings [28]. Due to its sensibility to temperature changes, potentially resulting in brittle cracking, it may become more challenging to clean. Moreover, surface damages due to abrasion or aging can reduce the cleanability of plastic materials and promote biofilm development [29,30].
As bacterial biofilm adhesion and its correlation to interfacial surface characteristics are still controversially discussed, a better understanding is needed to understand the mechanisms of biofilm formation and further to reduce and/or prevent biofilm-associated contaminations [31] in open and closed processes. Therefore, this research aims to mimic the growth behavior of static mono-species S. capitis and M. lacticum biofilms on food contact surfaces such as SS and PTFE in vitro. Microscopic, physicochemical (hydrophobicity measurements), mechanical (roughness), and culture-based methods were used to analyze interfacial surface characteristics in correlation to biofilm adhesion.

2. Materials and Methods

2.1. Selected Bacterial Isolates and Culture Conditions

M. lacticum D84 (EF204392), isolated from extended shelf-life (ESL) milk, and S. capitis subsp. capitis, isolated from an air decontamination step prior to packaging at a meat production facility, were selected for biofilm studies, as they are persistent food-related contaminants with less studied biofilm-related characteristics. The isolates were preserved in a 50% (v/v) glycerol stock at −80 °C. To obtain a stock culture, bacteria were sub-cultured overnight in tryptic soy broth (TSB; Carl Roth, Karlsruhe, Germany) at 37 °C and in 0.8% (v/v) skimmed milk broth (MB; Carl Roth, Karlsruhe, Germany) at 30 °C, for S. capitis and M. lacticum, respectively. Subsequently, stock cultures were then streaked onto either tryptic soy agar (TSA) or milk agar (MA) (Carl Roth, Karlsruhe, Germany) and incubated at 37 °C or 30 °C overnight and stored at 4 °C. Before each experiment, one colony was inoculated in 10 mL fresh TSB or MB, and the optical density 600 (OD) was standardized to 0.1 (corresponding to 6.7 ± 0.2 log10 colony-forming units (CFUs) per mL−1 and 8.5 ± 0.2 log10 CFUs mL−1 for S. capitis and M. lacticum, respectively) to obtain a working culture.

2.2. Surface Materials and Cleaning Procedure

PTFE coupons (Ø = 22 mm, 1.0 mm thickness; GAMMA Kunststofftechnik GmbH, Vienna, Austria) and austenitic AISI-304 SS coupons (EN 1.4301; Ø = 22 mm, 0.5 mm thickness; Metallvertrieb ds GmbH, Surheim, Germany) were used as abiotic surface materials. SS coupons, consisting of 18% chromium, 10% nickel, and < 0.03% carbon [32], were mechanically polished by 320 and 240 grit (SS 320, SS 240) to achieve different surface roughness. Before each experiment, surfaces were cleaned according to Pérez Ibarreche, et al. [33] with acetone and 1 M of NaOH. Subsequently, coupons were autoclaved.

2.3. Biofilm Formation on Model Surface Materials

For biofilm growth on surface materials, 3 mL of the working culture was pipetted into a petri-dish (35 × 10 mm; Greiner Bio-One, Kremsmünster, Austria) and biofilm formation was analyzed up to 192 h, with orbital shaking (60 rpm) at 30 °C for M. lacticum or without shaking at 37 °C for S. capitis. Non-adherent bacterial cells were removed at 24, 48, 72, and 144 h by gently rinsing twice with 3 mL of phosphate-buffered saline (PBS, pH 7.4, composition: 0.14 M of NaCl, 2.7 mM of KCl, 10 mM of phosphate; Carl Roth, Karlsruhe, Germany). The biofilms were incubated accordingly.

2.4. Culture-Based Analysis of Biofilms

The biofilm growth was enumerated at 24, 48 144, and 192 h by the drop plating method. For cell detachment efficiency, scraping and sonication were compared. For scraping (mechanical action), coupons were washed twice in PBS, resuspended in 1 mL of PBS and scraped off four times vertically and horizontally by using a sterile pipette tip (Figure S1). The solution was centrifuged at 4000× g for 10 min. Subsequently, after tenfold serial dilution, samples were drop plated (6 × 5 µL; 10−1–10−6) onto TSA (37 °C, 24 h) or MA (30 °C, 72 h) and expressed as log10 CFU cm−2. For the sake of simplicity, log10 will be referred to as log hereafter. For the sonication (ultrasound; chemical and physical action), the coupons were washed, resuspended in 1 mL of PBS and treated three times for 1 min at 35 kHz (Ultrasonic bath, Sonorex RK100H; Bandelin electronic, Berlin, Germany), as described by Schulte [34] and drop plated. The treatment time for cell removal was assessed in pre-trials to exclude cell injury by sonic waves (data not shown). For both methods, a minimum of three biological and technical triplicates was performed.

2.5. Surface Coverage and Cell Viability with Epifluorescence Microscopy (EFM)

The biofilms were washed and stained with 3.34 µM of SYTOTM 9 (Thermo Fisher Scientific, Waltham, MA, USA) and 20.00 µM of propidium iodide (PI; Thermo Fisher Scientific, Waltham, MA, USA) in TSB and incubated for 20 min at 37 °C in the dark, as described by Rodríguez-Melcón, et al. [35]. The surface coverage and viability of biofilm formation on surface materials was quantified at 24, 48, 144, and 192 h using a stereomicroscope (Olympus SZX16; Olympus, Vienna, Austria). Measurements were conducted using two filter cubes, with an excitation filter of BP470/40 and BP545/30, for SYTOTM 9 and PI, respectively, with a magnification of 7× and 100×. The quantitative area of cells with an intact cell membrane (viable; green fluorescence) and membrane-comprised cells (dead; red fluorescence) was analyzed using ImageJ/NIH image software (Version 1.48v) [36]. Negative controls of surface materials and nutrient media without staining procedure were included and subtracted from the final results. Measurements were performed in biological and technical triplicates.

2.6. Descriptive and Structural Evaluation of the Biofilm Matrix by Scanning Electron Microscopy (SEM)

For the structural analysis of exemplary early and late biofilm growth with SEM (QuantaTM 250 FEG; FEI, Hillsboro, OR, USA), biofilm formation at 48 and 192 h was considered. After biofilm growth on small SS and PTFE coupons (10 × 10 mm, l × w), fixation and dehydration steps of biofilm specimens were performed, as described by Murtey and Ramasamy [37] but without postfixation. Fixation was carried out overnight in a 2.5% (v/v) glutaraldehyde solution at 4 °C. After ascending dehydration steps with an ethanol and 25% hexamethyldisilazane solution, the samples were dried in a desiccator at 20 °C for 16 h. Before SEM analysis, the specimens were mounted on an SEM sample stub and gold-coated (HHV Scancoat Six; HHV Ltd., Crawley, United Kingdom). Specimens were scanned with an emission current of 216–230 µA and a high vacuum (chamber pressure: 0.1 mbar) at an accelerating voltage of 20 kV and 10.0 mm WD or 10 kV and 5.5 mm WD, for SS or PTFE specimen, respectively. Images of biological duplicates were taken at magnifications of 1000×, 5000×, 10,000×, 30,000×, and 55,000×.

2.7. Surface Topography Measurement

The areal surface roughness and line roughness, according to ISO 25178-2:2012 [38] and BS EN ISO 4288:1998+A1:2009 [39] was defined using a three-dimensional CLSM (VK-X1000; Keyence International, Mechelen, Belgium). For the areal surface texture, which is an extension of the line profile roughness, the mean arithmetic height of the surface roughness (Sa), the maximum height (Sz), the root mean square height (Sq), the maximum pit height (Sv) and the maximum peak height (Sp) were assessed. For line roughness, Ra, the mean roughness depth (Rz), Rq, the maximum depth of valleys (Rv), the maximum height of peaks (Rp) and RSm, a line roughness spacing parameter, were included. For line roughness parameters, 41 measurements were performed, while for Sa- and Sz-values, one representative surface material was analyzed. It has to be noted that mechanical interactions during the grinding of steel surfaces, like for AISI 304 SS, cause surface roughness anisotropy [40]. In this study, only roughness parameters perpendicular to the main surface structure were considered.

2.8. Physicochemical Surface Properties

Contact angle measurements were performed with a drop shape analyzer (Digidrop; Fa. GBX, Romans-sur-Isère, France) at room temperature by the sessile drop method. The analysis was carried out to investigate surface hydrophobicity, also known as wettability. For each measurement, with the help of a microsyringe, ~5 µL of liquid was carefully dropped on the surface. For pure contact angle measurements, MB and TSB were applied. For steel surfaces, all contact angles were measured perpendicular to the main surface structure.
For surface free energy calculation, reference liquids, including diiodomethane, formamide (both >99.5% purity, VWR International, Radnor, PA, USA), and dH2O, were used. Droplets were placed on the specimens, and time series of ten seconds were recorded. Every 40 ms, the right and left contact angles were evaluated and averaged. A minimum of 4 drops was placed on two independent surfaces. Surface free energy parameters were calculated based on the acid-base approach according to Van Oss, et al. [41]. The work of adhesion can be described as follows and gives the formal connection of the contact angle with the surface free energy components:
γ L ( 1 + cos   θ ) = 2 [ ( γ S L W γ L L W ) + ( γ S + γ L ) + ( γ s γ L + ) ]
the total surface free energy ( γ s )   consists of the Lifshitz-van der Waals component ( y s L W ) and the polar Lewis acid–base component ( y i A B ) . y i A B consists further of the electron-acceptor ( γ s + )   and -donor parameter ( γ s )   [42,43]; γ L is the surface tension of the liquid:
y S = y s L W +   y i A B
y i A B = 2   γ s + γ s

2.9. Statistical Analysis

Results are presented as the mean value ± standard deviation. For statistical significance, a multifactor ANOVA with two independent factors and Tukey’s t-test were carried out in Statgraphics Centurion XVIII (Statpoint Technologies, Inc., Warrenton, FL, USA). A statistical significance was considered at p < 0.05. For goodness-of-fit statistics, the regression coefficient r2 was measured. The linear correlation coefficient (r) was used to obtain the relationship between biofilm growth or surface coverage to surface characteristics. Data were visualized with Sigma Plot 13 (Systat Software, Inc., San Jose, CA, USA).

3. Results and Discussion

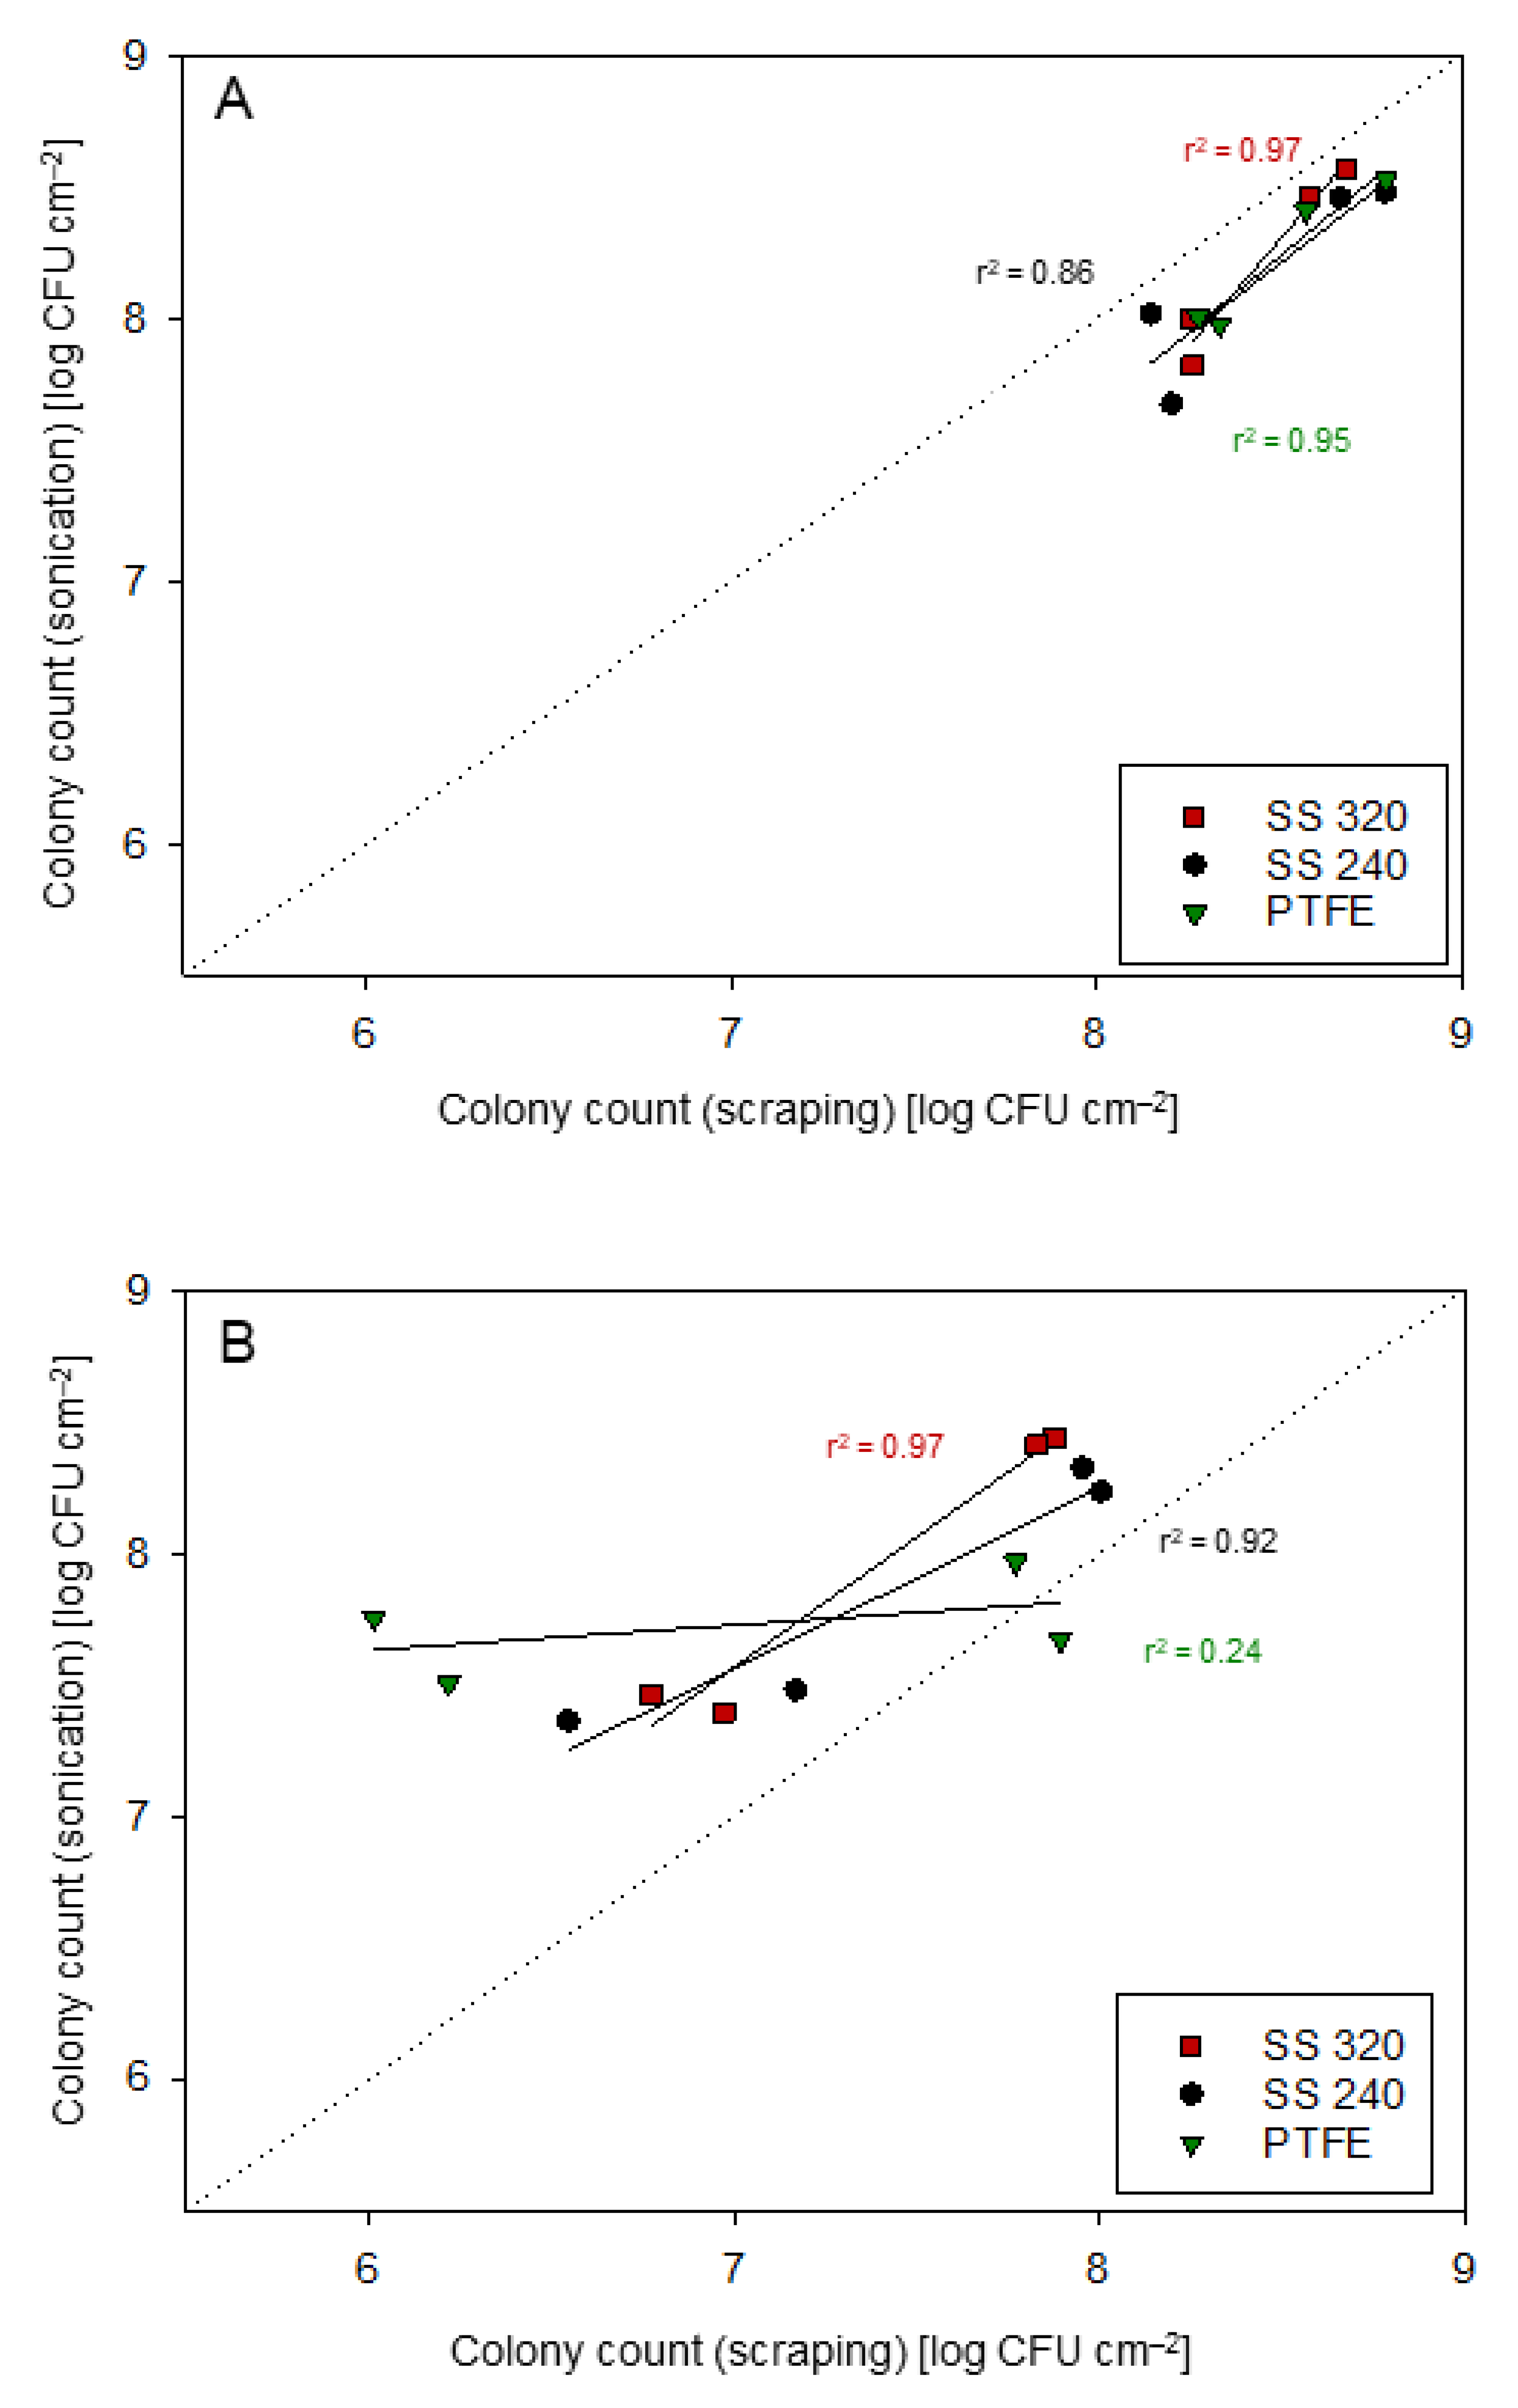
3.1. Comparison of the Bacterial Cell Detachment Approaches

According to the literature, different approaches are used for cell detachment, including scraping with a sterile pipette tip [44,45] or stick [46], sonication [34,47,48,49], wet-swabbing [50] or the violent water-flapping method, introduced by Wang, et al. [51].
As it is crucial to use reproducible methods, the present study compared scraping and sonication for S. capitis and M. lacticum biofilm formation at the early- (24–48 h) and late-stage (144–192 h) (Table S1). Goodness-of-fit statistics (r2 ≥ 0.92; Figure 1) indicated high agreement with M. lacticum or S. capitis colony counts obtained by scraping and sonication, except for M. lacticum growth on SS 240 and S. capitis growth on PTFE. For M. lacticum on SS 240, the growth difference (≤0.5 log CFU/mL) between both methods was within the normal range of experimental error and thus not further considered. In contrast, S. capitis growth on PTFE at the early-stage was significantly (p < 0.05) different between the two methods, indicating higher counts after sonication. It is assumed that either scraping underestimated S. capitis counts on PTFE or that the biofilm in these experiments developed poorly, containing a lower quantity of cells. Bjerkan, et al. [52] concluded that sonication efficiently removed biofilm cells from surfaces, while different scraping approaches used in their study removed fewer cells and resulted in inconsistent findings. In contrast, Kragh, et al. [53] reported that scraping in schematic order with a sterile pipette tip removed significantly more cells from a well (90% of attached cells) than sonication. In the present study, detachment by scraping showed very consistent findings (experimental error ≤0.4 log CFU/mL), even though it is based on mechanical action. Scraping was also more in line with data obtained by SEM and quantitative EFM measurements than detachment by sonication. Hence, the results presented in the following Section 3.2. are based on the scraping method.

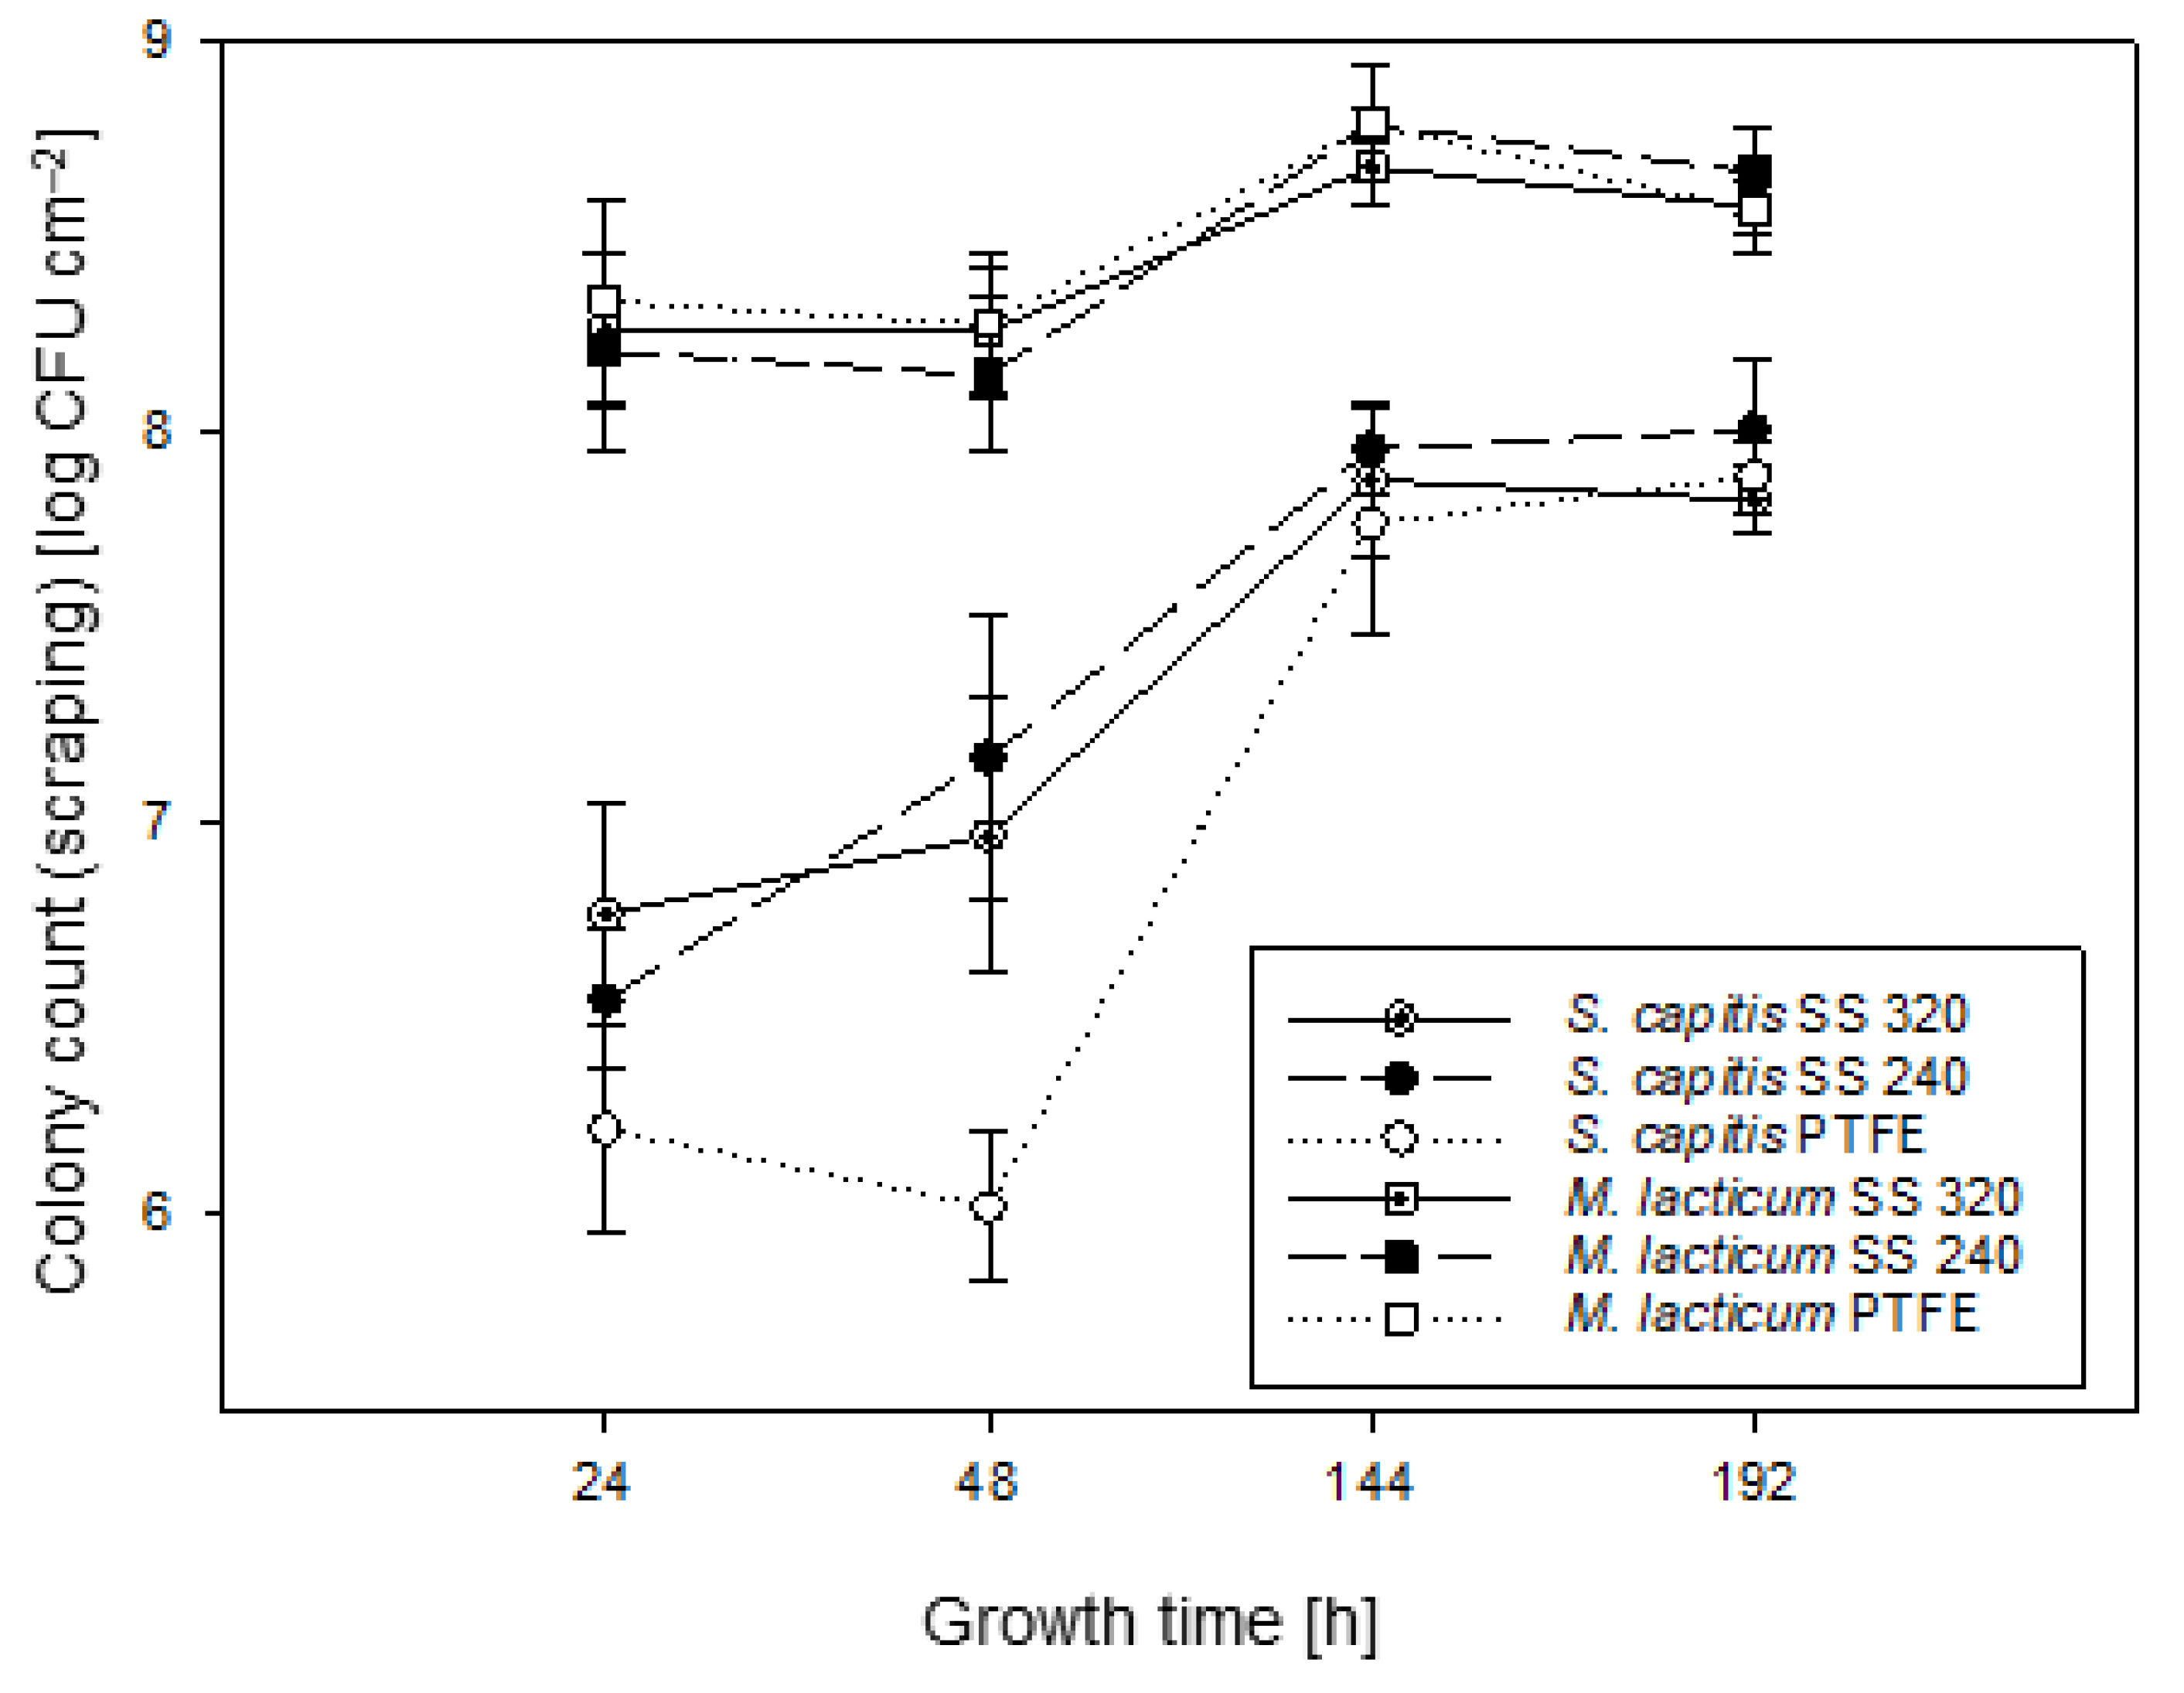
3.2. Culture-Based Enumeration of Biofilm Development Using the Scraping Technique

Figure 2 illustrates the biofilm growth behavior of M. lacticum and S. capitis, removed from the substrate by scraping. Overall, the extent of S. capitis biofilm growth (max. 7.2 log CFU cm−2) at the early-stage (24–48 h) was similar to previous findings for S. carnosus at 48 h (max. 6.6 log CFU cm−2) [54] and S. aureus biofilms at 240 h (max. 6.3 log CFU cm−2) [55]. For M. lacticum biofilm growth, a slight peak at 144 h (max. 8.8 log CFU cm−2) and a subsequent slight decrease in log CFU cm−2 was observed. Together with EFM data (Section 3.3, Figure 3), this leads to the assumption that at 192 h, single bacteria already detach from the biofilm, resulting in the dispersal phase. In contrast, for S. capitis biofilm growth, the highest log CFU cm−2 within the investigated period of time was observed at 192 h (max. 8.0 log CFU cm−2). These findings indicate fully mature biofilms at 144 h and 192 h (late-stage), for M. lacticum and S. capitis, respectively. In the study of Iñiguez-Moreno, et al. [56], several mono-species biofilms resulted in full maturity on SS and polypropylene surfaces at 240 h, resulting in a growth of ≥7.7 log CFU cm−2. These findings are in agreement with late-stage biofilm formation in the present study. The present findings showed that M. lacticum biofilm growth was significantly more developed (p < 0.05) than S. capitis, even though for S. capitis, a trend towards faster growth was indicated.
If one considers the growth curves solely, the tested surface materials did not significantly (p < 0.05) affect the biofilm growth. Only bacterial growth on PTFE after 48 h was significantly lower (p < 0.05) compared to SS surfaces. Likewise, bacterial attraction to specific interfaces was controversially discussed in the literature. Planchon, Gaillardmartinie, Leroy, Bellonfontaine, Fadda and Talon [54] found a preferred growth of S. carnosus biofilms on SS (AISI-304) compared to PTFE surfaces. Other researchers suggested that Staphylococcus spp. attach and stick very well to plastic surfaces [57,58,59]. The latter was related to autolysins [17]. Several studies linked specific surface characteristics, including roughness or hydrophobicity, to cell adhesion, which is discussed in Section 3.5 and Section 3.6.
At the time of research, there was no other study focusing on M. lacticum biofilm growth characteristics. Comparative discussion for the observed strain was, therefore, quite challenging. In the literature, protease activity was considered as a promotor for the strong biofilm formation of M. lacticum [9]. Vithanage, et al. [60] found protease, lipase, or phospholipase C activity in over 80% of Microbacterium raw milk isolates. Those enzymes are suggested to have different key roles within the biofilm formation process. The ubiquitous and strong biofilm growth of M. lacticum, independent of substrate properties or temperature changes [20], as well as its increased resistance to disinfectants [9], render M. lacticum as a highly persistent challenge for the food industry.

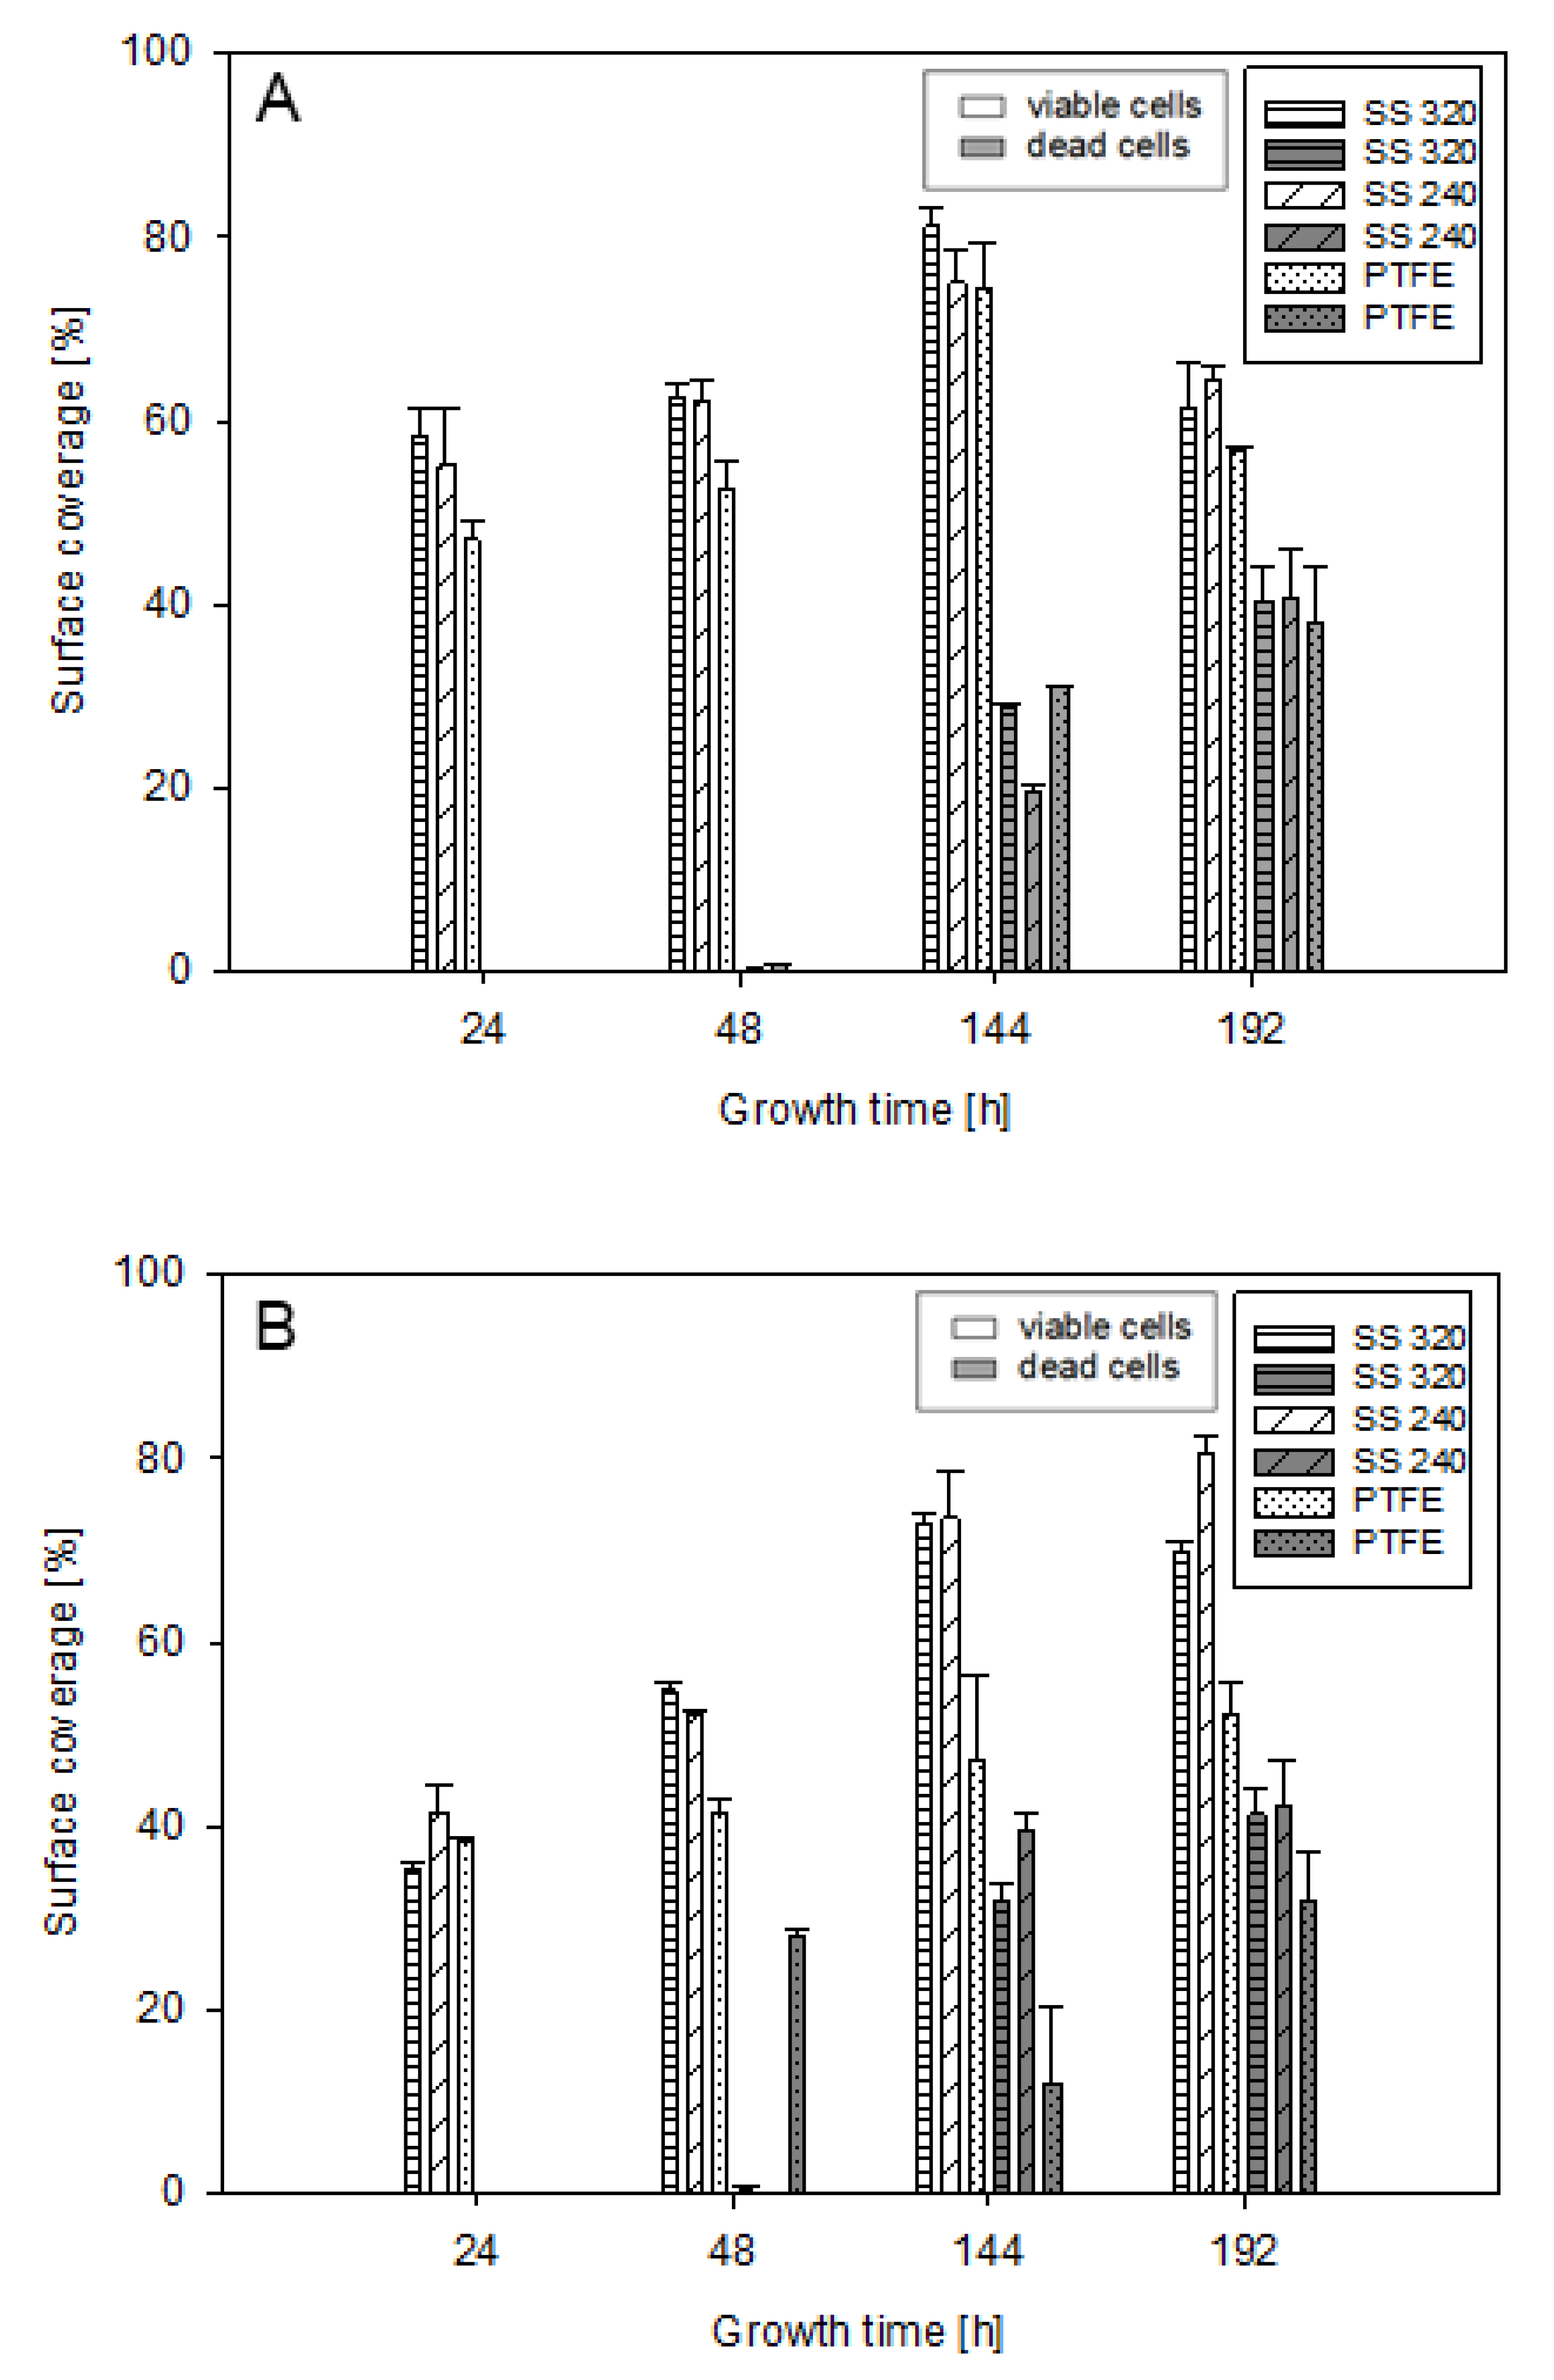
3.3. Surface Coverage and Biofilm Viability

Surface coverage and viability of M. lacticum and S. capitis cells were assessed at early- (24–48 h) and late-stage (144–192 h) biofilm formation (Figure 3). The proportion of viable intact cells, covering the observed area of 260.55 mm2, ranged from 35–81% for S. capitis biofilms and from 47–81% for M. lacticum biofilms. Hence, indicating the same maximum proportion of viable cells at late-stage biofilm formation. For M. lacticum, dead cells resulted in ≤1% and 29–41%, and for S. capitis in 0–28% and 12–42%, at early- and late-stage biofilm formation, respectively. Late-stage biofilm formation showed an overall significant (p < 0.05) increase in impaired cells in comparison to biofilm formation at the early-stage. Solely for S. capitis on PTFE, there was no significant difference (p > 0.05), as a relatively high amount of dead cells (28%) was already observed at 48h. Together with the descriptive SEM data (showing compromised cell membranes; Section 3.4, Figure 4F) and its lower lag phase, as indicated in the growth curve (Section 3.2, Figure 2), inferior growth conditions for S. capitis on PTFE surfaces are assumed. Therefore, S. capitis cells on PTFE require a more prolonged adaptation phase for biofilm formation. verall, the biofilm viability and surface coverage underlined the biofilm maturity of M. lacticum and S. capitis at late-stage biofilm formation, as previously suggested from culture-based analysis. The increased amount of dead cells at late-stage biofilm formation is in agreement with previous findings for Listeria monocytogenes (L. monocytogenes) [61] and Staphylococcus spp. biofilms [17,62]. It is known that individual bacterial cells can deliberately exceed their exponential growth phase in order to achieve a growth decline or die. This stress response mainly occurs as nutrients diminish and it enables cells to contribute to the preservation of the biofilm structure as well as to protect the system from energy loss [17,61,62]. Moreover, damaged or dead cells usually contribute to a greater extent to outer layers of the biofilm, which is known as a protection mechanism [63].EFM as an analytical method might over- or underestimate the proportion of live and dead cells, as the method only supports two-dimensional images, while biofilms have complex three-dimensional structures. With flow cytometry as an alternative approach for the viability analysis of biofilms, it is possible to elucidate this error as cell aggregates are dissolved, and single cells inside the biofilm are measurable [64]. If studying biofilms on transparent surfaces, a detailed analysis of the three-dimensional biofilm structure, including its viability, can be performed with confocal laser scanning microscopy [65]. Considering the direct staining of the cells, biases such as the background fluorescence of PI in the unbound form or bleaching of SYTOTM 9, especially during SYTOTM 9-PI staining, can occur [66]. Another limitation is that the nutrient media [67], surface materials [68], or cells themselves [69] can emit autofluorescence and thus, false-positive results can occur. SS is known as non-autofluorescence substrate [68] in the nanometer range observed within this study. Besides the surface materials, the nutrient broths, such as TSB or MB, could have slightly affected the results, even though negative controls were included and subtracted from samples. Such unwanted signals, also known as background or noise that do not represent fluorescence, are a fundamental challenge for fluorescence-based assays [69] and could explain why the percentage of total surface coverage (=viable and dead cells) was sometimes higher than 100%. EFM is a supportive analysis for viability and morphology but may not be suitable as a standalone method for biofilm research.

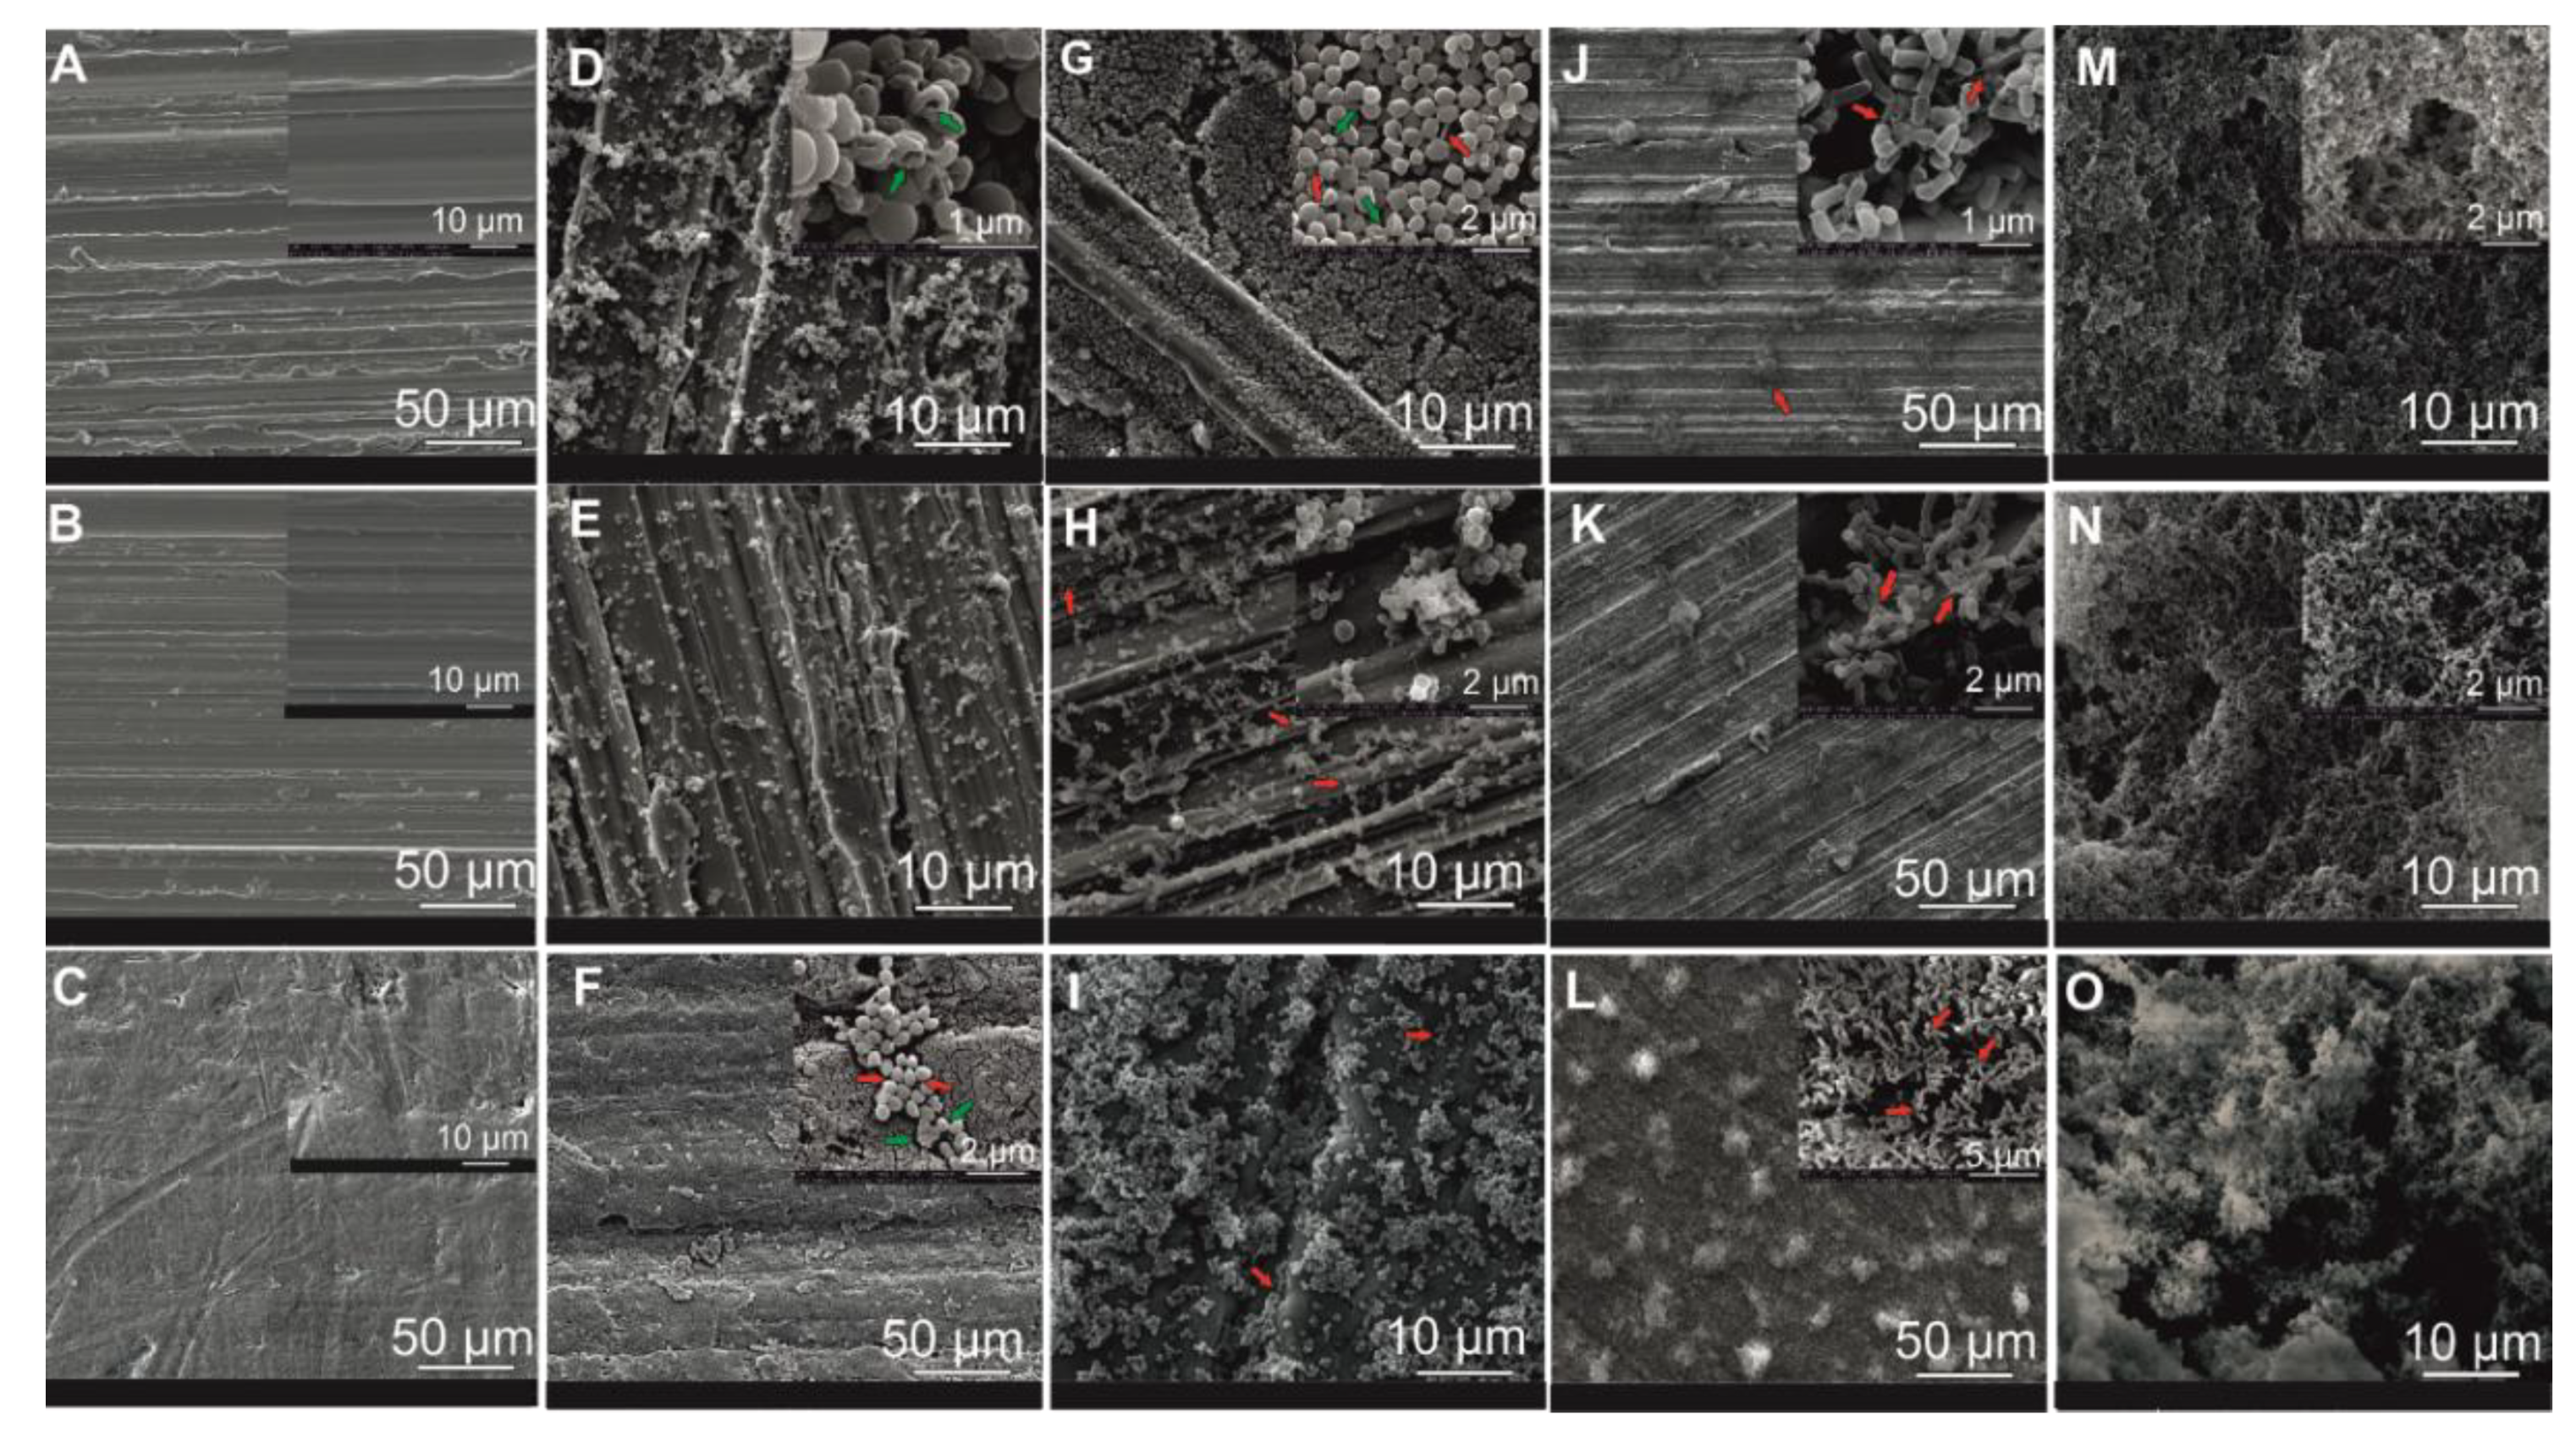
3.4. Qualitative Structural and Morphological Biofilm Analysis

In Figure 4, SS 240, SS 320, and PTFE surface topography as well as microstructural M. lacticum and S. capitis biofilm formation at both the early- and late-stage (48 h and 192 h), are visualized.
At 48 h, adhered S. capitis formed evenly distributed microcolonies, resulting in a flat and patchy structure (Figure 4D–F). Their appearance as grape-like clusters was most evident on PTFE coupons, while growth on SS 240 suggested the first three-dimensional structures. At 192 h, cells indicated different appearances on the three surface materials (Figure 4G–I). On SS 240, cells almost completely covered the surface, showing a very dense structure, while on PTFE, the three-dimensional structure appeared more pronounced, but the surface was not yet covered. Notwithstanding, only weak amorphous matrices, possibly EPSs, have formed. Besides, damaged cells, characterized by a rough and shrunken appearance [44], were visible in some of the S. capitis close-up views (Figure 4D,F–H; green arrows) and are in agreement with quantified dead cells obtained with EFM (Section 3.3, Figure 3). Cell-to-cell interactions are envisioned in the close-up view of SS 240.
The M. lacticum growth resulted in three-dimensional structures at 48 h (Figure 4J–L), most evident on PTFE surface. In the close-up views of M. lacticum (Figure 4J–L, red arrows), amorphous matrix, fibers, and amorphous substances, most likely EPSs, were evident. EPSs were generally observed as thin fibers or filaments, as the extracellular matrix, consisting of 95% water, collapsed due to dehydration during SEM sample preparation [70]. At 192 h, a very thick and stable M. lacticum biofilm matrix with a relatively homogenous solid amorphous matrix covered the surface materials (Figure 4M–O).
Overall, M. lacticum produced a mature and rigid biofilm, while S. capitis biofilms were indicated as flat and pliable structures. The amorphous matrix, possibly an EPS, was vastly more developed for M. lacticum than for S. capitis. Growth curves also showed a slight increase in M. lacticum compared to S capitis growth, but colony counts in the late-stage biofilm formation resulted in a marginal difference only (<1 log CFU/cm−2; Section 3.2, Figure 2). This highlights that the structural analysis of biofilms is essential in addition to culture-based analysis, as the latter does not consider the biofilm morphology and structure and might lead to false predictions about the biofilm-forming ability if used as a standalone method. Besides morphological observation, EPS production can be quantified with techniques such as the phenol–sulfuric acid method [71].
The structural appearance of S. capitis is was comparable to other findings for S. aureus biofilms at 48 h and 72 h on polystyrene plates [44]. The present findings of M. lacticum were compared to other genera, as studies on M. lacticum biofilms are very limited. Observations for M. lacticum at 48 h were in agreement to findings for Lactobacillus sakei biofilms on SS and PTFE at 6 d (144 h) [33], while its appearance at 192 h was similar to images for L. monocytogenes on rubber surfaces [72]. Interestingly, M. lacticum biofilm growth was also similar to a multi-species biofilm consisting of typical food-related biofilm formers [56]. In a study by Techer, Jan, Gonnet, Grosset, Gautier and Baron [20], Microbacterium spp. and Staphylococcus spp., isolated from food contact surfaces, showed similar adhesion behavior to SS (AISI-304). Hence, the highly developed biofilm-forming characteristics of M. lacticum on the tested food contact materials are probably not related to its rapidity in adhesion and growth. It is suggested that M. lacticum D84 is a suitable biofilm strain for further application studies.
For both biofilm formers, different appearances on SS and PTFE surfaces were observed, which can be explained as follows. An adaptation of the extracellular matrix to the substratum topography can cause discrepancies. According to Pérez Ibarreche, Castellano and Vignolo [33], the microcolonies on SS cover all scratches, which results in an overall smoother appearance of their microstructure, while in contrast, on overall flat PTFE, a more amorphous extracellular mass appears. Artifacts can also occur due to material reflection. Besides, the high accelerating voltages used during SEM measurements can have also negatively affected the structural appearance of the biofilm structure [73]. However, similar accelerating voltages, as used in the present study, were previously reported for biofilm research [44,71].

3.5. Effect of Surface Roughness on Biofilm Formation

As a recent review concluded, no clear correlation has yet been found between biofilm growth and surface topography [31]. Still, according to EHEDG Document No. 8 [74], the use of surfaces with Ra-values < 0.8 µm is recommended for food process equipment to realize improved cleanability and prevent bacterial contaminations. However, the effect of surface roughness on bacterial adhesion has been controversially discussed. It should also be noted that surfaces with similar roughness parameters can still have significantly different topographies [75]. Hence, roughness may not be used as a surface indicator for hygienic design properties and cleanability by itself.
In the present study, both line roughness (Ra, Rz, Rq, Rv, Rp, RSm) [76] as well as areal surface texture parameters (Sa, Sz, Sq, Sv, Sp), were considered (Table 1). The Ra-value defines the height deviation of an area but does not differentiate between valleys, peaks, or spatial structures [29] and is not sensitive to minor alterations. The root mean square roughness (Rq) is more sensitive to deviations than the Ra-value and thus a vital roughness parameter [76]. SS 240 was the overall roughest material with an Ra-value of 1.0 µm and Sa-value of 1.1 µm, while PTFE was the smoothest substrate, if referring solely to Ra- and Sa-values (Ra: 0.2 µm, Sa: 0.5 µm). The differences between the line and areal surface parameters are reasonable, as measurements differ [77]. The Rq and Sq values in the present study were in line with the Ra and Sa values and thus, were not further considered. Moreover, the RSm-value (also known as a spacing parameter), which indicates the average distance between profile peaks on the centerline [76], was comparable on all three tested surface materials, ranging from 9.7–10.7 µm. For PTFE coupons, the high Sz-value (15.1 µm) combined with the relatively low Sa-value (0.5 µm) underlined surface irregularities such as pits and scratches. Besides, a high maximum depth of valleys (Rv) and a high maximum height of peaks (Rp) could positively affect the bacterial attachment to a surface since protection against external forces is increased. In the present study, the highest values for Rv (1.7 µm), Rp (2.1 µm), Sv (9.7 µm), and Sp (5.1 µm) were observed for SS 240.
For S. capitis, the different roughness parameters, except for Sz, positively correlated with the average amount of viable intact cells covering the surface (r ≥ 0.98), further referred to as surface coverage, indicating increased surface coverage on surfaces with higher roughness values (Figure 3, Section 3.3). The preferred growth on SS 240 was also assumed from graphical SEM data (Figure 4, Section 3.4). Previous studies were in agreement and reported that surface topographical dimensions comparable with microbial cell size (~1–2 µm) were found to positively influence cell–surface interaction and the attachment of Gram-positive bacteria to surface materials [31,78,79,80]. However, the present findings also show that S. capitis biofilm growth on agar plates was not significantly affected by the surface topography (Figure 2, Section 3.2). For M. lacticum, a negative correlation of Sz to its surface coverage was observed (r = −0.95). Despite this, only weak or no correlation of surface properties on M. lacticum surface coverage or biofilm growth was found, indicating ubiquitous growth behavior. Based on the present study, it is not apparent whether there is a decisive roughness parameter or threshold reducing or even preventing biofilm growth.
The findings of previous research were also controversial. Several studies observed no significant effect of roughness on bacterial attachment and biofilm growth of, e.g., S. aureus, L. monocytogenes and Salmonella spp. [26,81,82], while others found a positive correlation [83,84]. Interestingly, Awad, et al. [85] observed an improved attachment of Pseudomonas aeruginosa at higher (Ra: 0.2 µm) compared to lower surface roughness (Ra: 0.1 µm) at 4 h, but did not find any correlation of roughness and adherence at a later biofilm formation stage. Thus, the lack of time points below 24 h in the present work may explain why there was no overall correlation between surface roughness and culture-based analysis.

3.6. Effect of Physicochemical and Interfacial Properties on Biofilm Formation

In this work, physicochemical surface characteristics, including contact angles and surface free energy parameters, were studied (Table 2). The surface free energy is caused by solid–liquid interactions at an interface, such as van der Waals forces, hydrogen bonding, and Lewis acid–base interactions [86]. It is consequently suitable for investigating the attachment of liquid bacterial biofilms to a solid surface. Surface hydrophobicity or rather wettability is also vital for cleanability [32].
In order to investigate surface wettability, water contact angles were used [87]. According to Vogler [88], a contact angle of >65° is considered as hydrophobic, while everything below is categorized as hydrophilic. Based on this approach, all surfaces in the present study were hydrophobic (θW > 65°); among them, PTFE was the most hydrophobic one (θW = 94.5°). The surface free energy parameters, γ s and y s L W ,   were highly consistent for SS 320 (41.3 mJ m−2; 41.0 mJ m−2), and SS 240 (40.7 mJ m−2; 38.9 mJ m−2). PTFE showed lower γ s and y s L W (23.5 mJ m−2; 21.2 mJ m−2), compared to SS 320 and SS 240. Low y i A B values of all three surfaces indicate apolar surface areas, which is consistent with the θW-values > 65 °. For SS and PTFE, low electron activity was found. Solely SS 320 showed quite high electron-donating activity, which is comparable to other findings for SS [89]. Overall, results for SS [26,43,87,89,90] and PTFE [43,91,92] agree with the previous literature. Chia, Goulter, McMeekin, Dykes and Fegan [26], Ammar, Swailes, Bridgens and Chen [83] found surface energy values ( y s L W ,   γ s )   for PTFE different from the one in the present study.
A positive relationship between y s L W or γ s to S. capitis surface coverage (r = 0.92, r = 0.89), respectively, was found. Hence, the decrease in surface coverage on PTFE is not only related to roughness parameters but also to its low surface free energy (Figure 3, Section 3.3). Similar results were previously reported by Chia, Goulter, McMeekin, Dykes and Fegan [26], Pereni, Zhao, Liu and Abel [92] for different Salmonella strains and P. aeruginosa, respectively. The differences in S. capitis biofilm growth on the three surfaces, however, are neglectable (Figure 2, Section 3.2). For M. lacticum, no strong correlation between y s L W or γ s to biofilm growth or surface coverage were observed, indicating its ubiquitous growth, as mentioned previously.
Besides surface wettability, cell hydrophobicity was discussed to play a vital role in the adhesion process [31]. According to Hood and Zottola [93], most bacterial cells are hydrophobic and preferably adhere to hydrophobic interfaces, while the hydrophilic cells preferably adhere to hydrophilic interfaces [94]. Several studies, however, did not find a relationship between surface hydrophobicity and bacterial attachment or biofilm adhesion [8,26,56,81,95]. Cell hydrophobicity was not examined in the present study but could have affected the relationship between biofilm growth or surface coverage and surface properties. Other potential differences in cell characteristics [31] might also explain the overall more significant effect of surface properties on S. capitis surface coverage, compared to M. lacticum.
In the present study, contact angles of the applied nutrient media (θTSB, θMB) were also analyzed to investigate the effect of the selected media on the relationship between biofilms and surface material. Interestingly, θMB (94.5–60.1°) was generally higher compared to θTSB (76.3–54.6°), indicating increased hydrophobic reactivity using MB media. Even though clean surfaces were used for this study, MB media could imitate residual food matrices containing milk powder. During food processing, food contact surfaces are rapidly covered with organic layers of i.e., milk or meat matrix [27]. Whenever a material surface is exposed to a fluid medium containing nutrients, its surface characteristics become frequently modified by the ambient liquid, as organic molecules are adsorbed [89,90]. The increased hydrophobic interaction related to MB media might have positively affected the biofilm formation of M. lacticum, compared to S. capitis in TSB, and should be considered for the selection of food contact materials in combination with the processed food matrix. This finding is in agreement with Hamadi, Asserne, Elabed, Bensouda, Mabrouki and Latrache [89], who found a positive relation between hydrophobicity and the number of adherend cells. Still, further research is needed to prove our hypothesis for contact angles with nutrient media as an additional reliable parameter in studying biofilm formation of liquid–solid interfaces.

4. Conclusions

The present study underlines that a combination of image-based and culture-based methods is essential to comprehensively research biofilm-forming ability, while one method alone may give false predictions. Additionally, surface characteristics are key to better understand and efficiently control biofilm formation on food contact surfaces. S. capitis biofilm was affected by several roughness parameters as well as γ s and y s L W , while M. lacticum growth remained unaffected. Independent from the surface characteristics, biofilm formation of M. lacticum was more developed than that of S. capitis, even though S. capitis showed a faster growth behavior. It is hypothesized that the M. lacticum growth could have been positively affected by the increased hydrophobicity of the nutrient media used. Therefore, besides the bacteria strain and surface material, the impact of the growth media or residual food matrix should be considered. Striking recommendations such as the Ra-value of <0.8 µm are helpful for cleanability in industrial applications, but it is not clear whether there is a threshold value or specific roughness parameter for preventing biofilm growth. To conclude, this study not only contributes to the understanding of biofilm formation on food contact surfaces but may also help to update hygiene-related guidelines for the food industry.
Further research needs to fully understand biofilm-forming ability on surfaces and include a detailed quantification and characterization of the produced EPS and three-dimensional analysis of biofilm architecture by CLSM.

Supplementary Materials

The following are available online at https://0-www-mdpi-com.brum.beds.ac.uk/2304-8158/10/3/611/s1, Figure S1: Schematic representation of the scraping technique used to detach biofilm cells from surface material coupons (PTFE, SS 320, SS 240). Scraping with a sterile pipette tip was performed four times vertically and horizontally across the entire coupon., Table S1: For cell detachment, scraping and sonication were compared as mean log CFU cm−2 of M. lacticum and S. capitis biofilms at 24 h, 48 h, 144 h, and 192 h on SS and PTFE surfaces a.

Author Contributions

E.Z., M.Z.-P. and H.J. contributed to the study design. E.Z. and H.P. conducted the microbiological experiments, while G.S. and E.Z. carried out the material characteristics. E.Z. and H.P. acquired and analyzed the data. G.S. contributed to the data acquisition and discussion of the material characteristics. E.Z. wrote the manuscript, and M.Z.-P., K.J.D. and H.J. proofread it. All authors have read and agreed to the published version of the manuscript.

Funding

This study was supported by the Austrian Research Promotion Agency under Grant (FFG Project No. 866346, Hygiene 4.0).

Institutional Review Board Statement

Not applicable.

Informed Consent Statement

Not applicable.

Acknowledgments

Parts of the research were accomplished at the BOKU Core Facility Food & Bio Processing (BOKU Vienna) and supported by EQ-BOKU VIBT GmbH (Center for Preservation and Aseptic Processing; BOKU Vienna). The authors acknowledge Alisa Meier BSc. (BOKU Vienna) for her support during the first screening of biofilm-forming strains, Monika Debreczeny (BOKU Core Facility Multiscale Imaging, BOKU Vienna) for valuable input on microscopic measurements and Ao.Univ.Dipl.-Ing. nat.techn. Marie-Theres Hauser (BOKU Vienna) for access to the epifluorescence microscope, Beatrix Stessl (Vetmed Vienna), for providing the M. lacticum D84 isolate, Mag. Leon Ploszczanski, MA (BOKU Vienna) for access to and support with SEM analyses and Benjamin Hajny (Keyence International) for support with roughness measurements.

Conflicts of Interest

The authors declare no conflict of interest. The funders had no role in the design of the study; in the collection, analyses, or interpretation of data; in the writing of the manuscript, or in the decision to publish the results.

References

  1. Srey, S.; Jahid, I.K.; Ha, S.-D. Biofilm formation in food industries: A food safety concern. Food Control 2013, 31, 572–585. [Google Scholar] [CrossRef]
  2. Giaouris, E.; Heir, E.; Hébraud, M.; Chorianopoulos, N.; Langsrud, S.; Møretrø, T.; Habimana, O.; Desvaux, M.; Renier, S.; Nychas, G.-J. Attachment and biofilm formation by foodborne bacteria in meat processing environments: Causes, implications, role of bacterial interactions and control by alternative novel methods. Meat Sci. 2014, 97, 298–309. [Google Scholar] [CrossRef]
  3. Wang, R. Biofilms and Meat Safety: A Mini-Review. J. Food Prot. 2019, 82, 120–127. [Google Scholar] [CrossRef]
  4. Galiè, S.; García-Gutiérrez, C.; Miguélez, E.M.; Villar, C.J.; Lombó, F. Biofilms in the food industry: Health aspects and control methods. Front. Microbiol. 2018, 9, 898. [Google Scholar] [CrossRef] [PubMed]
  5. Alonso-Calleja, C.; Gómez-Fernández, S.; Carballo, J.; Capita, R. Prevalence, Molecular Typing, and Determination of the Biofilm-Forming Ability of Listeria monocytogenes Serotypes from Poultry Meat and Poultry Preparations in Spain. Microorganisms 2019, 7, 529. [Google Scholar] [CrossRef] [Green Version]
  6. Jamal, M.; Ahmad, W.; Andleeb, S.; Jalil, F.; Imran, M.; Nawaz, M.A.; Hussain, T.; Ali, M.; Rafiq, M.; Kamil, M.A. Bacterial biofilm and associated infections. J. Chin. Med. Assoc. 2018, 81, 7–11. [Google Scholar] [CrossRef]
  7. Bridier, A.; Briandet, R.; Thomas, V.; Dubois-Brissonnet, F. Resistance of bacterial biofilms to disinfectants: A review. Biofouling 2011, 27, 1017–1032. [Google Scholar] [CrossRef] [PubMed]
  8. Gazula, H.; Scherm, H.; Li, C.; Takeda, F.; Wang, P.; Chen, J. Ease of biofilm accumulation, and efficacy of sanitizing treatments in removing the biofilms formed, on coupons made of materials commonly used in blueberry packing environment. Food Control 2019, 104, 167–173. [Google Scholar] [CrossRef]
  9. Weber, M.; Liedtke, J.; Plattes, S.; Lipski, A. Bacterial community composition of biofilms in milking machines of two dairy farms assessed by a combination of culture-dependent and –independent methods. PLoS ONE 2019, 14, e0222238. [Google Scholar] [CrossRef]
  10. Karunakaran, E.; Mukherjee, J.; Ramalingam, B.; Biggs, C.A. “Biofilmology”: A multidisciplinary review of the study of microbial biofilms. Appl. Microbiol. Biotechnol. 2011, 90, 1869–1881. [Google Scholar] [CrossRef]
  11. Lianou, A.; Koutsoumanis, K.P. Strain variability of the biofilm-forming ability of Salmonella enterica under various environmental conditions. Int. J. Food Microbiol. 2012, 160, 171–178. [Google Scholar] [CrossRef]
  12. Zou, M.; Liu, D. A systematic characterization of the distribution, biofilm-forming potential and the resistance of the biofilms to the CIP processes of the bacteria in a milk powder processing factory. Food Res. Int. 2018, 113, 316–326. [Google Scholar] [CrossRef]
  13. Yong, Y.Y.; Dykes, G.A.; Choo, W.S. Biofilm formation by staphylococci in health-related environments and recent reports on their control using natural compounds. Crit. Rev. Microbiol. 2019, 45, 201–222. [Google Scholar] [CrossRef]
  14. Møretrø, T.; Hermansen, L.; Holck, A.L.; Sidhu, M.S.; Rudi, K.; Langsrud, S. Biofilm Formation and the Presence of the Intercellular Adhesion Locus ica among Staphylococci from Food and Food Processing Environments. Appl. Environ. Microbiol. 2003, 69, 5648. [Google Scholar] [CrossRef] [Green Version]
  15. Cherif-Antar, A.; Moussa–Boudjemâa, B.; Didouh, N.; Medjahdi, K.; Mayo, B.; Flórez, A.B. Diversity and biofilm-forming capability of bacteria recovered from stainless steel pipes of a milk-processing dairy plant. Dairy Sci. Technol. 2016, 96, 27–38. [Google Scholar] [CrossRef]
  16. Marchand, S.; De Block, J.; De Jonghe, V.; Coorevits, A.; Heyndrickx, M.; Herman, L. Biofilm Formation in Milk Production and Processing Environments; Influence on Milk Quality and Safety. Compr. Rev. Food Sci. Food Saf. 2012, 11, 133–147. [Google Scholar] [CrossRef]
  17. Otto, M. Staphylococcal biofilms. In Gram-Positive Pathogens; Fischetti, V.A., Novick, R.P., Ferretti, J.J., Portnoy, D.A., Braunstein, M., Rood, J.I., Eds.; ASM Press: Washington, DC, USA, 2019; pp. 699–711. [Google Scholar] [CrossRef]
  18. Fagerlund, A.; Langsrud, S.; Heir, E.; Mikkelsen, M.I.; Møretrø, T. Biofilm Matrix Composition Affects the Susceptibility of Food Associated Staphylococci to Cleaning and Disinfection Agents. Front. Microbiol. 2016, 7, 856. [Google Scholar] [CrossRef] [Green Version]
  19. Maes, S.; Heyndrickx, M.; Vackier, T.; Steenackers, H.; Verplaetse, A.; Reu, K.D. Identification and Spoilage Potential of the Remaining Dominant Microbiota on Food Contact Surfaces after Cleaning and Disinfection in Different Food Industries. J. Food Prot. 2019, 82, 262–275. [Google Scholar] [CrossRef]
  20. Techer, C.; Jan, S.; Gonnet, F.; Grosset, N.; Gautier, M.; Baron, F. Bacterial diversity on stainless steel surfaces of egg processing companies and potential of selected isolates to spoil liquid whole egg products. J. Appl. Microbiol. 2019, 127, 1501–1510. [Google Scholar] [CrossRef] [PubMed]
  21. Jahid, I.K.; Ha, S.-D. A review of microbial biofilms of produce: Future challenge to food safety. Food Sci. Biotechnol. 2012, 21, 299–316. [Google Scholar] [CrossRef]
  22. Flemming, H.-C.; Wuertz, S. Bacteria and archaea on Earth and their abundance in biofilms. Nat. Rev. Microbiol. 2019, 17, 247–260. [Google Scholar] [CrossRef] [PubMed]
  23. Sauer, K. The genomics and proteomics of biofilm formation. Genome Biol. 2003, 4, 219. [Google Scholar] [CrossRef] [PubMed] [Green Version]
  24. Kishen, A.; Haapasalo, M. Biofilm models and methods of biofilm assessment. Endod. Top. 2010, 22, 58–78. [Google Scholar] [CrossRef]
  25. Gobbetti, M.; De Angelis, M.; Di Cagno, R.; Minervini, F.; Limitone, A. Cell–cell communication in food related bacteria. Int. J. Food Microbiol. 2007, 120, 34–45. [Google Scholar] [CrossRef]
  26. Chia, T.W.R.; Goulter, R.M.; McMeekin, T.; Dykes, G.A.; Fegan, N. Attachment of different Salmonella serovars to materials commonly used in a poultry processing plant. Food Microbiol. 2009, 26, 853–859. [Google Scholar] [CrossRef]
  27. Chmielewski, R.A.N.; Frank, J.F. Biofilm Formation and Control in Food Processing Facilities. Compr. Rev. Food Sci. Food Saf. 2003, 2, 22–32. [Google Scholar] [CrossRef]
  28. EHEDG Document No. 43. Hygienic Design of Belt Conveyors for the Food Industry; European Hygienic Enginnering & Design Group: Frankfurt, Germany, 2016.
  29. Fink, R. Good Hygiene Practices and Their Prevention of Biofilms in the Food Industry; Cambridge Scholars Publishing: Newcastle, UK, 2019. [Google Scholar]
  30. Partington, E. EHEDG Document No. 32. Materials of Construction for Equipment in Contact with Food; European Hygienic Enginnering & Design Group: Frankfurt, Germany, 2005. [Google Scholar] [CrossRef]
  31. Cheng, Y.; Feng, G.; Moraru, C.I. Micro- and Nanotopography Sensitive Bacterial Attachment Mechanisms: A Review. Front. Microbiol. 2019, 10, 191. [Google Scholar] [CrossRef] [Green Version]
  32. Hauser, G.; Curiel, G.J.; Bellin, H.W.; Cnossen, H.J.; Hofmann, J.; Kastelein, J.; Partington, E.; Peltier, Y.; Timperley, A.W. EHEDG Document No. 13. Hygienic Design of Equipment for Open Processing, 2nd ed.; European Hygienic Enginnering & Design Group: Frankfurt, Germany, 2005. [Google Scholar]
  33. Pérez Ibarreche, M.; Castellano, P.; Vignolo, G. Evaluation of anti-Listeria meat borne Lactobacillus for biofilm formation on selected abiotic surfaces. Meat Sci. 2014, 96, 295–303. [Google Scholar] [CrossRef]
  34. Schulte, S. Efficiency of Hydrogen Peroxide against Biofilms; University of Duisburg-Essen: Duisburg, Germany, 2004. [Google Scholar]
  35. Rodríguez-Melcón, C.; Capita, R.; Rodríguez-Jerez, J.J.; Martínez-Suárez, J.V.; Alonso-Calleja, C. Effect of Low Doses of Disinfectants on the Biofilm-Forming Ability of Listeria monocytogenes. Foodborne Pathog. Dis. 2019, 16, 262–268. [Google Scholar] [CrossRef]
  36. Schneider, C.A.; Rasband, W.S.; Eliceiri, K.W. NIH Image to ImageJ: 25 years of image analysis. Nat. Methods 2012, 9, 671–675. [Google Scholar] [CrossRef]
  37. Murtey, M.D.; Ramasamy, P. Sample Preparations for Scanning Electron Microscopy–Life. Sciences 2016, 23, 45. [Google Scholar] [CrossRef] [Green Version]
  38. ISO 25178-2:2012. Geometrical Product Specifications (GPS)—Surface Texture: Areal—Part 2: Terms, Definitions and Surface Texture Parameters; ISO: Geneva, Switzerland, 2021. [Google Scholar]
  39. ISO 4288:1998. Geometrical Product Specifications (GPS)—Surface Texture: Profile Method—Rules and Procedures for the Assessment of Surface Texture; ISO: Geneva, Switzerland, 1998. [Google Scholar]
  40. Eifler, M.; Garretson, I.C.; Linke, B.S.; Das, J.; Torner, F.; Seewig, J. Effects of vibratory finishing of 304 stainless steel samples on areal roughness parameters: A correlational analysis for anisotropy parameters. J. Mater. Process Technol. 2019, 273, 116256. [Google Scholar] [CrossRef]
  41. Van Oss, C.J.; Good, R.J.; Chaudhury, M.K. Additive and nonadditive surface tension components and the interpretation of contact angles. Langmuir 1988, 4, 884–891. [Google Scholar] [CrossRef]
  42. Gindl, M.; Sinn, G.; Gindl, W.; Reiterer, A.; Tschegg, S. A comparison of different methods to calculate the surface free energy of wood using contact angle measurements. Colloids Surf. A Physicochem. Eng. Asp. 2001, 181, 279–287. [Google Scholar] [CrossRef]
  43. Bargir, S.; Dunn, S.; Jefferson, B.; Macadam, J.; Parsons, S. The use of contact angle measurements to estimate the adhesion propensity of calcium carbonate to solid substrates in water. Appl. Surf. Sci. 2009, 255, 4873–4879. [Google Scholar] [CrossRef]
  44. Makovcova, J.; Babak, V.; Kulich, P.; Masek, J.; Slany, M.; Cincarova, L. Dynamics of mono- and dual-species biofilm formation and interactions between Staphylococcus aureus and Gram-negative bacteria. Microb. Biotechnol. 2017, 10, 819–832. [Google Scholar] [CrossRef]
  45. Nikinmaa, S.; Alapulli, H.; Auvinen, P.; Vaara, M.; Rantala, J.; Kankuri, E.; Sorsa, T.; Meurman, J.; Pätilä, T. Dual-light photodynamic therapy administered daily provides a sustained antibacterial effect on biofilm and prevents Streptococcus mutans adaptation. PLoS ONE 2020, 14, e0232775. [Google Scholar] [CrossRef]
  46. Galdiero, E.; Di Onofrio, V.; Maione, A.; Gambino, E.; Gesuele, R.; Menale, B.; Ciaravolo, M.; Carraturo, F.; Guida, M. Allium ursinum and Allium oschaninii against Klebsiella pneumoniae and Candida albicans Mono- and Polymicrobic Biofilms in In Vitro Static and Dynamic Models. Microorganisms 2020, 8, 336. [Google Scholar] [CrossRef] [Green Version]
  47. Granick, M.S.; Paribathan, C.; Shanmugam, M.; Ramasubbu, N. Direct-contact low-frequency ultrasound clearance of biofilm from metallic implant materials. Eplasty 2017, 17, 17. [Google Scholar]
  48. Zips, A.; Schaule, G.; Flemming, H. Ultrasound as a means of detaching biofilms. Biofouling 1990, 2, 323–333. [Google Scholar] [CrossRef]
  49. Baumann, A.R.; Martin, S.E.; Feng, H. Removal of Listeria monocytogenes Biofilms from Stainless Steel by Use of Ultrasound and Ozone. J. Food Prot. 2009, 72, 1306–1309. [Google Scholar] [CrossRef]
  50. Badalyan, G.; Díaz, C.; Bücking, M.; Lipski, A. Novel sensor platform for rapid detection and quantification of coliforms on food contact surfaces. J. Microbiol. Methods 2018, 153, 74–83. [Google Scholar] [CrossRef]
  51. Wang, H.; Wu, N.; Jiang, Y.; Ye, K.; Xu, X.; Zhou, G. Response of long-term acid stress to biofilm formation of meat-related Salmonella Enteritidis. Food Control 2016, 69, 214–220. [Google Scholar] [CrossRef]
  52. Bjerkan, G.; Witsø, E.; Bergh, K. Sonication is superior to scraping for retrieval of bacteria in biofilm on titanium and steel surfaces in vitro. Acta Orthop. 2009, 80, 245–250. [Google Scholar] [CrossRef] [Green Version]
  53. Kragh, K.N.; Alhede, M.; Kvich, L.; Bjarnsholt, T. Into the well—A close look at the complex structures of a microtiter biofilm and the crystal violet assay. Biofilm 2019, 1, 100006. [Google Scholar] [CrossRef]
  54. Planchon, S.; Gaillardmartinie, B.; Leroy, S.; Bellonfontaine, M.; Fadda, S.; Talon, R. Surface properties and behaviour on abiotic surfaces of Staphylococcus carnosus, a genetically homogeneous species. Food Microbiol. 2007, 24, 44–51. [Google Scholar] [CrossRef] [PubMed]
  55. Iñiguez-Moreno, M.; Avila-Novoa, M.G.; Gutiérrez-Lomelí, M. Resistance of pathogenic and spoilage microorganisms to disinfectants in the presence of organic matter and their residual effect on stainless steel and polypropylene. J. Glob. Antimicrob. Resist. 2018, 14, 197–201. [Google Scholar] [CrossRef] [PubMed]
  56. Iñiguez-Moreno, M.; Gutiérrez-Lomelí, M.; Avila-Novoa, M.G. Kinetics of biofilm formation by pathogenic and spoilage microorganisms under conditions that mimic the poultry, meat, and egg processing industries. Int. J. Food Microbiol. 2019, 303, 32–41. [Google Scholar] [CrossRef]
  57. Heilmann, C.; Hussain, M.; Peters, G.; Götz, F. Evidence for autolysin-mediated primary attachment of Staphylococcus epidermidis to a polystyrene surface. Mol. Microbiol. 1997, 24, 1013–1024. [Google Scholar] [CrossRef]
  58. Cui, B.; Deighton, M.A.; Smooker, P.M.; Rouch, D.A. Effects of erythromycin on the phenotypic and genotypic biofilm expression in two clinical Staphylococcus capitis subspecies and a functional analysis of Ica proteins in S. capitis. J. Med. Microbiol. 2015, 65, 257. [Google Scholar] [CrossRef] [PubMed] [Green Version]
  59. Heilmann, C. Identification and characterization of a novel autolysin (Aae) with adhesive properties from Staphylococcus epidermidis. Microbiology 2003, 149, 2769–2778. [Google Scholar] [CrossRef] [Green Version]
  60. Vithanage, N.R.; Dissanayake, M.; Bolge, G.; Palombo, E.A.; Yeager, T.R.; Datta, N. Biodiversity of culturable psychrotrophic microbiota in raw milk attributable to refrigeration conditions, seasonality and their spoilage potential. Int. Dairy J. 2016, 57, 80–90. [Google Scholar] [CrossRef]
  61. Ripolles-Avila, C.; Hascoët, A.S.; Guerrero-Navarro, A.E.; Rodríguez-Jerez, J.J. Establishment of incubation conditions to optimize the in vitro formation of mature Listeria monocytogenes biofilms on food-contact surfaces. Food Control 2018, 92, 240–248. [Google Scholar] [CrossRef]
  62. Rice, K.C.; Bayles, K.W. Death’s toolbox: Examining the molecular components of bacterial programmed cell death. Mol. Microbiol. 2003, 50, 729–738. [Google Scholar] [CrossRef]
  63. Ripolles-Avila, C.; García-Hernández, N.; Cervantes-Huamán, B.H.; Mazaheri, T.; Rodríguez-Jerez, J.J. Quantitative and Compositional Study of Monospecies Biofilms of Spoilage Microorganisms in the Meat Industry and Their Interaction in the Development of Multispecies Biofilms. Microorganisms 2019, 7, 655. [Google Scholar] [CrossRef] [Green Version]
  64. Kerstens, M.; Boulet, G.; Van Kerckhoven, M.; Clais, S.; Lanckacker, E.; Delputte, P.; Maes, L.; Cos, P. A flow cytometric approach to quantify biofilms. Folia Microbiol. 2015, 60, 335–342. [Google Scholar] [CrossRef] [PubMed]
  65. Rodríguez-Melcón, C.; Riesco-Peláez, F.; Carballo, J.; García-Fernández, C.; Capita, R.; Alonso-Calleja, C. Structure and viability of 24- and 72-h-old biofilms formed by four pathogenic bacteria on polystyrene and glass contact surfaces. Food Microbiol. 2018, 76, 513–517. [Google Scholar] [CrossRef]
  66. Stiefel, P.; Schmidt-Emrich, S.; Maniura-Weber, K.; Ren, Q. Critical aspects of using bacterial cell viability assays with the fluorophores SYTO9 and propidium iodide. BMC Microbiol. 2015, 15, 36. [Google Scholar] [CrossRef] [PubMed] [Green Version]
  67. Yang, Y.; Hoe, Y.W.; Zheng, Q.; Chung, H.-J.; Yuk, H.-G. Biofilm formation by Salmonella Enteritidis in a simulated liquid egg processing environment and its sensitivity to chlorine and hot water treatment. Food Control 2016, 73, 595–600. [Google Scholar] [CrossRef]
  68. Jun, W.; Kim, M.S.; Cho, B.-K.; Millner, P.D.; Chao, K.; Chan, D.E. Microbial biofilm detection on food contact surfaces by macro-scale fluorescence imaging. J. Food Eng. 2010, 99, 314–322. [Google Scholar] [CrossRef]
  69. Haider, S.A.; Cameron, A.; Siva, P.; Lui, D.; Shafiee, M.J.; Boroomand, A.; Haider, N.; Wong, A. Fluorescence microscopy image noise reduction using a stochastically-connected random field model. Sci. Rep. 2016, 6, 20640. [Google Scholar] [CrossRef] [Green Version]
  70. El Abed, S.; Ibnsouda, S.K.; Latrache, H.; Hamadi, F. Scanning electron microscopy (SEM) and environmental SEM: Suitable tools for study of adhesion stage and biofilm formation. In Scanning Electron Microscopy; Kazmiruk, V., Ed.; Intechopen: London, UK, 2012. [Google Scholar] [CrossRef] [Green Version]
  71. Liu, F.; Jin, P.; Sun, Z.; Du, L.; Wang, D.; Zhao, T.; Doyle, M.P. Carvacrol oil inhibits biofilm formation and exopolysaccharide production of Enterobacter cloacae. Food Control 2021, 119, 107473. [Google Scholar] [CrossRef]
  72. Sadekuzzaman, M.; Yang, S.; Rahaman Mizan, M.F.; Kim, H.-S.; Ha, S.-D. Effectiveness of a phage cocktail as a biocontrol agent against L. monocytogens Biofilms. Food Control 2016, 16, 56. [Google Scholar] [CrossRef]
  73. Zhou, W.; Apkarian, R.; Wang, Z.L.; Joy, D. Fundamentals of Scanning Electron Microscopy (SEM). In Scanning Microscopy for Nanotechnology: Techniques and Applications; Zhou, W., Wang, Z.L., Eds.; Springer: New York, NY, USA, 2007; pp. 1–40. [Google Scholar] [CrossRef]
  74. Hofmann, J.; Akesson, S.; Curiel, G.; Wouters, P.; Timperley, A. EHEDG Document No. 8. Hygienic Design Principles, 3rd ed.; European Hygienic Enginnering & Design Group: Frankfurt, Germany, 2018. [Google Scholar]
  75. Jones, C.R.; Adams, M.R.; Zhdan, P.A.; Chamberlain, A.H.L. The role of surface physicochemical properties in determining the distribution of the autochthonous microflora in mineral water bottles. J. Appl. Microbiol. 1999, 86, 917–927. [Google Scholar] [CrossRef]
  76. Gadelmawla, E.S.; Koura, M.M.; Maksoud, T.M.A.; Elewa, I.M.; Soliman, H.H. Roughness parameters. J. Mater. Process Technol. 2002, 123, 133–145. [Google Scholar] [CrossRef]
  77. Leach, R. Characterisation of Areal Surface Texture; Springer Sience & Business Media: Berlin/Heidelberg, Germany, 2013. [Google Scholar]
  78. Hsu, L.C.; Fang, J.; Borca-Tasciuc, D.A.; Worobo, R.W.; Moraru, C.I. Effect of Micro- and Nanoscale Topography on the Adhesion of Bacterial Cells to Solid Surfaces. Appl. Environ. Microbiol. 2013, 79, 2703–2712. [Google Scholar] [CrossRef] [PubMed] [Green Version]
  79. Friedlander, R.S.; Vlamakis, H.; Kim, P.; Khan, M.; Kolter, R.; Aizenberg, J. Bacterial flagella explore microscale hummocks and hollows to increase adhesion. Proc. Natl. Acad. Sci. USA 2013, 110, 5624–5629. [Google Scholar] [CrossRef] [PubMed] [Green Version]
  80. Hochbaum, A.I.; Aizenberg, J. Bacteria Pattern Spontaneously on Periodic Nanostructure Arrays. Nano Lett. 2010, 10, 3717–3721. [Google Scholar] [CrossRef] [PubMed]
  81. Teixeira, P.; Lima, J.; Azeredo, J.; Oliveira, R. Adhesion of Listeria monocytogenes to materials commonly found in domestic kitchens. Int. J. Food Sci. Technol. 2008, 43, 1239–1244. [Google Scholar] [CrossRef] [Green Version]
  82. Bezek, K.; Nipič, D.; Torkar, K.G.; Oder, M.; Dražić, G.; Abram, A.; Žibert, J.; Raspor, P.; Bohinc, K. Biofouling of stainless steel surfaces by four common pathogens: The effects of glucose concentration, temperature and surface roughness. Biofouling 2019, 35, 273–283. [Google Scholar] [CrossRef] [PubMed]
  83. Ammar, Y.; Swailes, D.; Bridgens, B.; Chen, J. Influence of surface roughness on the initial formation of biofilm. Surf. Coat. Technol. 2015, 284, 410–416. [Google Scholar] [CrossRef] [Green Version]
  84. Dürr, H. Influence of Surface Roughness and Wettability of Stainless Steel on Soil Adhesion, Cleanability and Microbial Inactivation. Food Bioprod. Process. 2007, 85, 49–56. [Google Scholar] [CrossRef]
  85. Awad, T.S.; Asker, D.; Hatton, B.D. Food-Safe Modification of Stainless Steel Food-Processing Surfaces to Reduce Bacterial Biofilms. ACS Appl. Mater. Interfaces 2018, 10, 22902–22912. [Google Scholar] [CrossRef] [PubMed]
  86. Park, S.-J.; Seo, M.-K. Chapter 2—Solid-Gas Interaction. In Interface Science and Technology; Park, S.-J., Seo, M.-K., Eds.; Elsevier: Amsterdam, The Netherlands, 2011; Volume 18, pp. 59–145. [Google Scholar]
  87. Silva, S.; Teixeira, P.; Oliveira, R.; Azeredo, J. Adhesion to and Viability of Listeria monocytogenes on Food Contact Surfaces. J. Food Prot. 2008, 71, 1379–1385. [Google Scholar] [CrossRef]
  88. Vogler, E.A. Structure and reactivity of water at biomaterial surfaces. Adv. Colloid Interface Sci. 1998, 74, 69–117. [Google Scholar] [CrossRef]
  89. Hamadi, F.; Asserne, F.; Elabed, S.; Bensouda, S.; Mabrouki, M.; Latrache, H. Adhesion of Staphylococcus aureus on stainless steel treated with three types of milk. Food Control 2014, 38, 104–108. [Google Scholar] [CrossRef]
  90. Azelmad, K.; Hamadi, F.; Mimouni, R.; Amzil, K.; Latrache, H.; Mabrouki, M.; El Boulani, A. Adhesion of Staphylococcus aureus and Staphylococcus xylosus to materials commonly found in catering and domestic kitchens. Food Control 2017, 73, 156–163. [Google Scholar] [CrossRef]
  91. Zhao, Q.; Wang, C.; Liu, Y.; Wang, S. Bacterial adhesion on the metal-polymer composite coatings. Int. J. Adhes. Adhes. 2007, 27, 85–91. [Google Scholar] [CrossRef]
  92. Pereni, C.I.; Zhao, Q.; Liu, Y.; Abel, E. Surface free energy effect on bacterial retention. Colloids Surf. B Biointerfaces 2006, 48, 143–147. [Google Scholar] [CrossRef]
  93. Hood, S.K.; Zottola, E.A. Adherence to stainless steel by foodborne microorganisms during growth in model food systems. Int. J. Food Microbiol. 1997, 37, 145–153. [Google Scholar] [CrossRef]
  94. Giaouris, E.; Chapot-Chartier, M.-P.; Briandet, R. Surface physicochemical analysis of natural Lactococcus lactis strains reveals the existence of hydrophobic and low charged strains with altered adhesive properties. Int. J. Food Microbiol. 2009, 131, 2–9. [Google Scholar] [CrossRef] [PubMed]
  95. Da Silva Meira, Q.G.; De Medeiros Barbosa, I.; Alves Aguiar Athayde, A.J.; De Siqueira-Júnior, J.P.; De Souza, E.L. Influence of temperature and surface kind on biofilm formation by Staphylococcus aureus from food-contact surfaces and sensitivity to sanitizers. Food Control 2012, 25, 469–475. [Google Scholar] [CrossRef] [Green Version]
Figure 1. Goodness-of-fit statistics of the cell detachment methods sonication (y-axis) and scraping (x-axis) for M. lacticum (A) and S. capitis (B). Data points represent mean values. CFU: colony-forming unit.
Foods 10 00611 g001
Figure 2. Growth curves of M. lacticum (□, ■, ◘) and S. capitis (○, ●, ⦿) biofilms at 24, 48, 144, and 192 h on stainless steel (SS) 240, SS 320, and polytetrafluoroethylene (PTFE) surfaces, obtained by the scraping technique. For culture-based analysis, mean values ± standard deviation are based on three independent experiments.
Foods 10 00611 g002
Figure 3. M. lacticum (A) and S. capitis (B) surface coverage (%) at 24, 48, 144, and 192 h through cell staining with SYTOTM 9 and propidium iodide (PI) on PTFE and SS coupons. The proportion of viable (white bars; SYTOTM 9) and dead cells (grey bars; PI) is indicated. For image analysis, an area of 260 mm² was investigated.
Foods 10 00611 g003
Figure 4. Representative scanning electron microscopy (SEM) images of the reference surface materials SS 240 (A), SS 320 (B), PTFE (C), and the biofilm structure. S. capitis biofilm at 48 h on SS 240 (D), SS 320 (E), and PTFE (F) and at 192 h on SS 240 (G), SS 320 (H) and PTFE (I). M. lacticum biofilm at 48 h on SS 240 (J), SS 320 (K), PTFE (L), as well as at 192 h on SS 240 (M), SS 320 (N), and PTFE (O). The amorphous matrix (possibly an extracellular polymeric substance (EPS); red arrows) and membrane-compromised cells (green arrows) are visualized in color.
Foods 10 00611 g004
Table 1. Surface topography, including line roughness (Ra, Rz, Rq, Rv, Rp, RSm) and surface roughness (Sa, Sz, Sq, Sv, Sp) parameters of SS 320, SS 240 and PTFE a.
MaterialLine Roughness [µm] b Surface Roughness [µm] c
RaRzRqRvRpRSmSaSzSqSvSp
SS 3200.5 ± 0.02.5 ± 0.10.7 ± 0.01.3 ± 0.11.5 ± 0.110.2 ± 0.50.77.50.62.72.9
SS 2401.0 ± 0.04.2 ± 0.11.0 ± 0.11.7 ± 0.12.1 ± 0.110.7 ± 1.31.117.61.09.75.1
PTFE0.2 ± 0.00.9 ± 0.20.3 ± 0.10.5 ± 0.10.4 ± 0.19.7 ± 2.20.515.10.56.93.2
a SS 320 and SS 240, Stainless steel with a grit of 320 and 240; PTFE, polytetrafluoroethylene; Ra, arithmetic mean roughness value; Rz, mean roughness depth; Rq, root mean square deviation; Rv, maximum depth of valleys; Rp, the maximum height of peaks; RSm, mean spacing at the mean line; Sa, mean arithmetic height of surface roughness; Sz, the maximum height of surface roughness; Sq, root mean square height; Sv, maximum pit height; Sp, maximum peak height; b Means ± standard deviation of 41 line roughness measurements; c for surface roughness single measurements were performed.
Table 2. Physicochemical surface properties of SS 320, SS 240 and PTFE a.
MaterialContact Angle (°) bSurface Free Energy (mJ m−2) c
θTSBθMBθWθDθF γ s y s L W γ s A B γ s + γ s
SS 32054.6 ± 1.361.4 ± 3.165.9 ± 11.736.9 ± 5.552.7 ± 6.341.3 ± 0.441.0 ± 0.20.3 ± 0.20.0 ± 0.017.1 ± 0.3
SS 24058.9 ± 3.260.1 ± 4.785.6 ± 7.941.4 ± 1.155.7 ± 8.240.7 ± 0.239.0 ± 0.11.8 ± 0.10.5 ± 0.01.7 ± 0.1
PTFE76.3 ± 7.994.5 ± 4.594.5 ± 8.072.8 ± 10.866.5 ± 5.823.5 ± 0.321.2 ± 0.12.4 ± 0.12.9 ± 0.10.5 ± 0.0
a SS 320 and SS 240, Stainless steel with a grit of 320 and 240; PTFE, polytetrafluoroethylene; θTSB, contact angle measured with tryptic soy broth; θMB, contact angle measured with milk broth; θW, contact angle using water; θD, contact angle using diiodomethane; θF, contact angle using formamide; γ s , total surface free energy;   y s L W , apolar Lifshitz-van der Waals surface energy component;   γ s A B , Lewis acid–base component; γ s + , electron-acceptor; γ s , electron-donator. b Means ± standard errors of a minimum of 4 drops of each liquid on three individual pieces of material as well as c means ± standard deviation.
Publisher’s Note: MDPI stays neutral with regard to jurisdictional claims in published maps and institutional affiliations.

