
A Comparison of β-Carotene, Phytoene and Amino Acids Production in Dunaliella salina DF 15 (CCAP 19/41) and Dunaliella salina CCAP 19/30 Using Different Light Wavelengths

 , , ,
, , ,
Abstract
:1. Introduction
2. Materials and Methods
2.1. Microalgal Strains and Cultivation Methods
2.2. Biomass, Carotenoids and Amino Acids Content Analysis
2.3. Statistical Analysis
3. Results
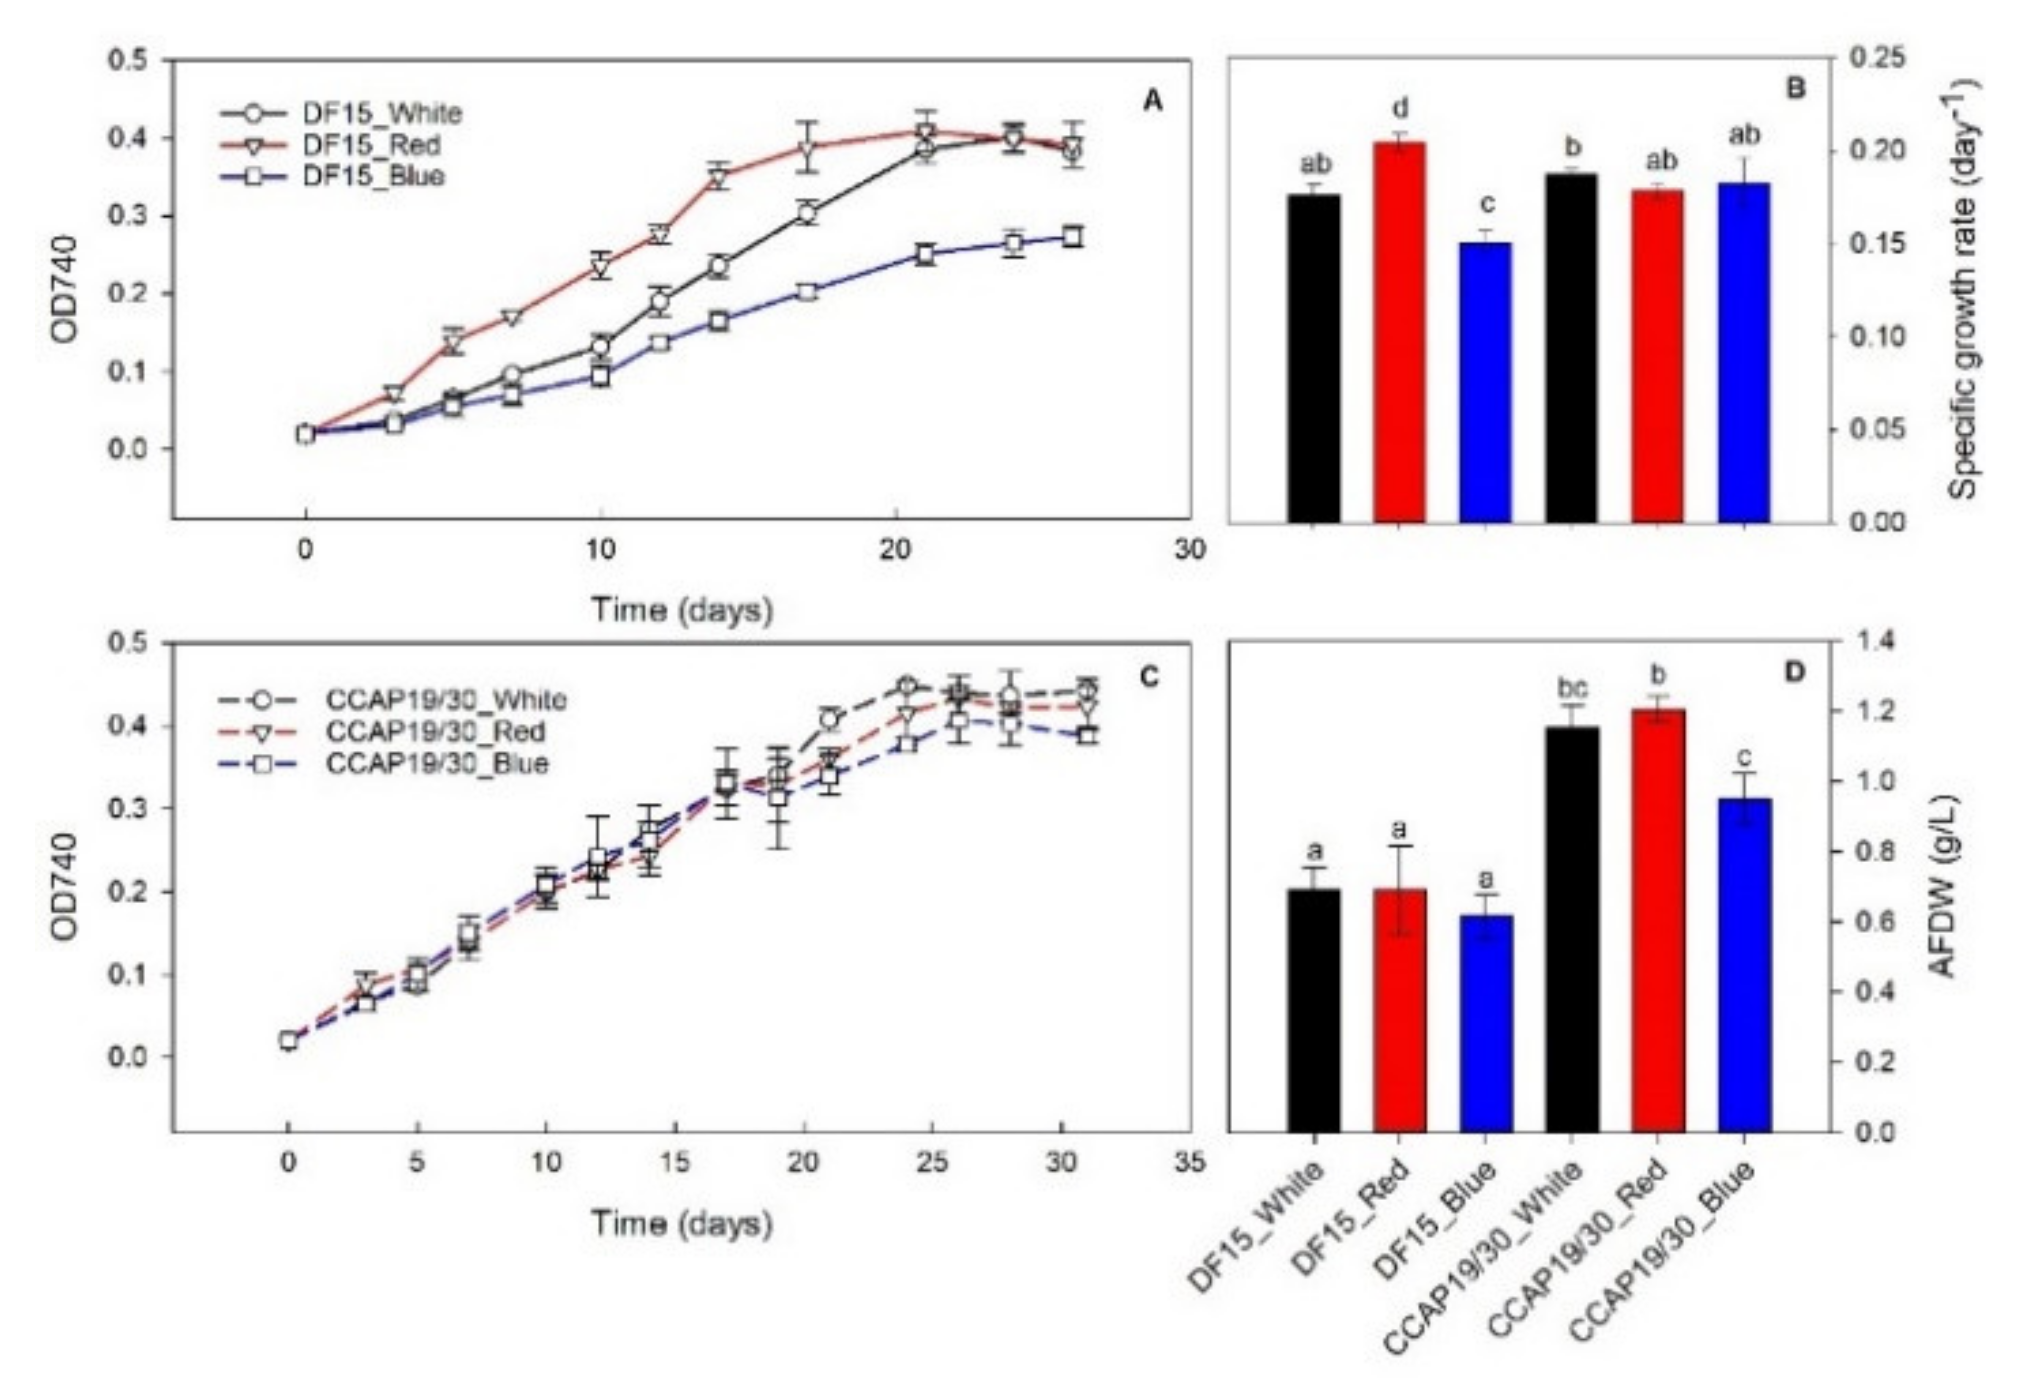
3.1. Biomass Growth
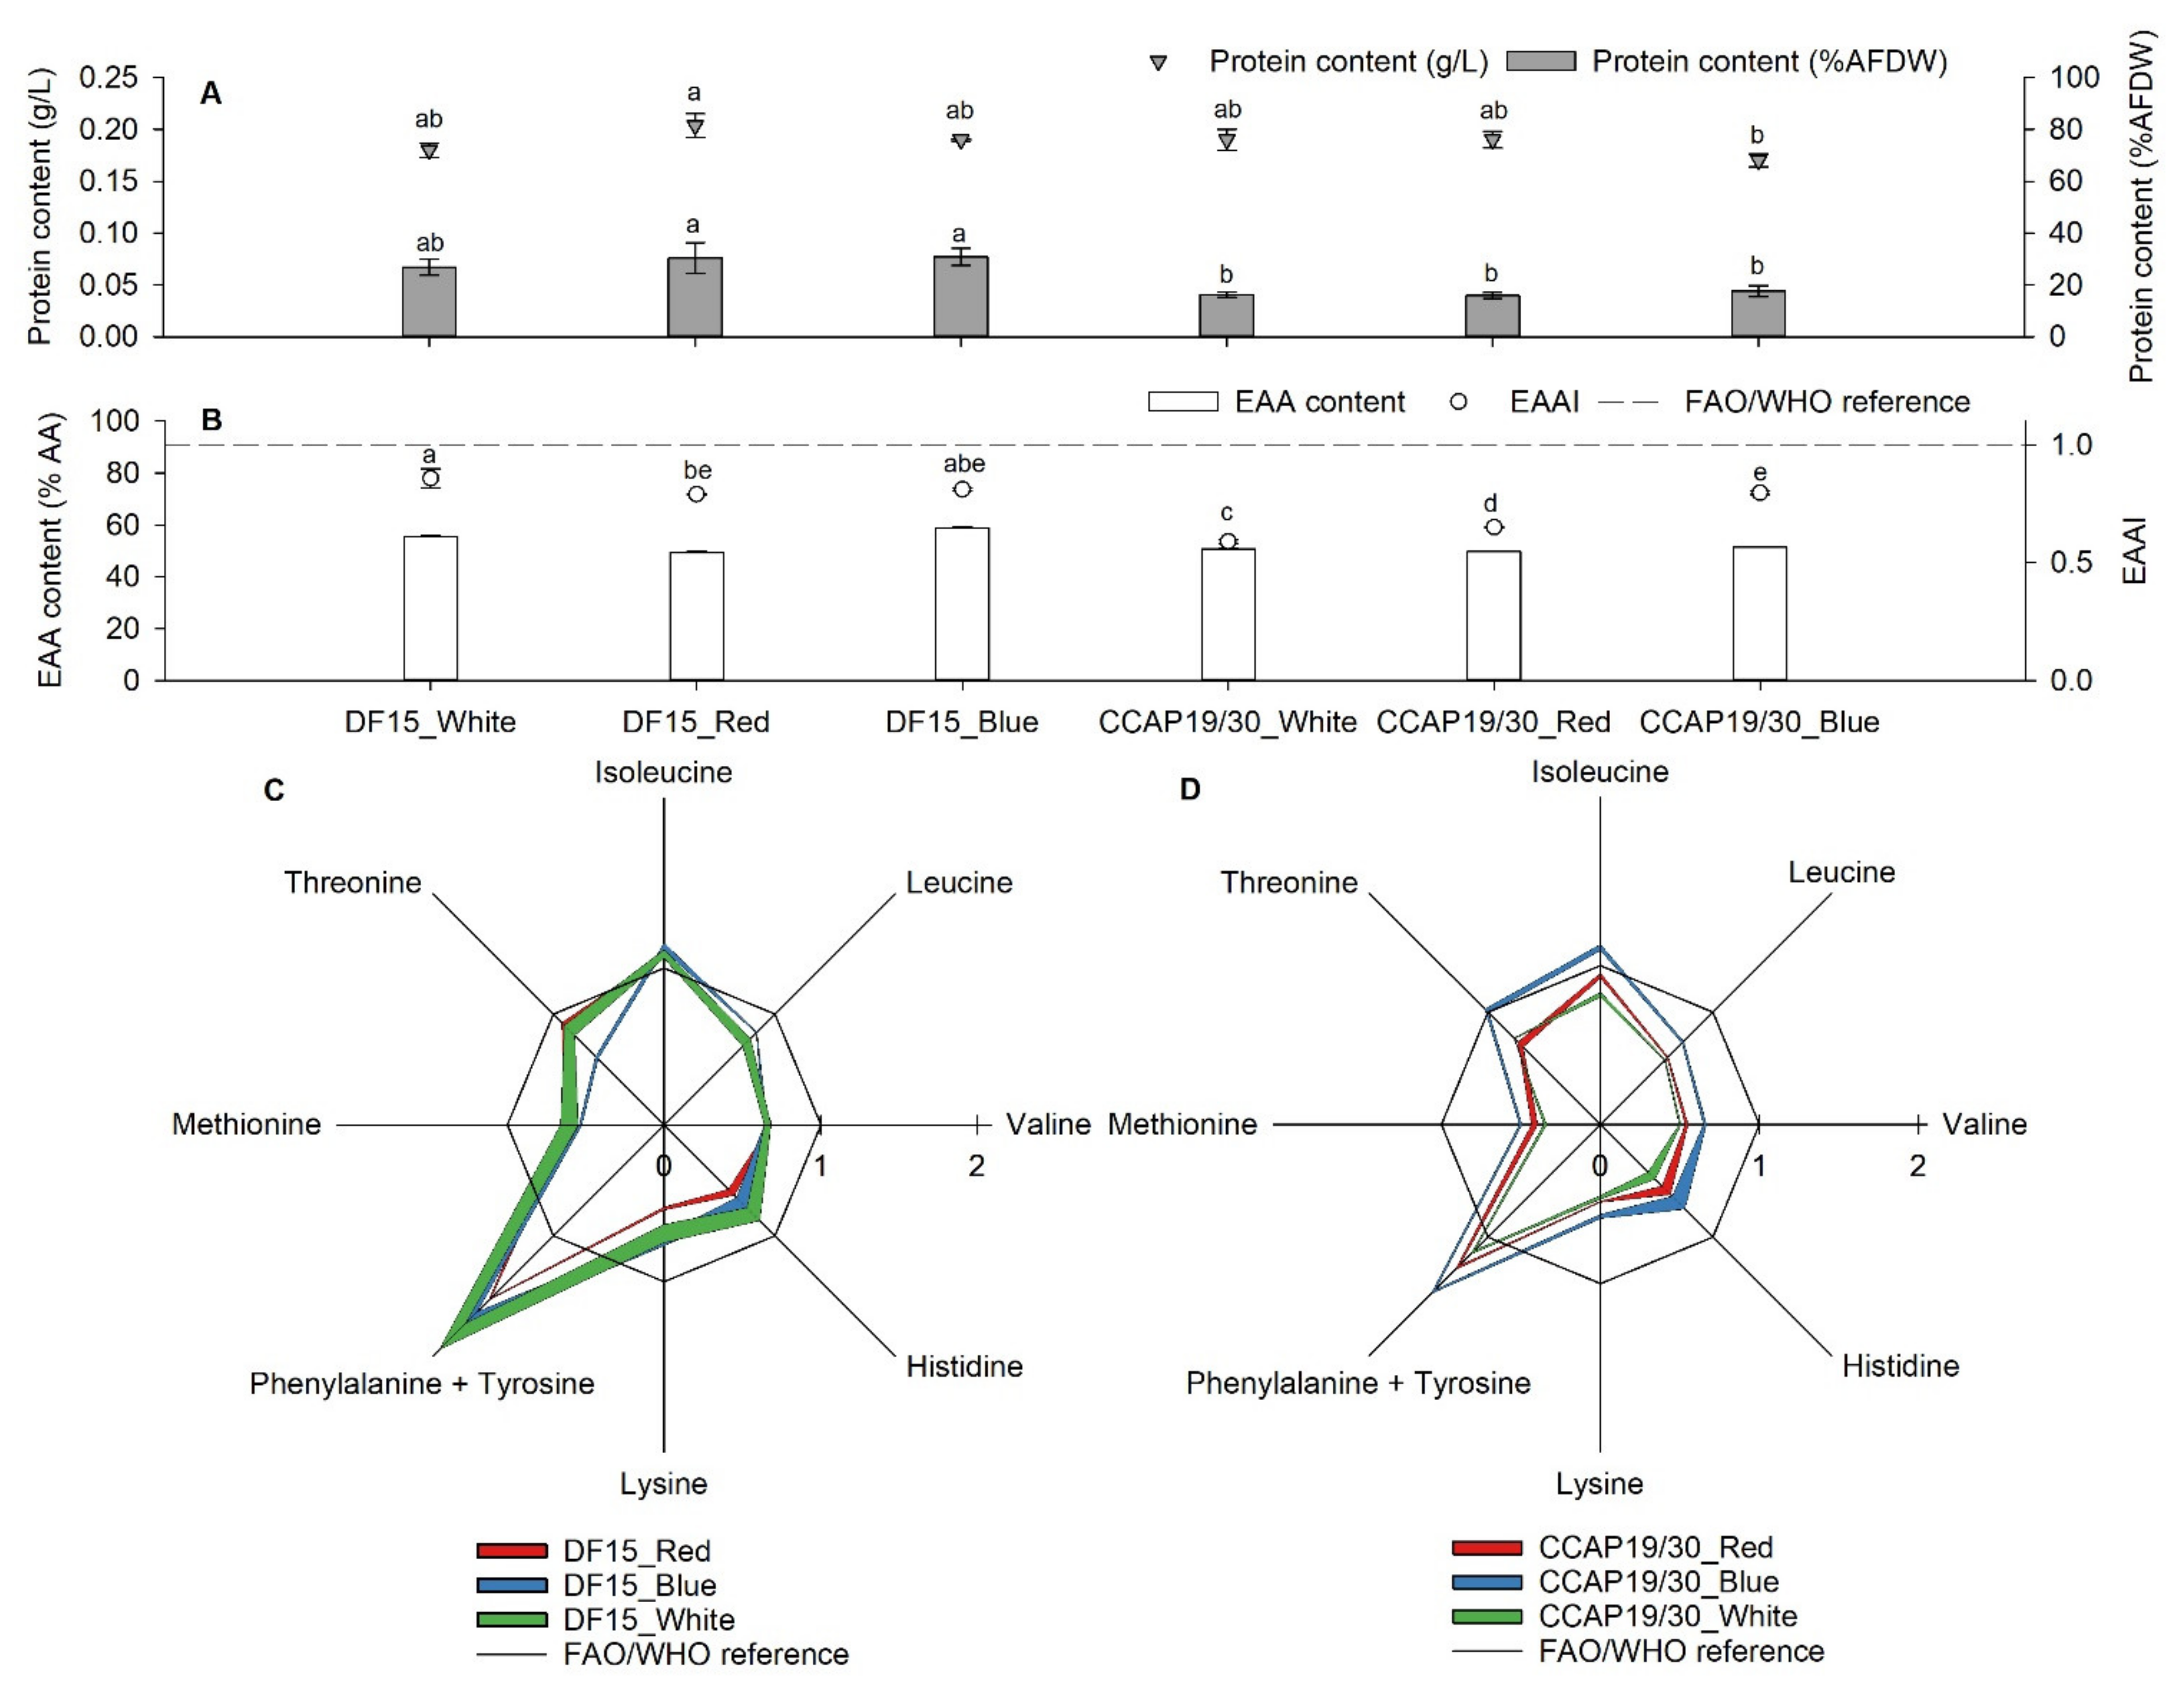
3.2. Protein and Amino Acids
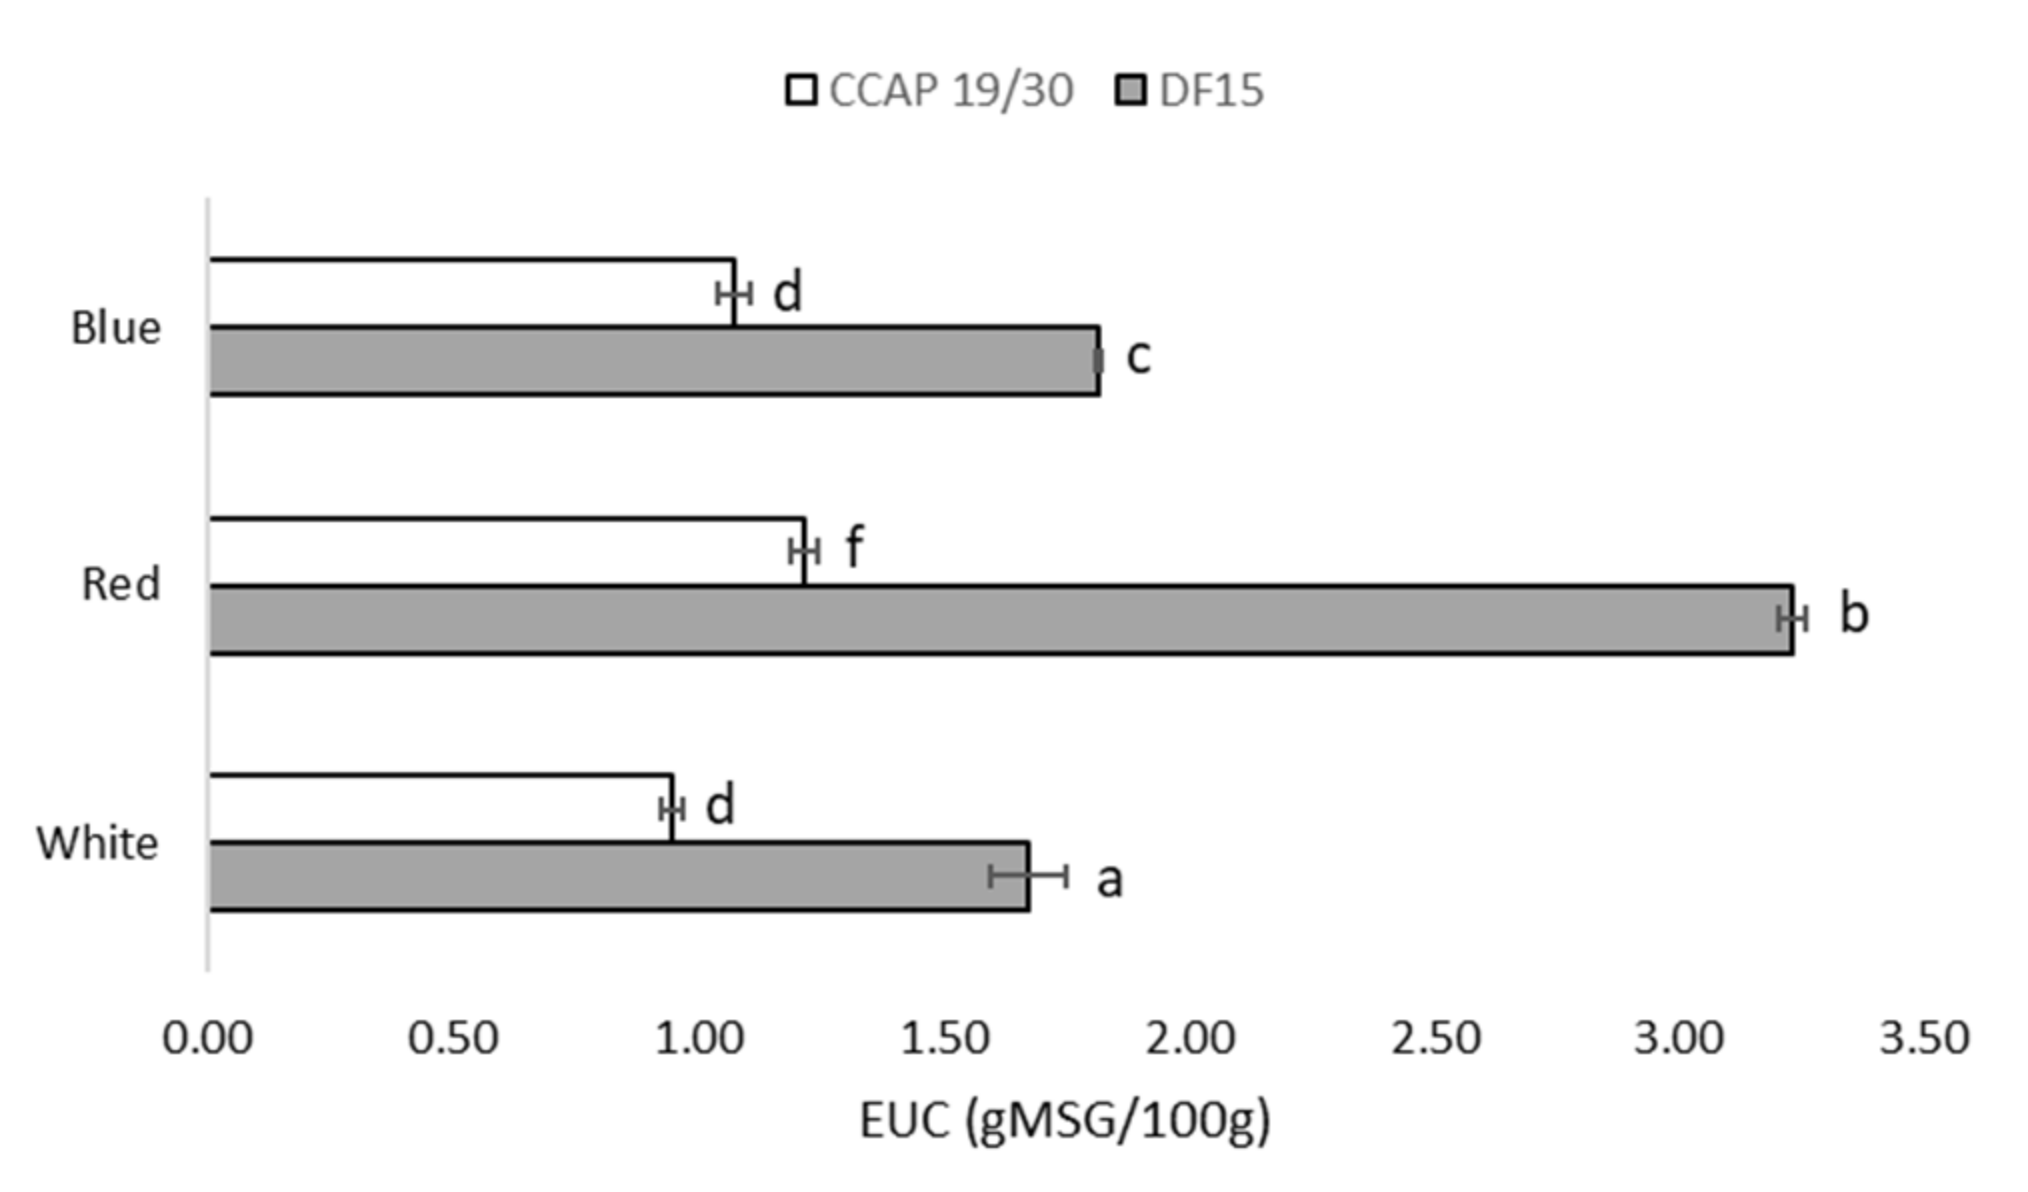
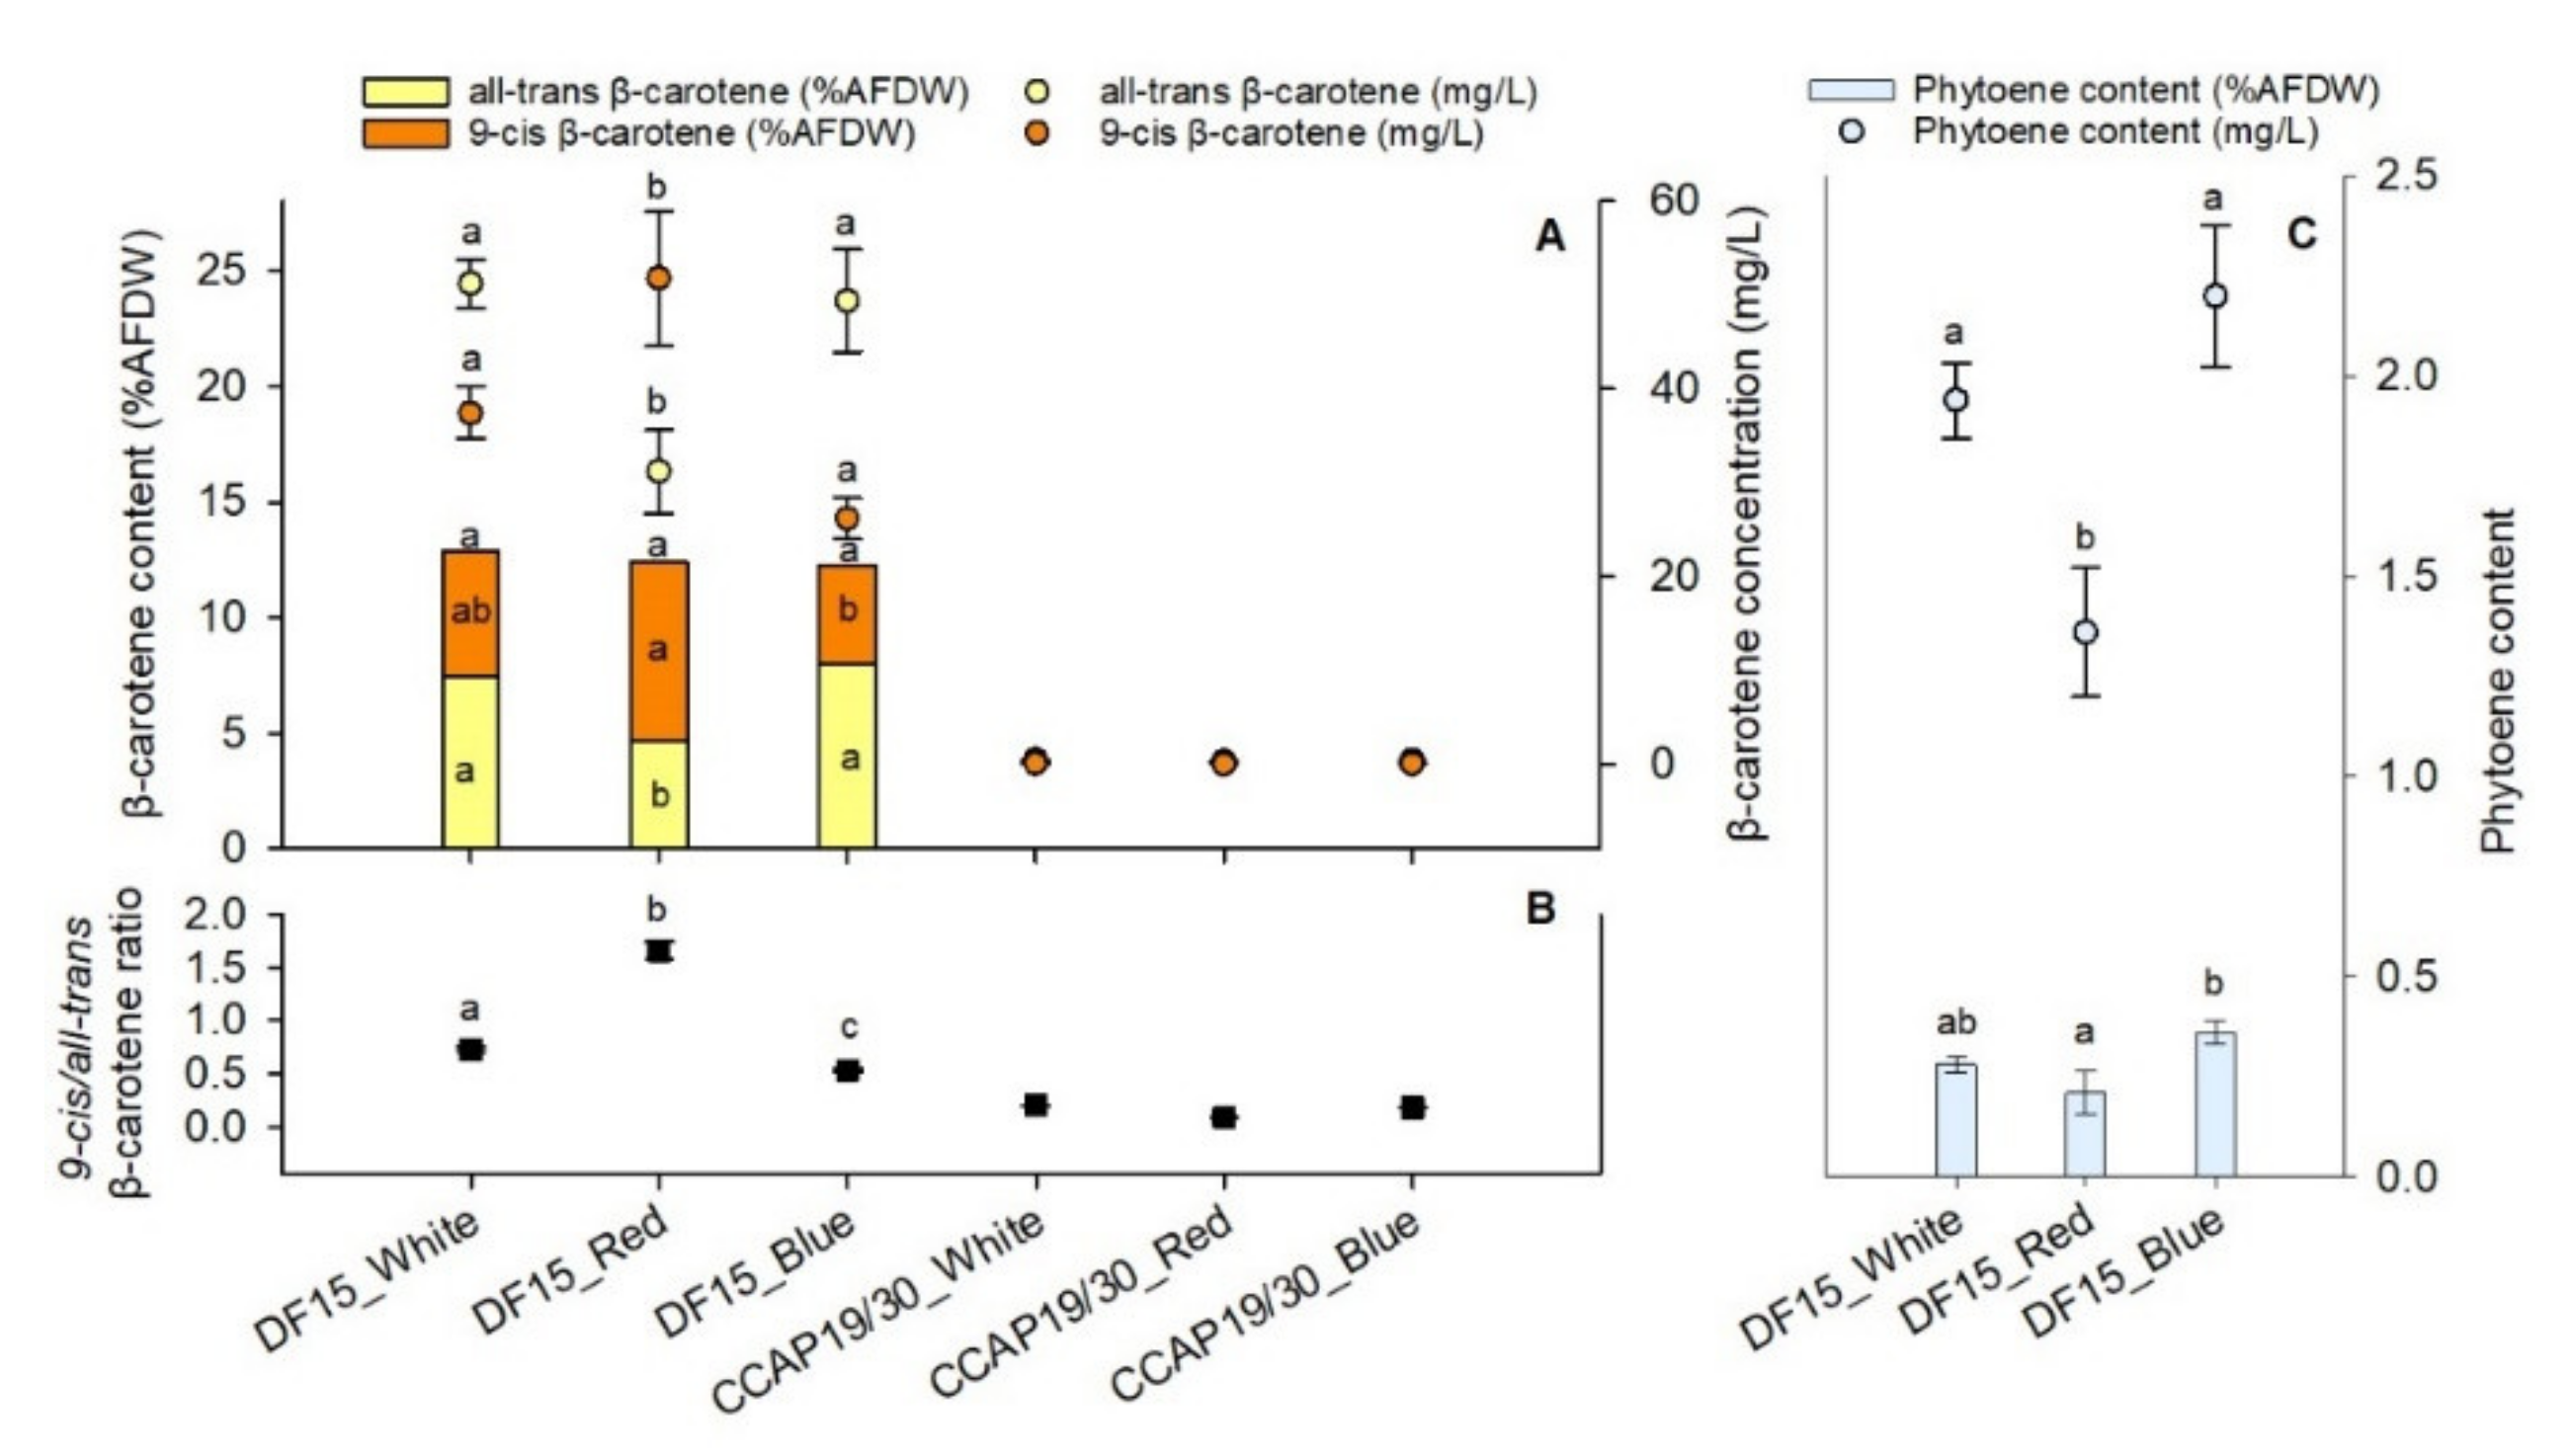
3.3. Carotenoids Production
4. Discussion
4.1. Protein and Amino Acid Dynamics
4.2. Carotenoids Dynamics
5. Conclusions
Supplementary Materials
Author Contributions
Funding
Institutional Review Board Statement
Informed Consent Statement
Conflicts of Interest
References
- Magyar, A.; Bowman, M.K.; Molnár, P.; Kispert, L. Neutral carotenoid radicals in photoprotection of wild-type Arabidopsis thaliana. J. Phys. Chem. B 2013, 117, 2239–2246. [Google Scholar] [CrossRef]
- Landrum, J.T. Carotenoids: Physical, Chemical, and Biological Functions and Properties; CRC Press: Boca Raton, FL, USA, 2009; ISBN 9781420052312. [Google Scholar]
- Ablazov, A.; Mi, J.; Jamil, M.; Jia, K.-P.; Wang, J.Y.; Feng, Q.; Al-Babili, S. The Apocarotenoid Zaxinone Is a Positive Regulator of Strigolactone and Abscisic Acid Biosynthesis in Arabidopsis Roots. Front. Plant Sci. 2020, 11, 578. [Google Scholar] [CrossRef]
- Ben-Amotz, A.; Katz, A.; Avron, M. Accumulation of beta-carotene in halotolerant algae: Purification and characterization of β-carotene-rich globules from Dunaliella bardawil (chlorophyceae). J. Phycol. 1982, 18, 529–537. [Google Scholar] [CrossRef]
- Xu, Y.; Harvey, P.J. Red Light Control of β-Carotene Isomerisation to 9-cis β-Carotene and Carotenoid Accumulation in Dunaliella salina. Antioxidants 2019, 8, 148. [Google Scholar] [CrossRef] [Green Version]
- Xu, Y.; Harvey, P.J. Phytoene and phytofluene overproduction by Dunaliella salina using the mitosis inhibitor chlorpropham. Algal Res. 2020, 52, 102126. [Google Scholar] [CrossRef]
- Sui, Y.; Vlaeminck, S.E. Dunaliella Microalgae for Nutritional Protein: An Undervalued Asset. Trends Biotechnol. 2020, 38, 10–12. [Google Scholar] [CrossRef] [PubMed]
- Harvey, P.J.; Ben-Amotz, A. Towards a sustainable Dunaliella salina microalgal biorefinery for 9-cis β-carotene production. Algal Res. 2020, 50, 102002. [Google Scholar] [CrossRef]
- Sui, Y.; Muys, M.; Van de Waal, D.B.; D’Adamo, S.; Vermeir, P.; Fernandes, T.V.; Vlaeminck, S.E. Enhancement of co-production of nutritional protein and carotenoids in Dunaliella salina using a two-phase cultivation assisted by nitrogen level and light intensity. Bioresour. Technol. 2019, 287, 121398. [Google Scholar] [CrossRef]
- Sui, Y.; Muys, M.; Vermeir, P.; D’Adamo, S.; Vlaeminck, S.E. Light regime and growth phase affect the microalgal production of protein quantity and quality with Dunaliella salina. Bioresour. Technol. 2019, 275, 145–152. [Google Scholar] [CrossRef]
- Sui, Y.; Harvey, P.J. Effect of Light Intensity and Wavelength on Biomass Growth and Protein and Amino Acid Composition of Dunaliella salina. Foods 2021, 10, 1018. [Google Scholar] [CrossRef]
- Lv, H.; Qiao, C.; Zhong, C.; Jia, S. Metabolic fingerprinting of Dunaliella salina cultured under sulfur deprivation conditions. J. Appl. Phycol. 2018, 30, 355–365. [Google Scholar] [CrossRef]
- Lv, H.; Cui, X.; Tan, Z.; Jia, S. Analysis of metabolic responses of Dunaliella salina to phosphorus deprivation. J. Appl. Phycol. 2017, 29, 1251–1260. [Google Scholar] [CrossRef]
- Xu, Y.; Harvey, P.J. Carotenoid production by Dunaliella salina under red light. Antioxidants 2019, 8, 123. [Google Scholar] [CrossRef] [PubMed] [Green Version]
- Xu, Y.; Ibrahim, I.M.; Harvey, P.J. Potential of New Isolates of Dunaliella salina for Natural β -Carotene Production. Biology 2018, 7, 14. [Google Scholar] [CrossRef] [PubMed] [Green Version]
- Borowitzka, M.A. Algal growth media and sources of cultures. In Micro-Algal Biotechnology; Cambridge University Press: Cambridge, UK, 1988; pp. 456–465. ISBN 0-521-32349-5. [Google Scholar]
- Phenomenex. Phenomenex EZ: Faast Amino Acid Analysis; Phenomenex: Torrance, CA, USA, 2003. [Google Scholar]
- Schroeder, D.; Harvey, P.J.; Xu, Y. Algal Strains. Patent WO/2018/141978, 3 February 2017. [Google Scholar]
- Hansberg, W.; Aguirre, J. Hyperoxidant states cause microbial cell differentiation by cell isolation from dioxygen. J. Theor. Biol. 1990, 142, 201–221. [Google Scholar] [CrossRef]
- Salbitani, G.; Carfagna, S. Ammonium utilization in microalgae: A sustainable method for wastewater treatment. Sustainability 2021, 13, 956. [Google Scholar] [CrossRef]
- Chen, M.; Tang, H.; Ma, H.; Holland, T.C.; Ng, K.Y.S.; Salley, S.O. Effect of nutrients on growth and lipid accumulation in the green algae Dunaliella tertiolecta. Bioresour. Technol. 2011, 102, 1649–1655. [Google Scholar] [CrossRef]
- Alipanah, L.; Rohloff, J.; Winge, P.; Bones, A.M.; Brembu, T. Whole-cell response to nitrogen deprivation in the diatom Phaeodactylum tricornutum. J. Exp. Bot. 2015, 66, 6281–6296. [Google Scholar] [CrossRef] [Green Version]
- Halsey, K.H.; Milligan, A.J.; Behrenfeld, M.J. Linking time-dependent carbon-fixation efficiencies in Dunaliella Tertiolecta (Chlorophyceae) to underlying metabolic pathways. J. Phycol. 2011, 47, 66–76. [Google Scholar] [CrossRef]
- Remmers, I.M.; D’Adamo, S.; Martens, D.E.; de Vos, R.C.H.; Mumm, R.; America, A.H.P.; Cordewener, J.H.G.; Bakker, L.V.; Peters, S.A.; Wijffels, R.H.; et al. Orchestration of transcriptome, proteome and metabolome in the diatom Phaeodactylum tricornutum during nitrogen limitation. Algal Res. 2018, 35, 33–49. [Google Scholar] [CrossRef]
- Zhang, Y.; Liu, Y.; Cao, X.; Gao, P.; Liu, X.; Wang, X.; Zhang, J.; Zhou, J.; Xue, S.; Xu, G.; et al. Free amino acids and small molecular acids profiling of marine microalga Isochrysis zhangjiangensis under nitrogen deficiency. Algal Res. 2016, 13, 207–217. [Google Scholar] [CrossRef]
- Van de Waal, D.B.; Ferreruela, G.; Tonk, L.; Van Donk, E.; Huisman, J.; Visser, P.M.; Matthijs, H.C.P. Pulsed nitrogen supply induces dynamic changes in the amino acid composition and microcystin production of the harmful cyanobacterium Planktothrix agardhii. FEMS Microbiol. Ecol. 2010, 74, 430–438. [Google Scholar] [CrossRef] [Green Version]
- Kiyota, H.; Hirai, M.; Ikeuchi, M. NblA1/A2-Dependent Homeostasis of Amino Acid Pools during Nitrogen Starvation in Synechocystis sp. PCC 6803. Metabolites 2014, 4, 517–531. [Google Scholar] [CrossRef]
- Patelou, M.; Infante, C.; Dardelle, F.; Randewig, D.; Kouri, E.D.; Udvardi, M.K.; Tsiplakou, E.; Mantecón, L.; Flemetakis, E. Transcriptomic and metabolomic adaptation of Nannochloropsis gaditana grown under different light regimes. Algal Res. 2020, 45, 101735. [Google Scholar] [CrossRef]
- da Fontoura Prates, D.; Duarte, J.H.; Vendruscolo, R.G.; Wagner, R.; Ballus, C.A.; da Silva Oliveira, W.; Godoy, H.T.; Barcia, M.T.; de Morais, M.G.; Radmann, E.M.; et al. Role of light emitting diode (LED) wavelengths on increase of protein productivity and free amino acid profile of Spirulina sp. cultures. Bioresour. Technol. 2020, 306, 123184. [Google Scholar] [CrossRef] [PubMed]
- Jungandreas, A.; Costa, B.S.; Jakob, T.; Von Bergen, M.; Baumann, S.; Wilhelm, C. The acclimation of Phaeodactylum tricornutum to blue and red light does not influence the photosynthetic light reaction but strongly disturbs the carbon allocation pattern. PLoS ONE 2014, 9, e99727. [Google Scholar] [CrossRef] [PubMed] [Green Version]
- Latsos, C.; Bakratsas, G.; Moerdijk, T.; van Houcke, J.; Timmermans, K.R. Effect of salinity and pH on growth, phycoerythrin, and non-volatile umami taste active compound concentration of Rhodomonas salina using a D-optimal design approach. J. Appl. Phycol. 2021, 1, 3. [Google Scholar] [CrossRef]
- Hwang, Y.H.; Ismail, I.; Joo, S.T. Identification of Umami Taste in Sous-vide Beef by Chemical Analyses, Equivalent Umami Concentration, and Electronic Tongue System. Foods 2020, 9, 251. [Google Scholar] [CrossRef] [Green Version]
- Mau, J.L. The umami taste of edible and medicinal mushrooms. Int. J. Med. Mushrooms 2005, 7, 119–125. [Google Scholar] [CrossRef]
- Ben-amotz, A.; Avron, M. On the Factors Which Determine Massive beta-Carotene Accumulation in the Halotolerant Alga Dunaliella bardawil. Plant Physiol. 1983, 72, 593–597. [Google Scholar] [CrossRef] [Green Version]
- Finney, K.F.; Pomeranz, Y.; Bruinsma, B.L. Use of algae Dunaliella as a protein supplement in bread. Cereal Chem. 1984, 61, 402–406. [Google Scholar]
- Ben-Amotz, A. Effect of low temperature on the stereoisomer composition of β-carotene in the halotolerant alga Dunaliella bardawil (Chlorophyta). J. Phycol. 1996, 32, 272–275. [Google Scholar] [CrossRef]
- García-González, M.; Moreno, J.; Cañavate, J.P.; Anguis, V.; Prieto, A.; Manzano, C.; Florencio, F.J.; Guerrero, M.G. Conditions for open-air outdoor culture of Dunaliella salina in southern Spain. J. Appl. Phycol. 2003, 15, 177–184. [Google Scholar] [CrossRef]
- Ben-Amotz, A.; Lers, A.; Avron, M. Stereoisomers of β-Carotene and Phytoene in the Alga Dunaliella bardawil. Plant Physiol. 1988, 86, 1286–1291. [Google Scholar] [CrossRef] [PubMed] [Green Version]
- Davidi, L.; Pick, U. Novel 9-cis/all-trans β-carotene isomerases from plastidic oil bodies in Dunaliella bardawil catalyze the conversion of all-trans to 9-cis β-carotene. Plant Cell Rep. 2017, 36, 807–814. [Google Scholar] [CrossRef] [PubMed]
- Mazzucchi, L.; Xu, Y.; Harvey, P. Stereoisomers of colourless carotenoids from the marine microalga Dunaliella salina. Molecules 2020, 25, 1880. [Google Scholar] [CrossRef]
- Harvey, P.J.; Xu, Y. Production of Dunaliella. Patent WO/2019/097219, 14 November 2017. [Google Scholar]


| mg/g Protein | Histidine | Isoleucine | Leucine | Lysine | Methionine + Cysteine | Phenylalanine + Tyrosine | Threonine | Valine | Total EAA | |
|---|---|---|---|---|---|---|---|---|---|---|
| DF 15 | White | 12.1 ± 0.9 | 32.7 ± 0.8 | 43.9 ± 2.0 | 31.2 ± 2.6 | 13.1 ± 0.9 | 72.6 ± 4.5 | 19.6 ± 1.1 | 25.8 ± 0.8 | 251.0 ± 13.6 a |
| Red | 9.1 ± 0.4 | 32.3 ± 0.5 | 42.5 ± 0.3 | 24.0 ± 0.4 | 13.6 ± 0.4 | 59.8 ± 0.4 | 21.0 ± 0.2 | 26.6 ± 0.2 | 228.9 ± 2.9 b | |
| Blue | 10.7 ± 0.8 | 34.1 ± 0.7 | 49.2 ± 0.2 | 33.1 ± 1.5 | 11.8 ± 0.2 | 68.1 ± 4.0 | 14.0 ± 0.3 | 25.3 ± 0.4 | 246.2 ± 8.1 ab | |
| CCAP 19/30 | White | 6.8 ± 0.5 | 24.5 ± 0.5 | 33.9 ± 0.2 | 20.5 ± 0.5 | 7.6 ± 0.2 | 43.2 ± 0.6 | 17.6 ± 0.1 | 19.5 ± 0.2 | 173.7 ± 2.7 c |
| Red | 8.8 ± 0.6 | 28.1 ± 0.5 | 35.3 ± 0.3 | 21.9 ± 0.2 | 9.1 ± 0.4 | 48.3 ± 0.8 | 16.3 ± 0.5 | 21.2 ± 0.3 | 188.9 ± 3.6 c | |
| Blue | 10.4 ± 0.9 | 33.4 ± 0.6 | 43.2 ± 0.4 | 26.0 ± 0.6 | 11.0 ± 0.2 | 56.5 ± 0.8 | 23.2 ± 0.4 | 25.7 ± 0.4 | 229.5 ± 4.1 b | |
| FAO/WHO | 15 | 30 | 59 | 45 | 22 | 38 | 23 | 39 | 271 |
Publisher’s Note: MDPI stays neutral with regard to jurisdictional claims in published maps and institutional affiliations. |
© 2021 by the authors. Licensee MDPI, Basel, Switzerland. This article is an open access article distributed under the terms and conditions of the Creative Commons Attribution (CC BY) license (https://creativecommons.org/licenses/by/4.0/).
Share and Cite
Sui, Y.; Mazzucchi, L.; Acharya, P.; Xu, Y.; Morgan, G.; Harvey, P.J. A Comparison of β-Carotene, Phytoene and Amino Acids Production in Dunaliella salina DF 15 (CCAP 19/41) and Dunaliella salina CCAP 19/30 Using Different Light Wavelengths. Foods 2021, 10, 2824. https://0-doi-org.brum.beds.ac.uk/10.3390/foods10112824
Sui Y, Mazzucchi L, Acharya P, Xu Y, Morgan G, Harvey PJ. A Comparison of β-Carotene, Phytoene and Amino Acids Production in Dunaliella salina DF 15 (CCAP 19/41) and Dunaliella salina CCAP 19/30 Using Different Light Wavelengths. Foods. 2021; 10(11):2824. https://0-doi-org.brum.beds.ac.uk/10.3390/foods10112824
Chicago/Turabian StyleSui, Yixing, Laura Mazzucchi, Parag Acharya, Yanan Xu, Geraint Morgan, and Patricia J. Harvey. 2021. "A Comparison of β-Carotene, Phytoene and Amino Acids Production in Dunaliella salina DF 15 (CCAP 19/41) and Dunaliella salina CCAP 19/30 Using Different Light Wavelengths" Foods 10, no. 11: 2824. https://0-doi-org.brum.beds.ac.uk/10.3390/foods10112824