Article

Non-Destructive Measuring Systems for the Evaluation of High Oxygen Stored Poultry: Development of Headspace Gas Composition, Sensory and Microbiological Spoilage

by
Jasmin Dold
1,*,
Caroline Kehr
1,
Clarissa Hollmann
1 and
Horst-Christian Langowski
2,3
1
Chair of Brewing and Beverage Technology, Technical University of Munich, Weihenstephaner Steig 20, D-85354 Freising, Germany
2
TUM School of Life Sciences, Technical University of Munich, Weihenstephaner Steig 22, D-85354 Freising, Germany
3
Fraunhofer Institute for Process Engineering and Packaging, Giggenhauser Straße 35, D-85354 Freising, Germany
*
Author to whom correspondence should be addressed.
Submission received: 31 January 2022 / Revised: 15 February 2022 / Accepted: 17 February 2022 / Published: 18 February 2022

Abstract

:
As poultry is known to be a perishable food, the use-by date is set in such a way that food safety is guaranteed even with a higher initial bacterial count. This means, however, that some products are wasted, even if they are still safe to eat. Therefore, non-destructive measurement devices might be a good opportunity for individual shelf-life prediction, e.g., in retail. The aim of this study was therefore to use non-destructive measurement devices based on fluorescence quenching (oxygen detection) and mid-infrared laser spectroscopy (carbon dioxide detection) for the monitoring of high-oxygen-packed poultry in different storage conditions. During 15 days of storage, the gas composition of the headspace was assessed (non-destructively and destructively), while total plate count was monitored and a comprehensive sensory evaluation was performed by a trained panel. We were able to demonstrate that in most cases, non-destructive devices have comparable precision to destructive devices. For both storage conditions, the sensory attribute slime was correlated with reaching the critical microbiological value of 107 CFU/g; the attribute buttery was also useful for the prediction of regularly stored poultry. The change in the gas atmosphere as a sign of premature spoilage, however, was only possible for samples stored in irregular conditions.

1. Introduction

Food waste is a global issue, estimated by the FAO (Food and Agriculture Organization of the United Nations) to be about 1.3 billion tons per year worldwide [1]. In the wealthier industrialized countries, more than 50% of food waste happens during distribution in the retail sector or at the consumer’s home, often due to an expired “best before” or “use by” date [1,2]. The individual quality evaluation of an already packed foodstuff represents a major research topic of our time for different reasons. First of all, the quality standards and consumer expectations of foodstuffs are constantly increasing. To integrate an intelligent sensor, e.g., a colorimetric dye, into a packaging system can serve as both a safeguard for the manufacturer to ensure quality and at the same time to give the consumer the feeling that they are in charge of quality control. The latter, however, brings the disadvantage that consumers are often insecure in estimating the information in the right way, which can cause unnecessary food waste [3]. In addition, the risk remains that the indicator is false negative due to the lack of the relevant metabolites, for example, something that could have very negative consequences if pathogens (e.g., Campylobacter jejuni) are present [3,4]. Contrary to the earlier assumption that chicken meat is best packed in a low-oxygen (O2) atmosphere [5], nowadays, a modified atmosphere packaging (MAP) with a high O2 and a low carbon dioxide (CO2) content is often chosen, as the high O2 amount is known to inhibit the growth of the anaerobic pathogen C. jejuni [6]. Therefore, some studies focusing on the growth of microorganisms on fresh poultry under high O2 atmosphere were conducted. By identifying different types of microorganisms as being part of the spoilage—such as Brochothrix thermosphacta or Carnobacteria—they also noticed a decrease in O2 and an increase in CO2 in the headspace of the packaging during the storage time, measured via destructive gas detection devices [7,8]. Further studies confirmed the connection of O2 consumption in the headspace of packed meat products with the growth of different types of microorganisms [9,10]. However, the authors were not in full agreement whether the change in gas composition was really correlated with the critical value of spoilage or not. The critical value is defined as 107 colony-forming units per gram of sample (CFU/g) [11].
The quality determination of food by optical measurement methods has some advantages that cannot be denied. First of all, most of the methods are very fast and easy to handle. In addition, a lot of successful research that provides a good basis for the comparability and interpretation of results was conducted in the past. Another big advantage is that the measurements are non-destructive in most cases and can therefore be used for the quality evaluation of already packed foodstuffs. There are systems available over a wide range of the optical spectrum, with several advantages and disadvantages, as we already discussed in Dold and Langowski (2022) [12]. In our work shown here, we used measurement systems based on fluorescence quenching and infrared (IR) spectroscopy. Fluorescence quenching—or more precisely, dynamic quenching—can be used for determining O2 concentrations, as these molecules are able to absorb the energy of a fluorophore excited by visible light which leads to a shorter luminescence lifetime as a consequence. This effect can be described with the Stern–Volmer equation [13]. It is therefore a useful tool for the detection of packaging integrity for modified atmosphere packed products [14] but may also be useful for a statement on microbiological spoilage [15], by successful integration into a suitable packaging system. Measurement systems based on IR are also well studied for the quality determination of food and already packaged foodstuffs. Schmutzler et al., for example, studied the adulteration of veal sausage with pork products, using different near-infrared (NIR) devices in 2016 [16]. When light is used in the NIR and mid-infrared (MIR) range, vibrational states of the molecules are excited; in the far-infrared (FIR), IR radiation leads to the excitation of rotational states [17]. The resulting absorption peaks are characteristic for many different properties, such as gas concentration [18] or moisture content [19]. In this work, we used a device working in the MIR range for the detection of CO2.
At the 2nd International Electronic Conference on Foods—“Future Foods and Food Technologies for a Sustainable World”, we already showed some of our results, showing that non-destructive measurement devices are able to monitor the gas atmosphere in the headspace of transparent packages. Therefore, high-O2-packed poultry was stored over a period of 15 days at two different temperatures. We showed the development of the headspace concentrations of O2 and CO2 during storage via the non-destructive devices and the development of the microbiological spoilage in comparison to sensory acceptability. These results are also presented in the following publication. We concluded that the systems cannot be used for the shelf-life prediction of regularly stored poultry with only these parameters. We decided that a correlation with volatile emissions (volatile organic compounds (VOCs)) might be useful, which had to be part of an extensive sensory evaluation. In this publication, we show a more extensive sensory panel evaluation of the samples during storage, as well as the results of the previous training of the panelists. These results were further correlated in detail with the gas change and microbiological spoilage. In addition, the formed VOCs were theoretically assigned to typical meat spoilers. We also studied the influence of the headspace to meat ratio for best possible measurement accuracy. To further demonstrate the suitability of the non-destructive devices, their measurement precision was compared to that of the destructive devices.

2. Materials and Methods

2.1. Panel Training for the Sensory Evaluation

For the sensory evaluation of the samples, a panel (n = 15) consisting of 5 female and 10 male participants with an average age of 29 years was selected.
First, a descriptive analysis was carried out. Therefore, the panelists had to describe two poultry strips in their own words. The first sample was fresh slaughtered poultry and the second a forced-aged sample (4 days stored at 23 °C). A distinction was thereby made between visual and olfactory impression.
Based on the descriptive analysis, fitting references for further training (olfactory references) and for the sensory evaluation (olfactory and visual references) were selected and prepared, respectively. As olfactory references, common odor substances (e.g., diacetyl for buttery) were used. For the visual evaluation, a color chart for fresh and forced-aged poultry was designed. For this purpose, the RGB values of the meat samples were measured and transferred for both fresh and forced-aged poultry to a color chart, which was available to the panelists during the evaluation. In addition, images of fresh and forced-aged poultry were printed as image reference.
Subsequently, the named attributes were collected, and the most frequently described attributes were selected for the second part of the training, consisting of an odor identification test. For this purpose, the participants were given standardized flavors (references) corresponding to the attributes selected above, which they had to match to the correct attributes. In addition, they had to evaluate the odor intensity for each sample with the help of a line scale, ranging from weak (0) to strong (100). This was used to determine how sensitive each panelist was to the flavors.

2.2. Determination of the Headspace Gas Atmosphere

2.2.1. Non-Destructive Determination of O2 Concentration

For the non-destructive determination of O2 gas concentration, a fluorescence-based measurement system and associated sensor spots containing a fluorescent dye (PreSens Precision Sensing GmbH, Regensburg, Germany) were used. The measurement device works via fiber optics, exciting the embedded fluorophores at a wavelength of 505 nm. The excited fluorophores emit fluorescent light at a wavelength of 650 nm, when returning back to the ground state. Fiber optics has an integrated photodiode (which measures the luminescence lifetime of the emitting fluorophores) that is directly linked with the O2 concentration, as already described in the Introduction section. To integrate the sensor spots into the lid film, a sensor spot was placed on the inside of the lid film, (PP/PA/PP/PA, 100 μm, allvac Folien GmbH, Waltenhofen, Germany) covered with a PP film (56 μm, Huhtamaki Flexible Packaging Germany GmbH & Co. KG, Ronsberg, Germany) and sealed with a ring-shaped sealing tool at 155 °C. Before sealing, a two-point calibration of the sensor spots in the relevant measuring range (0 and 60% O2 % (v/v)) was carried out. All O2 gas concentrations mentioned in the text are to be understood as percent by volume (v/v).

2.2.2. Non-Destructive Determination of CO2 Concentration

The non-destructive measurement of CO2 was carried out with a measurement system based on MIR spectroscopy (KNESTEL Technologie und Elektronik GmbH; Hopferbach, Germany). Three different wavelengths in the region of the CO2 vibrational mode were used: λ1 = 4.26 μm, λ2 = 4.45 μm, and λ3 = 4.27 μm. The beam of a tunable diode laser was directed at 45° through the corner of the transparent packaging. A two-point calibration with 0% (v/v) and 40% (v/v) CO2 was carried out on the empty reference trays. All CO2 gas concentrations mentioned in the text are to be understood as percent by volume (v/v).

2.2.3. Destructive Determination of O2 and CO2 Concentration

To estimate the measuring accuracy of the non-destructive devices, a comparison with a destructive measurement system was made. Therefore, a gas analyzer (MAT1500, A.KRÜSS Optronic GmbH, Hamburg, Germany) with a zirconium dioxide sensor for determining O2 and a non-dispersive infrared sensor for determining CO2 gas concentration were used. To extract small aliquots (7 mL) of the gas atmosphere, a hollow needle belonging to the measuring device was inserted into the headspace of the packaging via a septum attached to the lid film.

2.3. Microbiological Analysis

Samples were prepared for microbiological analysis as already described in Höll et al., 2016 [7], with slight modifications: In a typical analysis, a total of 70 g of chicken strips were weighed in a sample bag (VWR International, Darmstadt, Germany) and homogenized for 120 s with 50 mL Ringer’s solution (Merck KGaA, Darmstadt, Germany) in a stomacher (LabBlender400, Gemini BV, Apeldoorn, Netherlands). A tenfold dilution series of chicken homogenate was prepared with Ringer’s solution. An amount of 100 μL of each dilution was later spread onto the brain heart infusion agar (Carl Roth GmbH & Co. KG, Karlsruhe, Germany) using sterile glass beads. After incubating the plates aerobically at 30 °C for 3 days, the number of colony-forming units on the plates were counted and the units per gram sample (CFU/g) were calculated.

2.4. Influence of the Headspace-to Product Ratio

For the selection of an appropriate headspace:meat ratio, a pre-trial was carried out, with two different headspace:meat ratios—6:1 and 3:1. For this purpose, 200 g fresh chicken strips (Donautal Geflügelspezialitäten, Bogen, Germany) for the 6:1 and 400 g fresh chicken strips for the 3:1 ratio were weighed in transparent polypropylene trays (ES-Plastic GmbH, Hutthurm, Germany) and sealed with a semiautomatic tray sealer (T250, MULTIVAC Sepp Haggenmüller SE & Co. KG, Wolfertschwenden, Germany) under a modified gas atmosphere of 70% O2/30% CO2. Afterwards, the samples were stored at 10 °C for 11 days, as a greater change in the gas atmosphere was expected at this temperature. The O2 and CO2 concentrations were measured with a destructive measuring device (see Section 2.2.3) during storage.

2.5. Storage at Different High-Oxygen Atmospheres

2.5.1. Sample Preparation

For the main trials, a total of 400 g of fresh chicken strips were weighed into transparent polypropylene trays and sealed with the semiautomatic tray sealer at two modified gas atmosphere compositions: 70% O2/30% CO2 or 80% O2/20% CO2. For each atmosphere, six packages were prepared using lid films with integrated sensor spots as described above. In addition, 44 samples were prepared for each gas atmosphere without integrated sensor materials for the destructive gas concentration measurement as well as for the sensory and microbiological evaluation. Samples were stored at 4 °C and 10 °C. Furthermore, three empty trays were prepared for each temperature and gas combination with sealed-in sensor spots to monitor the concentrations of O2 and CO2 without product influence during storage. For destructive monitoring, two empty trays were prepared for each day of measurement and each gas concentration or storage temperature (n = 64).

2.5.2. Determination of O2 and CO2 Gas Concentration

The gas atmosphere of the prepared trays was monitored for 15 days (except for day 3 for the filled trays and days 3, 5, 6, 12, and 13 for the empty trays) via the non-destructive measurement devices for O2 and CO2 detection. In addition, measurements with the destructive measuring device for O2 and CO2 detection were carried out on days 0, 1, 4, 6, 8, 11, 13 and 15 to validate the measuring precision of the non-destructive devices for this purpose.

2.5.3. Determination of the Total Viable Count

The total viable count (TVC) was determined for each temperature and gas composition on days 0, 1, 4, 6, 8, 11, 13, and 15 in duplicate.

2.5.4. Sensory Evaluation during Storage

During the storage trial, the samples were investigated by the panelists on days 0, 1, 4, 6, and 8 (4 °C and 10 °C), and on days 11 and 14 for the samples stored at 4 °C. The intensity of the previously specified and trained attributes was evaluated visually and olfactorily on a line scale ranging from 0 to 100 (0 = not perceptible; 100 = strongly perceptible). In addition, it was asked whether the sample was perceived as visually and olfactorily fresh or rotten. This was also classified by a line scale ranging from 0 (fresh) to 100 (rotten). For the evaluation, a sample was defined as no longer acceptable when the average value of the olfactory or visual impression was ≥50.

2.6. Statistical Analysis

The drawings and statistical analysis were performed using MS Excel and Origin version 2021 (Origin Lab., Hampton, VA, USA). All data are presented as the arithmetic mean ± standard deviation. For the calculation of the statistical significance, two-sample t-tests (two-tailed) were performed (alpha level 0.05). An analysis of variance was performed to test for equal variances prior to t-test analysis.

3. Results and Discussion

3.1. Panel Training

The first part of the panel training consisted of a descriptive analysis. The summed attributes of the panel are shown in Table 1 for both the visual and olfactory impressions. For the forced-aged sample, many more attributes were found. This is to be expected, as fresh poultry is rather odorless and characterized by a neutral pink coloration [20]. The named attributes for the forced-aged samples were also mostly described in the literature [20,21,22,23]. The two odors, buttery (diacetyl) and pungent (acetic acid), which are also linked with the spoilage of poultry [22,23], were not mentioned by the panel. Nevertheless, they were added to the descriptors and were part of the second part of the training. One possible reason for the missing perception of these attributes during the descriptive analysis might be the forcing at room temperature. In this case, the sulfurous impression became very intense, which probably overlapped with the presence of the diacetyl and pungent odor. For the second part of the training, the references showed in Table 2 were chosen for the odor identification test. All panelists were able to correctly match the flavors to their fitting attributes.

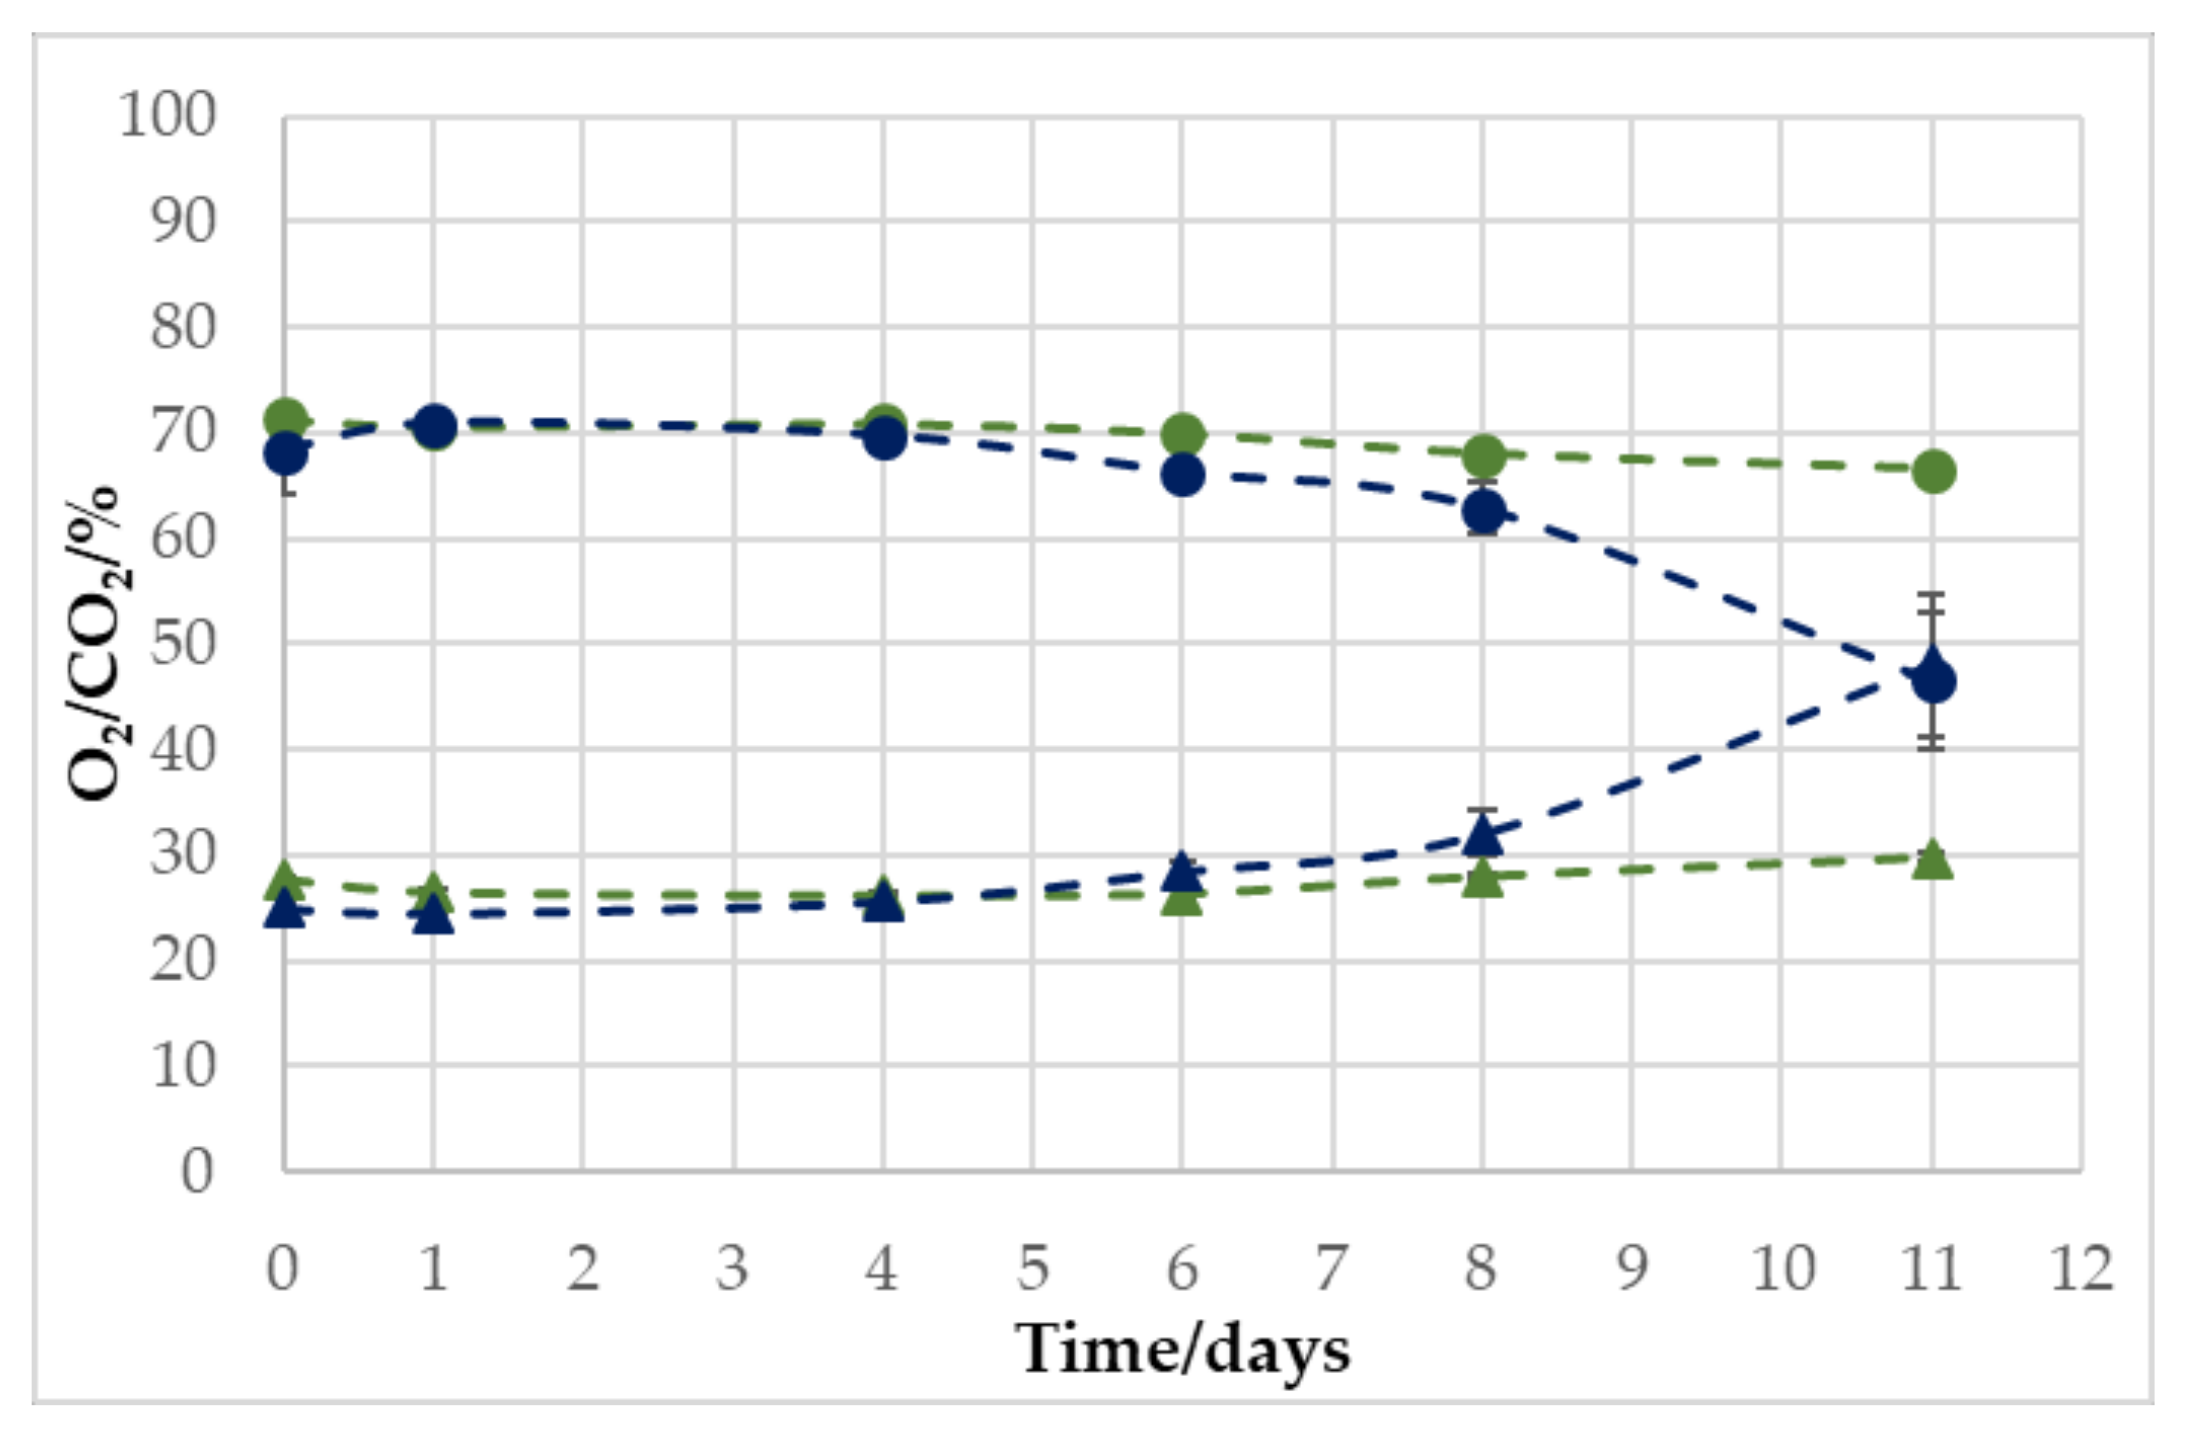
3.2. Influence of the Headspace to Product Ratio

The measurement of O2 and CO2 over a storage period of 11 days at 10 °C with two different headspace:meat volume ratios showed very clearly that the headspace volume is decisive for the effect of O2 respiration, which was previously described. In Figure 1, it can be seen that the samples with a headspace:meat volume of 3:1 experienced a considerable change in headspace atmosphere, as both O2 and CO2 reached a concentration between 45 and 50% on day 11. This means that the O2 amount decreased and the CO2 amount increased, as the starting concentration was 70% O2 and 30% CO2.
However, the samples with a 6:1 ratio showed hardly any change, with end-concentrations on day 11 of 66.6 ± 0.2% O2 and 29.8 ± 0.37% CO2. For this reason, the following trials were carried out with a headspace:meat volume ratio of 3:1.

3.3. Non-Destructive vs. Destructive Determination of O2 and CO2 Concentration

To estimate the measuring precision and the suitability of the tested application, a comparison of the non-destructive and destructive measurement systems was carried out and can be seen in Figure 2. Clearly, the measuring points on day 0 and 1 for O2 were not in agreement with the destructive measurement. That is due to the fact that the sensor spots were integrated into the packaging lid under atmospheric oxygen partial pressure, and therefore the higher O2 concentration of the MAP had to permeate first into the spot area. For the CO2 measurement, the values could be recorded directly in real time.
From day 4, the measured values of the non-destructive methods of both O2 and CO2 were mostly in agreement with the destructive measurements, with individual exceptions, which are explainable by measurement inaccuracies. However, it is also noticeable that a very high standard of deviations were partially present. Presumably, two effects must be distinguished here. If we look at the measuring point on day 11 of graph d, it becomes clear that this must be an effect in which the gas development in different packages was different, since both the O2 and the CO2 content have a similarly large deviation. Here, the individual development of the gas atmosphere by spoilage—which builds the basis of this research—is again clarified.

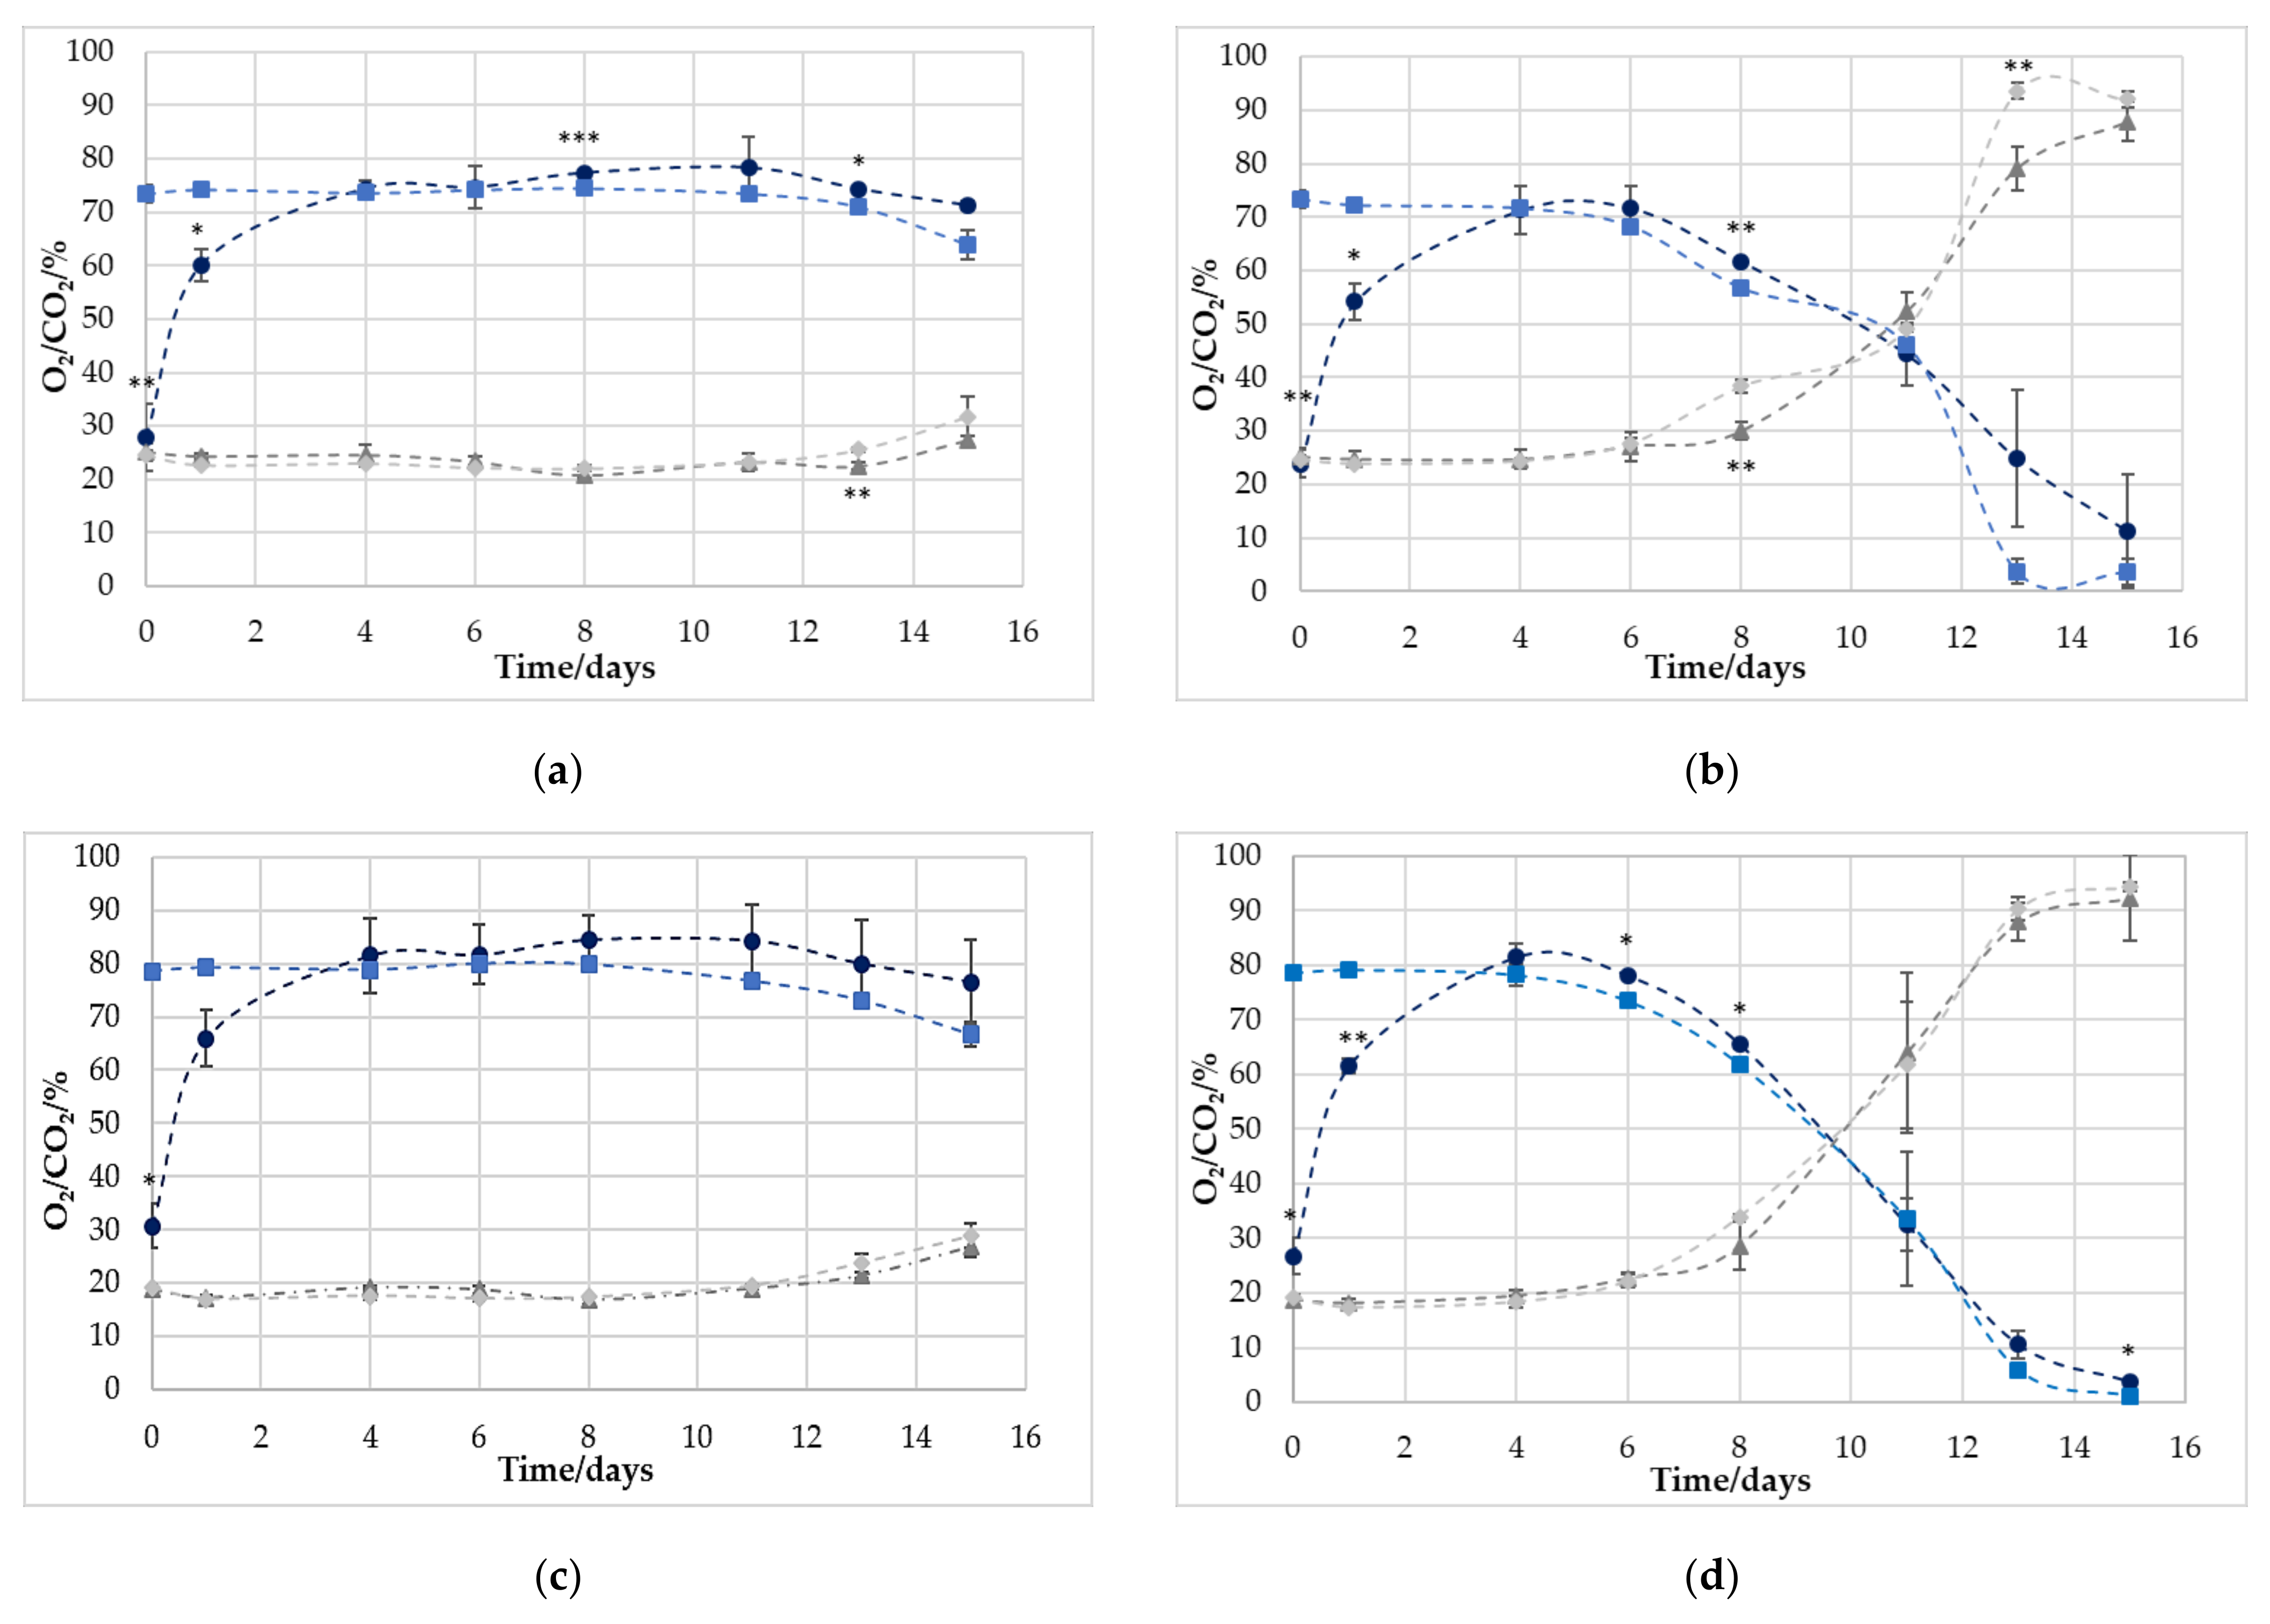
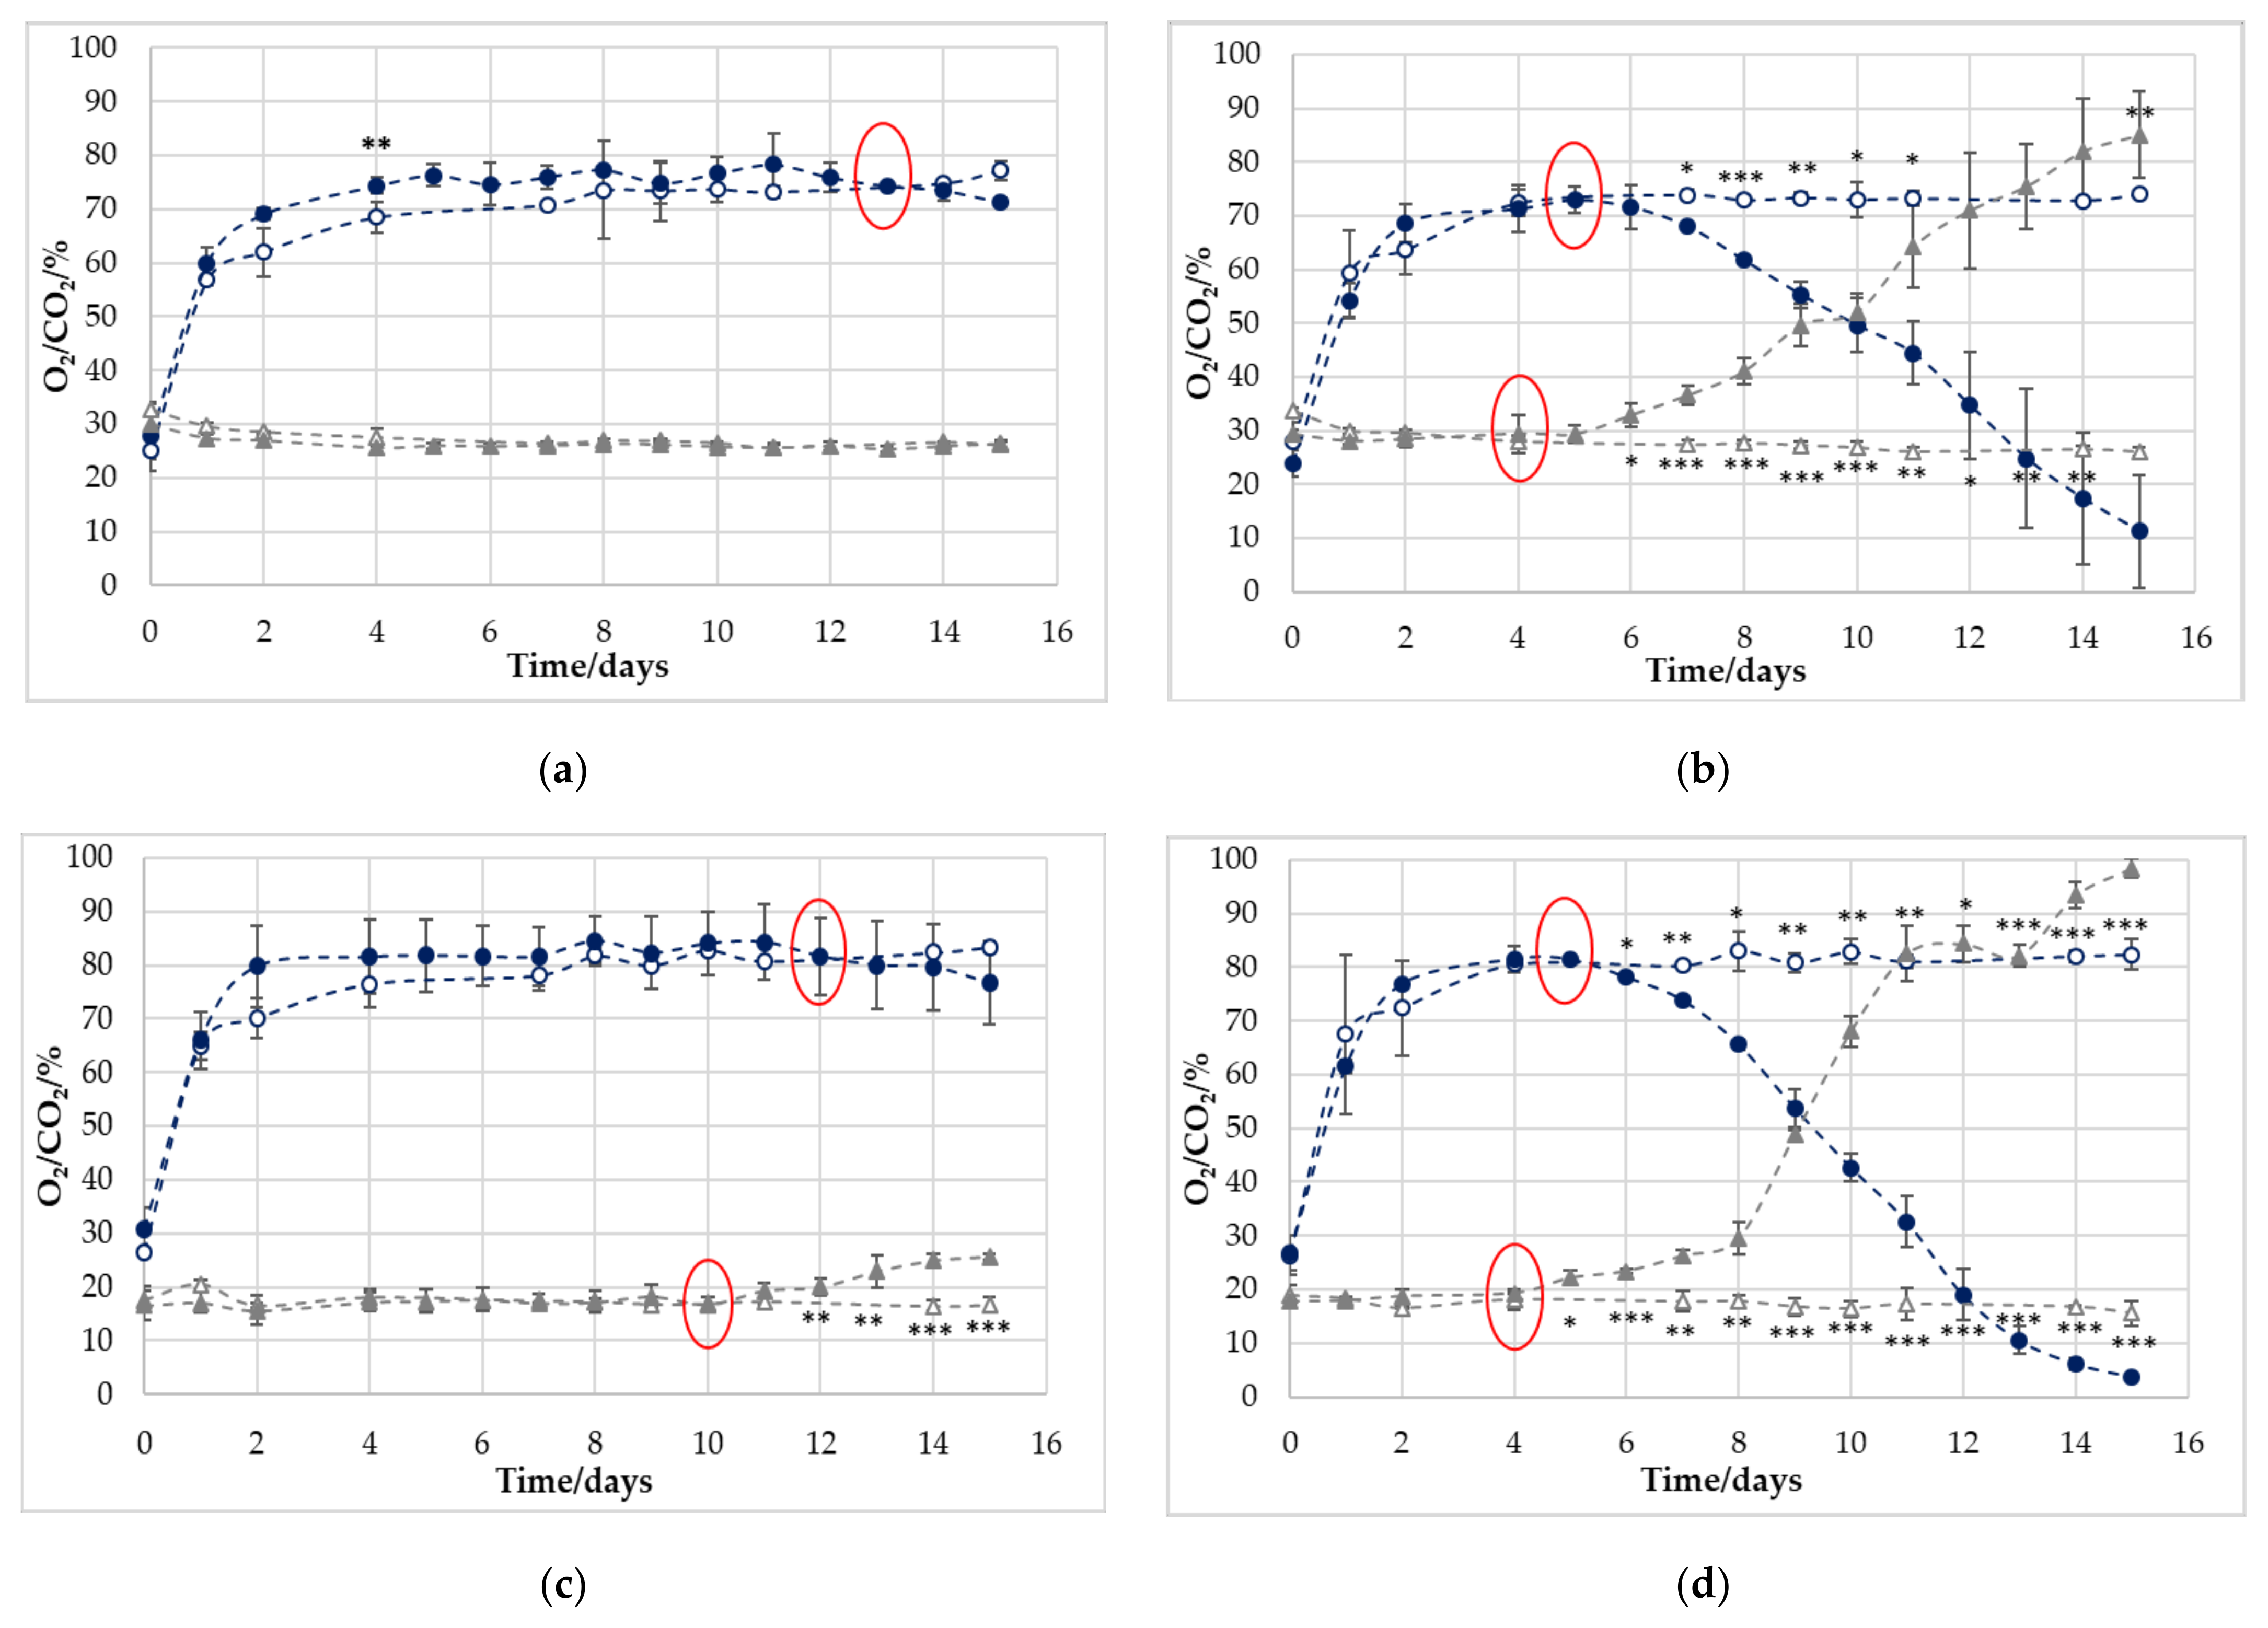
3.4. Development of the Gas Concentration in Empty and Filled Trays

Since the non-destructive measuring systems had similar accuracies compared to the destructive systems, the following results were obtained using only the non-destructive devices. The results are shown in Figure 3.
For the empty trays, almost no changes in the gas content were detected. The amount of O2 and CO2 increased and decreased slightly, respectively. In addition, the optical measurement method for O2 deviated from the real values at the first two to three measurement points. This was because the sensor spots were sealed into the lid film under atmospheric conditions and the higher O2 concentration in the MAP had to permeate into the spot area first, which was previously discussed in Section 3.3.
By comparing the empty and filled trays, the influence of the product was determined. The samples stored at 4 °C and flushed with 70% O2 and 30% CO2 (Figure 3a) showed the least change, only having a noticeable cross-over on day 13 for O2. A “cross-over” was defined as the day when the curve of the respective gas concentration in the filled trays intersects that of the empty trays. This is an indication of a microbiologically induced change in the headspace atmosphere. For CO2 content, however, no change in the headspace atmosphere was observed for the filled and empty trays.
The sample stored at 10 °C (Figure 3b) showed significant greater effects. For these samples, a cross-over for O2 was detected on day 5, and for CO2 was detected one day earlier. For both gases, the first significant deviation between empty and filled trays was present two days after having the cross-over (O2: day 7; CO2: day 6). Afterwards, a rapid decrease in the O2 and a similar increase in the CO2 concentration were visible. For both, the O2 and the CO2 measurements of the filled trays, high standard deviations were visible from day 11 on. As already described in the prior chapter, this was an effect induced by the individual development of the microbiota.
For the 80% O2/20% CO2 MAP samples stored at 4 °C (Figure 3c), a significant deviation was noted between the filled and empty trays for the CO2 measurement from days 12 to 15. However, O2 did not show a statistically significant deviation. The cross-over was on day 12 and then the O2 content of the filled package decreased steadily until day 15. Samples stored at 10 °C showed the earliest deviation from the empty trays, with a significant change at day 5 for CO2 and day 6 for O2. The cross-over was on day 4 (CO2) and 5 (O2), similar to the samples packed at lower oxygen amounts. The O2 decrease and CO2 increase was even faster, with values almost reaching 100% CO2, and totally respired O2 on day 15.
The results clearly indicate that a difference in microbiological spoilage was present. However, the fact that the samples stored at 4 °C showed such a low change in gas concentration stands in contrast to the underlying study of Höll et al., 2016 [7]. Herbert et al. showed more similar results in their study, published in 2015. In that study, the O2 decrease and CO2 increase were comparable for the 4 °C samples, packed under 70% O2/30% CO2 MAP. The chicken stored at 10 °C had already reached its cross-over at day 2, and the O2 decreased to a value of 20%, while the CO2 increased to 60% on day 5 [8]. These results raise the question of whether the overall degree of microbiological spoilage has a lesser impact, and the composition of the microbiome may play a much greater role. To further answer this, the next chapter shows the determined TVCs.

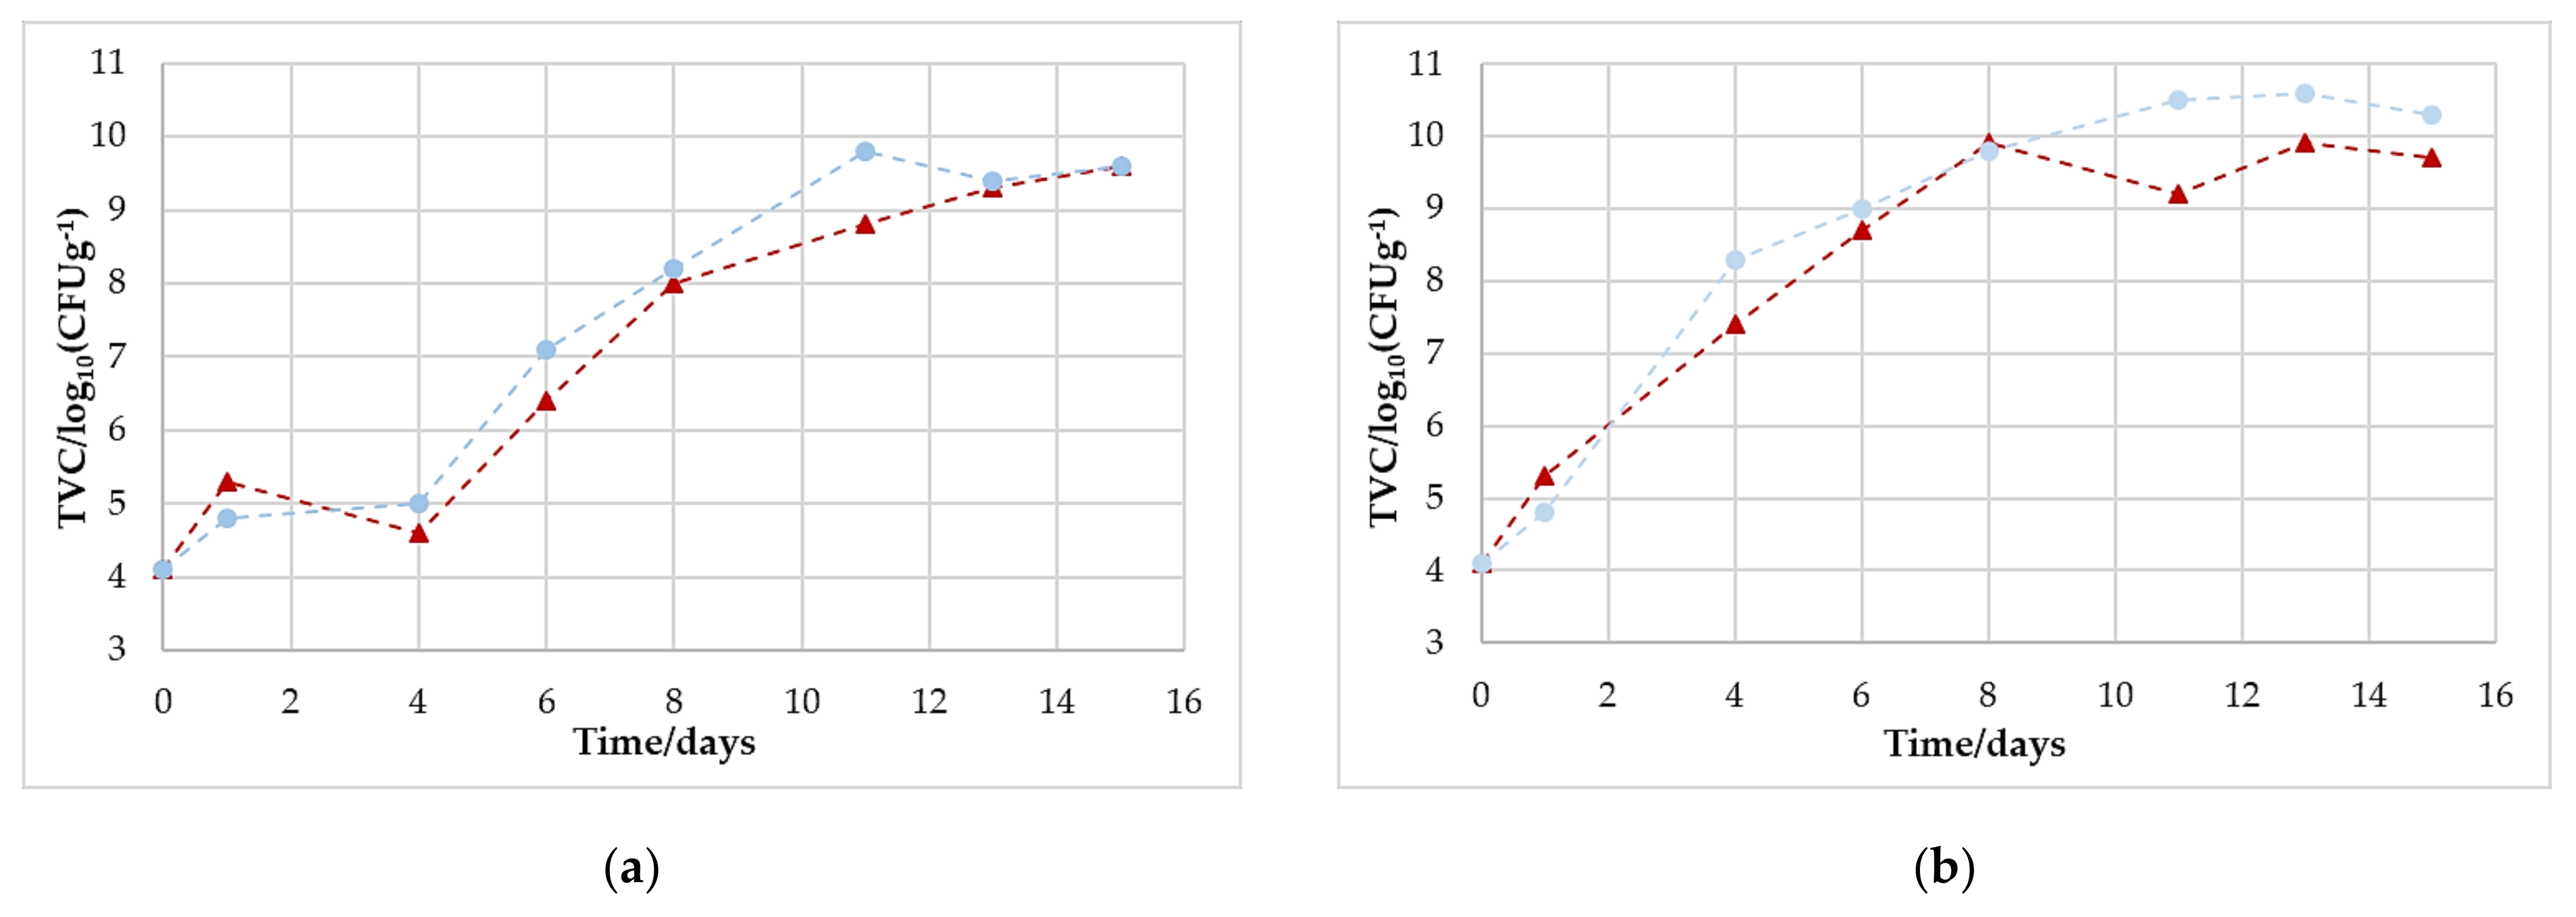
3.5. Microbiological Growth

All samples had a similar starting value of the total viable count of approximately 104 CFU/g (see Table 3 and Figure 4). The samples that were stored at 10 °C showed a faster and more immediate growth and reached the defined critical value of 107 CFU/g [11] after about 3 (80/20) or 4 days (70/30). The samples that were stored at 4 °C grew significantly slower and reached this value after about 6 (80/20) or 7 (70/30) days. At the end of storage, all the samples were well above the critical limit. The highest value of >1010 CFU/g was reached by the sample packed with 80% O2 and 20% CO2, which was stored at 10 °C. However, the samples stored at 4 °C also reached final values of >109 CFU/g.
Comparing these results with the literature, only partially similar results are evident. Höll et al., for example, observed a different growth of the TVC during their 2016 study, although they chose the same storage conditions (80% O2/20% CO2 at 4 and 10 °C) and had similar starting values of TVC. For the samples stored at 4 °C, they reached the critical value for the first time at day 10; for the samples stored at 10 °C, it was reached on day 6 [7]. Rossaint et al. also showed a lower increase in their TVC at 4 °C [20]. However, other studies showed results more similar to ours, reaching critical values between day 4 and 6 [8,21,22] for the samples stored at 4 °C, and on day 2 for the samples stored at 10 °C [8].
These results show very clearly that the type of microorganisms is decisive for O2 consumption and CO2 generation, not necessarily the absolute number of microorganisms. This fact may present difficulties for the prediction of shelf life.

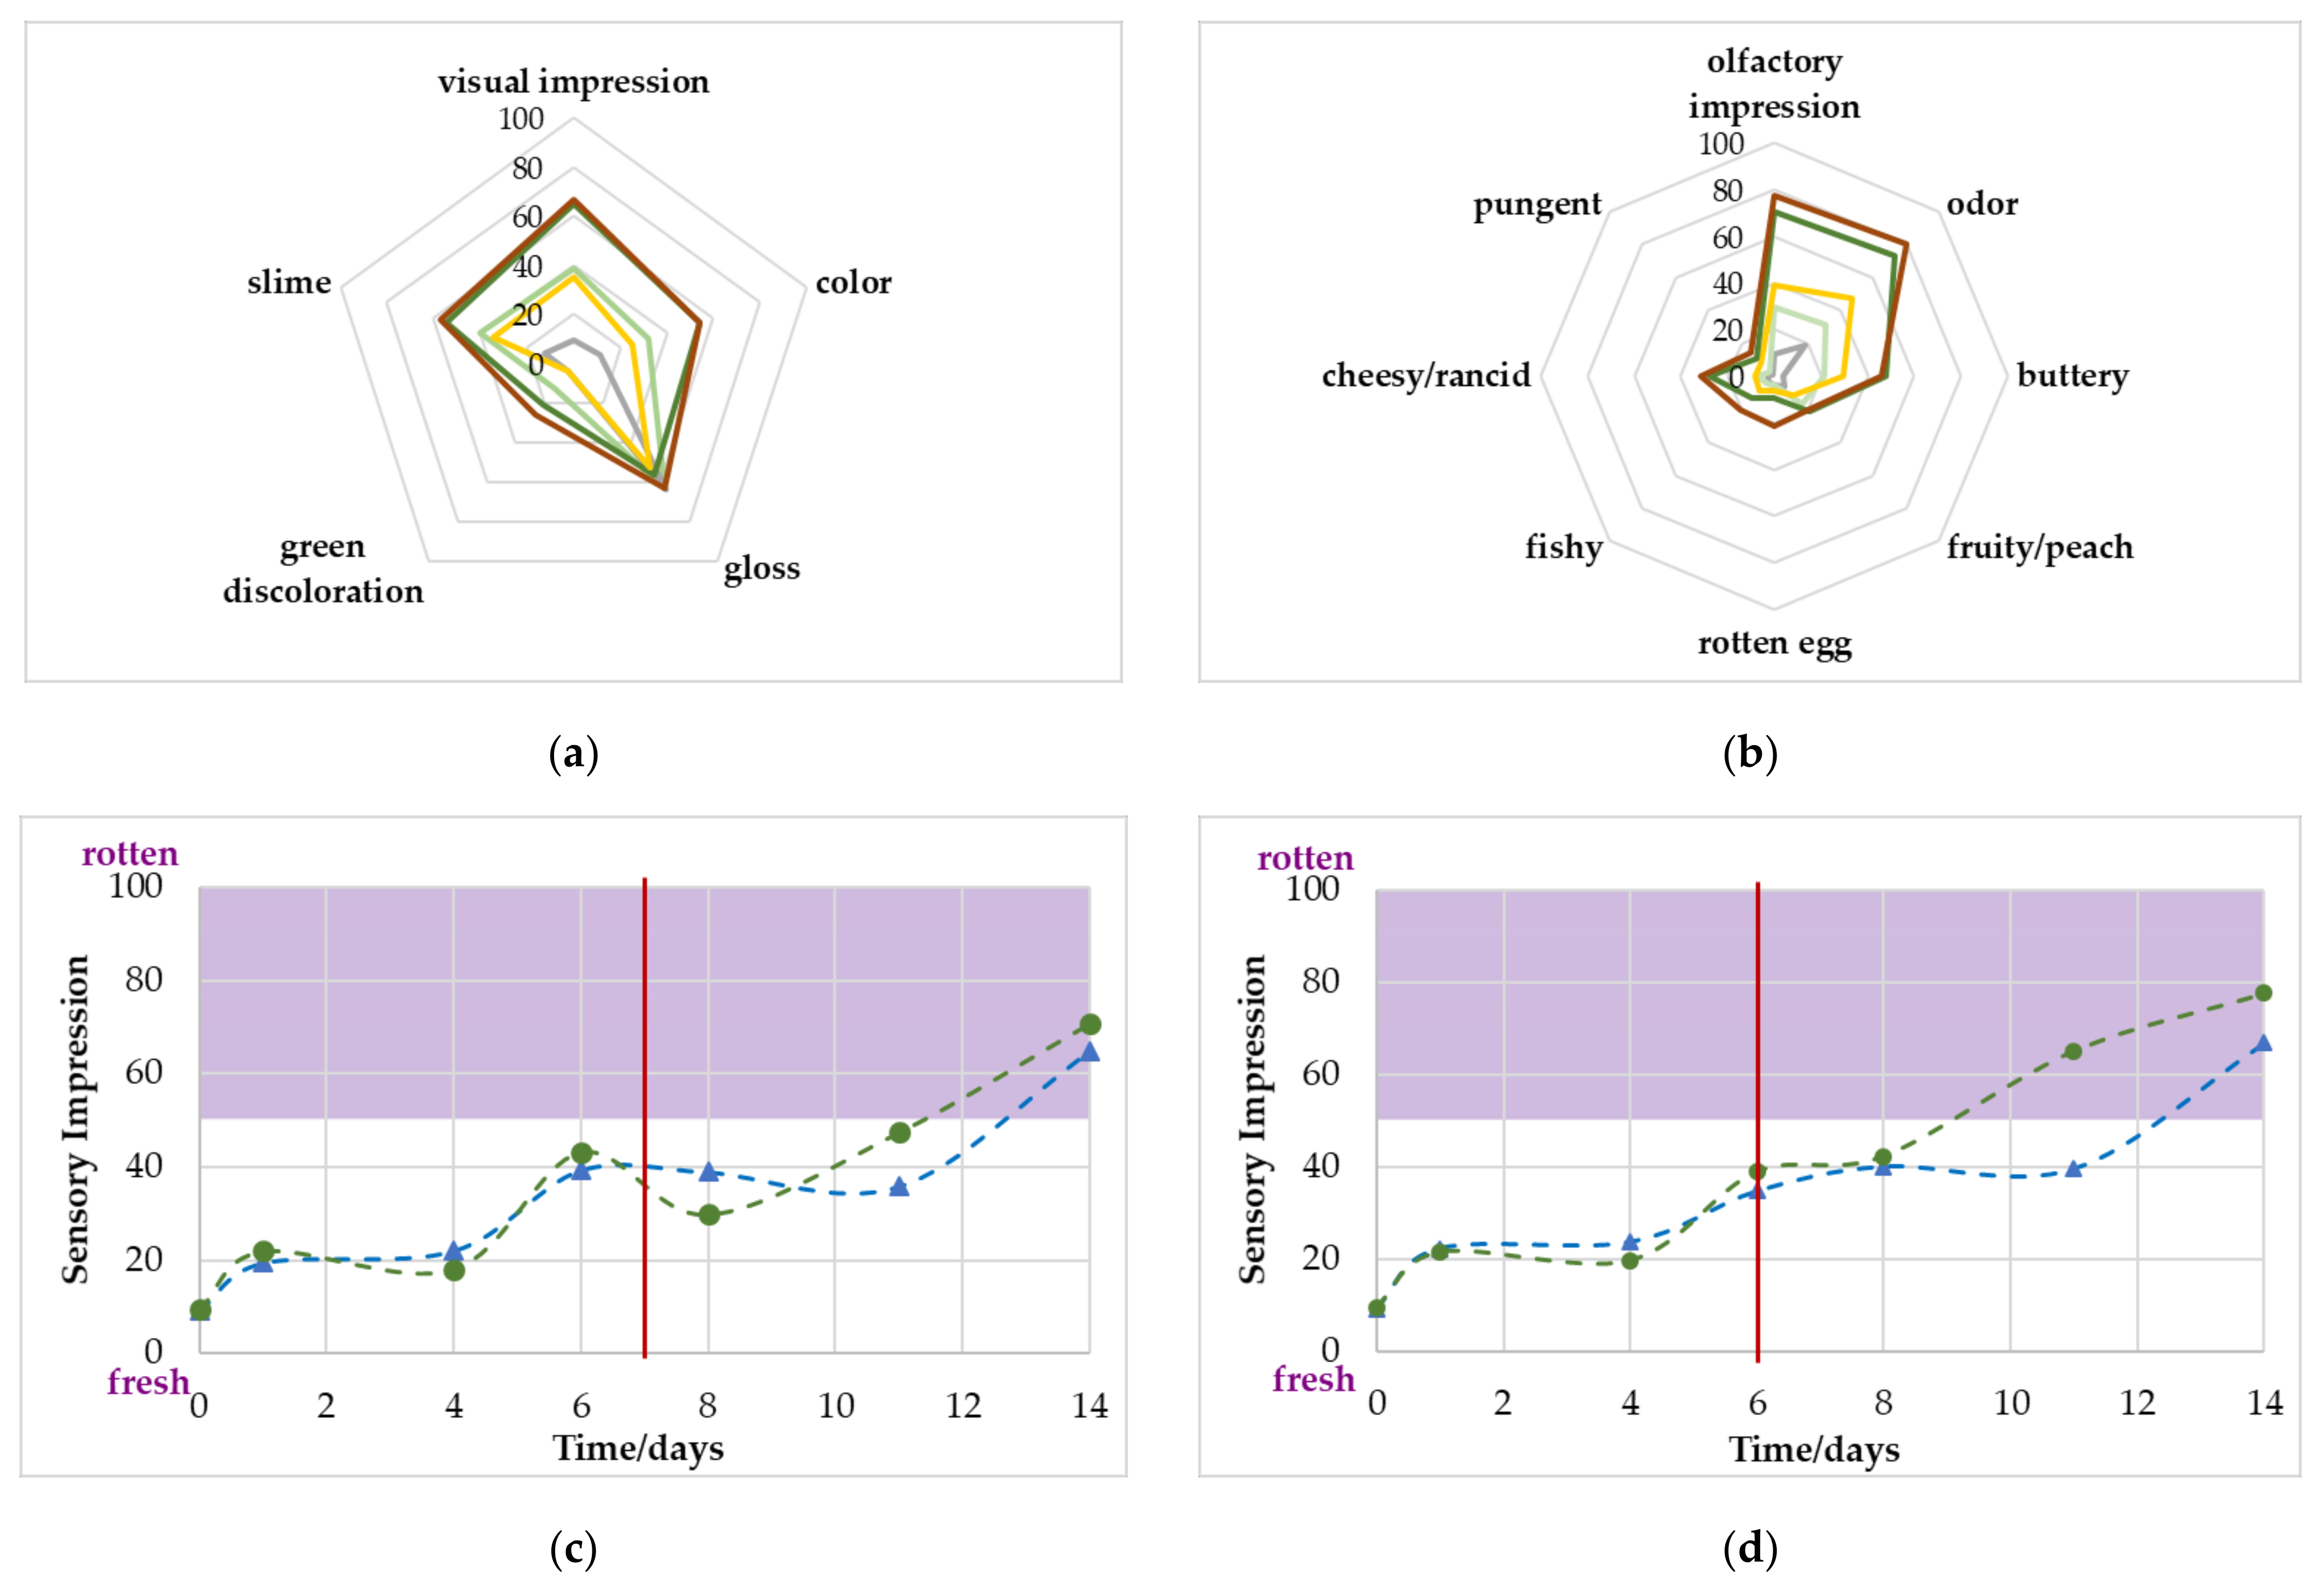
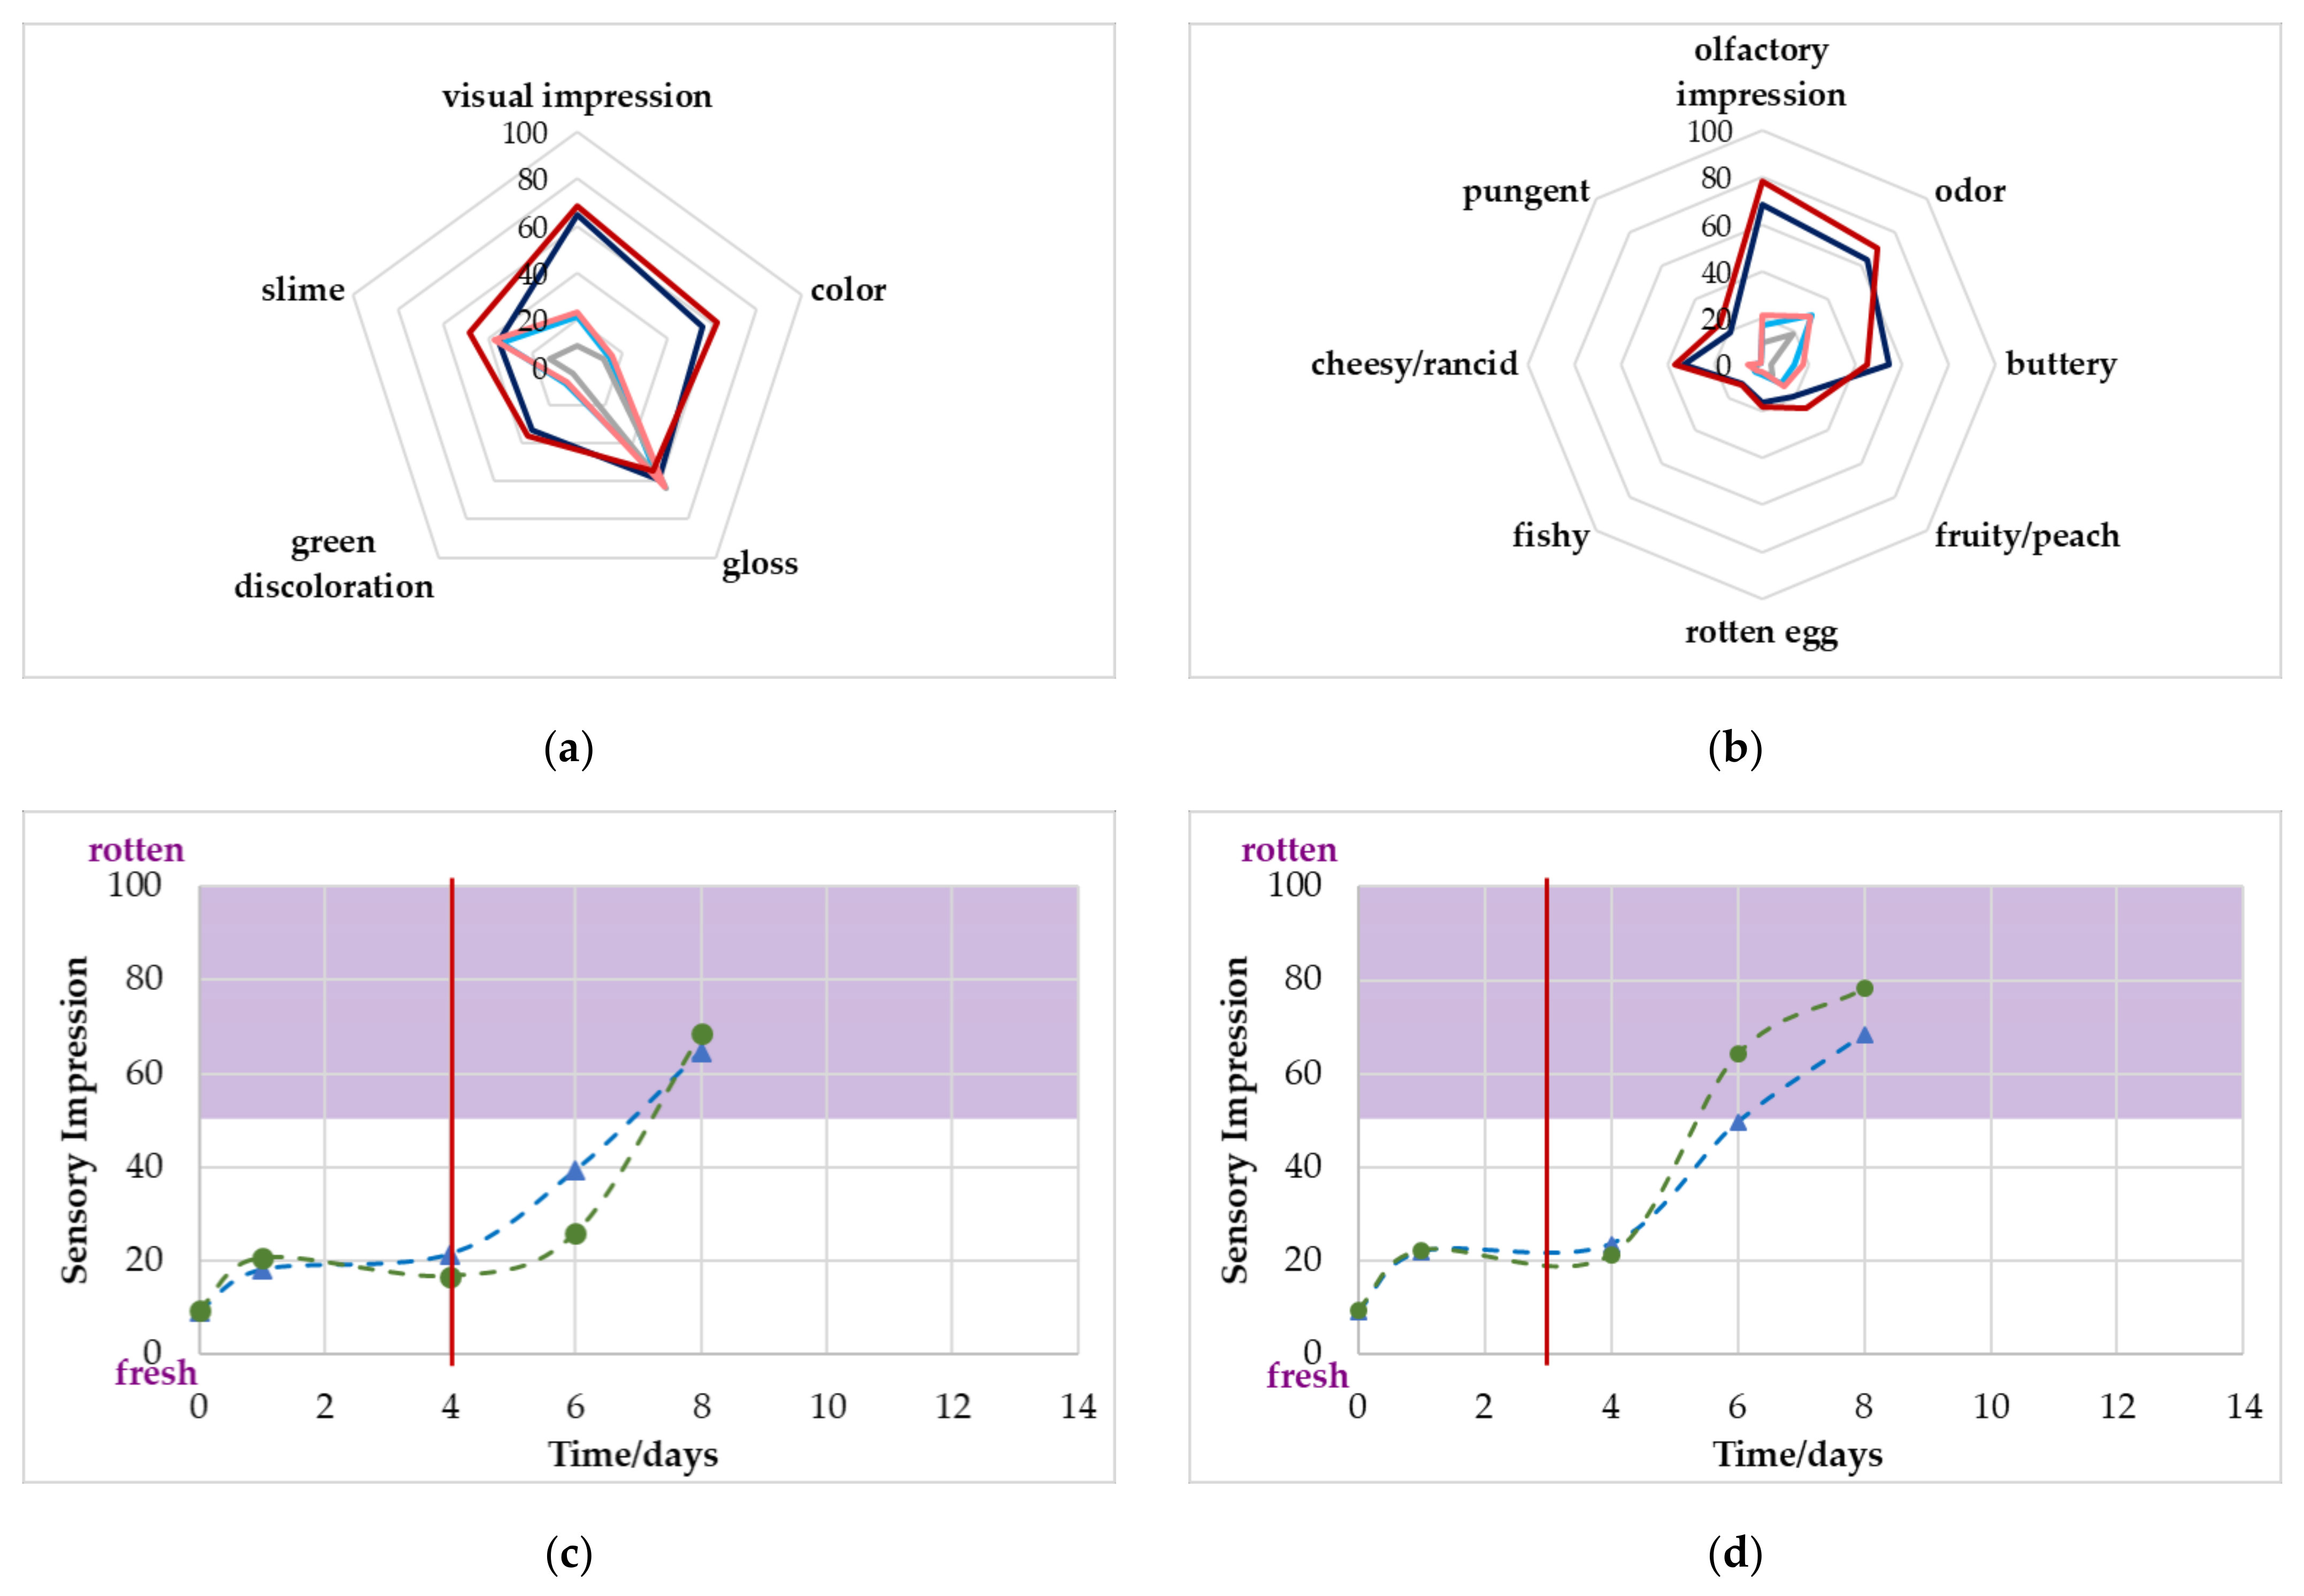
3.6. Sensory Evaluation

The sensory panel was able to determine changes for the visual and olfactory attributes that were defined in Table 2. In Figure 5, the sensory evaluation of the samples stored at 4 °C are shown for both gas concentrations. Aside from the visual descriptor, gloss, all attributes increased during the storage time. For the visual evaluation, the overall impression (fresh/rotten), slime (not present/present) and color (pink/grey) increased the most, all signs of spoilage. For the orthonasal evaluation, the overall impression and the intensity of the odor showed the highest change. The descriptor buttery also noticeably increased. Except for the descriptor gloss, all attributes were still below 50 scores, prior to the end of the shelf life. This becomes even clearer when looking at Figure 5c,d.
For both gas concentrations, the overall olfactory impression reached the limit of 50 scores clearly after the critical value of 107 CFU/g was achieved. More specifically, the sample packed with a MAP of 70% O2/30% CO2 was classified as rotten only on the last day of evaluation; for the sample packed with 80% O2/20% CO2, olfactory spoilage was reached on day 11. Poultry stored at 10 °C (see Figure 6) showed a very similar progression to the 4 °C stored sample but at a much faster rate. However, some attributes were even more evident than those in the samples stored at 4 °C. For the visual evaluation, the samples were classified as more greyish and greenish on day 8. For the olfactory evaluation, the descriptors buttery and cheesy/rancid were slightly higher than the 4 °C samples on day 14. However, again, by reaching the critical microbiological limit value, the impressions were below the 50 scores value and therefore, visual and olfactory were rated as still fresh.
Table 4 compares the evaluation of the sensory attributes more precisely. It is also shown which VOC is dominant or typical for the descriptor on high-oxygen-stored poultry and which microorganisms are often responsible for the emitted substances. With respect to this, it should be said that almost all meat spoilage organisms can form the typical spoilage aroma and it is assumed, that the formation of VOCs can be a result of the interactions between different spoilage bacteria, which makes it difficult to assign specific odors to a single species [24]. However, we focused on the involvement of Brochothrix thermosphacta, lactic acid bacteria (LAB) (e.g., Carnobacterium ssp., Leuconostoc ssp., Lactobacillus ssp.) and Pseudomonas ssp. because, based on previous studies, we assumed that these were the main spoilage bacteria in our chicken samples [7,22,25,26].
All samples showed a noticeable change in meat color, changing from pink to grey. For beef, this effect is related to low oxygen levels, as red oxymyoglobin turns into metmyoglobin, which is known to appear as grey–brown [27]. However, this mechanism cannot be the cause for the color change observed in poultry, as several studies have shown that lower levels of oxygen actually result in a more stable color in fresh poultry [28]. In 2017, Franke et al. also showed that storing poultry in two different oxygen-rich atmospheres resulted in similar greying effects, which is consistent with our experiments [22]. From our point of view, the greying must be an oxidation effect initiated by several microorganisms.
Gloss seems not to be an attribute that can be linked with the poultry quality, as no change was observed by the panel.
The green discoloration was more present for the samples stored at 10 °C at the end of the storage, compared to the samples stored at 4 °C. However, both samples showed a significant increase during this observation. The greening of food of animal origin is known to be induced by several microorganisms [29,30]; however, several studies were able to connect Pseudomonas with this phenomenon as a result of the formation of sulfur compounds [23,31,32,33]. Since the green discoloration was clearly increased in the descriptive analysis (see Section 3.1) and a connection with the rotten egg attribute was also seen here, this assumption is supported once again.
In general, slime formation is not a question of which microorganisms dominate, but how large the microbial count is, as the breakdown of the tissue begins at 108 CFUg−1, in other words, after the sample is microbiologically spoiled [34]. This is also consistent with the panel’s perception at the time that the critical limit was reached for most of the samples, as the slime formation clearly already increased in this regard.
Table 4. Sensory evaluation of the visual and olfactory descriptors under different storage conditions from day 0 to the last day of sensory evaluation (4 °C: Day 14, 10 °C: Day 8). Each + stands for an increase of 10 scores on the line scale, each - stands for a decrease of 10 scores, 0 stands for a change <10 scores. * Responsible VOCs and spoilage bacteria regarding the literature-based assumptions for the tested descriptors, e.g., lactic acid bacteria (LAB).
DescriptorDevelopment by Storage atVOCs *Spoilage Bacteria *
4 °C10 °C
70/3080/2070/3080/20
Color+++++++++++++++++Not knownUnclear
Gloss-00-Not knownNot known
Green
discoloration
++++++++++Sulfur compounds [33]Pseudomonas ssp., LAB [23,30,31,32]
Slime++++++++++++++-Diverse [29,34]
Buttery+++++++++++++++++2,3-butanedione (diacetyl) [35]LAB [25,32]
B. thermosphacta [29]
Fruity+++++Ethyl esters [23,35,36], 1-Hexanol [25]Pseudomonas ssp. [36]
Rotten egg+++++Sulphur compounds [33]Pseudomonas ssp. [23,31]
Fishy+++++Trimethylamine [37]Pseudomonas ssp. [22]
Cheesy/Rancid+++++++++++Isovaleric acid; (2- and 3-methyl) butanoic acid [38,39]LAB [25] B. thermosphacta [32,39]
Pungent++++++Lactic acid [40], acetic acid [41], propanoic acid [25]LAB [25] B. thermosphacta [32,35,41]
The descriptor with the strongest increase—aside from the overall visual and olfactory impression—was buttery, which is linked with the VOC diacetyl (2,3-butanedione). Diacetyl is synthesized by LABs as Carnobacterium divergens or B. thermosphacta [25,42], but it can be also present for Pseudomonas inoculated samples [35]. With the exception of the 70/30 sample stored at 10 °C, the increase in the attribute buttery was rated by the panel as equivalent (++++). Therefore, it is very likely that a mixture of LAB and B. thermosphacta was responsible for this VOC formation.
Typical VOCs, which are perceived as fruity, are ethyl esters—such as ethyl acetate, ethyl butanoate, ethyl 2-hexenoate, etc.—and are very often produced by Pseudomonas [23]. As this aroma was more present for the 10 °C stored samples packed at 80% O2/20% CO2, we assume that these microorganisms were highly present, especially at the end of storage. This also agrees well with the greening previously described. However, the evaluation of the attributes rotten egg and fishy do not totally fit that presumption, as a highest increase was present here for the 4 °C 80/20 samples.
Volatile fatty acids are responsible for a cheesy or rancid odor. These are often formed by B. thermosphacta, but can also be formed during spoilage where high amounts of LABs are present [25,32,39]. This fits very well with our results, as the samples stored at 10 °C, and the 80/20 sample stored at 4 °C showed an increase in these attributes. These samples also showed a decrease in the concentration of O2 in the headspace. This is in line with the respiration abilities of these microorganisms, especially with those of B. thermosphacta and Leuconostoc gelidum [10].
The oxygen consumption by B. thermosphacta and LABs for the samples stored at 10 °C can be further underlined by the higher increase in the attribute pungent for these samples, as the formation of acetic and lactic acid is linked with these meat spoilers [32,35,40,41].

3.7. Correlation of the Results

Table 5 gives an overview of the tested parameters and indicates some observed correlations. “Correlations” are understood as mutual, temporal relationships. The correlations refer to effects (e.g., the change in gas content and microbiological spoilage) that occurred at the same or a similar point in time. Yellow describes a possible association between the cross-over and microbiological spoilage. Orange indicates a correlation between the cross-over and sensory changes. Green indicates a correlation between the change in gas concentrations in the headspace and sensory changes. Grey stands for a correlation of microbiological spoilage and sensory changes.

3.7.1. Correlation of Change in Gas Concentrations with Microbiological Spoilage

As described previously, some studies were carried out that also indicate a correlation between O2 respiration and microbiological spoilage for chicken meat [7,9]. However, this study could not completely confirm these findings. For all samples, no significant change in the gas concentration of the headspace was noted when the limit of 107 CFU/g was reached. Microbial spoilage might be visible with the help of the previously described cross-over point for CO2 detection; however, this is only valid for the samples that were stored at 10 °C. This point was reached either on the day (70/30) or 1 day after (80/20) the critical value of 107 CFU/g was reached. The suggestion that the cross-over could be an indication of premature spoilage, e.g., due to improper storage, is further underlined in the literature, where chicken samples were also stored at 70% O2 and 30% CO2 at 10 and 15 °C, and the cross-over of the reference and the packed sample for O2 and CO2 measured with a destructive device (=empty tray) were consistent in reaching their critical value [8].
A significant change in the headspace gas atmosphere occurred in the samples stored at 10 °C, and also for CO2 detection in the 80/20 4 °C samples; however, the TVC was already ≥109 CFU/g in these cases. For the samples stored at 10 °C, a very strong change occurred for both gases in the gas atmosphere after 5 or 6 days. At the end of the storage period, the gas atmosphere completely changed in the headspace. Nevertheless, the total microbiological growth was not very different compared with the 4 °C samples after 15 days. This is a strong indication that the type of microorganisms, and not necessarily the quantity, was crucial for O2 consumption. This was confirmed in a study wherein beef was inoculated with different meat-spoiling bacteria. Samples contaminated with Brochothrix thermospacta showed significant O2 consumption, while samples contaminated with Carnobacterium divergens and Carnobacterium maltaromaticum showed no consumption at all, even at microbial populations of ≥108/cm2 [10]. This shows that it is mainly the individual microbiota that determines O2 consumption and CO2 production, which makes a shelf-life prediction on this basis difficult. However, the cross-over seems to be a useful tool for identifying inappropriately stored samples, e.g., in case of cold-chain interruption.

3.7.2. Correlation of Change in Gas Concentrations with Sensory Evaluation

There appeared to be a correlation between the gas development and sensory acceptance or descriptors in some cases. For the poultry that was stored at 4 °C at initial gas concentrations of 80% O2 and 20% CO2, a significant change in CO2 was observed on day 12, and the cross-over happened on day 10. This agreed with the overall olfactory impression on day 11 when the panel classified the sample as not acceptable for the first time. The 4 °C 70/30 sample had its cross-over with O2 on day 13 and the first classification as olfactory spoiled on day 14. However, the classification on day 11 was slightly below the 50 scores limit, which is why a prediction of shelf life via a determination of the composition of the headspace gases is rather unlikely. The overall olfactory impression was probably mostly induced by the descriptor cheesy/rancid in this case, as both attributes were rated by the panel with an increase of >20 scores compared to day 0 on the same days for each gas composition (80/20: day 11; 70/30: day 14). For the samples stored at 10 °C, however, a very good fit between the gas concentration and the sensory changes was observed. The 80/20 samples experienced their significant change in CO2 on day 5 and for O2 on day 6. At this time, the overall olfactory impression was scored as spoiled by the panel and the greyish color, and the descriptors buttery and cheesy/rancid increased by >20 scores. For the 70/30 sample, the gas change occurred one day later; for both gases and the sensory changes, the defined levels were reached on day 8, except for slime.

3.7.3. Correlation of Sensory Evaluation with Microbiological Spoilage

Several sensory attributes show a correlation with microbiological spoilage. For the samples stored at 4 °C, the descriptors slime and buttery increased by >20 scores on day 6 (80/20) or day 7 (70/30), while the critical value of 107 CFUg−1 was reached on day 6 for both initial gas compositions. Inappropriately stored samples at 10 °C also showed the slime formation when the critical TVC was reached. This fact demonstrates the need for other detection methods, especially for the samples stored at 4 °C, as the non-destructive gas evaluation seems not to be suitable here. The identification of slime could be possible using other spectroscopic analysis methods such as absorption spectroscopy in the infrared or Raman spectroscopy on the surface of the sample. Another possibility would be the use of hyperspectral imaging. All of these are useable as non-destructive methods for already packed products as well [12].

3.8. Influence of the Microbiome

These results allow some conclusions to be drawn about the type of spoilage microorganisms, with some limitations. Franke et al. (2017) showed that chicken breasts packed at high O2 and stored at 4 °C were mainly populated with B. thermospacta, and developed Carnobacteria sp. and Pseudomonas sp., mainly under MAP with lower CO2 concentrations (≤15%) [22]. Because Pseudomonas sp. are responsible for the formation of VOCs [20], this agreed well with the earlier sensory spoilage of the 80/20 sample, compared with that of the 70/30 sample. However, O2 was hardly respired at this point, which could be because of the small population of B. thermospacta; the lack of heme, compared to beef; or because of the low temperature [9,10]. The influence of storage temperature was visible, especially with respect to sensory evaluation and gas development. In addition, this was also observed by Höll et al. (2016). They had a mixed microbiota at the beginning of storage. Later, at 4 °C, a mixture of B. thermospacta, Pseudomonas sp., and Carnobacteria sp. grew, and at 10 °C, the microbiota mainly consisted of Pseudomonas sp. and Serratia sp. at the end of storage period. After 4–8 days, B. thermospacta was present, which likely favored O2 consumption. Then, VOC-forming Pseudomonas sp. could grow [7]. This effect was likely the same as that observed in this study.
In conclusion, the composition of the microbiome in this work can only be estimated based on the gas change in the headspace and the VOCs produced. So, a reliable statement can be made and the clarification of the species would have to be carried out in the future, e.g., using MALDI-TOF MS.

4. Conclusions

This study showed that the presented non-destructive measurement systems can monitor the O2 and CO2 concentrations in the headspace of a package in real time and showed little to no deviations to the destructive methods in which gas samples were extracted from the headspace. The measurement of the CO2 with the infrared-based systems showed no problems. The observed variations in headspace gas composition could be attributed to individual compositions of the microbiota on the samples. The systems, however, cannot be used to predict the shelf life of high-O2-packed poultry stored under regular conditions and the resulting regular decay mechanisms. For the detection of premature microbial spoilage, however, e.g., due to contamination or an interruption in the cold chain, CO2 detection might be especially useful because a significant change in the CO2 fraction of the headspace could be observed before sensory spoilage, and the defined cross-over was correlated with reaching the critical value of 107 CFU/g. The predominant sensory changes identified by the successfully trained panel were overall olfactory and visual impression, the formation of slime, color change from pink to grey, and the formation of the odors buttery and cheesy/rancid. However, a correlation with the microbiological shelf life (107 CFU/g) was only possible with the formation of slime (4 °C and 10 °C) and buttery (4 °C). As the formation of VOCs also strongly depends on the microbiome, the detection of diacetyl (=buttery) is not a recommendable approach in our view. This is particularly true because the detection of individual substances using simple indicators can be disturbed by the presence of other substances. The optical detection of slime could instead be more promising. In addition, the influence of the heme concentration should be clarified by experiments with beef in the future, as this seems to have a main role in O2 consumption. Another possible application for the technologies might be the detection of leakages in packages or process control for MAP production lines. For this purpose, further investigations should be carried out on the measurement accuracy of the two non-destructive methods.

Author Contributions

Conceptualization, J.D., C.H., C.K. and H.-C.L.; methodology, J.D., C.H., C.K. and H.-C.L.; validation, J.D., C.H. and C.K.; formal analysis, J.D. and H.-C.L.; investigation, J.D., C.H. and C.K.; data curation, J.D., C.H. and C.K.; writing—original draft preparation, J.D.; writing—review and editing, H.-C.L.; visualization, J.D. and C.K.; supervision, H.-C.L.; project administration, J.D. and H.-C.L. All authors have read and agreed to the published version of the manuscript.

Funding

This work was funded by the German Federal Ministry for Economic Affairs and Climate Action via the German Federation of Industrial Research Associations (AiF) and the Industry Association for Food Technology and Packaging (IVLV) (IGF 19993N).

Institutional Review Board Statement

The study was conducted according to the guidelines of the Declaration of Helsinki and the TUM ethic committee.

Informed Consent Statement

Informed consent was obtained from all subjects involved in the study.

Data Availability Statement

Not applicable.

Acknowledgments

We would like to thank the Fraunhofer IVV in Freising and the Chair of Technical Microbiology in Freising—especially Sandra Kolbeck—for their professional support, and their supply of equipment and materials.

Conflicts of Interest

The authors declare no conflict of interest.

References

  1. FAO. Global Food Losses and Food Waste—Extent, Causes and Prevention; Food and Agriculture Organization: Rome, Italy, 2011. [Google Scholar]
  2. Lipinski, B.; Hanson, C.; Lomax, J.; Kitinoja, L.; Waite, R.; Searchinger, T. Reducing Food Loss and Waste; World Resources Institute: Washington, DC, USA, 2013; pp. 1–40. [Google Scholar]
  3. Kerry, J.P.; O’Grady, M.N.; Hogan, S.A. Past, current and potential utilisation of active and intelligent packaging systems for meat and muscle-based products: A review. Meat Sci. 2006, 74, 113–130. [Google Scholar] [CrossRef] [PubMed]
  4. Heiss, R.; Eichner, K. Haltbarmachen von Lebensmitteln: Chemische, Physikalische und Mikrobiologische Grundlagen der Qualitätserhaltung, 4th ed.; Springer: Berlin/Heidelberg, Germany, 2002; ISBN 3-540-43137-3. [Google Scholar]
  5. Buchner, N. Verpackung von Lebensmitteln: Lebensmitteltechnologische, Verpackungstechnische und Mikrobiologische Grundlagen; Springer: Berlin/Heidelberg, Germany, 1999; ISBN 978-3-642-63658-5. [Google Scholar]
  6. Meredith, H.; Valdramidis, V.; Rotabakk, B.T.; Sivertsvik, M.; McDowell, D.; Bolton, D.J. Effect of different modified atmospheric packaging (MAP) gaseous combinations on Campylobacter and the shelf-life of chilled poultry fillets. Food Microbiol. 2014, 44, 196–203. [Google Scholar] [CrossRef] [PubMed]
  7. Höll, L.; Behr, J.; Vogel, R.F. Identification and growth dynamics of meat spoilage microorganisms in modified atmosphere packaged poultry meat by MALDI-TOF MS. Food Microbiol. 2016, 60, 84–91. [Google Scholar] [CrossRef] [PubMed]
  8. Herbert, U.; Albrecht, A.; Kreyenschmidt, J. Definition of predictor variables for MAP poultry filets stored under different temperature conditions. Poult. Sci. 2015, 94, 424–432. [Google Scholar] [CrossRef]
  9. Kolbeck, S.; Reetz, L.; Hilgarth, M.; Vogel, R.F. Quantitative Oxygen Consumption and Respiratory Activity of Meat Spoiling Bacteria Upon High Oxygen Modified Atmosphere. Front. Microbiol. 2019, 10, 2398. [Google Scholar] [CrossRef]
  10. Kolbeck, S.; Hilgarth, M.; Vogel, R.F. Proof of concept: Predicting the onset of meat spoilage by an integrated oxygen sensor spot in MAP packages. Lett. Appl. Microbiol. 2021, 73, 39–45. [Google Scholar] [CrossRef]
  11. Baumgart, J.; Becker, B.; Stephan, R. Mikrobiologische Untersuchung von Lebensmitteln: Ein Leitfaden für das Studium, 6th ed.; Behr’s GmbH: Hamburg, Germany, 2015; ISBN 978-3-95468-333-8. [Google Scholar]
  12. Dold, J.; Langowski, H.-C. Optical measurement systems in the food packaging sector and research for the non-destructive evaluation of product quality. Food Packag. Shelf Life 2022, 31, 100814. [Google Scholar] [CrossRef]
  13. Lakowicz, J.R. Principles of Fluorescence Spectroscopy, 3rd ed.; Springer Science + Business Media, LLC: New York, NY, USA, 2006; ISBN 978-0-387-31278-1. [Google Scholar]
  14. O’Callaghan, K.A.M.; Papkovsky, D.B.; Kerry, J.P. An Assessment of the Influence of the Industry Distribution Chain on the Oxygen Levels in Commercial Modified Atmosphere Packaged Cheddar Cheese Using Non-Destructive Oxygen Sensor Technology. Sensors 2016, 16, 916. [Google Scholar] [CrossRef] [Green Version]
  15. Araque, P.E.; Sansalvador, I.M.P.D.V.; Ruiz, N.L.; Erenas, M.M.; Rodriguez, M.A.C.; Olmos, A.M. Non-Invasive Oxygen Determination in Intelligent Packaging Using a Smartphone. IEEE Sens. J. 2018, 18, 4351–4357. [Google Scholar] [CrossRef]
  16. Schmutzler, M.; Beganovic, A.; Böhler, G.; Huck, C.W. Modern Safety Control for Meat Products: Near Infrared Spectroscopy Utilised for Detection of Contaminations and Adulterations of Premium Veal Products. NIR News 2016, 27, 11–13. [Google Scholar] [CrossRef]
  17. Böcker, J. Spektroskopie: Instrumentelle Analytik mit Atom-und Molekülspektrometrie, 1st ed.; Vogel Communications Group GmbH & Co.KG: Vilzburg, Germany, 1997; ISBN 3-8023-1581-2. [Google Scholar]
  18. Dong, M.; Zheng, C.; Miao, S.; Zhang, Y.; Du, Q.; Wang, Y.; Tittel, F.K. Development and Measurements of a Mid-Infrared Multi-Gas Sensor System for CO, CO₂ and CH₄ Detection. Sensors 2017, 17, 2221. [Google Scholar] [CrossRef] [PubMed] [Green Version]
  19. Novo, J.M.; Iriel, A.; Lagorio, M.G. Rapid spectroscopic method to assess moisture content in free and packaged oregano (Origanum vulgare L.). J. Appl. Res. Med. Aromat. Plants 2016, 3, 211–214. [Google Scholar] [CrossRef]
  20. Rossaint, S.; Klausmann, S.; Kreyenschmidt, J. Effect of high-oxygen and oxygen-free modified atmosphere packaging on the spoilage process of poultry breast fillets. Poult. Sci. 2015, 94, 96–103. [Google Scholar] [CrossRef] [PubMed]
  21. Katiyo, W.; de Kock, H.L.; Coorey, R.; Buys, E.M. Sensory implications of chicken meat spoilage in relation to microbial and physicochemical characteristics during refrigerated storage. LWT 2020, 128, 109468. [Google Scholar] [CrossRef]
  22. Franke, C.; Höll, L.; Langowski, H.-C.; Petermeier, J.; Vogel, R.F. Sensory evaluation of chicken breast packed in two different modified atmospheres. Food Packag. Shelf Life 2017, 13, 66–75. [Google Scholar] [CrossRef]
  23. Casaburi, A.; Piombino, P.; Nychas, G.-J.; Villani, F.; Ercolini, D. Bacterial populations and the volatilome associated to meat spoilage. Food Microbiol. 2015, 45, 83–102. [Google Scholar] [CrossRef]
  24. Gram, L.; Dalgaard, P. Fish spoilage bacteria—Problems and solutions. Curr. Opin. Biotechnol. 2002, 13, 262–266. [Google Scholar] [CrossRef]
  25. Alessandroni, L.; Caprioli, G.; Faiella, F.; Fiorini, D.; Galli, R.; Huang, X.; Marinelli, G.; Nzekoue, F.; Ricciutelli, M.; Scortichini, S.; et al. A shelf-life study for the evaluation of a new biopackaging to preserve the quality of organic chicken meat. Food Chem. 2022, 371, 131134. [Google Scholar] [CrossRef]
  26. Borch, E.; Kant-Muermans, M.-L.; Blixt, Y. Bacterial spoilage of meat products and cured meat. Int. J. Food Microbiol. 1996, 33, 103–120. [Google Scholar] [CrossRef]
  27. Hood, D.E.; Riordan, E.B. Discolouration in pre-packaged beef: Measurement by reflectance spectrophotometry and shopper discrimination. Int. J. Food Sci. Technol. 1973, 8, 333–343. [Google Scholar] [CrossRef]
  28. Sante, V.; Renerre, M.; Lacourt, A. Effect of modified atmosphere packaging on color stability and on microbiology of turkey breast meat. J. Food Qual. 1994, 17, 177–195. [Google Scholar] [CrossRef]
  29. Nychas, G.-J.; Skandamis, P.N.; Tassou, C.C.; Koutsoumanis, K.P. Meat spoilage during distribution. Meat Sci. 2008, 78, 77–89. [Google Scholar] [CrossRef] [PubMed]
  30. Lee, B.H.; Simard, R.E. Evaluation of Methods for Detecting the Production of H2S, Volatile Sulfides, and Greening by Lactobacilli. J. Food Sci. 1984, 49, 981–983. [Google Scholar] [CrossRef]
  31. McMeekin, T.A.; Patterson, J.T. Characterization of hydrogen sulfide-producing bacteria isolated from meat and poultry plants. Appl. Microbiol. 1975, 29, 165–169. [Google Scholar] [CrossRef] [PubMed]
  32. Mead, G. Microbiological Analysis of Red Meat, Poultry and Eggs; Elsevier: Burlington, NJ, USA, 2006; ISBN 978-1-84569-059-5. [Google Scholar]
  33. Kadota, H.; Ishida, Y. Production of volatile sulfur compounds by microorganisms. Annu. Rev. Microbiol. 1972, 26, 127–138. [Google Scholar] [CrossRef]
  34. Charles, N.; Williams, S.K.; Rodrick, G.E. Effects of packaging systems on the natural microflora and acceptability of chicken breast meat. Poult. Sci. 2006, 85, 1798–1801. [Google Scholar] [CrossRef]
  35. Keupp, C.; Höll, L.; Beauchamp, J.; Langowski, H.-C. Online monitoring of volatile freshness indicators from modified atmosphere packaged chicken meat using PTR-MS. In Proceedings of the 27th IAPRI Symposium on Packaging 2015, Valencia, Spain, 8–11 June 2015. [Google Scholar]
  36. Freeman, L.R.; Silverman, G.J.; Angelini, P.; Merritt, C.; Esselen, W.B. Volatiles produced by microorganisms isolated from refrigerated chicken at spoilage. Appl. Environ. Microbiol. 1976, 32, 222–231. [Google Scholar] [CrossRef] [Green Version]
  37. Balamatsia, C.; Patsias, A.; Kontominas, M.; Savvaidis, I. Possible role of volatile amines as quality-indicating metabolites in modified atmosphere-packaged chicken fillets: Correlation with microbiological and sensory attributes. Food Chem. 2007, 104, 1622–1628. [Google Scholar] [CrossRef]
  38. Mikš-Krajnik, M.; Yoon, Y.-J.; Yuk, H.-G. Detection of volatile organic compounds as markers of chicken breast spoilage using HS-SPME-GC/MS-FASST. Food Sci. Biotechnol. 2015, 24, 361–372. [Google Scholar] [CrossRef]
  39. Dainty, R.H.; Hibbard, C.M. Precursors of the major end products of aerobic metabolism of Brochothrix thermosphacta. J. Appl. Bacteriol. 1983, 55, 127–133. [Google Scholar] [CrossRef]
  40. Nassos, P.S.; King, A.D.; Stafford, A.E. Relationship between lactic acid concentration and bacterial spoilage in ground beef. Appl. Environ. Microbiol. 1983, 46, 894–900. [Google Scholar] [CrossRef] [PubMed] [Green Version]
  41. Kakouri, A.; Nychas, G.J. Storage of poultry meat under modified atmospheres or vacuum packs: Possible role of microbial metabolites as indicator of spoilage. J. Appl. Bacteriol. 1994, 76, 163–172. [Google Scholar] [CrossRef] [PubMed]
  42. Höll, L.; Hilgarth, M.; Geissler, A.J.; Behr, J.; Vogel, R.F. Metatranscriptomic analysis of modified atmosphere packaged poultry meat enables prediction of Brochothrix thermosphacta and Carnobacterium divergens in situ metabolism. Arch. Microbiol. 2020, 202, 1945–1955. [Google Scholar] [CrossRef] [PubMed]
Figure 1. Development of the relative volume concentration of O2 (/) and CO2 (/) for a headspace:meat ratio of 6:1 (/) and 3:1 (/) at a storage temperature of 10 °C for 11 days (n = 2 for each measuring point).
Foods 11 00592 g001
Figure 2. Comparison between the destructive (/) and non-destructive (/) measurement devices for the investigation of O2 (/) and CO2 (/) during the storage of poultry over 15 days under different storage conditions: (a) 70% O2/30% CO2 4 °C (b) 70% O2/30% CO2 10 °C (c) 80% O2/20% CO2 4 °C (d) 80% O2/20% CO2 10 °C. Indices indicate a significant difference between the curves measured with the destructive and non-destructive measurement devices: * p < 0.05, ** p < 0.01, and *** p < 0.001.
Foods 11 00592 g002
Figure 3. Development of O2 (/) and CO2 (/) under different storage conditions over 15 days in trays with (/) and without poultry (/): (a) 70% O2/30% CO2 4 °C (b) 70% O2/30% CO2 10 °C (c) 80% O2/20% CO2 4 °C (d) 80% O2/20% CO2 10 °C. Indices indicate a significant difference between the curves with and without poultry: * p < 0.05, ** p < 0.01, and *** p < 0.001. The red circles mark the point when the curve of the respective gas concentration in the filled trays intersects that for the empty trays (cross-over), which indicates a microbiologically induced change in the headspace atmosphere.
Foods 11 00592 g003
Figure 4. Development of the total viable count (TVC) for poultry stored under different storage conditions over 15 days in trays with initial gas concentrations of 70% O2/30% CO2 () and 80% O2/20% CO2 () at (a) 4 °C and (b) 10 °C.
Foods 11 00592 g004
Figure 5. (a,b): Sensory evaluation of the poultry stored at 4 °C by the panel with the chosen descriptors for (a) visual and (b) olfactory attributes on day 0 (grey line), after reaching the critical value of 107 CFU/g (70% O2/30% CO2: light green; 80% O2/20% CO2: yellow) and on day 14 (70% O2/30% CO2: dark green; 80% O2/20% CO2: brown). (c,d): Change in the overall visual () and olfactory () impression during the storage time: (c) 70% O2/30% CO2 4 °C and (d) 80% O2/20% CO2 4 °C. The red line marks the point when the microbiological limit value was achieved. The purple area indicates the previously defined sensory limit of 50 scores.
Foods 11 00592 g005
Figure 6. (a,b): Sensory evaluation of poultry stored at 10 °C by the panel with the chosen descriptors for (a) visual and (b) olfactory attributes on day 0 (grey line), after reaching the critical value of 107 CFU/g (70% O2/30% CO2: light blue; 80% O2/20% CO2: pink) and on day 8 (70% O2/30% CO2: dark blue; 80% O2/20% CO2: red). (c,d): Change in the overall visual () and olfactory () impression during the storage time: (c) 70% O2/30% CO2 10 °C and (d) 80% O2/20% CO2 10 °C. The red line marks the point when the microbiological limit value was achieved. The purple area indicates the previously defined sensory limit of 50 scores.
Foods 11 00592 g006
Table 1. Results of the descriptive analysis for the visual and olfactory attributes named by the panel for a fresh and forced-aged (4 days at 23 °C) poultry sample.
Visual ImpressionOlfactory Impression
Fresh PoultryForced-Aged PoultryFresh PoultryForced-Aged Poultry
Fresh11Grey11Fresh10Rotten egg/sulfurous15
Pink10Green8Neutral8Rotten9
Salmon-colored3Slime6Poultry typical2Rancid7
Solid shape2Glossy6Weak1Fishy6
Skin-colored1Weeping/wet5 Cheesy5
Appealing1Rotten3 Sweet3
Brown2 Fruity2
Yellowish1 Acidic2
Mushy1 Ammonia1
Flowery1
Lemony1
Drain-like1
Table 2. Chosen descriptors for the sensory evaluation, based on the descriptive analysis of the panel training. The references and scale for the olfactory impression were also used for the second part of the training—the odor identification test.
DescriptorScaleReference
Visual Impression
Overall impression0 (fresh)–100 (rotten)Images fresh and forced-aged sample
Color0 (pink)–100 (grey)Color chart
Green discoloration0 (none)–100 (clear)Color chart
Slime0 (not present)–100 (present)-
Gloss0 (weak)–100 (strong)Images fresh and forced-aged sample
Olfactory Impression
Overall impression0 (fresh)–100 (rotten)-
Odor0 (neutral)–100 (intense)Water
Buttery0 (not perceptible)–100 (clearly perceptible)Diacetyl
Fruity/peach0 (not perceptible)–100 (clearly perceptible)Gamma-decalactone
Rotten egg0 (not perceptible)–100 (clearly perceptible)Sodium sulfide
Fishy0 (not perceptible)–100 (clearly perceptible)Cis-4-heptenal
Cheesy/rancid0 (not perceptible)–100 (clearly perceptible)Butanoic acid
Pungent0 (not perceptible)–100 (clearly perceptible)Acetic acid
Table 3. Total viable count (TVC) for the poultry on days 0 and 15 for each storage condition (n = 4) and the day the critical limit of 107 CFUg−1 was reached (end of shelf life).
Day 0Day 15Shelf Life Expired
80/20 4 °C1.36 × 104 CFUg−14.00 × 10⁹ CFUg−1Day 6
70/30 4 °C1.27 × 104 CFUg−14.29 × 10⁹ CFUg−1Day 7
80/20 10 °C1.36 × 104 CFUg−12.19 × 10¹⁰ CFUg−1Day 3
70/30 10 °C1.27 × 104 CFUg−14.47 × 10⁹ CFUg−1Day 4
Table 5. Observed correlations between the tested parameters. p ≤ 0.05 represents the first day where the difference between empty and filled trays was significant with p ≤ 0.05, after the cross-over was reached. “Microbiologically spoiled” indicates a TVC of 107 CFUg−1 and “sensory changes” shows the panel classification of the sensory panel with: >50 scores for the overall olfactory impression (“olfactory spoiled”) and an increase of >20 scores in the descriptors slime, color, buttery and cheesy. A description of the color marking of the correlations can be found in the previous text.
Foods 11 00592 i001
Publisher’s Note: MDPI stays neutral with regard to jurisdictional claims in published maps and institutional affiliations.

