Article

Saponification Value of Fats and Oils as Determined from 1H-NMR Data: The Case of Dairy Fats

1
Department of Milk and Dairy Products, Technological Faculty, University of Food Technologies, 26 “Maritsa” Blvd., 4002 Plovdiv, Bulgaria
2
Department of Organic Chemistry, Biochemistry and Catalysis, Research Centre of Applied Organic Chemistry, Faculty of Chemistry, University of Bucharest, 90-92 Panduri Street, 050663 Bucharest, Romania
3
“C.D. Nenitescu” Centre of Organic Chemistry of the Romanian Academy, 202B Spl. Independentei, 060023 Bucharest, Romania
4
“C.D. Nenitescu” Organic Chemistry Department, Faculty of Chemical Engineering and Biotechnologies, University POLITEHNICA of Bucharest, 1-7 Polizu Street, 011061 Bucharest, Romania
5
Advanced Polymer Materials Group, University POLITEHNICA of Bucharest, 1-7 Gh. Polizu Street, 011061 Bucharest, Romania
6
Department of Oenology and Chemistry, Food Technology, Faculty of Food Technology, Technical University of Moldova, 9/9 Studentilor Street, MD-2045 Chisinau, Moldova
7
“Petru Poni” Institute of Macromolecular Chemistry of the Romanian Academy, Aleea Grigore Ghica Voda 41A, 700487 Iasi, Romania
*
Author to whom correspondence should be addressed.
Submission received: 14 April 2022 / Revised: 12 May 2022 / Accepted: 13 May 2022 / Published: 18 May 2022

Abstract

:
The saponification value of fats and oils is one of the most common quality indices, reflecting the mean molecular weight of the constituting triacylglycerols. Proton nuclear magnetic resonance (1H-NMR) spectra of fats and oils display specific resonances for the protons from the structural patterns of the triacylglycerols (i.e., the glycerol backbone), methylene (-CH2-) groups, double bonds (-CH=CH-) and the terminal methyl (-CH3) group from the three fatty acyl chains. Consequently, chemometric equations based on the integral values of the 1H-NMR resonances allow for the calculation of the mean molecular weight of triacylglycerol species, leading to the determination of the number of moles of triacylglycerol species per 1 g of fat and eventually to the calculation of the saponification value (SV), expressed as mg KOH/g of fat. The algorithm was verified on a series of binary mixtures of tributyrin (TB) and vegetable oils (i.e., soybean and rapeseed oils) in various ratios, ensuring a wide range of SV. Compared to the conventional technique for SV determination (ISO 3657:2013) based on titration, the obtained 1H-NMR-based saponification values differed by a mean percent deviation of 3%, suggesting the new method is a convenient and rapid alternate approach. Moreover, compared to other reported methods of determining the SV from spectroscopic data, this method is not based on regression equations and, consequently, does not require calibration from a database, as the SV is computed directly and independently from the 1H-NMR spectrum of a given oil/fat sample.

1. Introduction

One of the most common oil quality indices is the saponification value (SV); it is defined as the amount of alkali (expressed as mg KOH/g sample) required to saponify a defined amount of sample. It is conventionally determined through saponification of a known amount of oil/fat with excess KOH solution, followed by back titration of the excess base with acid solution in the presence of phenolphthalein as an indicator. The amount of base needed for saponification of the fatty acyl chains is then indirectly determined from the excess base that remains unreacted. Since the amount (moles) of base reacted is stoichiometrically equal to the amount (moles) of fatty acyl chains contained in 1 g of oil/fat, SV is then dependent on the length of the fatty acyl chains from triacylglycerols. Therefore, a small saponification value indicates long chain fatty acids on the glycerol backbone in a sample; on the contrary, a high SV indicates triacylglycerols with shorter fatty acyl chains. Consequently, SV becomes an easy approach to assess fatty acids’ chain length of specific fats/oils.
For example, most of the common oils/fats of vegetable or animal origin (sunflower, soybean, rapeseed, pork lard, beef tallow, chicken fat, etc.) contain almost only long chain fatty acids (C18 and C16), having similar SV values (ranging from 168–196 mg KOH/g oil) [1]. Some vegetable oils, such as the coconut and palm kernel oils, contain large amounts of lauric (C12:0) and myristic (C14:0) acids; therefore, their saponification values are significantly higher (235–260 mg KOH/g oil) [2,3,4,5]. Milk fat differs substantially from other fats and oils in terms of the fatty acid profile (FAP), including relevant amounts of short chain (C4–C6) and medium chain (C8–C12) fatty acids, which is subsequently reflected in its high SV (213–227 mg KOH/g fat) [6,7]. Consequently, SV may be helpful in the detection of the adulteration of dairy products with cheaper fats and oils, because the addition of an oil/fat rich in C18 to a dairy product will result in a decrease in the SV.
Although easy and accurate, the reference method of SV determination requires specific glassware and harmful chemicals and is time consuming (according to the protocol, the saponification step takes one hour to complete, because it is critical that the saponification be complete prior to the final titration). In addition, several factors can cause errors in the titration step including misjudging the color of the indicator near the end point, misreading volumes or faulty technique. Therefore, a new, rapid and reliable method would be preferred.
In this respect, spectroscopic methods coupled with multivariate data analysis have attracted attention, being considerably faster and more practical from a procedural viewpoint. For example, SV has been determined through Fourier transform infrared spectroscopy (FTIR) coupled with multivariate analysis [8] with good accuracy, compared to the standard method; however, the main drawback of the methods based on spectroscopic data is that they require the existence of a large spectral base for the model calibration.
1H-NMR spectroscopy is a fast (the recording of a 1H-NMR spectrum takes approximately 2 min) and non-destructive technique that has widely been applied in the analysis of edible oils. 1H-NMR spectra of fats and oils display signals assigned to both the unsaturated moiety and to various methylene groups of the fatty acyl chains. These signals may be used to calculate the average fatty acyl chain length of fat samples. The 1H-NMR technique allows for full process automation, from the recording (due to the autosamplers) to data processing. Small amounts of samples are necessary, which—if needed—can further be recovered simply through solvent evaporation, after the spectra are recorded. Very importantly, the 1H-NMR technique is also reliable, and several papers report the fatty acid profile of fats and oils computed from 1H-NMR data in good agreement with chromatographic data [9,10,11,12,13]. Skiera et al. briefly reported a rapid method for the determination of the SV from NMR data based on the integral of the CH2 protons adjacent to the ester groups (δH 2.2–2.4 ppm) and on the integral of the 1,2,4,5-tetrachloro-3-nitrobenzene (TCNB) signal at δH 7.7 ppm, used as an internal standard for quantitative NMR experiments. Five samples (with a single measurement per sample) were tested with the new method; the NMR results were in agreement with the values obtained through the ISO method, consequently pointing at the suitability of the NMR spectroscopy for the determination of the quality indices of fats and oils [14].
Based on our previous expertise on NMR chemometrics to edible oils [13], the present work reports a general algorithm for the calculation of the SV of fats and oils from the 1H-NMR data. The working model consists of a series of binary mixtures of tributyrin (TB) and vegetable oils in various ratios to obtain a wide range of SV. In addition, to ensure an even more variate composition also regarding the unsaturation, soybean and rapeseed oils—SO and RO, respectively—were used to prepare the model samples. The average length of the fatty acyl chains can be computed through chemometric equations from 1H-NMR data, leading to the calculation of the average molecular weight of each sample and eventually to the SV. The new method was evaluated in comparison with the conventional method based on titration and was further applied to a series of edible fats and oils including butter and cheese extracted fats. Compared to other reported methods of determining the SV from spectroscopic data, the proposed method is not based on regression equations and, consequently, does not require calibration from a database. SV may be computed directly and independently from the 1H-NMR spectrum of a given oil/fat sample.

2. Materials and Methods

2.1. Reagents

CH2Cl2 (HPLC purity) and anhydrous MgSO4 were from Sigma–Aldrich, as well as tributyrin (97%). The CDCl3 (isotopic purity 99.8%D) was also from Sigma–Aldrich.

2.2. Binary Oil–Tributyrin Mixtures

A series of binary mixtures of tributyrin (TB) and vegetable oils (RO and SO) in various ratios was prepared to obtain a wide range of SVs. Owing to their different fatty acid profiles, SO and RO were chosen as components for binary mixtures to obtain an even more variate composition also with respect to the unsaturation, thus leading to more reliable results. The specific composition of the RO-TB and SO-TB series is given in the Supplementary Table S1.

2.3. Butter and Cheese Samples

Butter (n = 4) and cheese (n = 9) samples of bovine origin were obtained from Romanian, Bulgarian and Moldavian dairy companies. Butter fat (BF) was extracted from butter samples with CH2Cl2, dried on anhydrous MgSO4, followed by evaporation of the solvent. Cheese fat was extracted according to ISO 1735|IDF 5:2004 protocol [15].

2.4. Oil and Fat Samples

Soybean, rapeseed and sunflower seeds were obtained from the National Agricultural Research and Development Institute of Fundulea (NARDI Fundulea), Romania. The oil was extracted from seeds according to the standard Soxhlet protocol [16]. Beef and sheep tallow were extracted with CH2Cl2 from subcutaneous adipose tissue, dried on anhydrous MgSO4, followed by evaporation of the solvent. Coconut oil was purchased from Trio Verde S.R.L., Romania (distributor), and the palm stearin and palm kernel oil were from Scintilla Silk, Romania (distributor).

2.5. Saponification Value

The saponification value was determined according to the ISO 3657:2013 standard procedure [17].

2.6. 1H-NMR Spectra

1H-NMR experiments were recorded in a field of 6.9 T using a Bruker Fourier spectrometer (Bruker Biospin, Ettlingen) operating at an 1H Larmor frequency of 300.18 MHz. The 1H-NMR experiments were using the standard zg30 pulse sequence and had the following parameters: 30° pulse, 5.37 s acquisition time, 6.1 kHz spectral window, 16 scans, 65K data points, 1 s delay time; all spectra were recorded at 25 °C. Fat samples (200 mg) were dissolved in 0.6 mL CDCl3 and transferred to 0.5 mm NMR tubes of the type Norell NOR508UP7-5EA (Sigma–Aldrich, Saint Louis, MO, USA). MestReNova 6.0.2-5475 software (Mestrelab Research, Santiago de Compostela, Spain) was used to process the spectra.
To eliminate operator errors, fixed integration limits were used to obtain the integration values (Supplementary Materials Table S1). In addition, for each sample the F resonance (given by the two protons adjacent to the ester group) was considered as a reference and, therefore, calibrated to 2.000; consequently, the rest of the integrals were automatically reported to the reference. According to the general rule for signals integration (i.e., from baseline to baseline), partially overlapping signals were integrated altogether (i.e., A + B and I + J, respectively). The NMR tubes were in-house quality checked as we previously reported [18].

2.7. Statistics

The experiments were run in triplicate (NMR) and in duplicate (ISO 3657:2013). The results are expressed as the mean values ± standard deviation (sd). Tuckey’s test was applied for the significantly different means (p < 0.05).

3. Results and Discussions

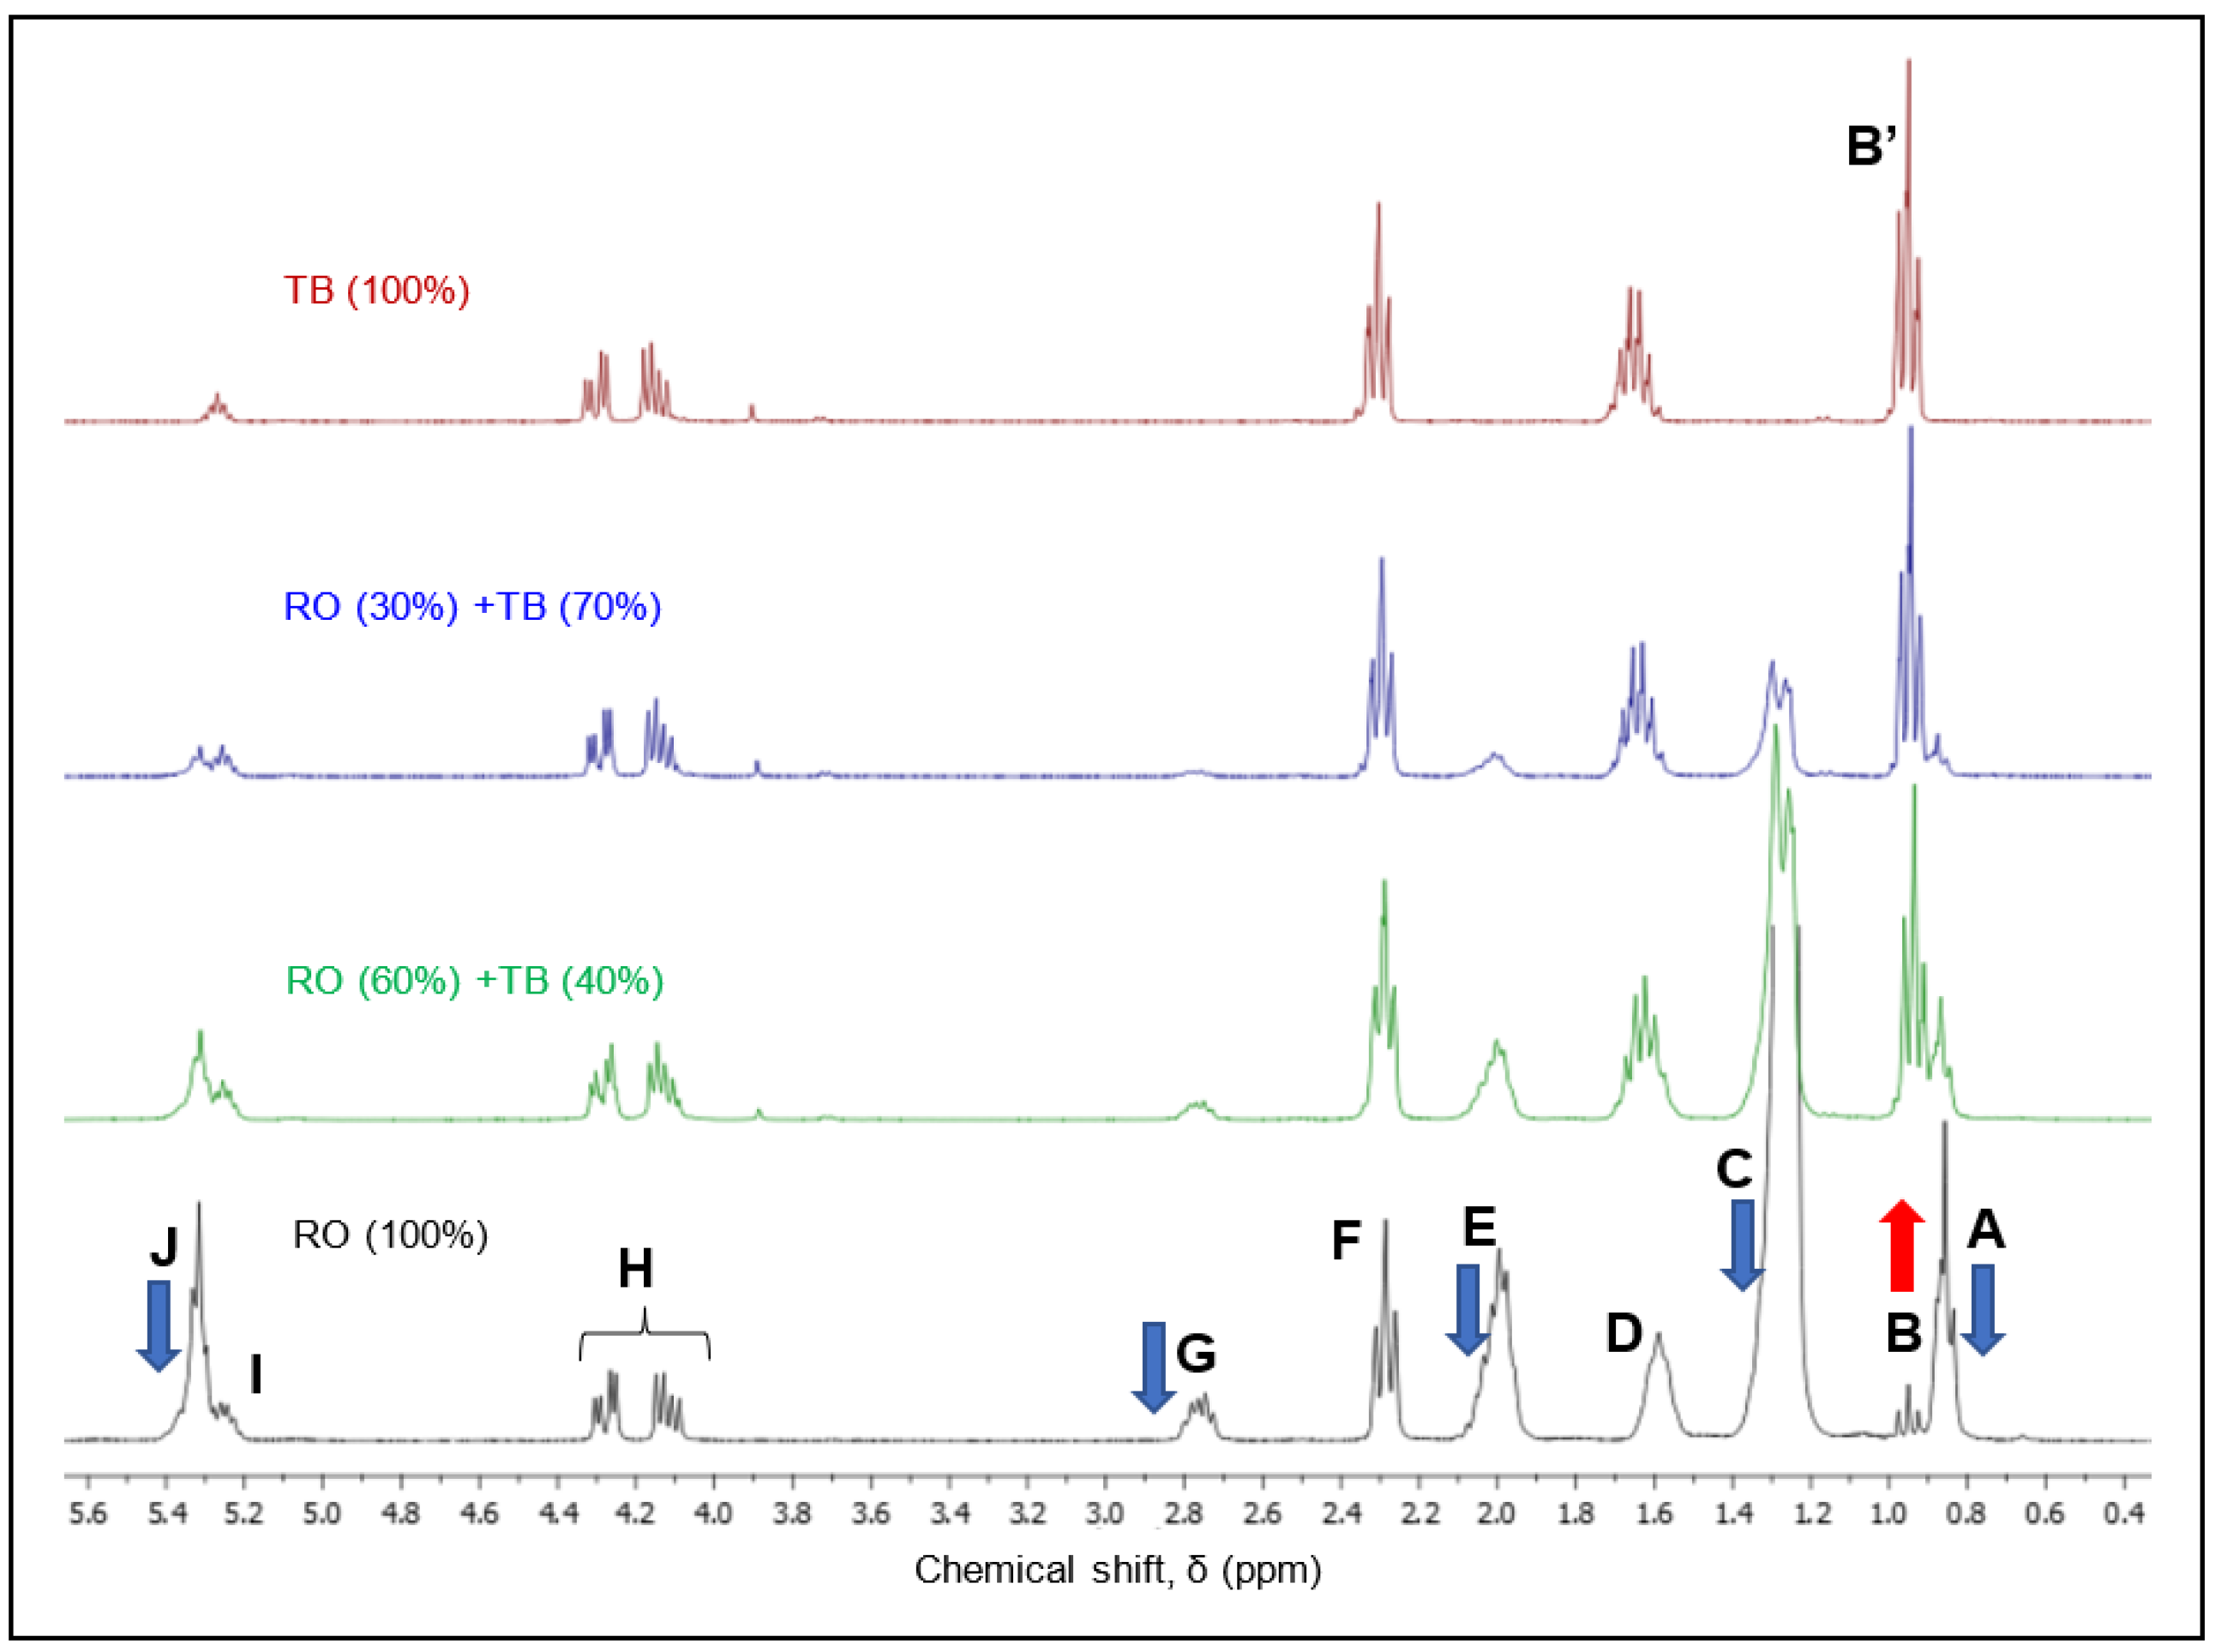
3.1. 1H-NMR Spectral Characterization of Fats and Oils

A typical 1H-NMR spectrum of an oil is illustrated for a rapeseed oil (RO) in Figure 1. The corresponding peak assignment is explained in Table 1. Figure 1 also shows a comparison of the 1H-NMR spectra of tributyrin (TB) and two rapeseed oil–tributyrin binary mixture: RO (30%) + TB (70%) and RO (60%) + TB (40%).
As reflected from Figure 1, certain signals (i.e., A, C, E and J) cannot be found in the spectrum of tributyrin, because butyric acid is a short chain saturated fatty acid, lacking allylic, bis-allylic and unsaturated protons. The butyric moiety displays the triplet B’ characteristic of the terminal methyl group in the structure of fatty acids, the signal D of the protons in position β relative to the ester group, the triplet F generated by the methylene groups adjacent to the ester group and the signals in the specific area of the glycerol backbone (H and I). We have previously shown the assignment of NMR signals in methyl esters of fatty acids as standards for vegetable oil characterization [20]. We have also shown [19] that the resonance characteristic to the terminal methyl group of the fatty acyl chains appears shifted downfield (0.96 ppm) only in the case of linolenic and butyric acyl moieties (B and B’, respectively), compared to the rest of the fatty acyl chains (triplet A, 0.85 ppm). It is therefore evident that as the amount of TB added to the vegetable oil increases, all the resonances related to unsaturated specific groups (J) and those in the vicinity of allylic and bis-allylic groups, (E and G) will decrease. The amplitude of signal C also decreases with the addition of TB, as this resonance is dependent on the length of the fatty acyl chains, being absent for TB.
The only signal that increases in intensity is the triplet B from 0.96 ppm, characteristic for the terminal methyl group in butyric acid or linolenic acid. In rapeseed oil, the 0.96 ppm resonance is due to the linolenic acyl moiety (signal B); as the percentage of added TB increases, this resonance also increases in intensity due to the overlapping signal B’. As expected, the unspecific signals present in all fats and oils, regardless of their specific fatty acid profile (such as H and I from the glycerol moiety, as well as D and F adjacent to the ester group), did not show modifications.

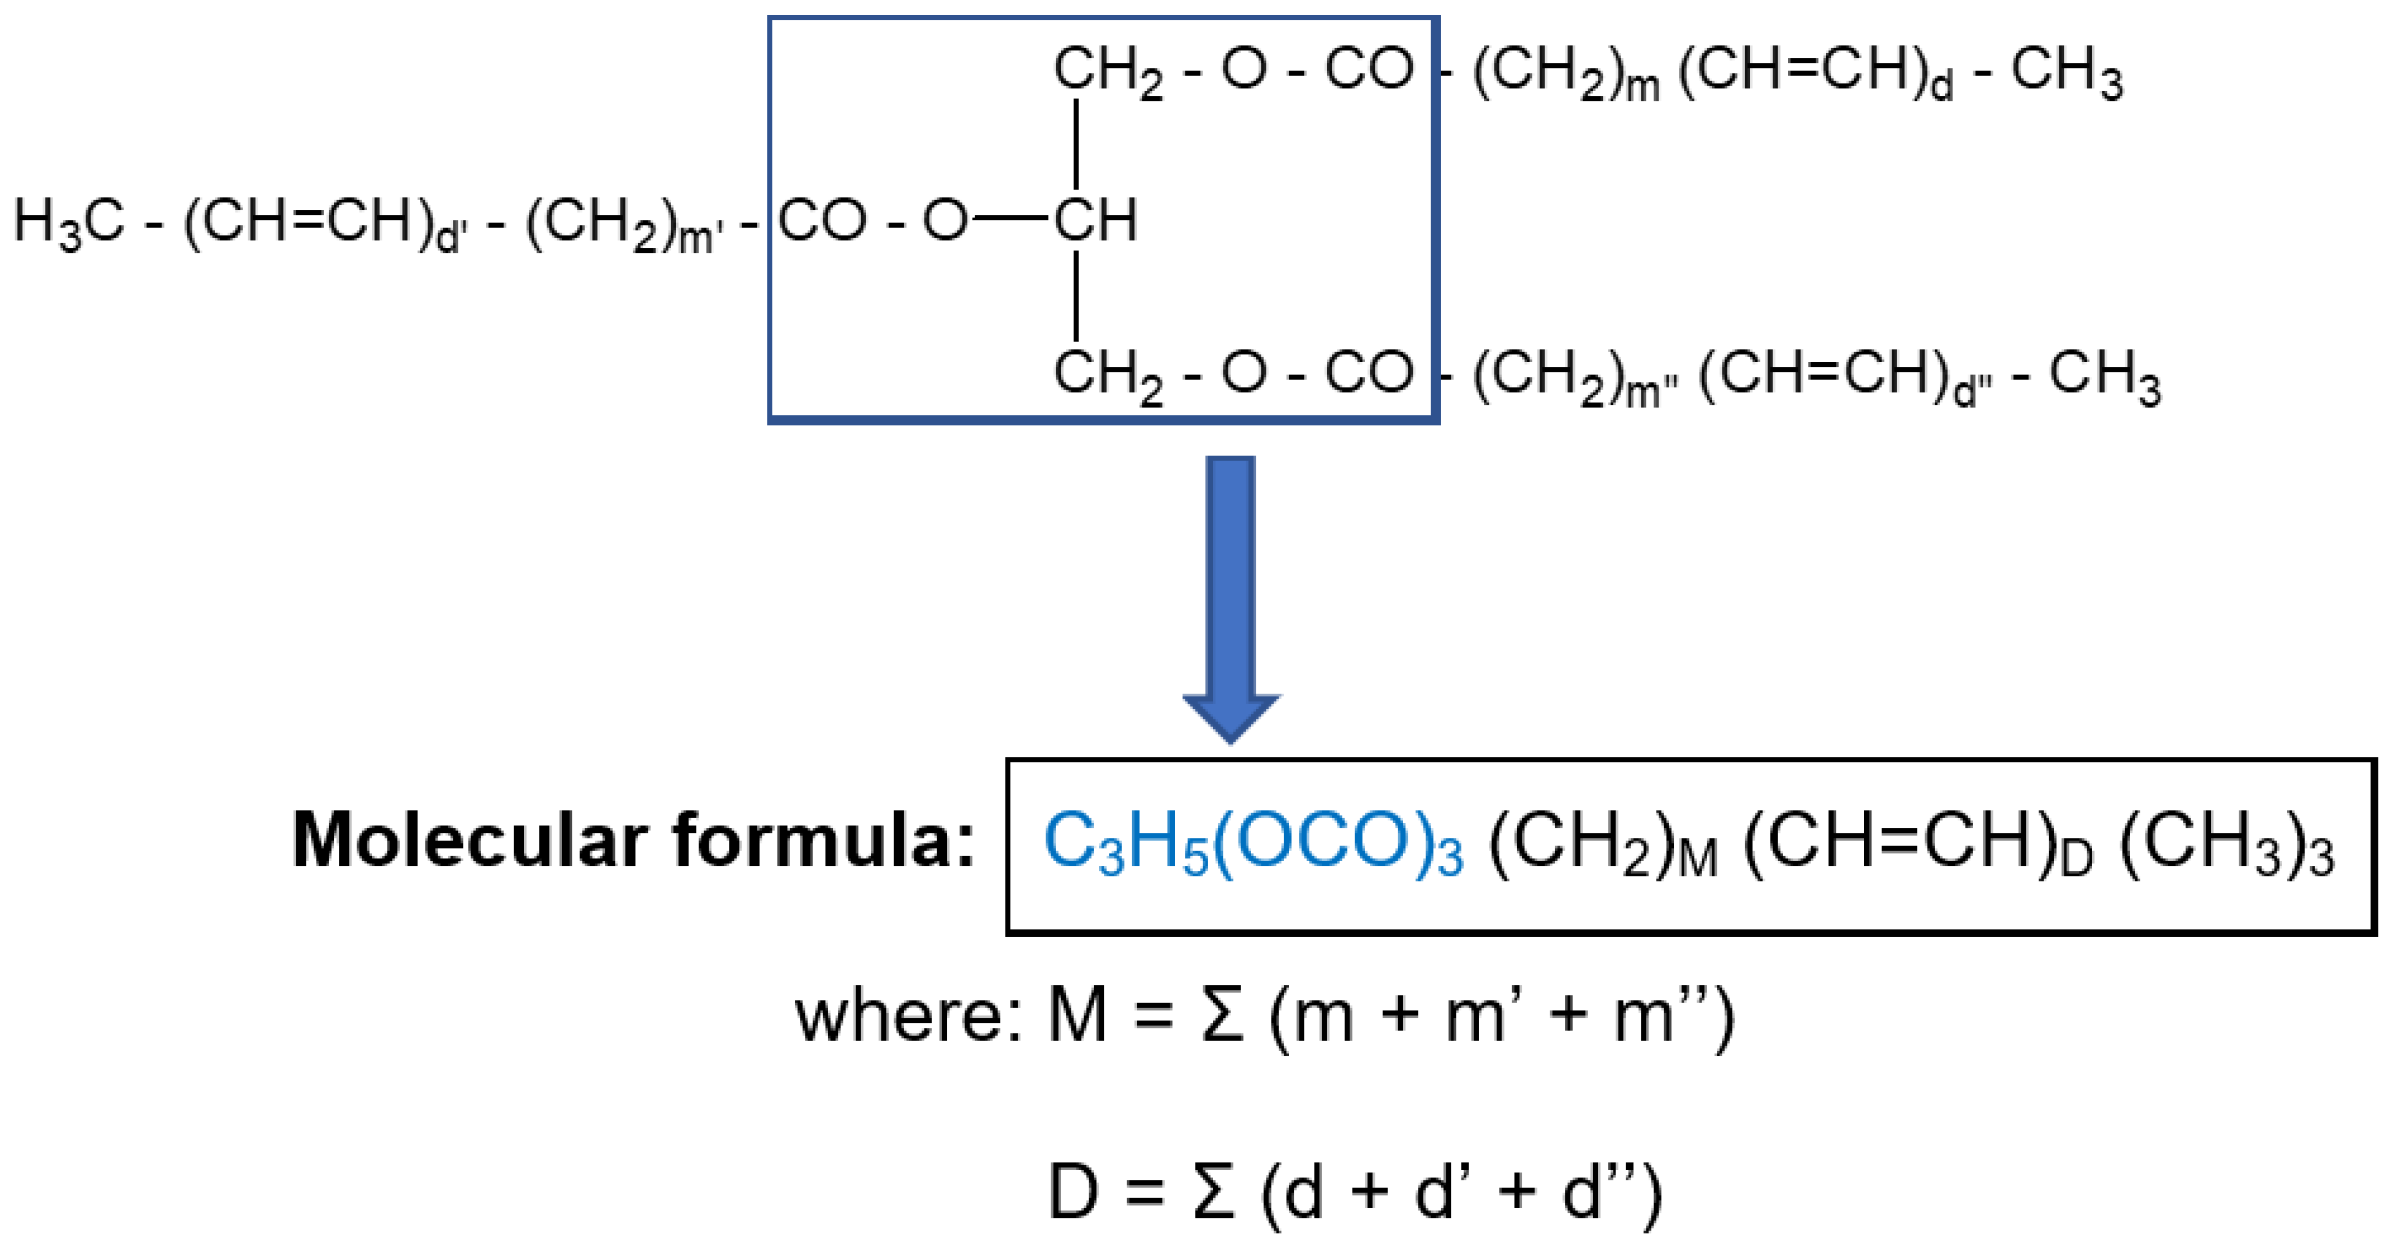
3.2. Algorithm for the SV Calculation from 1H-NMR Data

The general pattern of triacylglycerols (TAGs), as depicted in Figure 2, consists of a glycerol ester backbone and three fatty acyl chains, each with a terminal methyl group and various amounts of methylene and CH=CH double bonds.
As reflected from Figure 2, triacylglycerols consist of a glycerol triple ester backbone, common to all TAGs, the differences occurring in the hydrocarbon residues from fatty acyl chains. Apart from the terminal methyl groups (-CH3), the hydrocarbon chains consist only of methylene groups (-CH2-) and double bonds (-CH=CH-), the number of which differs depending on the length of the chain and on the degree of unsaturation, being characteristic for each individual fatty acid. For example, oleic acid contains fourteen methylene groups (-CH2-) and a single double bond (-CH=CH-), and linoleic acid contains twelve methylene groups (-CH2-) and two double bonds (-CH=CH-). Therefore, the average molecular formula of a triglyceride can be rendered as:
C3H5(OCO)3(CH2)M(CH=CH)D(CH3)3
The integral of a resonance being the area under the resonance curve, in the next chemometric equations the following suggestive notations were adopted for the integral values of the corresponding resonances: A(A+B), AC, AD, AE, AF, AG, AH, and A(I+J), respectively.
The average number of methylene groups (M) and the average number of double bonds (D) in the alkyl chain can then be calculated as:
M = 3 2 A C + A D + A E + A F + A G A ( A + B )
D = 3 2 A ( I + J ) A H / 4 A ( A + B )
(i)
The normalization factor 3/2 appeared as a consequence of the different number of protons that generated the resonances involved in Equations (1) and (2), i.e., two protons in the case of the resonances at the numerator and three in the case of the resonances at the denominator;
(ii)
Since resonances I and J appear partially overlapped, they cannot be integrated separately. However, AI (corresponding to the single proton in the sn-2 position from the glycerol moiety) can be indirectly computed as A H / 4 , given the proton ratio of 1:4 in the case of signals I and H, respectively. Consequently, AJ (corresponding to the unsaturated protons (CH=CH) may be computed as a difference A(I+J) − AI;
(iii)
Since resonances A and B appear partially overlapped, they cannot be accurately integrated as separate signals; the integration was therefore performed according to the general rule (i.e., from baseline to baseline), leading to the integral of the envelope resonance (A+B).
The mean number of carbon atoms in the hydrocarbon chain (nC) and the average number of hydrogen atoms in the hydrocarbon chain (nH) can be computed as:
n C = M + 2 D + 1
n H = 2 M + 2 D + 3
leading to the mean formulae of the hydrocarbon chain (CM+2D+1H2M+2D+3) and of the triacylglycerol, i.e., C6+3 (M+2D+1) H5+3(2M+2D+3) O6.
As a consequence, the average molecular weight of TAGs becomes:
M TAG = 12 × [ 6 + 3 ( M + 2 D + 1 ) ] + 1 × [ 5 + 3 ( 2 M + 2 D + 3 ) ] + 16 × 6
The SV represents the amount of KOH (in mg) required for the saponification of 1 g of fat [15]. Therefore, SV can be computed as:
SV   ( mg   KOH / g   fat ) = 3 × ν × 56 × 10 3
where ν represents the number of TAG moles per gram of fat (ν = 1/MTAG), while (3 ⨯ ν) is the number of moles of ester groups per gram of oil.
An example of SV calculation from 1H-NMR data is shown in the Supplementary Materials (Table S2).
The SV values for the SO-TB and RO-TB series (both determined by the method based on the 1H-NMR data and determined experimentally by the conventional ISO 3657:2013 method taken as reference) are presented in Table 2.
As reflected in Table 2, the values obtained based on the 1H-NMR data were close to the values determined by the conventional method, which reflects the accuracy of the calculation algorithm.
The accuracy of the new method was assessed by calculating for each sample the SV (NMR) deviation from the SV (ISO), taken as a reference and expressed as percentages relative to the SV (ISO) (see details in Table S3). The mean percent deviation of SV (NMR) from SV (ISO) was found to be 2%, which stands for a robust NMR algorithm. The accuracy of the proposed method was also reflected by the SV (NMR) plotted against the SV (ISO) in Figure 3. The concordance between the values obtained by the NMR method and the titration values is reflected by values close to 1 for both the slope of the trendline (in the case of perfect concordance, tg α = 1, corresponding to an angle of 45°) and for the coefficient of correlation R2. As reflected from Figure 3, values close to 1 were obtained for the two parameters, indicating a good correlation between the two methods.

3.3. Determination of the SV for Edible Oils and Fats

Subsequently, the algorithm for determining the saponification value was applied to a series of commercial samples of vegetable oils and fats, butter, cheeses and spreadable fat mixtures (margarine type). The results are presented in Table 3.
As reflected from Table 3, there was agreement between the SVs calculated from the 1H-NMR data and the SVs determined through the wet (ISO 3657:2013) method. However, in the case of the oil and fat samples, the mean percent deviation of SV (NMR) from SV (ISO) was 3%, higher than in the case of the oil–TB series (2%), which may be due to the fact of their more complex composition compared to the binary mixtures.
Edible fats have variable SVs, depending on the species. As expected, vegetable oils, such as sunflower, soybean and rapeseed, had similar SVs, ranging from 194 to 196 mg KOH/g oil (as determined from the 1H-NMR data). These values are in agreement with the fatty acid composition consisting of C18 fatty acids (i.e., linoleic C18:2 and oleic C18:1 as the main constituents, various amounts of stearic C18:0 and linolenic acid C18:3 in small amounts) and modest amounts of C16:0 (palmitic) acid [21,22,23]. They are also in agreement with similar SVs reported in the literature [21]. On the other hand, lauric fats, such as coconut oil and palm fat, showed significantly higher SVs (mean values of 248.5 and 236.5 mg KOH/g oil, respectively) due to the fact of their specific fatty acid profiles rich in lauric (C12:0), myristic (C14:0) and myristoleic (C14:1) fatty acids. In the case of the coconut oil, its fatty acid profile is dominated by medium chain length fatty acids, with lauric acid ranging between 30 and 50% [24,25,26], while myristic was also reported in high levels (accounting for more than 20%) [24,25,26]. Palm fats are abundant in palmitic (C16:0) acid [25,27], with large amounts of lauric and myristic acids (especially palm kernel oil [3]). The high levels of C12 and C14 explain the marked increase in the SVs of coconut and palm fats compared to the rest of the vegetable oils.
In the case of dairy products (i.e., butter and cheese fats), the average saponification values were approximately 242 mg KOH/g fat in both cases. The SV results correlated with their particular fatty acid profile, containing mainly long chain (C14–C18) as well as important amounts of short (butyric, caproic) and medium (C8–C14) chain fatty acids [19,28]. It is worth mentioning that milk fats contain high amounts (up to 32.4% [29]) of palmitic acid (C16:0), whereas myristic (C14:0) and myristoleic (C14:1) acids occur in important amounts, accounting for more than 10–12% altogether [30,31]. Consequently—although belonging to the long chain fatty acids category—C14 fatty acids contributed to the global lowering of the average molecular weight of the triacylglycerols of milk fats compared to vegetable oils (mainly consisting of C16–C18 fatty acids). Altogether, the short and medium chain fatty acids, myristic and palmitic acid levels explain the high SV in the case of dairy products.
On the other hand, spreadable fat mixtures, the analyzed samples consisted of mixtures of butter with various amounts of vegetable fats. Given the variable composition of these samples (depending on the producers’ recipes), an average SV cannot be calculated. The spreadable fat mixtures have SV lower than those of butters and cheeses, due to the higher amounts of C16 and C18 fatty acids from the oils and fat ingredients of vegetal origin.

4. Perspectives

Milk fat is one of the most expensive ingredients in the food industry [19,32,33]; therefore, it may be subject to fraudulent practices such as its partial replacement with cheaper oils and fats. The addition of nondairy fats and oils to dairy fats will result in lower SVs. Of course, an altered butter or cheese fat composition would be difficult to detect through SVs if coconut oil (SV = ~249 mg KOH/g oil) combined with a common C16–C18 oil (such as sunflower, rapeseed or soybean oil, with SV = ~193 mg KOH/g oil) is used as an adulterant. On the other hand, except for the producing countries, coconut oil is an expensive commodity [34] in the rest of the regions (for example, in Europe), which makes it improbable as an adulterant. Consequently, SVs may be an indicator for dairy products adulteration with other fats and oils of nondairy origin. Therefore, further studies correlating the amount of vegetable fats added into dairy fats with the variation of the SV may lead to the rapid detection of adulterated dairy products.

5. Conclusions

All structural patterns of triacylglycerols were reflected as specific resonances in the 1H-NMR spectra of fats and oils. Chemometric equations leading to the mean molecular weight of triacylglycerol species may be derived from the integral values of the 1H-NMR signals, which may further be used to compute the number of moles of triacylglycerol species per gram of fat, which will further lead to the calculation of the SV, expressed as mg KOH/g of fat. Consequently, 1H-NMR spectroscopic data may be used to rapidly compute the saponification values of oils and fats based on the resonances associated with the fatty acyl chain lengths. The obtained 1H-NMR-based saponification values differed from the conventionally determined SVs by a mean percent deviation of 2.3%, which is sufficient to properly characterize various types of fats. Although the NMR method is more expensive than the official method, as was proven both by us and other groups, one can obtain more information (e.g., fatty acid composition and iodine number) in addition to the saponification value from the same NMR analysis in a very short time. Thus, for combined analyses both for advanced research and authentication purposes, SV by NMR is a valuable alternative.

Supplementary Materials

The following are available online at https://0-www-mdpi-com.brum.beds.ac.uk/article/10.3390/foods11101466/s1, Examples of the SV algorithm’s application—Table S1: Reference intervals for resonance integration; Table S2: 1H-RMN integral values for the UR-TB-20 sample; Table S3: Assessment of the accuracy of the NMR method; Table S4: Influence of various delays on the calculated SV.

Author Contributions

Conceptualization, N.-A.C.; methodology, N.-A.C., C.D. and A.H.; formal analysis, N.-A.C., M.I., R.D. and M.T.; investigation, A.H., R.D., M.I., N.-A.C., M.T., C.S., C.D., L.P. and A.G.-M.; resources, N.-A.C., L.P., M.I., G.I. and R.S.; writing—original draft preparation, N.-A.C. and M.I.; writing—review and editing, C.D., A.H., G.I., R.S. and A.G.-M.; supervision, N.-A.C.; project administration, N.-A.C.; funding acquisition, N.-A.C., M.I. and L.P. All authors have read and agreed to the published version of the manuscript.

Funding

This work was funded through the international research grant “Méthode rapide basée sur la spectroscopie de 1H-RMN pour déceler les fromages adultérés par addition de graisses végétales (FRAUDmage)”, code AUF-ECO_SRI_2021_FRAUDmage_2144-2638, financed by the Agence Universitaire de la Francophonie (AUF) and co-funded by the University POLITEHNICA of Bucharest (Bucharest, Romania), the Technical University of Moldova (Chişinău, Republic of Moldova) and the University of Food Technologies (Plovdiv, Bulgaria). The APC was funded by the Agence Universitaire de la Francophonie (AUF) through FRAUDmage research grant.

Institutional Review Board Statement

Not applicable.

Informed Consent Statement

Not applicable.

Data Availability Statement

Data is contained within the article or supplementary material.

Acknowledgments

Support provided by Alina Nicolescu for testing the results on a second NMR spectrometer, as well as occasional support for spectrometers troubleshooting is warmly acknowledged.

Conflicts of Interest

The authors declare no conflict of interest. The funders had no role in the design of the study; in the collection, analyses, or interpretation of data; in the writing of the manuscript, or in the decision to publish the results.

References

  1. Li, Y.; Watkins, B.A. Unit D1.4: Oil Quality Indices. In Current Protocols in Food Analytical Chemistry; Wrolstad, R.E., Ed.; John Wiley & Sons, Inc.: New York, NY, USA, 2001; Protocol D1.4.3–D1.4.4. [Google Scholar]
  2. Toscano, G.; Riva, G.; Foppa Pedretti, E.; Duca, D. Vegetable oil and fat viscosity forecast models based on iodine number and saponification number. Biomass Bioenergy 2012, 46, 511–516. [Google Scholar] [CrossRef]
  3. Naksuk, A.; Sabatini, D.A.; Tongcumpou, C. Microemulsion-based palm kernel oil extraction using mixed surfactant solutions. Ind. Crops Prod. 2009, 30, 194–198. [Google Scholar] [CrossRef]
  4. Kilic, B.; Ozer, C.O. Potential use of interesterified palm kernel oil to replace animal fat in frankfurters. Meat Sci. 2019, 148, 206–212. [Google Scholar] [CrossRef] [PubMed]
  5. Marina, A.M.; Che Man, Y.B.; Nazimah, S.A.H.; Amin, I. Chemical properties of virgin coconut oil. J. Am. Oil Chem. Soc. 2009, 86, 301–307. [Google Scholar] [CrossRef]
  6. Sbihi, H.M.; Nehdi, I.A.; Tan, C.P.; Al-Resayes, S.I. Characteristics and fatty acid composition of milk fat from Saudi Aradi goat. Grassas y Aceites 2015, 66, e101. [Google Scholar] [CrossRef] [Green Version]
  7. Salem, E.R.; Awad, R.A.; El Batawy, O.I. Detection of Milk Fat Adulteration with Coconut Oil Depending on Some Physical and Chemical Properties. Int. J. Dairy Sci. 2019, 14, 36–44. [Google Scholar] [CrossRef]
  8. Putri, A.R.; Rohman, A.; Setyaningsih, W.; Riyanto, S. Determination of acid, peroxide, and saponification value in patin fish oil by FTIR spectroscopy combined with chemometrics. Food Res. 2020, 4, 1758–1766. [Google Scholar] [CrossRef]
  9. Alexandri, E.; Ahmed, R.; Siddiqui, H.; Choudhary, M.I.; Tsiafoulis, C.G.; Gerothanassis, I.P. High Resolution NMR Spectroscopy as a Structural and Analytical Tool for Unsaturated Lipids in Solution. Molecules 2017, 22, 1663. [Google Scholar] [CrossRef]
  10. Yeung, D.K.W.; Lam, S.L.; Griffith, J.F.; Chan, A.B.W.; Chen, Z.; Tsang, P.H.; Leung, P.C. Analysis of bone marrow fatty acid composition using high-resolution proton NMR spectroscopy. Chem. Phys. Lipids 2008, 151, 103–109. [Google Scholar] [CrossRef]
  11. Siudem, P.; Zielinska, A.; Paradowska, K. Application of 1H NMR in the study of fatty acids composition of vegetable oils. J. Pharm. Biomed. Anal. 2022, 212, 114658. [Google Scholar] [CrossRef]
  12. Knothe, G.; Kenar, J.A. Determination of the fatty acid profile by 1H-NMR Spectroscopy. Eur. J. Lipid Sci. Technol. 2004, 106, 88–96. [Google Scholar] [CrossRef]
  13. Chira, N.-A.; Todasca, M.-C.; Nicolescu, A.; Rosu, A.; Nicolae, M.; Rosca, S.-I. Evaluation of the computational methods for determining vegetable oils composition using 1H-NMR spectroscopy. Rev. Chim. 2011, 62, 42–46. Available online: https://www.revistadechimie.ro/Articles.asp?ID=2863 (accessed on 1 February 2022).
  14. Skiera, C.; Steliopoulos, P.; Kuballa, T.; Diehl, B.; Holzgrabe, U. Determination of free fatty acids in pharmaceutical lipids by 1H NMR and comparison with the classical acid value. J. Pharm. Biomed. 2014, 93, 43–50. [Google Scholar] [CrossRef] [PubMed]
  15. ISO 1735:2004; Cheese and Processed Cheese Products—Determination of Fat Content—Gravimetric Method (Reference method). ISO: Geneva, Switzerland, 2004.
  16. Shahidi, F. Unit 1.1: Extraction and Measurement of Total Lipids. In Current Protocols in Food Analytical Chemistry; Whitaker, J., Ed.; John Wiley & Sons, Inc.: New York, NY, USA, 2001; pp. D1.1.1–D1.1.11. [Google Scholar] [CrossRef]
  17. ISO 3657:2013; Animal and Vegetable Fats and Oils—Determination of Saponification Value. ISO: Geneva, Switzerland, 2013.
  18. Stavarache, C.; Nicolescu, A.; Duduianu, C.; Ailiesei, G.L.; Balan-Porcarasu, M.; Cristea, M.; Macsim, A.-M.; Popa, O.; Stavarache, C.; Hirtopeanu, A.; et al. A real-life reproducibility assessment for NMR metabolomics. Diagnostics 2022, 12, 559. [Google Scholar] [CrossRef]
  19. Hanganu, A.; Chira, N.-A. When detection of dairy food fraud fails: An alternative approach through proton nuclear magnetic resonance spectroscopy. J. Dairy Sci. 2021, 104, 8454–8466. [Google Scholar] [CrossRef] [PubMed]
  20. Deleanu, C.; Enache, C.; Caproiu, M.T.; Cornilescu, G.; Hirtopeanu, A. Esteri metilici ai acizilor grasi. Compusi etalon pentru atributia semnalelor in spectrele RMN de rezolutie inalta ale uleiurilor comestibile. Rev. Chim. 1994, 45, 1046–1052. [Google Scholar]
  21. Kuang, G.; Du, Y.; Lu, S.; Wang, Z.; Zhang, Z.; Fan, X.; Bilal, M.; Cui, J.; Jia, S. Silica@lipase hybrid biocatalysts with superior activity by mimetic biomineralization in oil/water two-phase system for hydrolysis of soybean oil. LWT 2022, 160, 113333. [Google Scholar] [CrossRef]
  22. Kampa, J.; Frazier, R.; Rodriguez-Garcia, J. Physical and Chemical Characterisation of Conventional and Nano/Emulsions: Influence of Vegetable Oils from Different Origins. Foods 2022, 11, 681. [Google Scholar] [CrossRef]
  23. Wang, J.; Han, Y.; Wang, X.; Li, Y.; Wang, S.; Gan, S.; Dong, G.; Chen, X.; Wang, S. Adulteration detection of Qinghai-Tibet Plateau flaxseed oil using HPLC-ELSD profiling of triacylglycerols and chemometrics. LWT 2022, 160, 113300. [Google Scholar] [CrossRef]
  24. Figueiredo, P.S.; Martins, T.N.; Ravaglia, L.M.; Alcantara, G.B.; Guimarães, R.d.C.A.; Freitas, K.d.C.; Nunes, Â.A.; de Oliveira, L.C.S.; Cortês, M.R.; Michels, F.S.; et al. Linseed, Baru, and Coconut Oils: NMR-Based Metabolomics, Leukocyte Infiltration Potential In Vivo, and Their Oil Characterization. Are There Still Controversies? Nutrients 2022, 14, 1161. [Google Scholar] [CrossRef]
  25. Dorni, C.; Sharma, P.; Saikia, G.; Longvah, T. Fatty acid profile of edible oils and fats consumed in India. Food Chem. 2018, 238, 9–15. [Google Scholar] [CrossRef]
  26. Kamath, R.; Basak, S.; Gokhale, J. Recent trends in the development of healthy and functional cheese analogues-a review. LWT 2022, 155, 112991. [Google Scholar] [CrossRef]
  27. Theam, K.L.; Islam, A.; Choo, Y.M.; Taufiq-Yap, Y.H. Biodiesel from low cost palm stearin using metal doped methoxide solid catalyst. Ind. Crops Prod. 2015, 76, 281–289. [Google Scholar] [CrossRef]
  28. Faccia, M.; Natrella, G.; Gambacorta, G.; Trani, A. Cheese ripening in nonconventional conditions: A multiparameter study applied to Protected Geographical Indication Canestrato di Moliterno cheese. J. Dairy Sci. 2022, 105, 140–153. [Google Scholar] [CrossRef] [PubMed]
  29. Salas-Valerio, W.F.; Aykas, D.P.; Hatta Sakoda, B.A.; Ludena-Urquizo, F.E.; Ball, C.; Plans, M.; Rodriguez-Saona, L. In-field screening of trans-fat levels using mid- and near-infrared spectrometers for butters and margarines commercialized in the Peruvian market. LWT 2022, 157, 113074. [Google Scholar] [CrossRef]
  30. Silva, C.C.G.; Silva, S.P.M.; Prates, J.A.M.; Bessa, R.J.B.; Rosa, H.J.D.; Rego, O.A. Physicochemical traits and sensory quality of commercial butter produced in the Azores. Int. Dairy J. 2019, 88, 10–17. [Google Scholar] [CrossRef]
  31. Wilms, J.N.; Hare, K.S.; Fischer-Tlustos, A.J.; Vahmani, P.; Dugan, M.E.R.; Leal, L.N.; Steele, M.A. Fatty acid profile characterization in colostrum, transition milk, and mature milk of primi- and multiparous cows during the first week of lactation. J. Dairy Sci. 2022, 105, 2612–2630. [Google Scholar] [CrossRef]
  32. Oduro, A.F.; Saalia, F.K.; Adjei, M.Y.B. Sensory Acceptability and Proximate Composition of 3-Blend Plant-Based Dairy Alternatives. Foods 2021, 10, 482. [Google Scholar] [CrossRef]
  33. De Meneses, R.B.; Monteiro, M.L.G.; dos Santos, F.F.; da Rocha-Leão, M.H.M.; Conte-Junior, C.A. Sensory Characteristics of Dairy By-Products as Potential Milk Replacers in Ice Cream. Sustainability 2021, 13, 1531. [Google Scholar] [CrossRef]
  34. Amit; Jamwal, R.; Kumari, S.; Dhaulaniya, A.S.; Balan, B.; Kelly, S.; Cannavan, A.; Singh, D.K. Utilizing ATR-FTIR spectroscopy combined with multivariate chemometric modelling for the swift detection of mustard oil adulteration in virgin coconut oil. Vib. Spectrosc. 2020, 109, 103066. [Google Scholar] [CrossRef]
Figure 1. Comparative 1H-NMR spectral characterization of tributyrin (TB ), rapeseed oil (RO ―) and rapeseed oil–tributyrin binary mixtures: RO (30%) + TB (70%) and RO (60%) + TB (40%) . Letters A–J were assigned to resonances according to letters in Table 1.
Foods 11 01466 g001
Figure 2. General representation of a triacylglycerol structure.
Foods 11 01466 g002
Figure 3. SV (NMR) plotted against the SV (ISO 3657:2013). Values for slope a and intercept b reported as the mean ± sd. The NMR experiments were performed in triplicate; ISO determinations were performed in duplicate.
Foods 11 01466 g003
Table 1. Chemical shifts and peak assignment of 1H-NMR spectra of milk fats. Adapted with permission from Refs. [12,19]. Copyright 2004, Eur. J. Lipid Sci. Technol.; Copyright 2021, J. Dairy Sci.
Resonance *δ (ppm)ProtonCompound
A0.85-CH2-CH2-CH2-CH3All acids except butyric acid and linolenic acid
B0.96-CH=CH-CH2-CH3Linolenic acid
-OOC-CH2-CH2-CH3Butyric acid (B’)
C1.24-(CH2)n-All fatty acids
D1.64-CH2-CH2-COO-All fatty acids
E2.02-CH2-CH=CH-All unsaturated fatty acids
F2.26-CH2-COO-All fatty acids
G2.76-CH=CH-CH2-CH=CH-n-6 (Linoleic) acid and n-3 (linolenic) acid
H4.19-CH2OCORH in the sn-1/3 position of the glycerol backbone
I5.15-CHOCORH in the sn-2 position of the glycerol backbone
J5.29-CH=CH-All unsaturated fatty acids
* Letters from A–J correspond to specific resonances according to Figure 1.
Table 2. SVs determined from the 1H-NMR data and through the standard (i.e., ISO 3657:2013) method for the SO-TB and RO-TB series (95% confidence level).
SO-TB SeriesRO-TB Series
SampleTB (%)SV * (mg KOH/g Fat)SampleTB (%)SV * (mg KOH/g Fat)
From
1H-NMR Data
According to
ISO 3657:2013
From
1H-NMR Data
According to
ISO 3657:2013
SO-TB-00196 ± 2 aA190 ± 0 aBRO-TB-00196 ± 4 aA192 ± 1 aA
SO-TB-1010230 ± 4 bA225 ± 6 bARO-TB-1010233 ± 3 bA227 ± 3 bA
SO-TB-2020266 ± 2 cA274 ± 3 cARO-TB-2020272 ± 2 pA266 ± 6 nA
SO-TB-3030302 ± 2 dA294 ± 0 dBRO-TB-3030305 ± 4 dA312 ± 10 lA
SO-TB-4040345 ± 3 eA336 ± 12 eARO-TB-4040341 ± 2 eA334 ± 3 eA
SO-TB-5050387 ± 2 fA374 ± 10 fARO-TB-5050378 ± 2 qA367 ± 9 fA
SO-TB-6060412 ± 1 gA403 ± 1 gBRO-TB-6060414 ± 3 gA411 ± 1 gA
SO-TB-7070447 ± 1 hA434 ± 2 hBRO-TB-7070448 ± 1 hA433 ± 13 hA
SO-TB-8080492 ± 2 iA480 ± 3 iBRO-TB-8080486 ± 3 rA474 ± 9 iA
SO-TB-9090535 ± 3 jA530 ± 8 jBRO-TB-9090523 ± 2 sA515 ± 0 mB
SO-TB-100100559 ± 2 kA547 ± 2 kBRO-TB-100100560 ± 3 kA551 ± 12 kA
SO-TB-1515250 ± 3 lA241 ± 3 bARO-TB-55215 ± 2 tA211 ± 0 oA
SO-TB-3535326 ± 3 mA318 ± 4 lARO-TB-2525286 ± 2 uA292 ± 3 dA
SO-TB-5555413 ± 1 gA403 ± 5 gARO-TB-4545359 ± 3 vA350 ± 4 pA
SO-TB-7575467 ± 3 nA477 ± 4 iARO-TB-6565429 ± 2 wA435 ± 4 hA
SO-TB-9595540 ± 2 oA527 ± 13 mARO-TB-8585503 ± 3 xA499 ± 1 qA
a–x Means with different letters within a column are significantly different (p < 0.05). A, B Means with different letters within a row are significantly different (p < 0.05). * Determined in triplicate (NMR method) and in duplicate (ISO method); values are reported as the mean ± sd.
Table 3. SVs determined from 1H-NMR data and through the standard (ISO 3657:2013) method for a series of edible fats and oils (95% confidence level).
No.SampleSV * (mg KOH/g Fat)
From 1H-NMR DataAccording to ISO 3657:2013
Sunflower oil
1Sunflower oil 1194 ± 2 aA188 ± 2 aA
2Sunflower oil 2195 ± 1 aA189 ± 2 aA
3Sunflower oil 3194 ± 1 aA188 ± 3 aA
4Sunflower oil 4196 ± 1 aA188 ± 3 aA
5Sunflower oil 5195 ± 1 aA189 ± 2 aA
Rapeseed oil
6Rapeseed oil 1196 ± 1 aA188 ± 3 aB
7Rapeseed oil 2196 ± 1 aA188 ± 2 aB
8Rapeseed oil 3194 ± 1 aA188 ± 1 aB
9Rapeseed oil 4195 ± 1 aA188 ± 2 aB
Soybean oil
10Soybean oil 1195 ± 2 aA189 ± 2 aB
11Soybean oil 2193 ± 2 aA188 ± 2 aA
12Soybean oil 3194 ± 1 aA187 ± 2 aB
13Soybean oil 4195 ± 1 aA188 ± 2 aB
14Soybean oil 5194 ± 1 aA188 ± 3 aA
Coconut oil
15Coconut oil 1249 ± 1 aA240 ± 3 aB
16Coconut oil 1248 ± 1 aA239 ±1 aB
Palm fat
17Palm fat 1236 ± 1 aA230 ± 2 aA
18Palm fat 2237 ± 1 aA230 ± 2 aB
Butter
19Butter 1242 ± 2 aA232 ± 1 aB
20Butter 2245 ± 2 aA234 ± 1 aB
21Butter 3245 ± 1 aA235 ± 1 aB
22Butter 4239 ± 1 abA231 ± 2 aB
23Butter 5241 ± 1 abA231 ± 1 aB
Spreadable fat mixtures **
24Spreadable fat mixture 1228 ± 1 aA217 ± 2 aB
25Spreadable fat mixture 2206 ± 2 bA196 ± 1 bB
26Spreadable fat mixture 3222 ± 2 cA217 ± 1 aA
27Spreadable fat mixture 4224 ± 2a acA218 ± 1 aB
Cheese
28Cheese 1239 ± 2 aA231 ± 2 aB
29Cheese 2242 ± 1 aA234 ± 1 aB
30Cheese 3244 ± 2 baA237 ± 1 baB
31Cheese 4238 ± 1 aA231 ± 2 aB
32Cheese 5241 ± 2 aA233 ± 3 aA
33Cheese 6241 ± 1 aA234 ± 1 aB
34Cheese 7244 ± 2 bA237 ± 1 baB
35Cheese 8244 ± 1 bA237 ± 2 baB
36Cheese 9239 ± 1 aA233 ± 2 aB
a–c Means with different letters within a column are significantly different (p < 0.05). A, B Means with different letters within a row are significantly different (p < 0.05). * Determined in triplicate (NMR method) and in duplicate (ISO method), respectively; values reported as the mean ± sd. ** Variable composition (various amounts of butter and different vegetable oils).
Publisher’s Note: MDPI stays neutral with regard to jurisdictional claims in published maps and institutional affiliations.

