
Thermal Stability of Fructooligosaccharides Extracted from Defatted Rice Bran: A Kinetic Study Using Liquid Chromatography-Tandem Mass Spectrometry


Abstract
:1. Introduction
2. Materials and Methods
2.1. Materials
2.2. Extraction of FOS from Rice Bran
2.3. Thermal Degradation of Rice Bran-Extracted GF2, GF3, and GF4
2.4. Analysis of FOS by UPLC-ESI-MS/MS
2.5. Kinetic Data Analysis
3. Results and Discussion
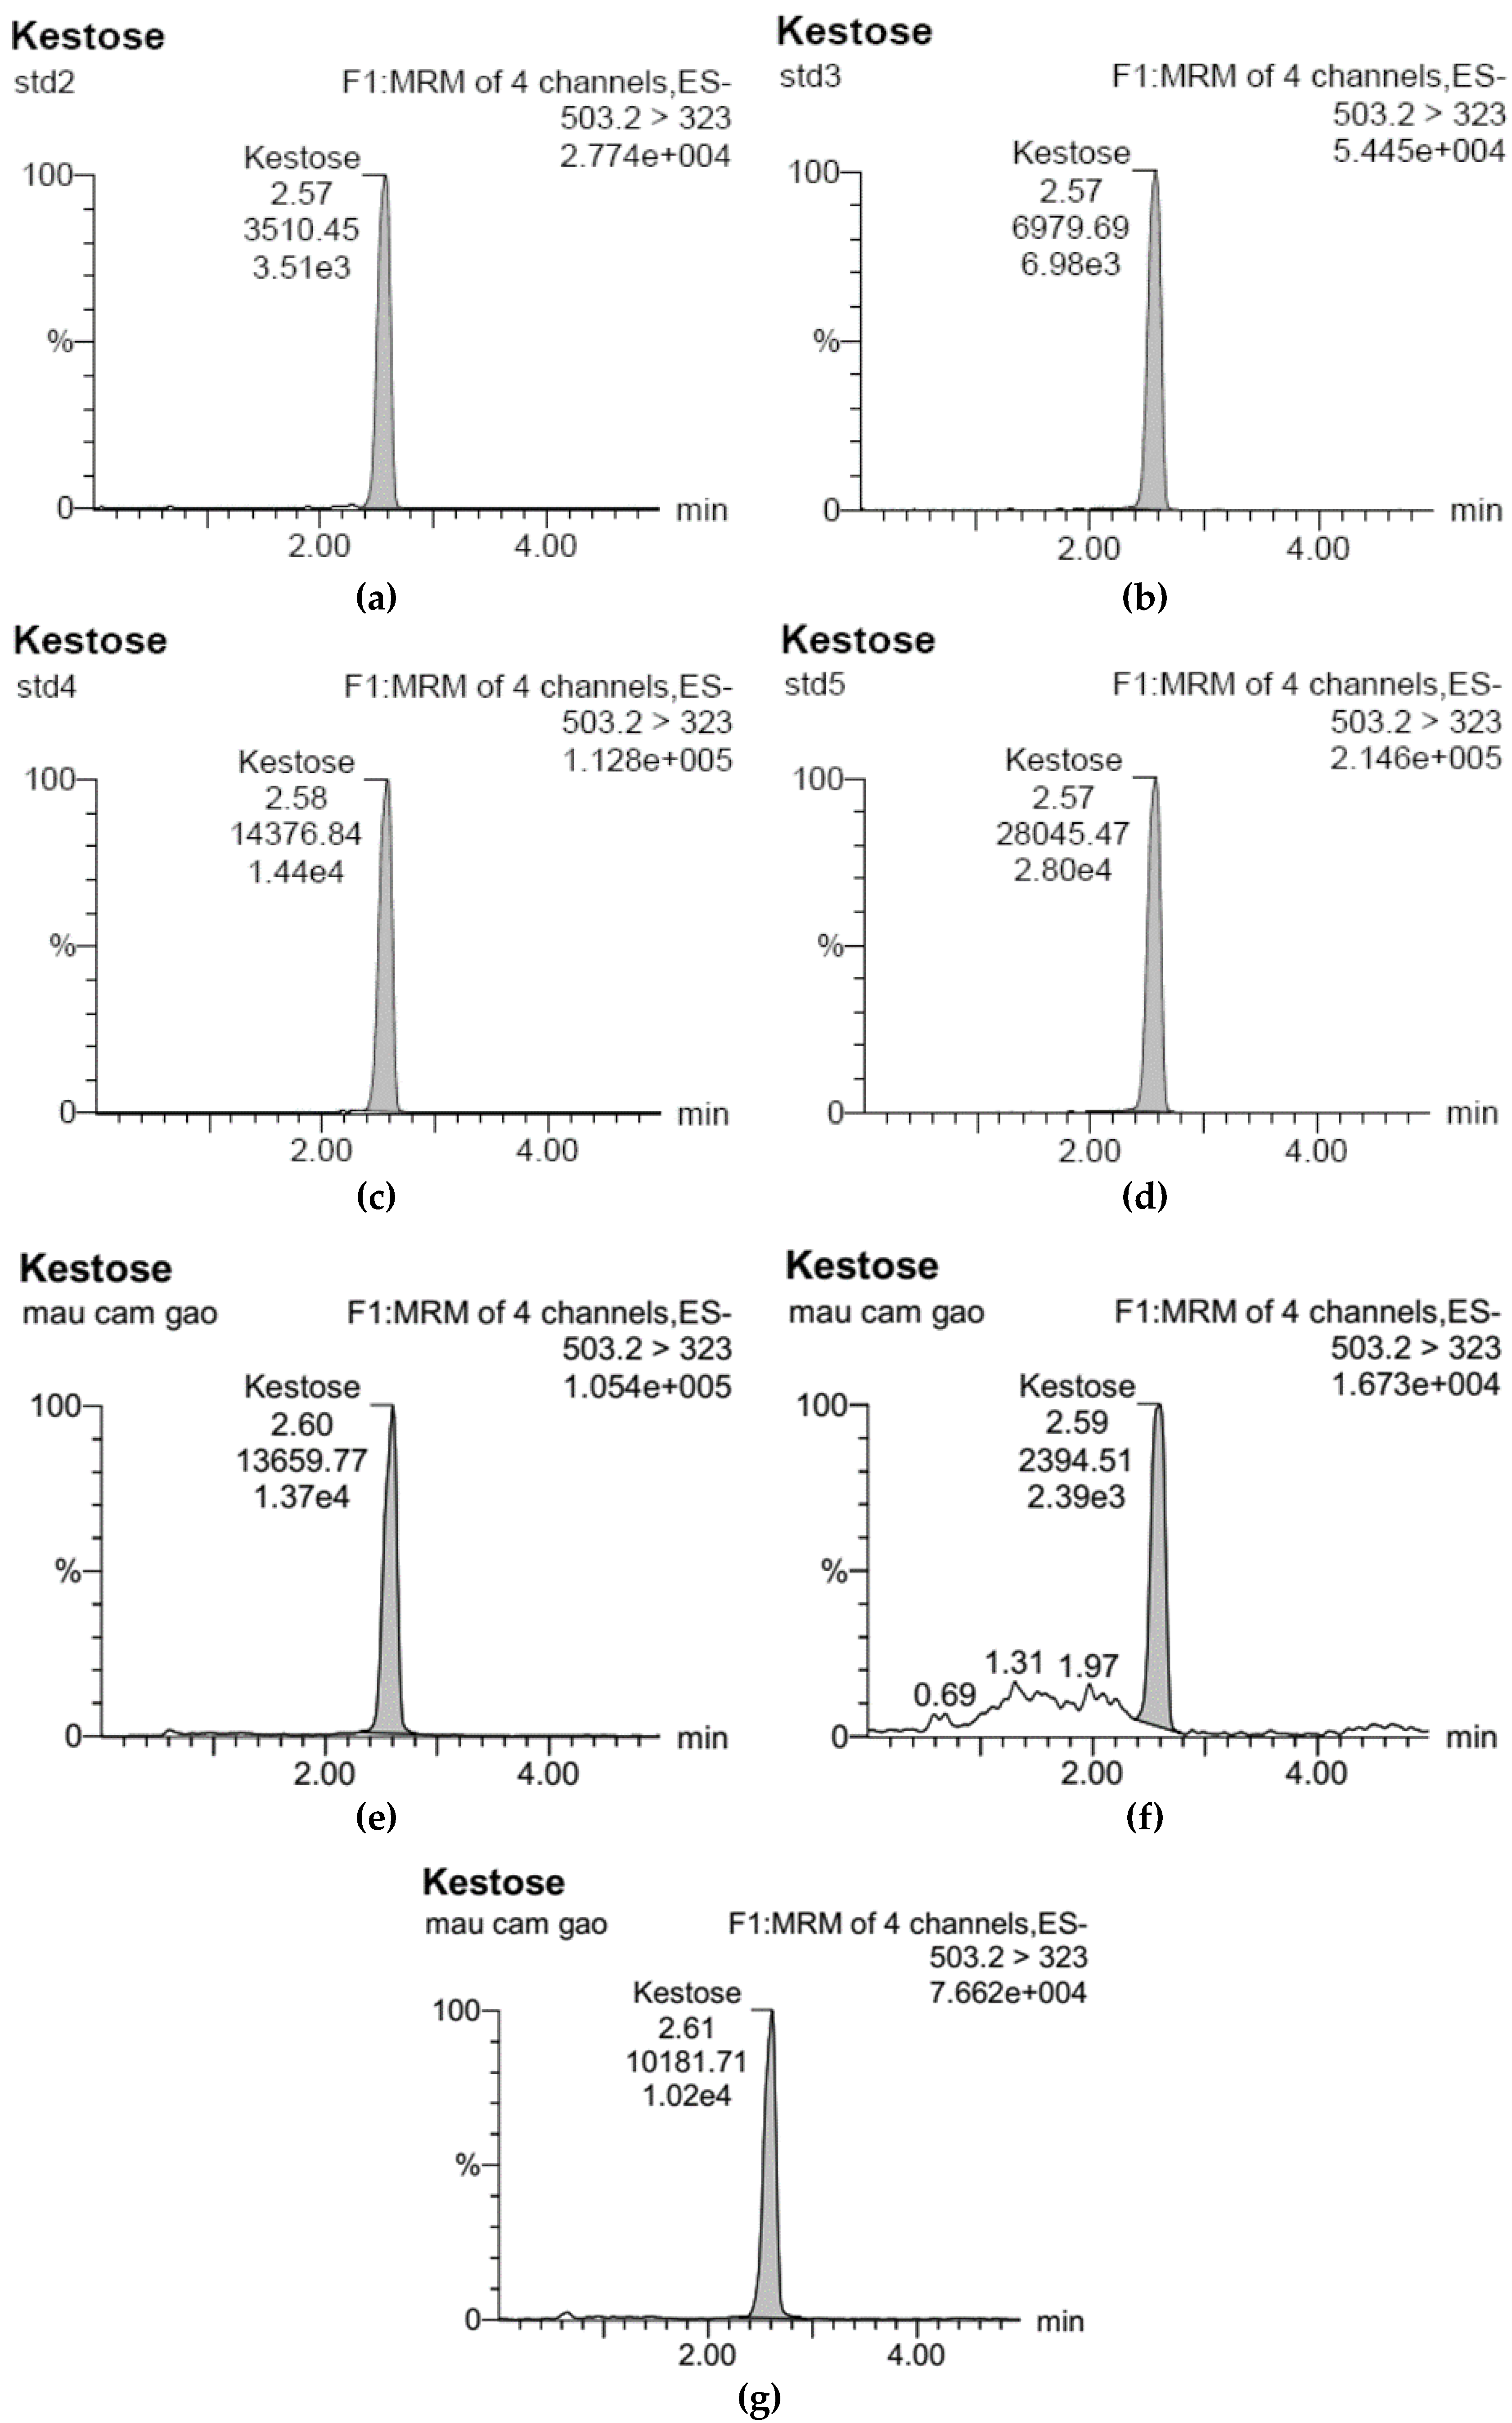
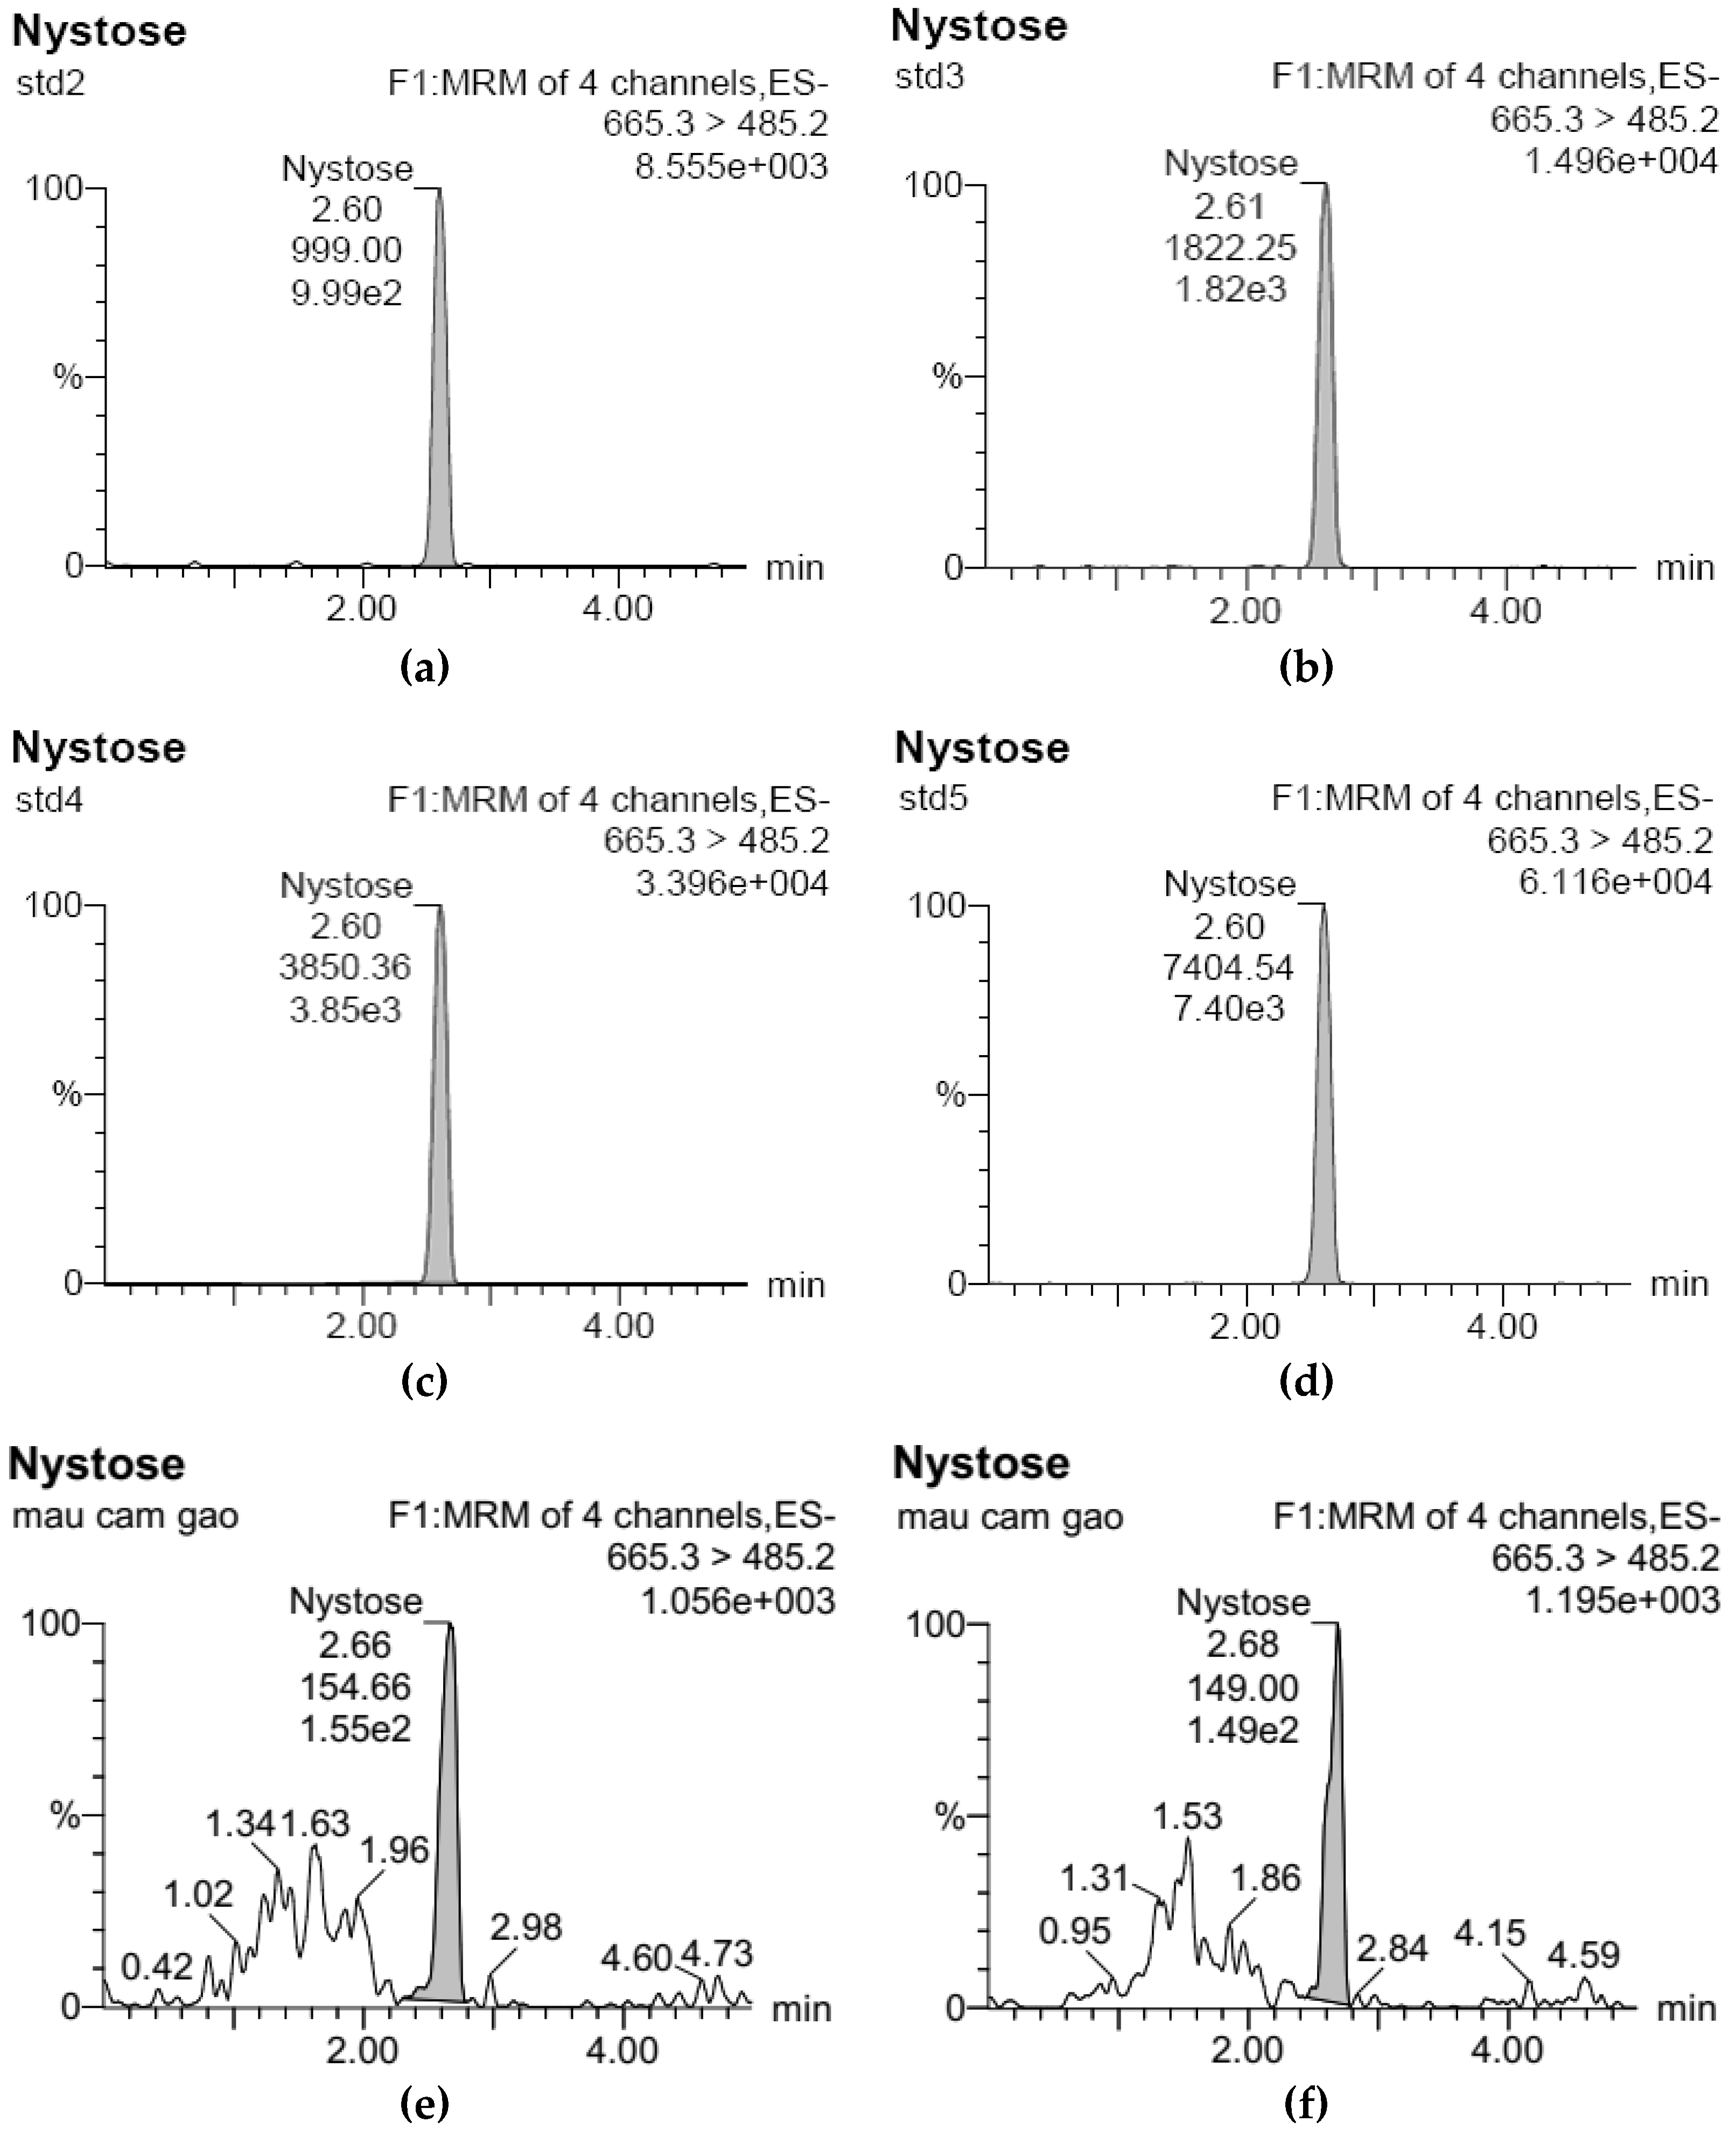
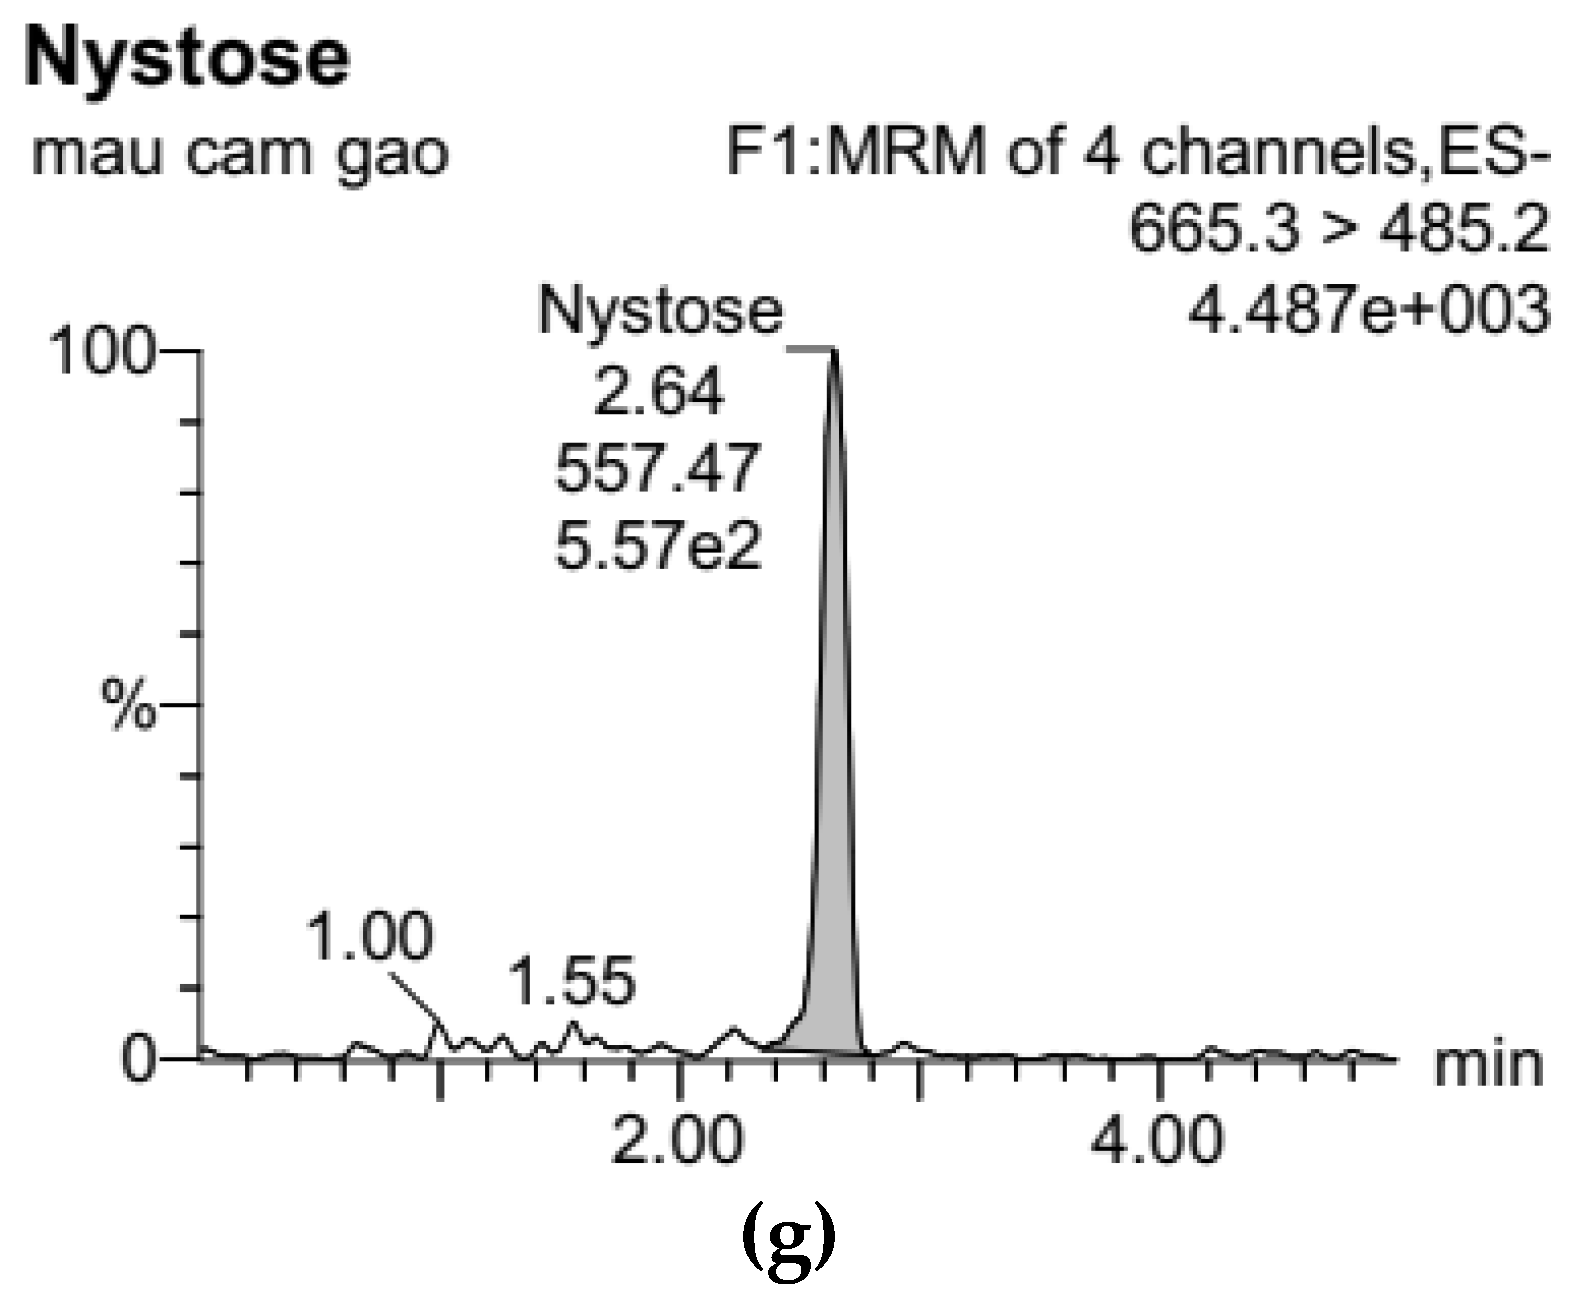
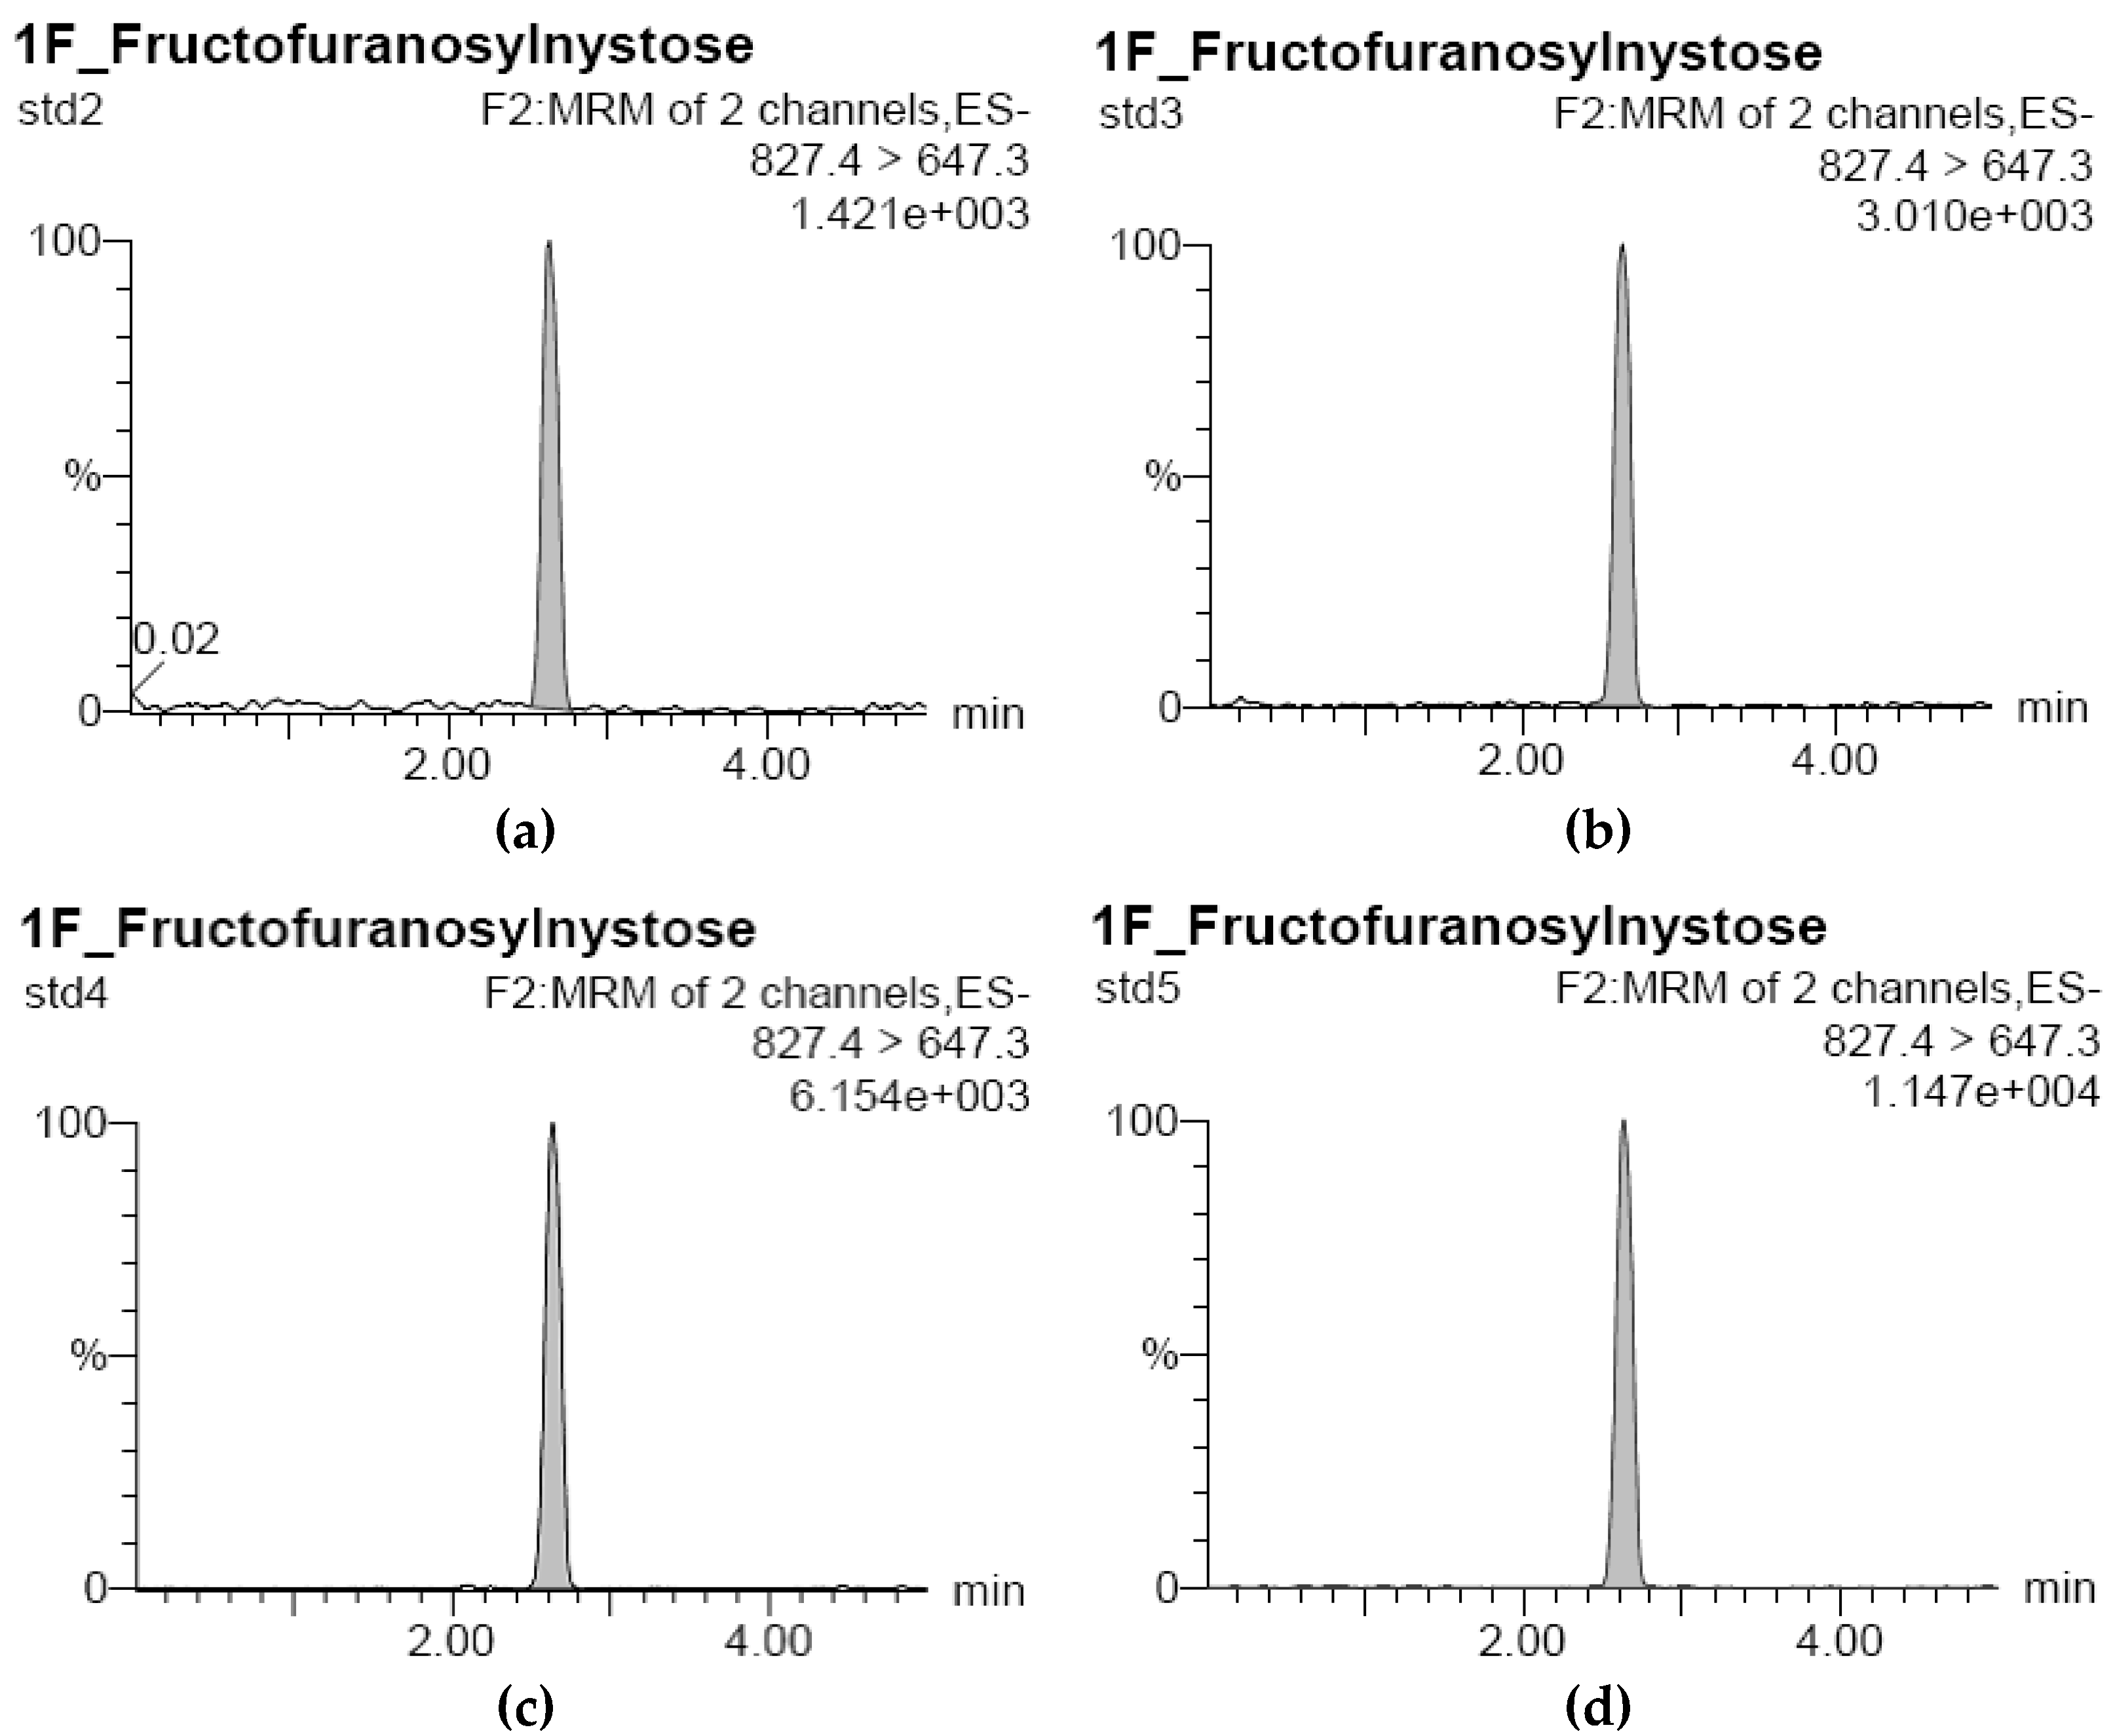
3.1. Development of Standard Curves for GF2, GF3, and GF4 Analysis
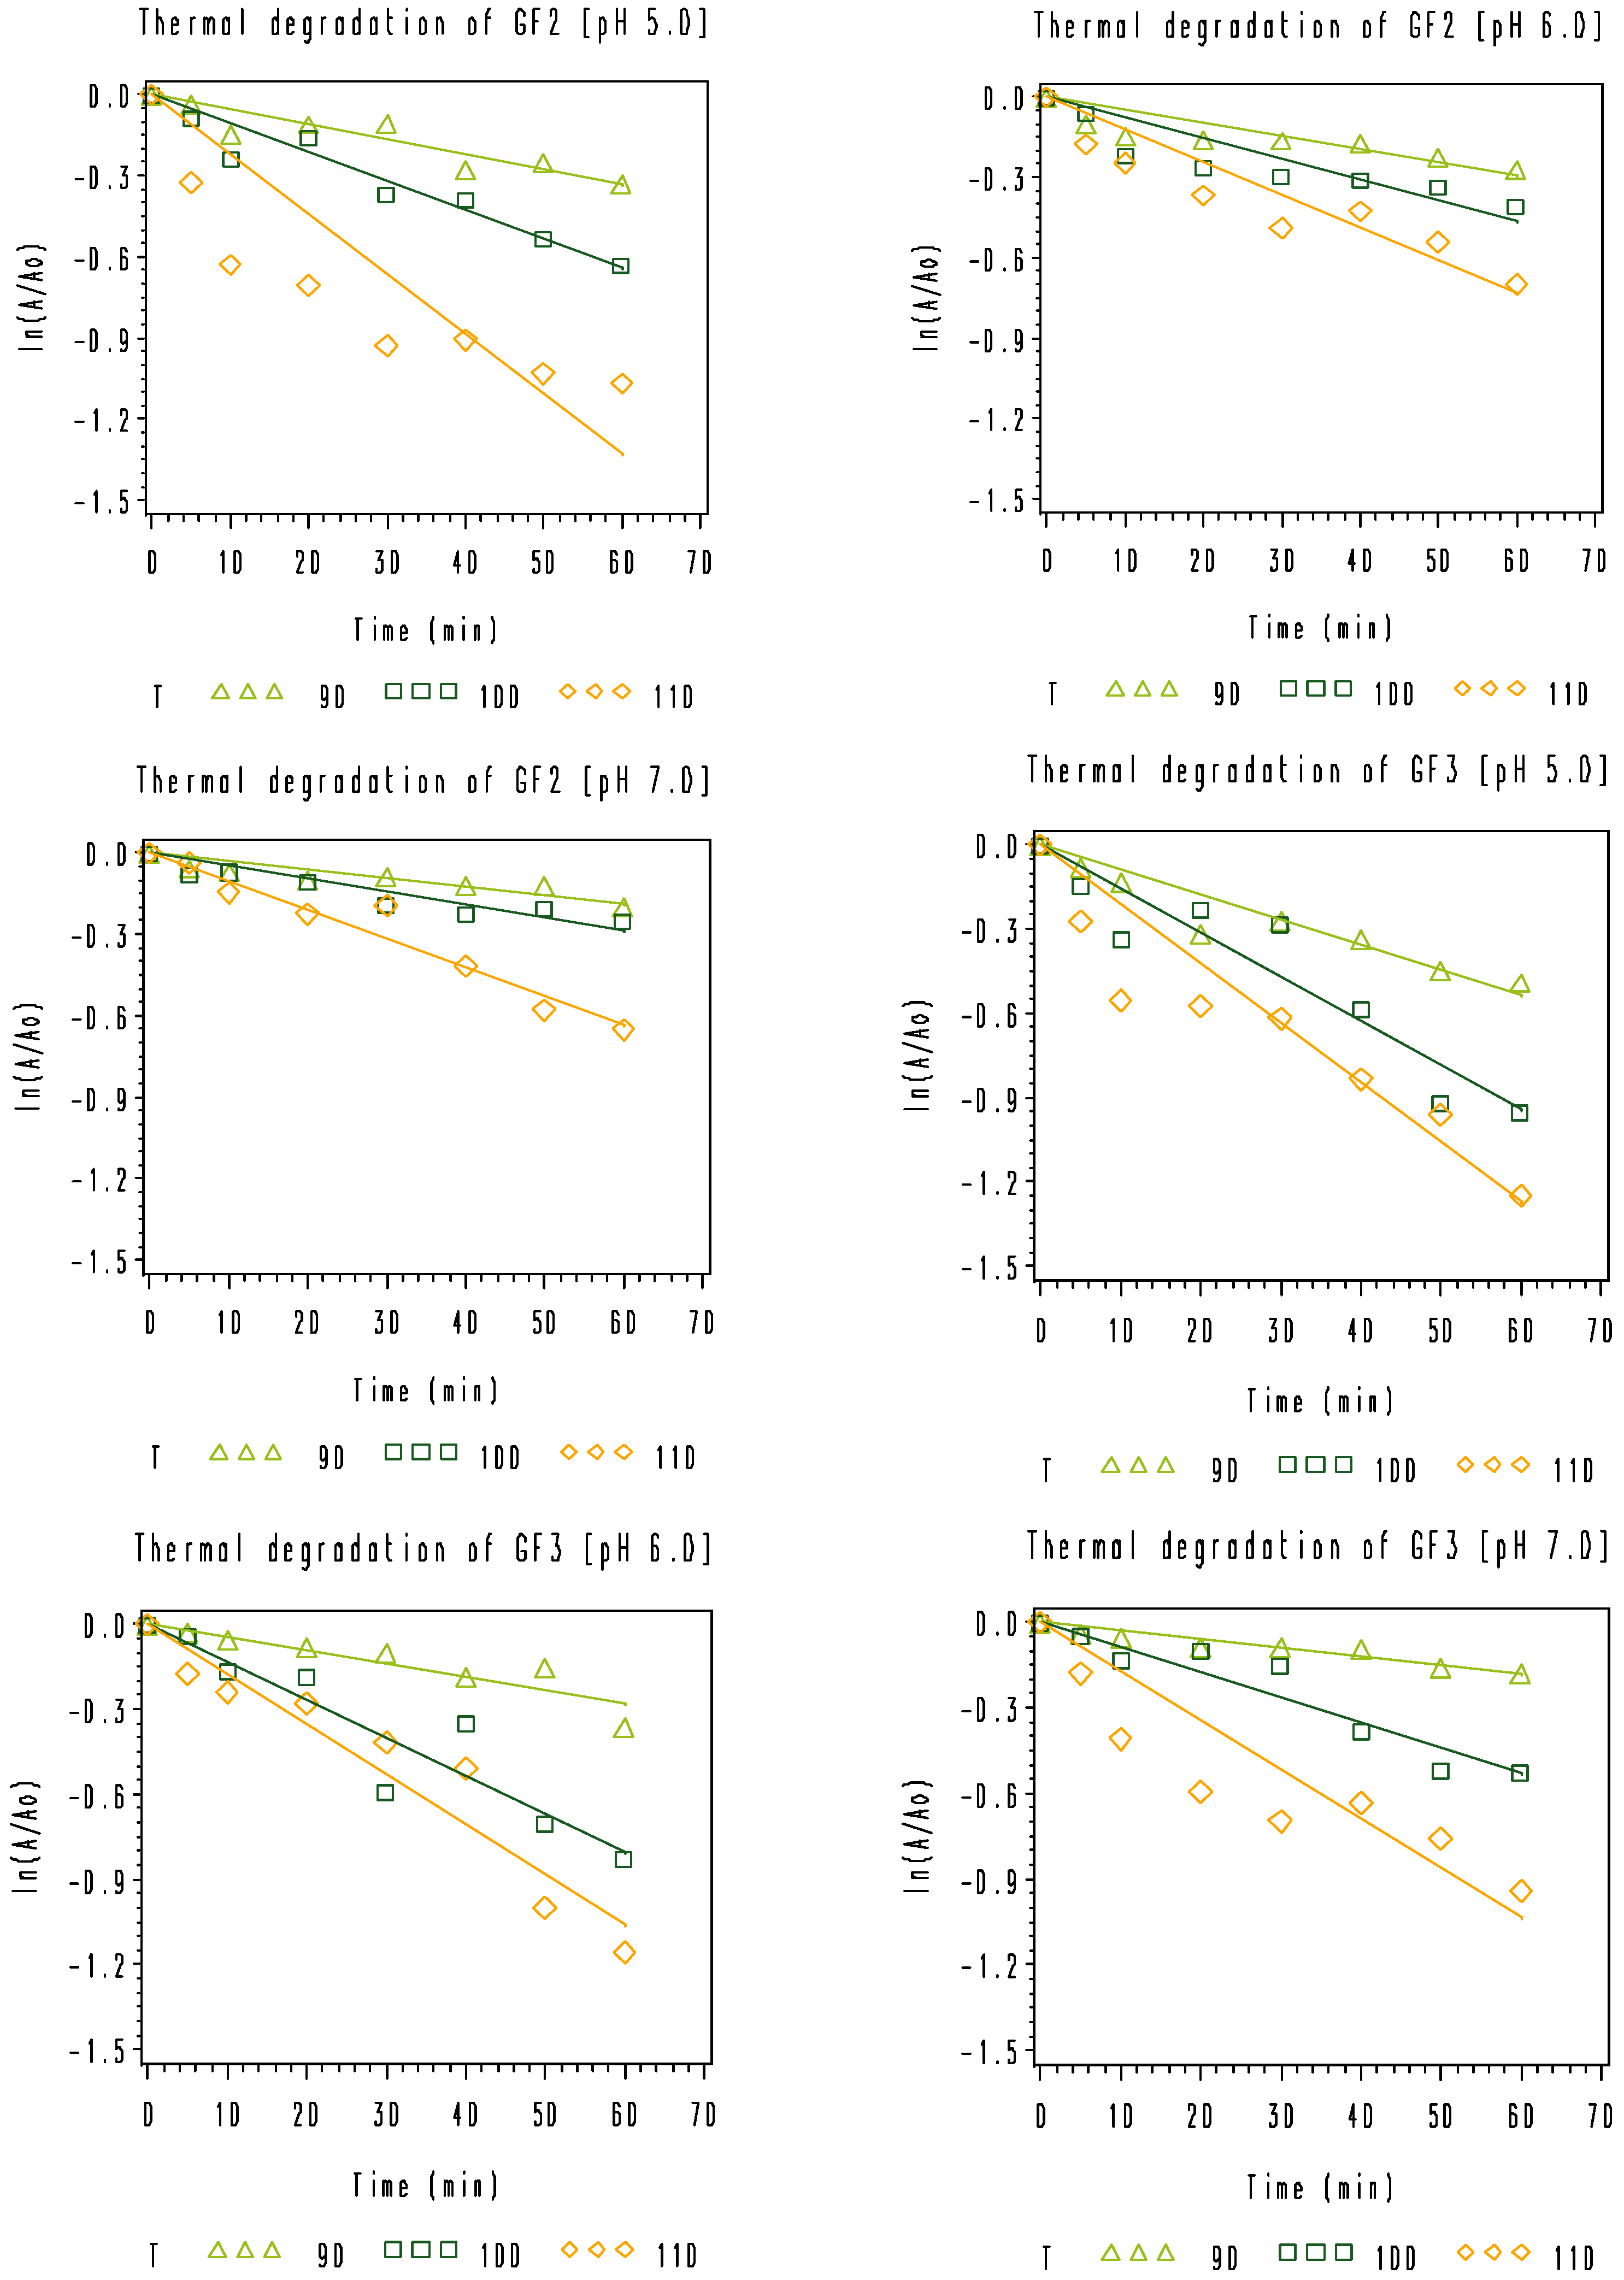
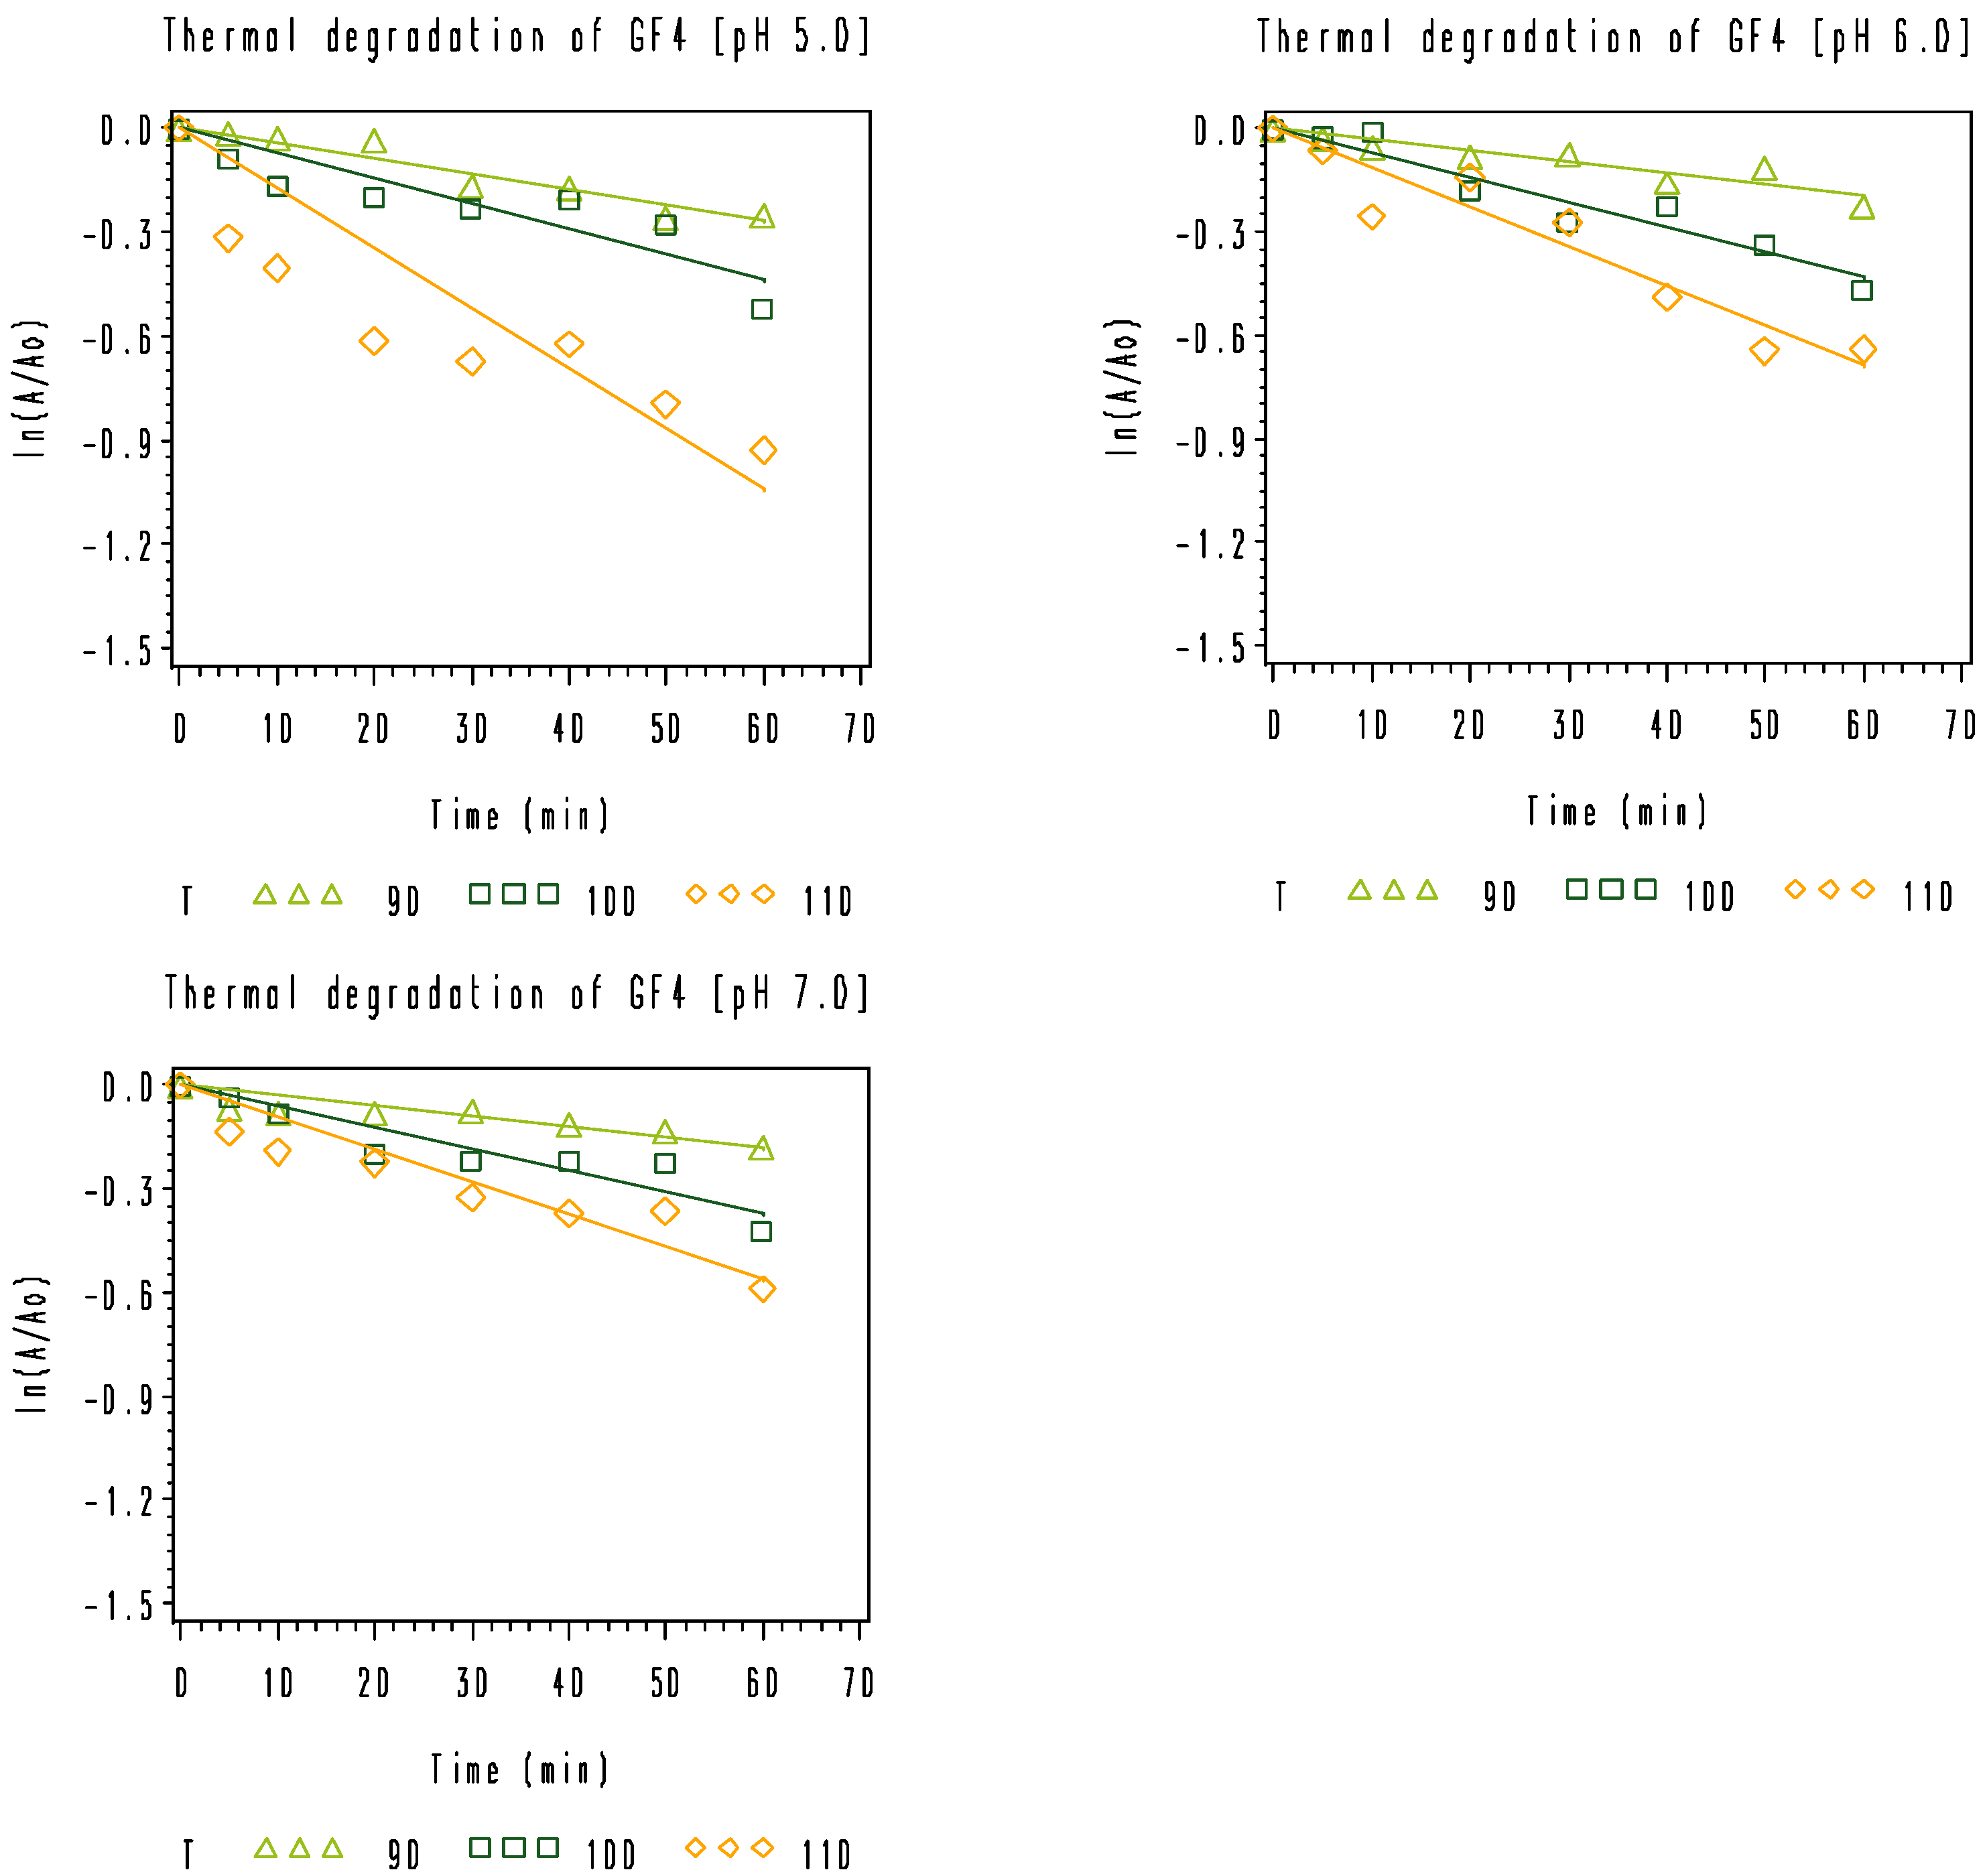
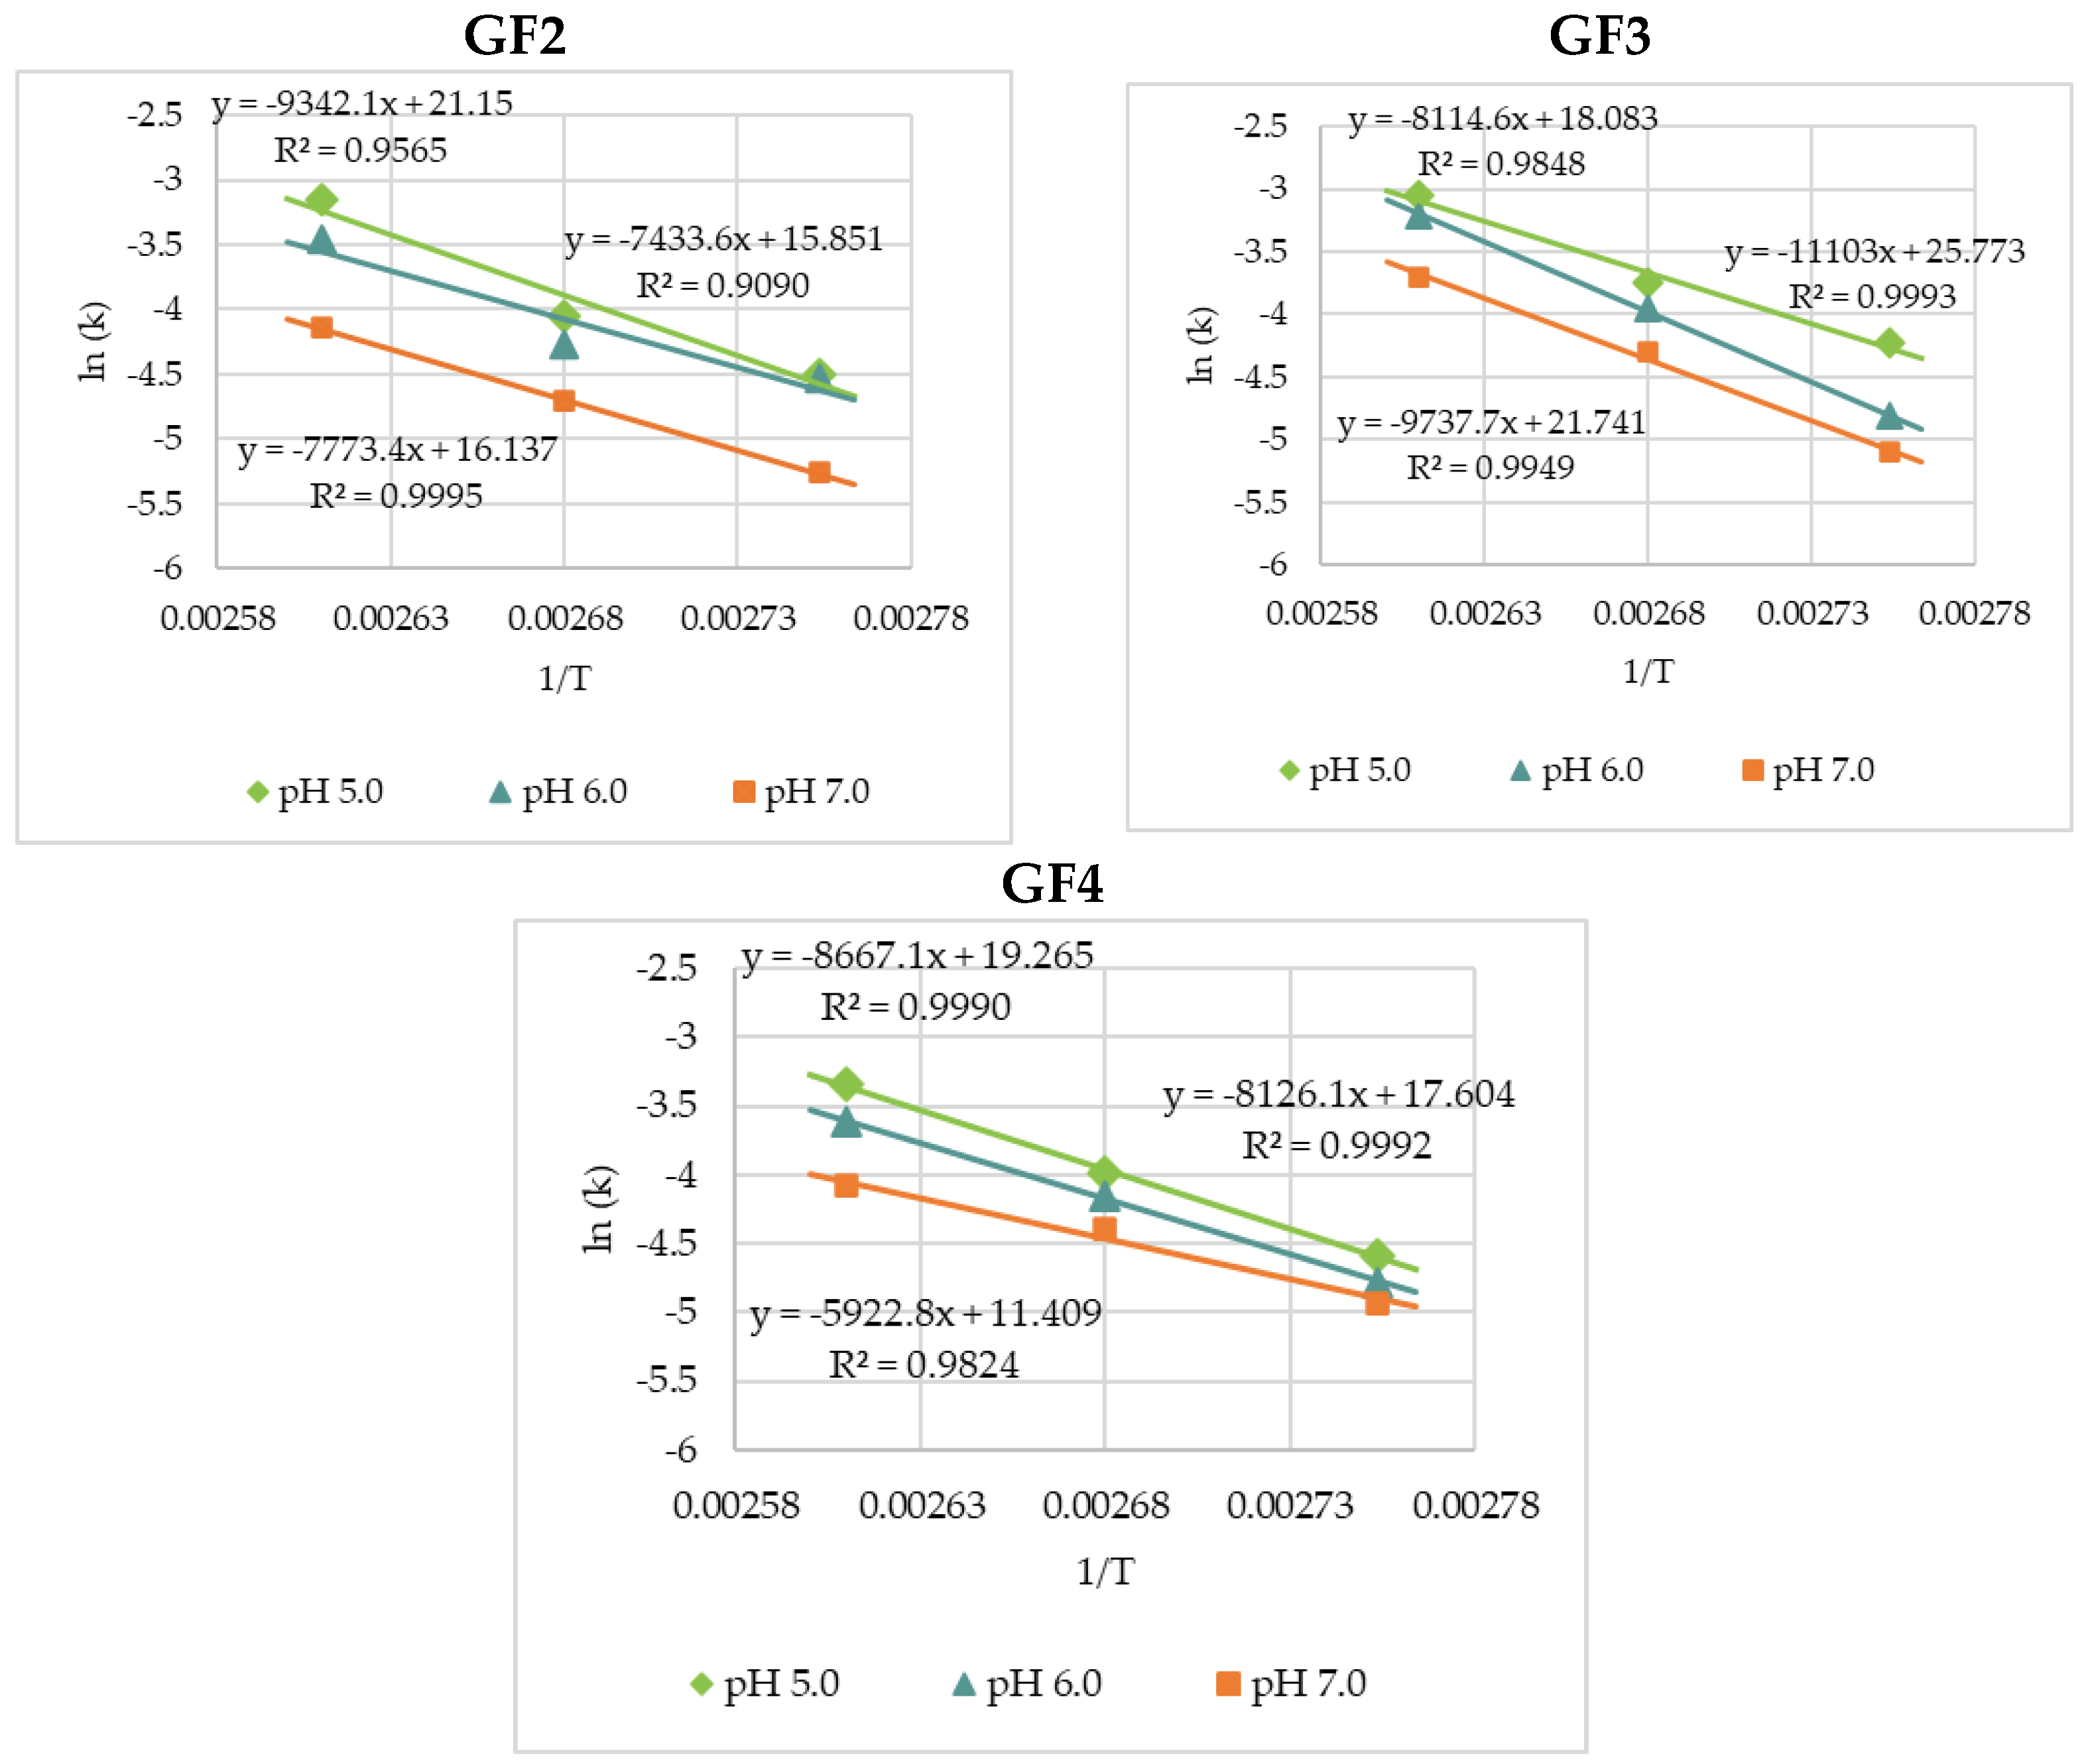
3.2. Thermal Degradation Kinetics of the Rice Bran FOS at Different pH Values
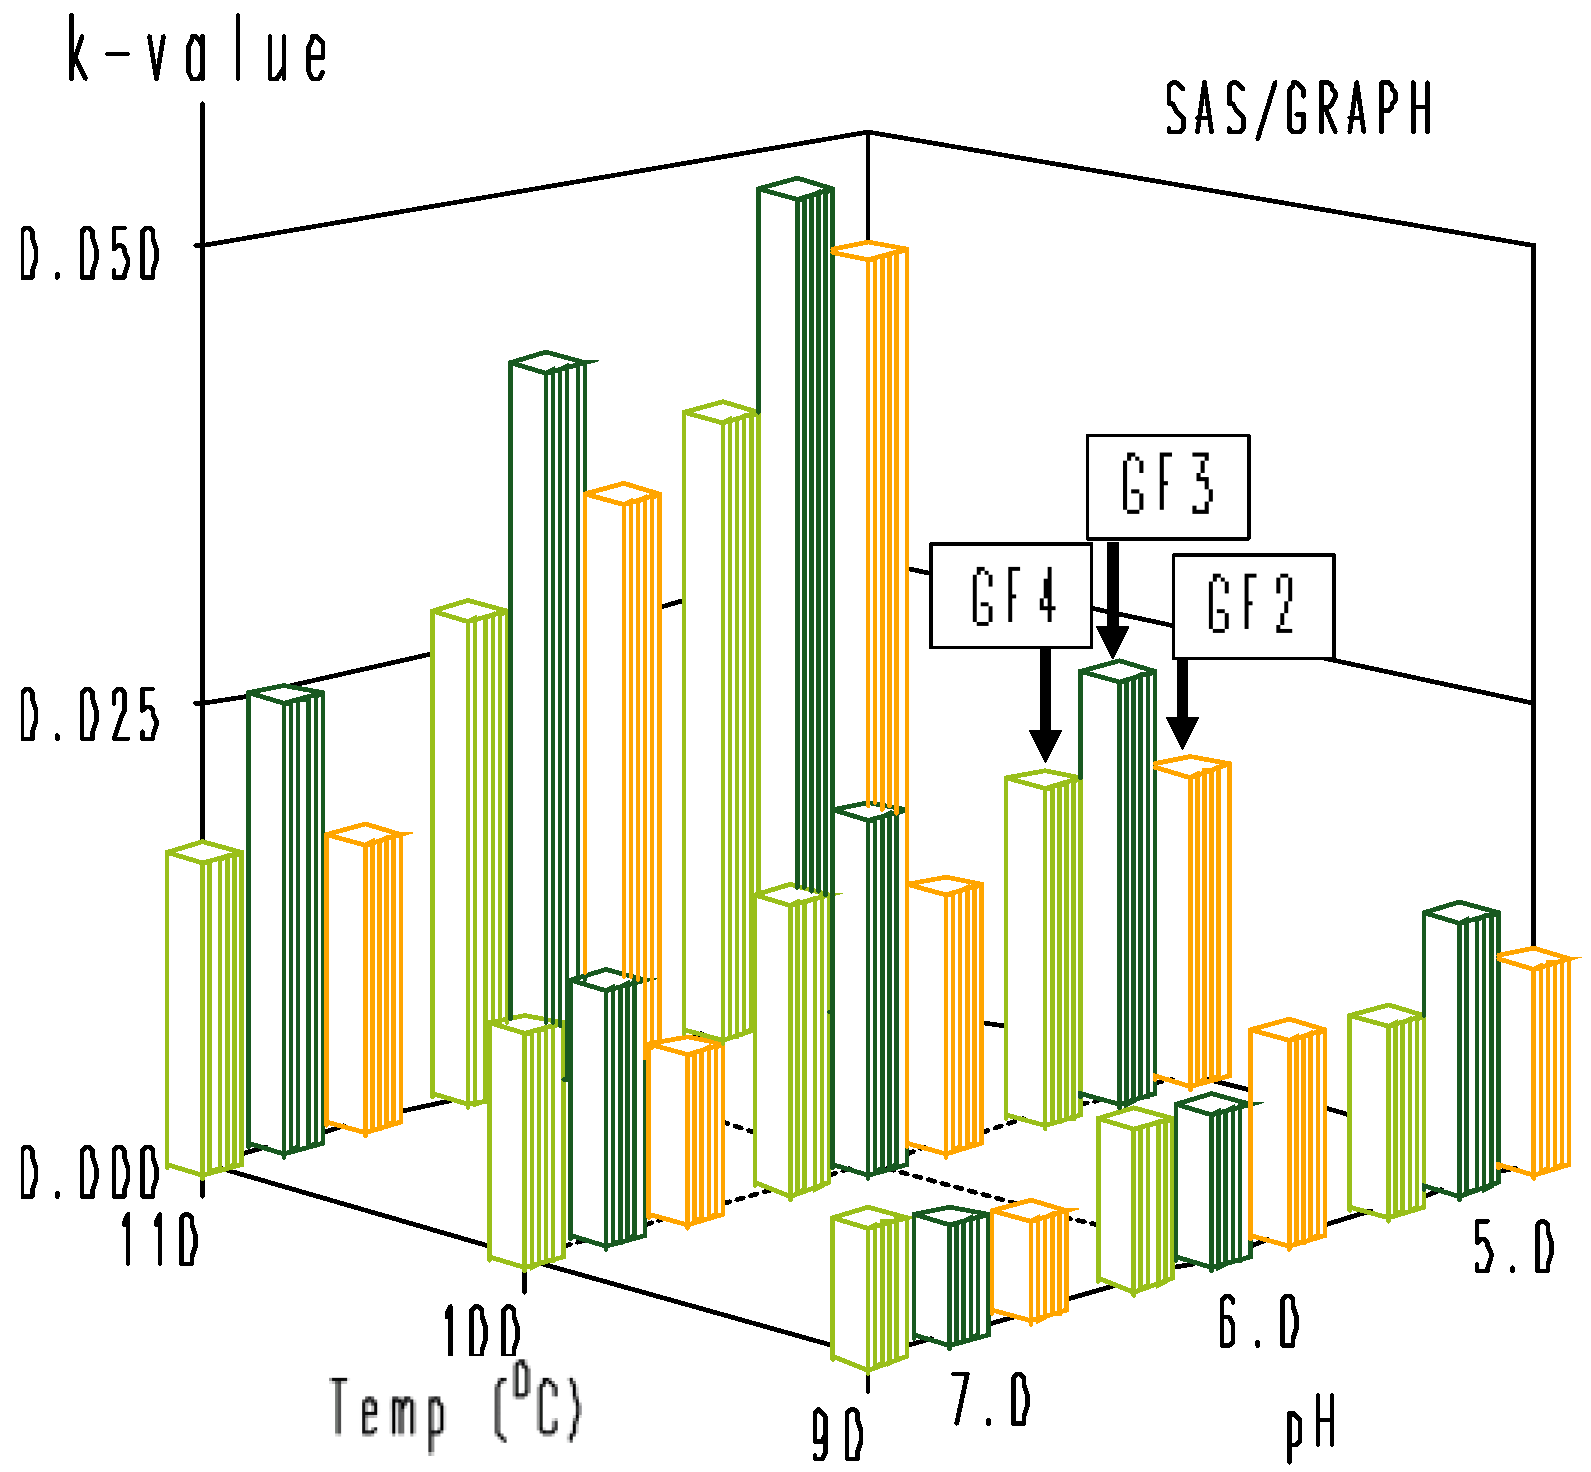
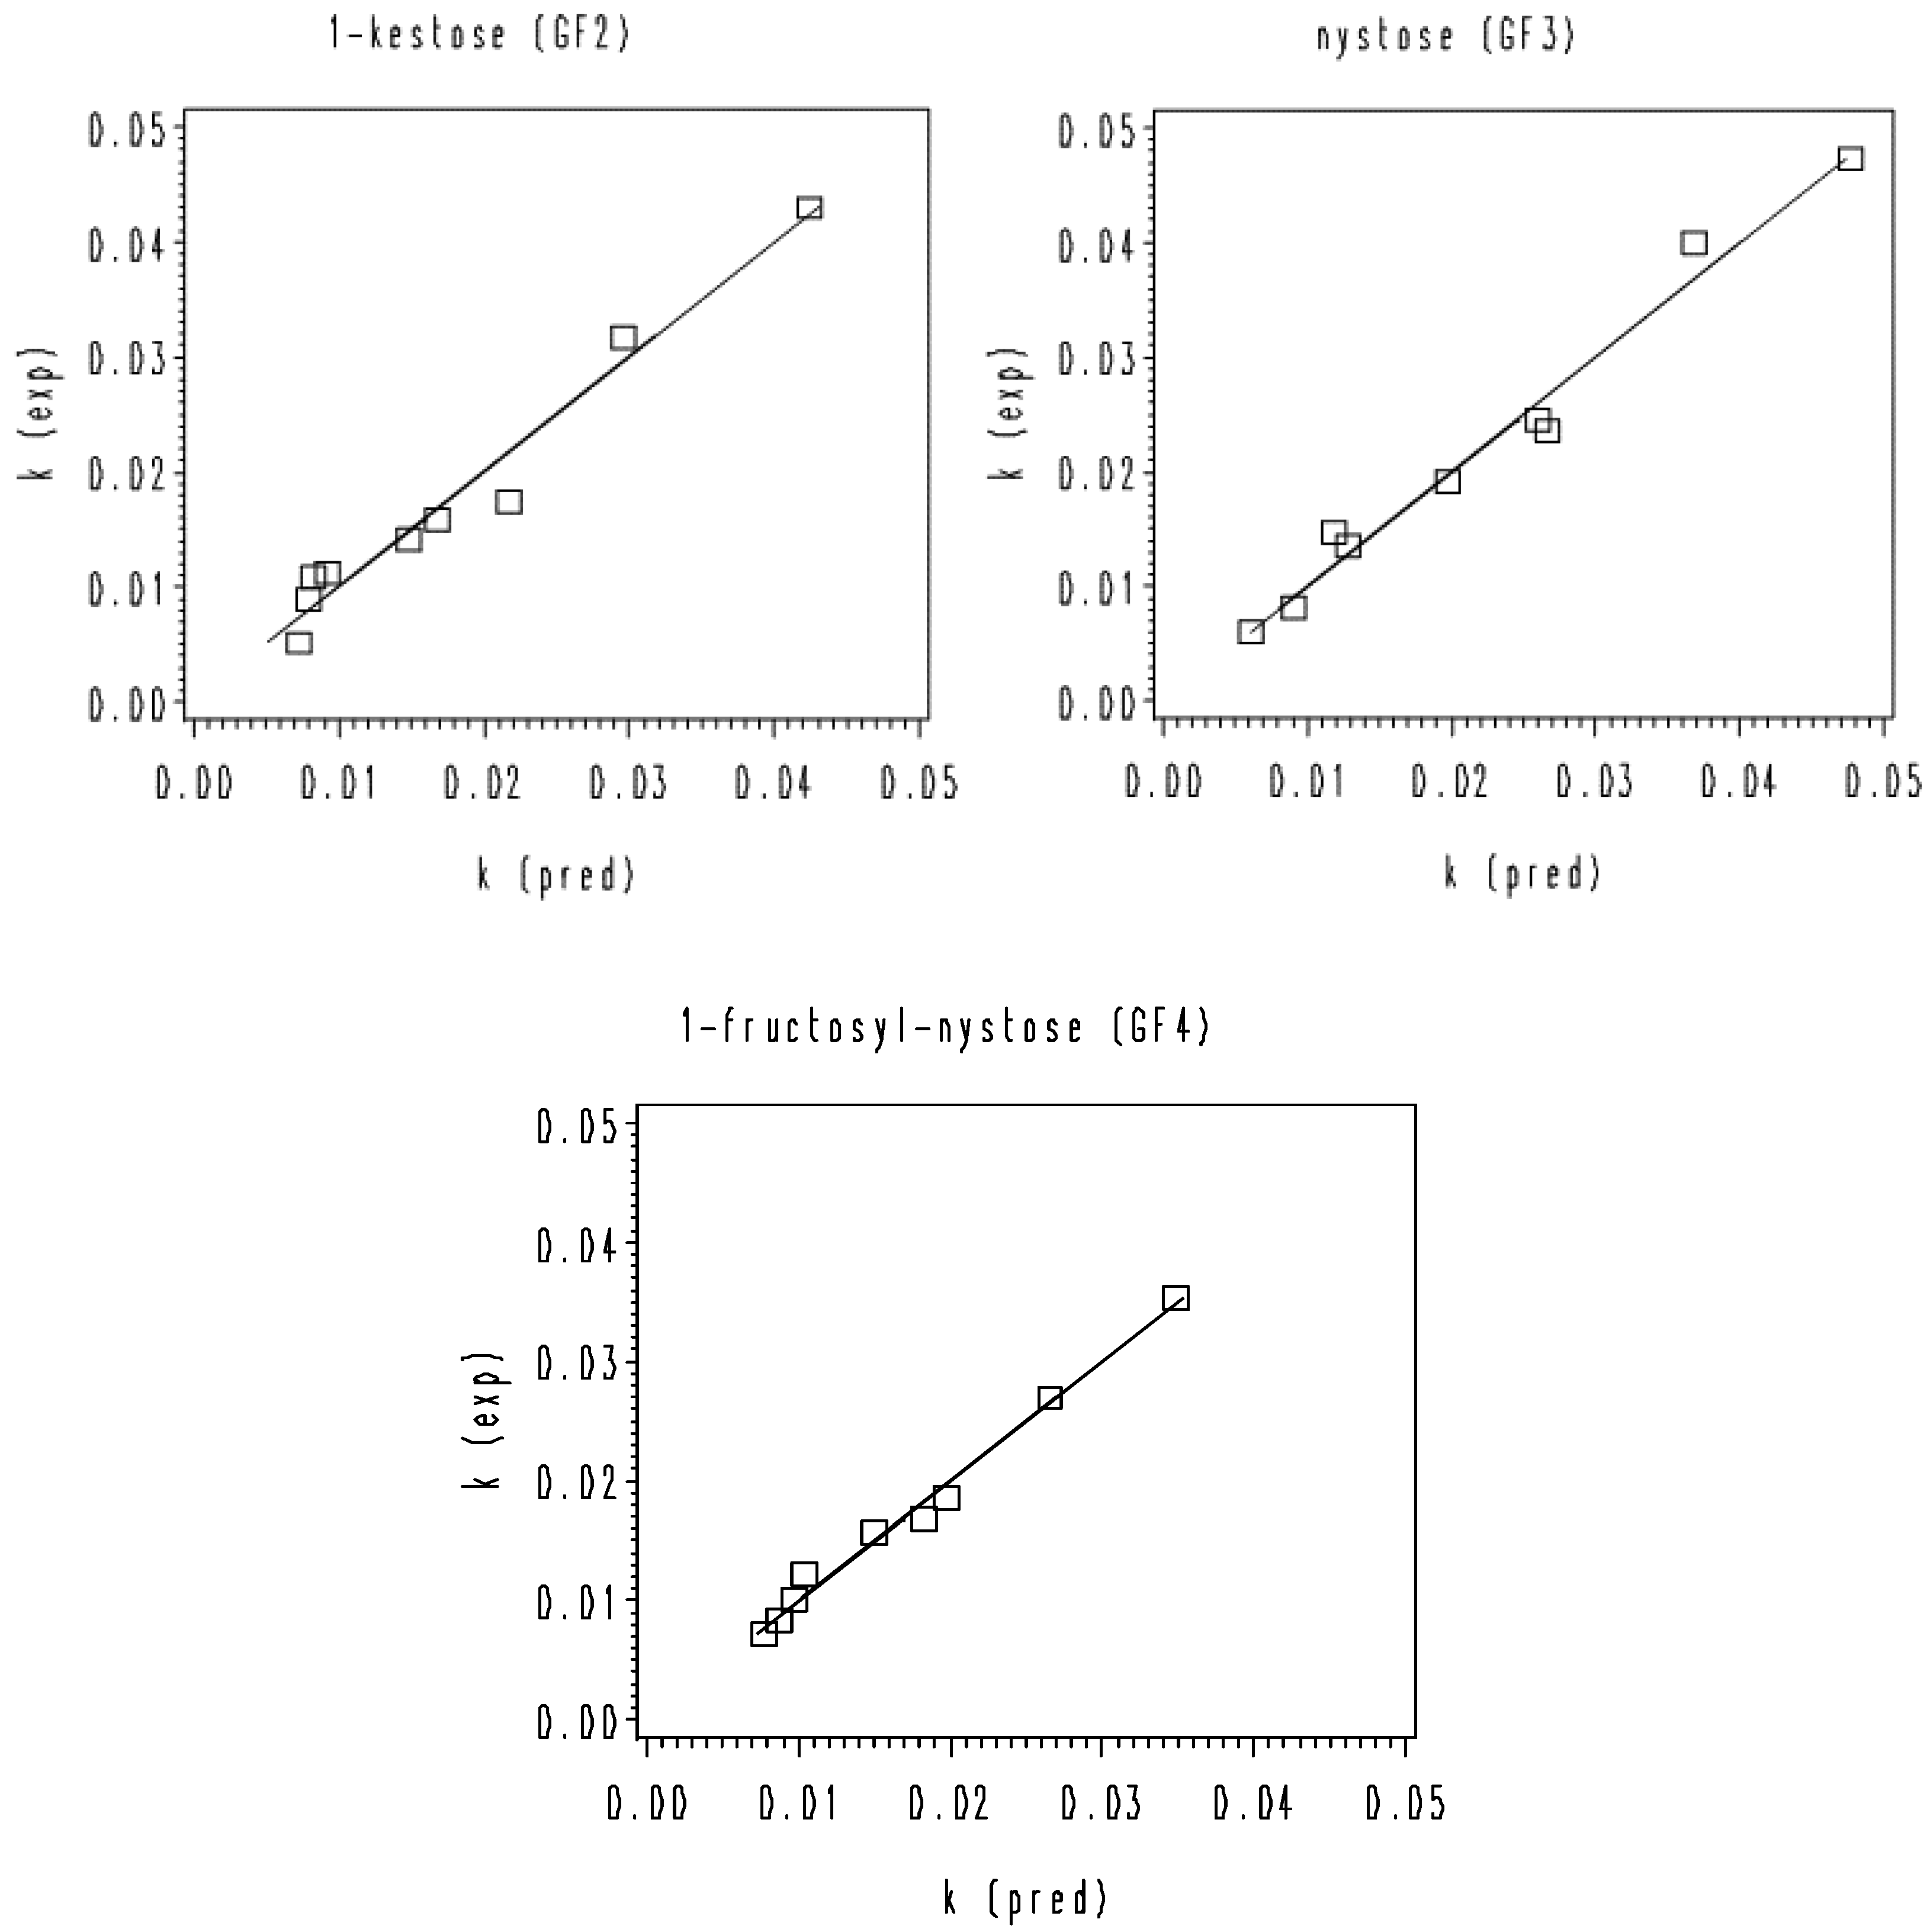
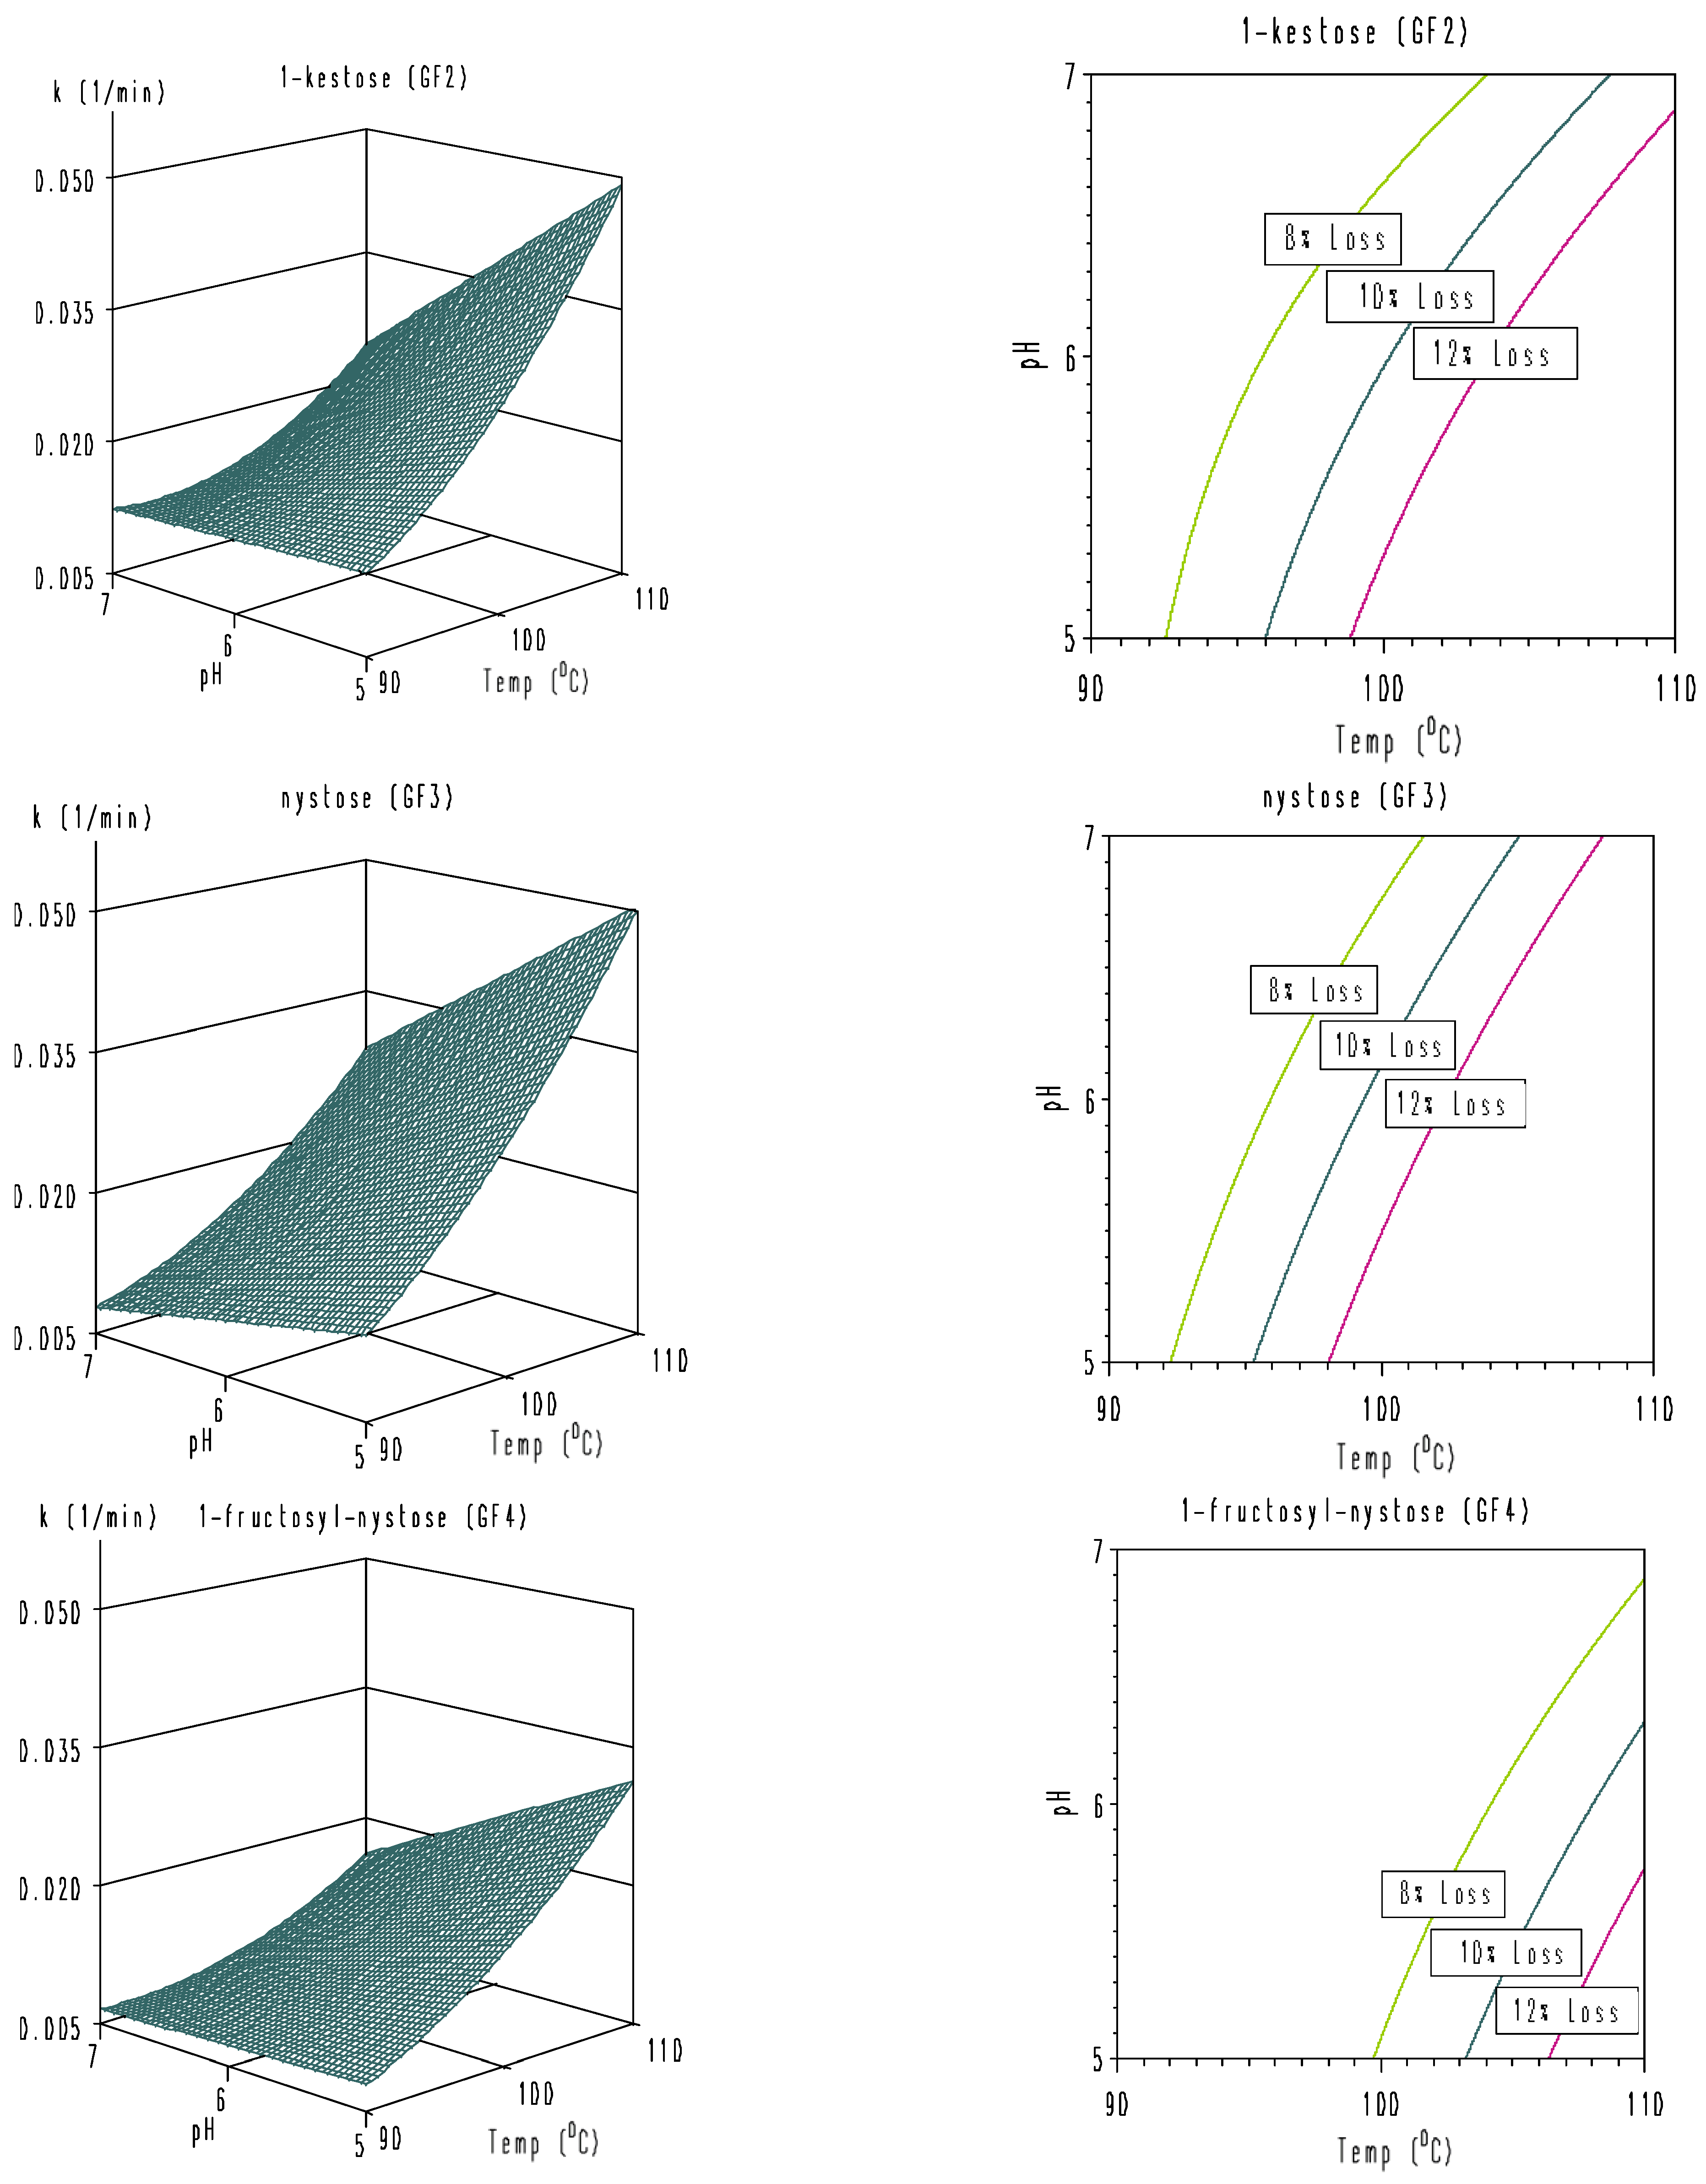
3.3. Modeling of Combined Temperature and pH Dependence of Degradation Rate Constants
4. Conclusions
Author Contributions
Funding
Institutional Review Board Statement
Informed Consent Statement
Data Availability Statement
Conflicts of Interest
References
- Campbell, J.M.; Bauer, L.L.; Fahey, G.C.; Hogarth, A.J.C.L.; Wolf, B.W.; Hunter, D.E. Selected fructooligosaccharide (1-kestose, nystose, and 1F-β-fructofuranosylnystose) composition of foods and feeds. J. Agric. Food Chem. 1997, 45, 3076–3082. [Google Scholar] [CrossRef]
- L’homme, C.; Arbelot, M.; Puigserver, A.; Biagini, A. Kinetics of hydrolysis of fructooligosaccharides in mineral-buffered aqueous solutions: influence of pH and temperature. J. Agric. Food Chem. 2003, 51, 224–228. [Google Scholar] [CrossRef] [PubMed]
- Sabater-Molina, M.; Larqué, E.; Torrella, F.; Zamora, S. Dietary fructooligosaccharides and potential benefits on health. J. Physiol. Biochem. 2009, 65, 315–328. [Google Scholar] [CrossRef] [PubMed]
- Bibas Bonet, M.E.; Meson, O.; de Moreno de LeBlanc, A.; Dogi, C.A.; Chaves, S.; Kortsarz, A.; Grau, A.; Perdigón, G. Prebiotic effect of yacon (Smallanthus sonchifolius) on intestinal mucosa using a mouse model. Food Agric. Immunol. 2010, 21, 175–189. [Google Scholar] [CrossRef] [Green Version]
- Sivieri, K.; Morales, M.V.; Saad, S.M.I.; Adorno, M.A.; Sakamoto, I.K.; Rossi, E.A. Prebiotic effect of fructooligosaccharide in the simulator of the human intestinal microbial ecosystem (SHIME model). J. Med. Food. 2014, 17, 894–901. [Google Scholar] [CrossRef]
- Gibson, G.R. Dietary modulation of the human gut microflora using prebiotics. Br. J. Nutr. 1998, 4, S209–S212. [Google Scholar] [CrossRef] [Green Version]
- Sun, Y.; O’Riordan, M.X.D. Regulation of bacterial pathogenesis by intestinal short-chain fatty acids. Adv. Appl. Microbiol. 2013, 85, 93–118. [Google Scholar] [CrossRef] [Green Version]
- Whelan, K. Mechanisms and effectiveness of prebiotics in modifying the gastrointestinal microbiota for the management of digestive disorders. Proc. Nutr. Soc. 2013, 72, 288–298. [Google Scholar] [CrossRef] [Green Version]
- Hidaka, H.; Hirayama, M.; Sumi, N. A fructooligosaccharide-producing enzyme from Aspergillus niger ATCC 20611. Agric. Biol. Chem. 1988, 52, 1181–1187. [Google Scholar] [CrossRef] [Green Version]
- Buddington, R.K.; Williams, C.H.; Chen, S.C.; Witherly, S.A. Dietary supplement of neosugar alters the fecal flora and decreases activities of some reductive enzymes in human subjects. Am. J. Clin. Nutr. 1996, 63, 709–716. [Google Scholar] [CrossRef] [Green Version]
- Sghir, A.; Chow, J.M.; Mackie, R.I. Continuous culture selection of bifidobacteria and lactobacilli from human faecal samples using fructooligosaccharide as selective substrate. J. Appl. Microbiol. 1998, 85, 769–777. [Google Scholar] [CrossRef] [PubMed]
- Dominguez, A.L.; Rodrigues, L.R.; Lima, N.M.; Teixeira, J.A. An overview of the recent developments on fructooligosaccharide production and applications. Food Bioproc. Tech. 2014, 7, 324–337. [Google Scholar] [CrossRef] [Green Version]
- Tungland, B.C.; Meyer, D. Nondigestible oligo- and polysaccharides (dietary fiber): Their physiology and role in human health and food. Compr. Rev. Food Sci. Food Saf. 2002, 1, 90–109. [Google Scholar] [CrossRef] [PubMed]
- Viuda-Martos, M.; López-Marcos, M.C.; Fernández-López, J.; Sendra, E.; López-Vargas, J.H.; Pérez-Álvarez, J.A. Role of fiber in cardiovascular diseases: A review. Compr. Rev. Food Sci Food Saf. 2010, 9, 240–258. [Google Scholar] [CrossRef]
- Seal, C.J.; Courtin, C.M.; Venema, K.; Vries, J.d. Health benefits of whole grain: Effects on dietary carbohydrate quality, the gut microbiome, and consequences of processing. Compr. Rev. Food Sci. Food Saf. 2021, 20, 2742–2768. [Google Scholar] [CrossRef]
- Caetano, B.F.R.; De Moura, N.A.; Almeida, A.P.S.; Dias, M.C.; Sivieri, K.; Barbisan, L.F. Yacon (Smallanthus sonchifolius) as a food supplement: Health-promoting benefits of fructooligosaccharides. Nutrients 2016, 8, 436. [Google Scholar] [CrossRef] [Green Version]
- Fung, T.C.; Olson, C.A.; Hsiao, E.Y. Interactions between the microbiota, immune and nervous systems in health and disease. Nat. Neurosci. 2017, 20, 145–155. [Google Scholar] [CrossRef]
- Stilling, R.M.; van de Wouw, M.; Clarke, G.; Stanton, C.; Dinan, T.G.; Cryan, J.F. The neuropharmacology of butyrate: The bread and butter of the microbiota-gut-brain axis? Neurochem Int. 2016, 99, 110–132. [Google Scholar] [CrossRef]
- Dalile, B.; Van Oudenhove, L.; Vervliet, B.; Verbeke, K. The role of short-chain fatty acids in microbiota–gut–brain communication. Nat. Rev. Gastroenterol Hepatol. 2019, 16, 461–478. [Google Scholar] [CrossRef]
- Borre, Y.E.; O’Keeffe, G.W.; Clarke, G.; Stanton, C.; Dinan, T.G.; Cryan, J.F. Microbiota and neurodevelopmental windows: Implications for brain disorders. Trends Mol. Med. 2014, 20, 509–518. [Google Scholar] [CrossRef]
- Zhang, L.; Wang, Y.; Xiayu, X.; Shi, C.; Chen, W.; Song, N.; Fu, X.; Zhou, R.; Xu, Y.-F.; Huang, L.; et al. Altered gut microbiota in a mouse model of Alzheimer’s disease. J. Alzheimer’s Dis. 2017, 60, 1241–1257. [Google Scholar] [CrossRef]
- Deng, F.L.; Pan, J.X.; Zheng, P.; Xia, J.J.; Yin, B.M.; Liang, W.W.; Li, Y.F.; Wu, J.; Xu, F.; Wu, Q.Y.; et al. Metabonomics reveals peripheral and central shortchain fatty acid and amino acid dysfunction in a naturally occurring depressive model of macaques. Neuropsychiatr. Dis. Treat. 2019, 15, 1077–1088. [Google Scholar] [CrossRef] [Green Version]
- Sharon, G.; Cruz, N.J.; Kang, D.W.; Gandal, M.J.; Wang, B.; Kim, Y.M.; Zink, E.M.; Casey, C.P.; Taylor, B.C.; Lane, C.J.; et al. Human gut microbiota from autism spectrum disorder promote behavioral symptoms in mice. Cell. 2019, 177, 1600–1618.E17. [Google Scholar] [CrossRef] [PubMed] [Green Version]
- Dinan, T.G.; Cryan, J.F. Microbes, immunity, and behavior: Psychoneuroimmunology meets the microbiome. Neuropsychopharmacology 2017, 42, 178–192. [Google Scholar] [CrossRef] [PubMed] [Green Version]
- Silva, Y.P.; Bernardi, A.; Frozza, R.L. The role of short-chain fatty acids from gut microbiota in gut-brain communication. Front. Endocrinol. 2020, 11, 25. [Google Scholar] [CrossRef] [Green Version]
- Quan, N.V.; Thien, D.D.; Khanh, T.D.; Tran, H.D.; Xuan, T.D. Momilactones A, B, and tricin in rice grain and by-products are potential skin aging inhibitors. Foods 2019, 8, 602. [Google Scholar] [CrossRef] [PubMed] [Green Version]
- Blecker, C.; Fougnies, C.; Van Herk, J.C.; Chevalier, J.P.; Paquot, M. Kinetic study of the acid hydrolysis of various oligofructose samples. J. Agric. Food Chem. 2002, 50, 1602–1607. [Google Scholar] [CrossRef]
- Courtin, C.M.; Swennen, K.; Verjans, P.; Delcour, J.A. Heat and pH stability of prebiotic arabinoxylooligosaccharides, xylooligosaccharides and fructooligosaccharides. Food Chem. 2009, 112, 831–837. [Google Scholar] [CrossRef]
- Patindol, J.; Wang, L.; Wang, Y.J. Cellulase-assisted extraction of oligosaccharides from defatted rice bran. J. Food Sci. 2007, 72, C516–C521. [Google Scholar] [CrossRef]
- Prošek, M.; Simonovska, B.; Golc-Wondra, A.; Vovk, I.; Andrenšek, S.; Mičović, E.; Golob, T. Use of HPTLC for quantitative evaluation of inulin in food products. JPC-J. Planar Chromat. 2003, 16, 58–62. [Google Scholar] [CrossRef]
- Ly-Nguyen, B.; Van Loey, A.M.; Smout, C.; Verlent, I.; Duvetter, T.; Hendrickx, M.E. Effect of mild–heat and high–pressure processing on banana pectin methylesterase: A kinetic study. J. Agric. Food Chem. 2003, 51, 7974–7979. [Google Scholar] [CrossRef]
- Ly-Nguyen, B.; Van Loey, A.M.; Smout, C.; Eren Özcan, S.; Fachin, D.; Verlent, I.; Vu Truong, S.; Duvetter, T.; Hendrickx, M.E. Mild–heat and high–pressure inactivation of carrot pectin methylesterase: A kinetic study. J. Food Sci. 2003, 68, 1377–1383. [Google Scholar] [CrossRef]
- Fachin, D.; Van Loey, A.M.; Ly Nguyen, B.; Verlent, I.; Indrawati; Hendrickx, M.E. Inactivation kinetics of polygalacturonase in tomato juice. Innov. Food Sci. Emerg. Technol. 2003, 4, 135–142. [Google Scholar] [CrossRef]
- Valdramidis, V.P.; Geeraerd, A.H.; Poschet, F.; Ly-Nguyen, B.; Van Opstal, I.; Van Loey, A.M.; Michiels, C.W.; Hendrickx, M.E.; Van Impe, J.F. Model based process design of the combined high pressure and mild heat treatment ensuring safety and quality of a carrot simulant system. J. Food Eng. 2007, 78, 1010–1021. [Google Scholar] [CrossRef]
- Van Loey, A.M.; Ludikhuyze, L.R.; Hendrickx, M.E. Pressure-temperature inactivation of lipoxygenase in green peas (Pisum sativum): A kinetic study. J. Food Sci. 2001, 6, 686–693. [Google Scholar] [CrossRef]


 ), 100 °C (
  ), and 110 °C (◇).
), 100 °C ( ), and 110 °C (◇).
), and 110 °C (◇).
), 100 °C ( ), and 110 °C (◇).


| No | Time (Min) | Flow Rate (mL/min) | % Acetonitril (Mobile Phase A) | % Water for UPLC (Mobile Phase B) |
|---|---|---|---|---|
| 1 | Initial | 0.45 | 80 | 20 |
| 2 | 1.0 | 0.45 | 80 | 20 |
| 3 | 1.5 | 0.45 | 30 | 70 |
| 4 | 3.0 | 0.45 | 30 | 70 |
| 5 | 3.2 | 0.45 | 80 | 20 |
| 6 | 5.0 | 0.45 | 80 | 20 |
| Compound | Mode | Parent Ion (m/z) | Daughter Ion (m/z) | Cone Voltage (V) |
| GF2 | Negative | 503.2 | 323.0 | 40 |
| GF3 | Negative | 665.3 | 485.2 | 40 |
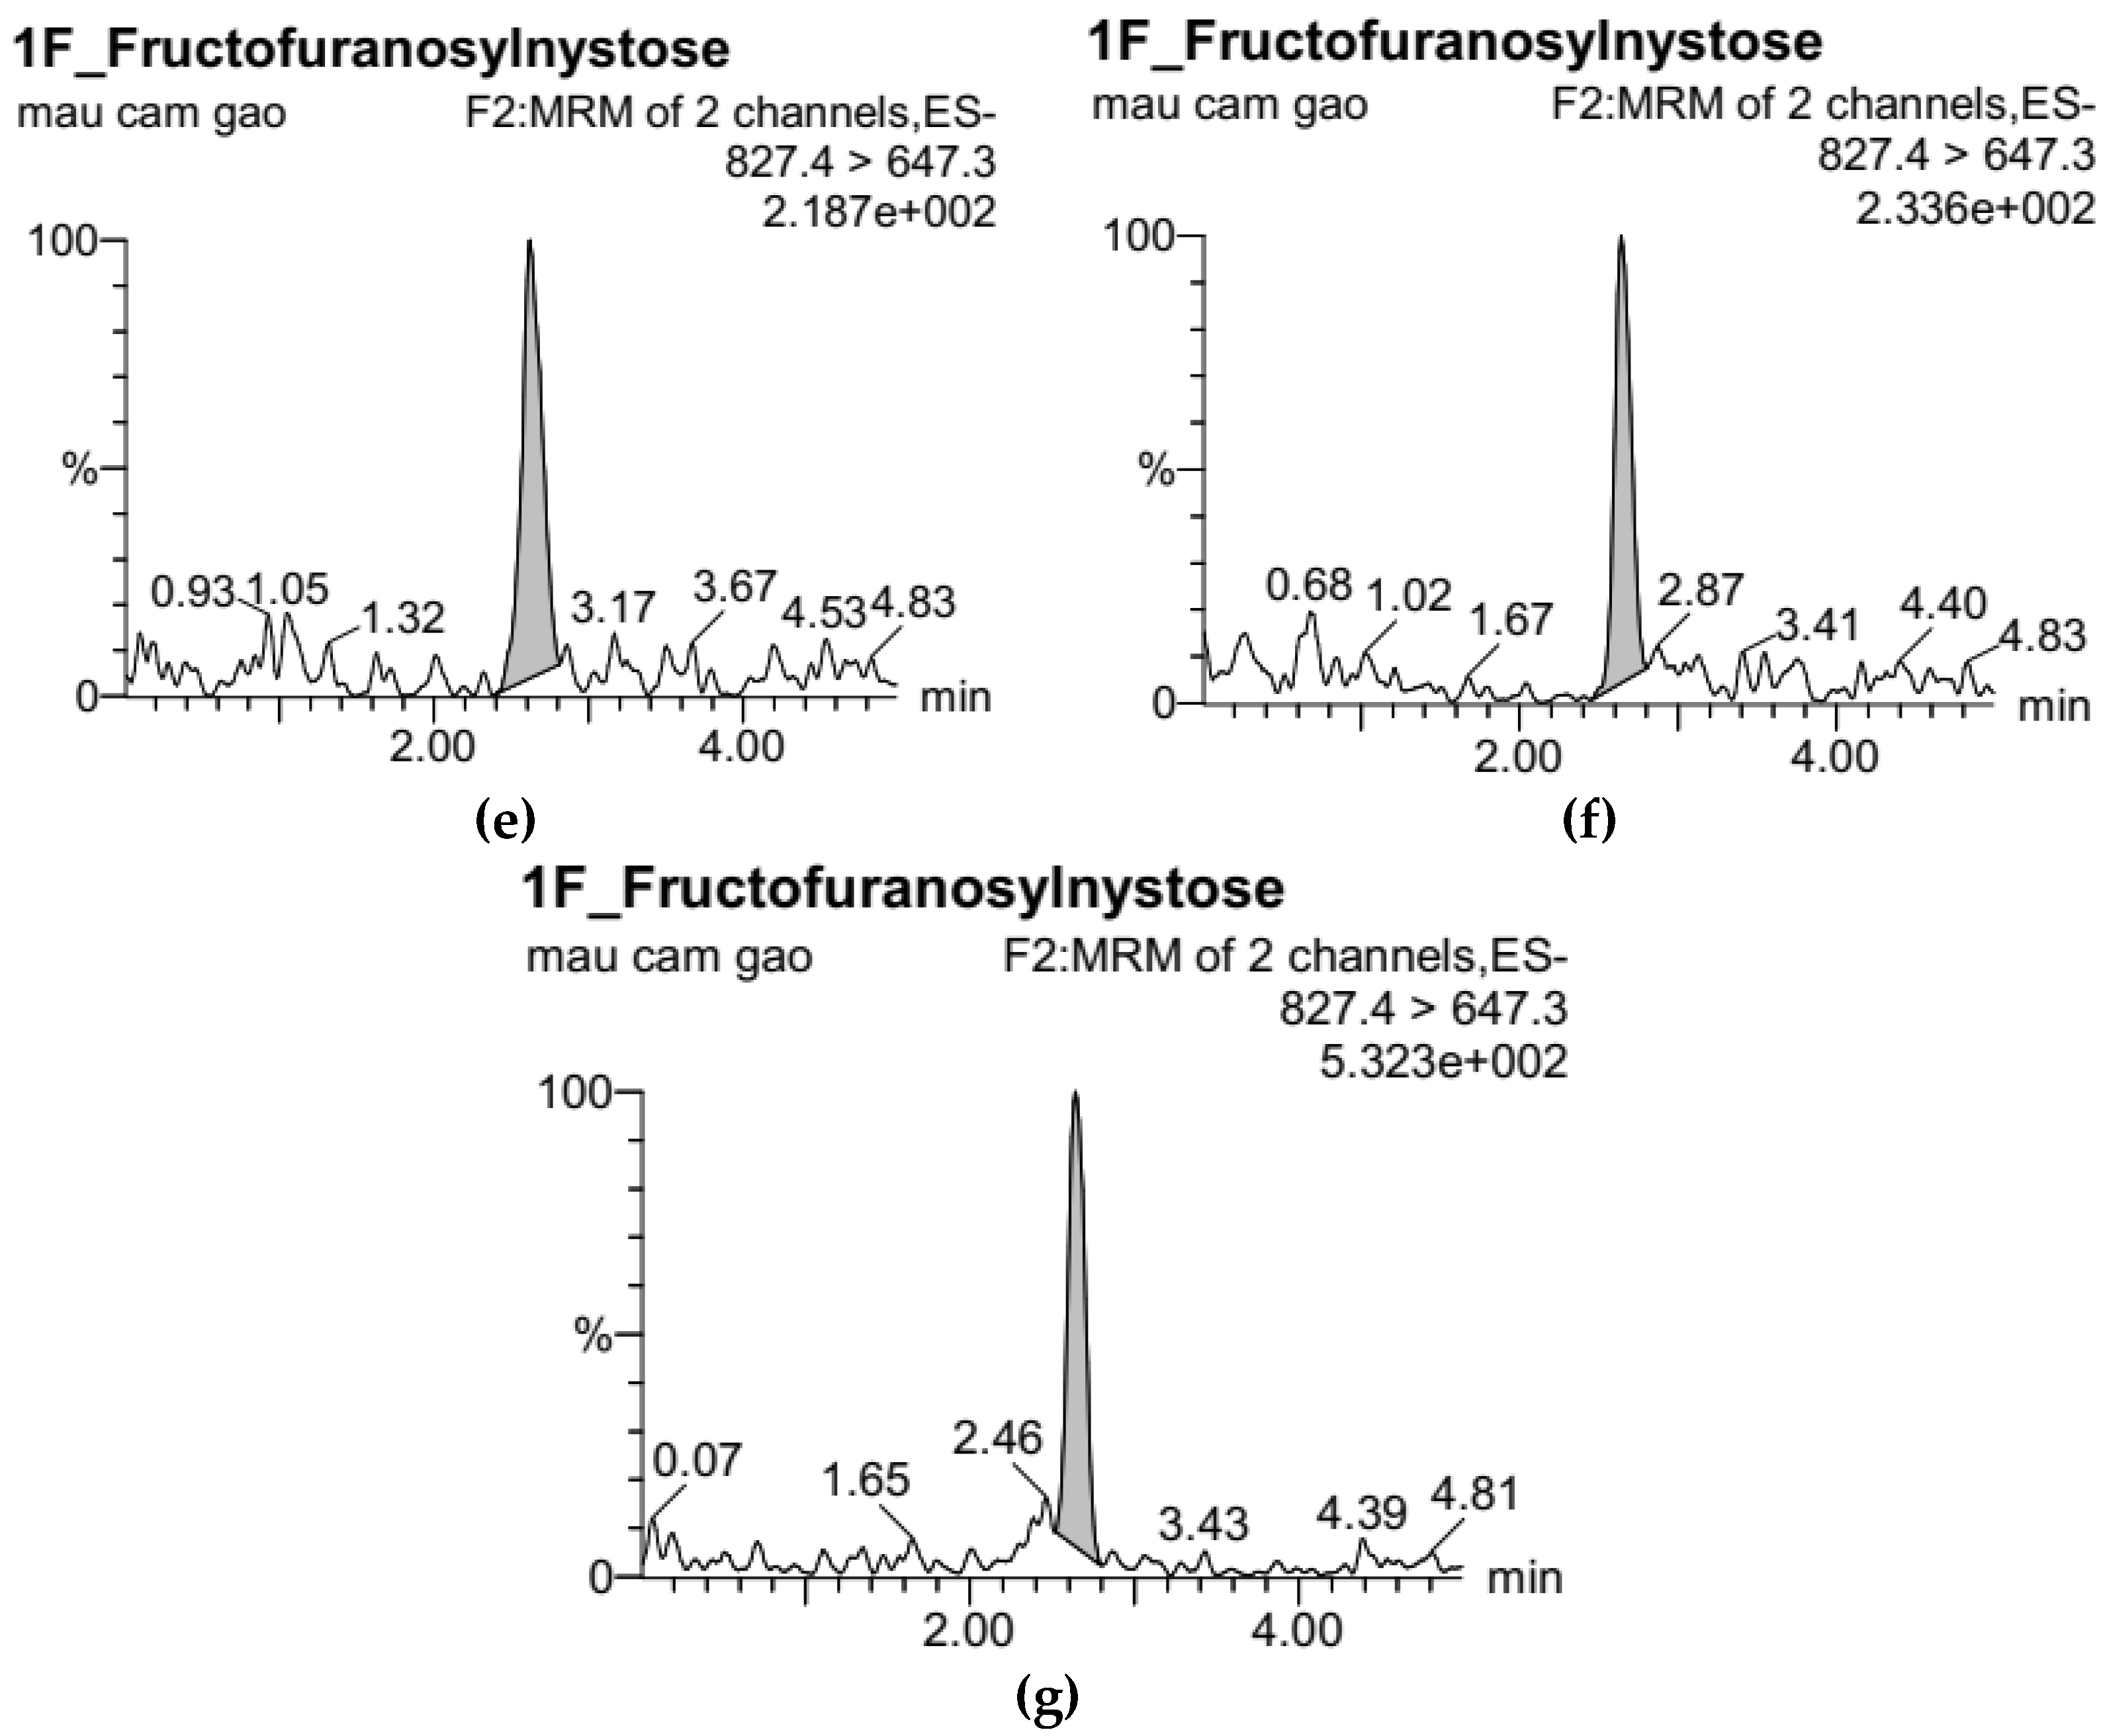
| GF4 | Negative | 827.4 | 647.3 | 40 |
| Sample | Standard GF2 Concentration (μg/L) | RT (min) | Response | GF2 Concentration Based on Standard Curve (μg/L) |
|---|---|---|---|---|
| std1 | 0 | 0.00 | 0.00 | 0.00 |
| std2 | 100 | 2.57 | 3510.45 | 98.16 |
| std3 | 200 | 2.57 | 6979.69 | 196.99 |
| std4 | 400 | 2.58 | 14,376.84 | 407.73 |
| std5 | 800 | 2.57 | 28,045.47 | 797.12 |
| Sample | Standard GF3 Concentration (μg/L) | RT (min) | Response | GF3 Concentration Based on Standard Curve (μg/L) |
|---|---|---|---|---|
| std1 | 0 | 0.00 | 0.00 | 0.00 |
| std2 | 50 | 2.60 | 999.00 | 50.78 |
| std3 | 100 | 2.61 | 1822.25 | 95.44 |
| std4 | 200 | 2.60 | 3850.36 | 205.48 |
| std5 | 400 | 2.60 | 7404.54 | 398.30 |
| Sample | Standard GF4 Concentration (μg/L) | RT (min) | Response | GF4 Concentration Based on Standard Curve (μg/L) |
|---|---|---|---|---|
| std1 | 0 | 0.00 | 0.00 | 0.00 |
| std2 | 20 | 2.63 | 160.80 | 19.46 |
| std3 | 40 | 2.64 | 351.50 | 40.93 |
| std4 | 80 | 2.63 | 694.50 | 79.54 |
| std5 | 160 | 2.63 | 1409.80 | 160.06 |
| pH | 90 °C | 100 °C | 110 °C | Ea (kJ·mol−1) | R2 | |
|---|---|---|---|---|---|---|
| GF2 | 5.0 | 0.0112 ± 0.0012 a | 0.0174 ± 0.0020 | 0.0430 ± 0.0056 | 77.7 | 0.9565 |
| 6.0 | 0.0109 ± 0.0011 | 0.0141 ± 0.0015 | 0.0318 ± 0.0031 | 61.8 | 0.9090 | |
| 7.0 | 0.0052 ± 0.0005 | 0.0090 ± 0.0008 | 0.0159 ± 0.0012 | 64.6 | 0.9995 | |
| GF3 | 5.0 | 0.0147 ± 0.0011 | 0.0236 ± 0.0020 | 0.0473 ± 0.0052 | 67.5 | 0.9848 |
| 6.0 | 0.0081 ± 0.0009 | 0.0192 ± 0.0016 | 0.0401 ± 0.0030 | 92.3 | 0.9993 | |
| 7.0 | 0.0061 ± 0.0005 | 0.0136 ± 0.0014 | 0.0246 ± 0.0026 | 81.0 | 0.9949 | |
| GF4 | 5.0 | 0.0102 ± 0.0009 | 0.0186 ± 0.0020 | 0.0353 ± 0.0041 | 72.1 | 0.9990 |
| 6.0 | 0.0084 ± 0.0006 | 0.0157 ± 0.0011 | 0.0270 ± 0.0031 | 67.6 | 0.9992 | |
| 7.0 | 0.0072 ± 0.0007 | 0.0123 ± 0.0011 | 0.0169 ± 0.0014 | 49.2 | 0.9824 |
| pH | 90 °C | 100 °C | 110 °C | |
|---|---|---|---|---|
| GF2 | 5.0 | 62.1 | 39.8 | 16.1 |
| 6.0 | 63.9 | 49.3 | 21.8 | |
| 7.0 | 133.7 | 76.9 | 43.7 | |
| GF3 | 5.0 | 47.2 | 29.4 | 14.7 |
| 6.0 | 85.2 | 36.2 | 17.3 | |
| 7.0 | 113.9 | 51.0 | 28.1 | |
| GF4 | 5.0 | 68.3 | 37.3 | 19.6 |
| 6.0 | 82.7 | 44.1 | 25.7 | |
| 7.0 | 96.2 | 56.4 | 41.1 |
| Parameter | GF2 | GF3 | GF4 |
|---|---|---|---|
| β1(X1: temp) | −0.00349 ± 0.00083 | −0.00256 ± 0.00072 | −0.00222 ± 0.00037 |
| β2(X2: pH) | 0.0523 ± 0.0133 | 0.0330 ± 0.0115 | 0.0318 ± 0.0059 |
| β11(X12: temp2) | 0.000041 ± 0.000008 | 0.000032 ± 0.000007 | 0.000026 ± 0.000003 |
| β12(X1 * X2: temp * pH) | −0.00059 ± 0.00013 | −0.00040 ± 0.00012 | −0.00036 ± 0.00006 |
| Corrected R2 | 0.984 | 0.992 | 0.995 |
| Standard Deviation (SD) | 0.0029 | 0.0025 | 0.0013 |
Publisher’s Note: MDPI stays neutral with regard to jurisdictional claims in published maps and institutional affiliations. |
© 2022 by the authors. Licensee MDPI, Basel, Switzerland. This article is an open access article distributed under the terms and conditions of the Creative Commons Attribution (CC BY) license (https://creativecommons.org/licenses/by/4.0/).
Share and Cite
Le, H.P.; Hong, D.T.N.; Nguyen, T.T.L.; Le, T.M.H.; Koseki, S.; Ho, T.B.; Ly-Nguyen, B. Thermal Stability of Fructooligosaccharides Extracted from Defatted Rice Bran: A Kinetic Study Using Liquid Chromatography-Tandem Mass Spectrometry. Foods 2022, 11, 2054. https://0-doi-org.brum.beds.ac.uk/10.3390/foods11142054
Le HP, Hong DTN, Nguyen TTL, Le TMH, Koseki S, Ho TB, Ly-Nguyen B. Thermal Stability of Fructooligosaccharides Extracted from Defatted Rice Bran: A Kinetic Study Using Liquid Chromatography-Tandem Mass Spectrometry. Foods. 2022; 11(14):2054. https://0-doi-org.brum.beds.ac.uk/10.3390/foods11142054
Chicago/Turabian StyleLe, Hoang Phuong, Diep Thanh Nghi Hong, Thi Thao Loan Nguyen, Thi My Hanh Le, Shige Koseki, Thanh Binh Ho, and Binh Ly-Nguyen. 2022. "Thermal Stability of Fructooligosaccharides Extracted from Defatted Rice Bran: A Kinetic Study Using Liquid Chromatography-Tandem Mass Spectrometry" Foods 11, no. 14: 2054. https://0-doi-org.brum.beds.ac.uk/10.3390/foods11142054