Consumer Attitudes towards Local and Organic Food with Upcycled Ingredients: An Italian Case Study for Olive Leaves


1
Faculty of Bioscience and Technology for Food, Agriculture and Environment, University of Teramo, 64100 Teramo, Italy
2
INRAE, ALISS, Université Paris-Saclay, 94205 Ivry-sur-Seine, France
3
Department of Agricultural and Food Economics, Catholic University of the Sacred Heart, 29122 Piacenza, Italy
4
Department of Economics and Law, University of Cassino and Southern Lazio, 03043 Cassino, Italy
*
Author to whom correspondence should be addressed.
Foods 2020, 9(9), 1325; https://0-doi-org.brum.beds.ac.uk/10.3390/foods9091325
Submission received: 4 September 2020
/
Revised: 12 September 2020
/
Accepted: 16 September 2020
/
Published: 20 September 2020
(This article belongs to the Special Issue Sustainability of Olive Oil System)
Abstract
:Food made with upcycled ingredients has received considerable attention in very recent years as a result of the need to both reduce waste and increase food nutritional properties. However, consumer acceptance of these novel foods is fundamental to their market uptake. This paper aims to assess the likelihood of the acceptance of food obtained from upcycled ingredients of olive oil productions and its association with some relevant recent consumption trends, such as organic food consumption and attention to food origin. In addition, particular attention is given to age group behaviors to appraise the differences between generations. Results suggest that, despite the negative influence of food technophobia, a core of sustainability-minded consumers seems to emerge that is interested in organic or local products, that could also favor the uptake of these novel food made with upcycled ingredients in the market. Results suggest that developing organic or “local” food products with upcycled ingredients can increase the probability of consumer acceptance.
1. Introduction
The olive tree is a central plant in the history of civilizations of the Mediterranean basin. It has historically been considered a sacred tree: in Genesis, the olive branch is a symbol of peace. Even in Greek Mythology, the olive branch was considered a symbol of peace and life. Ancient Romans rewarded valiant citizens with crowns of olive branches. In many cultures in the Mediterranean area, the olive branch is a symbol of justice. In addition, in the traditional culture of many Italian regions, olive leaves, as well as olive oil, have played the role of good luck against the evil eye [1]. Beyond the symbolic properties attributed to olive leaves, they have historically had a pharmacological role in Mediterranean countries and are widely used in traditional herbal medicine to prevent and treat various diseases [2,3].
This historical and anthropological excursus outlines the notion that olive leaves have almost never had a nutritional function in the tradition of Mediterranean areas, despite the importance of olive oil consumption [4,5]. The emergence of modern medicine and culture, however, has led to a loss of interest in olive leaves, and they have gradually become a processing waste for olive oil producers, with high disposal costs and no economic value.
Nevertheless, recent scientific literature has shown that olive leaves are rich in nutrients that could be used as by-products by the food industry to enrich food products with functional properties [6,7]. An essential point to understand the real market uptake of food enriched with food by-products that are not part of the traditional diet is to estimate consumer acceptance for such products, especially for food enriched with olive leaves.
Consumers consider food a complex good that contains both quality attributes as well as nutritional ones. Consumer acceptance is shaped by different factors, such as food habits and sociodemographic characteristics [8,9], food origin [5,10,11], the information that consumers access, and their trust in food production [12,13], the role of transparency [14], the range and prices of existing products [15,16,17,18,19], and the perception of health benefits and safety of food products [20,21].
In this context, the new objective of food production is no longer just food security but also the satisfaction of consumer needs and preferences with new products with both functional properties [22] and quality aspects (e.g., local, organic, etc.) [18,23]. In this context, the production of functional and nutritious food, obtained from upcycled ingredients, is a recent development [6,24,25,26,27].
Several studies referring to the use of unusual products in food production (i.e., insect products, cultured meat, etc.) report how new products can cause a strong food technophobia and neophobia in consumers [28,29,30,31,32]. Furthermore, studies on consumer acceptance of food derived from upcycled ingredients have found a negative impact of food technophobia and neophobia on the likelihood of acceptance [25,33]. However, interestingly, studies found that consumers may accord these products a premium status if promoted as a new food category akin to organic foods [34]. In fact, according to Bhatt et al. [34], consumers perceive “value-added surplus products” as having benefits for society and the individual.
The environmental sustainability of food production has become a matter of growing interest for consumers worldwide in recent years [35,36,37]. Often, environmental sustainability is understood by consumers as the preference to purchase organic food products, which are perceived as being healthier than conventional foods and better for the environment [18,38,39,40,41,42]. More recently, consumers have no longer been satisfied with the benefits offered by organic products only [43] but have been demanding domestic and local products as well [5,22,44,45,46]. In this respect, some studies suggest that consumers are interested in local food not only because they associate higher quality with these products but also for environmental friendliness, preference for their cultural roots [5,46], and support for the local economy [47] and local farmers [48].
Against this background, it seems to be of interest to analyze the possible impact of some frequent food consumption habits, such as buying organic products or giving importance to food origin in consumer acceptance of food derived from upcycled ingredients. In fact, foods obtained from upcycled ingredients of olive oil productions are new to the consumers, and their acceptance may be a problem despite their health or environmental benefits.
The main objective of the present study is to assess the association between the willingness to try food obtained from upcycled ingredients and consumer preferences for organic food and food origin. In particular, by estimating ordered probit models, we test if attributes, such as superior nutritional and/or environmental properties, of food with olive leaves are appealing to consumers. By doing so, we also investigate the possible market niches for these products.
2. Materials and Methods
To investigate the association between the willingness to try food obtained from upcycled ingredients and the preference for organic and food origin, we surveyed a sample of 852 Italian consumers. The core of our analysis was an ordered probit regression [51] of a discrete variable measuring the willingness to try food with upcycled ingredients on a set of regressors, including demographic variables, measures of consumer environmental responsibility, technophobia, and concerns for product origin.
Data were collected through a web-based survey administered in Italy between April 2018 and April 2019 with a convenience approach. Participants were reached via different social media networks, which is becoming a more popular means of reaching participants in social sciences research for both convenience and inclusion reason [52]. In fact, the use of the Internet makes it as convenient as possible for participants to take part in the survey and allows reaching a high number of participants from all Italian regions. In particular, the information was then posted on Twitter, LinkedIn, and Facebook pages. As sampling in Internet research studies is not random and could generate selection bias, to minimize this possible problem, we posted the questionnaire on pages and online groups with a general target audience (e.g., web pages of Italian radio programs).
Before answering the questions, participants were briefly informed about the research project that motivated the survey.
Respondents were given a short, four-section questionnaire. Section 1 collected the demographic information, Section 2 assessed the respondent’s attitudes toward the covariates of interest (organic food and food origin), Section 3 investigated the respondent’s technophobia [29,30], and Section 4 asked the respondent’s willingness to try food obtained from by-products [33]. Descriptive statistics of the sample and the questionnaire are presented in Table 1.
To lessen collection cost and maximize the response rate, we minimized the number of items in the questionnaires and drafted questions as five-point Likert scales. The final design was extremely parsimonious and included 11 questions (see Table 1).
We measured the attitude toward organic food, asking respondents to state the frequency of their purchase of organic food on a 5-point scale (from never to always). To limit the possible self-representation bias, we referred to a specific action (buying organic food) instead of asking to report the attitude directly. This approach was possible because Italian consumers, on average, are familiar with organic products, given the sharp increase in organic consumption in the last decade (in 2017, 78% of Italian family had bought organic food at least once, and 48% had bought them at least once a week [53]).
Consumer perception of food origin was blurred mostly because of the overlapping of several different concepts, such as local food, typical food, or food safety. As a consequence, the questionnaire asked to report the importance of product origin in the food purchase decision.
Food technophobia (or food technology neophobia) is defined as consumers’ fear, dislike, or avoidance of novel food technology [29]. Perito et al. [33] found that it is a key driver limiting consumer acceptance of food with olive by-products. As a consequence, we included it as a control variable in our empirical investigation.
Technophobia is a complex attitude to measure. Several contributions in the literature proposed scale measures [29,54,55]. In this paper, we adopt the approach proposed by Perito et al. [33]. The measure is based on three statements:
- NNNT: There is no need for new food technologies because there are so many types of foods;
- NTOR: The benefits associated with innovative food technologies are often overestimated;
- NTLQ: New food technologies reduce the natural quality of foods.
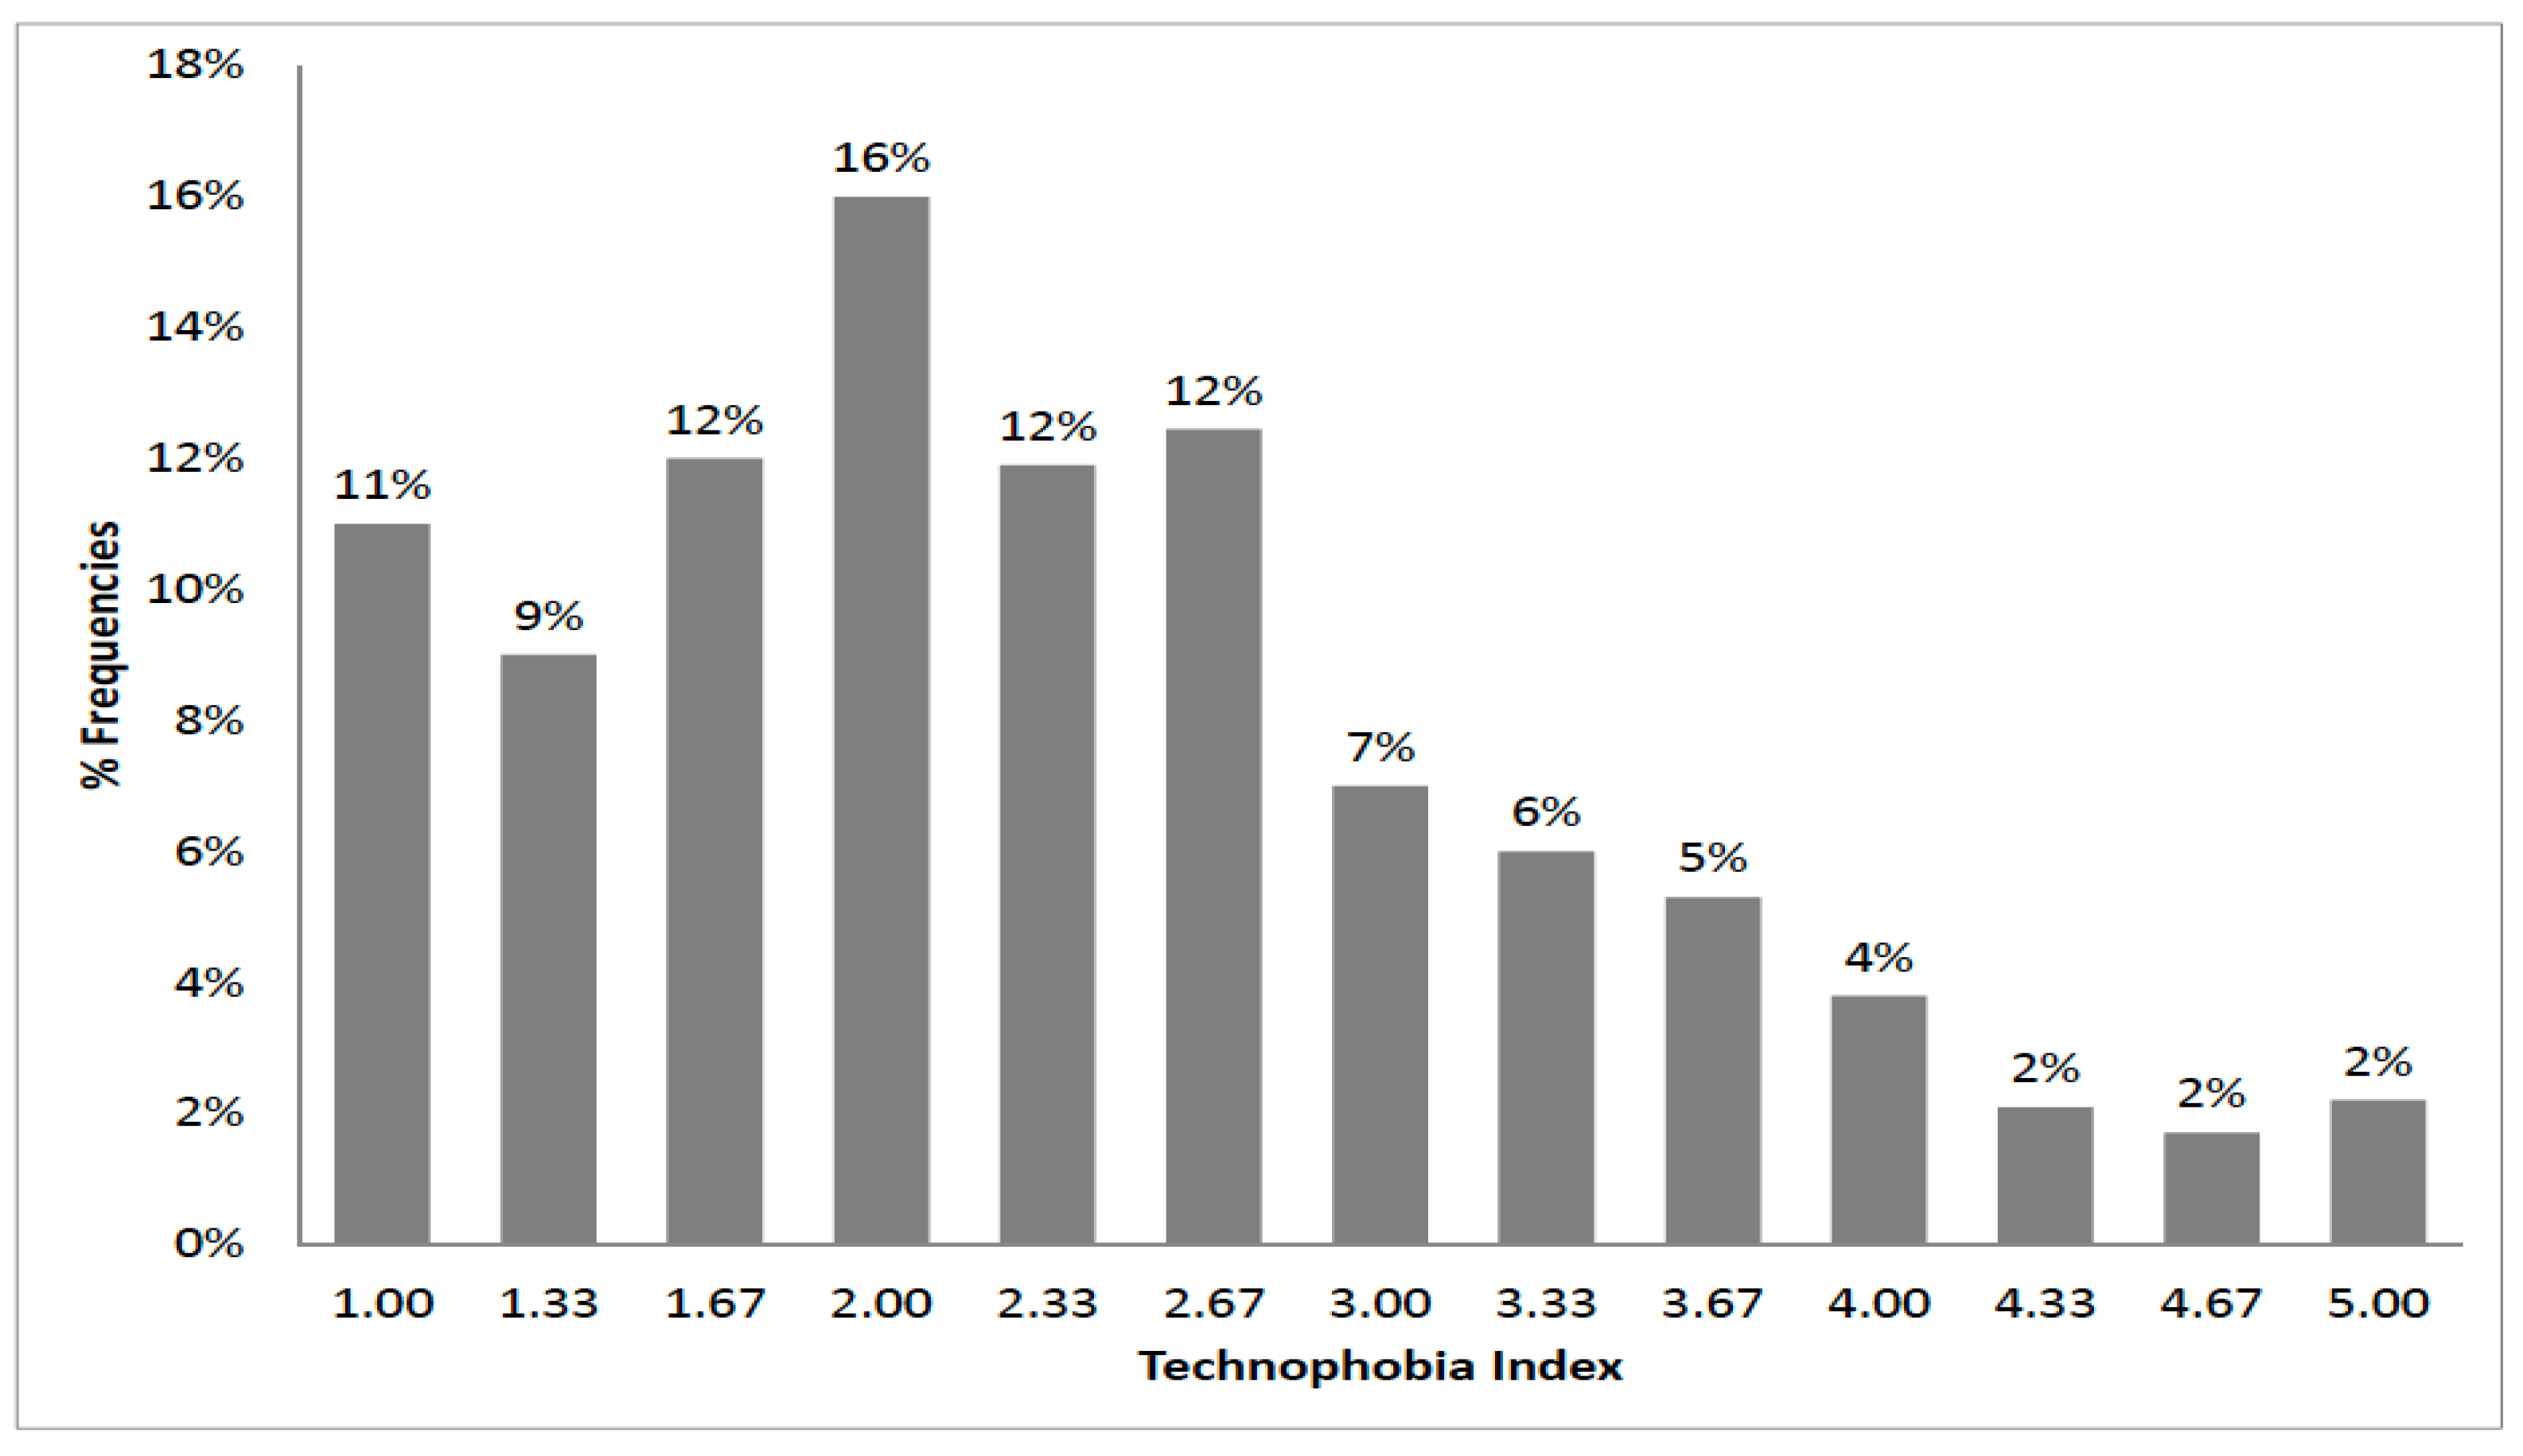
Respondents were asked to agree or disagree with the statements on a 5-point Likert scale from 1 (strongly disagree) to 5 (strongly agree). Cronbach α of 0.78 confirmed that the construct items were consistent. We defined the technophobia index (TFI) as the average of the scores of the three variables.
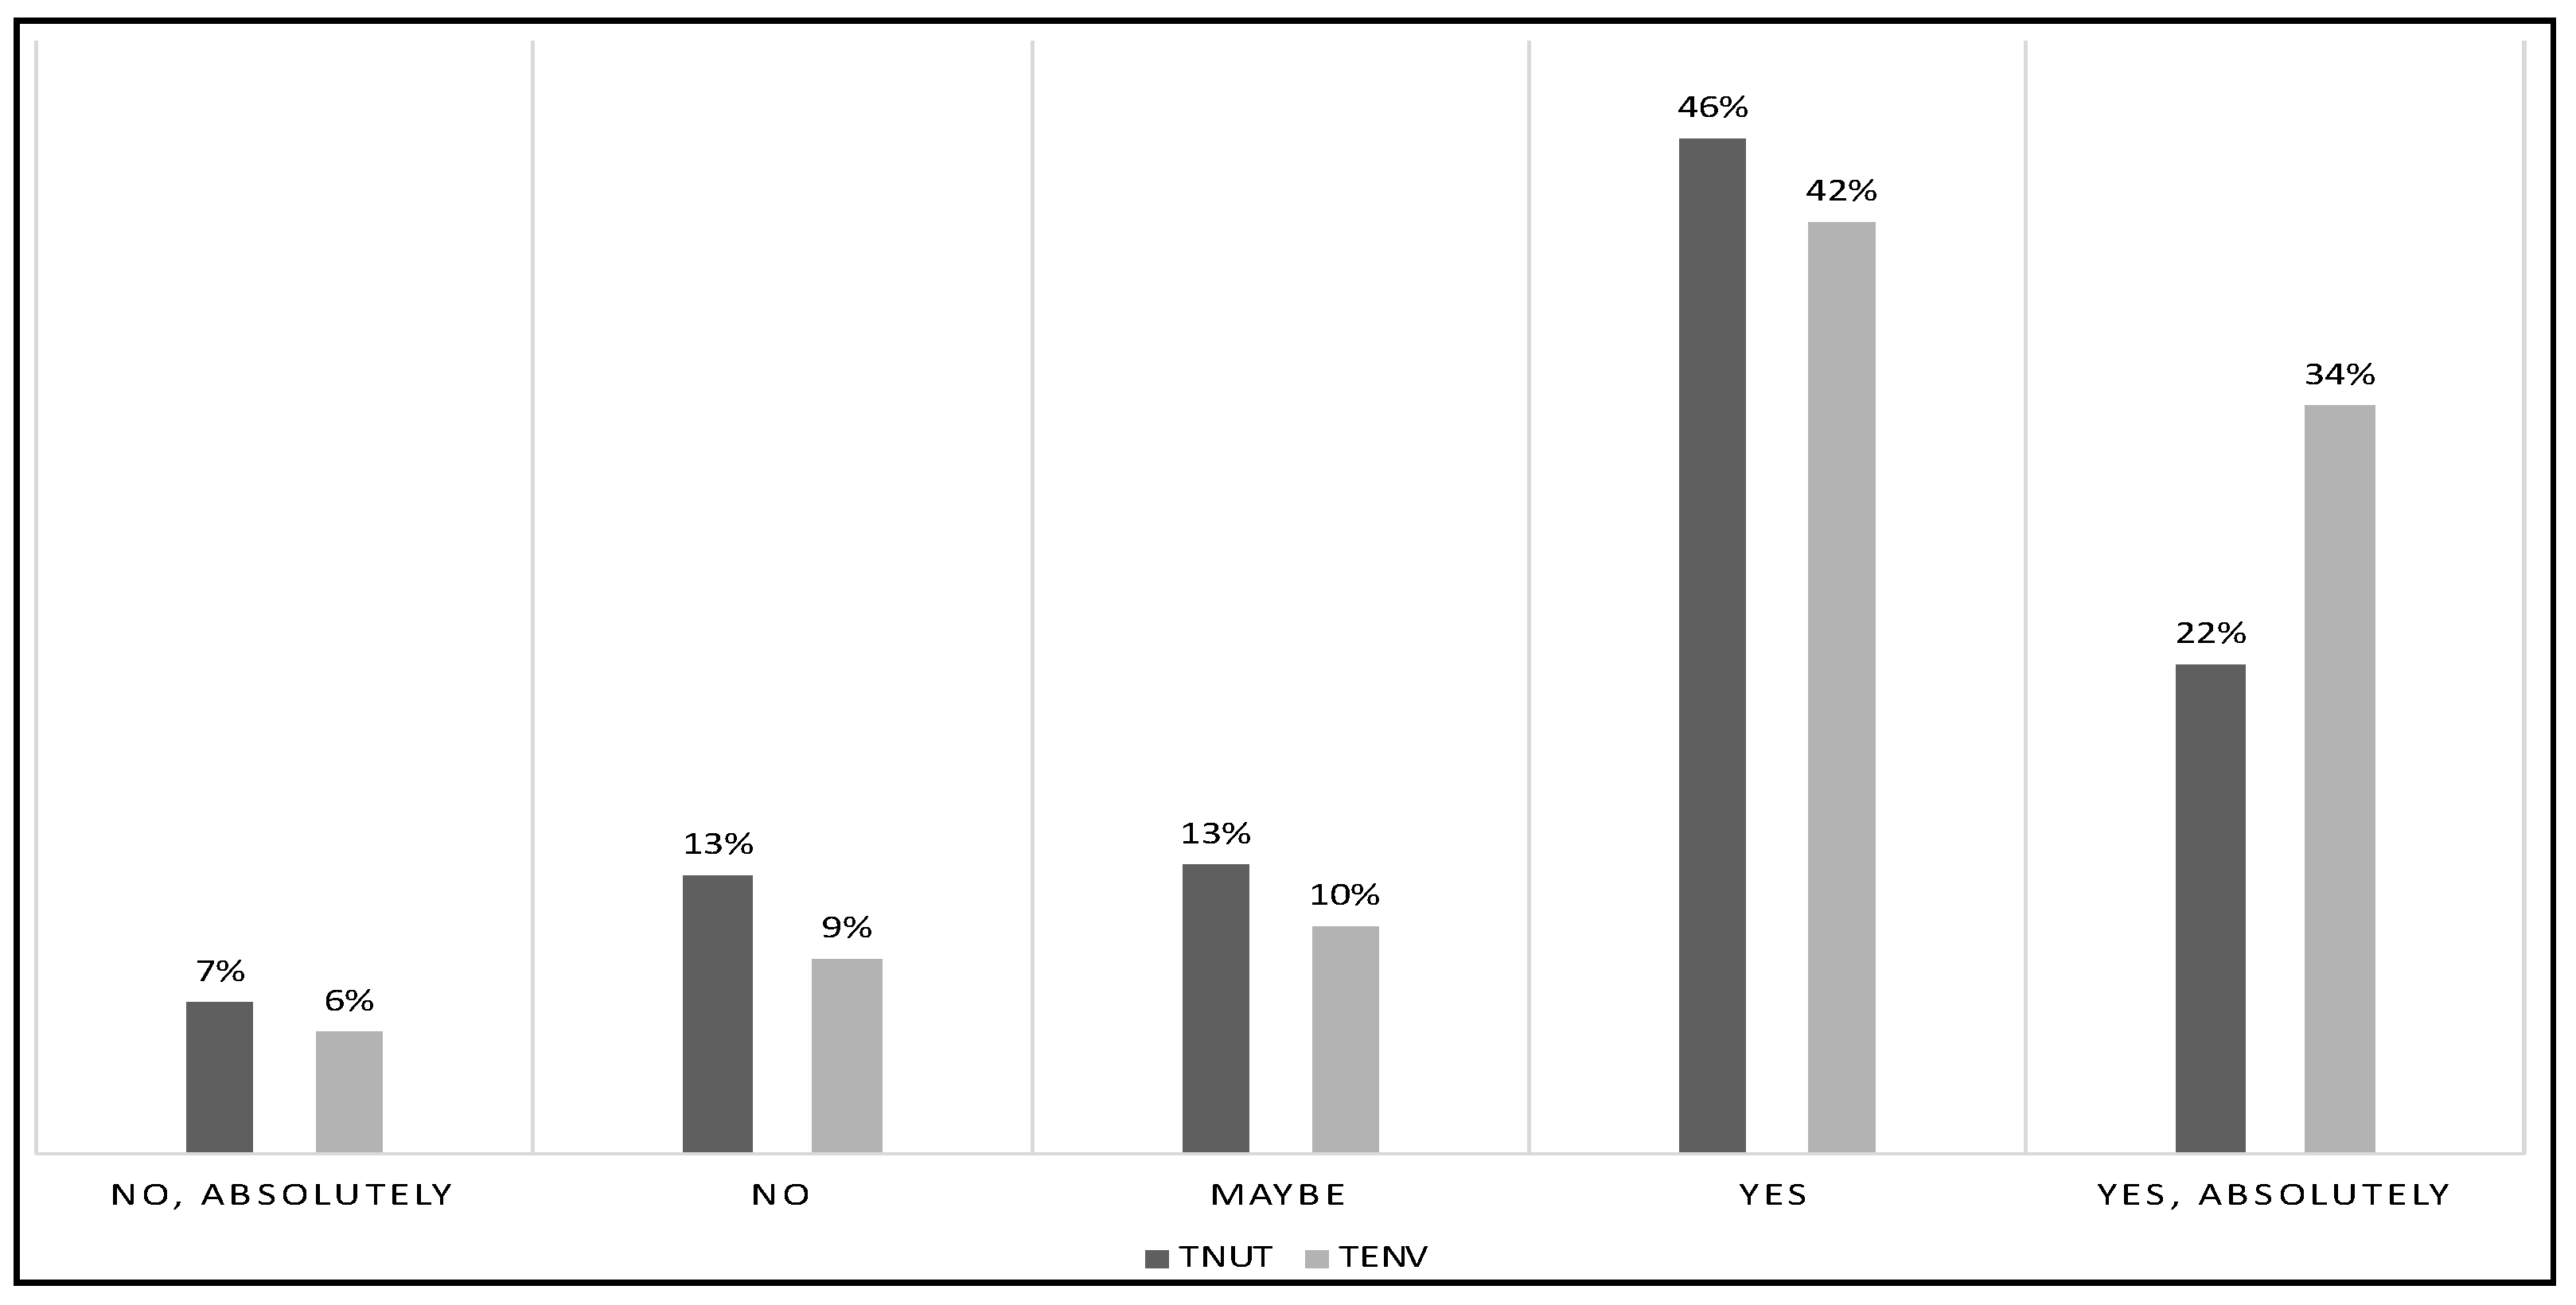
Finally, the questionnaire asked respondents to report their willingness to try food with olive leaves as upcycled ingredients on a 5-point scale from 1 (No, Absolutely) to 5 (Yes, Absolutely). Because Perito et al. [33] identified environmental and nutritional concerns as key drivers of consumer acceptance, we conditioned the answer to two situations: A) the upcycled ingredients of olive leaves has superior nutritional properties (TNUT), and B) the upcycled ingredients reduces the environmental impact of food production and consumption (TENV). In this way, we provide useful insights to novel food researchers willing to market food with upcycled ingredients and different characteristics. Our hypothesis is that products with different attributes (nutritional or environmental) may be appealing to different consumers.
To investigate the association between consumer willingness to try food enriched with upcycled ingredients, organic food, and food origin, we ran a regression of the dependent variables TNUT and TENV on a vector of demographic variables (gender, age, education, and employment status), the technophobia index (TFI), and the attitudes regarding organic food (ORGANIC) and product origin (ORIGIN). Given the discrete nature of the dependent variables, we used an ordered probit model. In fact, in our case, the dependent variables were ordinal, but not continuous in the sense that the metric used to code the variables was substantively meaningful. For instance, the 5-point scale adopted to measure the dependent variable assigned the numerals to the categories but the metric underlying response identification was not necessarily the same as the linear metric relating the numerals. In other terms, the difference between 0 and 2 on the coded responses may be quite different from the difference between 2 and 4. A widely used approach to estimating models of this type is an ordered response model. The basic assumption of such models is that there is a latent continuous metric underlying the ordinal responses observed by the analyst.
The model estimated, assuming that the values of TNUT and TENV were the observable outcome of latent variables, is the following:
where h = N, E; GENB is a binary variable that is equal to 1 if the respondent is female; AGE is the respondent’s age; EDUCATION is a categorical variable with four entries: elementary school, middle school, high school, and college, depending on the respondent’s degree; EMPLOYMENT is a five-entry categorical variable equal to the worker (if the respondent is employed or self-employed), unemployed, student, homemaker or retired, depending on the respondent’s status.
Regarding the variable AGE, a further refinement is then introduced as a separate regression for each age group has been conducted to exploit the large sample size of our survey.
3. Results
3.1. Sample Description
The sample was composed of 852 respondents aged between 18 and 90 years old, with an average of 37 years and six months. Sixty-five percent of respondents were female. Table 2 reports the social and demographic characteristics of the sample.
Table 3 illustrates the distribution of the variables. The majority of respondents stated that they buy organic food at least “seldom”. Eighty-seven percent of respondents stated that product origin was an important or very important driver of food purchase decisions (Table 3). Such a high figure is explained by the broad meaning of the term origin that in the consumers’ mind, is associated with local food, Italian food, typical products, and, in a broader sense, even to food safety. The value origin and the specific reputation for very local products are extensively documented in the literature [11]. Region of origin evokes tradition, habits, culture, and so on, and these aspects directly influence preference for a regional product [56,57,58].
Table 3 reports the distribution of the three original variables (NNNT, NTOR, and NTLQ), and Figure 1 illustrates the distribution of TFI.
Our respondents reported different willingness to try food with upcycled ingredients of olive leaves based on environmental and nutritional concerns. Our finding is that products with different attributes (nutritional or environmental) can be appealing to different consumers. Figure 2 illustrates the distribution of the two variables.
Variables TNUT and TENT are not independent. A Fisher’s exact test rejected the null hypothesis of independence at a 99% confidence level. Table 4 reports Pearson’s standardized residuals from the contingency table, showing that the diagonal elements were positive, while the off-diagonal ones were mostly negative. (Pearson’s standardized residuals are computed by subtracting the expected frequency in a given cell under the null hypothesis of independence from the actual observed frequency and then dividing by the square root of the expected frequency.) This result suggests a positive association and that the two drivers of consumer acceptance do not offset each other on average. The result is of particular importance because it shows that the two drivers may be pursued at the same time.
3.2. Model Results
Table 5 reports the results of the estimation of the model in Equation (1). An χ2 test on the joint significance of the coefficients of demography, education, and working status variables failed to reject the null hypothesis that all coefficients were jointly equal to zero (p-values 0.290 and 0.597 in the TNUT and TENV regressions, respectively) (The p-values of the χ2 on the joint significance of specific groups of variables (demography, education, employment status) are reported in Table 3.)
Technophobia’s coefficient was negative and statistically different from zero at a 95% confidence level in both regressions. High values of TFI were associated with a higher probability of being absolutely unwilling to try olive by-product food. Table 6 reports the marginal probabilities.
An χ2 test failed to reject the hypothesis that ORGANIC did not affect TNUT. Instead, we detected a statistically significant association with TENV (95% confidence level). Holding all other variables constant, buyers of organic food are expected to be more willing to try food with olive by-products if the consumption is beneficial for the environment.
In addition, respondents considering product origin an important or very important issue in food choice are more likely to be very willing to try food with olive by-products. The results hold in both regressions.
3.3. Differences across Generations
The regressions in Table 3 failed to reject the null hypothesis that the conditional expectations of TENV and TNUT were unaffected by the respondent’s age. However, several studies have shown that older generations show different food preferences to younger generations [49,50,59]. To investigate this point further, we exploited the large sample size of our survey to run separate regression for age groups.
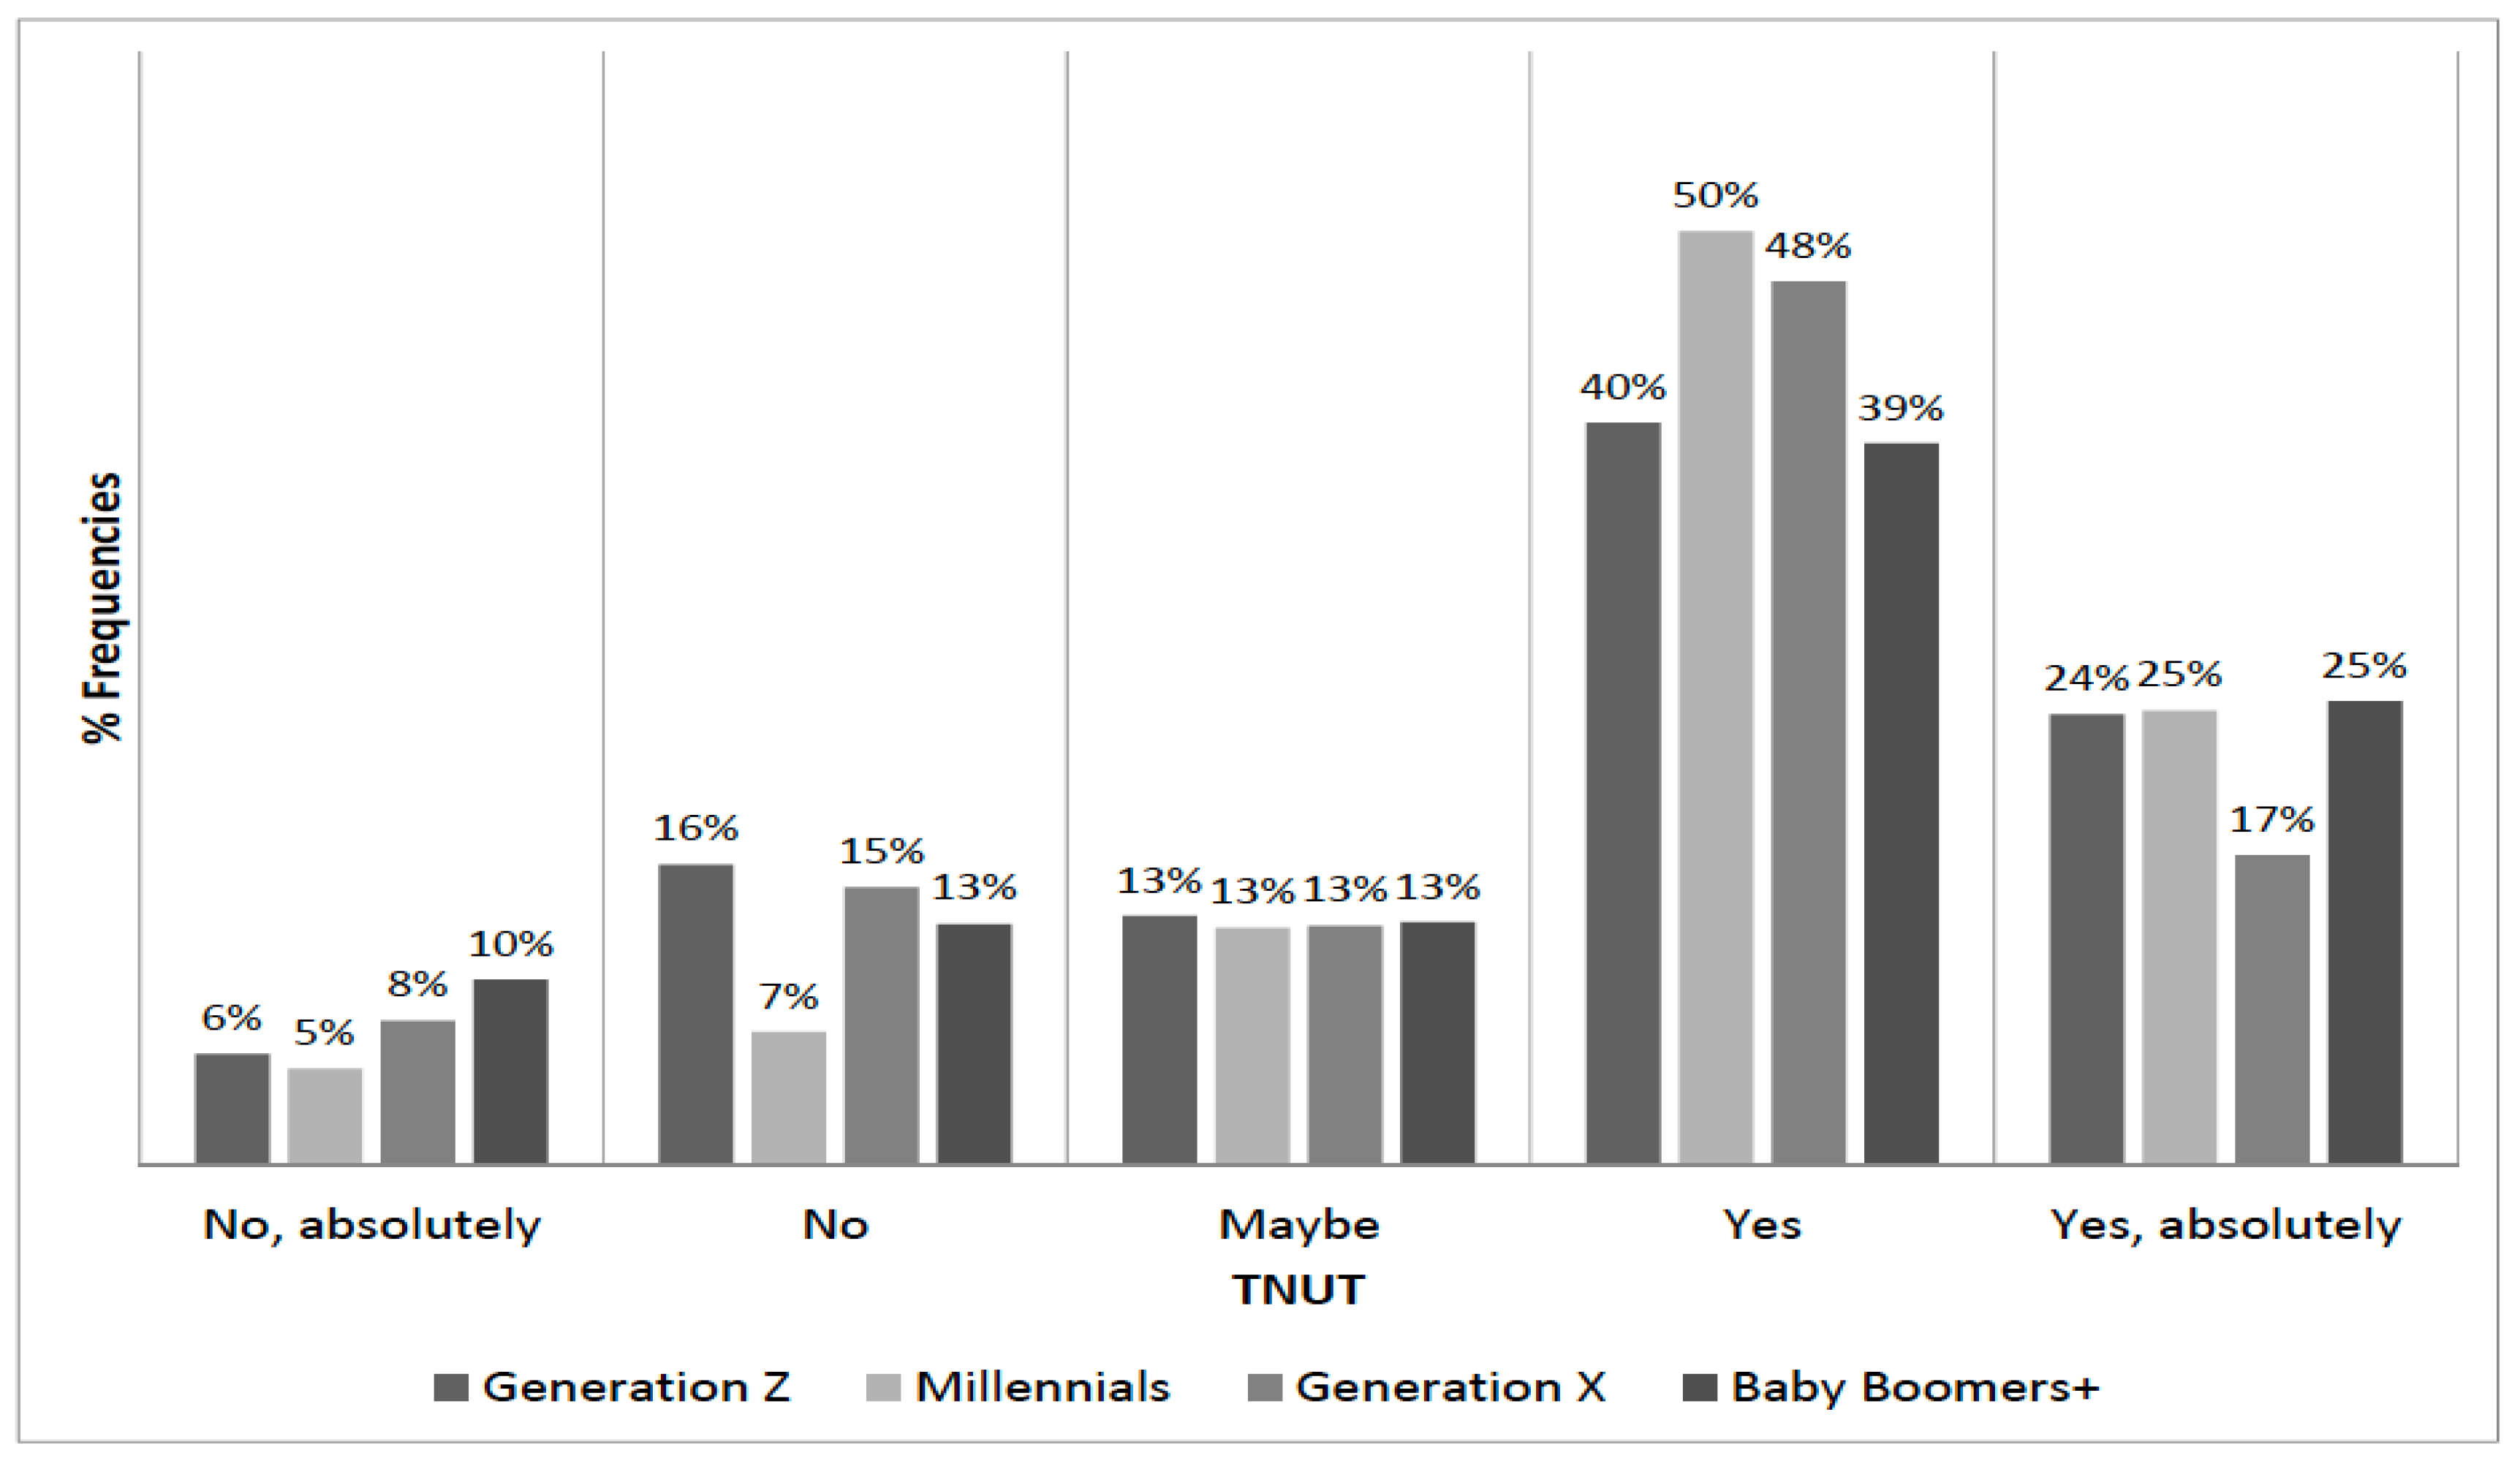
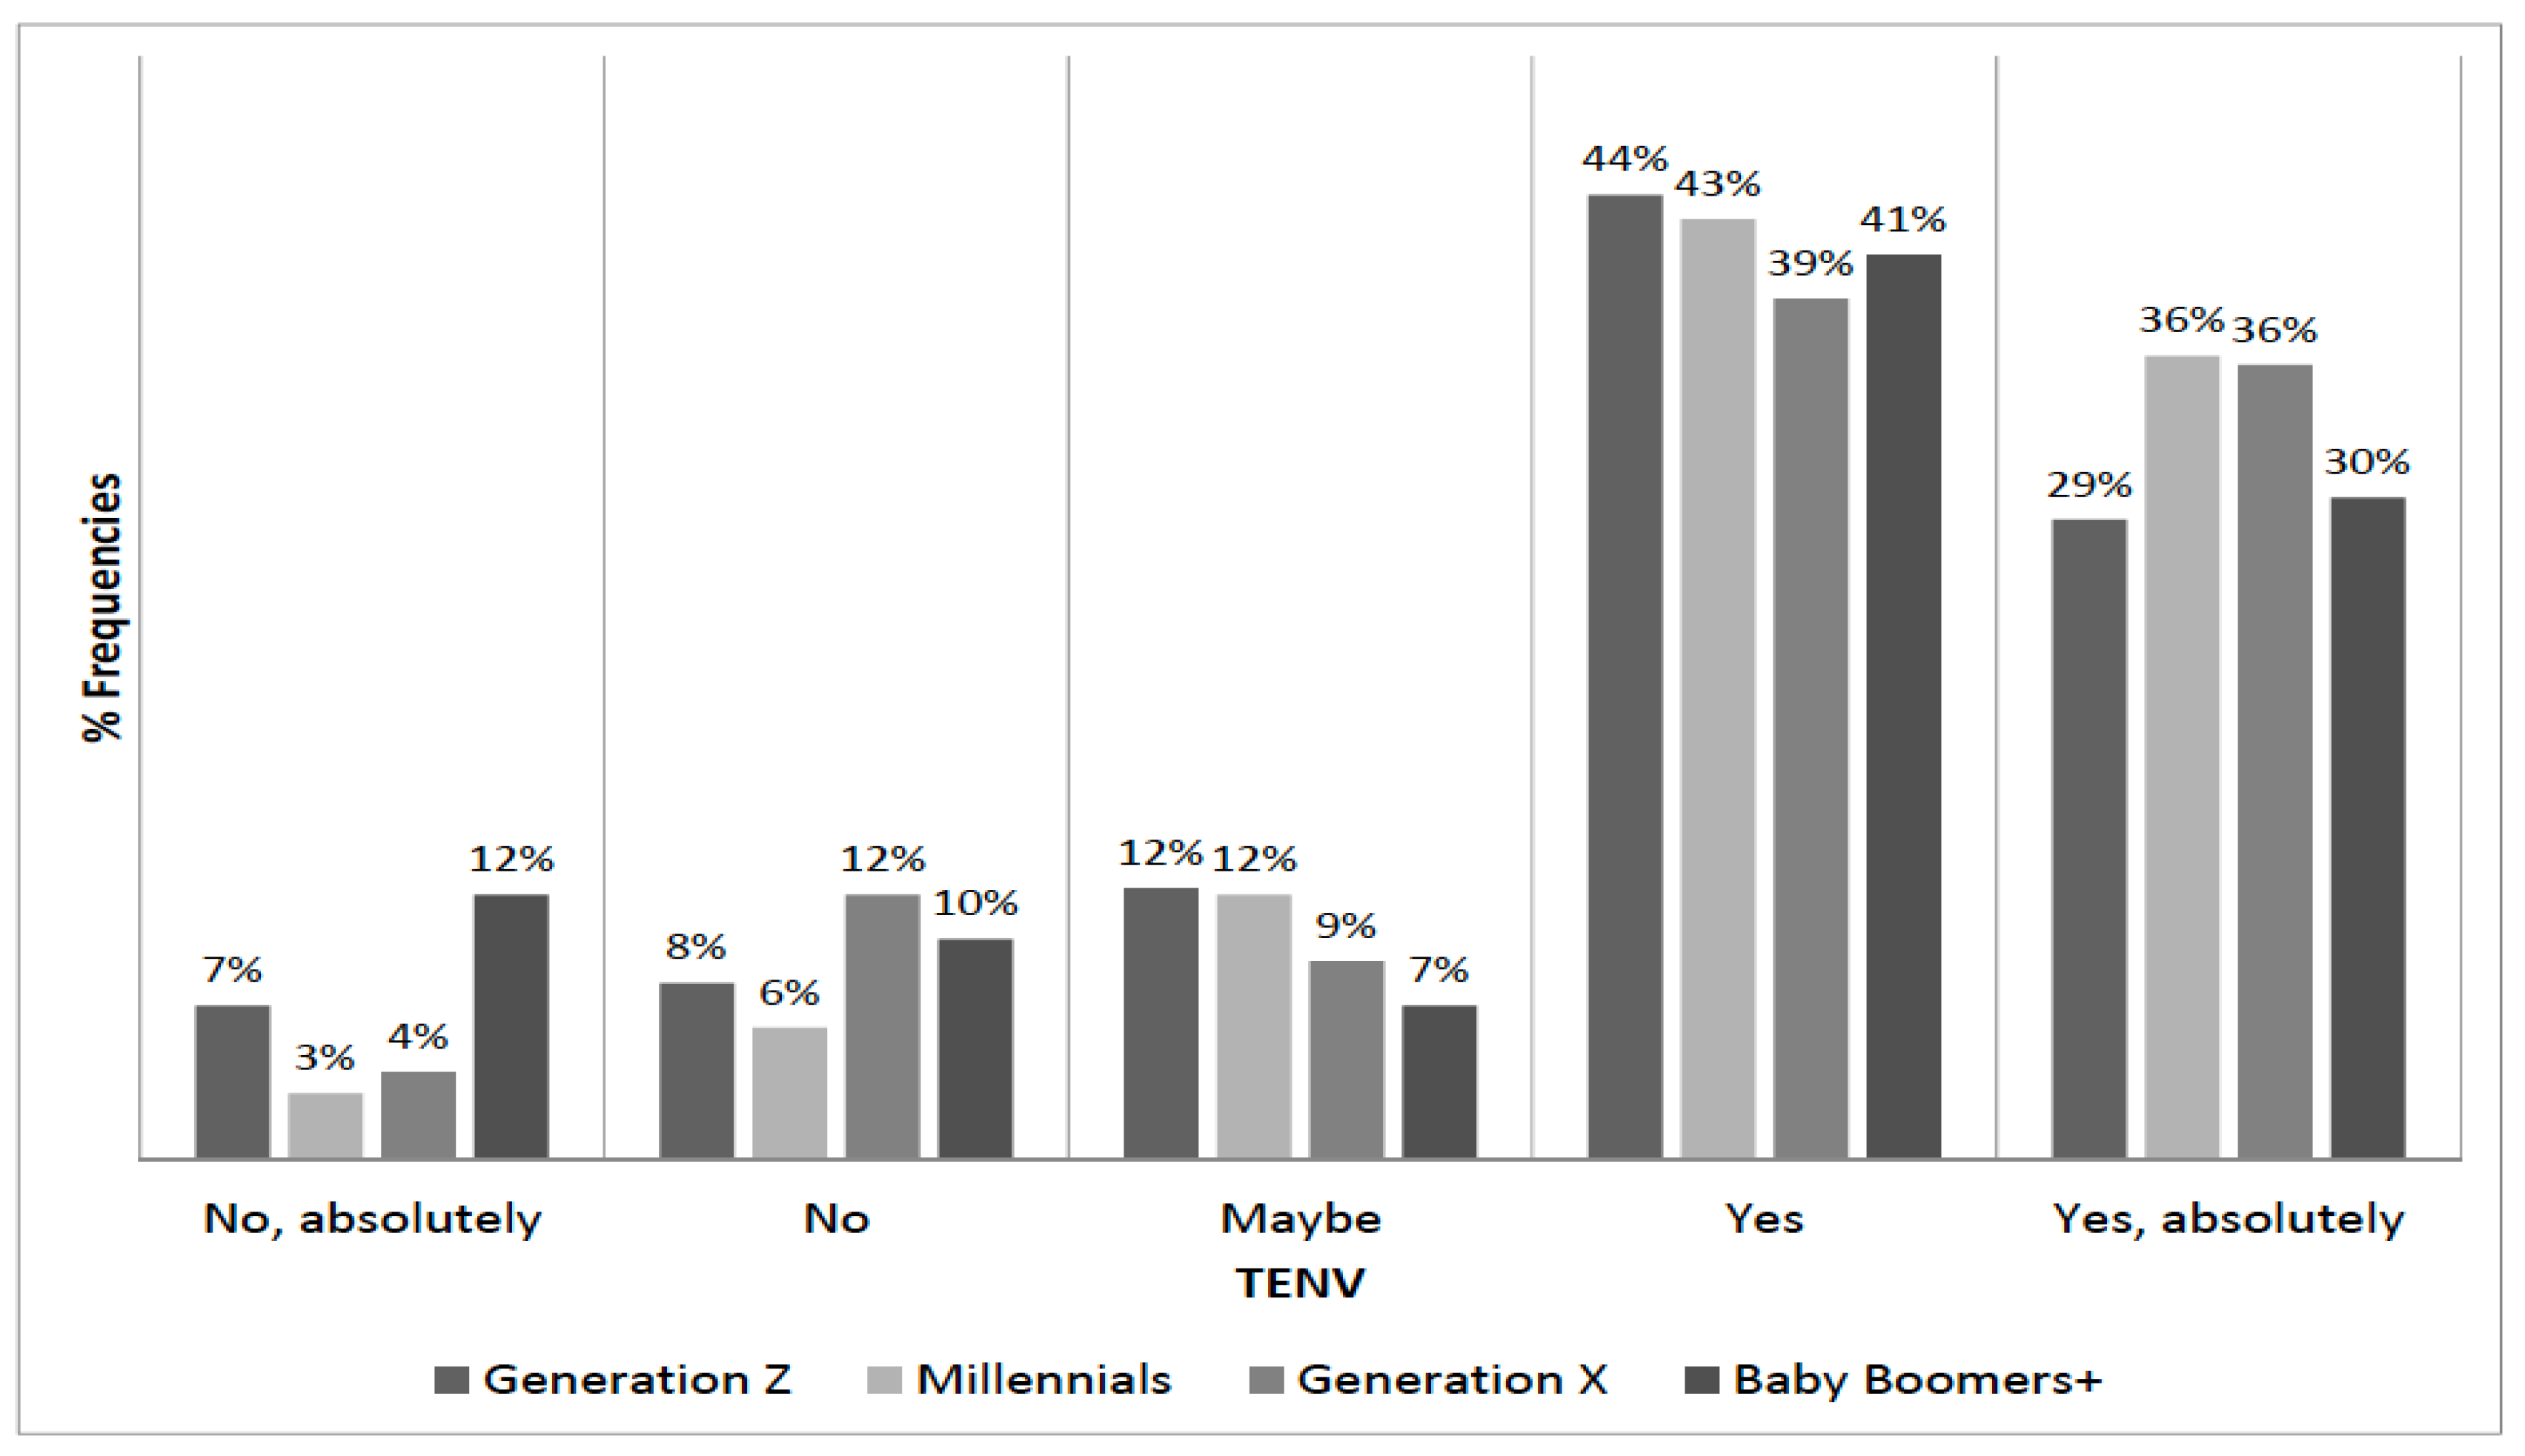
We split the sample into four age groups: Generation Z (age between 18 and 24), Millennials (or Generation Y, age between 25 and 39), Generation X (between 40 and 54), and Baby Boomers+ (age 55 or above). Figure 3 and Figure 4 illustrate the distribution of TNUT and TENV by age group, respectively. An χ2 test failed to reject the null hypothesis of independence between TNUT and age groups at a 95% confidence level (p-value 0.057). Instead, the independence of TENV and age group was rejected (p-value 0.01).
Table 7 and Table 8 report the outcome of the regressions of TNUT and TENV by generation groups, respectively. For the reader’s convenience, the results of the χ2 test on the joint significance of coefficients of groups of variables (Demography, Education, Employment status, Organic, and Origin) are summarized in Table 9.
The analysis by age group showed that the drivers of willingness to accept food with upcycled ingredients were not monotonic with respect to the respondent’s age. Each generation had distinctive characteristics that were not necessarily similar to the next age group. This result explains why the coefficients of the AGE and AGE2 variables were not statistically different from zero in the full sample regression and suggests that the ensemble of beliefs driving the behavior of a generation may be defined in contrast to the previous generation.
Generation Z’s (age 18–24) acceptance of food with olive by-products and improved nutrition characteristics was driven mainly by technophobia. Working status affects decisions, with students showing a higher willingness to try than unemployed respondents (An χ2 test rejected the null hypothesis that the coefficients w2 and w3 were equal with p-value 0.006.). The coefficient of the quadratic form of the variable AGE on TNUT was statistically different from zero, suggesting that preferences within Generation Z were not homogeneous. Generation Z’s decisions to try food with upcycled ingredients that reduce environmental impact were affected by technophobia and working status. A positive association with organic purchase was found as well.
The willingness of Millennials (age 25–39) to try upcycled ingredients with improved nutrition attributes was driven by technophobia alone. Decisions regarding environmentally friendly by-products were driven by technophobia, education, and organic purchase. The importance of product origin was not associated with the dependent variables.
The drivers of Generation X’s (40–54) decisions regarding TENV and TNUT were similar. The coefficients of Employment status variables, TFI, and ORIGIN were statistically different from zero in both regressions at a 95% confidence level. ORGANIC was statistically significant at a 95% confidence level in the TENV regression and at a 90% confidence level in the TNUT regression.
Finally, the age group Baby Boomers+ (55+) exhibited different behaviors depending on whether the upcycled ingredients were associated with improved nutrition or environmental responsibility. In the former case, technophobia was the only driver. In the latter case, ORGANIC and ORIGIN variables were associated with higher values of willingness to try.
4. Discussion
Among the greatest challenges the world faces today are how to ensure that a growing global population has access to enough healthy food and how to reduce food loss and waste. Rethinking the food system and implementing circular resource management systems will help mitigate the effects of food production on the environment and limited availability of resources [60].
Waste valorization has been defined by Arancon et al. [61] as the process of converting waste into more useful products. For example, the olive tree pruning produces 25 Kg of waste biomass for each tree annually, and approximately 25% is leaves [62]. Olive leaves are rich in phenolic compounds [6], and the food sector should use them to produce value-added products [25]. However, consumer acceptance of these products is fundamental to their market uptake.
This study aimed at answering two main research questions: What interest do consumers have in food products enriched with waste-to-value food? Which variables are important predictors of consumer willingness to buy food products enriched with waste-to-value food? Previous results suggest that, although the production of foods with up-cycled ingredients is technically feasible [6,7], carefully-designed marketing campaigns are necessary to ensure consumer acceptance and, ultimately, economic success [38,45]. Aschemann-Witzel and Peschel [27], analyzing how Danish consumers react to the use of by-products in some food products, indicated that specific brand, design, and specific quality information on these new ingredients could improve consumer attitudes towards the “waste-to-value” products.
Our study is useful to highlight what specific consumer profiles may be targeted for marketing campaigns. Environmentally responsible organic consumers, in fact, are likely to be an important niche for food with olive by-products. In the sample analyzed, buyers of organic food were expected to be more willing to try this novel food if it was more beneficial for the environment. This result is quite well known in the literature and might be explained with the special concern for the environmental aspects that organic buyers show [25,63,64,65].
The preference of organic consumers for such novel environmentally sustainable products is very important, considering the current market trends. In fact, nowadays, organic food is not a niche market anymore, accounting for approximately 3% of the total value of the agri-food sector [66,67]. In particular, Italy is ranked sixth in the world among the countries with the largest area cultivated with organic farming methods [68,69]. Furthermore, environmentally sustainable consumption is gaining importance in the market, with consumers showing higher interest in the impacts on natural resources of their food purchases [23].
On the contrary, nutritional attributes were not appealing for environmentalist consumers, as the lack of association between organic purchase and acceptance of upcycled food with superior nutritional properties showed. This finding seems in line with Grasso and Assioli [26], who analyzed three different groups of consumers and the group called “environmentalist”, more interested in the environment, had the lowest rejection towards upcycled sun-flower flour in biscuits.
Another result deserving particular attention is one of product origin. In fact, respondents considering product origin an important or very important issue in food choice were more likely to be willing to try food with olive by-products. As product origin is a very important driver of consumer choice in the Italian market [5], this result is of interest because it suggests that there could be a marketing potential for local food made with upcycled ingredients. In fact, our results confirm that the origin of the by-product may mitigate the food technophobia, and origin information on the olive by-products can increase consumer acceptance and preference for food with upcycled ingredients.
Interesting insights on the consumer characteristics can be derived from the differences across the generations analyzed. In fact, the drivers of willingness to accept food with upcycled ingredients were not the same with respect to the respondent’s age. Each generation had distinctive characteristics that were not necessarily similar to the next age group. This result explains why the coefficients of the AGE and AGE2 variables were not statistically different from zero in the full sample regression and suggests that the ensemble of beliefs driving the behavior of a generation may be defined in contrast to the previous generation.
For the youngest Z Generation, technophobia and working status were the relevant drivers in determining acceptance of food with by-products with improved nutrition characteristics or with reduced environmental impact. In this latter case, a positive association with organic purchase and a slight importance of a product’s origin was found as well, confirming the general result regarding organic consumers and product origin discussed above.
For Millennials, technophobia alone seemed to drive the acceptance of food with upcycled ingredients with improved nutrition attributes, while decisions regarding environmentally friendly by-products were driven by technophobia, education, and organic purchase. Interestingly, a distinctive characteristic of Millennials, compared to other age groups, was that the importance of product origin was not associated with their willingness to accept, thus highlighting a different behavior of that generation regarding this product’s feature.
Generation X seemed, instead, to show more similar and coherent preferences regarding both food with upcycled ingredients with improved nutrition attributes and lower environmental impact. For this group of consumers, technophobia, product’s origin, and organic consumption were all relevant in affecting their purchase intentions.
Baby Boomers+, instead, showed different preference structures. For food with upcycled ingredients with improved nutritional properties, technophobia seemed to be the only driver. For environmentally sustainable food with up-cycled ingredients, the willingness to accept was mainly driven by product origin and organic preferences.
Differences across generations allow even better targeting of market delivery of the product, focusing the attention on the specific driver of each age group segment. In fact, results, if confirmed by further surveys in other countries and with larger and more representative samples, suggest that different age groups respond differently to product characteristics and they could be better targeted with more specific and ad-hoc campaigns. For example, the aspect of a product’s origin seemed not to be relevant in determining the Millennials acceptance for food with up-cycled ingredients, and thus it could be argued that to target such consumers, the attention should be paid to better presenting the “low technological component” in the production process, rather than the local origin of the product to the consumer.
A final consideration should be given to the fact that, at the time of the survey, the proposed novel product was not yet available in the market. This aspect might represent a weakness in the proposed analysis. The fact that consumers were not able to test or see the product could have influenced their replies. However, the results presented here could be useful in the market launch of these products as they target consumers who have shown willingness to purchase such products (e.g., consumers of organic and local products) according to their specific age group.
5. Conclusions
Consumer’s general perception of the use of upcycled ingredients for food production is that the food industry tries to save money with inputs obtained at a lower cost [70]. Consumers accept many by-products for pharmaceutical use because they are rich in healthy components. The acceptance of by-products used for food production is a more complex matter because of the influence of certain levels of food neophobia or technophobia that might hamper the uptake of such products.
The present study confirmed this general influence as both the complete sample and all age groups of consumers demonstrated that technophobia was negatively influenced by the probability of accepting food enriched with olive oil by-products [33]. However, two major determinants of consumption of food made with upcycled ingredients emerged: organic consumers are more likely to accept this novel food and, also, consumers who consider product origin an important or very important issue in food choice are more likely to be willing to try food with olive by-products. The impact of such aspects slightly differs when referred to different product’s characteristics. When we consider products with superior nutrition properties, the association with origin attributes was stronger, while when looking at food with lower environmental impact, the consumption of organic food seemed to be highly associated with the acceptance of the novel food.
This latter aspect also emerged if we look at the results for the generation groups. In all the age groups, the consumption of organic products was positively associated with a likely acceptance of food made with upcycled ingredients, which show a lower environmental impact.
Results here presented would thus suggest that there could be a core of consumers interested in organic or local products, that could also favor the uptake of these novel foods made with upcycled ingredients in the market. Marketing policies are of great importance in that sense because indicating the benefits these foods could bring to health and the environment clearly in the label should help to deliver novel food to the greater public. According to the results of this study, developing organic or “local” varieties of food with upcycled ingredients might increase the probability of consumer acceptance.
Our study adds another piece to the puzzle of the research into upcycling or waste-to-value products in the area of food where studies are yet scarce [25,26,27,33].
However, this manuscript has two main limitations. First, the sample analyzed in this study is not representative of the whole Italian population. However, given the size of the sample, the relationships between the variables analyzed and the positive purchase intention eventually expressed remain valid and allow us to obtain interesting results. Second, as also reported by Grasso and Assioli [26], because upcycled ingredients for food products are not on the market yet and there is not an appropriate definition of these products, our study might suffer from hypothetical bias, which could have affected the estimation of consumer acceptance.
Future research is needed to confirm our results in other countries and using different products and/or upcycled ingredients. In particular, an experimental approach can be used to overcome the hypothetical bias.
Author Contributions
Conceptualization, M.A.P., S.C., and C.R.; Data curation, M.A.P., S.C., and C.R.; Formal analysis, M.A.P., S.C., and C.R.; Funding acquisition, M.A.P.; Investigation, M.A.P., S.C., and C.R.; Methodology, M.A.P., S.C., and C.R.; Resources, M.A.P.; Supervision, M.A.P., S.C., and C.R.; Writing—original draft, M.A.P., S.C., and C.R.; Writing—review and editing, M.A.P., S.C., and C.R. All authors have read and agreed to the published version of the manuscript.
Funding
This research was funded by the AGER 2 Project, grant number 2016-0105.
Acknowledgments
We would like to thank Carla Daniela Di Mattia for inspiring and supporting our research interests in consumer acceptance of novel food enriched with upcycled ingredients.
Conflicts of Interest
The authors declare no conflict of interest.
Data Availability
The data supporting the findings of this study are available from the corresponding author (M.A.P.), upon reasonable request.
References
- Pazzini, A. Storia, Tradizioni e Leggende Nella Medicina Popolare; Ricordati: Bergamo, Italy, 1940; pp. 1–142. [Google Scholar]
- Rossi, M. Tinture Madri in Fitoterapia; Studio Edizioni: Milano, Italy, 1992; pp. 1–225. [Google Scholar]
- Acar-Tek, N.; Ağagündüz, D. Olive Leaf (Olea europaea L. folium): Potential Effects on Glycemia and Lipidemia. Ann. Nutr. Metab. 2020, 76, 63–68. [Google Scholar] [CrossRef]
- Coderoni, S.; Perito, M.A.; Cardillo, C. Consumer behaviour in Italy. Who spends more to buy a Mediterranean Diet? New Medit. 2017, 162, 38–46. [Google Scholar]
- Perito, M.A.; Sacchetti, G.; Di Mattia, C.D.; Chiodo, E.; Pittia, P.; Saguy, I.S.; Cohen, E. Buy local! Familiarity and preferences for extra virgin olive oil of Italian consumers. J. Food Prod. Market. 2019, 25, 462–477. [Google Scholar] [CrossRef]
- Flamminii, F.; Di Mattia, C.D.; Difonzo, G.; Neri, L.; Faieta, M.; Caponio, F.; Pittia, P. From by-product to food ingredient: Evaluation of compositional and technological properties of olive-leaf phenolic extracts. J. Sci. Food Agric. 2019, 99, 6620–6627. [Google Scholar] [CrossRef] [PubMed]
- Flamminii, F.; Di Mattia, C.D.; Nardella, M.; Chiarini, M.; Valbonetti, L.; Neri, L.; Difonzo, G.; Pittia, P. Structuring alginate beads with different biopolymers for the development of functional ingredients loaded with olive leaves phenolic extract. Food Hydrocoll. 2020, in press. [Google Scholar] [CrossRef]
- Lähteenmäki, L. Claiming health in food products. Food Qual. Prefer. 2013, 27, 196–201. [Google Scholar] [CrossRef]
- Fernqvist, F.; Ekelund, L. Credence and the effect on consumer liking of food–A review. Food Qual. Prefer. 2014, 32, 340–353. [Google Scholar] [CrossRef] [Green Version]
- Menapace, L.; Colson, G.; Grebitus, C.; Facendola, M. Consumers’ preferences for geo-graphical origin labels: Evidence from the Canadian olive oil market. Eur. Rev. Agric. 2011, 38, 193–212. [Google Scholar] [CrossRef]
- Van der Lans, I.A.; Van Ittersum, K.; De Cicco, A.; Loseby, M. The role of the region of origin and EU certificates of origin in consumer evaluation of food products. Eur. Rev. Agric. 2001, 28, 451–477. [Google Scholar] [CrossRef]
- Hobbs, J.E.; Goddard, E. Consumers and trust. Food Policy 2015, 52, 71–74. [Google Scholar] [CrossRef]
- Russo, C.; Simeone, M. The growing influence of social and digital media. Br. Food J. 2017, 119, 1766–1780. [Google Scholar] [CrossRef]
- Peschel, A.O.; Aschemann-Witzel, J. Sell more for less or less for more? The role of transparency in consumer response to upcycled food products. J. Clean. Prod. 2020, 273, 122884. [Google Scholar] [CrossRef]
- Asioli, D.; Næs, T.; Granli, B.S.; Lengard Almli, V. Consumer preferences for iced coffee determined by conjoint analysis: An exploratory study with Norwegian consumers. Int. J. Food Sci. Technol. 2014, 49, 1565–1571. [Google Scholar] [CrossRef] [Green Version]
- Lusk, J.L.; Briggeman, B.C. Food values. Am. J. Agric. Econ. 2009, 91, 184–196. [Google Scholar] [CrossRef]
- Steenhuis, I.H.; Waterlander, W.E.; de Mul, A. Consumer food choices: The role of price and pricing strategies. Public Health Nutr. 2011, 14, 2220–2226. [Google Scholar] [CrossRef] [Green Version]
- Defrancesco, E.; Perito, M.A.; Bozzolan, I.; Cei, L.; Stefani, G. Testing consumers’ preferences for environmental attributes of pasta. Insights from an ABR approach. Sustainability 2017, 9, 1701. [Google Scholar] [CrossRef] [Green Version]
- Nait Mohand, N.; Hammoudi, A.; Radjef, M.S.; Hamza, O.; Perito, M.A. How do food safety regulations influence market price? A theoretical analysis. Br. Food J. 2017, 119, 1687–1704. [Google Scholar] [CrossRef]
- De Pelsmacker, P.; Driesen, L.; Rayp, G. Are fair trade labels good business? Ethics and coffee buying intentions. J. Consum. Aff. 2003, 39, 1–20. [Google Scholar]
- Boutouis, M.Z.; Hammoudi, A.; Benhassine, W.; Perito, M.A. Uncertainty of food contamination origin and liability rules: Implications for bargaining power. Agribusiness 2018, 34, 77–92. [Google Scholar] [CrossRef]
- Hempel, C.; Hamm, U. Local and/or organic: A study on consumer preferences for organic food and food from different origins. Int. J. Consum. 2016, 40, 732–741. [Google Scholar] [CrossRef]
- Canavari, M.; Coderoni, S. Consumer stated preferences for dairy products with carbon footprint labels in Italy. Agric. Food Econ. 2020, 8, 1–16. [Google Scholar] [CrossRef] [Green Version]
- Galanakis, C.M. Recovery of high added-value components from food wastes: Conventional, emerging technologies and commercialized applications. Trends Food Sci. Technol. 2012, 26, 68–87. [Google Scholar] [CrossRef]
- Coderoni, S.; Perito, M.A. Sustainable consumption in the circular economy. An analysis of consumers’ purchase intentions for waste-to-value food. J. Clean. Prod. 2020, 252, 119870. [Google Scholar] [CrossRef]
- Grasso, S.; Asioli, D. Consumer preferences for upcycled ingredients: A case study with biscuits. Food Qual. Prefer. 2020, 84, 103951. [Google Scholar] [CrossRef]
- Aschemann-Witzel, J.; Peschel, A.O. How circular will you eat? The sustainability challenge in food and consumer reaction to either waste-to-value or yet un derused novel ingredients in food. Food Qual. Prefer. 2019, 77, 15–20. [Google Scholar] [CrossRef]
- Pliner, P.; Hobden, K. Development of a scale to measure the trait of food neophobia in humans. Appetite 1992, 19, 105–120. [Google Scholar] [CrossRef]
- Cox, D.N.; Evans, G. Construction and validation of a psychometric scale to measure consumers’ fears of novel food technologies: The food technology neophobia scale. Food Qual. Prefer. 2008, 19, 704–710. [Google Scholar] [CrossRef]
- Verbeke, W. Profiling consumers who are ready to adopt insects as a meat substitute in a Western society. Food Qual. Prefer. 2015, 39, 147–155. [Google Scholar] [CrossRef]
- Palmieri, N.; Perito, M.A.; Macrì, M.C.; Lupi, C. Exploring consumers’ willingness to eat insects in Italy. Br. Food J. 2019, 121, 2937–2950. [Google Scholar] [CrossRef]
- Palmieri, N.; Perito, M.A.; Lupi, C. Consumer acceptance of cultured meat: Some hints from Italy. Br. Food J. 2020, in press. [Google Scholar] [CrossRef]
- Perito, M.A.; Di Fonzo, A.; Sansone, M.; Russo, C. Consumer acceptance of food obtained from olive by-products. Br. Food J. 2019, 122, 212–226. [Google Scholar] [CrossRef]
- Bhatt, S.; Lee, J.; Deutsch, J.; Ayaz, H.; Fulton, B.; Suri, R. From food waste to value-added surplus products (VASP): Consumer acceptance of a novel food product category. J. Consum. Behav. 2018, 17, 57–63. [Google Scholar] [CrossRef]
- Berghoef, N.; Dodds, R. Potential for sustainability eco-labeling in Ontario’s wine industry. Int. J. Wine Bus. Res. 2011, 23, 298–317. [Google Scholar] [CrossRef]
- Barber, N. “Green” wine packaging: Targeting environmental consumers. Int. J. Wine Bus. Res. 2010, 22, 423–444. [Google Scholar] [CrossRef]
- Sörqvist, P.; Haga, A.; Holmgren, M.; Hansla, A. An eco-label effect in the built environment: Performance and comfort effects of labeling a light source environmentally friendly. J. Environ. Psychol. 2015, 42, 123–127. [Google Scholar] [CrossRef] [Green Version]
- Ditlevsen, K.; Sandøe, P.; Lassen, J. Healthy food is nutritious, but organic food is healthy because it is pure: The negotiation of healthy food choices by Danish consumers of organic food. Food Qual. Prefer. 2019, 71, 46–53. [Google Scholar] [CrossRef] [Green Version]
- Ginon, E.; Ares, G.; dos Santos Laboissière, L.H.E.; Brouard, J.; Issanchou, S.; Deliza, R. Logos indicating environmental sustainability in wine production: An exploratory study on how do Burgundy wine consumers perceive them. Food Res. Int. 2014, 62, 837–845. [Google Scholar] [CrossRef] [Green Version]
- Grankvist, G.; Biel, A. The importance of beliefs and purchase criteria in the choice of eco-labeled food products. J. Environ. Psychol. 2001, 21, 405–410. [Google Scholar] [CrossRef]
- Magnusson, M.K.; Arvola, A.; Hursti, U.K.K.; Åberg, L.; Sjödén, P.O. Choice of organic foods is related to perceived consequences for human health and to environmentally friendly behaviour. Appetite 2003, 40, 109–117. [Google Scholar] [CrossRef]
- Hughner, R.S.; McDonagh, P.; Prothero, A.; Shultz, C.J.; Stanton, J. Who are organic food consumers? A compilation and review of why people purchase organic food. J. Consum. Behav. Int. Res. Rev. 2007, 6, 94–110. [Google Scholar] [CrossRef]
- Aschemann-Witzel, J.; Zielke, S. Can’t buy me green? A review of consumer perceptions of and behavior toward the price of organic food. J. Cons. Affairs 2015, 51, 211–251. [Google Scholar] [CrossRef]
- Loureiro, M.L.; Umberger, W.J. Estimating consumer willingness to pay for country-of- origin labelling. J. Agric. Resour. Econ. 2003, 28, 287–301. [Google Scholar]
- Zander, K.; Stolz, H.; Hamm, U. Promising ethical arguments for product differentiation in the organic food sector. A mixed methods research approach. Appetite 2013, 62, 133–142. [Google Scholar] [CrossRef] [PubMed]
- Feldmann, C.; Hamm, U. Consumers’ perceptions and preferences for local food: A review. Food Qual. Prefer. 2015, 40, 152–164. [Google Scholar] [CrossRef]
- Grebitus, C.; Lusk, J.L.; Nayga, R.M., Jr. Effect of distance of transportation on willingness to pay for food. Ecol. Econ. 2013, 88, 67–75. [Google Scholar] [CrossRef]
- Stephenson, G.; Lev, L. Common support for local agriculture in two contrasting Oregon communities. Renew. Agric. Food Syst. 2004, 19, 210–217. [Google Scholar] [CrossRef]
- Vanhonacker, F.; Lengard, V.; Hersleth, M.; Verbeke, W. Profiling European traditional food consumers. Br. Food J. 2010, 112, 871–886. [Google Scholar] [CrossRef]
- Fibri, D.L.N.; Frøst, M.B. Indonesian millennial consumers’ perception of tempe and how it is affected by product information and consumer psychographic traits. Food Qual. Prefer. 2020, 80, 103798. [Google Scholar] [CrossRef]
- Wooldridge, J.M. Econometric Analysis of Cross Section and Panel Data, 2nd ed.; MIT Press: Cambridge, MA, USA, 2010. [Google Scholar]
- Kayam, O.; Hirsch, T. Using social media networks to conduct questionnaire based research in social studies case study: Family language policy. J. Sociol. Res. 2012, 3, 57–67. [Google Scholar] [CrossRef]
- Osservatorio Sana. 2018: “Tutti i Numeri del Bio Italiano: I Driver del Consumatore e le Novità del Canale Specializzato”. Available online: http://www.sana.it/media-room/archivio-news/osservatorio-sana-2018-tutti-i-dati-sulle-abitudini-dacquisto-di-prodotti-bio-e-sulle-strategie-del-canale-specializzato/8843.html (accessed on 6 September 2020).
- Evans, G.; Kermarrec, C.; Sable, T.; Cox, D.N. Reliability and predictive validity of the Food Technology Neophobia Scale. Appetite 2010, 54, 390–393. [Google Scholar] [CrossRef]
- Verneau, F.; Caracciolo, F.; Coppola, A.; Lombardi, P. Consumer fears and familiarity of processed food. The value of information provided by the FTNS. Appetite 2014, 73, 140–146. [Google Scholar] [CrossRef] [PubMed]
- Dekhili, S.; Sirieix, L.; Cohen, E. How consumers choose olive oil: The importance of origin cues. Food Qual. Prefer. 2011, 22, 757–762. [Google Scholar] [CrossRef]
- Newman, C.L.; Turri, A.M.; Howlett, E.; Stokes, A. Twenty years of country of origin food labeling research: A review of the literature and implications for food marketing systems. J. Macromark. 2014, 34, 505–519. [Google Scholar] [CrossRef]
- Thøgersen, J.; Pedersen, S.; Paternoga, M.; Schwendel, E.; Aschemann-Witzel, J. How important is country-of-origin for organic food consumers? A review of the literature and suggestions for future research. Br. Food J. 2017, 119, 542–557. [Google Scholar] [CrossRef]
- Kwak, H.S.; Jung, H.Y.; Kim, M.J.; Kim, S.S. Differences in consumer perception of Korean traditional soybean paste (Doenjang) between younger and older consumers by blind and informed tests. J. Sens. Stud. 2017, 32, 1–10. [Google Scholar] [CrossRef]
- Van Loo, E.J.; Hoefkens, C.; Verbeke, W. Healthy, sustainable and plant-based eating: Perceived (mis)match and involvement-based consumer segments as targets for future policy. Food Policy 2017, 69, 46–57. [Google Scholar] [CrossRef]
- Arancon, R.A.D.; Lin, C.S.K.; Chan, K.M.; Kwan, T.H.; Luque, R. Advances on waste valorization: New horizons for a more sustainable society. Energy Sci. Eng. 2013, 1, 53–71. [Google Scholar] [CrossRef]
- Romero-García, J.M.; Niño, L.; Martínez-Patiño, C.; Álvarez, C.; Castro, E.; Negro, M.J. Biorefinery based on olive biomass. State of the art and future trends. Bioresour. Technol. 2014, 159, 421–432. [Google Scholar] [CrossRef]
- Aertsens, J.; Mondelaers, K.; Verbeke, W.; Buysse, J.; Van Huylenbroeck, G. The influence of subjective and objective knowledge on attitude, motivations and consumption of organic food. Br. Food J. 2011, 113, 1353–1378. [Google Scholar] [CrossRef]
- Harper, G.C.; Makatouni, A. Consumer perception of organic food production and farm animal welfare. Br. Food J. 2002, 104, 287–299. [Google Scholar] [CrossRef]
- Padel, S.; Foster, C. Exploring the gap between attitudes and behaviour: Understanding why consumers buy or do not buy organic food. Br. Food J. 2005, 107, 606–625. [Google Scholar] [CrossRef] [Green Version]
- Willer, H.; Lernoud, J. The World of Organic Agriculture. Statistics and Emerging Trends 2017; Research Institute of Organic Agriculture (FiBL), Frick, and IFOAM—Organics International: Bonn, Germany, 2017. [Google Scholar]
- Thøgersen, J.; Pedersen, S.; Aschemann-Witzel, J. The impact of organic certification and country of origin on consumer food choice in developed and emerging economies. Food Qual. Prefer. 2019, 72, 10–30. [Google Scholar] [CrossRef]
- Vega-Zamora, M.; Naspetti, S.; Zanoli, R. Principales motivaciones del consumidor de alimentos ecológicos en italia. El caso del aceite de oliva. Agrociencia 2020, 54, 327–336. [Google Scholar]
- Palmieri, N.; Perito, M.A. Consumers’ willingness to consume sustainable and local wine in Italy. Ital. J. Food Sci. 2020, 32, 222–233. [Google Scholar] [CrossRef]
- Nitzko, S.; Spiller, A. Comparing “Leaf-to-Root”, “Nose-to-Tail” and Other Efficient Food Utilization Options from a Consumer Perspective. Sustainability 2019, 11, 4779. [Google Scholar] [CrossRef] [Green Version]
Figure 1.
Distribution of the Technophobia Index (TFI).

Figure 2.
Willingness to try food containing upcycled ingredients with superior nutrition properties (TNUT) or lower environmental impact (TENV).
Figure 2.
Willingness to try food containing upcycled ingredients with superior nutrition properties (TNUT) or lower environmental impact (TENV).

Figure 3.
Distribution of TNUT by generations.

Figure 4.
Distribution of TENV by generations.


Table 1.
Questionnaire and descriptive statistics of variables (n = 852).
| Questionnaire | Label Variable | Scale | Mean | ||||
|---|---|---|---|---|---|---|---|
| Gender | GEN | Male | Female | ||||
| 35.33 | 64.67 | ||||||
| Age | AGE | 37.56 | |||||
| Education | EDU | Elemen. | Middle | High S. | College | ||
| 0.35 | 2.35 | 37.09 | 60.21 | ||||
| Employment | EMPL | Worker | Unempl. | Student | Homem. | Retired | |
| 59.04 | 5.87 | 28.29 | 2.70 | 4.11 | |||
| Frequency of the purchase of organic food | ORGANIC | 5-point scale | Never | Seldom | Somet. | Often | Always |
| 46.48 | 23.59 | 5.99 | 14.44 | 9.51 | |||
| Is food Origin (e.g., local/typical product) important when shopping for food? | ORIGIN | 5-point scale | Abs. Not | Not | Indiff. | Yes | Abs. Yes |
| 2.46 | 3.76 | 7.28 | 38.97 | 47.53 | |||
| There is no need for new food technologies because there are so many types of foods. | NNNT | 5-point scale | Abs. Disag. | Disagr. | Indiff. | Agree | Abs. Agree |
| 39.20 | 35.68 | 10.09 | 10.68 | 4.34 | |||
| The benefits associated with innovative food technologies are often overestimated | NTOR | 5-point scale | Abs. Disag. | Disagr. | Indiff. | Agree | Abs. Agree |
| 18.31 | 35.56 | 18.19 | 20.07 | 7.86 | |||
| New food technologies reduce the natural quality of foods | NTLQ | 5-point scale | Abs. Disag. | Disagr. | Indiff. | Agree | Abs. Agree |
| 23.83 | 36.97 | 15.96 | 15.61 | 7.63 | |||
| I am willing to try food with upcycled ingredients of olive leaves if: | |||||||
| it has superior nutritional properties | TNUT | 5-point scale | Abs. Not | Not | Indiff. | Yes | Abs. Yes |
| 6.81 | 12.56 | 13.03 | 45.66 | 21.95 | |||
| it reduces the environmental impact of food production and consumption | TENV | 5-point scale | Abs. Not | Not | Indiff. | Yes | Abs. Yes |
| 5.52 | 8.80 | 10.21 | 33.57 | 41.90 | |||
Table 2.
Sample demographics characteristics.
| Education | % Freq. | Employment Status | % Freq. | Gender | % Freq. | Age | % Freq. |
|---|---|---|---|---|---|---|---|
| Elementary school | 0.35 | Worker | 59.04 | Male | 35.33 | Generat. Z (18–24) | 25.23 |
| Middle School | 2.35 | Unemployed | 5.87 | Female | 64.67 | Millennials (25–39) | 31.34 |
| High School | 37.09 | Student | 28.29 | Generat. X (40–54) | 30.99 | ||
| College | 60.21 | Homemaker | 2.70 | Elder Gen. (55+) | 12.44 | ||
| Retired | 4.11 | ||||||
| Total | 100.00 | Total | 100.00 | Total | 100.00 | Total | 100.00 |
Table 3.
Distribution of selected variables.
| BUYBIO | ORIGIN | NNNT | NTOR | NTQL | ||||||||
|---|---|---|---|---|---|---|---|---|---|---|---|---|
| Scale | N | % | Scale | N | % | Scale | N | % | N | % | N | % |
| Never | 396 | 46.5 | Absol. not important | 21 | 2.5 | Strongly disagree | 334 | 39.2 | 156 | 18.3 | 203 | 23.8 |
| Seldom | 201 | 23.6 | Not important | 32 | 3.8 | Disagree | 304 | 35.7 | 303 | 35.6 | 315 | 37.0 |
| Sometimes | 51 | 6.0 | Indifferent | 62 | 7.3 | Not agree nor disagree | 86 | 10.1 | 155 | 18.2 | 136 | 16.0 |
| Often | 123 | 14.4 | Important | 332 | 39.0 | Agree | 91 | 10.7 | 171 | 20.1 | 133 | 15.6 |
| Always | 81 | 9.5 | Very important | 405 | 47.5 | Strongly agree | 37 | 4.3 | 67 | 7.9 | 65 | 7.6 |
| Total | 852 | 100.0 | Total | 852 | 100.0 | Total | 852 | 100.0 | 852 | 100.0 | 852 | 100.0 |
Note: BUYBIO: Do you buy organic food? ORIGIN: How important is product origin when deciding your food purchase? NNT: There is no need for new food technologies because there are so many types of foods; NTQR: The benefits associated with innovative food technologies are often overestimated; NTQL: New food technologies reduce the natural quality of foods.
Table 4.
Pearson’s standardized residuals from a two-way table of superior nutrition properties (TNUT) and lower environmental impact (TENV).
Table 4.
Pearson’s standardized residuals from a two-way table of superior nutrition properties (TNUT) and lower environmental impact (TENV).
| TENV | |||||
|---|---|---|---|---|---|
| TNUT | No, absol. | No | Maybe | Yes | Yes, absol. |
| No, absolutely | 17.8 | 0.8 | −2.0 | −3.1 | −3.1 |
| No | 0.5 | 12.9 | −0.3 | −3.0 | −3.3 |
| Maybe | −1.3 | −0.6 | 6.1 | −0.5 | −2.0 |
| Yes | −4.4 | −4.1 | −0.7 | 6.1 | −2.5 |
| Yes, absolutely | −2.9 | −3.8 | −2.3 | −4.4 | 9.4 |
Table 5.
Regression results.
| TNUT | TENV | ||||||
|---|---|---|---|---|---|---|---|
| Coeff | Std. Error | p-Value | Coeff | Std. Error | p-Value | ||
| Demography | 0.971 | 0.437 | |||||
| Female respondent | Genb | −0.012 | 0.076 | 0.872 | −0.035 | 0.080 | 0.658 |
| Age of respondent | Age | 0.009 | 0.029 | 0.750 | 0.041 | 0.027 | 0.130 |
| Age squared | age2 | 0.000 | 0.000 | 0.796 | 0.000 | 0.000 | 0.164 |
| Education | 0.098 | 0.857 | |||||
| Elementary school | |||||||
| Middle school | ed2 | −0.816 | 0.612 | 0.183 | 0.106 | 0.396 | 0.789 |
| High school | ed3 | −1.081 | 0.590 | 0.067 | 0.188 | 0.370 | 0.611 |
| College | ed4 | −0.915 | 0.588 | 0.120 | 0.231 | 0.365 | 0.526 |
| Working status | 0.167 | 0.358 | |||||
| Worker | |||||||
| Unemployed | w2 | 0.135 | 0.174 | 0.439 | 0.031 | 0.182 | 0.867 |
| Student | w3 | 0.224 | 0.167 | 0.180 | 0.216 | 0.177 | 0.221 |
| Homemaker | w4 | 0.582 | 0.275 | 0.034 | 0.436 | 0.262 | 0.096 |
| Retired | w5 | −0.006 | 0.298 | 0.983 | −0.031 | 0.264 | 0.906 |
| Organic | 0.145 | 0.000 | |||||
| Never | |||||||
| Seldom | bb2 | −0.209 | 0.098 | 0.033 | −0.218 | 0.099 | 0.028 |
| Sometimes | bb3 | 0.132 | 0.169 | 0.436 | 0.583 | 0.147 | 0.000 |
| Often | bb4 | −0.105 | 0.104 | 0.314 | 0.504 | 0.120 | 0.000 |
| Always | bb5 | 0.024 | 0.140 | 0.866 | 0.817 | 0.160 | 0.000 |
| Origin | 0.006 | 0.000 | |||||
| Absol. not important | |||||||
| Not important | bo2 | 0.177 | 0.368 | 0.631 | 0.116 | 0.365 | 0.751 |
| Indifferent | bo3 | 0.559 | 0.323 | 0.084 | 0.460 | 0.328 | 0.161 |
| Important | bo4 | 0.725 | 0.310 | 0.019 | 0.812 | 0.315 | 0.010 |
| Very important | bo5 | 0.769 | 0.310 | 0.013 | 0.897 | 0.317 | 0.005 |
| Technophobia | TFI | −0.368 | 0.046 | 0.000 | −0.301 | 0.045 | 0.000 |
| Observations | 852 | 852 | |||||
| Pseudo R2 | 0.052 | 0.076 | |||||
| Wald chi2 | 115.38 | 0.000 | 152.01 | 0.000 | |||
Note: Figures in Italic font report the p-values of a test on the joint significance of the regression coefficient of the corresponding group of variables (demography, education, working status, organic, origin).
Table 6.
Marginal probabilities.
| TNUT | TENV | ||||||||||
|---|---|---|---|---|---|---|---|---|---|---|---|
| Variables | TNUT = 1 | TNUT = 2 | TNUT = 3 | TNUT = 4 | TNUT = 5 | TENV = 1 | TENV = 2 | TENV = 3 | TENV = 4 | TENV = 5 | |
| Female respondent | 0.001 | 0.002 | 0.001 | −0.001 | −0.003 | 0.003 | 0.004 | 0.004 | 0.002 | −0.013 | |
| Demography | Age of respondent | −0.001 | −0.001 | −0.001 | 0.001 | 0.003 | −0.003 | −0.005 | −0.004 | −0.002 | 0.015 |
| Age squared | 0.000 | 0.000 | 0.000 | 0.000 | 0.000 | 0.000 | 0.000 | 0.000 | 0.000 | 0.000 | |
| Elementary school | |||||||||||
| Middle school * | 0.153 | 0.122 | 0.041 | −0.160 | −0.155 | −0.007 | −0.012 | −0.011 | −0.008 | 0.039 | |
| Educational | High school * | 0.150 | 0.158 | 0.082 | −0.123 | −0.266 | −0.014 | −0.022 | −0.020 | −0.013 | 0.067 |
| College * | 0.088 | 0.126 | 0.087 | −0.029 | −0.272 | −0.018 | −0.027 | −0.024 | −0.011 | 0.081 | |
| Worker | |||||||||||
| Unemployed * | −0.013 | −0.020 | −0.014 | 0.007 | 0.040 | −0.002 | −0.004 | −0.003 | −0.002 | 0.011 | |
| Employment | Student * | −0.022 | −0.033 | −0.022 | 0.012 | 0.065 | −0.015 | −0.024 | −0.023 | −0.016 | 0.078 |
| Homemaker * | −0.039 | −0.072 | −0.061 | −0.024 | 0.196 | −0.023 | −0.042 | −0.044 | −0.058 | 0.166 | |
| Retired * | 0.001 | 0.001 | 0.001 | 0.000 | −0.002 | 0.002 | 0.004 | 0.003 | 0.002 | −0.011 | |
| Never | |||||||||||
| Seldom * | 0.024 | 0.032 | 0.019 | −0.020 | −0.056 | 0.018 | 0.027 | 0.022 | 0.008 | −0.075 | |
| Organic | Sometimes * | −0.013 | −0.019 | −0.013 | 0.007 | 0.039 | −0.028 | −0.053 | −0.057 | −0.086 | 0.224 |
| Often * | 0.012 | 0.016 | 0.010 | −0.009 | −0.028 | −0.028 | −0.050 | −0.051 | −0.062 | 0.190 | |
| Always * | −0.002 | −0.004 | −0.002 | 0.002 | 0.007 | −0.035 | −0.068 | −0.076 | −0.135 | 0.314 | |
| Absol. not important | |||||||||||
| Origin | Not important * | −0.016 | −0.026 | −0.018 | 0.007 | 0.053 | −0.008 | −0.013 | −0.012 | −0.009 | 0.042 |
| Indifferent * | −0.040 | −0.072 | −0.058 | −0.015 | 0.185 | −0.025 | −0.045 | −0.046 | −0.060 | 0.175 | |
| Important * | −0.070 | −0.102 | −0.070 | 0.028 | 0.215 | −0.056 | −0.087 | −0.080 | −0.070 | 0.293 | |
| Very important * | −0.082 | −0.111 | −0.072 | 0.048 | 0.217 | −0.070 | −0.101 | −0.088 | −0.055 | 0.314 | |
| TFI | 0.039 | 0.055 | 0.036 | −0.027 | −0.103 | 0.023 | 0.035 | 0.031 | 0.017 | −0.107 |
* The marginal probability is for a discrete change in a binary variable from 0 to 1.
Table 7.
Regression of willingness to try food with upcycled ingredients and superior nutrition properties (TNUT) by generations.
Table 7.
Regression of willingness to try food with upcycled ingredients and superior nutrition properties (TNUT) by generations.
| Generation Z (n= 215) | Millennials (n= 267) | Generation X (n= 264) | Baby Boomers+ (n= 106) | ||||||
|---|---|---|---|---|---|---|---|---|---|
| Coeff | p-Val | Coeff | p-Val | Coeff | p-Val | Coeff | p-Val | ||
| Demography | 0.015 | 0.661 | 0.651 | 0.316 | |||||
| Female respondent | Genb | −0.185 | 0.221 | 0.162 | 0.262 | 0.140 | 0.319 | −0.085 | 0.724 |
| Age of respondent | Age | −2.182 | 0.109 | 0.089 | 0.753 | −0.341 | 0.359 | 0.507 | 0.075 |
| Age squared | age2 | 0.053 | 0.088 | −0.001 | 0.732 | 0.004 | 0.362 | −0.004 | 0.071 |
| Education | 0.679 | 0.591 | 0.186 | 0.183 | |||||
| Elementary school | |||||||||
| Middle school | ed2 | −0.056 | 0.960 | 0.786 | 0.229 | −1.507 | 0.033 | ||
| High school | ed3 | −0.171 | 0.383 | −0.017 | 0.955 | −0.775 | 0.071 | −1.462 | 0.046 |
| College | ed4 | −0.030 | 0.918 | −0.682 | 0.123 | −1.496 | 0.034 | ||
| Working status | 0.015 | 0.560 | 0.000 | 0.626 | |||||
| Worker | |||||||||
| Unemployed | w2 | −0.151 | 0.820 | 0.191 | 0.414 | 0.186 | 0.633 | −0.737 | 0.429 |
| Student | w3 | 0.571 | 0.351 | 0.318 | 0.253 | 8.978 | 0.000 | ||
| Homemaker | w4 | −0.309 | 0.599 | 0.817 | 0.014 | 0.511 | 0.531 | ||
| Retired | w5 | −0.278 | 0.424 | ||||||
| Organic | 0.300 | 0.148 | 0.064 | 0.493 | |||||
| Never | |||||||||
| Seldom | bb2 | −0.130 | 0.497 | −0.370 | 0.024 | −0.446 | 0.022 | 0.288 | 0.295 |
| Sometimes | bb3 | 0.444 | 0.101 | −0.147 | 0.676 | 0.127 | 0.639 | 0.111 | 0.881 |
| Often | bb4 | 0.163 | 0.468 | −0.128 | 0.539 | −0.301 | 0.106 | 0.077 | 0.824 |
| Always | bb5 | 0.209 | 0.437 | −0.537 | 0.093 | 0.062 | 0.791 | 0.512 | 0.115 |
| Origin | 0.874 | 0.441 | 0.000 | 0.115 | |||||
| Absol. not important | |||||||||
| Not important | bo2 | 0.024 | 0.979 | 0.876 | 0.231 | −0.601 | 0.207 | 0.129 | 0.932 |
| Indifferent | bo3 | −0.230 | 0.760 | 1.225 | 0.081 | 0.501 | 0.214 | 0.717 | 0.616 |
| Important | bo4 | −0.117 | 0.875 | 1.170 | 0.087 | 0.592 | 0.123 | 1.265 | 0.375 |
| Very important | bo5 | −0.288 | 0.698 | 1.110 | 0.109 | 0.870 | 0.027 | 1.327 | 0.337 |
| Technophobia | TFI | −0.457 | 0.000 | −0.525 | 0.000 | −0.255 | 0.002 | −0.337 | 0.002 |
| R2 | 0.072 | 0.100 | 0.075 | 0.094 | |||||
Table 8.
Regression of willingness to try food with upcycled ingredients and lower environmental impact (TENV) by Generations.
Table 8.
Regression of willingness to try food with upcycled ingredients and lower environmental impact (TENV) by Generations.
| Generation Z | Millennials | Generation X | Baby Boomers+ | ||||||
|---|---|---|---|---|---|---|---|---|---|
| Coeff | p-Val | Coeff | p-Val | Coeff | p-Val | Coeff | p-Val | ||
| Demography | 0.852 | 0.624 | 0.570 | 0.425 | |||||
| Female respondent | Genb | 0.013 | 0.938 | 0.005 | 0.976 | −0.041 | 0.802 | −0.082 | 0.738 |
| Age of respondent | Age | −0.760 | 0.585 | −0.360 | 0.194 | −0.162 | 0.694 | 0.032 | 0.912 |
| Age squared | age2 | 0.019 | 0.564 | 0.005 | 0.199 | 0.002 | 0.657 | −0.001 | 0.795 |
| Education | 0.084 | 0.001 | 0.658 | 0.167 | |||||
| Elementary school | (omitted) | ||||||||
| Middle school | ed2 | −0.844 | 0.038 | 1.266 | 0.192 | −0.277 | 0.598 | ||
| High school | ed3 | −0.403 | 0.068 | 0.988 | 0.001 | −0.251 | 0.608 | 0.135 | 0.809 |
| College | ed4 | 1.151 | 0.000 | −0.369 | 0.461 | −0.473 | 0.353 | ||
| Working status | 0.007 | 0.436 | 0.000 | 0.500 | |||||
| Worker | |||||||||
| Unemployed | w2 | 0.948 | 0.177 | −0.178 | 0.406 | 0.379 | 0.376 | −0.931 | 0.330 |
| Student | w3 | 1.265 | 0.002 | 0.218 | 0.442 | 8.193 | 0.000 | ||
| Homemaker | w4 | −0.529 | 0.239 | 0.827 | 0.012 | 1.177 | 0.297 | ||
| Retired | w5 | 0.081 | 0.816 | ||||||
| Organic | 0.004 | 0.013 | 0.000 | 0.023 | |||||
| Never | |||||||||
| Seldom | bb2 | −0.133 | 0.479 | −0.320 | 0.082 | −0.617 | 0.001 | 0.097 | 0.725 |
| Sometimes | bb3 | 0.635 | 0.046 | 0.798 | 0.018 | 0.342 | 0.086 | 0.907 | 0.101 |
| Often | bb4 | 0.602 | 0.007 | 0.261 | 0.240 | 0.564 | 0.025 | 1.560 | 0.001 |
| Always | bb5 | 0.596 | 0.070 | 0.217 | 0.412 | 1.831 | 0.000 | 0.466 | 0.330 |
| Origin | 0.057 | 0.450 | 0.000 | 0.000 | |||||
| Absol. not important | |||||||||
| Not important | bo2 | 1.241 | 0.029 | 1.206 | 0.203 | −1.585 | 0.004 | 0.706 | 0.486 |
| Indifferent | bo3 | 0.855 | 0.024 | 1.381 | 0.140 | −0.754 | 0.101 | 1.337 | 0.188 |
| Important | bo4 | 1.064 | 0.004 | 1.512 | 0.096 | −0.174 | 0.685 | 2.282 | 0.030 |
| Very important | bo5 | 1.016 | 0.006 | 1.536 | 0.093 | 0.059 | 0.891 | 2.321 | 0.020 |
| Technophobia | TFI | −0.366 | 0.000 | −0.313 | 0.000 | −0.274 | 0.001 | −0.461 | 0.000 |
| R2 | 0.082 | 0.077 | 0.161 | 0.179 | |||||
Table 9.
Summary of the findings of the generation analysis *.
| > | Full Sample | Generation Z | Millennials | Generation X | Baby Boomers+ | |||||
|---|---|---|---|---|---|---|---|---|---|---|
| Var. Group | TNUT | TENV | TNUT | TENV | TNUT | TENV | TNUT | TENV | TNUT | TENV |
| Demography | ✗ | ✗ | ✓✓ | ✗ | ✗ | ✗ | ✗ | ✗ | ✗ | ✗ |
| Education | ✗ | ✗ | ✗ | ✓ | ✗ | ✓✓ | ✗ | ✗ | ✗ | ✗ |
| Emp. Status | ✗ | ✗ | ✓✓ | ✓✓ | ✗ | ✗ | ✓✓ | ✓✓ | ✗ | ✗ |
| Organic | ✗ | ✓✓ | ✗ | ✓✓ | ✗ | ✓✓ | ✓ | ✓✓ | ✗ | ✓✓ |
| Origin | ✓✓ | ✓✓ | ✗ | ✓ | ✗ | ✗ | ✓✓ | ✓✓ | ✗ | ✓✓ |
| Technophobia | ✓✓ | ✓✓ | ✓✓ | ✓✓ | ✓✓ | ✓✓ | ✓✓ | ✓✓ | ✓✓ | ✓✓ |
* The null hypothesis that all coefficients in the variable group are jointly equal to zero was: (✗) not rejected, (✓) rejected at 90% confidence level, (✓✓) rejected at 95% confidence level in an χ2 test.
© 2020 by the authors. Licensee MDPI, Basel, Switzerland. This article is an open access article distributed under the terms and conditions of the Creative Commons Attribution (CC BY) license (http://creativecommons.org/licenses/by/4.0/).
Share and Cite
MDPI and ACS Style
Perito, M.A.; Coderoni, S.; Russo, C. Consumer Attitudes towards Local and Organic Food with Upcycled Ingredients: An Italian Case Study for Olive Leaves. Foods 2020, 9, 1325. https://0-doi-org.brum.beds.ac.uk/10.3390/foods9091325
AMA Style
Perito MA, Coderoni S, Russo C. Consumer Attitudes towards Local and Organic Food with Upcycled Ingredients: An Italian Case Study for Olive Leaves. Foods. 2020; 9(9):1325. https://0-doi-org.brum.beds.ac.uk/10.3390/foods9091325
Chicago/Turabian StylePerito, Maria Angela, Silvia Coderoni, and Carlo Russo. 2020. "Consumer Attitudes towards Local and Organic Food with Upcycled Ingredients: An Italian Case Study for Olive Leaves" Foods 9, no. 9: 1325. https://0-doi-org.brum.beds.ac.uk/10.3390/foods9091325
Note that from the first issue of 2016, this journal uses article numbers instead of page numbers. See further details here.