Article

Potential of Propolis Extract as a Natural Antioxidant and Antimicrobial in Gelatin Films Applied to Rainbow Trout (Oncorhynchus mykiss) Fillets

1
Animal Production and Technologies Department, Faculty of Agricultural Sciences and Technologies, Nigde Omer Halisdemir University, 51240 Nigde, Turkey
2
Nutrition and Food Science, Faculty of Science, Universidad de Burgos, 09001 Burgos, Spain
3
Department of Animal Source Food Technology, Faculty of Agriculture, University of Belgrade, Nemanjina 6, 11080 Belgrade, Serbia
4
Nutrition and Food Science Area, Department of Preventive Medicine and Public Health, Food Science, Toxicology and Forensic Medicine, Faculty of Pharmacy, Universitat de València, Avda Vicent Andrés Estellés, s/n. 46100 Burjassot València, Spain
*
Author to whom correspondence should be addressed.
Submission received: 25 September 2020 / Revised: 25 October 2020 / Accepted: 29 October 2020 / Published: 1 November 2020

Abstract

:
Usage of edible films and coatings alone or incorporated with natural extracts are a new approach to preservation and packaging of food. In this study, therefore, the microbiological, chemical quality, and sensorial changes of rainbow trout fillets coated with gelatin films supplemented with propolis extract (PE) (2, 8, 16%), as a source of polyphenols, were determined during 15 days of refrigerated storage (4 ± 1 °C). According to peroxide value (PV) and thiobarbituric acid reactive substances (TBARS) assays, lipid oxidation was delayed in the fillets coated with gelatin films incorporated with PE comparing with the control and gelatin-coated (without PE) fillets. The total volatile basic nitrogen (TVB-N) value of rainbow trout fillets showed an increase in all groups at the end of storage, observing the lowest values in the fillets coated with gelatin films prepared with 16% PE. Gelatin films enriched with PE had great inhibitory effects on the microbial growth in rainbow trout fillets. The addition of PE enhanced the effectiveness of gelatin films and delayed the lipid oxidation and sensory and microbial deterioration in trout fillets coated with these films. Thus, PE can be recommended to be used as a natural antioxidant and antimicrobial additive with gelatin films to maintain rainbow trout fillet quality.

Graphical Abstract

1. Introduction

Rainbow trout (Oncorhynchus mykiss, Walbaum) is an important fish species in worldwide aquaculture, having a high nutritional value and consumed typically both fresh and frozen. The production of rainbow trout has grown exponentially over the last years reaching ≈110 thousand tonnes in Turkey mainly due to its desirable characteristics. However, the high water content, neutral pH, and high amount of polyunsaturated fatty acids make the trout susceptible to spoilage. Therefore, preservation techniques are required in order to maintain fish quality and freshness. Typically, temperature-based preservation techniques such as cooling and freezing are efficient in reducing the deterioration and extending the shelf life of fish [1,2]. However, some modifications in fish quality such as texture, color, and organoleptic properties still have been triggered during these processes [2]. Therefore, preservation techniques should be combined with active packaging and natural food additives in order to delay the decline of product quality and to achieve extended shelf life [3].
Recently, researchers have tried various biopolymer films and coatings alone/or in combination with plant additives to improve the shelf life of fish products [4]. Edible films and coatings such as chitosan, gelatin, alginate, and whey proteins show antibacterial, antifungal, and antioxidant activity, being an effective and eco-friendly way for maintaining the safety of a product during storage [5,6]. Gelatin is one of the most frequently used biodegradable polymers in the formation of films and coatings, which has barrier properties against lipids [7]. Furthermore, because of its biophysical, rheological, and functional properties, gelatin is extensively studied and highly applicable in the industry [8]. Propolis, perceived as a natural antioxidant and antibacterial source, is collected by honeybees from plant sources [9]. Propolis contains a wide variety of chemical compounds such as polyphenols, coumarins, sesquiterpene quinines, and amino acids, which can be considered as a chemical weapon against pathogens [9]. One of the most important groups are flavonoids, which represent around 50% of the propolis content. In addition to the functional properties of propolis, its use in food preservation is limited due to its resinous and bitter taste. For this reason, in this study, to avoid the direct use of propolis, a mixture of gelatin film–propolis was prepared that could exhibit reasonable sensory characteristics with extended shelf life. There are some studies related with the effects of both ethanolic and water extracts of propolis in fish fillets [10,11]. However, the incorporation of edible films with propolis extract is limited and conducted on chitosan films [12]. To the best of our knowledge, there is no study on the effects of gelatin-based edible films incorporated with propolis extract on fish fillets.
Therefore, the aim of this study was to increase the shelf life and to improve the overall quality of rainbow trout fillets wrapped with gelatin-based edible films incorporated with propolis extract. In order to assess the effectiveness of the gelatin film and incorporation of gelatin film with different concentrations of propolis extract, pH, lipid oxidation, total volatile basic nitrogen (TVB-N), microbial growth, and sensory changes were studied on trout fillets during 15 days under refrigeration (4 ± 1 °C).

2. Materials and Methods

2.1. Samples

Rainbow trout (Oncorhynchus mykiss) fillets were provided from a local fish farm located in Nigde (Turkey) and immediately (within 1 h) transported to the laboratory using ice boxes. Fish samples were gutted, beheaded, filleted, and washed. The fillets were divided into five groups and wrapped according to method of Ahmad et al. [13] with slight modifications. Dried films were removed from the foam dishes and sterilized under ultraviolet (UV) for 10 min. Fish fillets wrapped with gelatin (i) without propolis extract (PE) film were identified as GF, (ii) with gelatin film containing 2% PE named as P2, (iii) with gelatin film containing 8% PE named as P8, (iv) with gelatin film containing 16% PE named as P16 and one group left as control without wrapping. Each fillet was coated on both sides. Then all samples were put in the sterile foam plate, covered with stretch film (as a packaging material) and stored at 4 ± 1 °C for 15 days.

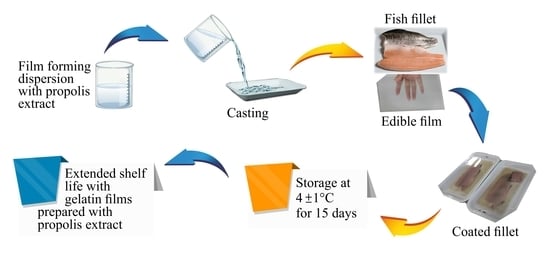
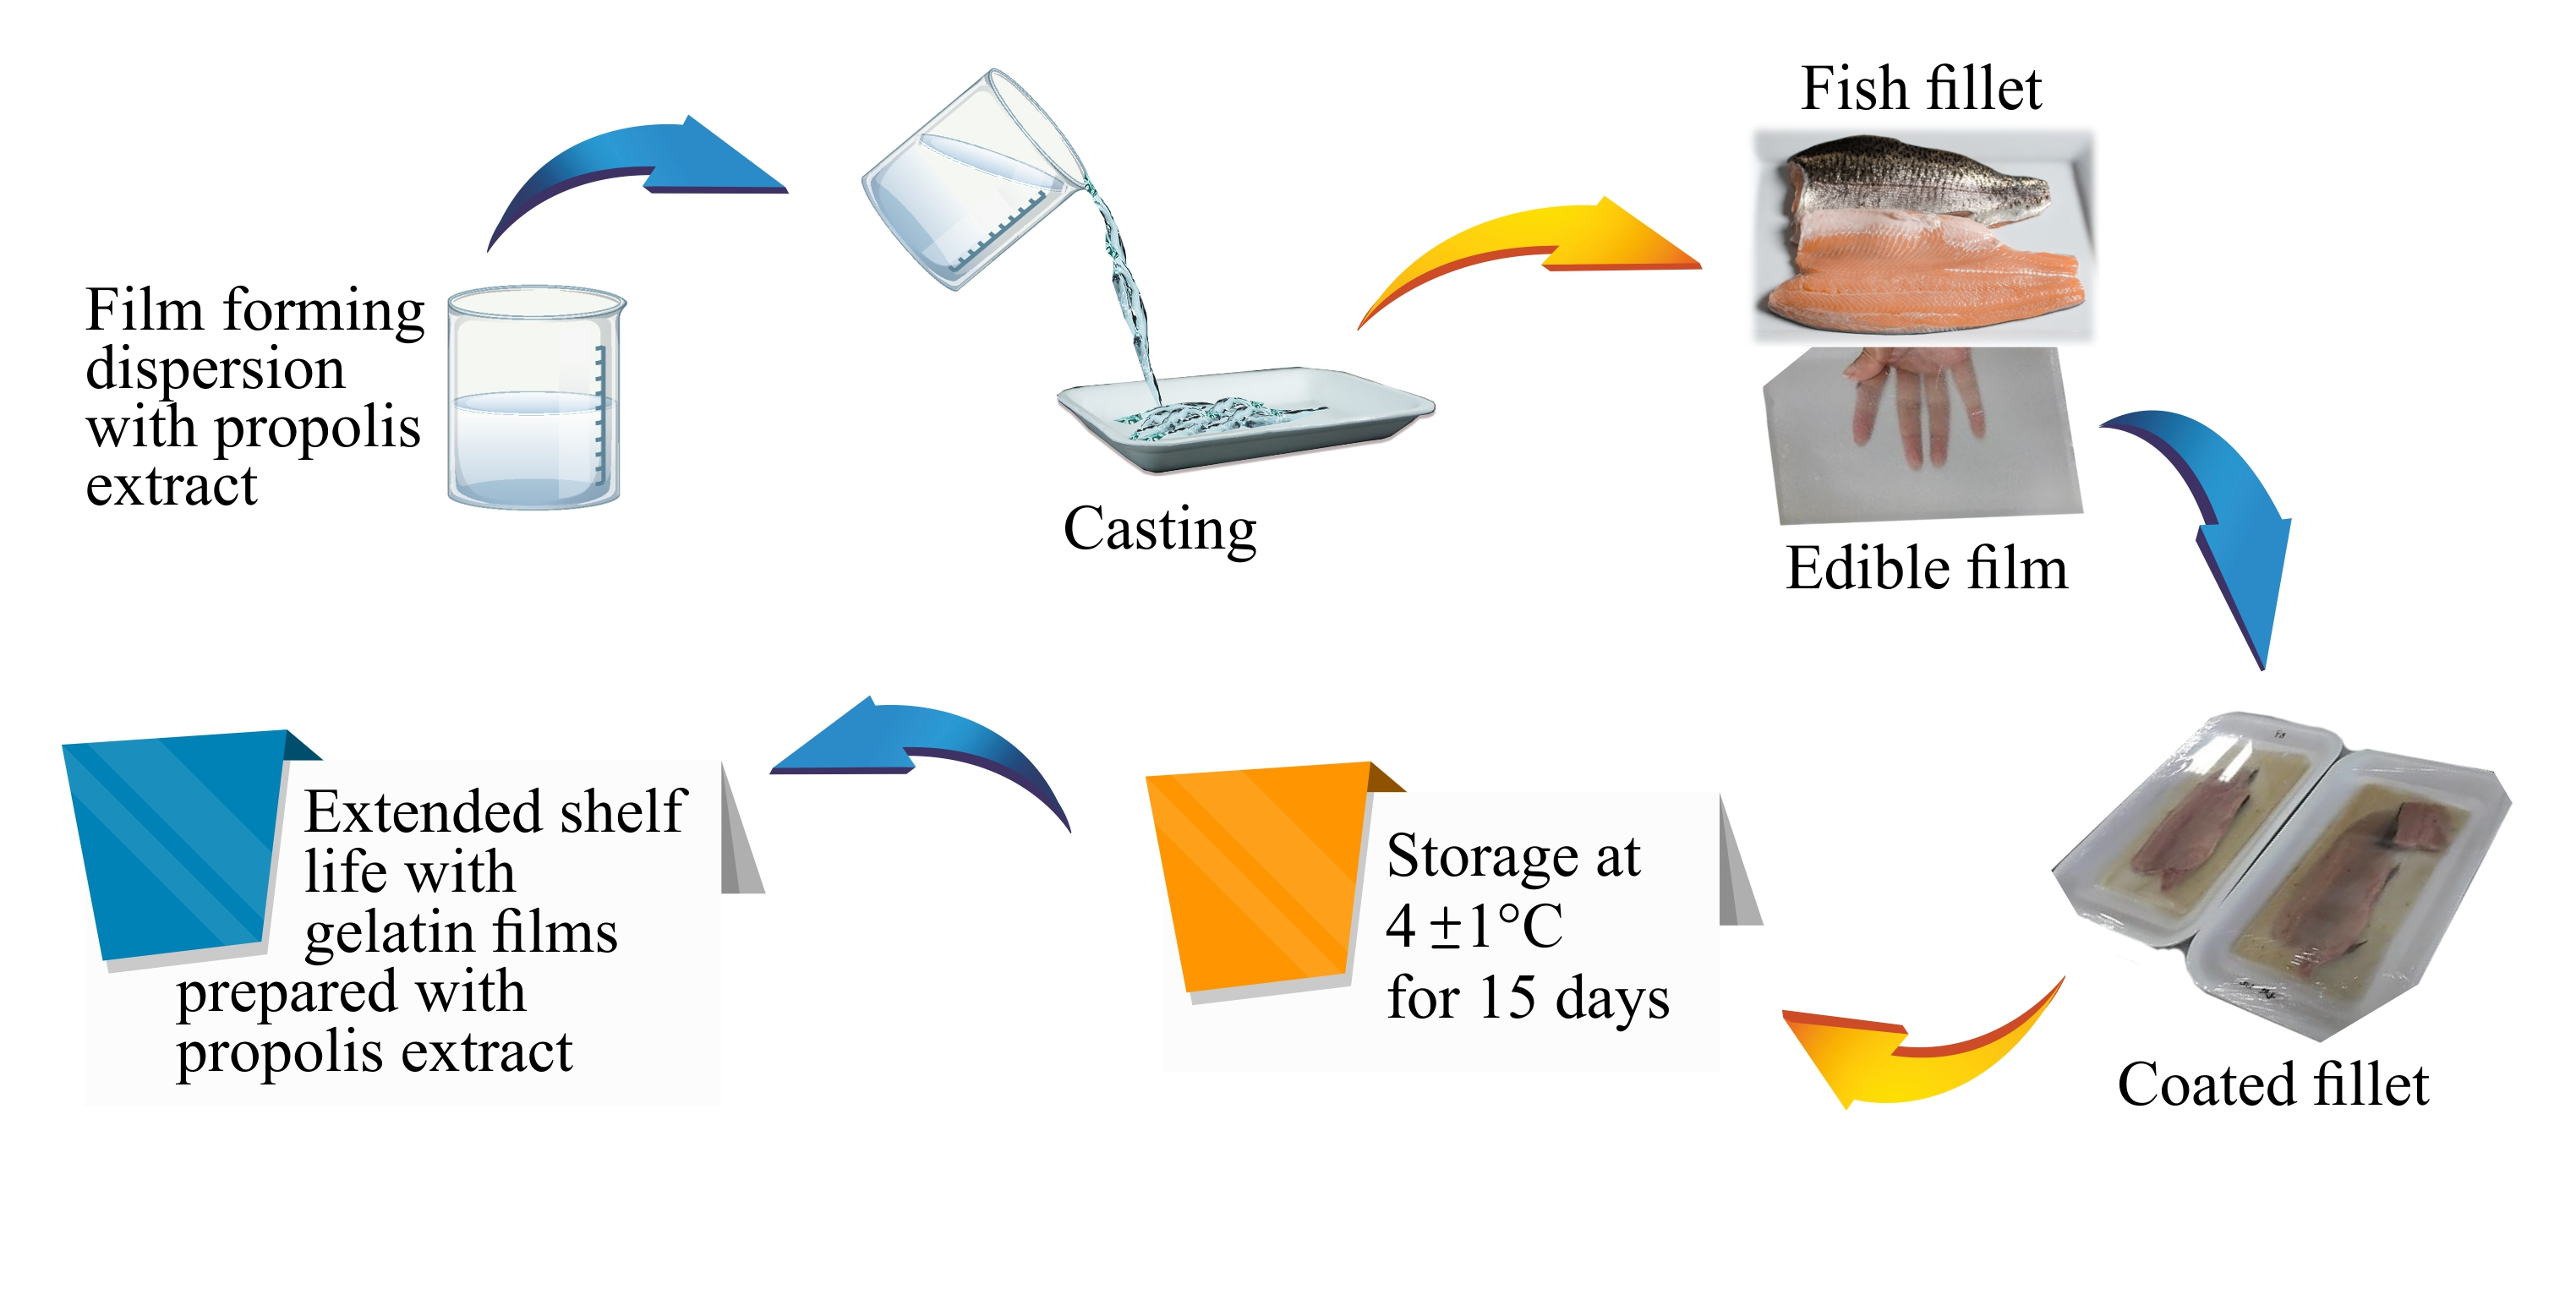
2.2. Propolis Extraction and Preparation of Gelatin Films

Propolis was obtained from a local market in Nigde, Turkey. It was ground into powder with a laboratory blender. Then, propolis powder and ethanol (70%) were put in a conical flash (1:10, w:v) and shaken for 5 h at 25 °C in a water bath. Then, the extracts were filtered and evaporated using a rotary evaporator at 45 °C.
The method previously described by Gomez-Estaca et al. [14] was used for the preparation of gelatin films with slight modifications. Glycerol (0.1 mL per g of gelatin) and D-sorbitol (0.15 g per g of gelatin) were added to the dissolved gelatin solution in distilled water (25 °C, for 30 min with shaking) (8 g/100 mL) and kept at 45 °C for 15 min. Propolis extracts (PE) were added to the film solution at different concentrations (2%, 8%, and 16% by volume per mass of gelatin). Film solutions were poured into square polystyrene foam dishes as 40 mL and put into a cabine for drying at room temperature for 48 h at 50% relative humidity.

2.3. Total Phenolic Content and Antioxidant Activity

The Folin–Ciocalteu colorimetric method was used for the determination of total phenolic content (TPC) of the propolis extracts [15]. Results were expressed as mg gallic acid equivalents/g sample (mg GAE/g sample). PE antioxidant activity was determined by means of the photometric method described by Re et al. [16]. The results were expressed in µmol Trolox equivalents (TE)/g sample.

2.4. Physicochemical Analysis

The pH values of the samples were determined by dipping the pH-meter probe into the fish homogenates (1:1, w:v, fish:distilled water).
For the determination of total volatile basic nitrogen (TVB-N), the method of Schormuller [17] was used. Homogenized fish samples (10 g) were put into the flask with the addition of 1 mg magnesium oxide. Then, the samples were boiled for 20 min and distilled into 10 mL of 0.1 mol equi/L HCl solution in a flask and Tashiro indicator was added. The flasks were titrated with 0.1 mol equi/L NaOH after distillation. The results were expressed as mg nitrogen/100 g sample.
The AOAC (Association of Official Analytical Chemists) method [18] was used in order to determine the peroxide value (PV). Two grams of sample were mixed with 30 mL of a solution consisting of glacial acetic acid:chloroform (2:3, v/v). After that, 1 mL of saturated potassium iodide (KI) solution was added, and the mixture was put under darkness for 5 min. The mixture was taken and 75 mL of distilled water were added; then the mixture was titrated with sodium thiosulfate (Na2S2O3) (0.1 M) with the addition of a starch solution as an indicator. The results were calculated as meq O2/kg.
A thiobarbituric acid reactive substances (TBARS) assay was determined according to the AOCS (American Oil Chemists’ Society) [19] method. Lipid dissolved in n-butanol was mixed with the same amount of TBA reagent (0.288 g/100 mL). The absorbance of the samples was measured with an UV–VIS spectrophotometer at 530 nm after incubation at 95 °C for 120 min in a water bath for the color reactions. Results were expressed as follows:
TBARS (mg malondialdehyde (MDA)/kg) = 50 × (absorbance of lipid − absorbance of blank)/sample weight (mg)

2.5. Microbiological Analysis

Ten grams of fish samples were mixed with 90 mL sterile ringer solution. Other decimal serial dilutions were used from this homogenate. Plate count agar (PCA) was used for the determination of total psychrophilic bacteria and total viable counts. Then, the plates were incubated at 8 °C for 7 days and 37 °C for 24–48 h, respectively. Yeast and mold were determined by plating on potato dextrose agar (PDA, pH 3.5) incubating the samples at 25 °C for 36–48 h. For the determination of Enterobacteriaceae, the pour plating method with violet red bile agar (VRBA) and incubation at 37 °C for 36–48 h was used.

2.6. Sensory Analysis

Sensory evaluation was conducted according to the method proposed by Amerina et al. [20] with slight modifications. Ten trained panelists aged between 25 and 35 years participated in sensory tests. The panelists were not informed about the experimental approach, and the samples were blind-coded with 3-digit random numbers. The gelatin films were removed before the fillets were served to the panelists. Separated sensory test boxes were used for the evaluation of samples under daylight at 24 °C. In order to test the samples, panelists were asked to open the plates covered with stretch film. The samples were assessed in terms of odor, texture, color, appearance, and overall acceptance on a nine-point hedonic scale during the storage period. A score of 9–7 indicated “very good”, a score of 6.9–4.0 “good”, and a score of 3.9–1.0 denoted as “spoiled”.

2.7. Statistical Analysis

All measurements were carried out in triplicate, and data were subjected to analysis of variance (ANOVA) and Duncan’s multiple range tests using the SPSS Version 18.0 statistical package (SPSS Inc., Chicago, IL, USA). Differences were regarded as statistically significant at p < 0.05. Statistical differences were marked with different letters. Capital letters indicate significant difference among groups, and lower-case letters indicate significant difference among storage days.

3. Results and Discussion

3.1. Total Phenolic Content and Antioxidant Capacity

In the present study, the value of TPC in the propolis extract was determined as 593.313 mg GAE/g, which was higher than that reported by Socha et al. [21] (150–197 mg GAE/g) and Aliyazicioglu et al. [22] (115–210 mg GAE/g). Similarly, Ozdal et al. [23] found the TPC of ethanolic extracts of Turkish propolis between 2748 and 19,970 mg GAE/100 g. In another study, Chaillou et al. [24] reported the amount of TPC in Argentina propolis between 92 and 170 mg GAE/g. Ciftci-Yilmaz [25] determined the TPC of Azerbaijan propolis extracted with ethanol (95%) between 10.94 and 79.23 mg GAE/g. Moreira et al. [26] reported that the methanolic extract of propolis samples contained 40.83–94.54 mg GAE/g total phenolic compounds.
It was stated that the phenolic compound content of propolis extract was significantly affected by the kind of solvent and concentration used [27]. Moreover, the essential factor influencing the TPC of propolis is floral origins of propolis, which exhibit various biological effects such as antioxidants and antimicrobials [28,29]. Our findings for TPC are in accordance with the results of Ahn et al. [30] and Kalogeropoulos et al. [31], who studied the TPC of Chinese propolis and Greek propolis, respectively.
The antioxidant activity of propolis extract in the present study was found to be 569.684 μmol TE/g propolis. Socha et al. [21] reported the antioxidant activity of propolis from various regions of Poland between 3.96 and 4.98 mM TE/g. Likewise Oses et al. [32] found the antioxidant capacity of Brazilian propolis (80% ethanolic extract) ranged between 25.5 and 439.2 µmol TE/g sample, while Serra-Bonvehi and Lacalle-Gutierrez [33] reported the antioxidant activity of Spanish propolis between 420 and 1430 μmol TE/g. In another study, antioxidant activity of Brazilian red propolis extracted with 70% ethanol was determined as 1223 μmol TE/g, which is higher than those of the reported studies by Oses et al. [32] and Andrea et al. [34]. Kumazawa et al. [35] and Ahn et al. [30] reported that quercetin and kaempferol, which are the most active flavonoids, contain five and four hydroxyl groups responsible for the antioxidant features. Therefore, the aforementioned factors influencing the phenolic compound content of propolis extract may also explain the wide range of antioxidant activities reported in the literature for this natural product.

3.2. Physicochemical Properties

First of all, the pH trend of trout fillets coated with and without gelatin films during storage at 4 °C was evaluated (Table 1). As can be seen in the table, the initial pH value of trout fillets was 6.482, which was lower than those values reported by other researchers for trout fillets [36,37,38]. It should be noted that the pH value of the control group was significantly higher (p < 0.05) than those fillets coated with gelatin film incorporated with PE, reaching values up to 7.548 at the end of the storage. Ludorf and Mayer [39] reported that the upper limit of pH value for fresh fish is between 6.8 and 7.0. In the present study, the pH value of trout fillets coated with gelatin film without PE reached a value of 7.524 after 15 days, while for the fillets coated with gelatin film incorporated with 8 and 16% PE, the pH values were 6.880 and 6.769, respectively. Similarly, Alparslan et al. [40] found that the initial pH value of trout samples was 6.30, which was the lowest value during the storage period in the samples coated with gelatin film enriched with laurel essential oil.
As was previously observed by other authors, the accumulation of alkaline compounds such as ammonia and trimethylamine, due to the activity of spoilage bacteria, promotes an increase in the pH values [41]. Moreover, Volpe et al. [38] reported that the generally dissociation of carbonic acid results in the increase of pH as the storage time progresses. As reported in the literature, a coating can protect the surface of the fillet from the spoiling effect of oxygen, which leads to a pH increase, probably as a result of basic amine production [42].
On the other hand, the changes of TVB-N content in the trout fillets wrapped with or without gelatin films during storage period were also evaluated (Table 1). The initial TVB-N value of trout fillets was 16.804 mg N/100 g and increased gradually during the storage time for both control and gelatin film-coated fillets. TVB-N is one of the most widely used quality indexes for fish, and the limit level of TVB-N was specified as 35 mg N/100 g by the European Commission [43] guidelines. In the present study, TVB-N values of the control and GF samples exceeded the limit value at the 6th and 9th day of the storage and reached 53.903 and 52.504 mg N/100 g at the end of the storage period, respectively. The activity of spoilage bacteria in amino acids of fish muscle causes the accumulation of volatile bases, thus promoting an increase of TVB-N [44]. TVB-N values of the fillets coated with gelatin film incorporated with PE were significantly (p < 0.05) lower at the end of the storage. Moreover, P8 and P16 groups showed the lowest (p < 0.05) TVB-N values, which did not exceed the limit value until the 15th day of storage.
Nowzari et al. [45] reported that the initial TVB-N value of trout fillets was 18.78 mg N/100 g, observing significantly lower values in coated fillets during storage. Similarly, Ojagh et al. [46] found the TVB-N value of trout fillets was 12.13 mg N/100 g at the beginning of storage, while after the 16th day of the storage, the samples coated with chitosan prepared with cinnamon oil reached lower TVB-N values (14.23 mg N/100 g) compared to the control (42.93 mg N/100 g) and chitosan coated samples (22.86 mg N/100 g). Other studies indicated that the incorporation of essential oils or plant extracts with edible films and coatings inhibited the TVB-N value increases in fish fillets [4,13,40,47]. Therefore, the results obtained in the present study suggest that the incorporation of PE with gelatin film is effective to enhance film properties, most probably due to the bioactive phenolic compounds found in propolis extract.
Moreover, taking into account lipid oxidation is the main cause of fish spoilage after microbial growth [48], the peroxide value (PV), which is an indicator of the primary oxidation products such as peroxides and hydroperoxides [49], was also determined in this work. The effect of gelatin film enriched with or without PE on the changes of PV of trout fillets is shown in Table 1. At the beginning of the storage, the PV of trout fillets was 2.004 meq O2/kg sample. The PV of all samples increased with the elapse of storage time; however, the highest (p < 0.05) values were found in the control and GF groups during the storage. At the end of storage, the PVs of control, GF, P2, P8, and P16 groups were 8.503, 7.002, 6.956, 5.505, and 5.001 meq O2/kg, respectively. Fillets coated with gelatin films incorporated with PE showed lower PV than those of control and GF groups during the whole storage period, which means that the addition of PE is an efficient way to increase the protective effect of gelatin film to retard the production of PV in trout fillets stored at 4 °C. According to Yuan et al. [50], the application of edible films and coatings with the incorporation of antioxidants represents a new approach to solve the oxidation problem in food products. For instance, the results of the present study are in agreement with those previously reported by Rezaei and Shahbazi [51] and Alparslan et al. [40], who reported that the enrichment of chitosan and gelatin films with essential oils and plant extracts was an effective tool to control the delay in lipid oxidation.
In order to evaluate the secondary lipid oxidation degree, the thiobarbituric acid reactive substances (TBARS) assay was conducted [52]. Changes in the TBARS values of all samples are presented in Table 1. As can be seen in the table, the initial TBARS value of trout fillets was 0.882 mg MDA/kg. TBARS values of the controls and gelatin coated fillets increased with the elapse of storage time. However, the fillets coated with gelatin films enriched with PE reached significantly (p < 0.05) lower TBARS values in comparison with the controls or gelatin coated samples. At the 15th day of storage, TBARS values of control, GF, P2, P8, and P16 were found as 1.588, 1.558, 1.488, 1.417, and 1.284 mg MDA/kg, respectively. The maximum TBARS level of frozen or chilled fish indicating good quality is 5 mg MDA/kg of tissue [53]. In the present study, TBARS values for all groups were much lower than the maximum limits throughout the storage period. Sun et al. [47] explained the reason for this phenomena as curing of the films on the surfaces of the gelatin films and forming a protective film that made the gelatin films free from direct interaction with the oxygen, which promotes lipid oxidation.
In a previous study, Jeon et al. [52] reported lower TBARS content in chitosan-coated herring and cod fillets than those of the uncoated samples during the storage period. Moreover, Ahmad et al. [13] found a lipid oxidation delay in sea bass coated with gelatin films enriched with lemongrass essential oil (LEO). They claimed that this was the result of the antioxidant property of LEO. Similar results were found by Alparslan et al. [40], who reported lower TBARS values in trout samples coated with gelatin films incorporated with laurel essential oil than those of control and gelatin film-coated samples. Reis et al. [54] also found that the supplementation of microencapsulated propolis extract resulted in a strong suppressing effect on oxidation in burger meat. Similarly, Spinelli et al. [55] observed lower lipid oxidation in fish burger supplemented with 5% spray-dried propolis than the control samples, mainly due to the higher polyphenol content of propolis.
In this study, gelatin coated samples combined with PE showed a lower lipid oxidation in comparison with gelatin-coated samples or control samples. The addition of PE into the gelatin film probably had a synergistic effect.

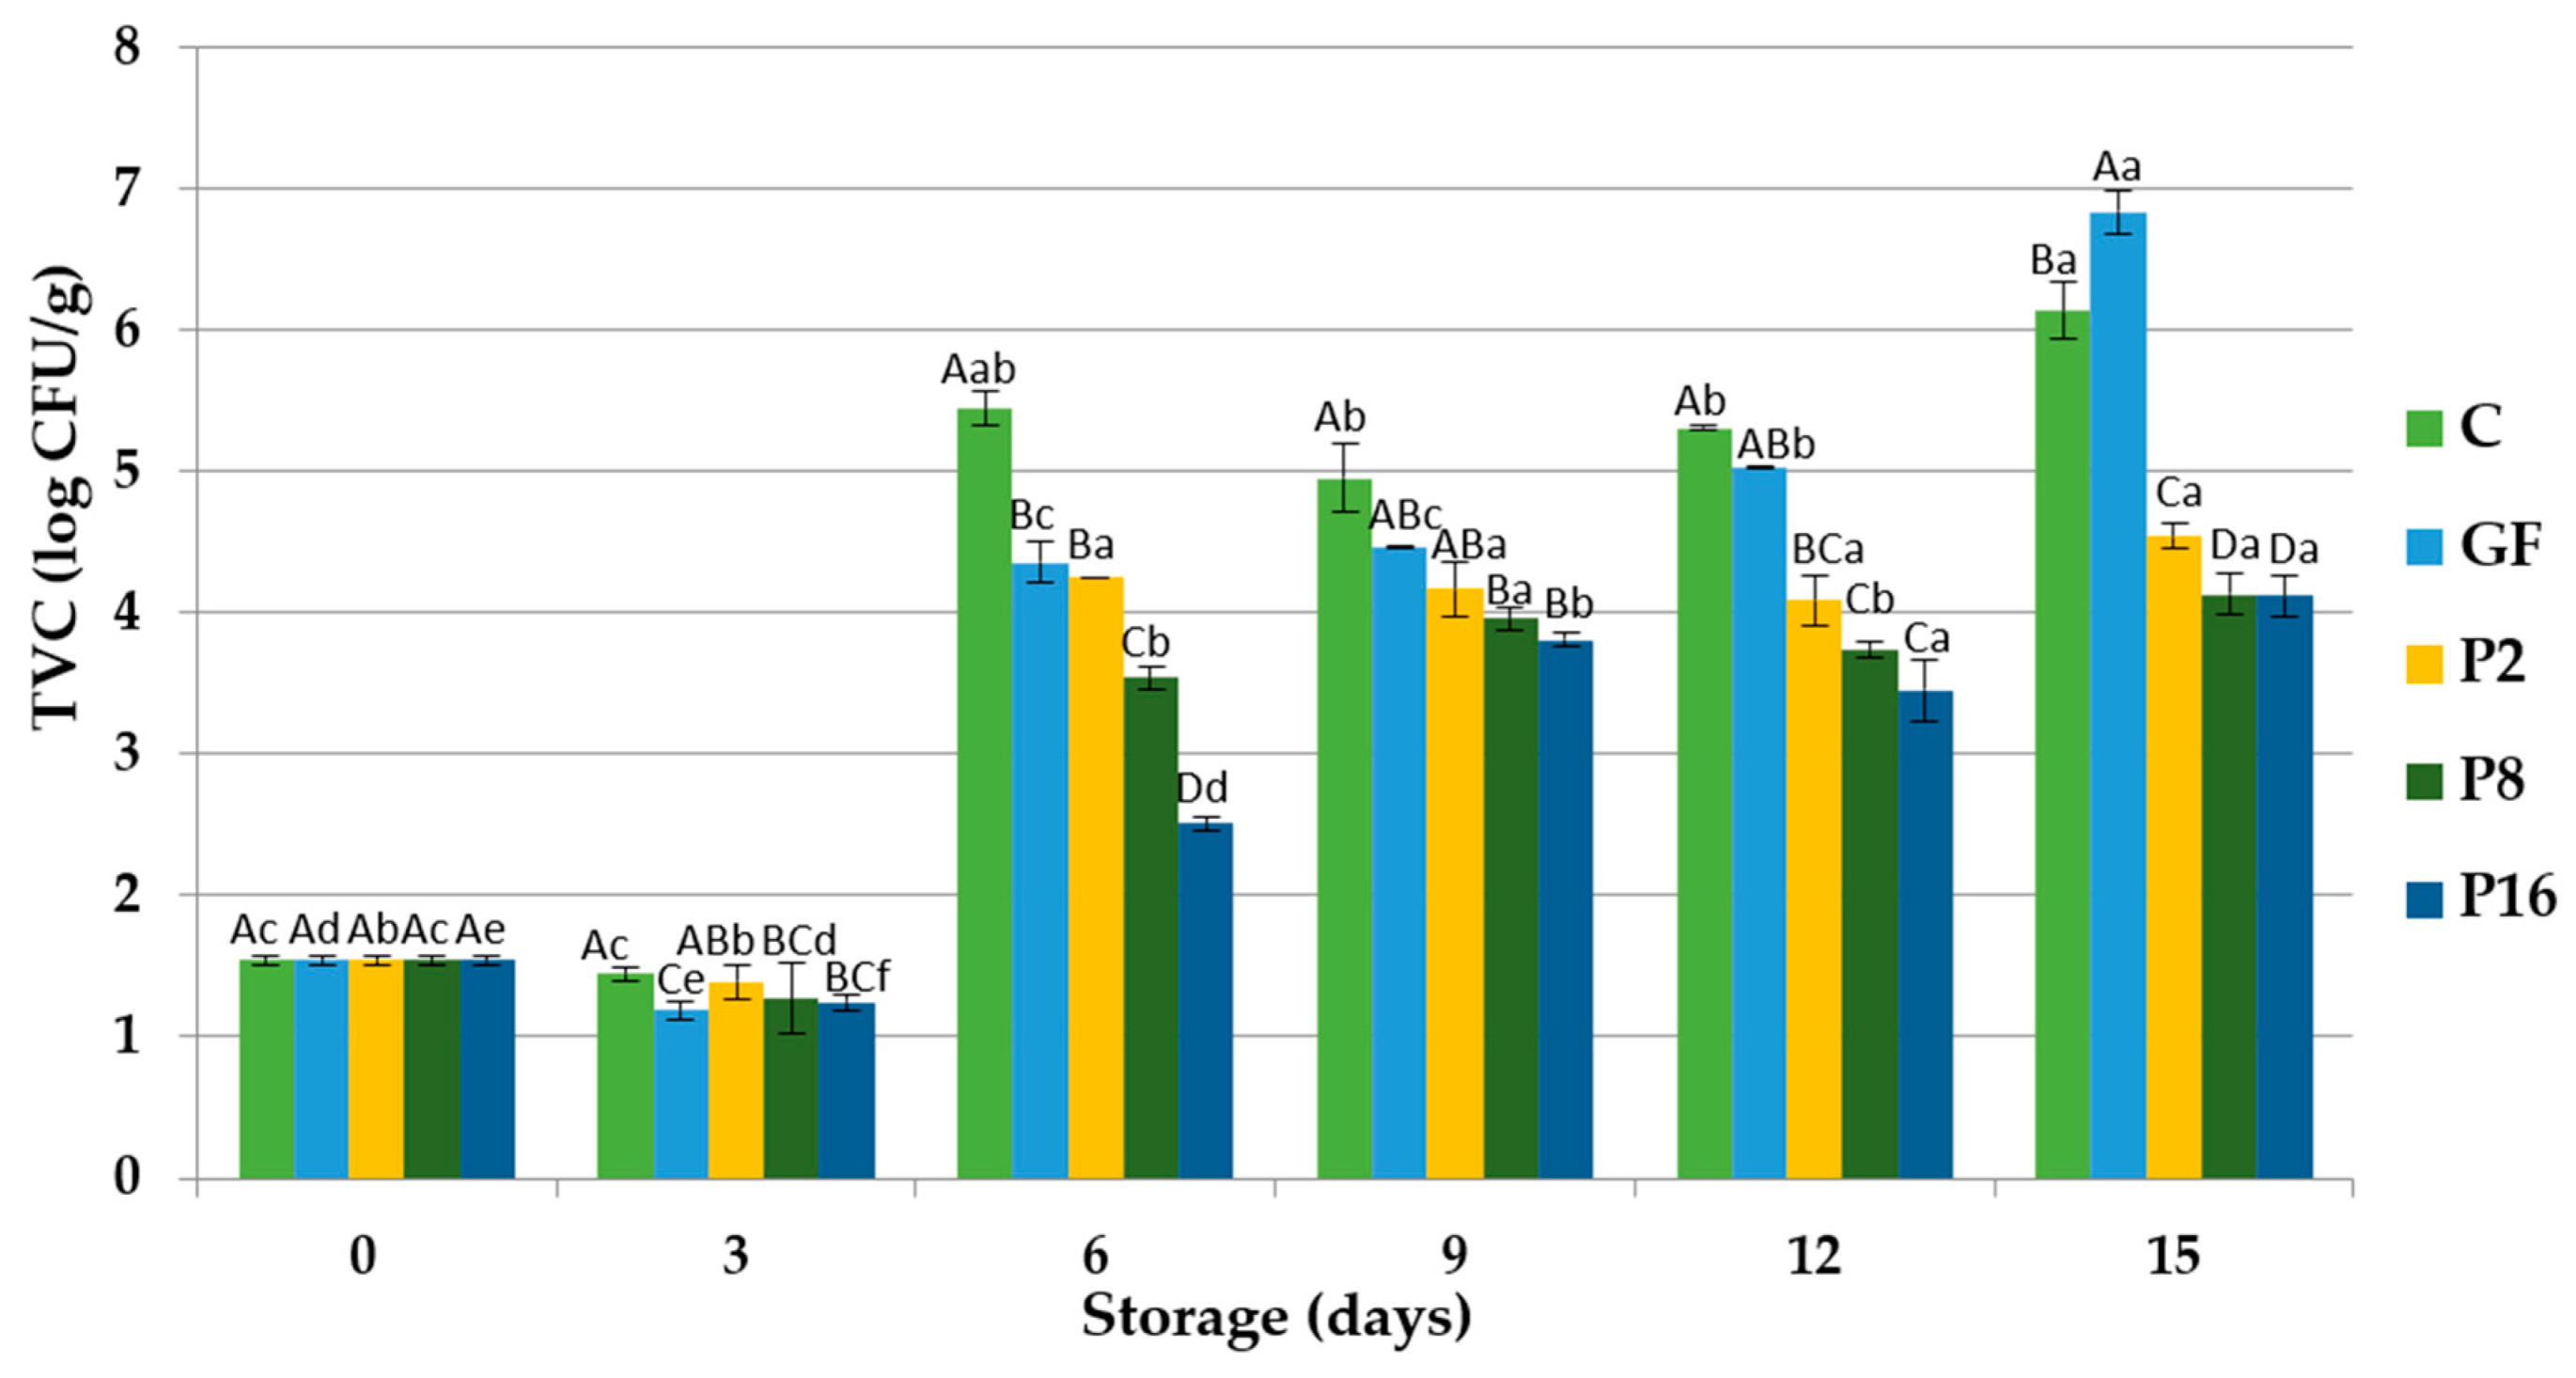
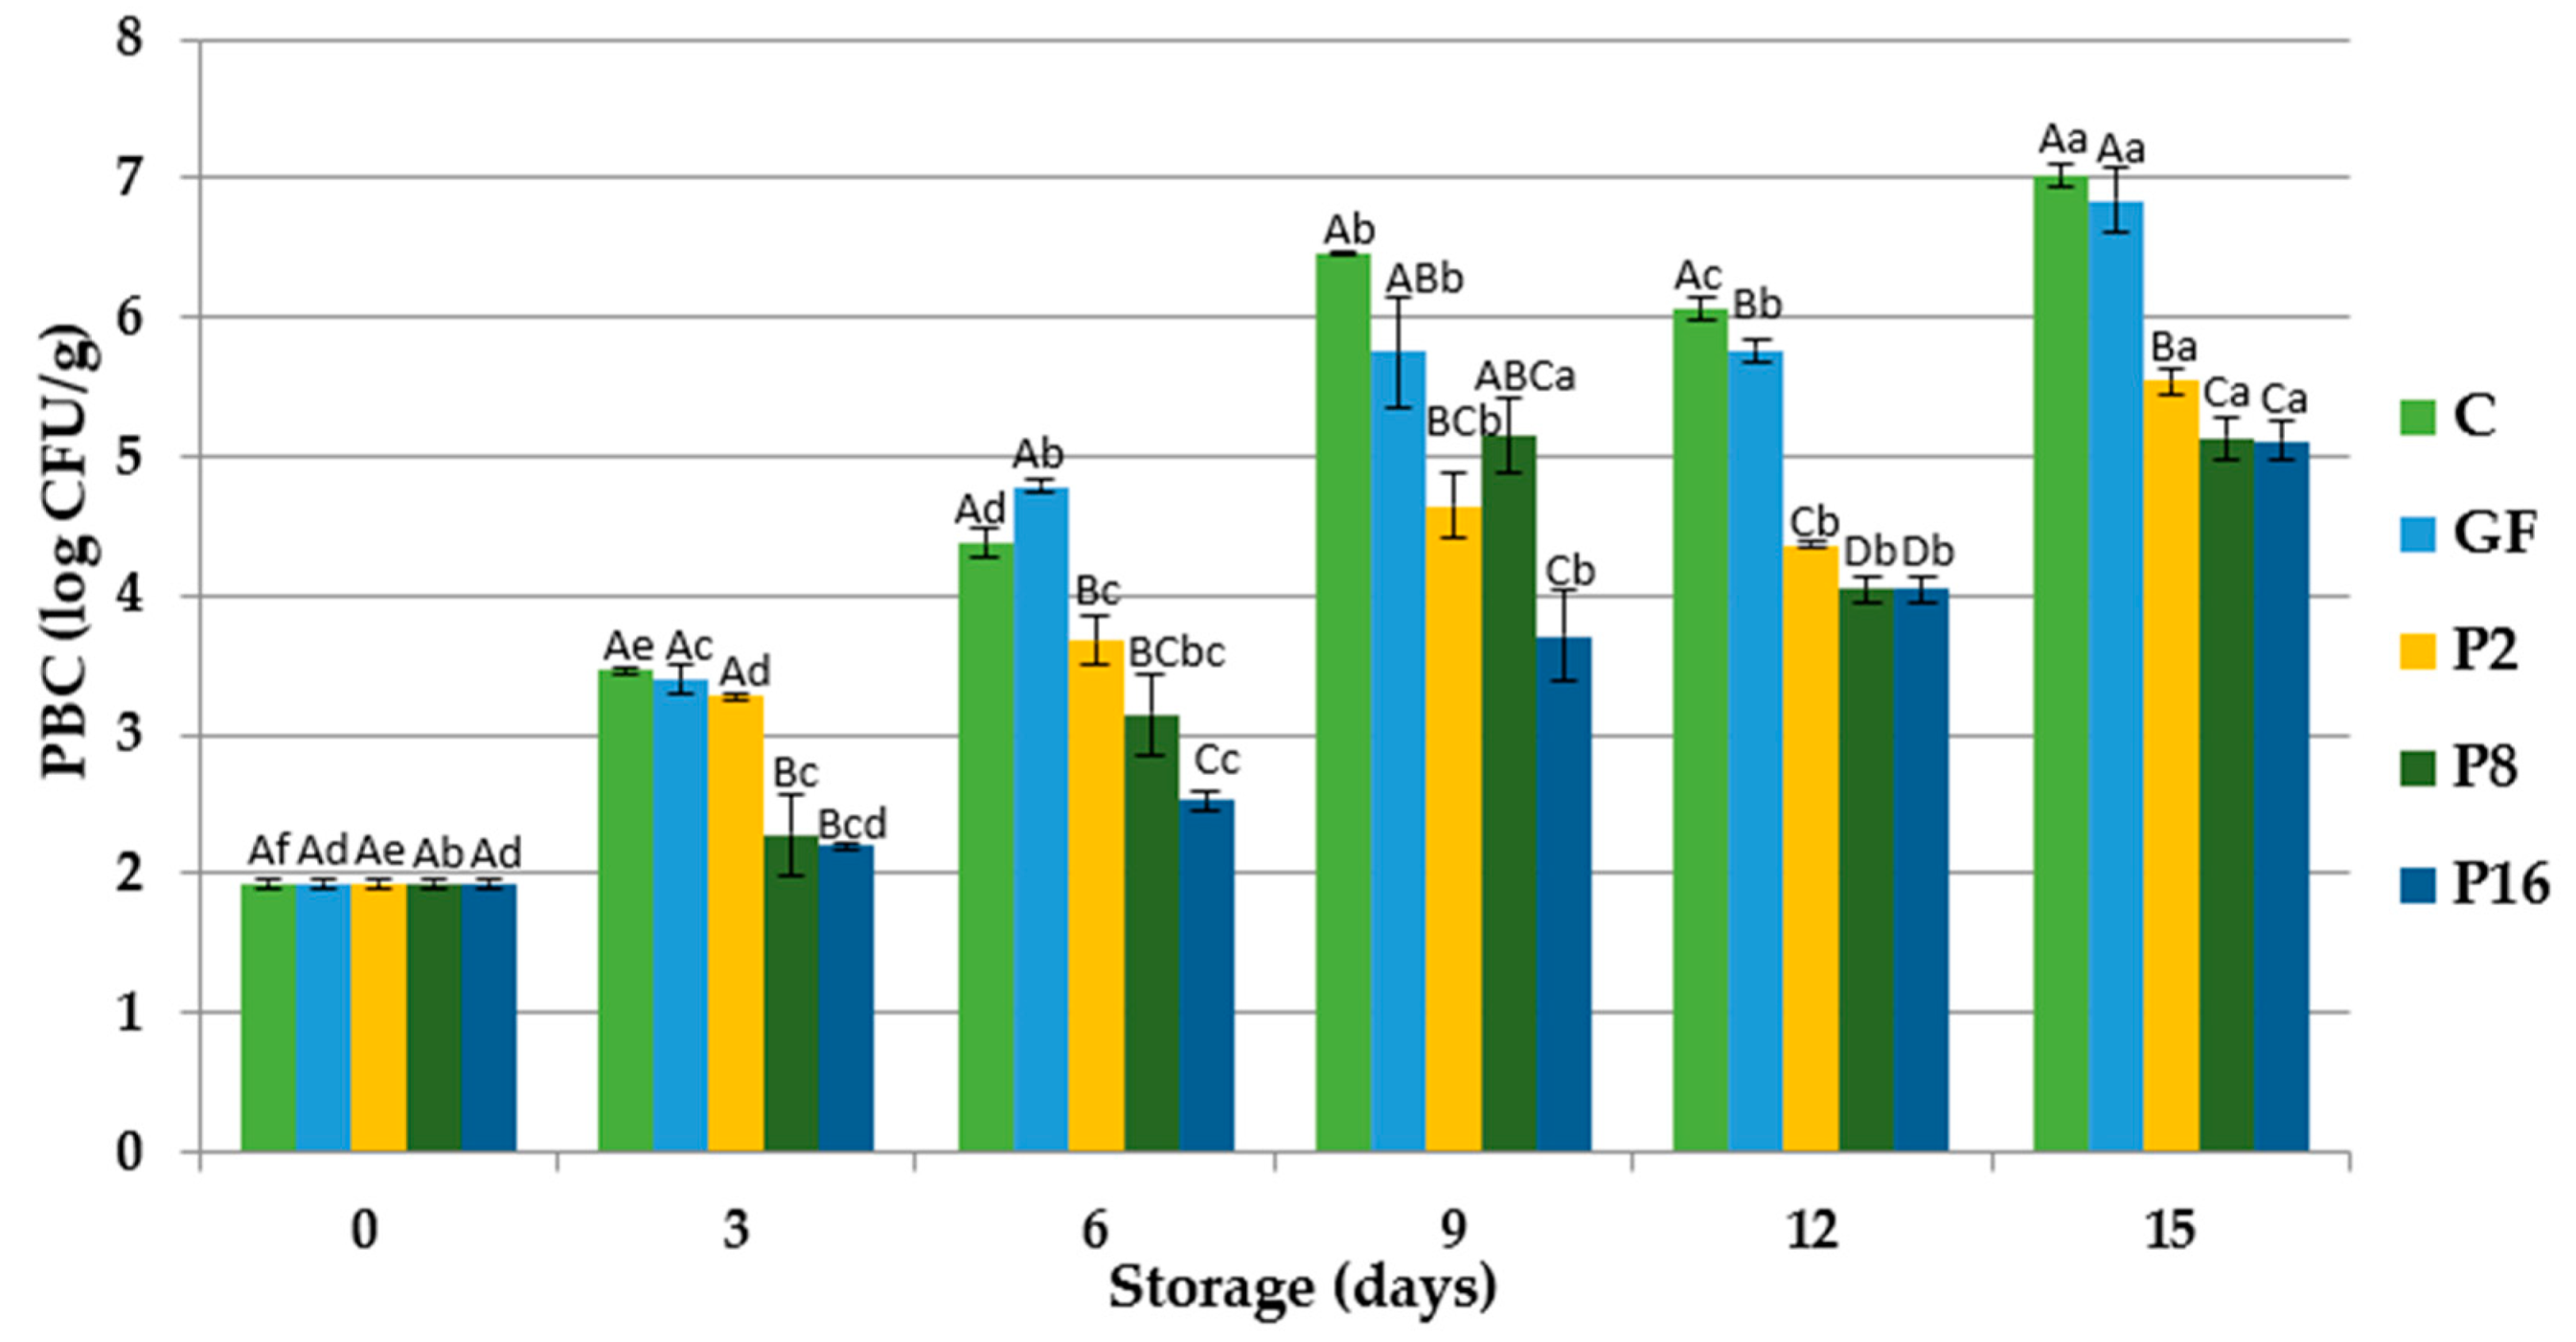
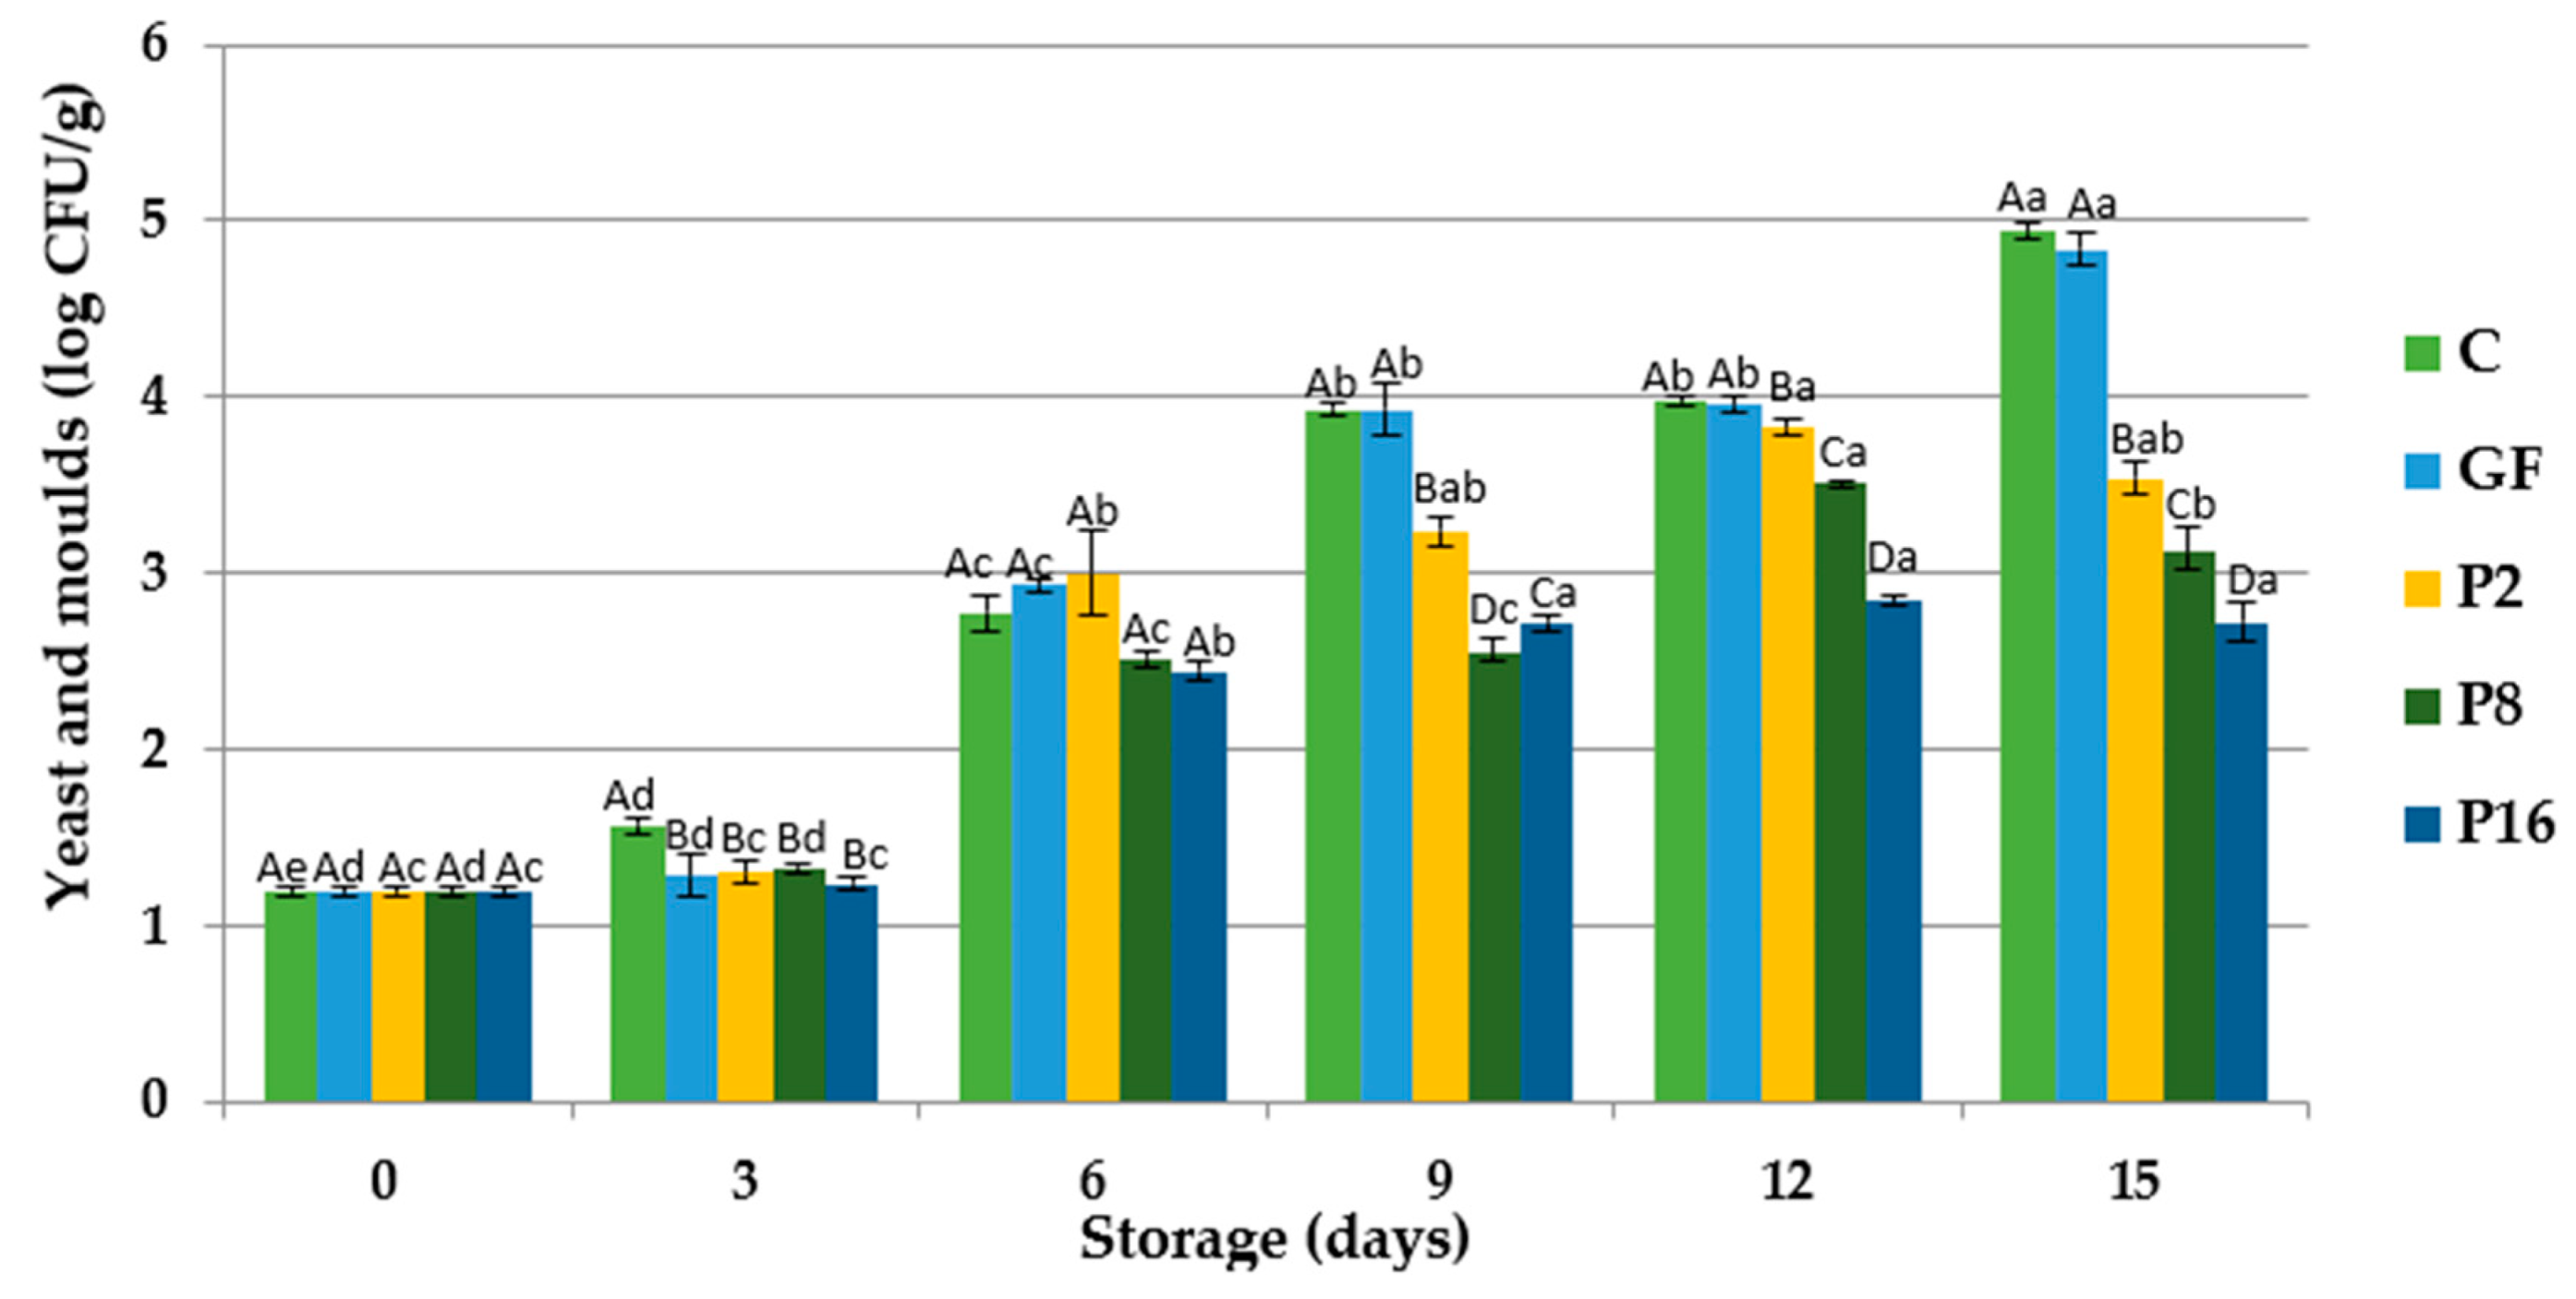
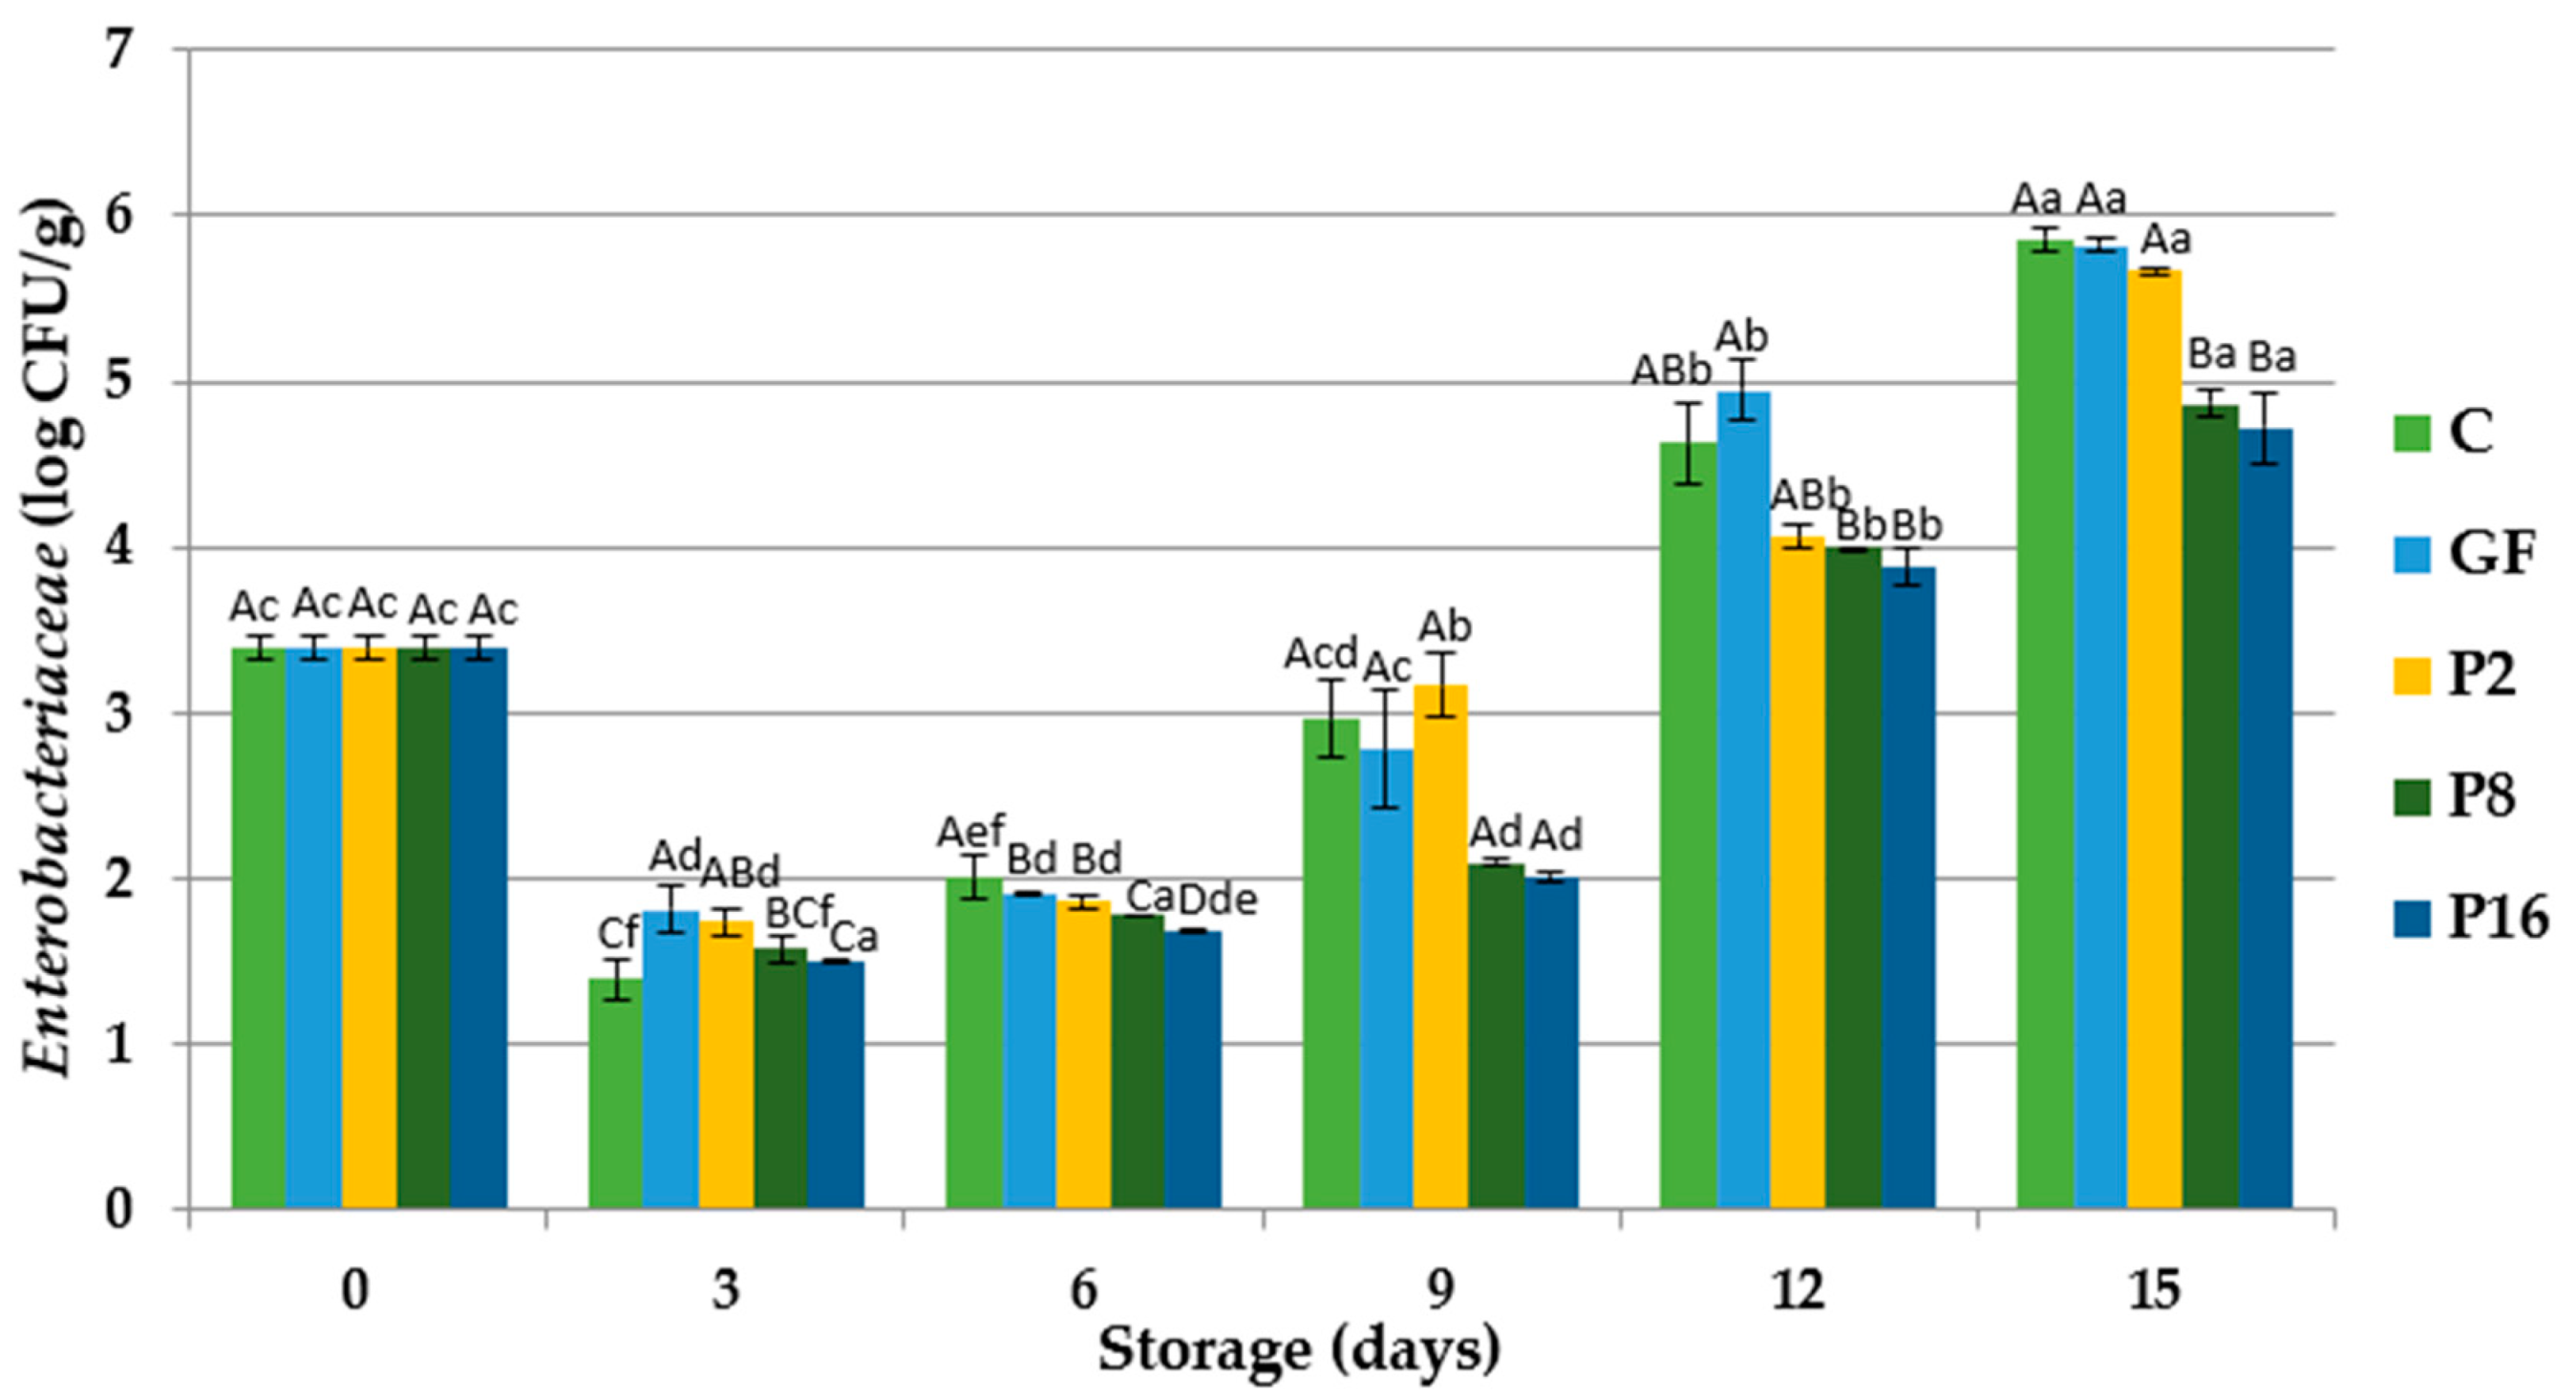
3.3. Changes in Microbiological Quality

The overall microbiological results of trout fillets wrapped with and without gelatin films are presented in Figure 1, Figure 2, Figure 3 and Figure 4. The initial total viable counts (TVCs) of trout fillet were found to be 1.543 log CFU/g (Figure 1), which were lower than values reported by other researches in trout fillets [16,28]. The TVC values of trout fillets were significantly (p < 0.05) different between control and gelatin coated samples during the storage period. However, lower TVCs were observed in the fillets wrapped with gelatin film supplemented with PE. For instance, significant (p < 0.05) lower TVCs were found in the samples coated with gelatin film incorporated with 16% PE followed by 8% PE compared with the control, GF, and P2 samples. At the end of the storage, TVC values of samples were reported as 6.14, 6.842, 4.536, 4.121, and 4.112 log CFU/g in the control, GF, P2, P8, and P16, respectively. The lower viable counts of coated fillets can be attributed to the antibacterial activity of propolis, which resulted in lower microbiological growth [56]. The antioxidant and antimicrobial properties of propolis have been largely ascribed to the polyphenolic fraction such as phenolic acids and flavonoids [57,58].
In the aerobically stored fresh fish, Gram-negative psychrotrophic bacteria are the main groups causing the spoilage [50]. The effects of gelatin coating enriched with PE was significant (p < 0.05) for psychrotrophic bacteria (Figure 2). At the beginning of the storage, the psychrotrophic bacteria count (PBC) of rainbow trout was 1.932 log CFU/g, showing an increase with the storage period until the 15th day. During the storage period, PBC of fillets coated with gelatin films incorporated with PE were lower than those of the gelatin film coated samples and control samples. At the 15th day of storage, PBC of trout fillets reached 7.024 log CFU/g for control samples, which is higher than the upper acceptability limit (7 log CFU/g) for fresh fish [59], while these values were determined as 6.840, 5.541, 5.120, and 5.114 log CFU/g in GF, P2, P8, and P16 groups, respectively.
In a previous study, Jouki et al. [60] monitored the initial number of PBC as 3.10 log CFU/g of rainbow trout fillets wrapped with chitosan films supplemented with oregano or thyme essential oil. The initial PBC of trout fillets coated with gelatin films incorporated with garlic peel extract (GPE) was found as 2.59 log CFU/g, which is higher than the value found in the present study, and it was reported that the treatment of gelatin films enriched with GPE had significant effects on the growth of PBC [48]. In this study, it was observed that gelatin films incorporated with PE were efficient to inhibit the psychrotrophic bacteria growth in trout fillets.
Total yeast and mold counts of rainbow trout fillets coated with gelatin films during storage at 4 °C is shown in Figure 3. The initial number of total yeast and molds was 1.194 log CFU/g, showing an increase during the storage period in all groups. At the end of the storage, total yeast and mold count of trout fillets reached 4.940, 4.841, 3.535, 3.122, and 2.273 log CFU/g in control, GF, P2, P8, and P16 groups, respectively. Results showed that the incorporation of PE with GF had a significant effect on the growth of yeast and mold, since lower values were observed in those groups (mainly in P16). In a study Petruzzi et al. [61] reported that propolis delayed the fungal and bacterial growth. Similarly, Kahramanoglu et al. [62] found that propolis is very effective in controlling pathogenic decay based on studies on its antimicrobial and fungicidal effects.
Total Enterobacteriaceae count of rainbow trout fillets are shown in Figure 4. Enterobacteriaceae is considered as a hygiene indicator and spoilage microorganisms in fresh rainbow trout. The initial number of Enterobacteriaceae was 3.390 log CFU/g. At the 3rd day of storage, the Enterobacteriaceae count of trout fillets showed a decrease in all groups, while after day 9 of storage, total Enterobacteriaceae number increased until the end of storage. At the end of storage, Enterobacteriaceae counts were 5.860, 5.822, 5.671, 4.865, and 4.724 log CFU/g in control, GF, P2, P8, and P16 groups, respectively. The lowest bacteria counts were obtained from P8 and P16 groups. This result is in agreement with other previous studies evaluating the shelf life of rainbow trout fillets coated with gelatin films enriched with laurel essential oil [40] and tilapia fillets coated with fungal chitosan containing pomegranate peel extract [49].

3.4. Sensory Evaluation

The sensory results of the rainbow trout fillets treated with gelatin films incorporated with PE are presented in Table 2. As expected, the sensory scores of fillets wrapped with gelatin films enriched with PE showed higher values than those of the control and GF groups. According to the sensory evaluation, control and GF samples were rejected at day 9, while P2 group sample were rejected at day 12. Moreover, P8 and P16 groups were rejected at the 15th day of the storage. The quality of trout fillets in P8 and P16 groups maintained 6 days more compared with the control and GF samples. As compared to the control and GF groups, it was found that the incorporation of PE with gelatin films showed a positive effect on the trout fillets, since P8 and P16 groups were more preferred and had higher sensory scores.
When trout fillets were unacceptable by sensory panel, the PBC values were 6.448 and 5.753 log CFU/g for the control and GF groups, respectively, at the 9th day; 4.362 log CFU/g for P2 at the 12th day; and 5.124 and 5.110 log CFU/g at the 15th day for P8 and P16 groups, respectively (Section 3.3). Therefore, the product is rejected when the microbiological quality is still acceptable, which means that the shelf life established based on sensory evaluation is shorter than that obtained from a microbiological approach.
Data reported by Jouki et al. [60] suggested a shelf life of rainbow trout fillets coated with edible film containing oregano or thyme essential oil as 18 days, while the shelf-life of the control group was 10 days. Similar results were found by Jasour et al. [63], who reported a shelf life extension after the addition of chitosan in rainbow trout fillets as 4 days compared with the control samples. Ucak [48] reported the shelf life of rainbow trout fillets as 5, 7, and 10 days in control group, gelatin film wrapped group, and gelatin film enriched with garlic peel extract wrapped group, respectively. These results related to the application of gelatin films incorporated with plant extracts or essential oils to fish fillet showed that the incorporation of these extracts improved the film properties, thus maintaining the sensory quality and therefore extending the shelf life of trout fillets.

4. Conclusions

After evaluating the impact of the incorporation of propolis extract (PE) with gelatin films for preservation of rainbow trout fillets, it can be concluded that the addition of PE in the gelatin films enhanced the antioxidant and antimicrobial properties of films since the lowest microbiological and chemical scores were obtained from these groups. According to sensory assessment, the shelf life of trout fillets was 6 days for the control and GF groups, 9 days for the P2 group, and 12 days for P8 and P16 groups, respectively. It can be concluded that the quality of rainbow trout fillets can be better preserved after using 8 and 16% PE in gelatin films.

Author Contributions

Conceptualization, I.U., R.K., C.C., I.T., and F.J.B.; Data curation, I.U., R.K., and F.J.B.; Formal analysis, I.U. and R.K.; Investigation, I.U. and R.K.; Writing—original draft, I.U. and R.K.; Writing—review and editing, I.U., R.K., C.C., I.T., and F.J.B. All authors agree to the published version of the manuscript.

Funding

This research received no external funding.

Acknowledgments

This study has been produced from the master thesis of Rowida Khalily, who is a student at the Nigde Omer Halisdemir University Graduate School of Natural and Applied Sciences.

Conflicts of Interest

The authors declare no conflict of interest.

References

  1. Sampels, S. The effects of processing technologies and preparation on the final quality of fish products. Trends Food Sci. Technol. 2011, 44, 131–146. [Google Scholar] [CrossRef]
  2. Nisar, T.; Yang, X.; Alim, A.; Iqbal, M.; Wanga, Z.C.; Guo, Y. Physicochemical responses and microbiological changes of bream (Megalobrama ambycephala) to pectin based coatings enriched with clove essential oil during refrigeration. Int. J. Biol. Macromol. 2019, 124, 156–1166. [Google Scholar] [CrossRef] [PubMed]
  3. Domínguez, R.; Barba, F.J.; Gómez, B.; Putnik, P.; Bursać Kovačević, D.; Pateiro, M.; Santos, E.M.; Lorenzo, J.M. Active packaging films with natural antioxidants to be used in meat industry: A review. Food Res. Int. 2018, 113, 93–101. [Google Scholar] [CrossRef] [PubMed]
  4. Ebadi, Z.; Khodanazary, A.; Hosseini, S.M.; Zanguee, N. The shelf life extension of refrigerated Nemipterus japonicus fillets by chitosan coating incorporated with propolis extract. Int. J. Biol. Macromol. 2019, 139, 94–102. [Google Scholar] [CrossRef] [PubMed]
  5. Guo, M.; Jin, T.Z.; Yadav, M.P.; Yang, R. Antimicrobial property and microstructure of micro-emulsion edible composite films against Listeria. Int. J. Food Microbiol. 2015, 208, 58–64. [Google Scholar] [CrossRef] [PubMed]
  6. Umaraw, P.; Munekata, P.E.S.; Verma, A.K.; Barba, F.J.; Singh, V.P.; Kumar, P.; Lorenzo, J.M. Edible films/coating with tailored properties for active packaging of meat, fish and derived products. Trends Food Sci. Technol. 2020, 98, 10–24. [Google Scholar] [CrossRef]
  7. Gomez-Guillen, M.C.; Gimenez, B.; Lopez-Caballero, M.E.; Montero, M.P. Functional and bioactive properties of collagen and gelatin from alternative sources: A review. Food Hydrocoll. 2011, 25, 1813–1827. [Google Scholar] [CrossRef] [Green Version]
  8. Karim, A.A.; Bhat, R. Fish gelatin: Properties, challenges, and prospects as an alternative to mammalian gelatins. Food Hydrocoll. 2009, 23, 563–576. [Google Scholar] [CrossRef]
  9. Bankova, V. Chemical diversity of propolis and the problem of standardization. J. Ethnopharmacol. 2005, 100, 114–117. [Google Scholar] [CrossRef]
  10. Yazgan, H.; Burgut, A.; Durmus, M.; Kosker, A.R. The impacts of water and ethanolic extracts of propolis on vacuum packaged sardine fillets inoculated with Morganella psychrotolerans during chilly storage. J. Food Saf. 2020, 40, e12767. [Google Scholar] [CrossRef]
  11. Duman, M.; Ozpolat, E. Effects of water extract of propolis on fresh shibuta (Barbus grypus) fillets during chilled storage. Food Chem. 2015, 189, 80–85. [Google Scholar] [CrossRef]
  12. Piedrahíta Márquez, D.G.; Fuenmayor, C.A.; Suarez Mahecha, H. Effect of chitosan-propolis edible coatings on stability of refrigerated cachama (Piaractus brachypomus) vacuum-packed fish fillets. Packag. Technol. Sci. 2018, 32, 143–153. [Google Scholar] [CrossRef]
  13. Ahmad, M.; Benjakul, S.; Sumpavapol, P.; Nirmal, N.P. Quality changes of sea bass slices wrapped with gelatin film incorporated with lemongrass essential oil. Int. J. Food Microbiol. 2012, 155, 171–178. [Google Scholar] [CrossRef] [PubMed]
  14. Gomez-Estaca, J.; Montero, P.; Fernandez-Martin, F.; Aleman, A.; Gomez-Guillen, M.C. Physical and chemical properties of tuna-skin and bovine-hide gelatin films with added aqueous oregano and rosemary extracts. Food Hydrocoll. 2009, 23, 1334–1341. [Google Scholar] [CrossRef] [Green Version]
  15. Singleton, V.L.; Rossi, J.A. Colorimetry of total phenolics with phosphomolybdic-phosphotungstic acid reagents. Am. J. Enol. Vitic. 1965, 16, 144–158. [Google Scholar]
  16. Re, R.; Pellegrini, N.; Proteggente, A.; Pannala, A.; Yang, M.; Rice-Evans, C. Antioxidant activity applying an improved ABTS radical cation decolourization assay. Free Radic. Biol. Med. 1999, 26, 1231–1237. [Google Scholar] [CrossRef]
  17. Schormuller, J. Handbuch der Lebensmittelchemie; Springer: Berlin/Heidelberg, Germany; New York, NY, USA, 1968; Volume III/2. [Google Scholar]
  18. AOAC (Association of Official Analytical Chemists). Official Methods of Analyses of Association of Analytical Chemist, 15th ed.; AOAC: Washington, DC, USA, 1990. [Google Scholar]
  19. AOCS (American Oil Chemists’ Society). AOCS Official Method Cd 19-90. 2-Thiobarbituric acid value. Direct Method. In Official Methods and Recommended Practices of the American Oil Chemists’ Society, 5th ed.; Firestone, D., Ed.; AOCS: Champaign, IL, USA, 1998. [Google Scholar]
  20. Amerina, M.A.; Pangborn, R.V.; Roessler, E.B. Principles of Sensory Evaluation of Food; Academic Press: New York, NY, USA, 1965; p. 602. [Google Scholar]
  21. Socha, R.; Gałkowska, D.; Bugaj, M.; Juszczak, L. Phenolic composition and antioxidant activity of propolis from various regions of Poland. Nat. Prod. Res. 2015, 29, 416–422. [Google Scholar] [CrossRef] [PubMed]
  22. Aliyazıcıoglu, R.; Sahin, H.; Erturk, O.; Ulusoy, E.; Kolayli, S. Properties of phenolic composition and biological activity of propolis from Turkey. Int. J. Food Prop. 2013, 16, 277–287. [Google Scholar] [CrossRef]
  23. Ozdal, T.; Ceylan, F.D.; Eroglu, N.; Kaplan, M.; Olgun, E.O.; Capanoglu, E. Investigation of antioxidant capacity, bioaccessibility and LC-MS/MS phenolic profile of Turkish propolis. Food Res. Int. 2019, 122, 528–536. [Google Scholar] [CrossRef]
  24. Chaillou, L.L.; Nazareno, M.A. Bioactivity of propolis from Santiago del Estero, Argentina, related to their chemical composition. LWT-Food Sci. Technol. 2009, 42, 1322–1427. [Google Scholar] [CrossRef]
  25. Ciftci-Yilmaz, S.; Azman, Z.N.; Gunduz, E.; Grenman, R. Evaluating antioxidant capacity of different propolis samples from konya, turkey and their inhibitory effect on head and neck cancer cells. bioRxiv 2017. preprint. [Google Scholar]
  26. Moreira, L.; Dias, L.G.; Pereira, J.A.; Estevinho, L. Antioxidant properties, total phenols and pollen analysis of propolis samples from Portugal. Food Chem. Toxicol. 2008, 46, 3482–3485. [Google Scholar] [CrossRef] [Green Version]
  27. Mello, B.C.B.S.; Hubinger, M.D. Antioxidant activity and polyphenol contents in Brazilian green propolis extracts prepared with the use of ethanol and water as solvent in different pH values. Int. J. Food Sci. Technol. 2012, 47, 2510–2518. [Google Scholar] [CrossRef]
  28. Pyrzynska, K.; Biesaga, M. Analysis of phenolic acids and flavonoids in honey. Trends Anal. Chem. 2009, 28, 893–902. [Google Scholar] [CrossRef]
  29. Küçük, M.; Kolayli, S.; Karaoglu, Ş.; Ulusoy, E.; Baltacı, C.; Candan, F. Biological activities and chemical composition of three honeys of different types from Anatolia. Food Chem. 2007, 100, 526–534. [Google Scholar] [CrossRef]
  30. Ahn, M.-R.; Kumazawa, S.; Usui, Y.; Nakamura, J.; Matsuka, M.; Zhu, F.; Nakayama, T. Antioxidant activity and constituents of propolis collected in various areas of China. Food Chem. 2007, 101, 1383–1392. [Google Scholar] [CrossRef]
  31. Kalogeropoulos, N.; Konteles, S.J.; Troullidou, E.; Mourtzinos, I.; Karathanos, V. Chemical composition, antioxidant activity and antimicrobial properties of propolis extract from Greece and Cyprus. Food Chem. 2009, 116, 452–461. [Google Scholar] [CrossRef]
  32. Osés, S.M.; Marcos, P.; Azofra, P.; de Pablo, A.; Fernández-Muíño, M.A.; Sancho, M.T. Phenolic profile, antioxidant capacities and enzymatic inhibitory activities of propolis from different geographical areas: Needs for analytical harmonization. Antioxidants 2020, 9, 75. [Google Scholar] [CrossRef] [Green Version]
  33. Serra-Bonvehí, J.; Lacalle-Gutiérrez, A. Antioxidant activity and total phenolics of propolis from the Basque country (Northeastern Spain). J. Am. Oil Chem. Soc. 2011, 88, 1387–1395. [Google Scholar] [CrossRef]
  34. Andrade, J.K.S.; Denadai, M.; de Oliveira, C.S.; Nunes, M.L.; Narain, N. Evaluation of bioactive compounds potential and antioxidant activity of brown, green and red propolis from Brazilian northeast region. Food Res. Int. 2017, 101, 129–138. [Google Scholar] [CrossRef]
  35. Kumazawa, S.; Hamasaka, T.; Nakayama, T. Antioxidant activity of propolis of various geographical origins. Food Chem. 2004, 84, 329–339. [Google Scholar] [CrossRef]
  36. Ozogul, Y.; Yuvka, Y.; Ucar, Y.; Durmus, M.; Kosker, A.R.; Oz, M.; Ozogul, F. Evaluation of effects of nanoemulsion based on herb essential oils (rosemary, laurel, thyme and sage) on sensory, chemical and microbiological quality of rainbow trout (Oncorhynchus mykiss) fillets during ice storage. LWT-Food Sci. Technol. 2017, 75, 677–684. [Google Scholar] [CrossRef]
  37. Oz, M.; Dikel, S.; Durmus, M.; Ozogul, Y. Effects of black cumin oil (Nigella sativa) on sensory, chemical and microbiological properties of rainbow trout during 23 days of storage at 2 ± 1 °C. J. Aquat. Food Prod. Technol. 2017, 26, 665–674. [Google Scholar] [CrossRef]
  38. Volpe, M.G.; Sianoa, F.; Paolucci, M.; Sacco, A.; Sorrentino, A.; Malinconico, M.; Varricchio, E. Active edible coating effectiveness in shelf-life enhancement of trout (Oncorhynchus mykiss) fillets. LWT-Food Sci. Technol. 2015, 60, 615–622. [Google Scholar] [CrossRef]
  39. Ludorf, W.; Meyer, V. Fish and Fish Products; Verlag Paul Parey: Berlin, Germany, 1973; p. 308. [Google Scholar]
  40. Alparslan, Y.; Baygar, T.; Baygar, T.; Hasanhocaoglu, H.; Metin, C. Effects of gelatin-based edible films enriched with laurel essential oil on the quality of rainbow trout (Oncorhynchus mykiss) fillets during refrigerated storage. Food Technol. Biotechnol. 2014, 52, 325–333. [Google Scholar]
  41. Lopez-Caballero, M.E.; Martinez-Alvarez, O.; Gomez-Guillen, M.C.; Montero, P. Quality of thawed deepwater pink shrimp (Parapenaeus longirostris) treated with melanosis- inhibiting formulations during chilled storage. Int. J. Food Sci. Technol. 2007, 42, 1029–1038. [Google Scholar] [CrossRef] [Green Version]
  42. Pastoriza, L.; Sampedro, G.; Herrera, J.J.; Cabo, M.L. Effect of modified atmosphere packaging on shelf life of iced fresh hake slices. J. Sci. Food Agric. 1996, 71, 541–547. [Google Scholar] [CrossRef]
  43. EEC. Total volatile basic nitrogen (TVB-N) limits values for certain categories of fishery products and specifying the analysis methods to be used. Commission Decision 95/149/EEC of 8 March 1995. Off. J. Eur. Commun. L 1995, 97, 84–87. [Google Scholar]
  44. Goulas, A.E.; Kontominas, M.G. Effect of salting and smoking-method on the keeping quality of chub mackerel (Scomber japonicus): Biochemical and sensory attributes. Food Chem. 2005, 93, 511–520. [Google Scholar] [CrossRef]
  45. Nowzari, F.; Shabanpour, B.; Ojagh, S.M. Comparison of chitosan–gelatin composite and bilayer coating and film effect on the quality of refrigerated rainbow trout. Food Chem. 2013, 141, 1667–1672. [Google Scholar] [CrossRef]
  46. Ojagh, S.M.; Rezaei, M.; Razavi, S.H.; Hosseini, S.M.H. Effect of chitosan coatings enriched with cinnamon oil on the quality of refrigerated rainbow trout. Food Chem. 2010, 120, 193–198. [Google Scholar] [CrossRef]
  47. Sun, X.; Guo, X.; Ji, M.; Wu, J.; Zhu, W.; Wang, J.; Cheng, C.; Chen, L.; Zhang, Q. Preservative effects of fish gelatin coating enriched with CUR/βCD emulsion on grass carp (Ctenopharyngodon idellus) fillets during storage at 4 °C. Food Chem. 2019, 272, 643–652. [Google Scholar] [CrossRef] [PubMed]
  48. Ucak, I. Physicochemical and antimicrobial effects of gelatin-based edible films incorporated with garlic peel extract on the rainbow trout fillets. Prog. Nutr. 2019, 21, 232–240. [Google Scholar]
  49. Alsaggaf, M.S.; Moussa, S.H.; Tayel, A.A. Application of fungal chitosan incorporated with pomegranate peel extract as edible coating for microbiological, chemical and sensorial quality enhancement of Nile tilapia fillets. Int. J. Biol. Macromol. 2017, 99, 499–505. [Google Scholar] [CrossRef]
  50. Yuan, G.; Chen, X.; Li, D. Chitosan films and coatings containing essential oils: The antioxidant and antimicrobial activity, and application in food systems. Food Res. Int. 2016, 89, 117–128. [Google Scholar] [CrossRef] [PubMed]
  51. Rezaei, F.; Shahbazi, Y. Shelf-life extension and quality attributes of sauced silver carp fillet: A comparison among direct addition, edible coating and biodegradable film. LWT-Food Sci. Technol. 2018, 87, 122–133. [Google Scholar] [CrossRef]
  52. Jeon, Y.; Kamil, J.Y.V.A.; Shahidi, F. Chitosan as an edible film for quality preservation of herring and Atlantic cod. J. Agric. Food Chem. 2002, 50, 5167–5178. [Google Scholar] [CrossRef]
  53. Ibrahim Sallam, K. Antimicrobial and antioxidant effects of sodium acetate, sodium lactate, and sodium citrate in refrigerated sliced salmon. Food Control 2007, 18, 566–575. [Google Scholar] [CrossRef] [Green Version]
  54. Reis, A.S.; Diedrich, C.; Moura, C.; Pereira, D.; de Florio Almeida, C.; Silva, L.D. Physico-chemical characteristics of microencapsulated propolis co-product extract and its effect on storage stability of burger meat during storage at −15 °C. LWT-Food Sci. Technol. 2017, 76, 306–313. [Google Scholar] [CrossRef]
  55. Spinelli, S.; Conte, A.; Lecce, L.; Incoronato, A.L.; del Nobile, M.A. Microencapsulated propolis to enhance the antioxidant properties of fresh fish burgers. J. Food Process. Eng. 2015, 38, 527–535. [Google Scholar] [CrossRef]
  56. Pobiega, K.; Kraśniewska, K.; Gniewosz, M. Application of propolis in antimicrobial and antioxidative protection of food quality- a review. Trends Food Sci. Technol. 2019, 83, 53–62. [Google Scholar] [CrossRef]
  57. Kurek-Gorecka, A.; Rzepecka-Stojko, A.; Gorecki, M.; Stojko, J.; Sosada, M.; Swierczek-Zieba, G. Structure and antioxidant activity of polyphenols derived from propolis. Molecules 2013, 19, 78–101. [Google Scholar] [CrossRef] [PubMed] [Green Version]
  58. Rzepecka-Stojko, A.; Stojko, J.; Kurek-Gorecka, A.; Gorecki, M.; Kabala-Dzik, A.; Kubina, R.; Mozdzierz, A.; Buszman, E. Polyphenols from bee pollen: Structure, absorption, metabolism and biological activity. Molecules 2015, 20, 21732–21749. [Google Scholar] [CrossRef] [PubMed] [Green Version]
  59. ICMSF. Microorganisms in Foods; The International Commission on Microbiological Specifications for Foods of the International Union of Biological Societies; Blackwell: Oxford, UK, 1986; pp. 181–196. [Google Scholar]
  60. Jouki, M.; Yazdi, F.T.; Mortazavi, S.A.; Koocheki, A.; Khazaei, N. Effect of quince seed mucilage edible films incorporated with oregano or thyme essential oil on shelf life extension of refrigerated rainbow trout fillets. Int. J. Food Microbiol. 2014, 174, 88–97. [Google Scholar] [CrossRef]
  61. Petruzzi, L.; Rosaria Corbo, M.; Campaniello, D.; Speranza, B.; Sinigaglia, M.; Bevilacqua, A. Antifungal and Antibacterial Effect of Propolis: A Comparative Hit for Food-Borne Pseudomonas, Enterobacteriaceae and Fungi. Foods 2020, 9, 559. [Google Scholar] [CrossRef]
  62. Kahramanoglu, I.; Okatan, V.; Wan, C. Biochemical Composition of Propolis and Its Efficacy in Maintaining Postharvest Storability of Fresh Fruits and Vegetables. J. Food Qual. 2020, 2020, 8869624. [Google Scholar] [CrossRef]
  63. Jasour, M.S.; Rahimabadi, E.Z.; Ehsani, A.; Rahnama, M.; Arshadi, A. Effects of refrigerated storage on fillet lipid quality of rainbow trout (Oncorhynchus mykiss) supplemented by a-tocopheryl acetate through diet and direct addition after slaughtering. Int. J. Food Process. Technol. 2011, 2, 2–5. [Google Scholar] [CrossRef] [Green Version]
Figure 1. Changes in total viable counts (TVC) of rainbow trout fillets coated with gelatin films incorporated with propolis extract (PE) during storage at 4 °C. C: Control without gelatin film, GF: fillets coated with gelatin film, P2: fillets coated with gelatin film incorporated with 2% PE, P8: fillets coated with gelatin film incorporated with 8% PE, P16: fillets coated with gelatin film incorporated with 16% PE. Different capital letters indicate a significant difference among groups, and different lower-case letters indicate a significant difference among storage days (p < 0.05).
Foods 09 01584 g001
Figure 2. Changes in total psychrophilic bacteria counts (PBC) of rainbow trout fillets coated with gelatin films incorporated with propolis extract (PE) during storage at 4 °C. C: Control without gelatin film, GF: fillets coated with gelatin film, P2: fillets coated with gelatin film incorporated with 2% PE, P8: fillets coated with gelatin film incorporated with 8% PE, P16: fillets coated with gelatin film incorporated with 16% PE. Different capital letters indicate a significant difference among groups, and different lower-case letters indicate a significant difference among storage days (p < 0.05).
Foods 09 01584 g002
Figure 3. Changes in total yeast and molds of rainbow trout fillets coated with gelatin films incorporated with propolis extract (PE) during storage at 4 °C. C: Control without gelatin film, GF: fillets coated with gelatin film, P2: fillets coated with gelatin film incorporated with 2% PE, P8: fillets coated with gelatin film incorporated with 8% PE, P16: fillets coated with gelatin film incorporated with 16% PE. Different capital letters indicate a significant difference among groups, and different lower-case letters indicate a significant difference among storage days (p < 0.05).
Foods 09 01584 g003
Figure 4. Changes in total Enterobacteriaceae counts of rainbow trout fillets coated with gelatin films incorporated with propolis extract (PE) during storage at 4 °C. C: Control without gelatin film, GF: fillets coated with gelatin film, P2: fillets coated with gelatin film incorporated with 2% PE, P8: fillets coated with gelatin film incorporated with 8% PE, P16: fillets coated with gelatin film incorporated with 16% PE. Different capital letters indicate a significant difference among groups, and different lower-case letters indicate a significant difference among storage days (p < 0.05).
Foods 09 01584 g004
Table 1. Changes in physicochemical properties of rainbow trout fillets coated with gelatin films incorporated with propolis extract (PE) during storage at 4 °C.
Storage Period (Days)CGFP2P8P16
pH06.482 ± 0.054 Ac6.482 ± 0.054 Ac6.482 ± 0.054 Ae6.482 ± 0.054 Abc6.482 ± 0.054 Ac
36.713 ± 0.041 Ab6.679 ± 0.052 Ab6.644 ± 0.022 ABc6.548 ± 0.047 BCc6.458 ± 0.079 Cbc
66.733 ± 0.040 Ab6.703 ± 0.000 Ab6.680 ± 0.027 Ac6.577 ± 0.078 Bbc6.554 ± 0.011 Bb
96.730 ± 0.102 Ab6.615 ± 0.068 Ab6.571 ± 0.024 Bd6.582 ± 0.013 Bb6.579 ± 0.014 Bb
127.504 ± 0.014 Aa7.493 ± 0.092 Aa7.309 ± 0.021 Bb6.836 ± 0.067 Ca6.713 ± 0.000 Da
157.548 ± 0.019 Aa7.524 ± 0.036 Aa7.527 ± 0.017 Aa6.880 ± 0.000 Ba6.769 ± 0.147 Ca
TVB-N
(mg N/100 g)
016.804 ± 0.000 Ae16.804 ± 0.000 Ae16.804 ± 0.000 Ad16.804 ± 0.000 Ae16.804 ± 0.000 Ae
328.003 ± 0.000 Ad21.700 ± 0.991 Ad20.303 ± 8.911 Ac18.904 ± 0.992 Ad19.647 ± 0.944 Ad
635.702 ± 0.967 Ac32.203 ± 3.955 ABc28.001 ± 0.004 Bb27.302 ± 2.974 Bc25.204 ± 1.982 Bcd
940.601 ± 0.000 Ab39.200 ± 1.983 Ab34.302 ± 0.989 Bcb32.904 ± 0.985 Bb30.802 ± 1.977 Bcd
1243.400 ± 1.978 Ab44.801 ± 0.000 Ab35.704 ± 0.985 Bb34.300 ± 0.987 BCb32.203 ± 0.000 Cb
1553.903 ± 2.966 Aa52.504 ± 4.954 Aa49.700 ± 2.967 ABa42.001 ± 1.983 BCa44.100 ± 0.988 Ca
PV
(meq O2/kg)
02.004 ± 0.002 Ad2.004 ± 0.002 Ac2.004 ± 0.002 Ad2.004 ± 0.002 Ac2.004 ± 0.002 Ac
35.002 ± 0.000 Ac5.504 ± 0.707 Ab2.004 ± 0.001 Bd1.994 ± 0.001 Bc1.974 ± 0.065 Bc
66.504 ± 0.714 Ab5.002 ± 0.002 Bb3.502 ± 0.714 Bc2.503 ± 0.714 Cc1.943 ± 0.074 Cc
95.002 ± 0.002 Bc6.502 ± 0.710 Aa5.466 ± 0.704 Ab3.978 ± 0.001 Cb3.967 ± 0.000 Cb
127.001 ± 0.000 Ab6.978 ± 0.033 Aa6.003 ± 0.002 Aab5.477 ± 0.720 BCa4.502 ± 0.712 Cab
158.503 ± 0.713 Aa7.002 ± 0.001 Ba6.956 ± 0.007 Bab5.505 ± 0.708 Ca5.001 ± 0.000 Ca
TBARS (mg MDA/kg)00.882 ± 0.0438 Ad0.882 ± 0.038 Ad0.882 ± 0.038 Ac0.882 ± 0.038 Ad0.882 ± 0.038 Ad
31.248 ± 0.010 Ac0.862 ± 0.112 Bd0.824 ± 0.022 Bc0.790 ± 0.040 Be0.777 ± 0.023 Be
61.217 ± 0.092 Ac1.114 ± 0.030 Ac0.912 ± 0.082 Bc1.277 ± 0.000 Cf0.704 ± 0.052 Cf
91.474 ± 0.024 Ab1.730 ± 0.000 Aa1.023 ± 0.024 Bb0.975 ± 0.000 Cc0.912 ± 0.064 Cc
121.523 ± 0.017 Aab1.493 ± 0.001 Bb1.460 ± 0.014 Ba1.252 ± 0.001 Cb1.088 ± 0.012 Db
151.588 ± 0.016 Aa1.558 ± 0.033 Ab1.488 ± 0.000 Ba1.417 ± 0.024 Ca1.284 ± 0.015 Da
Means indicated by different capital letters in the same row differ significantly (p < 0.05). Means indicated by different lowercase letters in the same column differ significantly (p < 0.05). C: control without gelatin film, GF: fillets coated with gelatin film, P2: fillets coated with gelatin film incorporated with 2% PE, P8: fillets coated with gelatin film incorporated with 8% PE, P16: fillets coated with gelatin film incorporated with 16% PE.
Table 2. Changes in sensory scores of rainbow trout fillets coated with gelatin films incorporated with propolis extract (PE) during storage at 4 °C.
Storage Period (Days)CGFP2P8P16
Odor09.000 ± 0.000 Aa9.000 ± 0.000 Aa9.000 ± 0.000 Aa9.000 ± 0.000 Aa9.000 ± 0.000 Aa
38.002 ± 0.530 Bb9.000 ± 0.000 Aa9.000 ± 0.000 Aa8.902 ± 0.354 Aa9.000 ± 0.000 Aa
68.124 ± 0.831 Bb8.750 ± 0.461 Aa9.000 ± 0.000 Aa8.752 ± 0.458 Aa9.000 ± 0.000 Aa
93.865 ± 0.832 Cc3.372 ± 0.923 Cb5.622 ± 1.064 Bb7.869 ± 0.643 Ab7.623 ± 0.521 Ab
121.124 ± 0.347 Cd1.366 ± 0.522 Cc3.002 ± 0.533 Bc5.251 ± 1.580 Ac5.119 ± 0.825 Ac
151.002 ± 0.000 Bd1.001 ± 0.000 Bc1.248 ± 0.458 Bd2.123 ± 0.636 Ad2.247 ± 0.458 Ad
Texture09.000 ± 0.000 Aa9.000 ± 0.000 Aa9.000 ± 0.000 Aa9.000 ± 0.000 Aa9.000 ± 0.000 Aa
38.253 ± 0.461 Bb9.000 ± 0.000 Aa9.000 ± 0.000 Aa8.872 ± 0.354 Aa9.000 ± 0.000 Aa
66.747 ± 0.892 Bc7.754 ± 0.462 Ab9.000 ± 0.000 Aa8.620 ± 0.522 Aa9.000 ± 0.000 Aa
93.124 ± 0.988 Dd2.251 ± 0.891 Ec5.124 ± 0.350 Cb8.502 ± 0.531 Aa7.374 ± 0.520 Bb
121.369 ± 0.743 BCe1.254 ± 0.457 Cd2.367 ± 0.521 Bc5.371 ± 1.766 Ab5.117 ± 0.991 Ac
151.002 ± 0.000 Be1.003 ± 0.001 Bd1.115 ± 0.347 Bd2.502 ± 0.763 Ac2.503 ± 0.527 Ad
Color09.000 ± 0.000 Aa9.000 ± 0.000 Aa9.000 ± 0.000 Aa9.000 ± 0.000 Aa9.000 ± 0.000 Aa
37.872 ± 0.636 Bb8.874 ± 0.458 Aab8.871 ± 0.348 Aa8.869 ± 0.354 Aa9.000 ± 0.000 Aa
67.001 ± 0.758 Bc8.253 ± 0.888 Ab8.623 ± 0.464 Aa8.754 ± 0.521 Aa8.752 ± 0.457 Aa
92.001 ± 0.933 Dd3.372 ± 0.921 Cc5.368 ± 0.922 Bb8.002 ± 0.758 Aa7.621 ± 0.523 Aa
121.004 ± 0.002 Ce1.367 ± 0.524 Cd2.503 ± 2.002 Bc4.617 ± 2.000 Ab4.118 ± 0.612 Ab
151.002 ± 0.000 Be1.002 ± 0.000 Bd1.117 ± 0.351 Bd2.503 ± 0.531 Ac2.254 ± 0.463 Ac
Appearance09.000 ± 0.000 Aa9.000 ± 0.000 Aa9.000 ± 0.000 Aa9.000 ± 0.000 Aa9.000 ± 0.000 Ad
38.000 ± 0.762 Bb8.754 ± 0.461 Aab8.753 ± 0.462 Aa8.868 ± 0.345 Aa9.000 ± 0.000 Aa
67.124 ± 0.643 Bc8.252 ± 0.887 Ab8.754 ± 0.461 Aa8.621 ± 0.743 Aab8.747 ± 0.464 Aa
92.868 ± 0.638 Cd3.121 ± 0.644 Cc5.747 ± 0.710 Ba7.872 ± 0.827 Ad7.503 ± 0.527 Aa
121.124 ± 0.352 Ce1.124 ± 0.353 Ce3.365 ± 0.922 Bc5.370 ± 1.602 Ac4.619 ± 1.192 Ac
151.000 ± 0.000 Be1.000 ± 0.000 Be1.254 ± 0.463 Bd2.366 ± 0.521 Ad2.254 ± 0.463 Ad
Overall acceptance09.000 ± 0.000 Aa9.000 ± 0.000 Aa9.000 ± 0.000 Aa9.000 ± 0.000 Aa9.000 ± 0.000 Aa
38.000 ± 0.532 Bb9.000 ± 0.000 Aa9.000 ± 0.000 Aa8.874 ± 0.351 Aa9.000 ± 0.000 Aa
67.000 ± 0.760 Bc8.754 ± 0.457 Aa9.000 ± 0.000 Aa8.867 ± 0.354 Aa9.000 ± 0.000 Aa
93.000 ± 0.930 Dd3.365 ± 0.743 Db6.000 ± 0.761 Cb8.370 ± 0.744 Aa7.500 ± 0.530 Bb
121.124 ± 0.351 Ce1.369 ± 0.524 Cc3.000 ± 9.533 Bc4.866 ± 1.887 Ab4.754 ± 0.461 Ac
151.000 ± 0.000 Be1.000 ± 0.000 Bc1.252 ± 0.464 Bd2.374 ± 0.521 Ac2.503 ± 0.532 Ad
Means indicated by different capital letters in the same row differ significantly (p < 0.05). Means indicated by different lowercase letters in the same column differ significantly (p < 0.05). C: control without gelatin film, GF: fillets coated with gelatin film, P2: fillets coated with gelatin film incorporated with 2% PE, P8: fillets coated with gelatin film incorporated with 8% PE, P16: fillets coated with gelatin film incorporated with 16% PE.
Publisher’s Note: MDPI stays neutral with regard to jurisdictional claims in published maps and institutional affiliations.

