Climatological Drought Forecasting Using Bias Corrected CMIP6 Climate Data: A Case Study for India


Abstract
:1. Introduction
- (1)
- How will the emission, land use, and social changes affect the drought situation in the future?
- (2)
- How will the simulated drought change in terms of severity, length, and spatial extent?
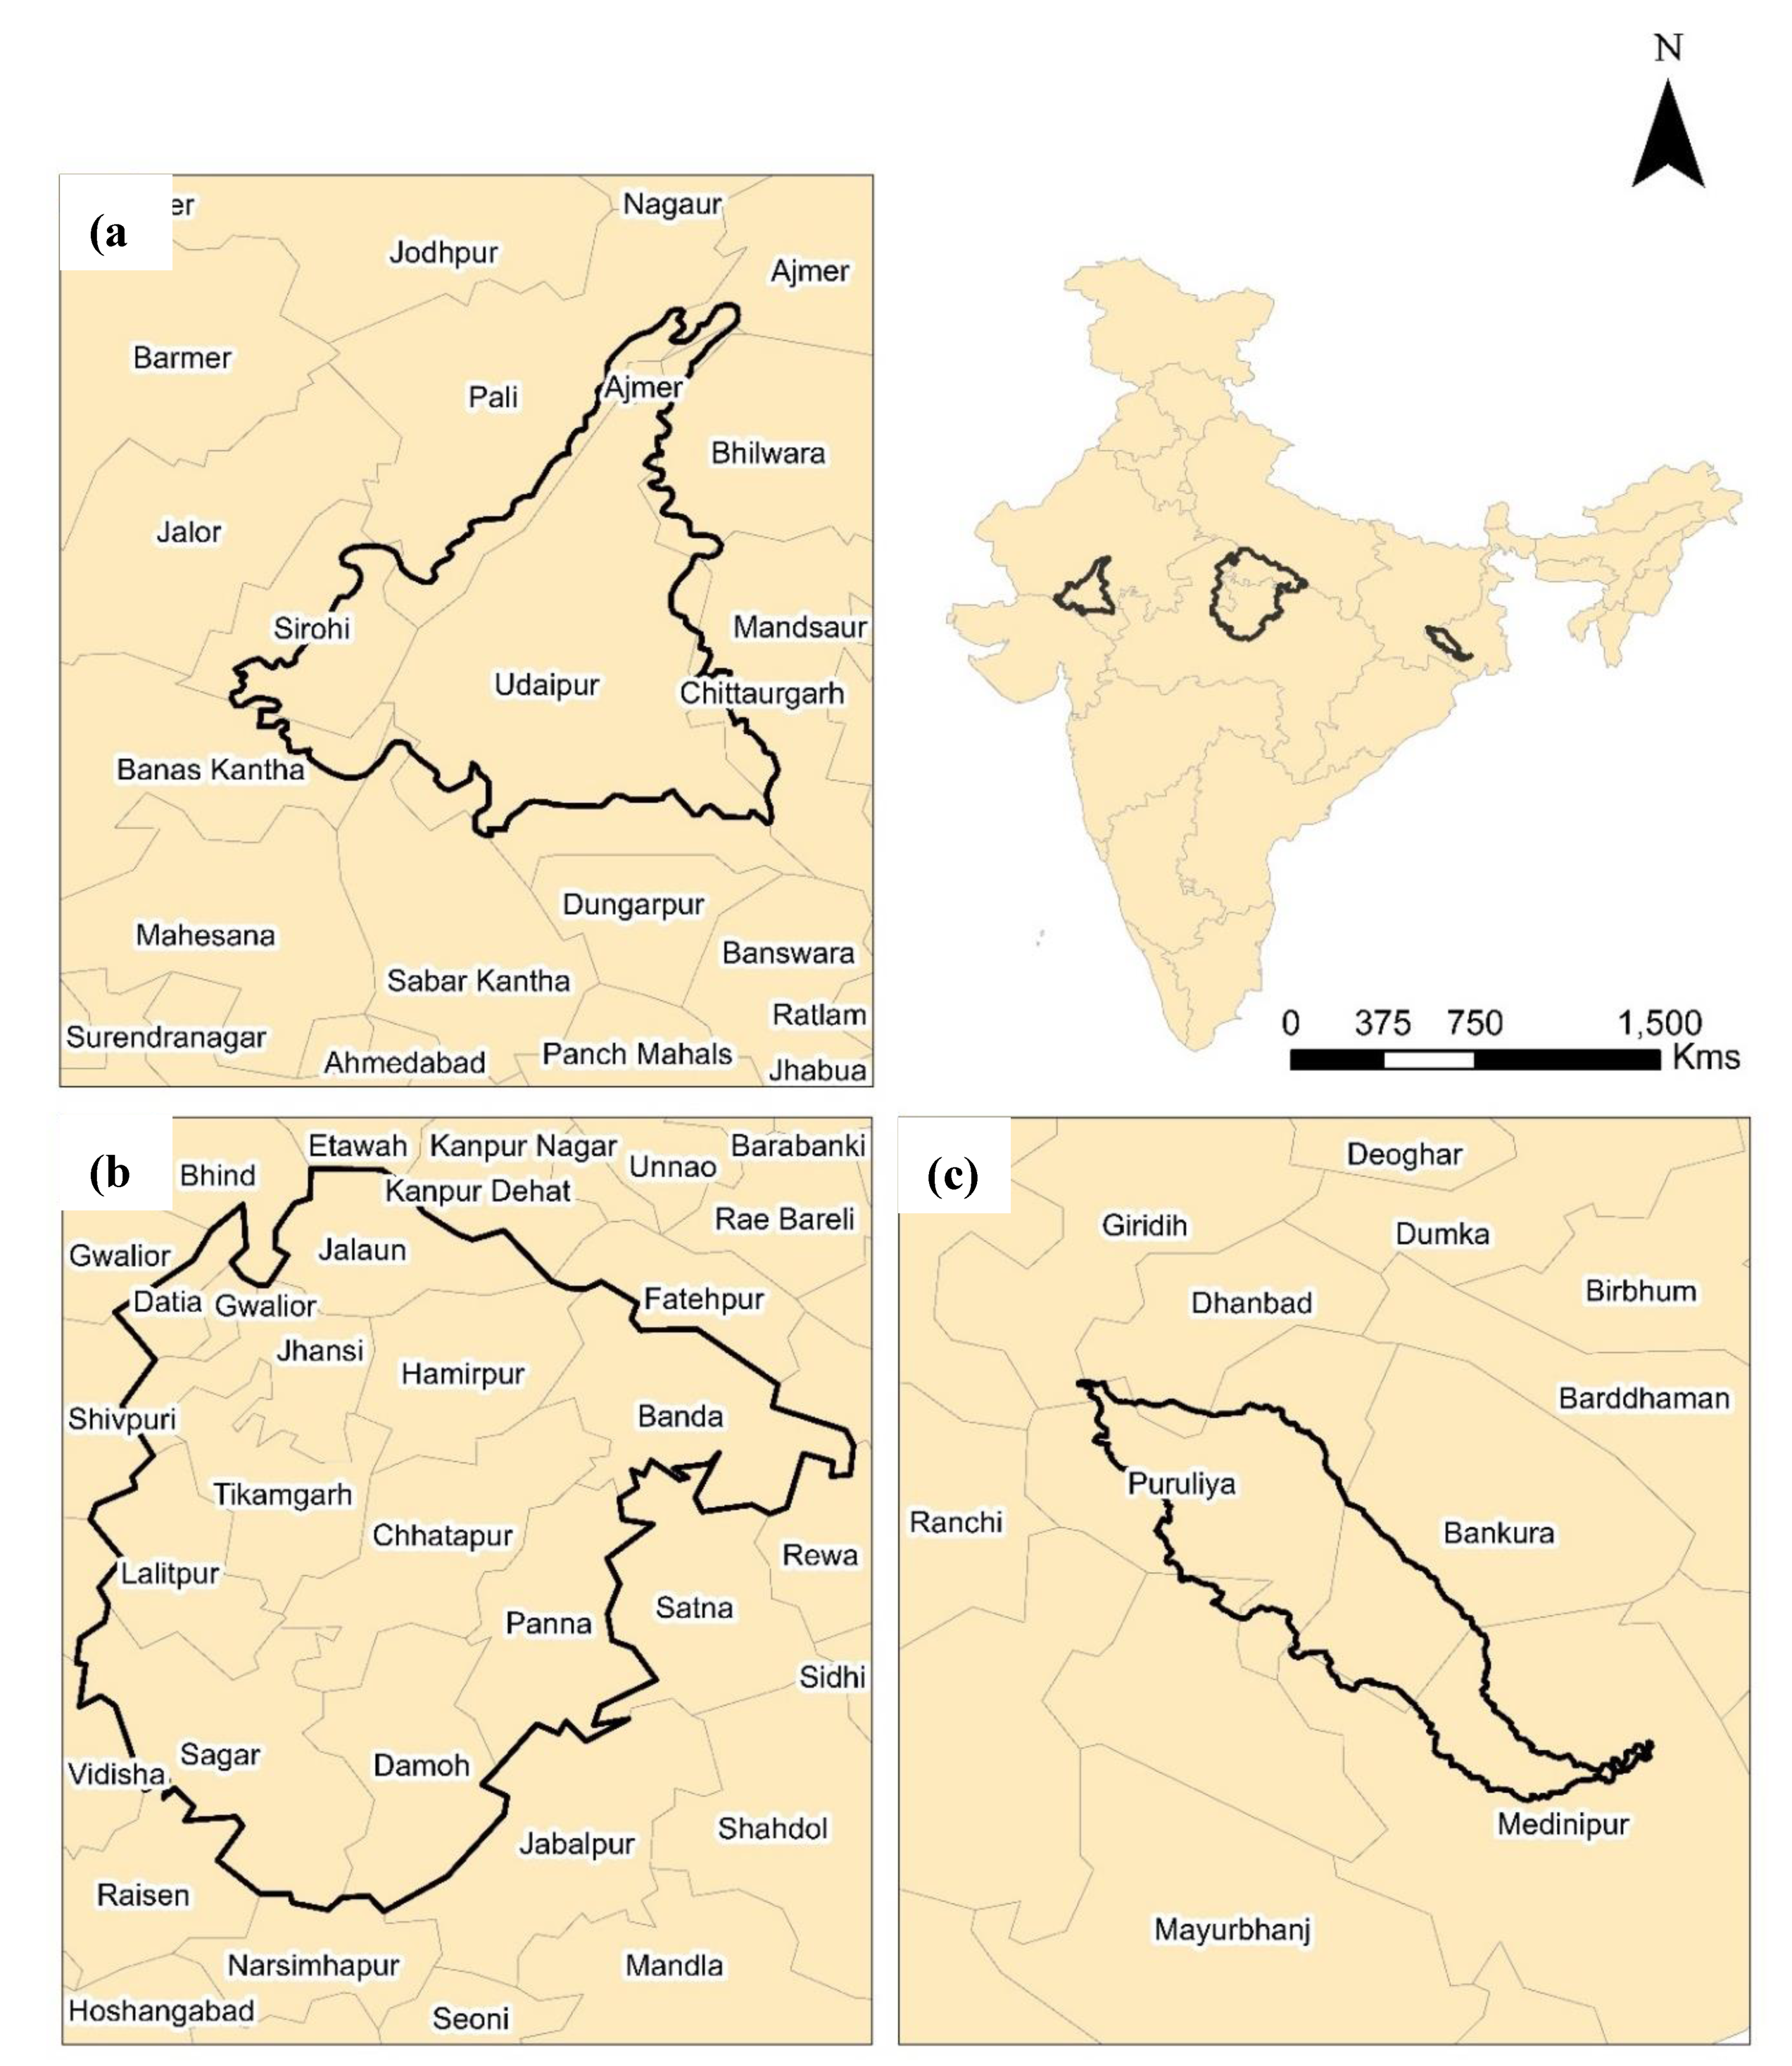
2. Study Area
2.1. Study Area 1— the Araveli Region
2.2. Study Area 2—Bundelkhand Region
2.3. Study Area 3—Kansabati River Basin
3. Data and Methodology
3.1. Data
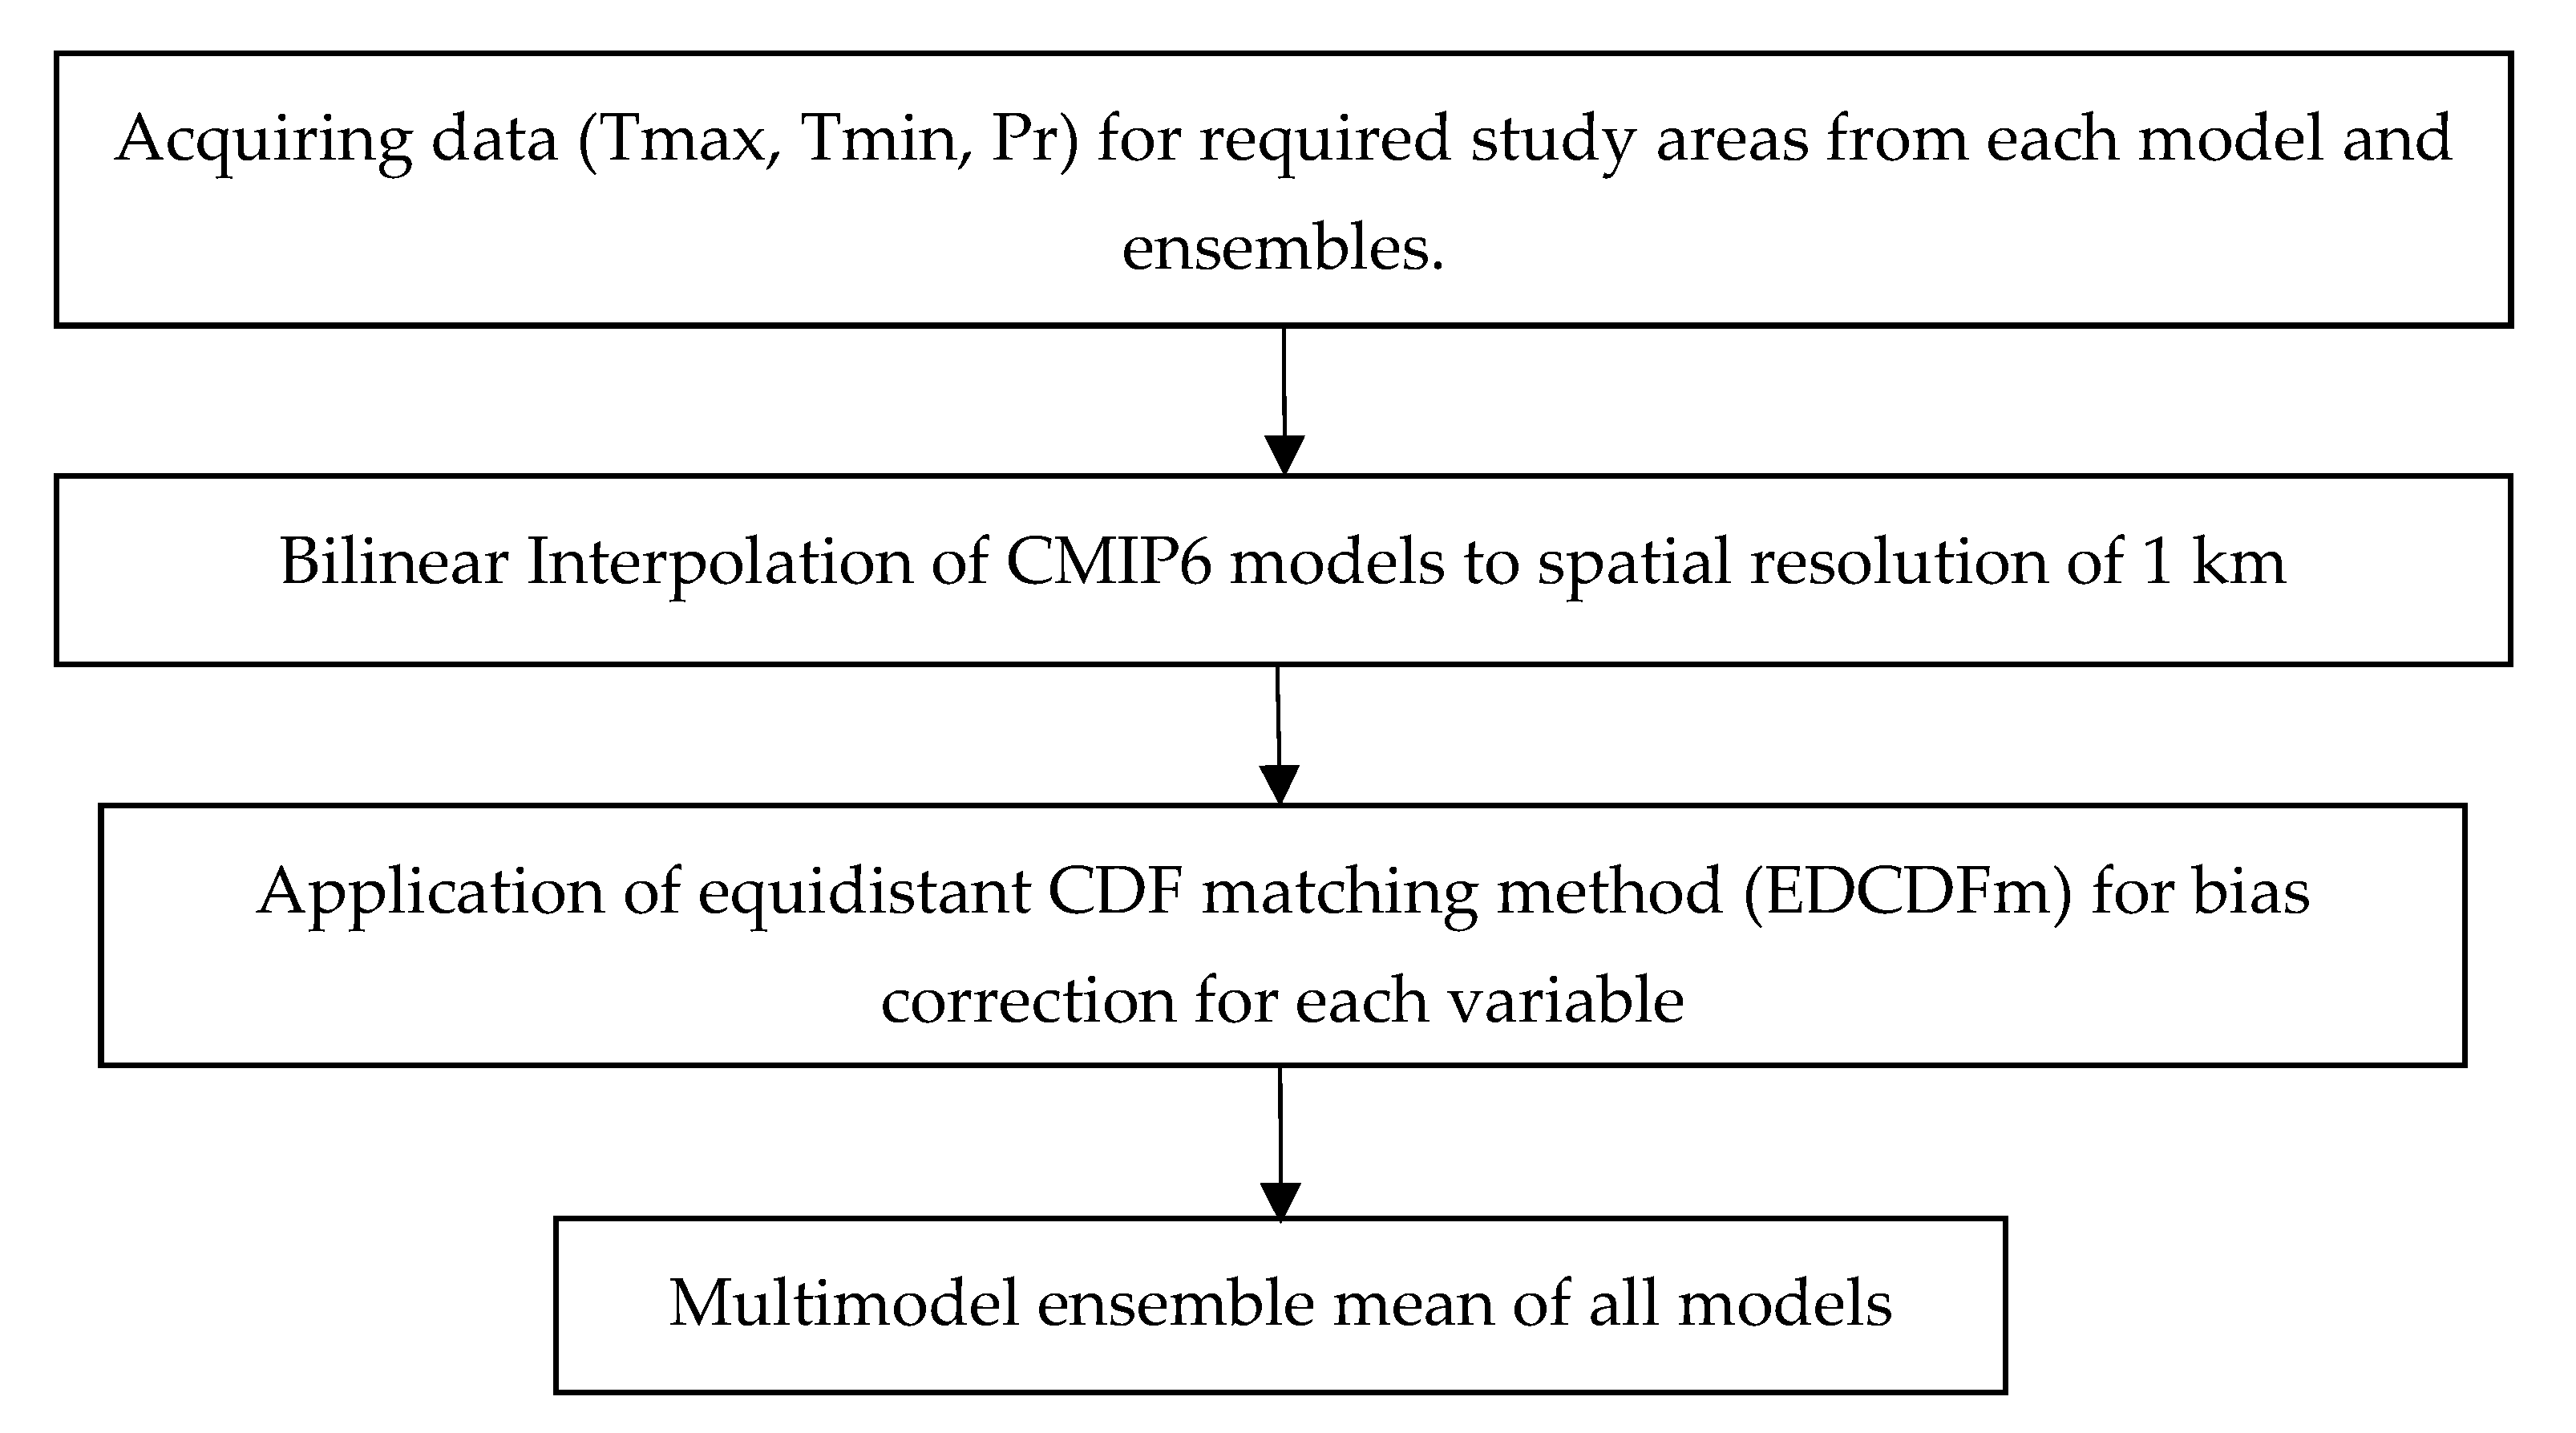
3.2. Methodology
3.2.1. Bias Correction of Climate Variables
- m = MME mean of CMIP6 data
- f = future observations from CMIP6 (2015 to 2044)
- o = historical observations from CMIP6 (1985 to 2014)
- h = observed historical data from gridded data (1985 to 2014)
- X = climate variables (Tasmax, Tasmin, and Pr)
- F = cumulative distributive function (CDF)
- F−1 = inverse cumulative distributive function
3.2.2. Potential Evapotranspiration
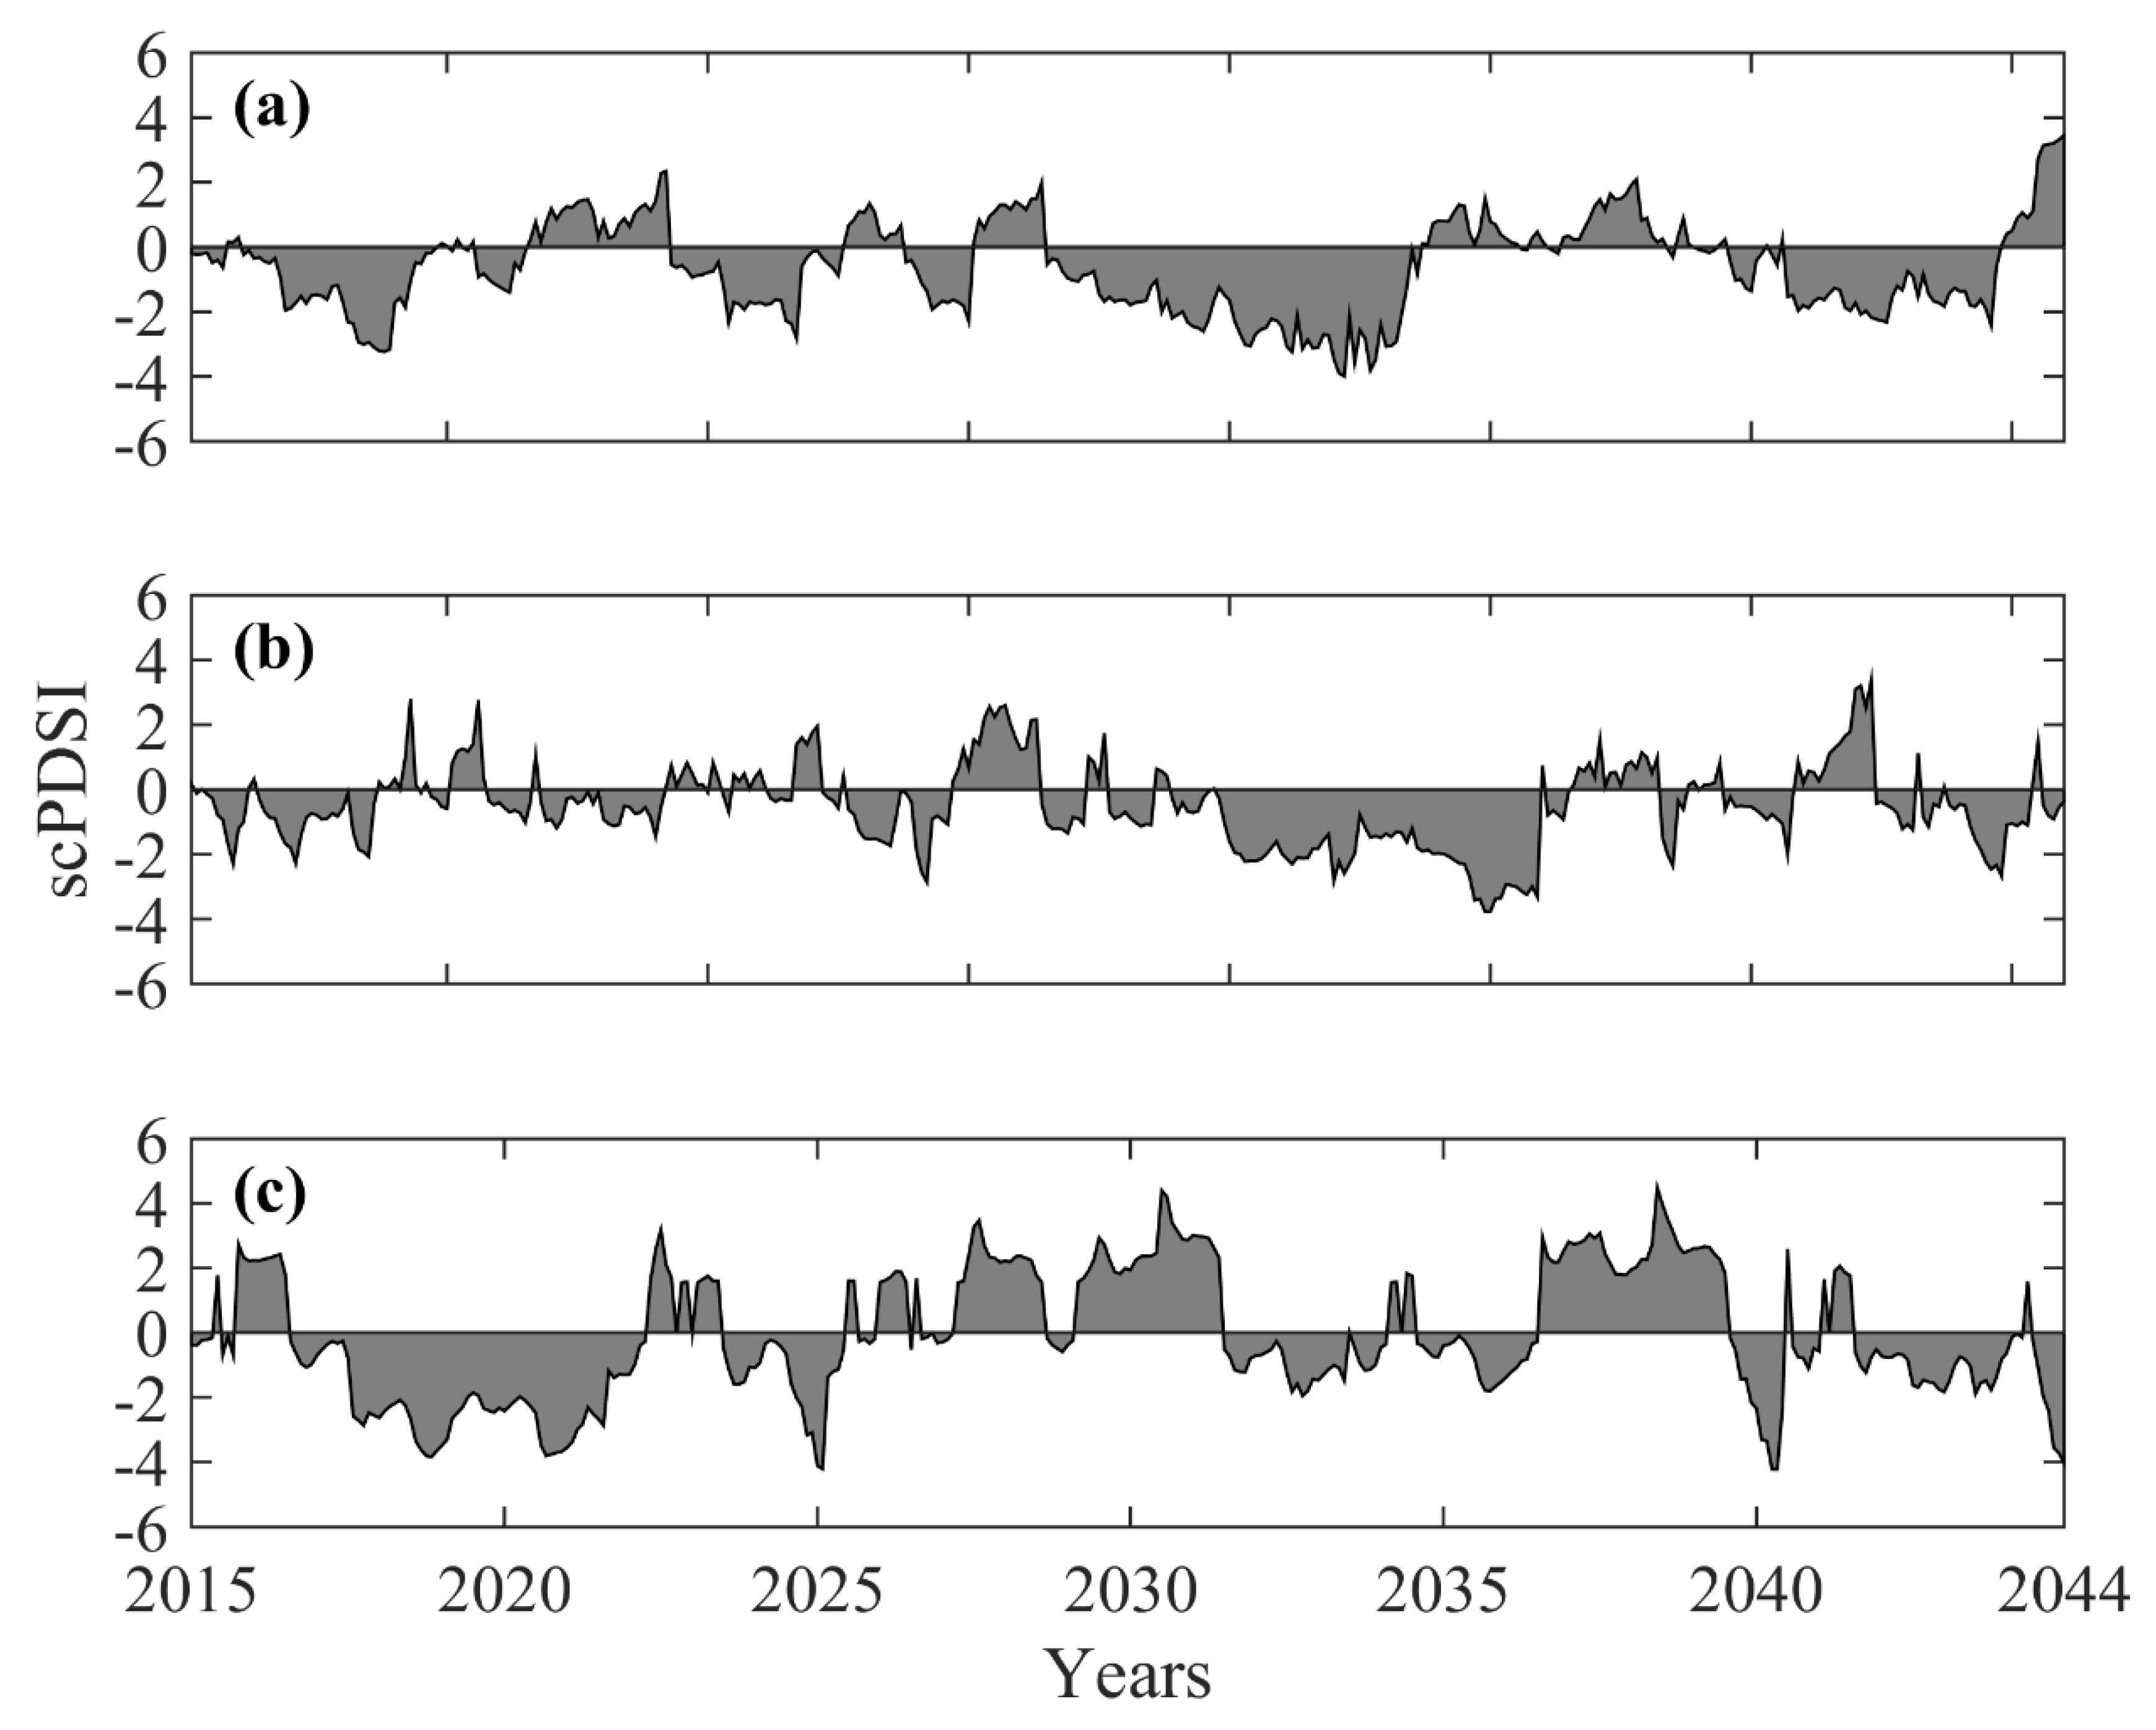
3.2.3. scPDSI Drought Index
3.2.4. Future Duration of Drought
4. Results
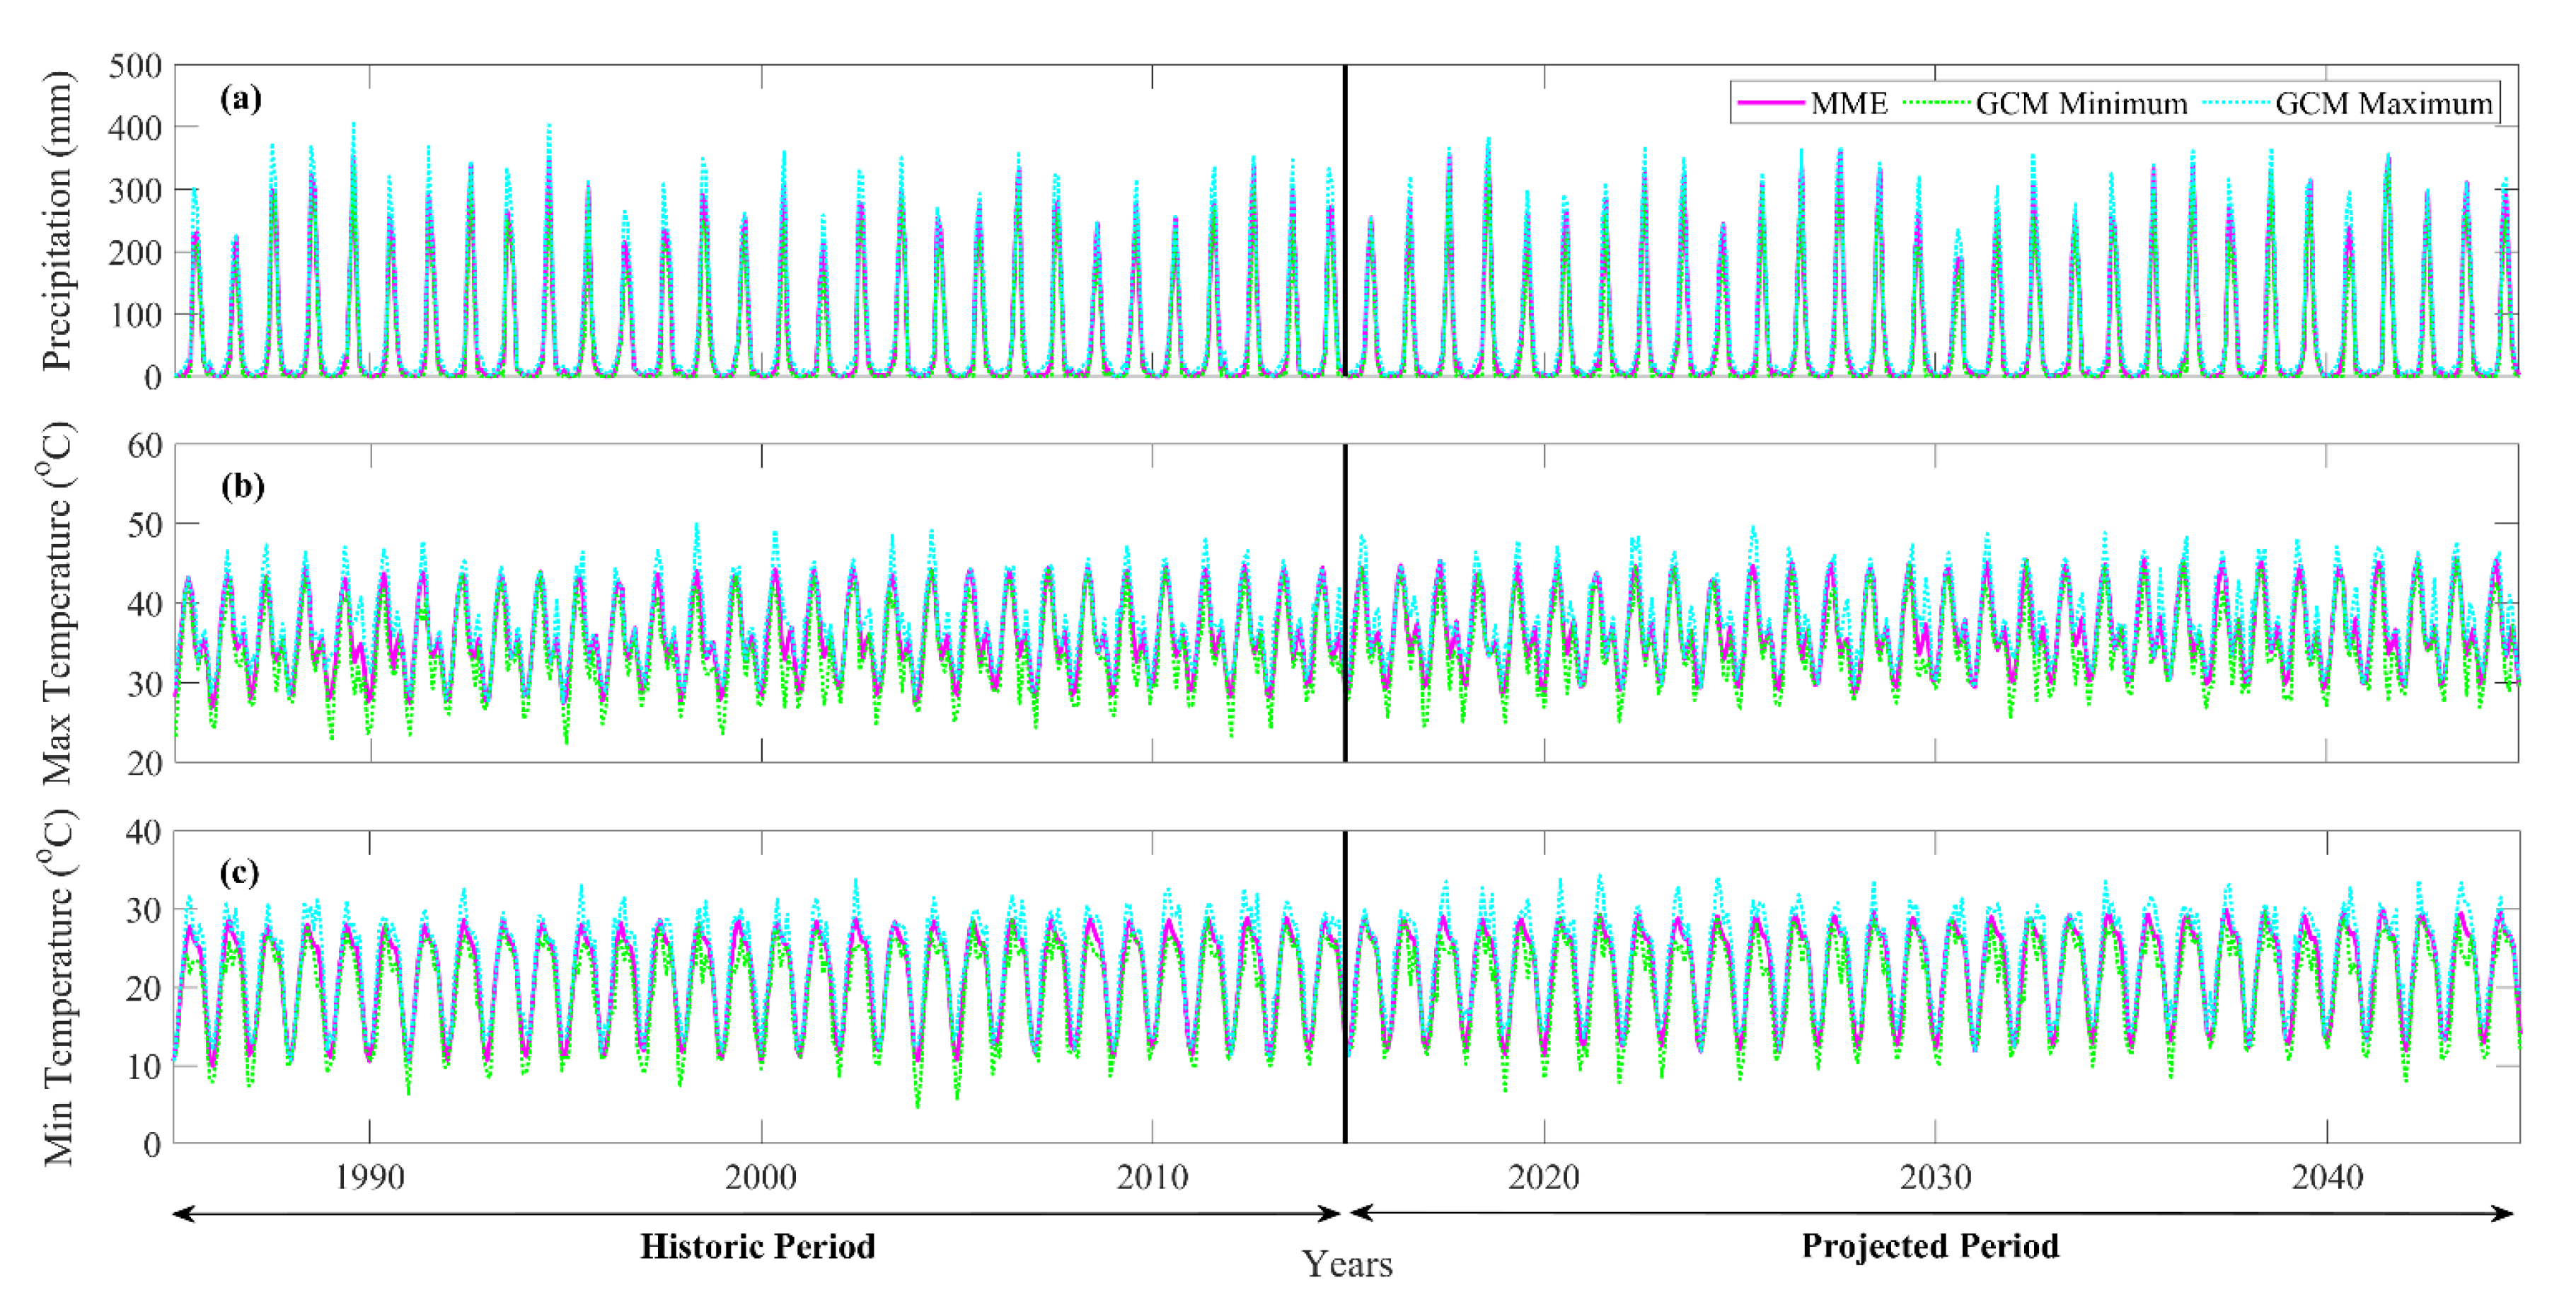
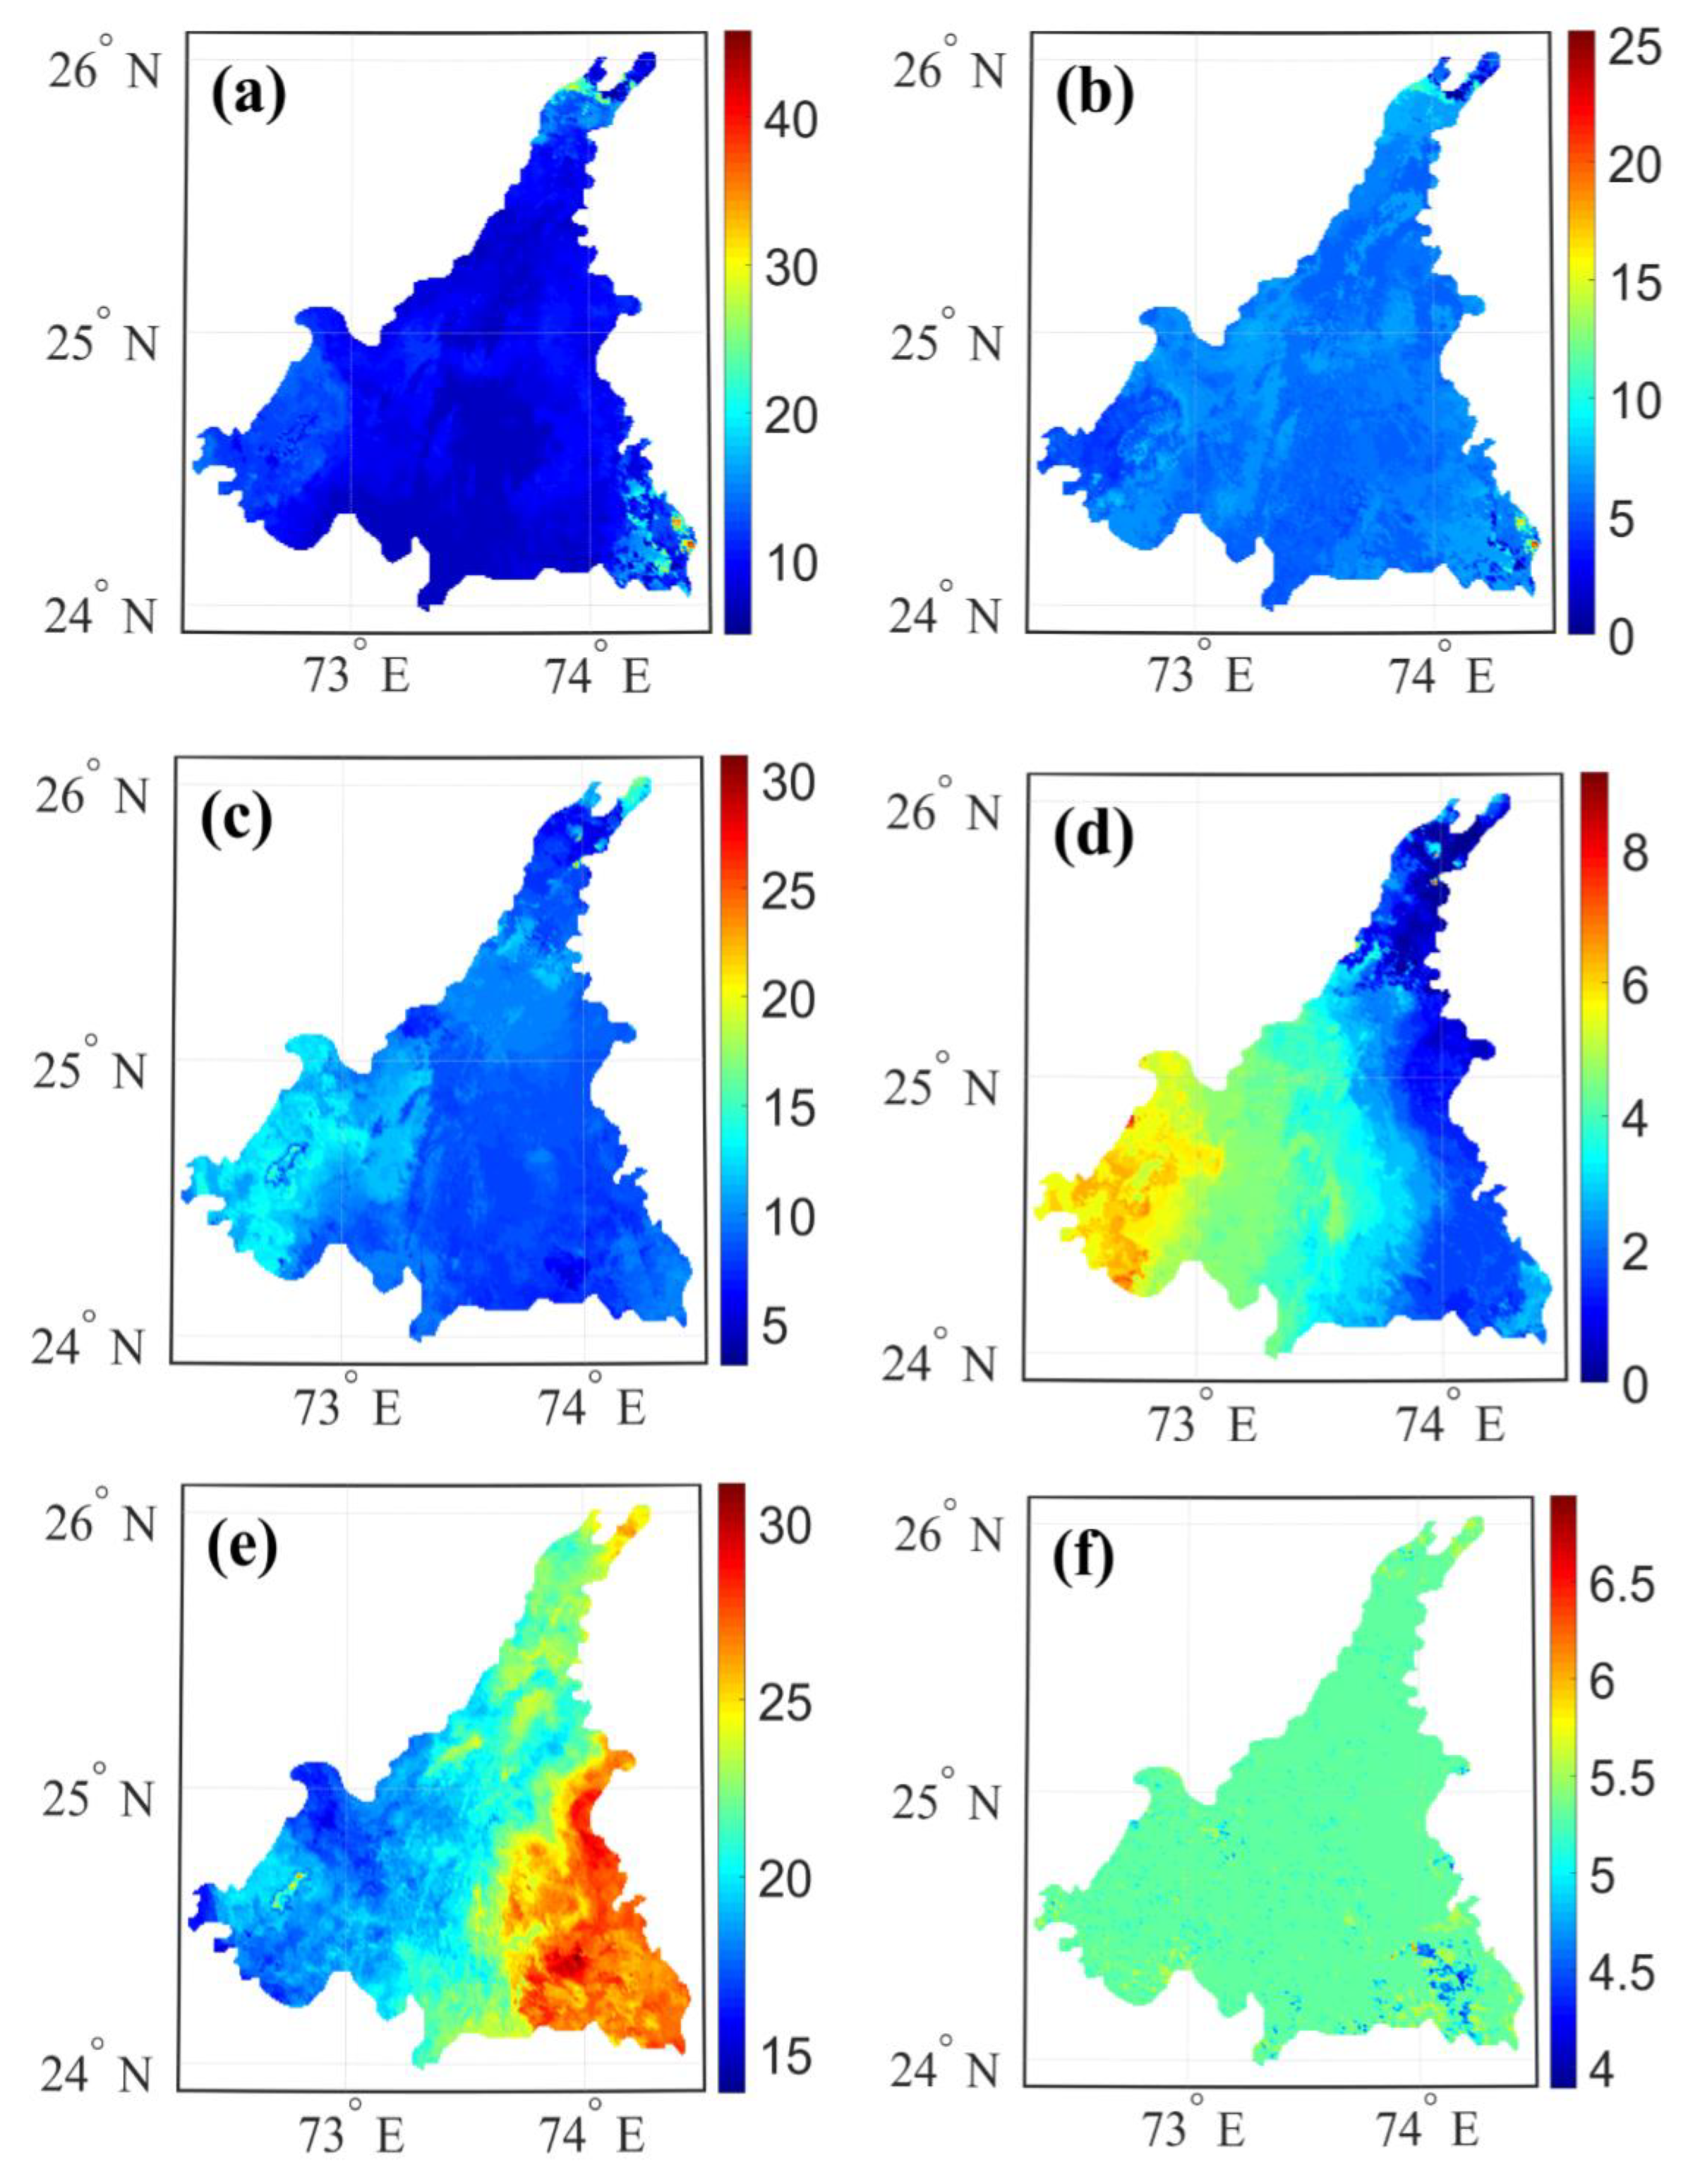
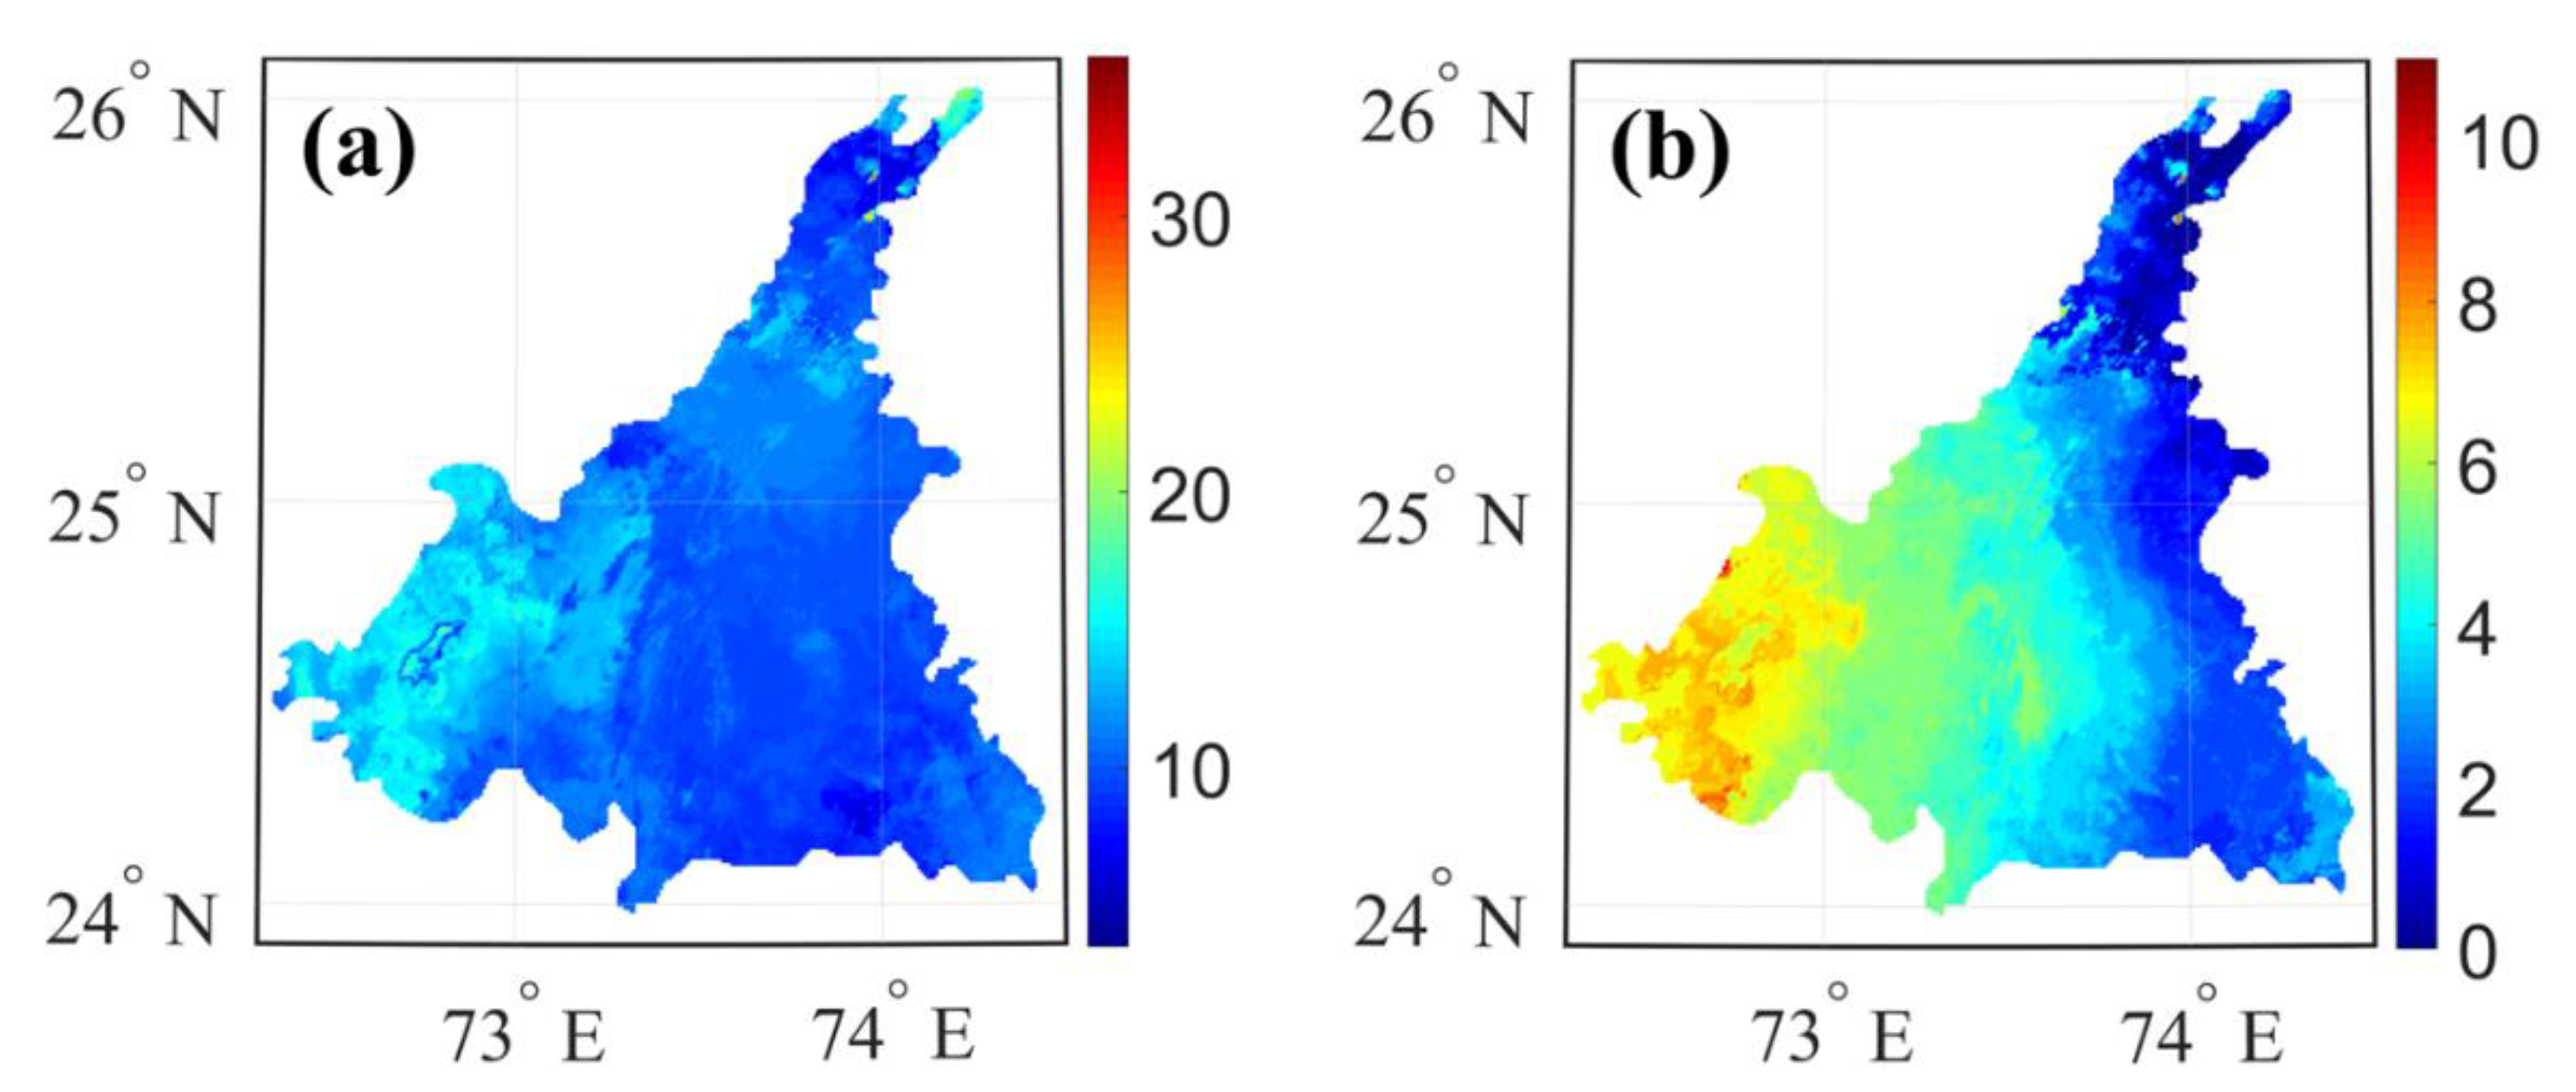
4.1. Araveli Region
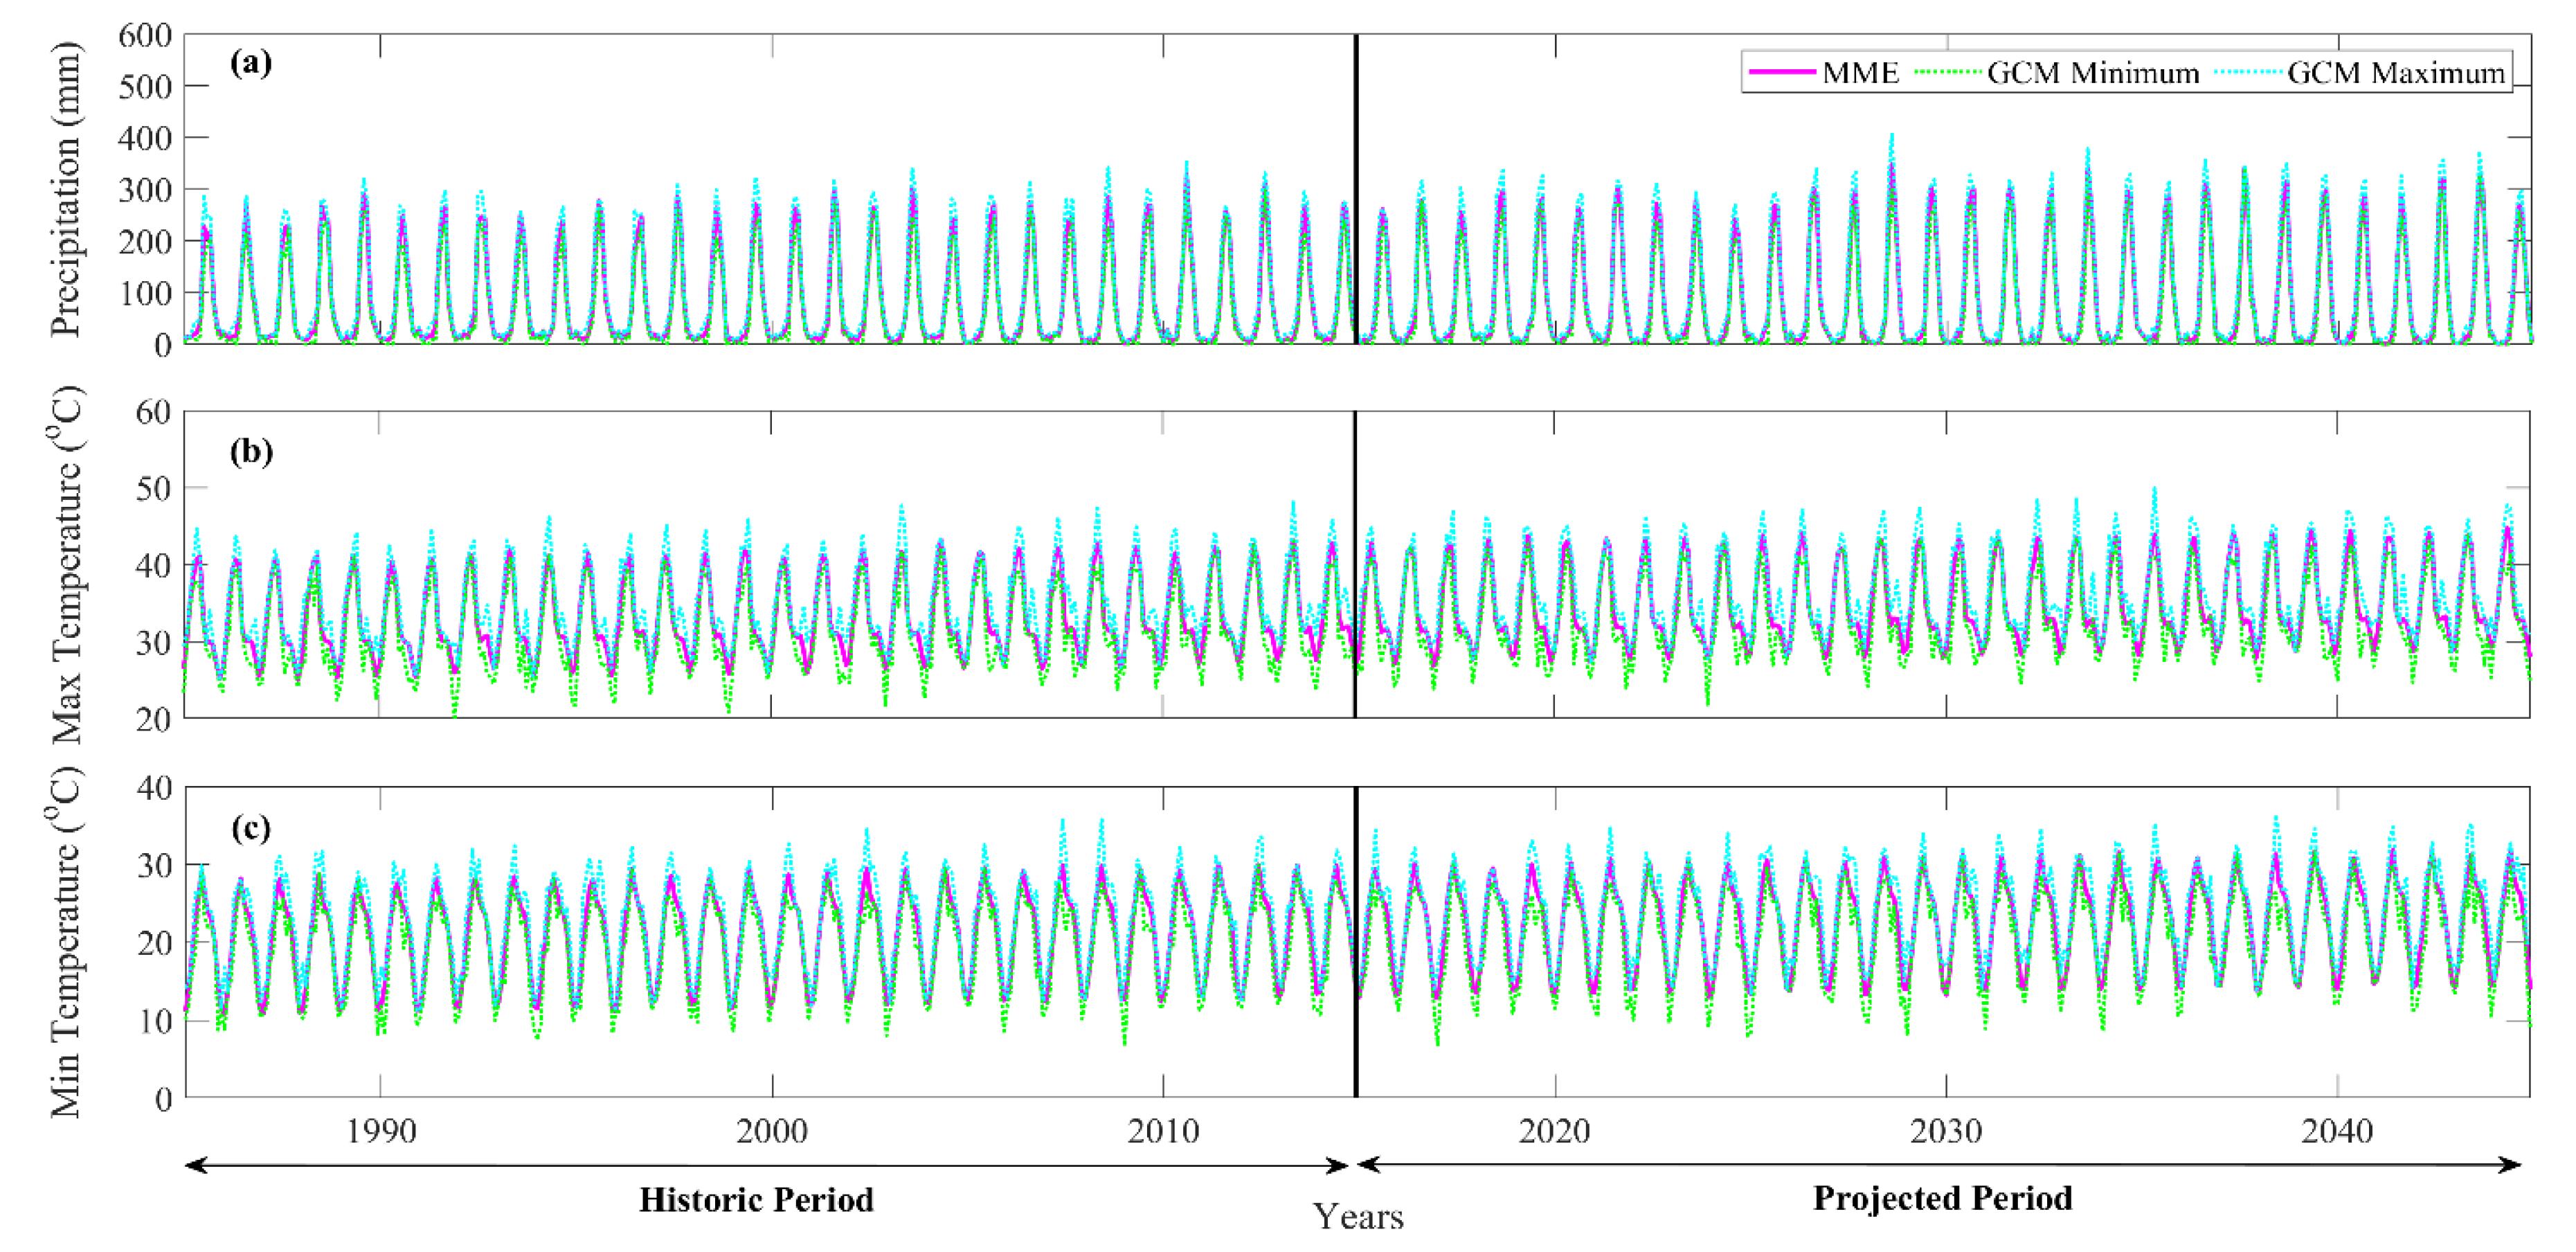
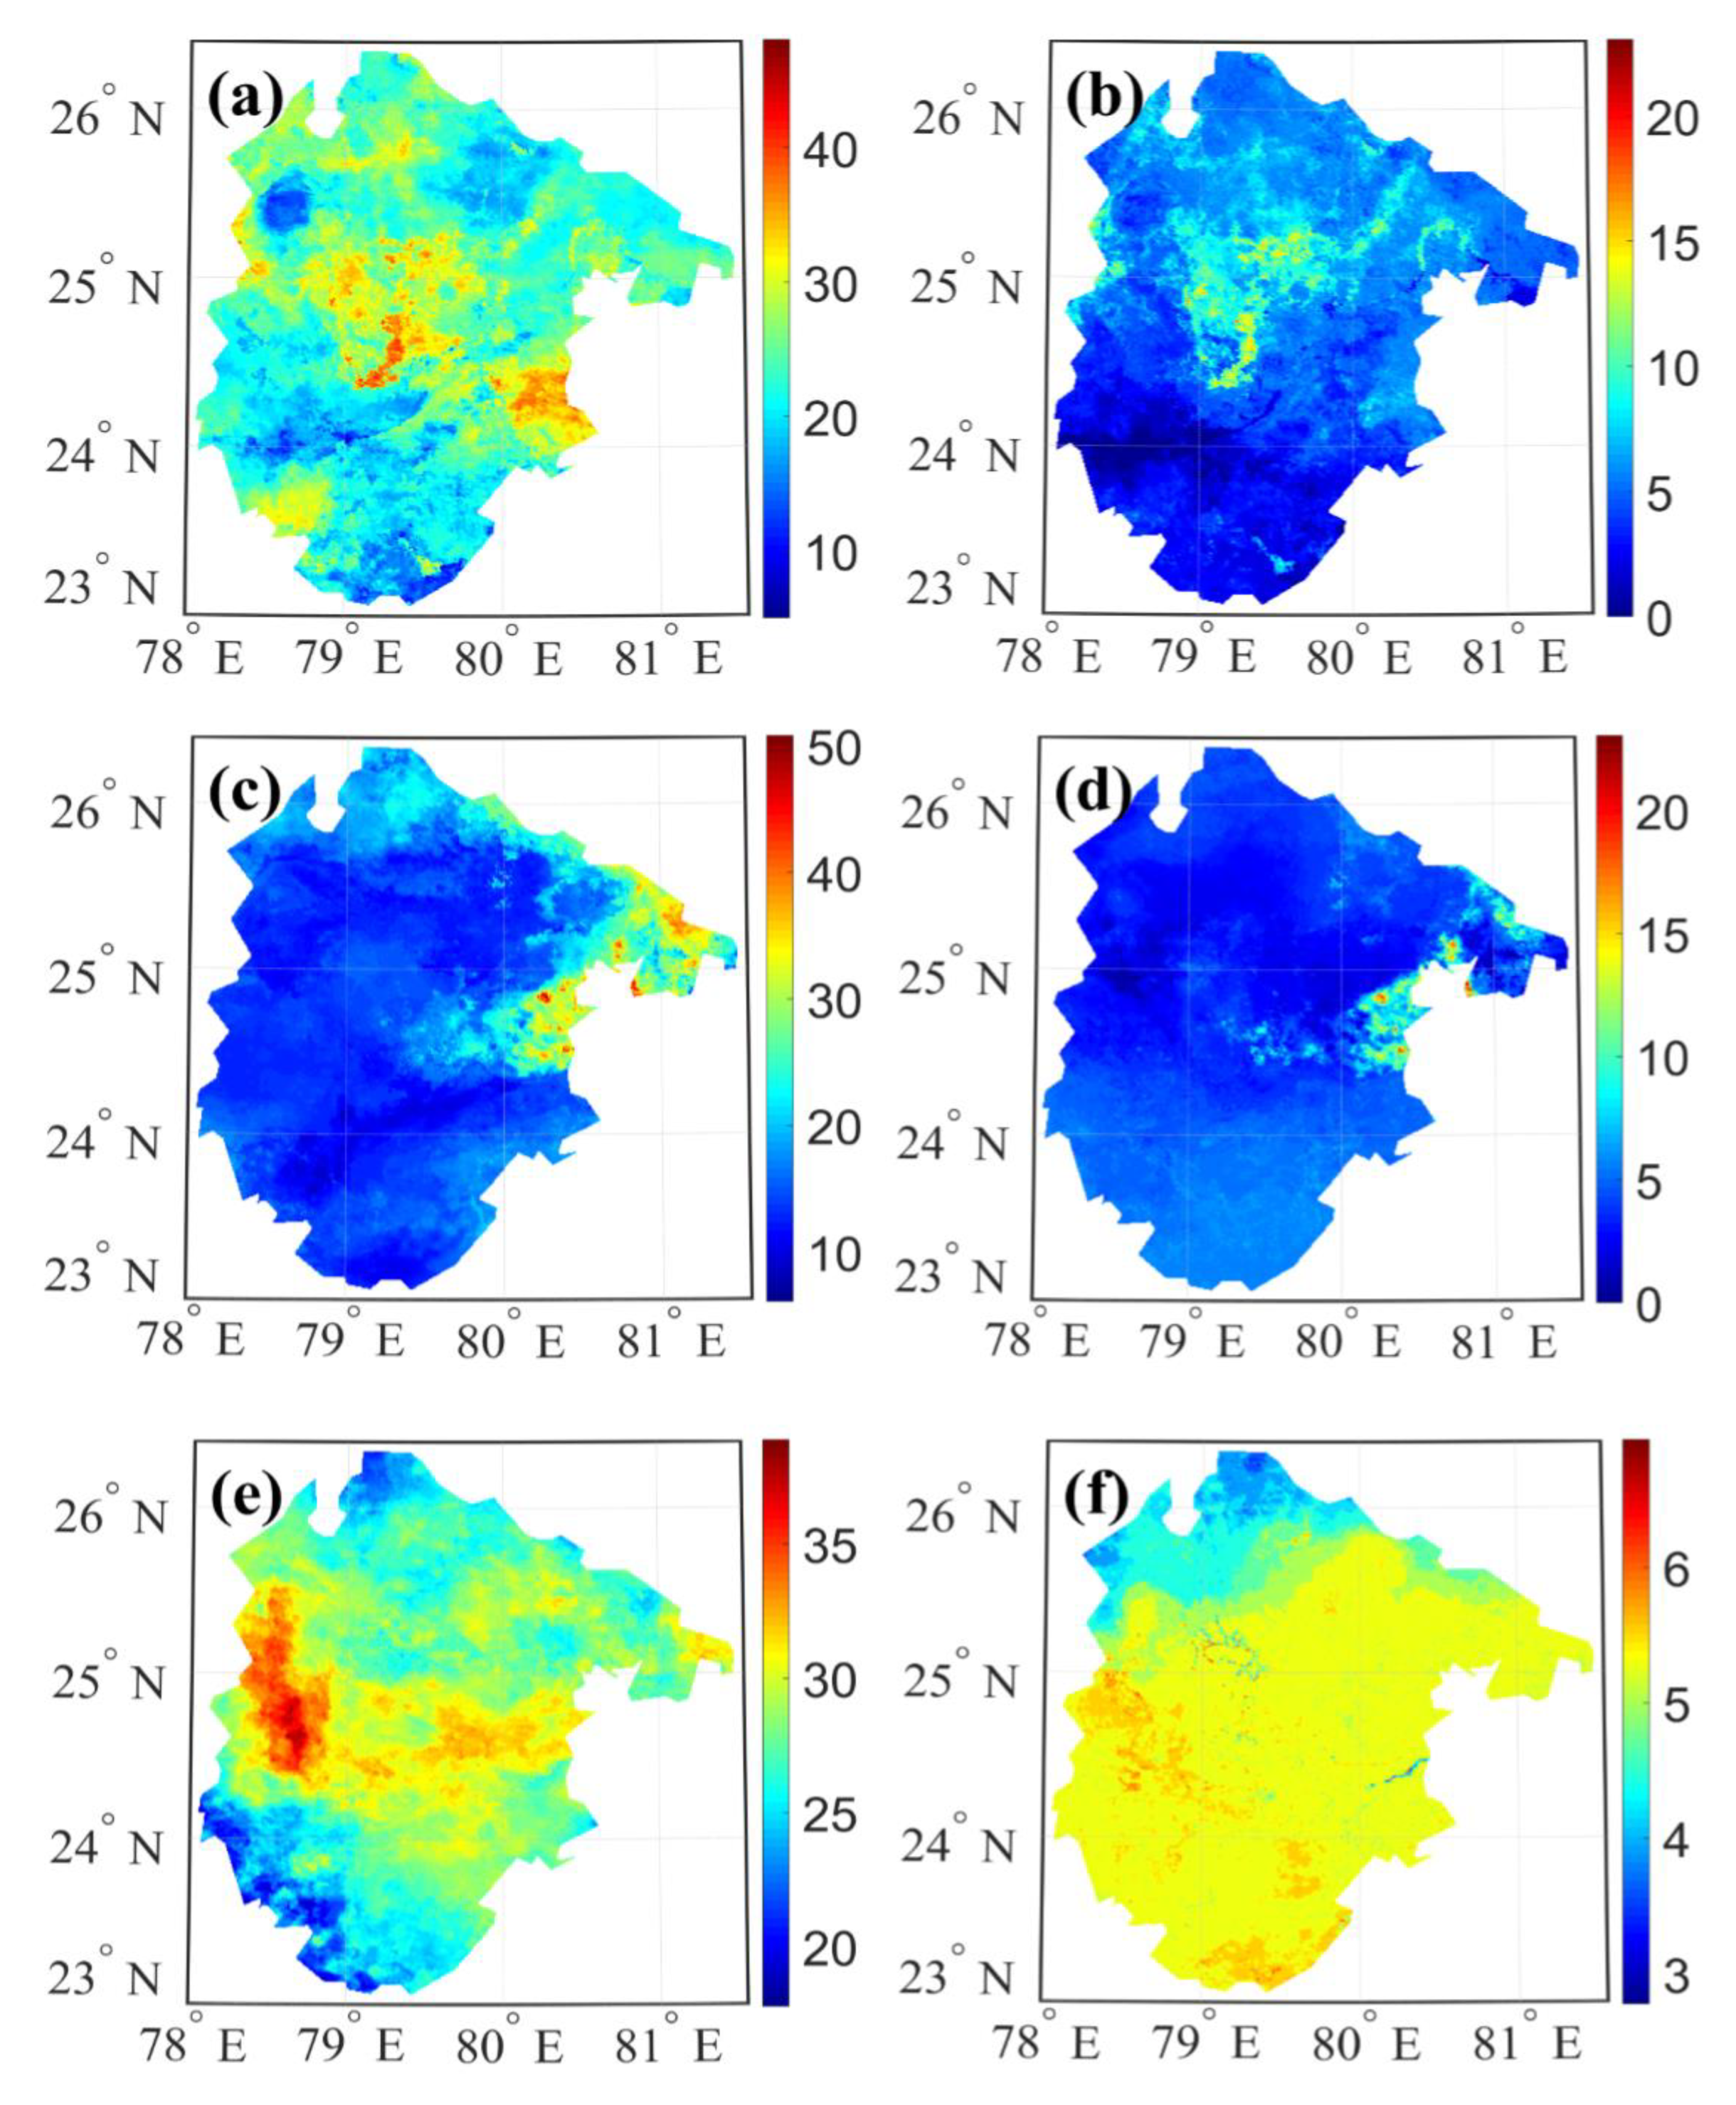
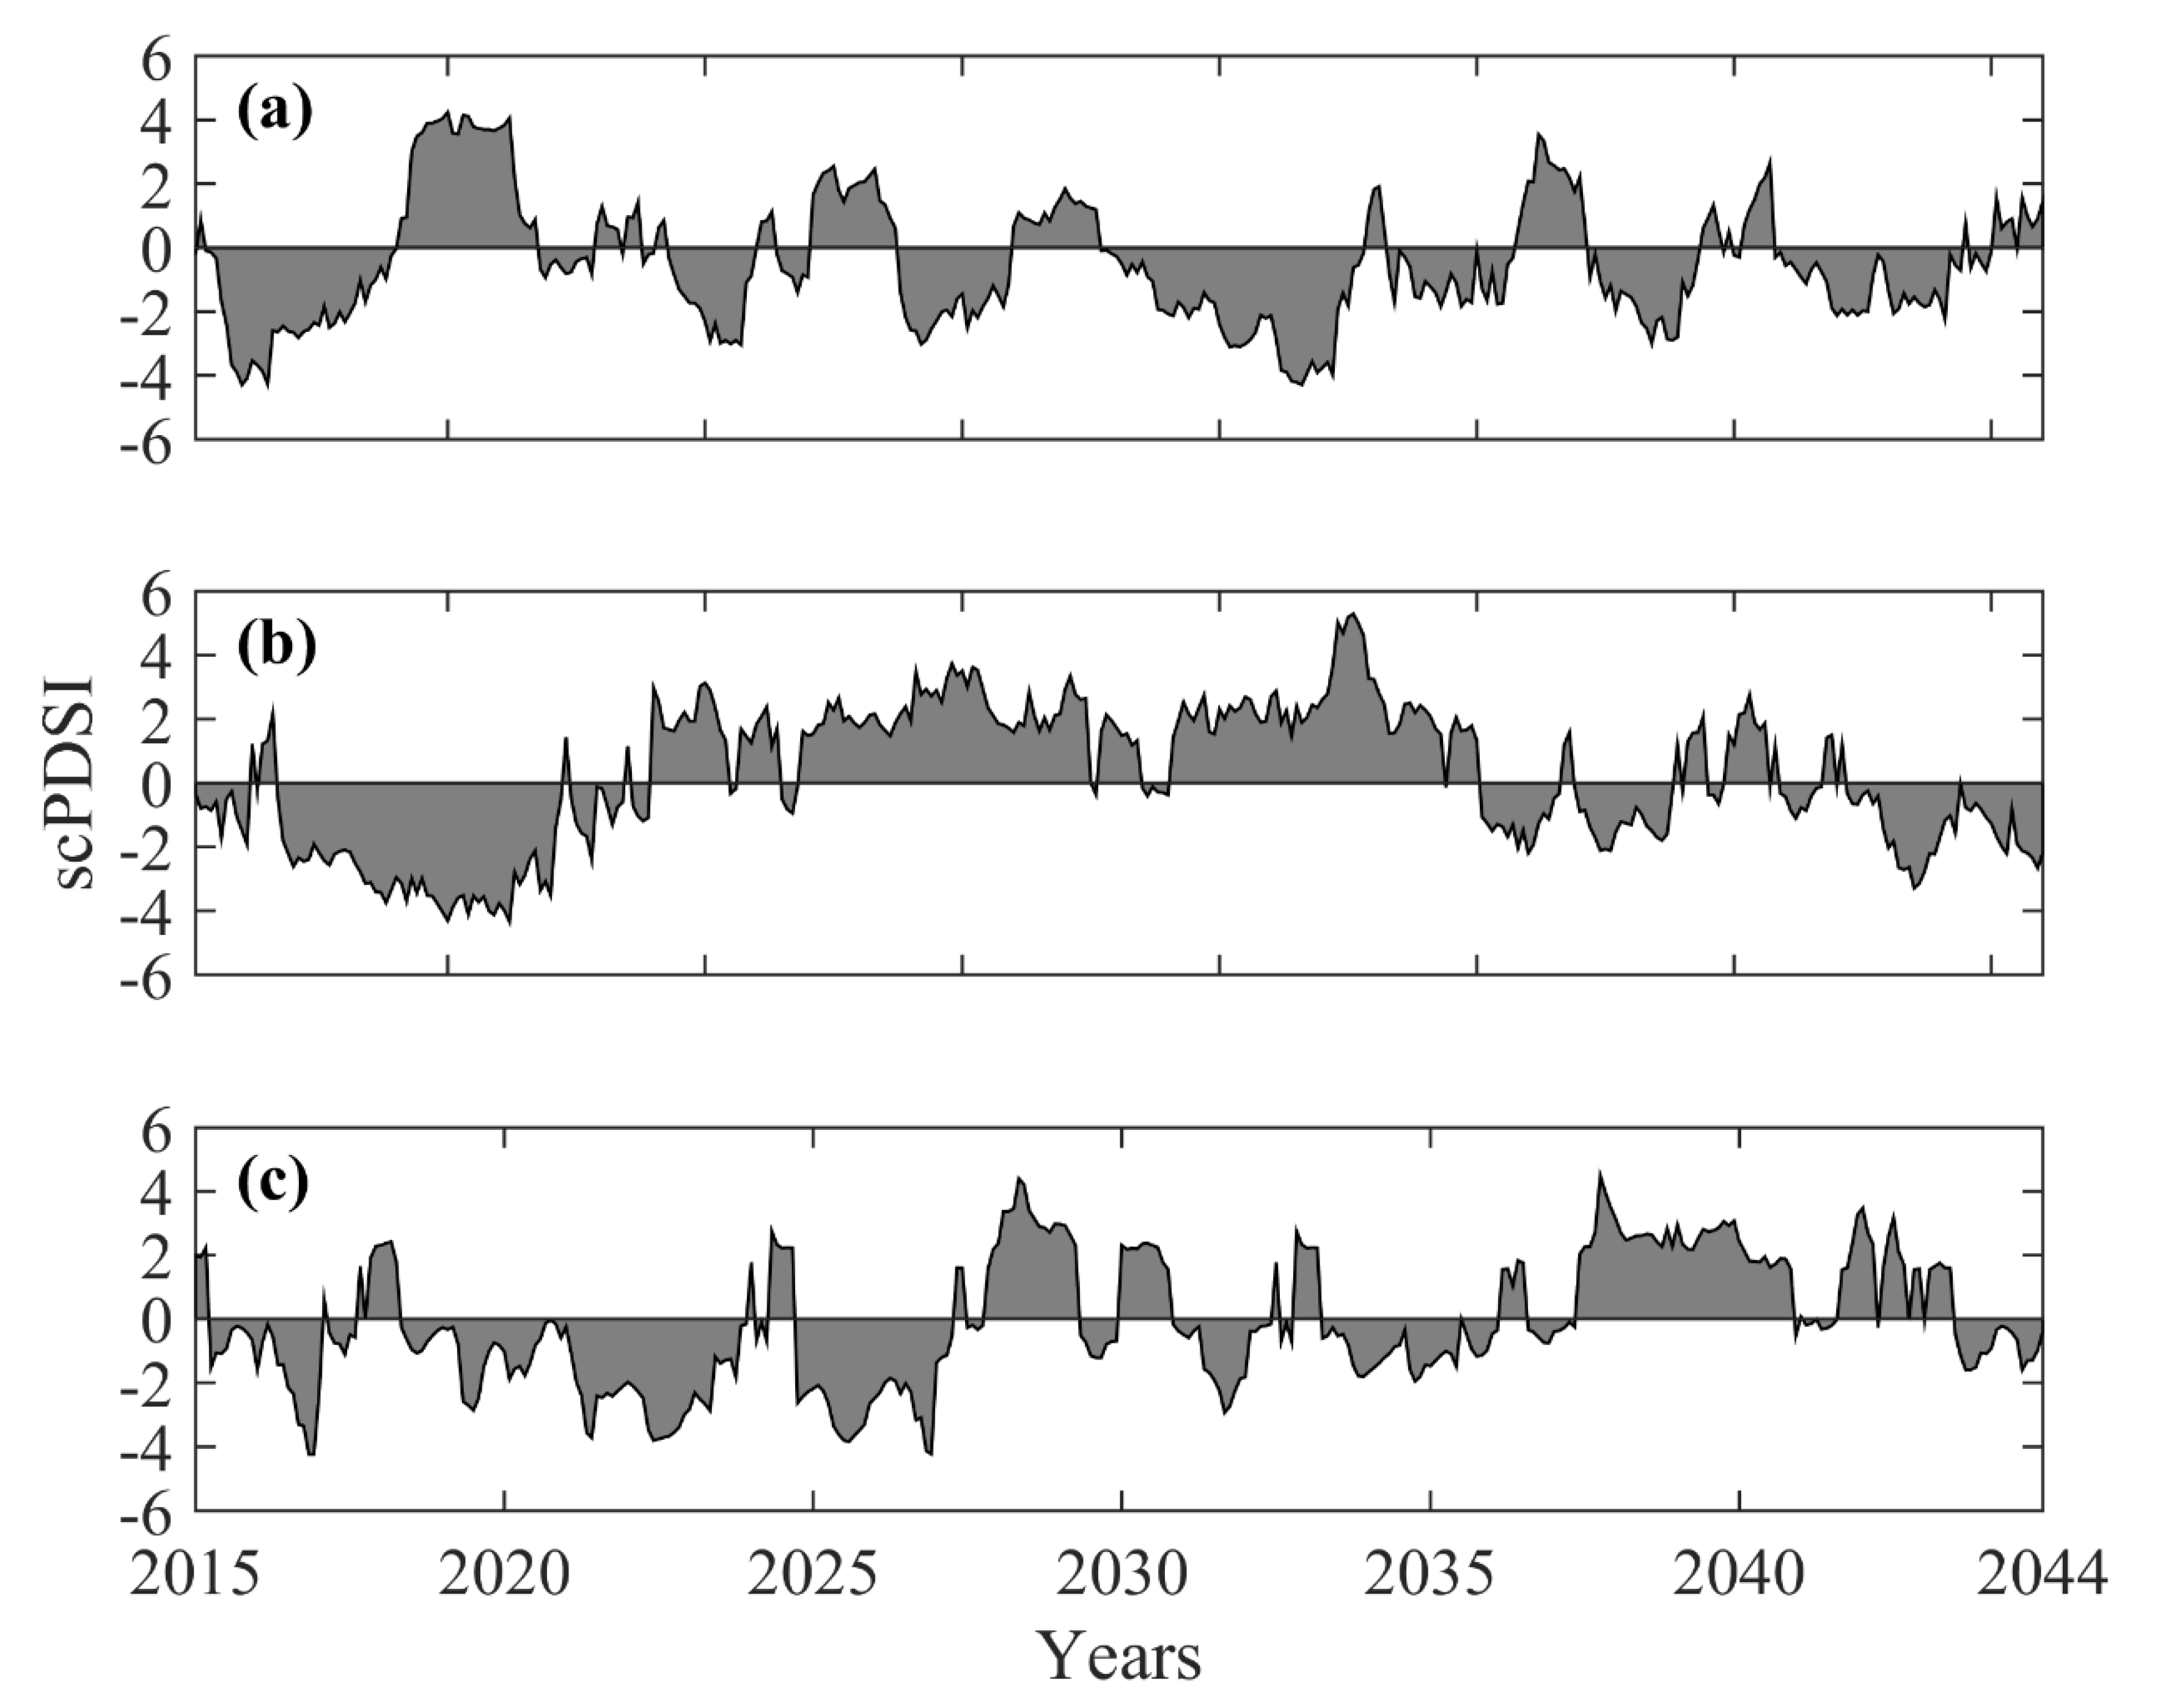
4.2. Bundelkhand Region
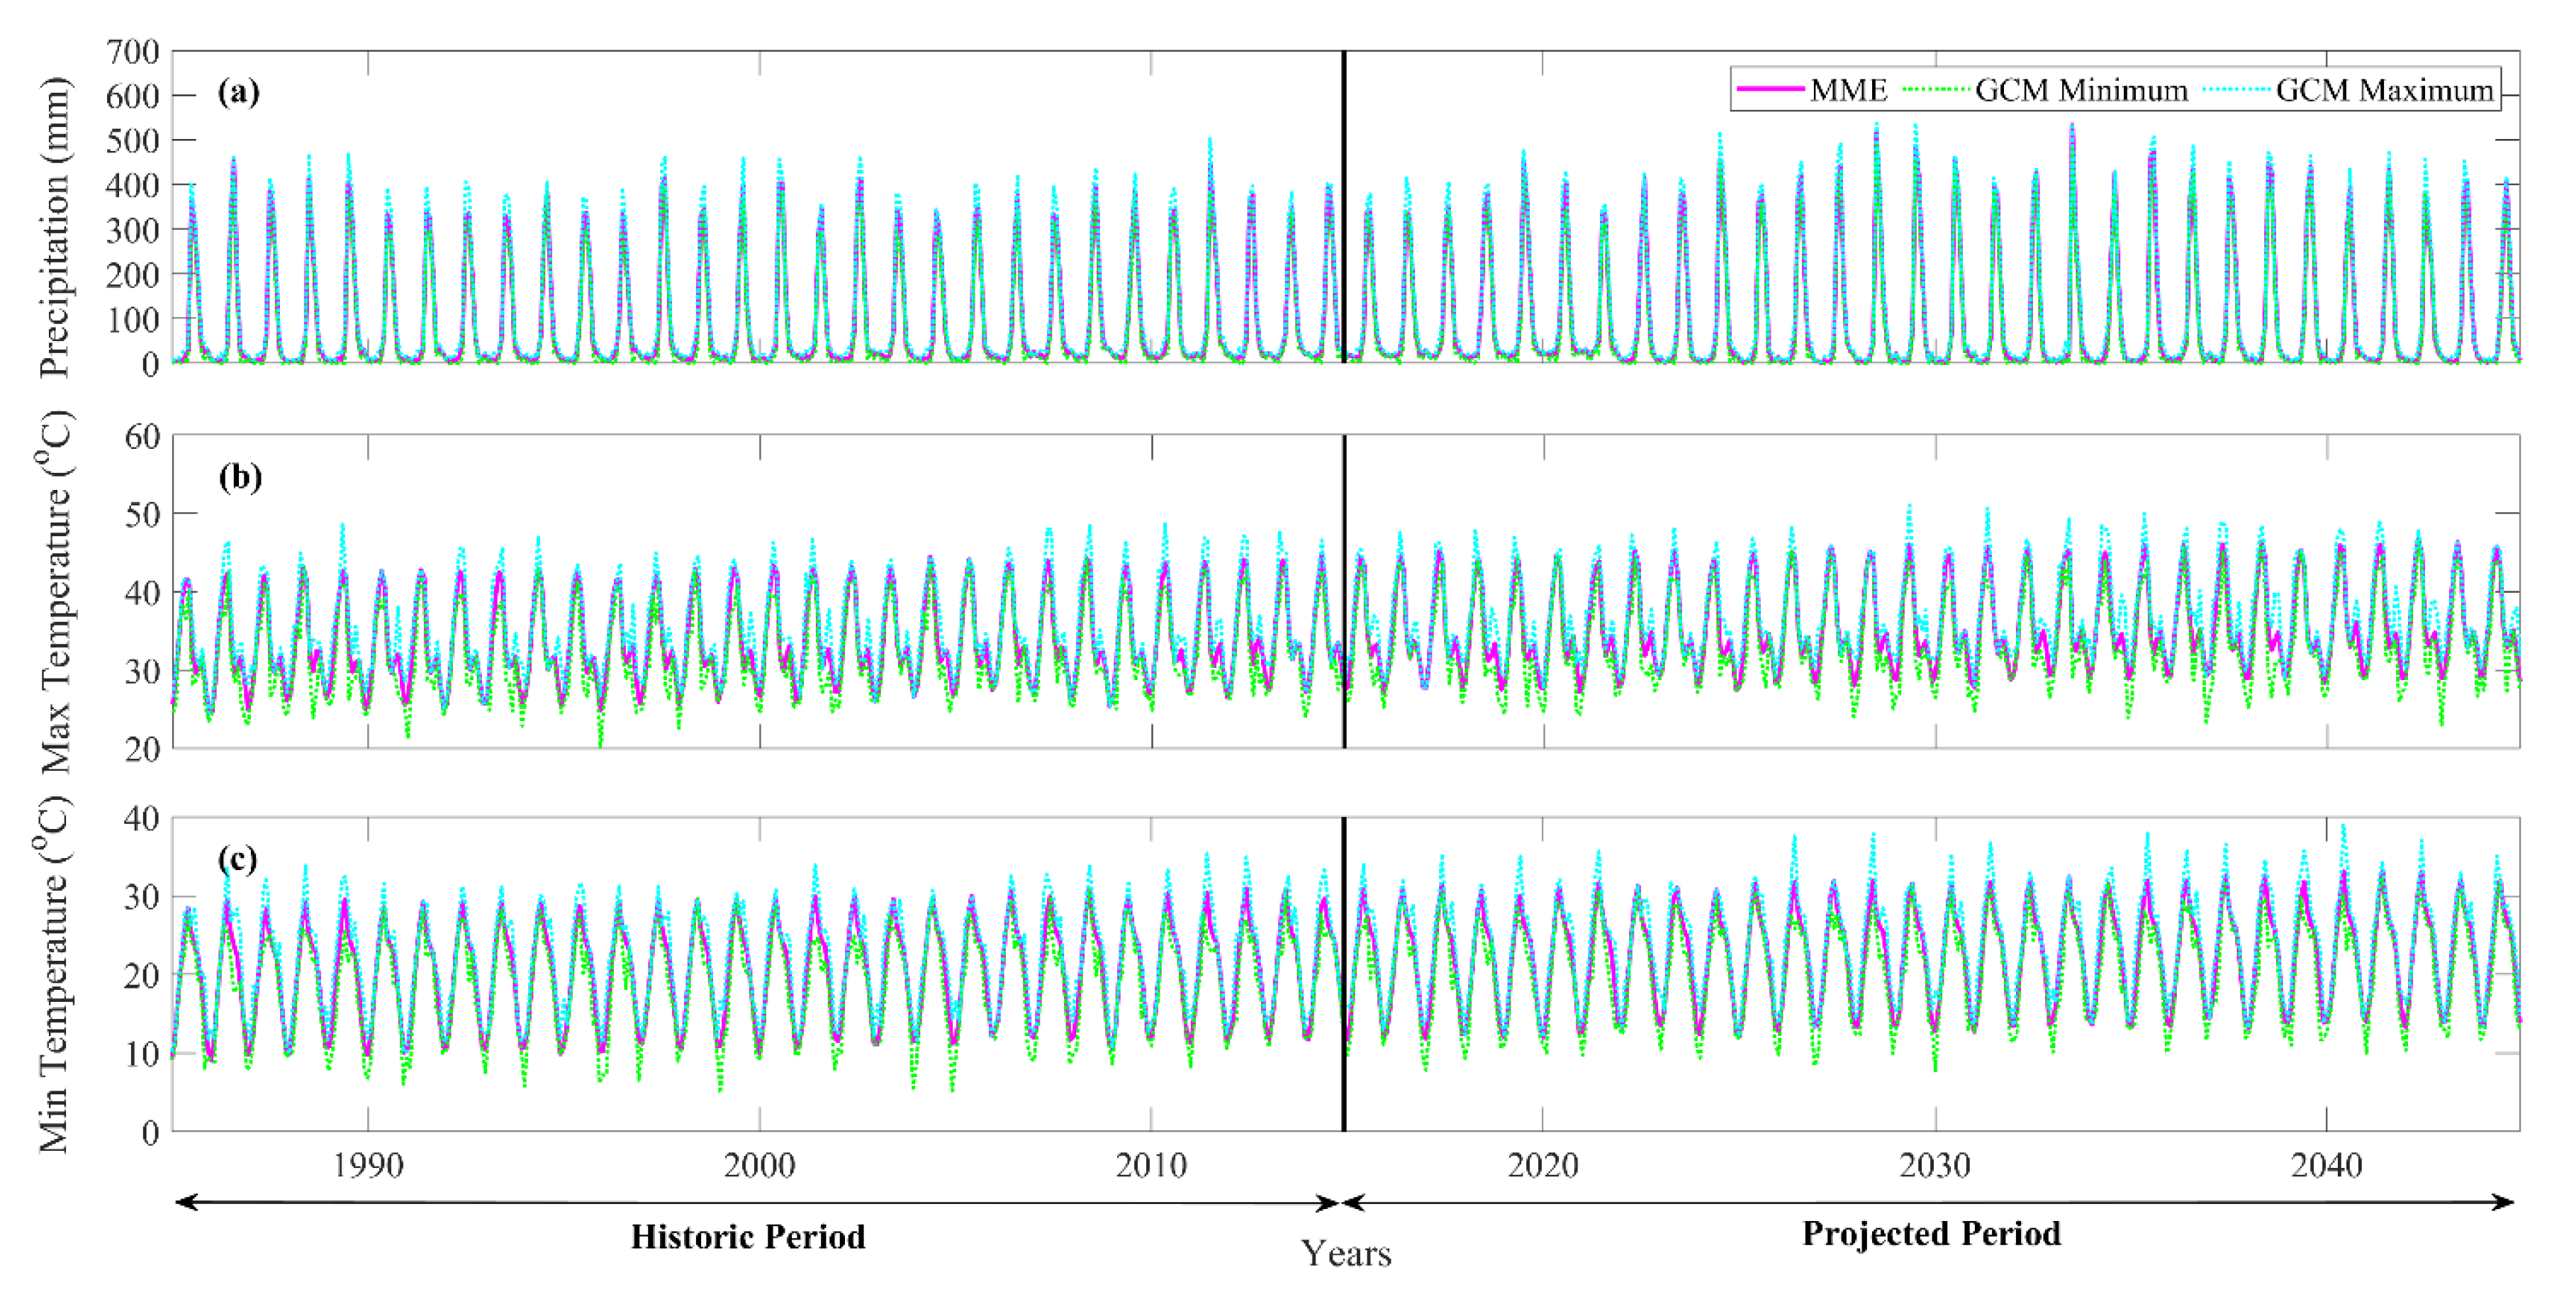
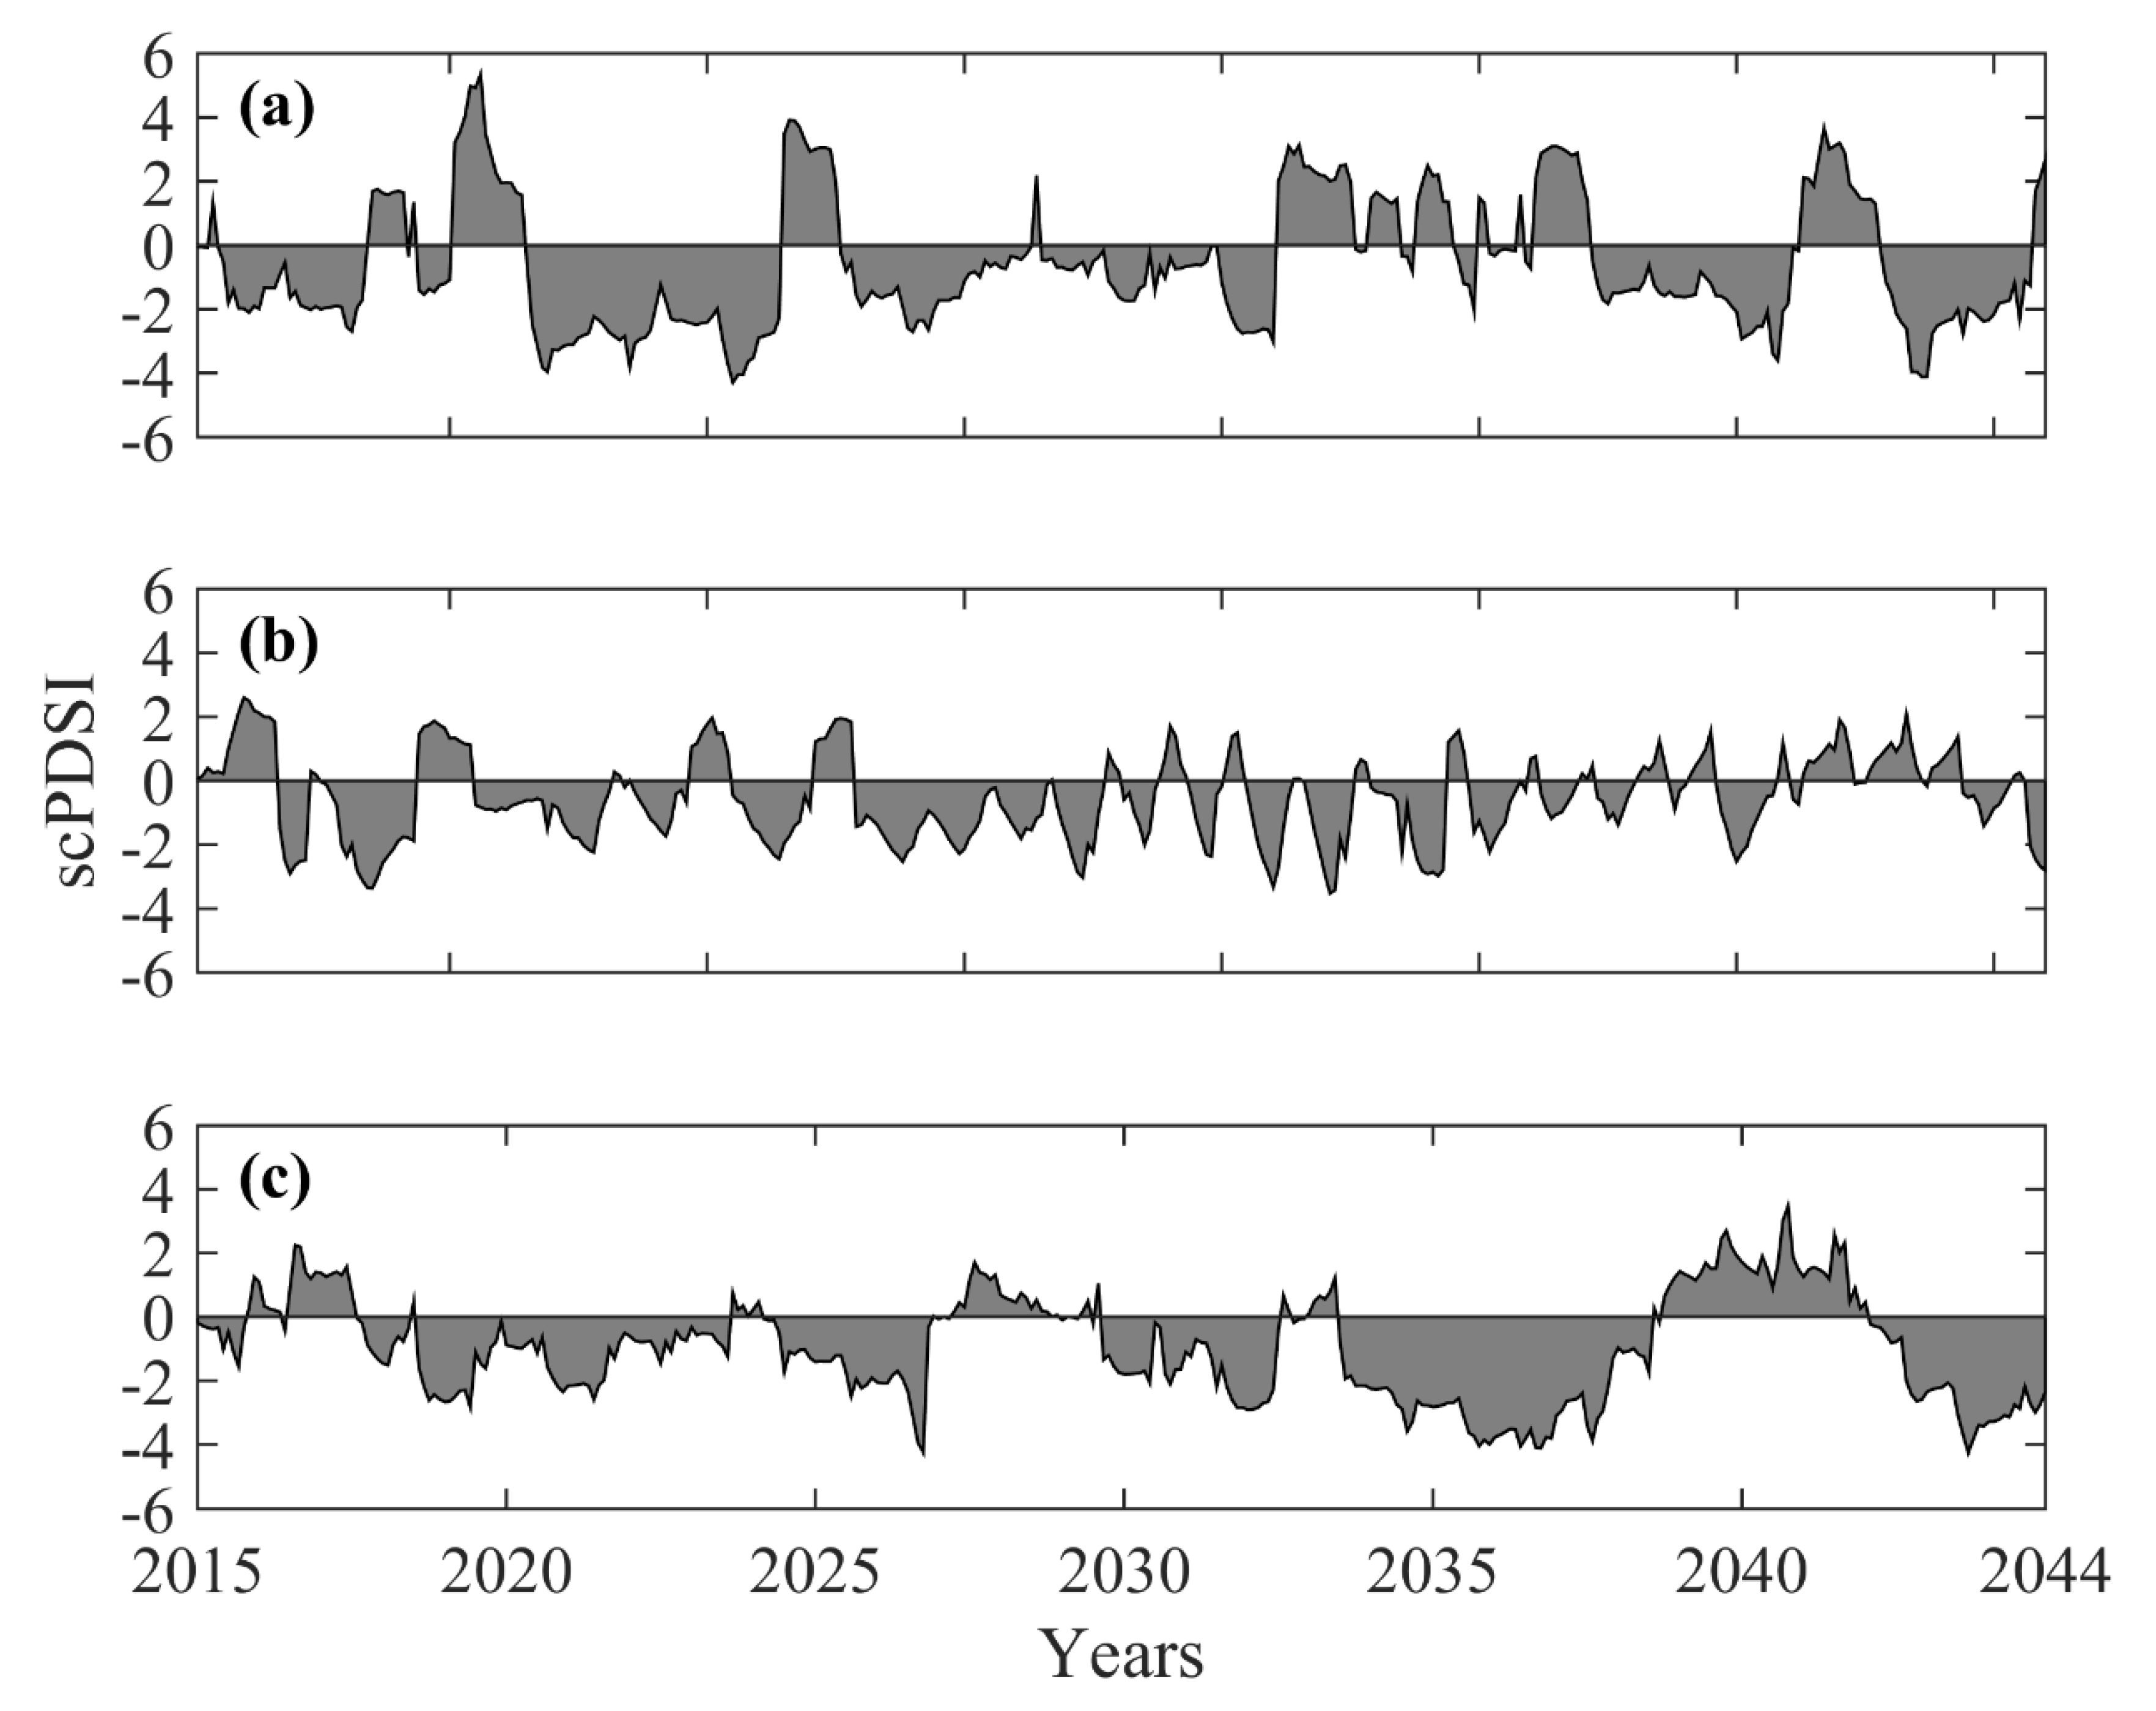
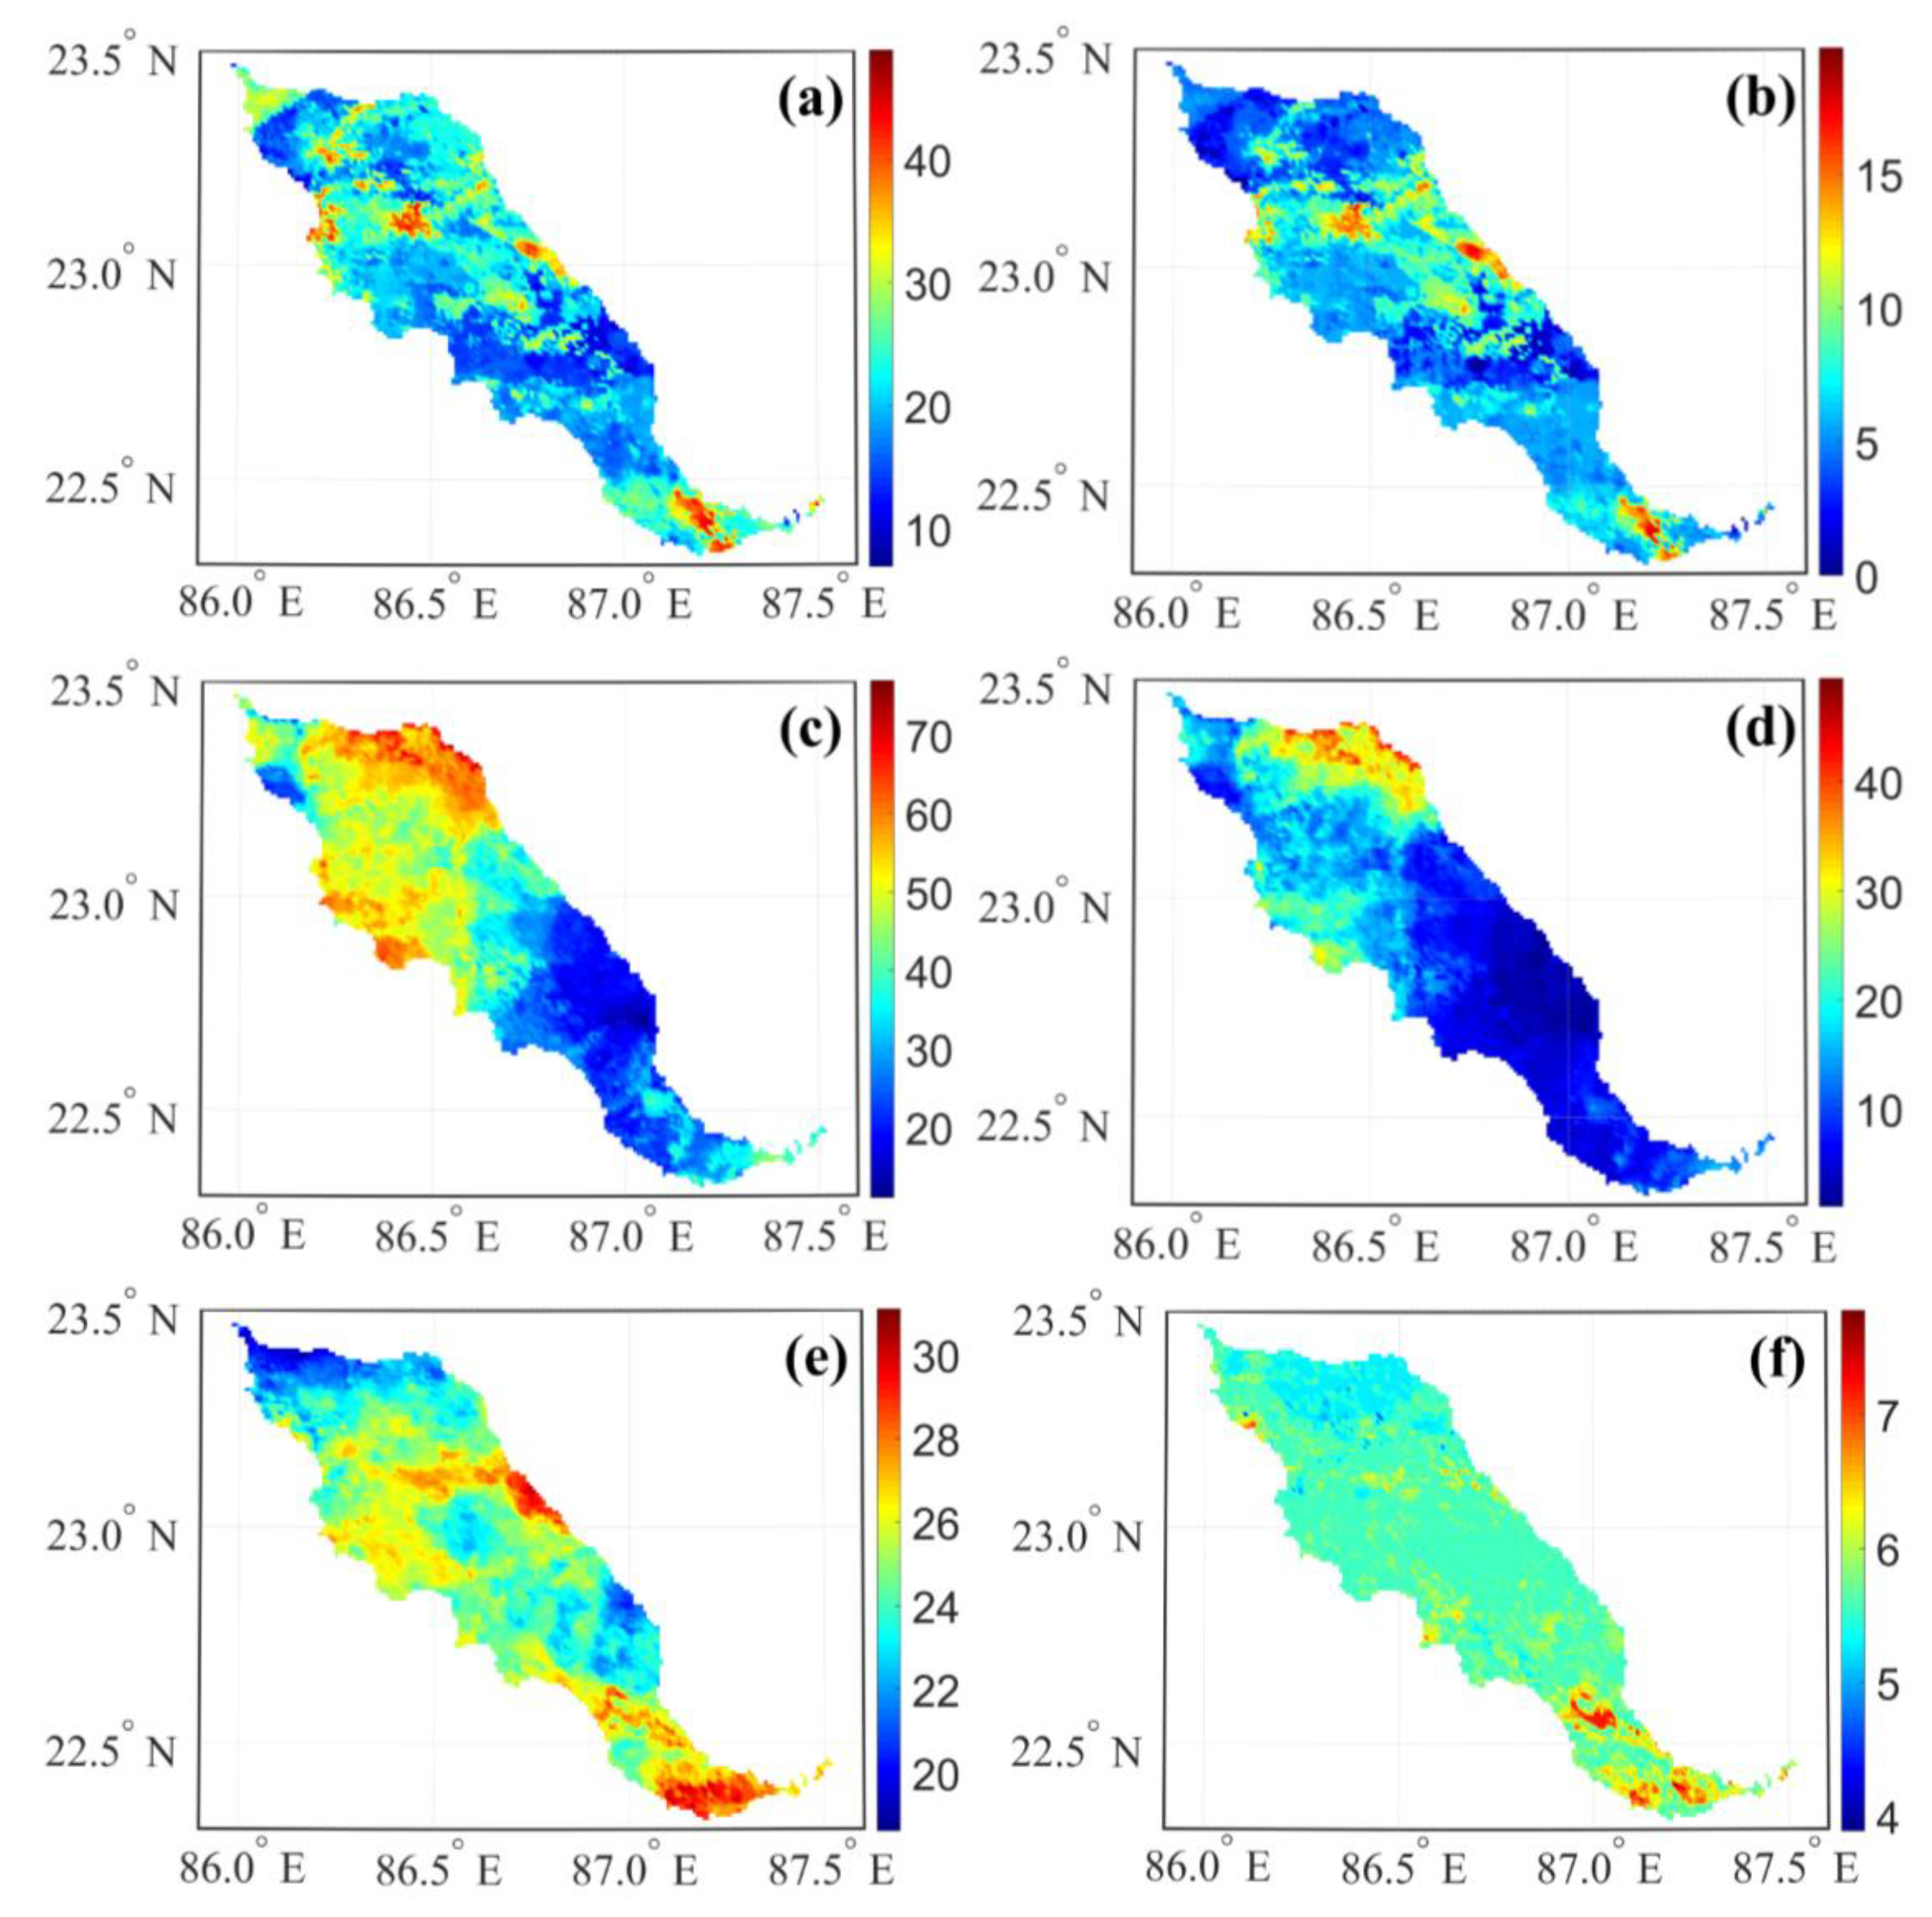
4.3. Kansabati River Basin
5. Discussion
6. Conclusions
- (1)
- Prolonged durations of severe drought (scPDSI ≤ −3) can be expected under the SSP2-4.5 and SSP 5-8.5 scenarios between 2015 and 2044.
- (2)
- The period of a possible lengthy spell of worse drought situation can be identified as the period between the mid-2030s and early 2040s for the Araveli and Bundelkhand regions.
- (3)
- Distinct drought durations, even in the smallest of the vulnerable areas, were identified due to fine spatial resolution of the obtained drought index dataset.
Author Contributions
Funding
Acknowledgments
Conflicts of Interest
References
- AghaKouchak, A.; Nakhjiri, N. A near real-time satellite-based global drought climate data record. Environ. Res. Lett. 2012, 7, 044037. [Google Scholar] [CrossRef] [Green Version]
- Venkataraman, K.; Tummuri, S.; Medina, A.; Perry, J. 21st century drought outlook for major climate divisions of Texas based on CMIP5 multimodel ensemble: Implications for water resource management. J. Hydrol. 2016, 534, 300–316. [Google Scholar] [CrossRef] [Green Version]
- Rahaman, M.M.; Thakur, B.; Kalra, A.; Ahmad, S. Modeling of GRACE-derived groundwater information in the Colorado River Basin. Hydrology 2019, 6, 19. [Google Scholar] [CrossRef] [Green Version]
- Brown, C.; Meeks, R.; Hunu, K.; Yu, W. Hydro climatic risk to economic growth in sub-Saharan Africa. Clim. Chang. 2011, 106, 621–647. [Google Scholar] [CrossRef]
- Hartmann, D.L.; Tank, A.M.G.K.; Rusticucci, M. Climatic Change 2013: The Physical Science Basis; IPCC Fifth Assessment Report; IPCC: Geneva, Switzerland, 2013; pp. 31–39. [Google Scholar]
- Trenberth, K.E.; Dai, A.; Van Der Schrier, G.; Jones, P.D.; Barichivich, J.; Briffa, K.R.; Sheffield, J. Global warming and changes in drought. Nat. Clim. Chang. 2014, 4, 17–22. [Google Scholar] [CrossRef]
- Dai, A. Increasing drought under global warming in observations and models. Nat. Clim. Chang. 2013, 3, 52–58. [Google Scholar] [CrossRef]
- Peterson, T.C.; Heim, R.R., Jr.; Hirsch, R.; Kaiser, D.P.; Brooks, H.; Diffenbaugh, N.S.; Dole, R.M.; Giovannettone, J.P.; Guirguis, K.; Karl, T.R.; et al. Monitoring and understanding changes in heat waves, cold waves, floods, and droughts in the United States: State of knowledge. Bull. Am. Meteorol. Soc. 2013, 94, 821–834. [Google Scholar] [CrossRef] [Green Version]
- Masih, I.; Maskey, S.; Mussá, F.E.; Trambauer, P. A review of droughts on the African continent: A geospatial and long-term perspective. Hydrol. Earth Syst. Sci. 2014, 18, 3635. [Google Scholar] [CrossRef] [Green Version]
- Spinoni, J.; Vogt, J.; Naumann, G.; Carrao, H.; Barbosa, P. Towards identifying areas at climatological risk of desertification using the Köppen–Geiger classification and FAO aridity index. Int. J. Climatol. 2015, 35, 2210–2222. [Google Scholar] [CrossRef] [Green Version]
- Kumar, K.R.; Sahai, A.K.; Kumar, K.K.; Patwardhan, S.K.; Mishra, P.K.; Revadekar, J.V.; Kamala, K.; Pant, G.B. High-resolution climate change scenarios for India for the 21st century. Curr. Sci. 2006, 90, 334–345. [Google Scholar] [CrossRef]
- Shackley, S.; Deanwood, R. Stakeholder Perceptions of Climate Change Impacts at the Regional Scale: Implications for the Effectiveness of Regional and Local Responses. J. Environ. Plan. Manag. 2002, 45, 381–402. [Google Scholar] [CrossRef]
- Zhao, T.; Dai, A. Uncertainties in historical changes and future projections of drought. Part II: Model-simulated historical and future drought changes. Clim. Chang. 2016, 144, 535–548. [Google Scholar] [CrossRef]
- Ault, T.R.; Cole, J.E.; Overpeck, J.T.; Pederson, G.T.; Meko, D.M. Assessing the risk of persistent drought using climate model simulations and paleoclimate data. J. Clim. 2014, 27, 7529–7549. [Google Scholar] [CrossRef] [Green Version]
- Cook, B.I.; Smerdon, J.E.; Seager, R.; Coats, S. Global warming and 21 st century drying. Clim. Dyn. 2014, 43, 2607–2627. [Google Scholar] [CrossRef] [Green Version]
- Zhao, T.; Dai, A. The magnitude and causes of global drought changes in the twenty-first century under a low–moderate emissions scenario. J. Clim. 2015, 28, 4490–4512. [Google Scholar] [CrossRef]
- Meehl, G.A.; Stocker, T.F.; Collins, W.D.; Friedlingstein, P.I.E.R.R.E.; Gaye, A.T.; Gregory, J.M.; Kitoh, A.K.I.O.; Knutti, R.E.T.O.; Murphy, J.M.; Noda, A.K.I.R.A.; et al. Global climate projections. Climate change 2007: The physical science basis. In Contribution of Working Group I to the Fourth Assessment Report of the Intergovernmental Panel on Climate Change; Cambridge University Press: Cambridge, UK, 2007; pp. 747–845. [Google Scholar]
- Touma, D.; Ashfaq, M.; Nayak, M.A.; Kao, S.C.; Diffenbaugh, N.S. A multi-model and multi-index evaluation of drought characteristics in the 21st century. J. Hydrol. 2015, 526, 196–207. [Google Scholar] [CrossRef] [Green Version]
- Marengo, J.A.; Torres, R.R.; Alves, L.M. Drought in Northeast Brazil—Past, present, and future. Theor. Appl. Climatol. 2017, 129, 1189–1200. [Google Scholar] [CrossRef]
- Kunkel, K.E.; Liang, X.Z.; Zhu, J.; Lin, Y. Can CGCMs simulate the twentieth-century “warming hole” in the central United States? J. Clim. 2006, 19, 4137–4153. [Google Scholar] [CrossRef]
- Pathak, R.; Sahany, S.; Mishra, S.K.; Dash, S.K. Precipitation Biases in CMIP5 Models over the South Asian Region. Sci. Rep. 2019, 9, 9589. [Google Scholar] [CrossRef]
- Solomon, S.; Manning, M.; Marquis, M.; Qin, D. Climate Change 2007-the Physical Science Basis: Working Group I Contribution to the Fourth Assessment Report of the IPCC; Cambridge University Press: Cambridge, UK, 2007; p. 4. [Google Scholar]
- Wood, A.W.; Leung, L.R.; Sridhar, V.; Lettenmaier, D.P. Hydrologic implications of dynamical and statistical approaches to downscaling climate model outputs. Clim. Chang. 2004, 62, 189–216. [Google Scholar] [CrossRef]
- Fowler, H.J.; Kilsby, C.G. Using regional climate model data to simulate historical and future river flows in northwest England. Clim. Chang. 2007, 80, 337–367. [Google Scholar] [CrossRef]
- Hay, L.E.; Wilby, R.L.; Leavesley, G.H. A comparison of delta change and downscaled GCM scenarios for three mountainous basins in the United States 1. JAWRA 2000, 36, 387–397. [Google Scholar] [CrossRef]
- Nath, R.; Nath, D.; Li, Q.; Chen, W.; Cui, X. Impact of drought on agriculture in the Indo-Gangetic Plain, India. Adv. Atmos. Sci. 2017, 34, 335–346. [Google Scholar] [CrossRef]
- Sharma, S.; Mujumdar, P. Increasing frequency and spatial extent of concurrent meteorological droughts and heatwaves in India. Sci. Rep. 2017, 7, 1–9. [Google Scholar] [CrossRef] [PubMed] [Green Version]
- Zhang, X.; Obringer, R.; Wei, C.; Chen, N.; Niyogi, D. Droughts in India from 1981 to 2013 and Implications to Wheat Production. Sci. Rep. 2017, 7, 44552. [Google Scholar] [CrossRef] [Green Version]
- AghaKouchak, A.; Feldman, D.; Hoerling, M.; Huxman, T.; Lund, J. Water and climate: Recognize anthropogenic drought. Nature 2015, 524, 409–411. [Google Scholar] [CrossRef] [Green Version]
- Zhao, M.; Running, S.W. Drought-induced reduction in global terrestrial net primary production from 2000 through 2009. Science 2010, 329, 940–943. [Google Scholar] [CrossRef] [Green Version]
- Arya, A.S.; Dhinwa, P.S.; Pathan, S.K.; Raj, K.G. Desertification/land degradation status mapping of India. Curr. Sci. 2009, 97, 1478–1483. [Google Scholar]
- Bhalme, H.N.; Mooley, D.A. Large-scale droughts/floods and monsoon circulation. Mon. Weather Rev. 1980, 108, 1197–1211. [Google Scholar] [CrossRef] [Green Version]
- De, U.S.; Dube, R.K.; Rao, G.P. Extreme weather events over India in the last 100 years. J. Ind. Geophys. Union 2005, 9, 173–187. [Google Scholar]
- Khanal, A.R.; Mishra, A.K. Enhancing food security: Food crop portfolio choice in response to climatic risk in India. Glob. Food Secur. 2017, 12, 22–30. [Google Scholar] [CrossRef]
- Lau, W.K.; Waliser, D.E. Intraseasonal Variability in the Atmosphere-Ocean Climate System; Springer Science & Business Media: Berlin/Heidelberg, Germany, 2011. [Google Scholar] [CrossRef]
- Kitoh, A.; Endo, H.; Krishna Kumar, K.; Cavalcanti, I.F.; Goswami, P.; Zhou, T. Monsoons in a changing world: A regional perspective in a global context. J. Geophys. Res. Solid Earth Atmos. 2013, 118, 3053–3065. [Google Scholar] [CrossRef] [Green Version]
- Birkenholtz, T. Knowing climate change: Local social institutions and adaptation in Indian groundwater irrigation. Prof. Geogr. 2014, 66, 354–362. [Google Scholar] [CrossRef]
- Sharmila, S.; Joseph, S.; Sahai, A.K.; Abhilash, S.; Chattopadhyay, R. Future projection of Indian summer monsoon variability under climate change scenario: An assessment from CMIP5 climate models. Glob. Planet. Chang. 2015, 124, 62–78. [Google Scholar] [CrossRef] [Green Version]
- Sarthi, P.P.; Ghosh, S.; Kumar, P. Possible future projection of Indian Summer Monsoon Rainfall (ISMR) with the evaluation of model performance in Coupled Model Inter-comparison Project Phase 5 (CMIP5). Glob. Planet. Chang. 2015, 129, 92–106. [Google Scholar] [CrossRef]
- Stocker, T.F.; Dahe, Q.; Plattner, G.K.; Alexander, L.V.; Allen, S.K.; Bindoff, N.L.; Xie, S.P. Technical summary. Climate Change 2013: The Physical Science Basis. In Contribution of Working Group I to the Fifth Assessment Report of the Intergovernmental Panel on Climate Change; Cambridge University Press: Cambridge, UK, 2013; pp. 33–115. [Google Scholar] [CrossRef]
- TERI (The Energy Research Institute). Assessing Climate Change Vulnerability and Adaptation Strategies for Maharashtra: Maharashtra State Adaptation Action Plan on Climate Change (MSAAPC); The Energy and Resources Institute: New Delhi, India, 2014. [Google Scholar]
- Mishra, V.; Shah, R.; Thrasher, B. Soil moisture droughts under the retrospective and projected climate in India. J. Hydrometeorol. 2014, 15, 2267–2292. [Google Scholar] [CrossRef]
- Mallya, G.; Mishra, V.; Niyogi, D.; Tripathi, S.; Govindaraju, R.S. Trends and variability of droughts over the Indian monsoon region. Weather Clim. Extrem. 2016, 12, 43–68. [Google Scholar] [CrossRef] [Green Version]
- Thomas, J.; Prasannakumar, V. Temporal analysis of rainfall (1871–2012) and drought characteristics over a tropical monsoon-dominated State (Kerala) of India. J. Hydrol. 2016, 534, 266–280. [Google Scholar] [CrossRef]
- Naresh Kumar, M.; Murthy, C.S.; Sesha Sai, M.V.; Roy, P.S. Spatiotemporal analysis of meteorological drought variability in the Indian region using standardized precipitation index. Meteorol. Appl. 2012, 19, 256–264. [Google Scholar] [CrossRef] [Green Version]
- Ojha, R.; Nagesh Kumar, D.; Sharma, A.; Mehrotra, R. Assessing severe drought and wet events over India in a future climate using a nested bias-correction approach. J. Hydrol. Eng. 2013, 18, 760–772. [Google Scholar] [CrossRef] [Green Version]
- Liu, B.; Asseng, S.; Müller, C.; Ewert, F.; Elliott, J.; Lobell, D.B.; Martre, P.; Ruane, A.C.; Wallach, D.; Jones, J.W.; et al. Similar estimates of temperature impacts on global wheat yield by three independent methods. Nat. Clim. 2016, 6, 1130–1136. [Google Scholar] [CrossRef]
- Vicente-Serrano, S.M.; Beguería, S.; López-Moreno, J.I. A multiscalar drought index sensitive to global warming: The standardized precipitation evapotranspiration index. J. Clim. 2010, 23, 1696–1718. [Google Scholar] [CrossRef] [Green Version]
- Li, H.; Sheffield, J.; Wood, E.F. Bias correction of monthly precipitation and temperature fields from Intergovernmental Panel on Climate Change AR4 models using equidistant quantile matching. J. Geophys. Res. 2010, 115, D10101. [Google Scholar] [CrossRef]
- O’Neill, B.C.; Tebaldi, C.; van Vuuren, D.P.; Eyring, V.; Friedlingstein, P.; Hurtt, G.; Knutti, R.; Kriegler, E.; Lamarque, J.-F.; Lowe, J.; et al. The Scenario Model Intercomparison Project (ScenarioMIP) for CMIP6. Geosci. Model Dev. 2016, 9, 3461–3482. [Google Scholar] [CrossRef] [Green Version]
- Leander, R.; Buishand, T.A. Resampling of regional climate model output for the simulation of extreme river flows. J. Hydrol. 2007, 332, 487–496. [Google Scholar] [CrossRef]
- Panofsky, H.A.; Brier, G.W. Some Applications of Statistics to Meteorology; Pennsylvania State University, University Park: State College, PA, USA, 1968; p. 224. [Google Scholar]
- Herrera, D.; Ault, T. Insights from a new high-resolution drought atlas for the Caribbean spanning 1950–2016. J. Clim. 2017, 30, 7801–7825. [Google Scholar] [CrossRef]
- van der Schrier, G.; Jones, P.D.; Briffa, K.R. The sensitivity of the PDSI to the Thornthwaite and Penman-Monteith parameterizations for potential evapotranspiration. J. Geophys. Res. 2011, 116, D03106. [Google Scholar] [CrossRef]
- Lockwood, J.G. Is potential evapotranspiration and its relationship with actual evapotranspiration sensitive to elevated atmospheric CO2 levels? Clim. Chang. 1999, 41, 193–212. [Google Scholar] [CrossRef]
- Allen, R.G.; Smith, M.; Perrier, A.; Pereira, L.S. An update for the definition of reference evapotranspiration. ICID Bull. 1994, 43, 1–34. [Google Scholar] [CrossRef]
- Allen, R.G. An update for the calculation of reference evapotranspiration. ICID Bull. 1994, 43, 35–92. [Google Scholar]
- Allen, R.G.; Pereira, L.S.; Raes, D.; Smith, M. Crop Evapotranspiration-Guidelines for Computing Crop Water Requirement; FAO Irrigation and drainage paper 56; FAO: Rome, Italy, 1998; Voluem 300, p. D05109. [Google Scholar]
- Alley, W.M. The Palmer drought severity index: Limitations and assumptions. J. Appl. Meteorol. Climatol. 1984, 23, 1100–1109. [Google Scholar] [CrossRef] [Green Version]
- Wells, N.; Goddard, S.; Hayes, M.J. A self-calibrating Palmer drought severity index. J. Clim. 2004, 17, 2335–2351. [Google Scholar] [CrossRef]
- Bhuiyan, C.; Singh, R.P.; Kogan, F.N. Monitoring drought dynamics in the Aravalli region (India) using different indices based on ground and remote sensing data. Int. J Appl. Earth Obs. 2006, 8, 289–302. [Google Scholar] [CrossRef]
- Thomas, T.; Nayak, P.C.; Ghosh, N.C. Spatiotemporal analysis of drought characteristics in the bundelkhand region of central india using the standardized precipitation index. J. Hydrol. Eng. 2015, 20, 05015004. [Google Scholar] [CrossRef]
- Mishra, A.K.; Desai, V.R. Spatial and temporal drought analysis in the Kansabati river basin, India. Int. J. River Basin Manag. 2005, 3, 31–41. [Google Scholar] [CrossRef]
- Weigel, A.P.; Liniger, M.A.; Appenzeller, C. Can multi-model combination really enhance the prediction skill of probabilistic ensemble forecasts? J. Atmos. Sci. 2008, 134, 241–260. [Google Scholar] [CrossRef]
- Pierce, D.W.; Barnett, T.P.; Santer, B.D.; Gleckler, P.J. Selecting global climate models for regional climate change studies. Proc. Natl. Acad. Sci. USA 2009, 106, 8441–8446. [Google Scholar] [CrossRef] [Green Version]
- Warner, T.T. Numerical Weather and Climate Prediction; Cambridge University Press: Cambridge, UK, 2010. [Google Scholar]
- Gupta, V.; Kumar Jain, M.; Singh, V.P. Multivariate modeling of projected drought frequency and hazard over India. J. Hydrol. Eng. 2020, 25, 04020003. [Google Scholar] [CrossRef]
- Bisht, D.S.; Sridhar, V.; Mishra, A.; Chatterjee, C.; Raghuwanshi, N.S. Drought characterization over India under projected climate scenario. Int. J. Climatol. 2019, 39, 1889–1911. [Google Scholar] [CrossRef] [Green Version]
- Bollasina, M.A.; Ming, Y.; Ramaswamy, V. Anthropogenic aerosols and the weakening of the South Asian summer monsoon. Science 2011, 334, 502–505. [Google Scholar] [CrossRef] [PubMed] [Green Version]
- Mishra, V.; Somalik, B.V.; Lettenmaier, D.P.; Wallace, J.M. A prominent pattern of year-to-year variability in Indian summer monsoon rainfall. Proc. Natl. Acad. Sci. USA 2012, 109, 7213–7217. [Google Scholar] [CrossRef] [PubMed] [Green Version]
- Gupta, V.; Jain, M.K. Investigation of multi-model spatiotemporal mesoscale drought projections over India under climate change scenario. J. Hydrol. 2018, 567, 489–509. [Google Scholar] [CrossRef]
- Salvi, K.; Ghosh, S. High-resolution multisite daily rainfall projections in India with statistical downscaling for climate change impacts assessment. J. Geophys. Res. 2013, 118, 3557–3578. [Google Scholar] [CrossRef]
- Ministry of Agriculture and Farmers’ Welfare. State of Indian Agriculture 2015–16; Ministry of Agriculture and Farmers’ Welfare: New Delhi, India, 2016.
- United Nations. World Population Prospects 2019. Volume I: Comprehensive Tables; United Nations: New York, NY, USA, 2019. [Google Scholar]


| Model | Modeling Institution | Spatial Resolution (km) |
|---|---|---|
| BCC-ESM1 | Beijing Climate Center Earth System Model | 250 × 250 |
| CanESM5 | Canadian Centre for Climate Modelling and Analysis | 500 × 500 |
| CNRM-CM6-1 | National Centre for Meteorological Research | 250 × 250 |
| CNRM-ESM2-1 | Centre National de Recherches Meteorologiques | 250 × 250 |
| GISS-E2-1-G | Goddard Institute for Space Studies | 250 × 250 |
| GISS-E2-1-H | Goddard Institute for Space Studies | 250 × 250 |
| MIROC6 | Model for Interdisciplinary Research on Climate | 500 × 500 |
© 2020 by the authors. Licensee MDPI, Basel, Switzerland. This article is an open access article distributed under the terms and conditions of the Creative Commons Attribution (CC BY) license (http://creativecommons.org/licenses/by/4.0/).
Share and Cite
Shrestha, A.; Rahaman, M.M.; Kalra, A.; Jogineedi, R.; Maheshwari, P. Climatological Drought Forecasting Using Bias Corrected CMIP6 Climate Data: A Case Study for India. Forecasting 2020, 2, 59-84. https://0-doi-org.brum.beds.ac.uk/10.3390/forecast2020004
Shrestha A, Rahaman MM, Kalra A, Jogineedi R, Maheshwari P. Climatological Drought Forecasting Using Bias Corrected CMIP6 Climate Data: A Case Study for India. Forecasting. 2020; 2(2):59-84. https://0-doi-org.brum.beds.ac.uk/10.3390/forecast2020004
Chicago/Turabian StyleShrestha, Alen, Md Mafuzur Rahaman, Ajay Kalra, Rohit Jogineedi, and Pankaj Maheshwari. 2020. "Climatological Drought Forecasting Using Bias Corrected CMIP6 Climate Data: A Case Study for India" Forecasting 2, no. 2: 59-84. https://0-doi-org.brum.beds.ac.uk/10.3390/forecast2020004