Article

Effect of Grain Size on Microscopic Pore Structure and Fractal Characteristics of Carbonate-Based Sand and Silicate-Based Sand

1
Department of Civil Engineering, Zhejiang University City College, Hangzhou 310015, China
2
Research Center of Coastal and Urban Geotechnical Engineering, Zhejiang University, Hangzhou 310058, China
*
Author to whom correspondence should be addressed.
Submission received: 3 September 2021 / Revised: 27 September 2021 / Accepted: 1 October 2021 / Published: 4 October 2021
(This article belongs to the Special Issue Fractal and Fractional in Geomaterials)

Abstract

:
In this study, a series of nuclear magnetic resonance (NMR) tests was conducted on calcareous sand, quartz sand, and glass bead with a wide range of grain sizes, to understand the effect of grain size on the micro-pore structure and fractal characteristics of the carbonate-based sand and silicate-based sand. The pore size distribution (PSD) of the tested materials were obtained from the NMR T2 spectra, and fractal theory was introduced to describe the fractal properties of PSD. Results demonstrate that grain size has a significant effect on the PSD of carbonate-based sand and silicate-based sand. As grain size increases, the PSD of sands evolves from a binary structure with two peaks to a ternary structure with three peaks. The increase in the grain size can cause a remarkable increase in the maximum pore size. It is also found that the more irregular the particle shape, the better the continuity between the large and medium pores. In addition, grain size has a considerable effect on the fractal dimension of the micro-pore structure. The increase of grain size can lead to a significant increase in the heterogeneity and fractal dimension in PSD for calcareous sand, quartz sand and glass bead.

1. Introduction

Carbonate-based sands (i.e., sands with the main component of calcium carbonate) and silicate-based sands (i.e., sands with the main component of quartz) exist extensively in nature, and they have long been used as the two most important granular geomaterials in the construction of geotechnical engineering. Specifically, siliceous-based sand is mainly distributed on the continent [1], which is applied to terrigenous geotechnical projects, such as roads, foundation pits, slopes, tunnels, etc. Calcareous-based sand, formed by the geological deposition of marine biological debris, is widely distributed onshore and offshore. It is commonly used in land reclamation projects. For example, it has been adopted as the filling material for the foundations of wharves, roads, and airport runways and in island reefs. Carbonate-based sand has more complex mechanical properties than silicate-based sand because its particle shape is more irregular [2,3,4,5,6,7,8,9,10,11,12,13,14,15]. The microstructure of soils, especially the pore-size distribution (i.e., PSD), has been extensively acknowledged to be related to mechanical properties, such as shear strength, compressibility, and water-retention ability [16,17,18,19,20,21,22]. Therefore, it is essential to investigate the micropore structure of carbonate-based sand and silicate sand for a better understanding of their macroscopic mechanical behaviors.
In the last decade, numerous efforts have been devoted to revealing the pore size distribution of soils, mainly based on several experimental measurement techniques, such as scanning electron microscope (SEM), mercury intrusion porosimetry (MIP), transmission electron microscopy (TEM), X-ray micro-tomography (XR-uCT), and nuclear magnetic resonance (NMR) [10,11,16,23,24,25,26,27]. The previous studies demonstrated that the microscopic pore structure of soils was highly complicated, highlighting the necessity of additional experimental research in this field. Moreover, previous works have provided sufficient evidence that the pore structures of porous media are born with fractal characteristics and could be studied by fractal theory [17,28,29,30,31,32]. Through a series of SEM and NMR tests, Shao et al. [33] observed a rather irregular pore size distribution in tight sandstone which consists of quartz and clay minerals. They found that the pore network of tight sandstones could be recognized as a dual-scale pore system based on fractal theory, and the fractal dimensions could reflect the physical properties. Sun et al. [34] carried out NMR tests on the Lower Cambrian Niutitang formation shale in northern Guizhou, China, and they investigated the relationships between fractal dimensions of micro-pore structure and mineral compositions. Li et al. [35] conducted NMR tests on the organic-rich marine shales of the Lower Cambrian Niutitang Formation in northern Guizhou, China, to explore the pore structures and fractal characteristics. It was found that shale samples with a larger surface fractal dimension have a higher methane adsorption capacity. Although some experimental investigations have been performed on sandstone and shale to investigate the micro-pore structure, few attempts have been made to quantify the microscopic pore structure and fractal characteristics of granular material, such as calcareous sand and siliceous sand. Another challenging problem is that the sands in the field are always heterogeneous with different grain sizes rather than with a single grain size. However, the effect of the grain size on the microstructure of granular material is still poorly understood. Consequently, further investigations are needed to eliminate the gap surrounding the effect of grain size on the microscopic pore structure and fractal characteristics of carbonate-based sand and silicate-based sand.
In this work, a series of nuclear magnetic resonance (NMR) tests was conducted on calcareous sand, quartz sand, and glass bead with a wide range of grain sizes. The effect of grain size on the micropore structure and fractal characteristics of the carbonate-based sand and silicate-based sand was analyzed in detail. Fractal theory was then introduced to describe the fractal properties of PSD, where the fractal dimension was obtained. The relationship between the fractal dimension and grain size was deeply discussed. The present findings might help to achieve a better interpretation and prediction of the macroscopic behavior of sands with different grain sizes from a microscopic structure view.

2. Materials and Methods
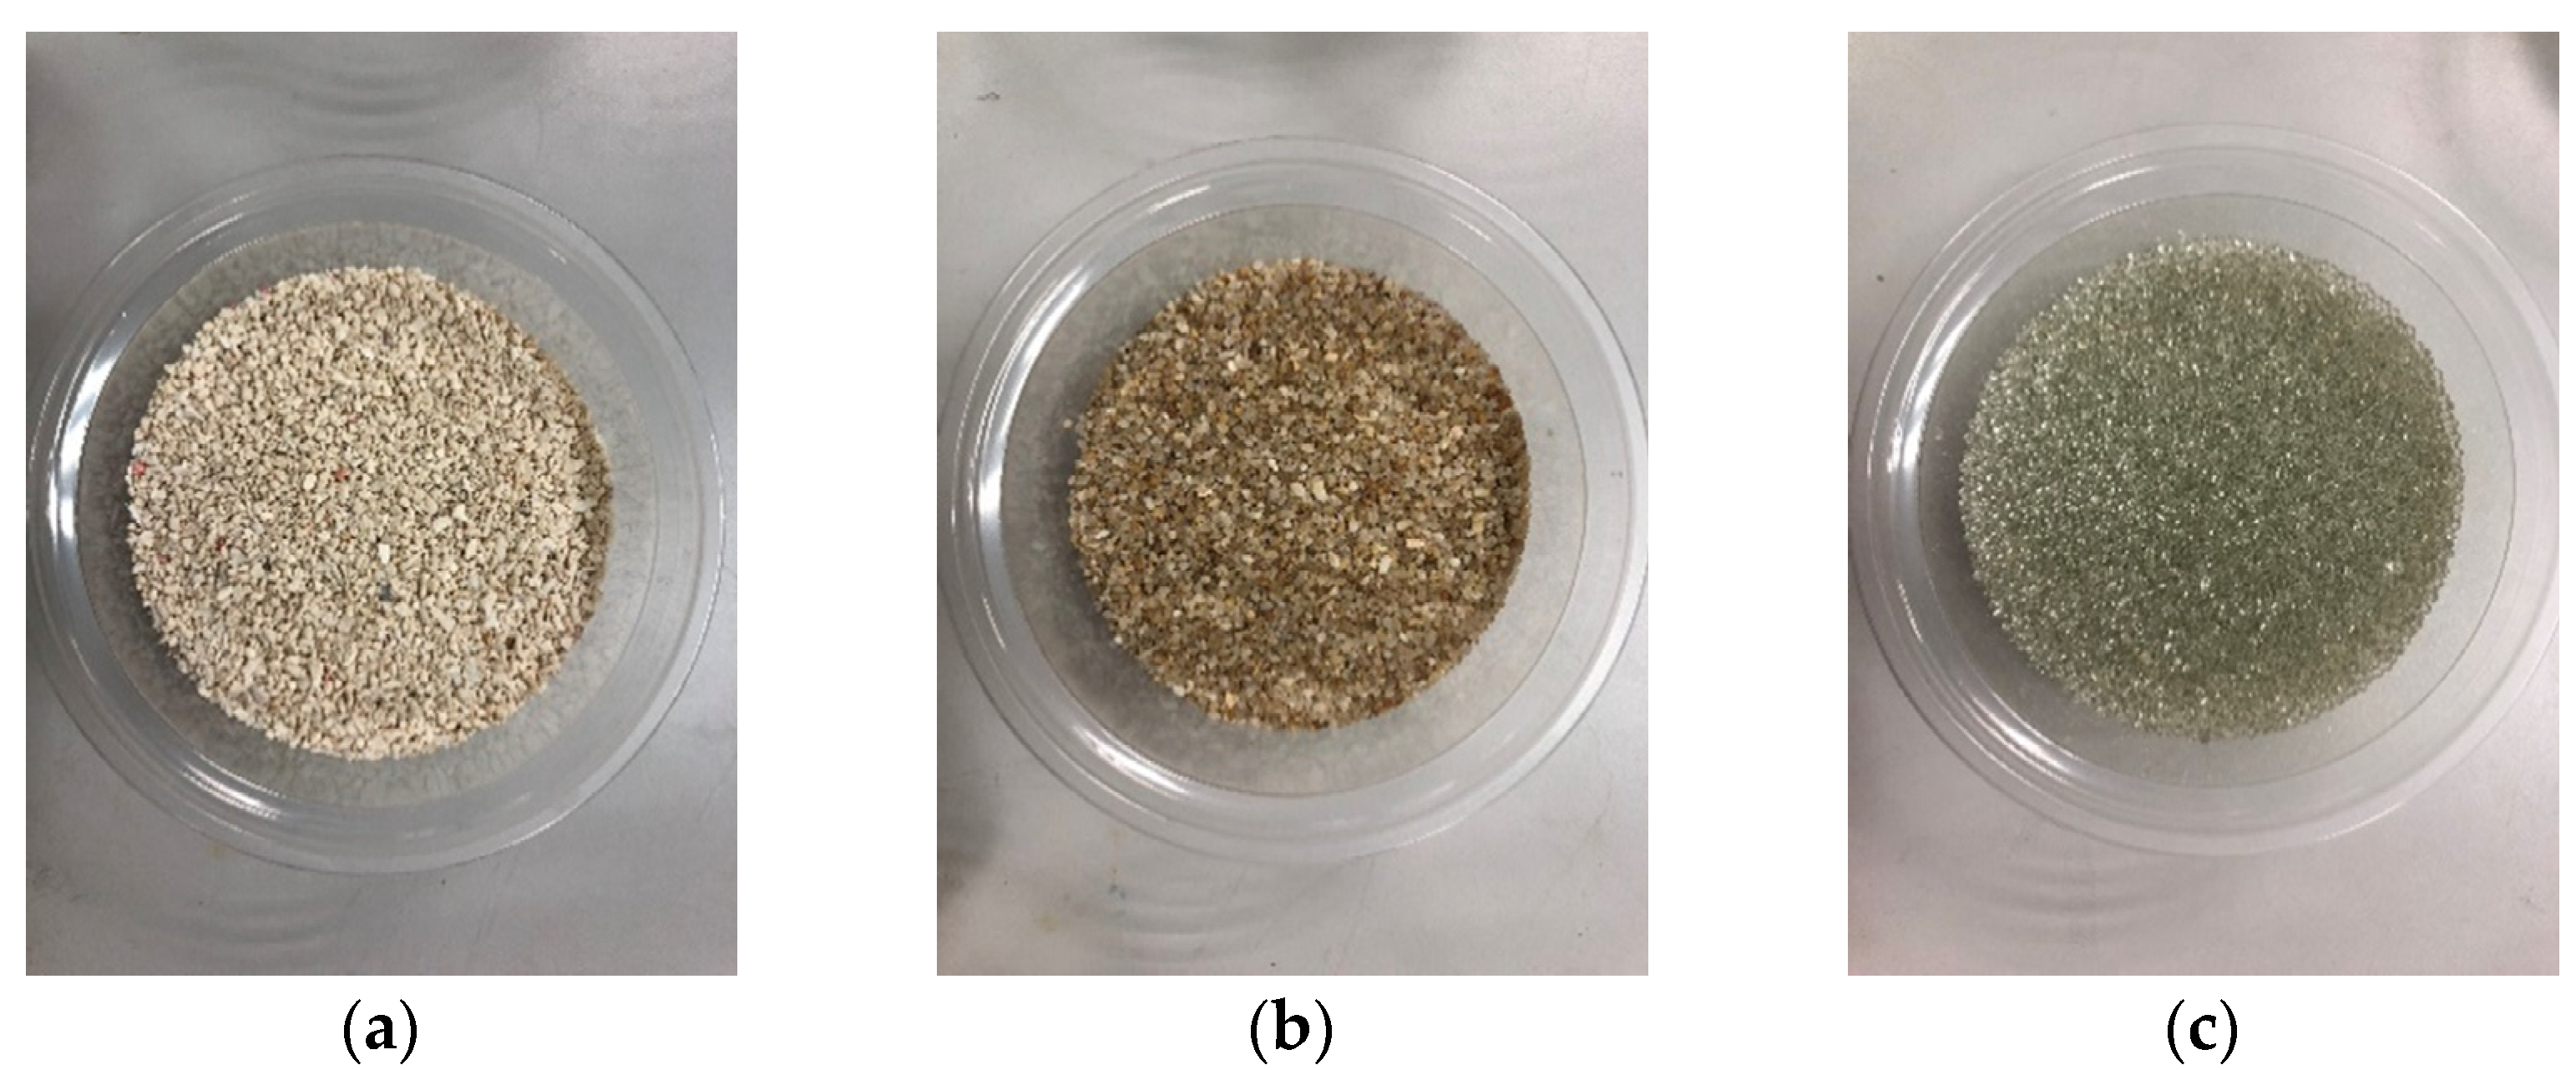
2.1. Materials

The carbonate-based sand used in this study was the natural calcareous sand from the South China Sea (as shown in Figure 1a). The South China Sea has a typical dual-structure coral reef stratum due to its complex seabed landform type. The upper layer of coral islands and reefs in the South China Sea is carbonate-based sand, and the lower layer is reef limestone. The carbonate-based sand adopted in this study was obtained from the upper layer of the coral island reef in the South China Sea, which is a good construction filler material widely used in marine reclamation projects. Through additional X-ray diffraction tests already conducted on this carbonated-based sand [2], it was found that this sand is mainly composed of aragonite and calcite, and the calcium carbonate (CaCO3) content of this sand is about 92%. The silicate sands adopted in this study were quartz sand (see Figure 1b) and glass bead (see Figure 1c) used for comparison experiments. The standard quartz sand was obtained from Fujian, China. It is extensively distributed in various strata in Fujian, China, and it is the most common geotechnical material in the local area. Through further X-ray diffraction tests, this sand was found to have a high silicon dioxide (SiO2) content of around 98%. The glass bead was a commercial glass bead with artificial round particles and the same particle size as sands. In the sampling process of this study, homogeneous calcareous sand and quartz sand were selected as much as possible in their respective identical locations. Moreover, additional sieving was performed before the NMR test to further ensure the uniformity of the experimental materials. Figure 2 shows the scanning electron microscope (SEM) images of calcareous sand and quartz sand. As can be seen, compared with quartz sand, the particles of calcareous sand have more corners, rougher surfaces and more irregular shapes.

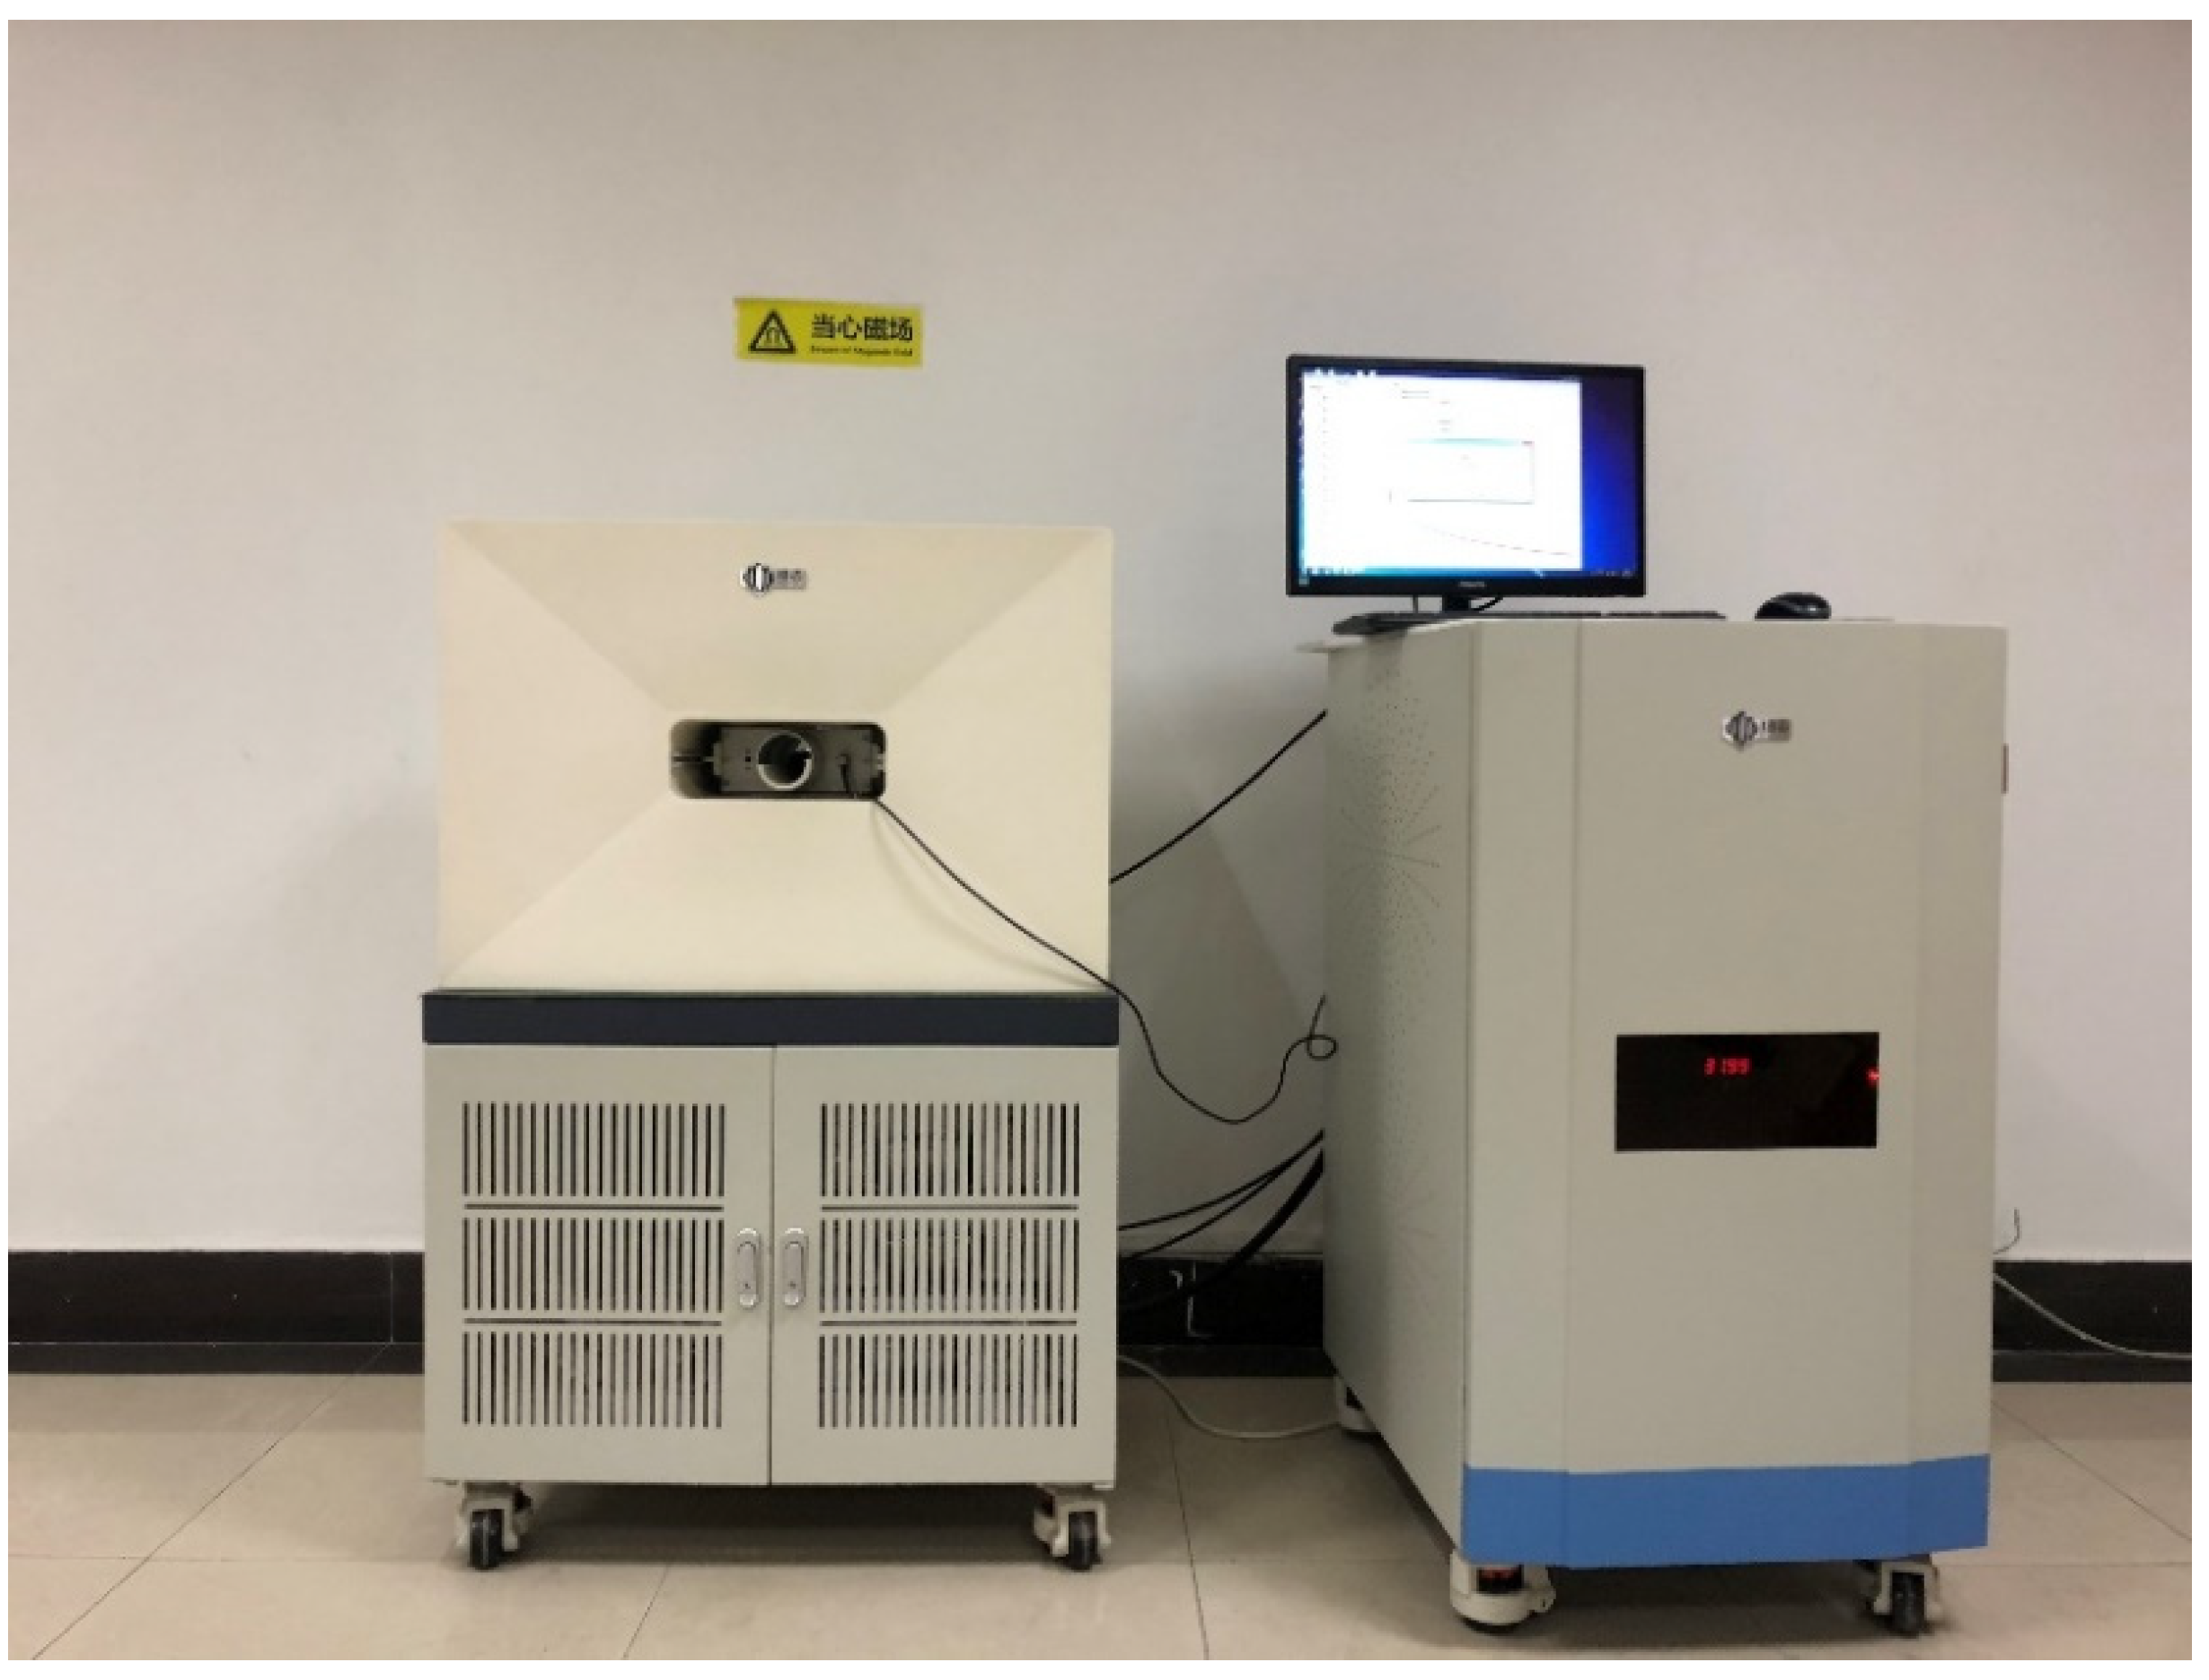
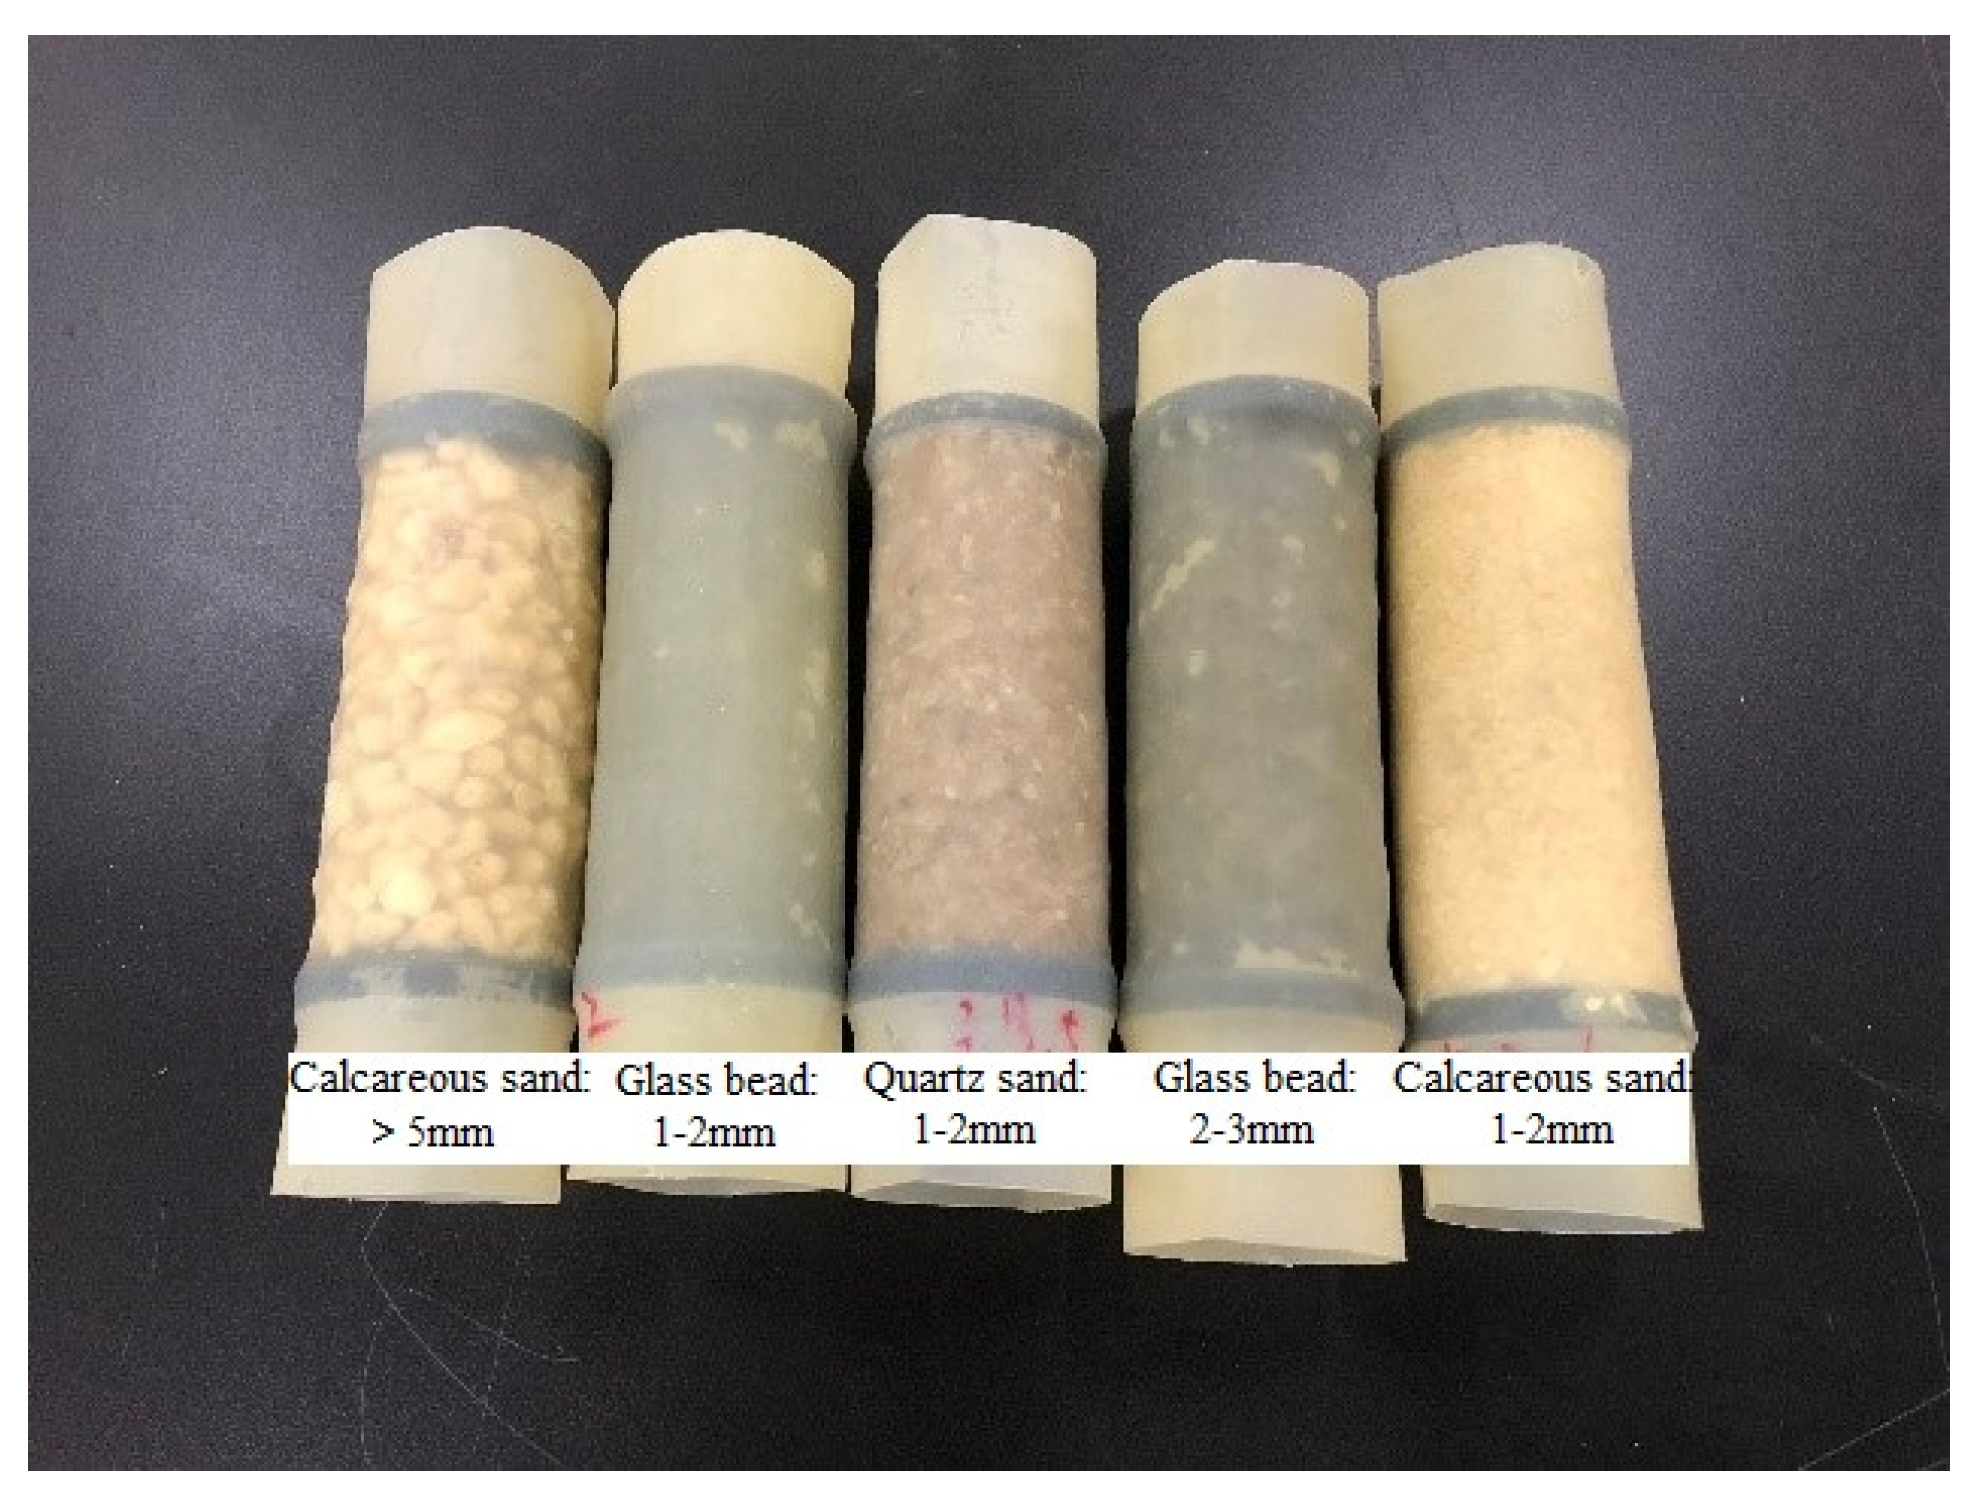
2.2. Test Equipment and Specimen Preparation

The NMR technique has been used to capture the pore size distribution of the adopted specimens. The NMR technique is fast, comprehensive, non-destructive and accurate, which makes it different than the other existing methods like MIT, SEM. Unlike MIT and SEM scanning, NMR can accurately detect the whole pore structures of the sand assembly based on the reliable theoretical relationship between relaxation time and pore size. The device used in this study is the low-field nuclear magnetic resonance device (MesoMR23-060H-I, Shanghai Niumag Corporation, Shanghai, China), as shown in Figure 3. The nuclear magnetic resonance device is composed of five major systems, namely the temperature control system, the magnet system, the spectrometer system, the radiofrequency system and the data acquisition system. The magnet system used 0.5T magnetic field strength, and the magnet temperature was controlled at 32 °C ± 0.01 °C.
The NMR specimens were prepared on a triaxial device. Standard cylindrical specimens with diameters of 50 mm and heights of 100 mm were employed in this study [36,37,38], as shown in Figure 4. The approach of air pluviation was adopted to prepare the specimen to prevent sand particles from breaking during specimen preparation [39]. The prepared specimens were then saturated by passing carbon dioxide and deaired water through the specimens. Subsequently, the specimen was saturated at a back pressure of 200 kPa. After the B-value was detected to be greater than 95%, the saturation operation was stopped. The saturated sample was removed from the triaxial device and then transferred to the sample tube of the NMR device under the protection of the mold. To investigate the effect of grain size on the microstructure and its fractal dimension, NMR tests were carried out on calcareous sand with six single grain sizes (i.e., 0.1–0.25 mm, 0.5–0.71 mm, 0.71–1 mm, 1–2 mm, 2–3 mm, and >5 mm), quartz sands with three single grain sizes (0.1–0.25 mm, 0.5–0.71 mm, and 1–2 mm), and glass beads with four single grain sizes (i.e., 0.5–0.71 mm, 0.71–1.0 mm, 1–2 mm, and 2–3 mm) for comparison. The detailed test program is summarized in Table 1.

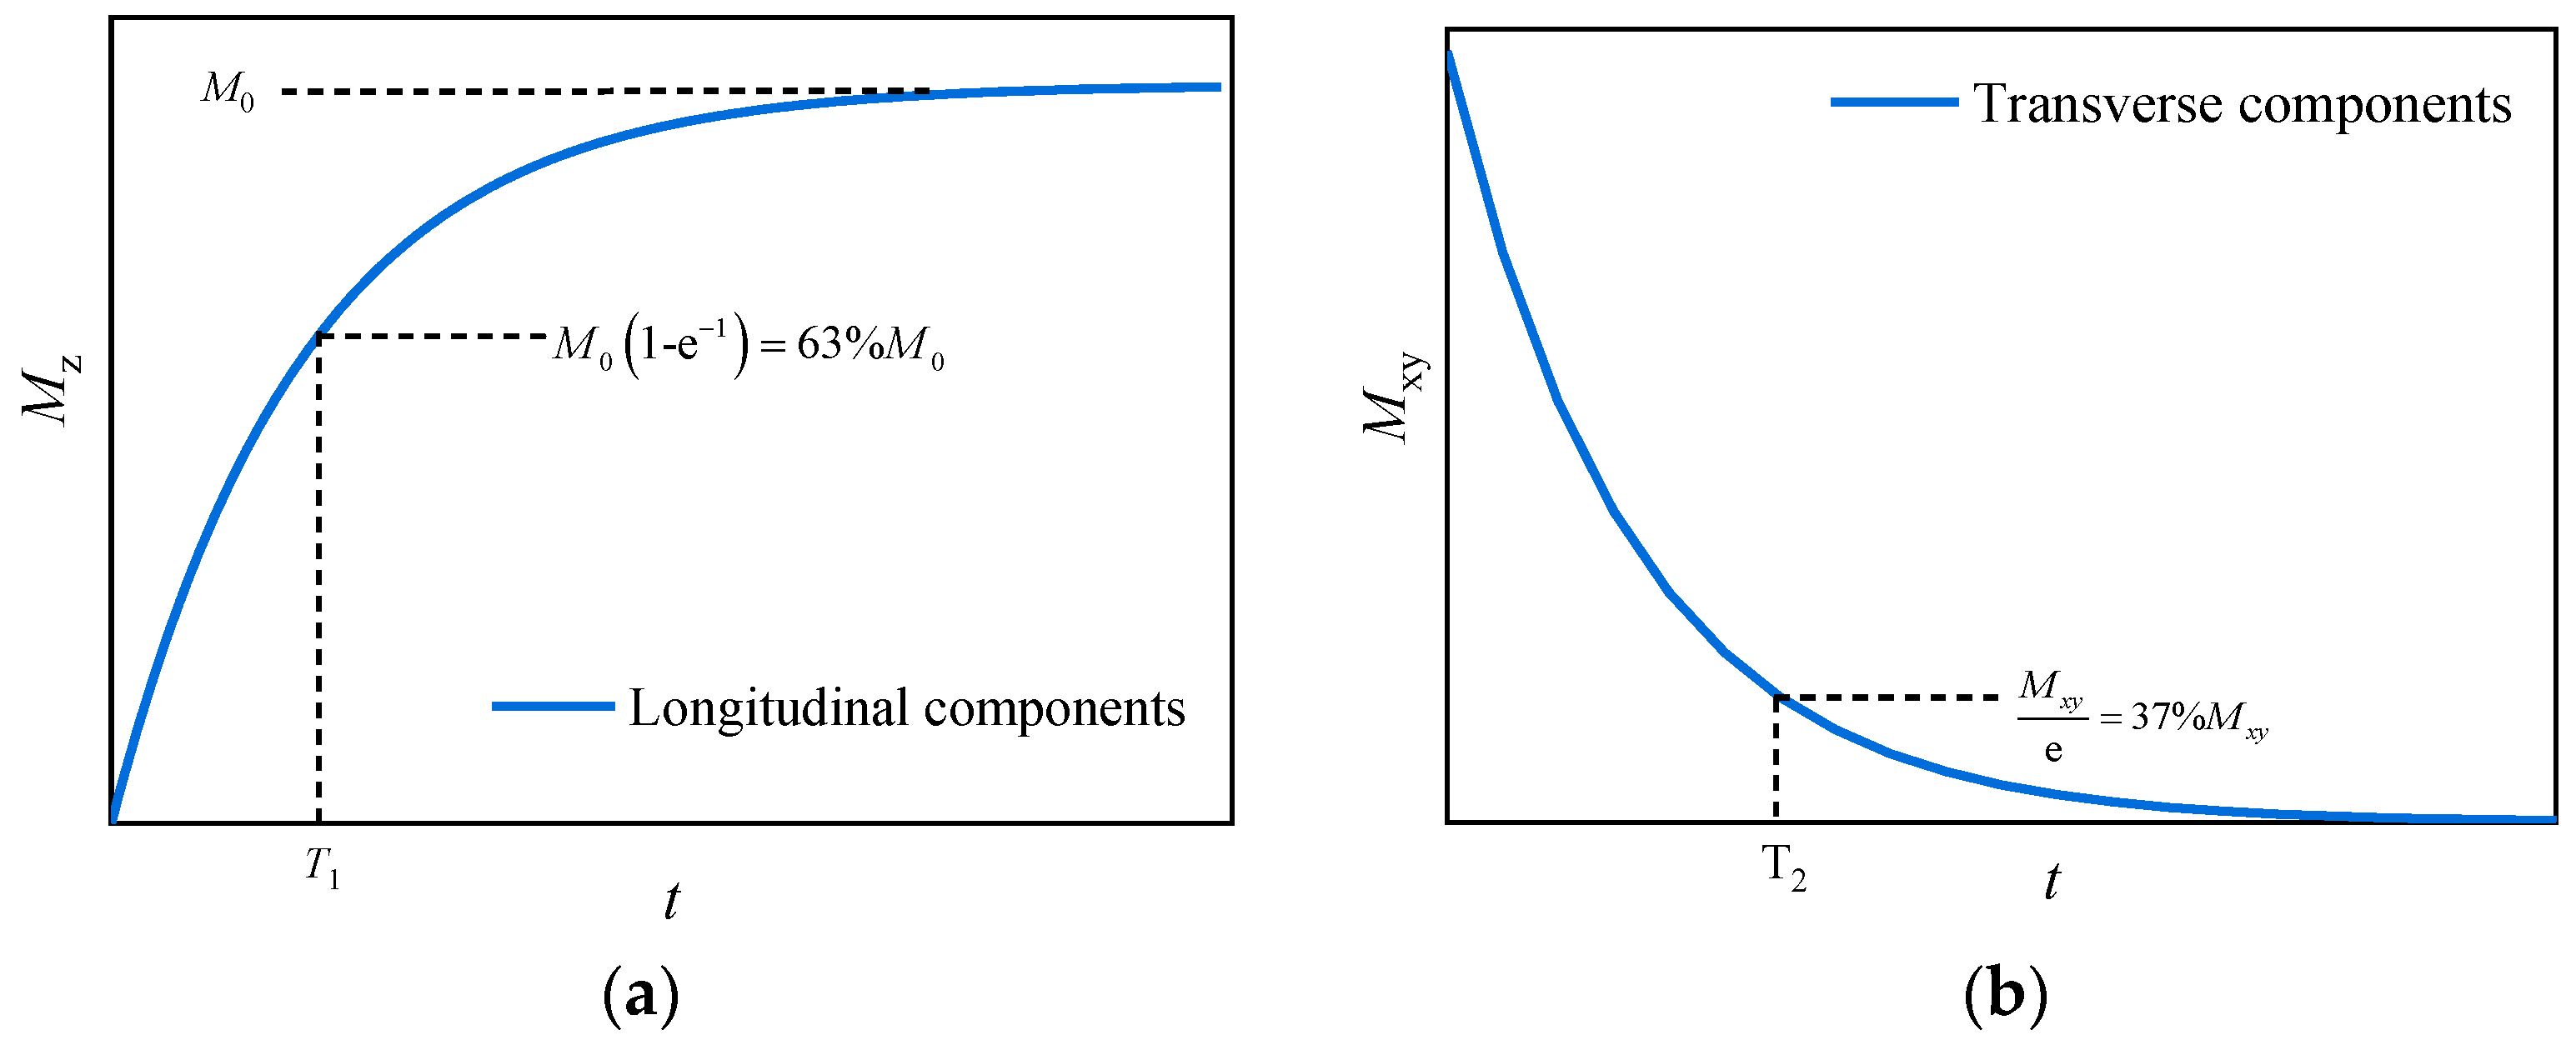
2.3. Calculation Method for Determining Pore Size Distribution Using NMR

After the main magnetic field (B0) is applied to the nuclei, the spin direction of some nuclei will become the same as the applied magnetic field, while most of the other spin directions are still chaotic. When the applied magnetic field is removed, the non-equilibrium protons at a high energy level will return to the equilibrium state of a low energy level. This process of returning the protons from a high energy level to the equilibrium state is called relaxation. From a macro point of view, the maximum magnetization (M0) will tend to return to the initial state parallel to B0 (i.e., the smallest energy and the most stable state). Therefore, attenuation occurs in the xy plane and recovery occurs in the z-direction. The Bloch equation can be used to describe the relaxation phenomenon, as follows:
d M d t = M × γ B ( M z M 0 ) k T 1 M x i + M y j T 2
which can be transformed into:
d d t ( M x M y M z ) = γ ( i j k M x M y M z B x B y B z ) ( M z M 0 ) k T 1 M x i + M y j T 2
The solution of the equation with the specific B0 is given by:
d d t ( M x M y M z ) = γ ( i j k M x M y M z 0 0 B 0 ) ( M z M 0 ) k T 1 M x i + M y j T 2 = γ ( M z B 0 i M x B 0 j ) ( M z M 0 ) k T 1 M x i + M y j T 2 = ( 1 T 2 γ B 0 0 γ B 0 1 T 2 0 0 0 1 T 1 ) ( M x M y M z ) + ( 0 0 M 0 T 1 )
where M is the magnetization vector, B is the magnetic field vector, t is the time, γ is the rotation ratio, T1 is the longitudinal relaxation time, and T2 is the transverse relaxation time.
T1 relaxation is the process of energy exchange between hydrogen nuclei and the surrounding environment, that is, T1 relaxation (i.e., longitudinal relaxation) is spin-lattice relaxation; T2 relaxation (i.e., transverse relaxation) is the process of energy exchange between hydrogen nuclei and other atomic nuclei, that is, T2 relaxation is spin-spin relaxation. Figure 5 shows the longitudinal and transverse components of the relaxation process versus time. The equation of longitudinal relaxation is given by:
d M z d t = M z M 0 T 1
Then, the solution can be expressed as:
M z ( t ) = M 0 + ( M z ( 0 ) M 0 ) e t / T 1
The equation of transverse relaxation is given by:
d M x y d t = M x y T 2
Then, the solution can be given by:
M x y ( t ) = M x y ( 0 ) e t / T 2
Because the completion time of T2 relaxation is much faster than T1 relaxation, T2 relaxation is commonly used to study the pore distribution characteristics of the sample in porous fluid media. According to the relaxation mechanism of low-field NMR, there are three different relaxation mechanisms for fluid in porous media. Therefore, the relaxation time of the pore fluid can be expressed as follows [40]:
1 T 2 = 1 T 2 B + 1 T 2 S + 1 T 2 D
where T2 is the transverse relaxation time of pore fluid collected by Carr-Purcell-Meiboom-Gill (CPMG) pulse sequence; T2B is the free transverse relaxation time of the liquid, which is determined by the physical properties of the liquid (such as viscosity and chemical composition); T2S is the transverse relaxation time caused by surface relaxation; T2D is the transverse relaxation time of pore fluid caused by diffusion under magnetic field gradient. For water in porous media, the influence of the first and third terms on the equation can be ignored, and the surface relaxation plays the main role as follows:
1 T 2 = 1 T 2 S = ρ 2 ( S V )
where ρ2 is the surface relaxation coefficient, which is a constant and is not affected by temperature and pressure; the method to determine the ρ2-value of the sand-gravel mixture is described in detail in Feng, Xu, Chai and Li [23]; S/V is the ratio between the pore surface area (S) to the pore volume (V), which is related to the pore shape. Tian et al. [40] represented that the pore shape in the soil can be approximated as a cylindrical tube shape. Therefore, Equation (9) can be written as such:
R = 2 ρ 2 T 2

2.4. Calculation Method of Fractal Dimension Using Fractal Theory

Fractal dimension reflects the validity of space occupied by complex shapes, and it is a measure of the irregularity of complex shapes. According to previous works, the pore structures of porous media show fractal characteristics and can be studied by fractal theory [41]. The different fractal dimensions (D) resulted in the mechanisms of pore generation. In recent years, fractal theory has been widely used in quantitatively describing and studying the geometric characteristics of the PSD. The fractal property for the pore size distribution is given by [42]:
N ( R > R a ) R D
where D is the fractal dimension; N (R > Ra) is the number of pores whose size R is greater than the specific measurement scale Ra. For most geomaterials, counting the number of pores of a given size is not feasible. Instead, it seems more appropriate to use mass to interpret the pore size distribution, which is a more readily measurable quantity. The definition of mass M (R > Ra) is suggested as [43]:
M ( R > R a ) = ρ P C m [ 1 ( R / λ m ) 3 D ]
where Cm and λm are constants related to pore shape and size, and ρP is the pore density under the assumed conditions. The total mass MT can be determined by setting R = 0 in Equation (12), as given by:
M T = ρ P C m
Substitution of Equation (13) into Equation (12) yields:
M ( R > R a ) / M T = 1 ( R / λ m ) 3 D
The constant λm is equal to the maximum pore size Rmax for the fractal behavior in the case of M (R > Ra)/MT = 0 with setting R = Rmax. For the fractal nature of soil pore size distribution, the fractal dimension D is strictly limited to the range of 0 < D < 3 [44].
On account of the fact M (R > Ra)/MT + M (R < Ra)/MT = 1, Equation (8) can be rearranged to display the pore size distribution in a finer percentage by weight, that is, M (R < Ra) by noting that:
M ( R < R a ) / M T = ( R / R max ) 3 D
According to the geometric fractal theory [41], the model of fractal dimension D in PSD corresponding to the pore size R obtained by NMR is as follows:
lg S v = ( 3 D ) log R + ( D 3 ) log R max
where Sv is the percentage of the pore volume. It is calculated by the pore size smaller than the specific pore diameter R to the total pore volume; D is the fractal dimension, and Rmax is the maximum pore size.

3. Results and Discussion

3.1. Effect of Grain Size on the Pore Size Distribution

Figure 6a shows the pore size distribution curve of calcareous sand with different grain sizes obtained from the T2 relaxation time. It can be observed that the grain size significantly affects the pore size distribution curve of calcareous sand. For specimens with a grain size of 0.1 mm–0.25 mm, the pore size distribution belongs to a binary type with two peaks. With the increase of the grain size, the binary pore size distribution gradually evolves into a ternary pore size distribution with three peaks. The pore diameter corresponding to the turning point where the two peaks evolve into three peaks is around 100 μm. From the pore size distribution curves of the calcareous sands with different grain sizes, it can be inferred that the pore size distribution curve of the specimen with a grain size less than 0.25 mm belongs to a binary type. However, for the specimen with grain size larger than 1 mm, the pore size distribution curve belongs to a ternary type. The pore size distribution curve of the specimen with grain size around 0.25 mm–1 mm is between the binary type and ternary type. In addition to the number of main peaks in the pore size distribution curve of calcareous sand, the grain size also significantly affects the range of the pore size distribution curve. As shown in Figure 6a, the larger the grain size, the larger the maximum pore size and the wider the pore size range.
Figure 6b shows the pore size distribution curves of quartz sands with different grain sizes. It can be seen that, similar to calcareous sand, for quartz sand specimens with a grain size of 0.1 mm–0.25 mm, the pore size distribution also belongs to a binary type with two peaks. As the grain size increases, the pore size distribution curve of quartz sand gradually evolves into a ternary type with three peaks. Figure 6c shows the pore size distribution curves of glass beads. The results show the pore size distribution curves of glass beads all have three peaks. Note that in the pore size range between 100 μm and 1000 μm, carbonate-based sand has a continuous pore size distribution, whereas the pore size distribution of silicate-based sand is discontinuous. This indicates that the more irregular the particle shape, the better the continuity between the large and medium pores. Moreover, for quartz sand and glass bead, as the particle size increases, the maximum pore size also increases significantly.
In order to better understand the relative change of the pore size distribution of the three tested sands with different grain sizes, the difference of the pore size distribution curve under different grain sizes is presented in Figure 7. Figure 7a is the difference between the pore size distribution of calcareous sand with different grain sizes and the pore size distribution of calcareous sand with a grain size of 0.1 mm–0.25 mm. Figure 7b is the difference between the pore size distribution of quartz sand with different grain sizes and the pore size distribution of quartz sand with a grain size of 0.1 mm–0.25 mm. Figure 7c is the difference between the pore size distribution of glass bead with different grain sizes and the pore size distribution of glass beads with a grain size of 0.5 mm–0.71 mm. It can be seen from Figure 7 that the pore size distribution of the three tested materials has a relatively consistent changing trend with the grain size. This indicates that the influence mechanism of grain size on the pore size distribution of the three materials is similar. Specifically, the increase in grain size increases the proportion of large pores with a size larger than 1000 μm, and correspondingly reduces the proportion of medium pores with a size between 100 μm–1000 μm. However, grain size has a minor effect on small pores with a size less than 100 um.

3.2. Effect of Grain Size on the Microsrcture’s Fractal Dimension

Liang et al. [44] reported that the lgSv-lgR curve of soil included two distinct parts and proposed that the PSD in soils showed multi-fractal characteristics. The lgSv-lgR curve of calcareous sand, quartz sand, and glass bead are shown in Figure 8, Figure 9 and Figure 10, respectively. There is an obvious inflection point around the pore diameter of 10 um in the lgSv-lgR curve, indicating that the pore size of about 10 μm is a limitation for the change of pore properties in the carbonate-based sand and silicate-based sand. The dominant pore structure content of carbonate-based sand and silicate-based sand is distributed in the large-size range (i.e., the pore structure with a size greater than 10 μm. Furthermore, the larger pore structure of sand assembly more tends to be a skeleton pore structure with strong contact and control of the mechanical behavior. Therefore, the fractal dimension (D) in a large-size range of pores is supposed to be the dominant parameter reflecting the principal characteristics of the PSD. Based on Equation (16), the fractal dimension of the macropore (i.e., on the right side of the turning point) was obtained through the regression analysis, as shown in Figure 8, Figure 9 and Figure 10. The fitting results of fractal dimensions demonstrate that the pore size distribution of calcareous sand, quartz sand, and glass bead all complies with the fractal law. In addition, the correlation coefficient (R2) of calcareous sand is between 0.95–0.99; the correlation coefficient of quartz sand is between 0.87–0.93 and the correlation coefficient of glass beads is between 0.87–0.94. This indicates that the fractal characteristics of calcareous sand of various particle sizes are more obvious than that of quartz sand and glass beads.
Figure 11 shows the relationship between the fractal dimension and the mean grain size (d50) of the three sands. It can be clearly observed that the fractal dimensions of calcareous sand and quartz sand all increase significantly with the increase of grain size. Compared with calcareous sand and quartz sand, the fractal dimension of glass beads increases more slowly with grain size. This may be due to the single shape (i.e., round shape) of glass beads. Previous studies pointed that the higher fractal dimension of pore size distribution means a more complex pore structure distribution and a stronger heterogeneity of the pore structure distribution [29]. The increase of grain size can lead to a significant increase of D for calcareous sand, quartz sand and glass bead. This indicates that the increase of grain size can cause a more complex pore structure distribution in the sand. Furthermore, under the same grain size, the fractal dimension of calcareous sand is the smallest, the fractal dimension of glass beads is the largest, and quartz sand is somewhere in between. In addition, the fractal dimension of calcareous sand increases more slowly with grain size than quartz sand. The larger the grain size, the greater the gap between the fractal dimensions of the two sands. This indicates that as the grain size increases, the difference in particle shape has a more obvious impact on the pore structure.
It is widely acknowledged that the determination of the fractal dimension plays an important role in predicting the physical and mechanical properties of geomaterials [45,46]. Huang et al. [45] quantified the fractal characteristics of the pore structure of shale and found a significant relationship between the fractal dimension and permeability. Kong et al. [47] established a fractal model of pore size distribution for porous geomaterials based on the fractal characteristics of pores, which could be used to study hydraulic properties. Based on the mercury intrusion test and image analysis, Dou et al. [46] analyzed the effect of different fractal models of pores on the evaluation of sandstone’s permeability and highlighted the role of the fractal dimension in determining the permeability. Therefore, accurate prediction of the fractal dimension is crucial for grasping and analyzing the engineering properties (e.g., permeability) of geomaterials. Considering this, a suitable correlation (see Figure 11) was proposed to capture the fractal dimensions of carbonate-based sand and silicate-based sand with different mean grain sizes, which is as follows:
D = α d 50 β
where α and β are model parameters, and through regression analysis, the best-fit α and β for carbonate-based sand and silicate-based are summarized in Table 2. The proposed correlation between D and d50 can be applied to the research of a permeability model, water-retention ability analysis, and other related aspects for granular geomaterials, which is useful for guiding the construction of geotechnical engineering.

4. Conclusions

Carbonate-based sand and silicate-based sand are widely used in the construction of geotechnical engineering. To investigate the effect of grain size on the micro-pore structure and fractal characteristics of carbonate-based sand and silicate-based sand, a series of NMR tests were conducted on calcareous sand, quartz sand, and glass bead. The effect of grain size on the pore size distribution and fractal dimension was discussed in detail. The following main conclusions were drawn:
(1)
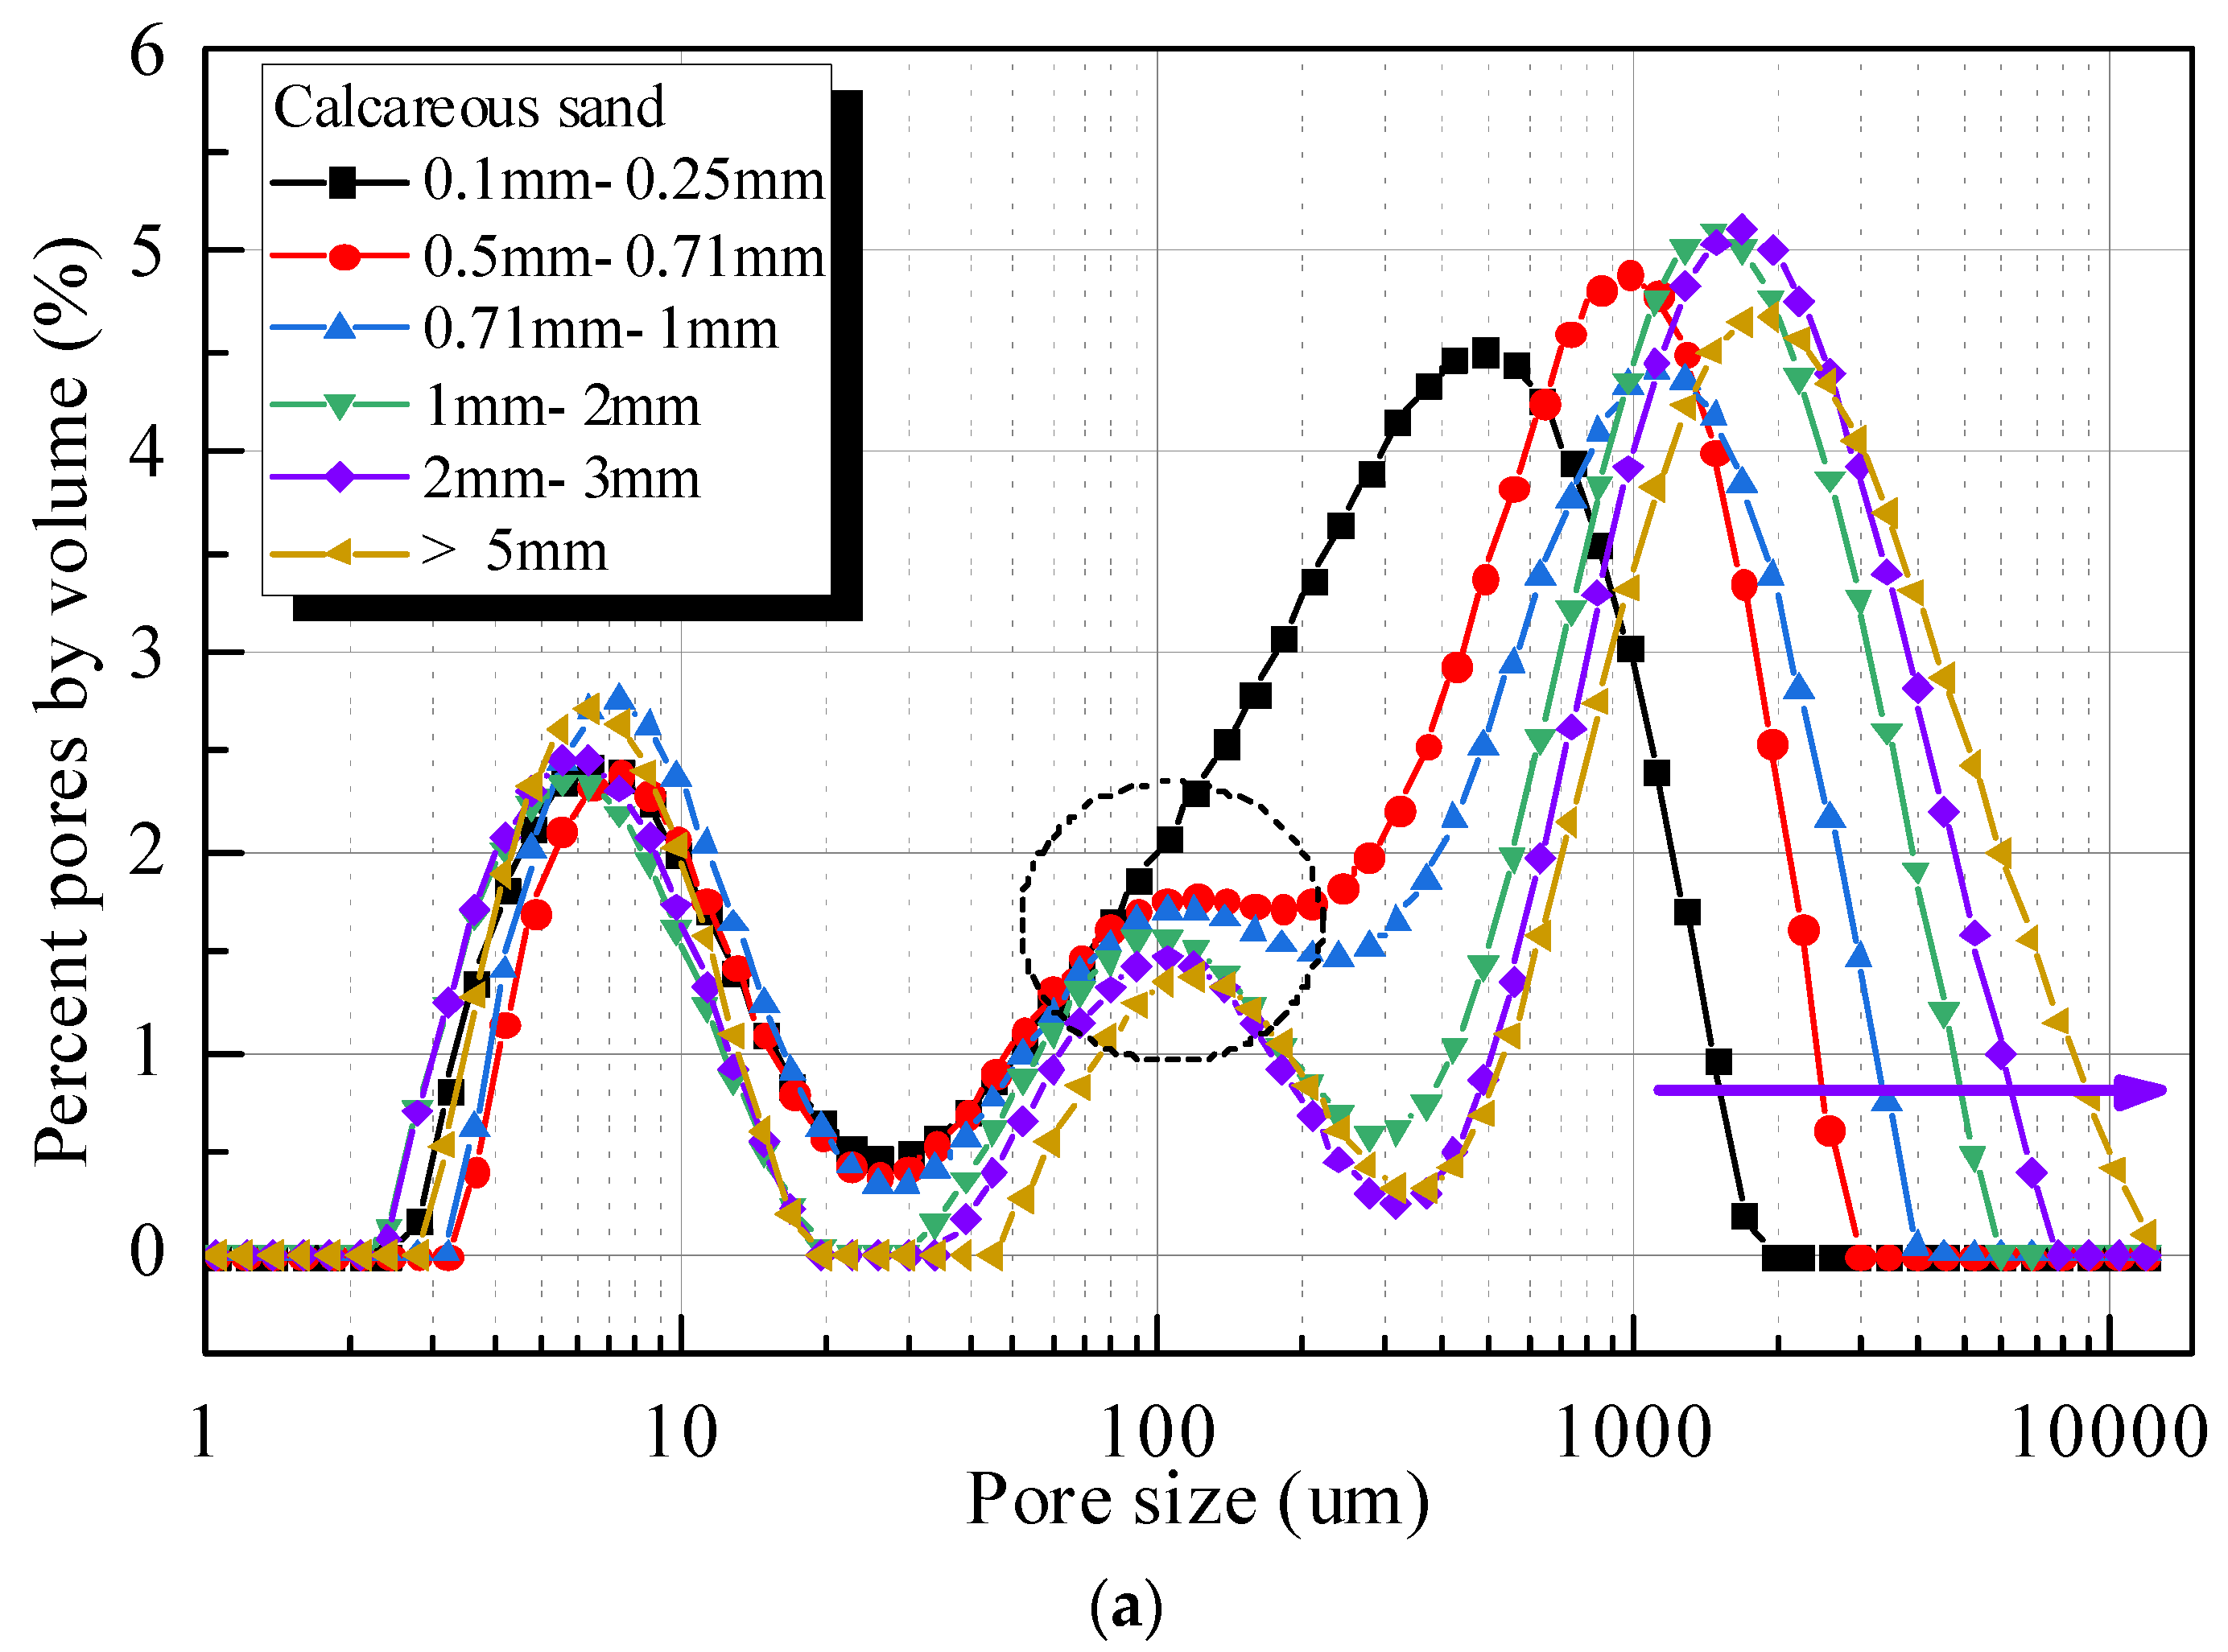
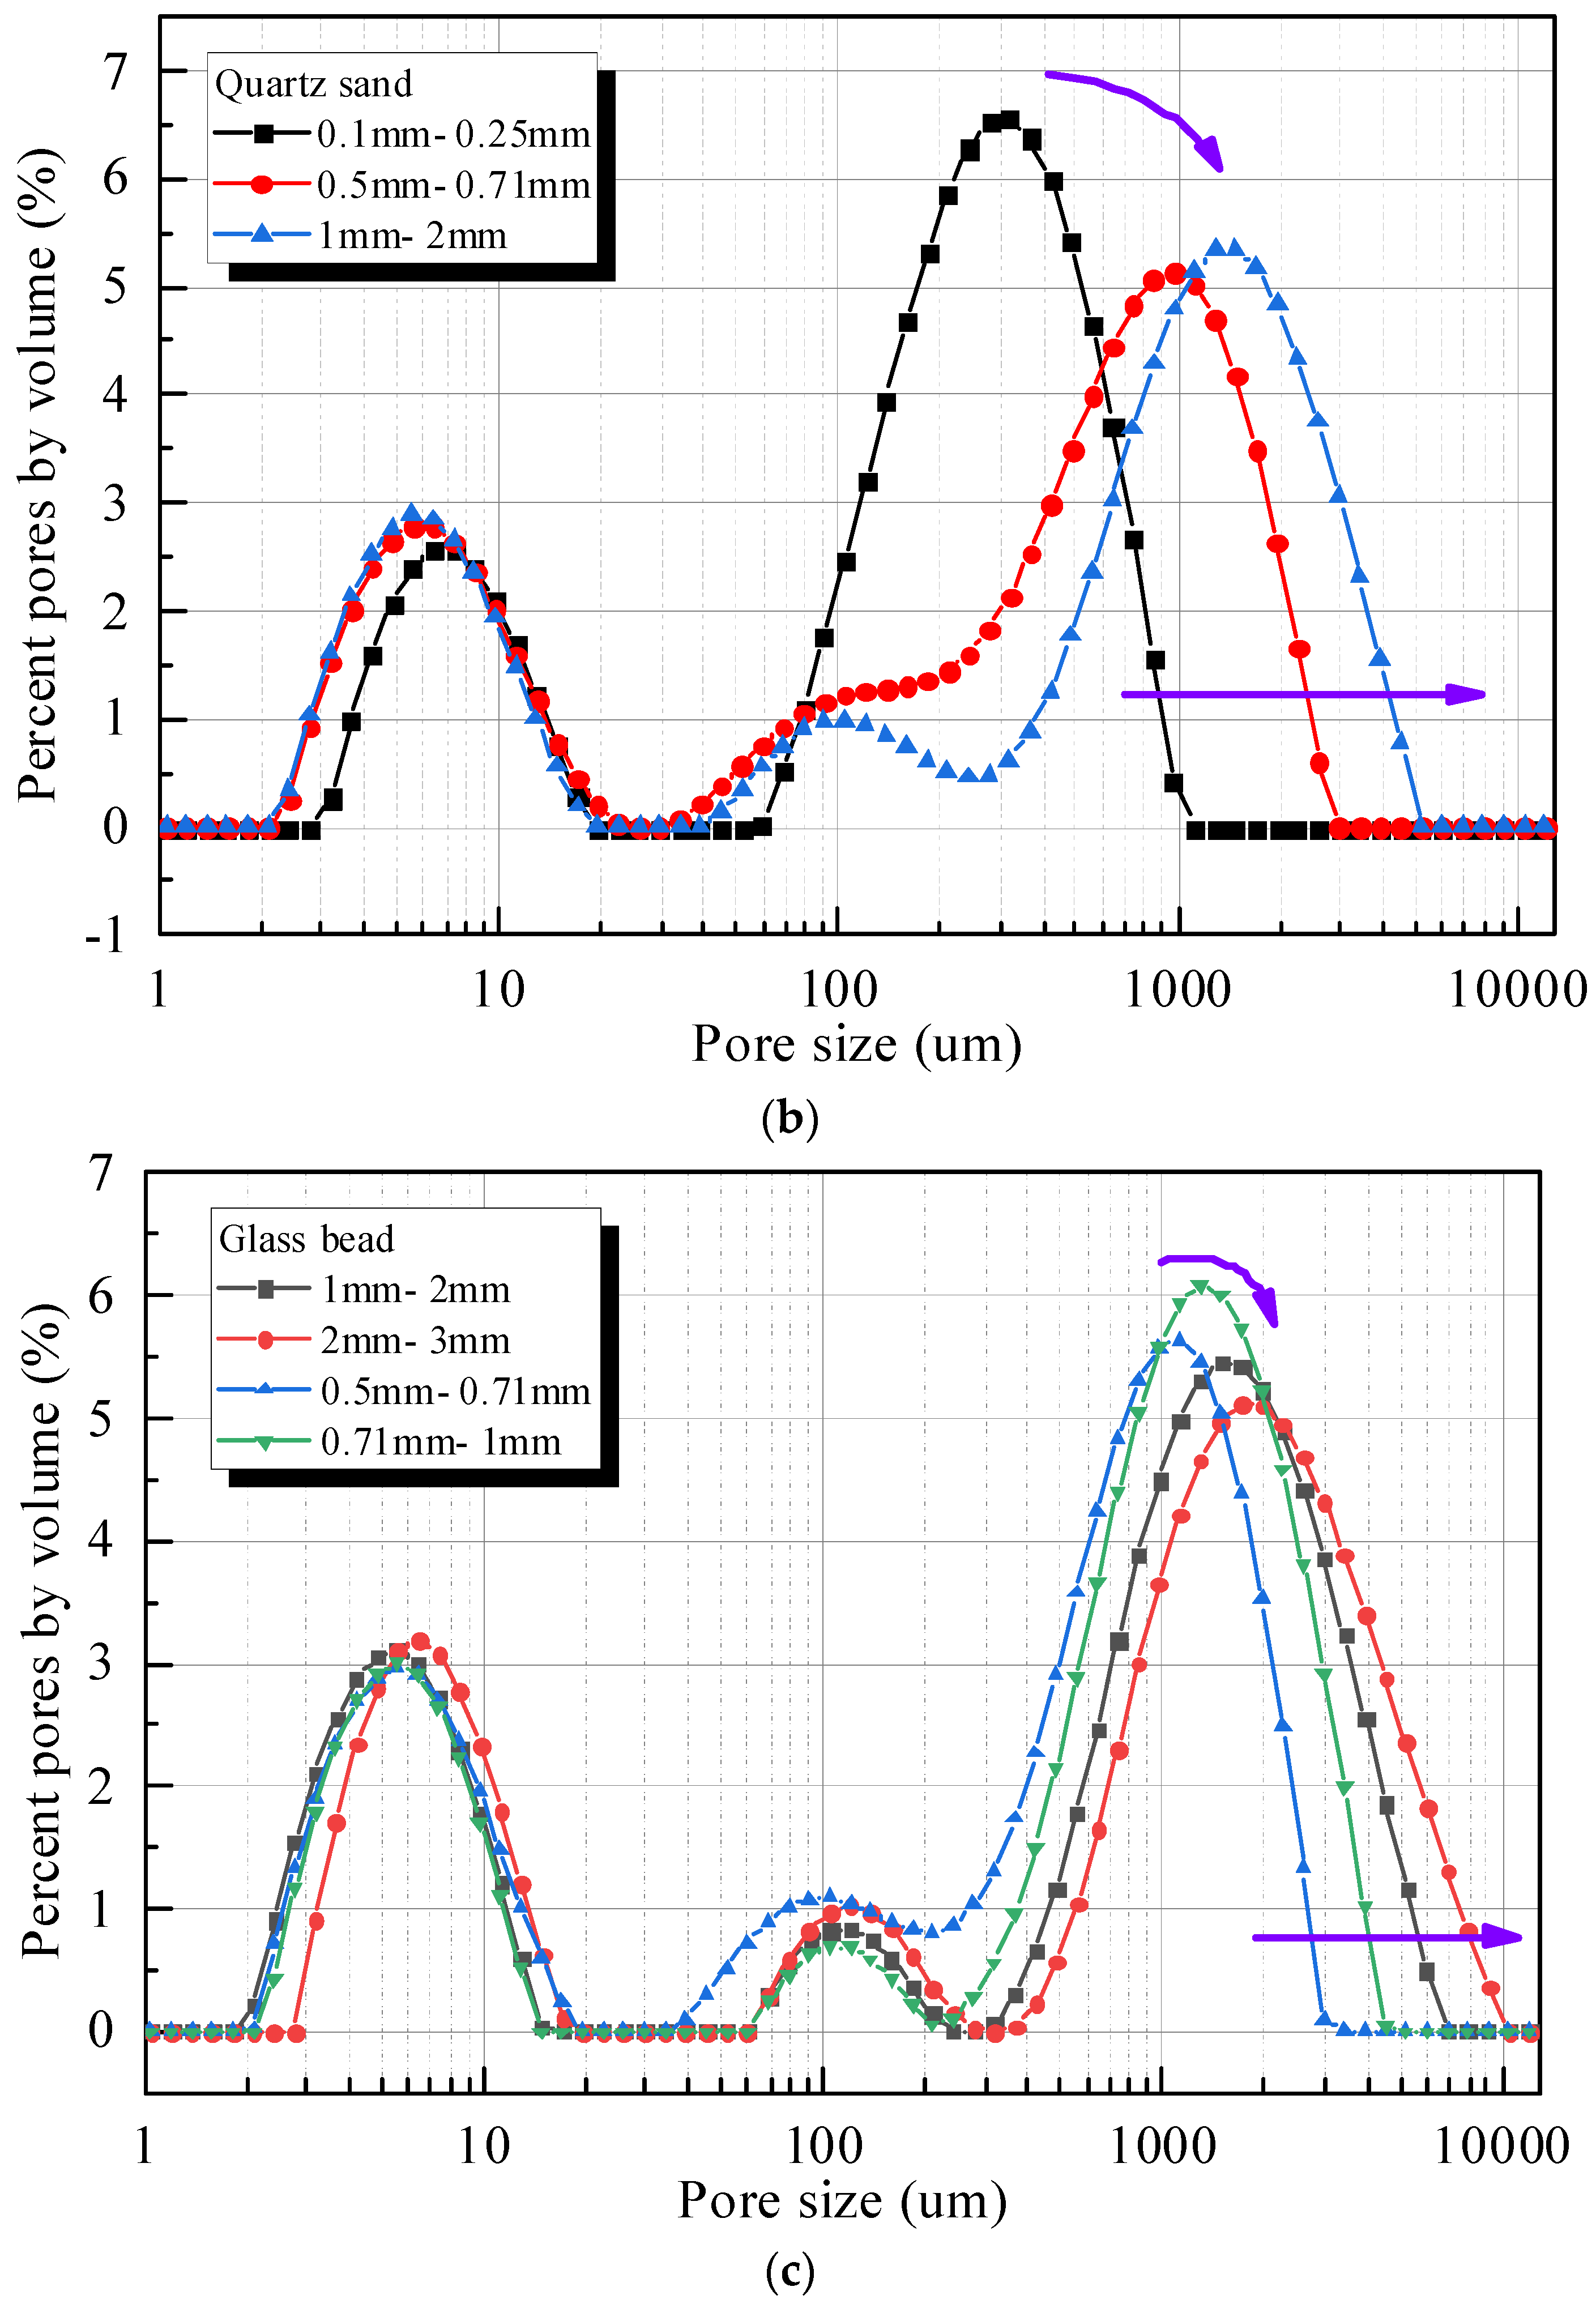
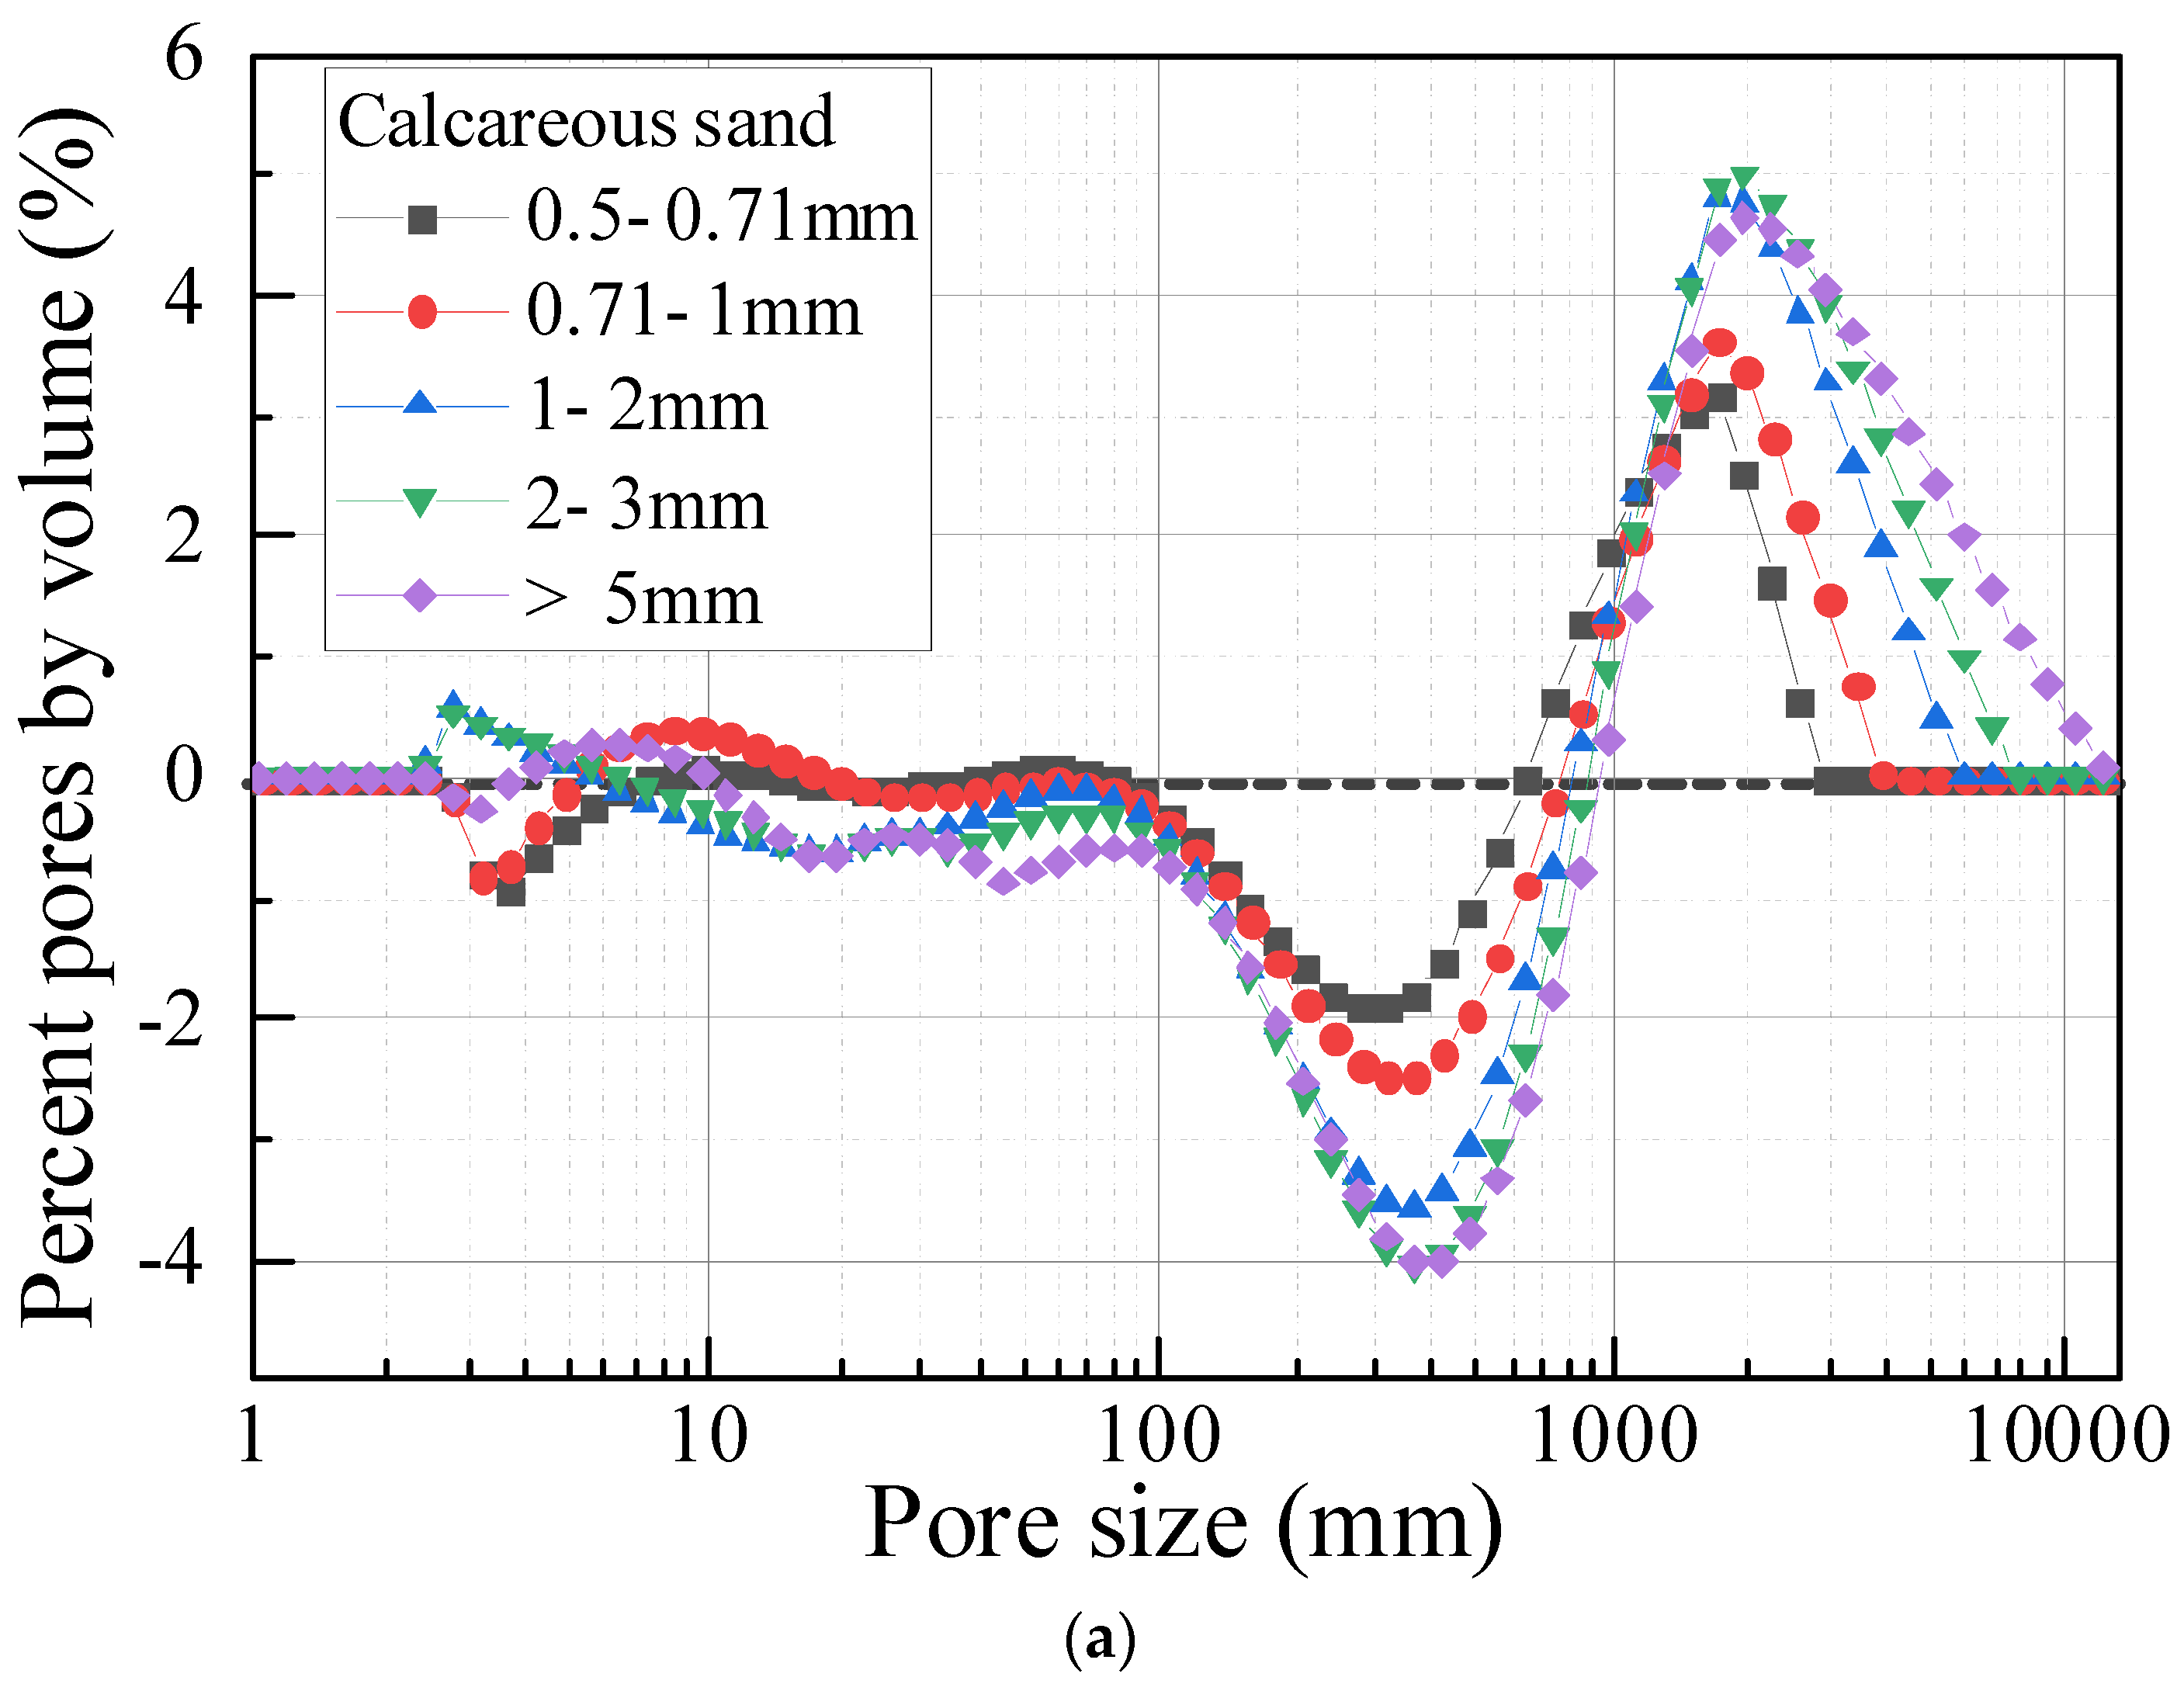
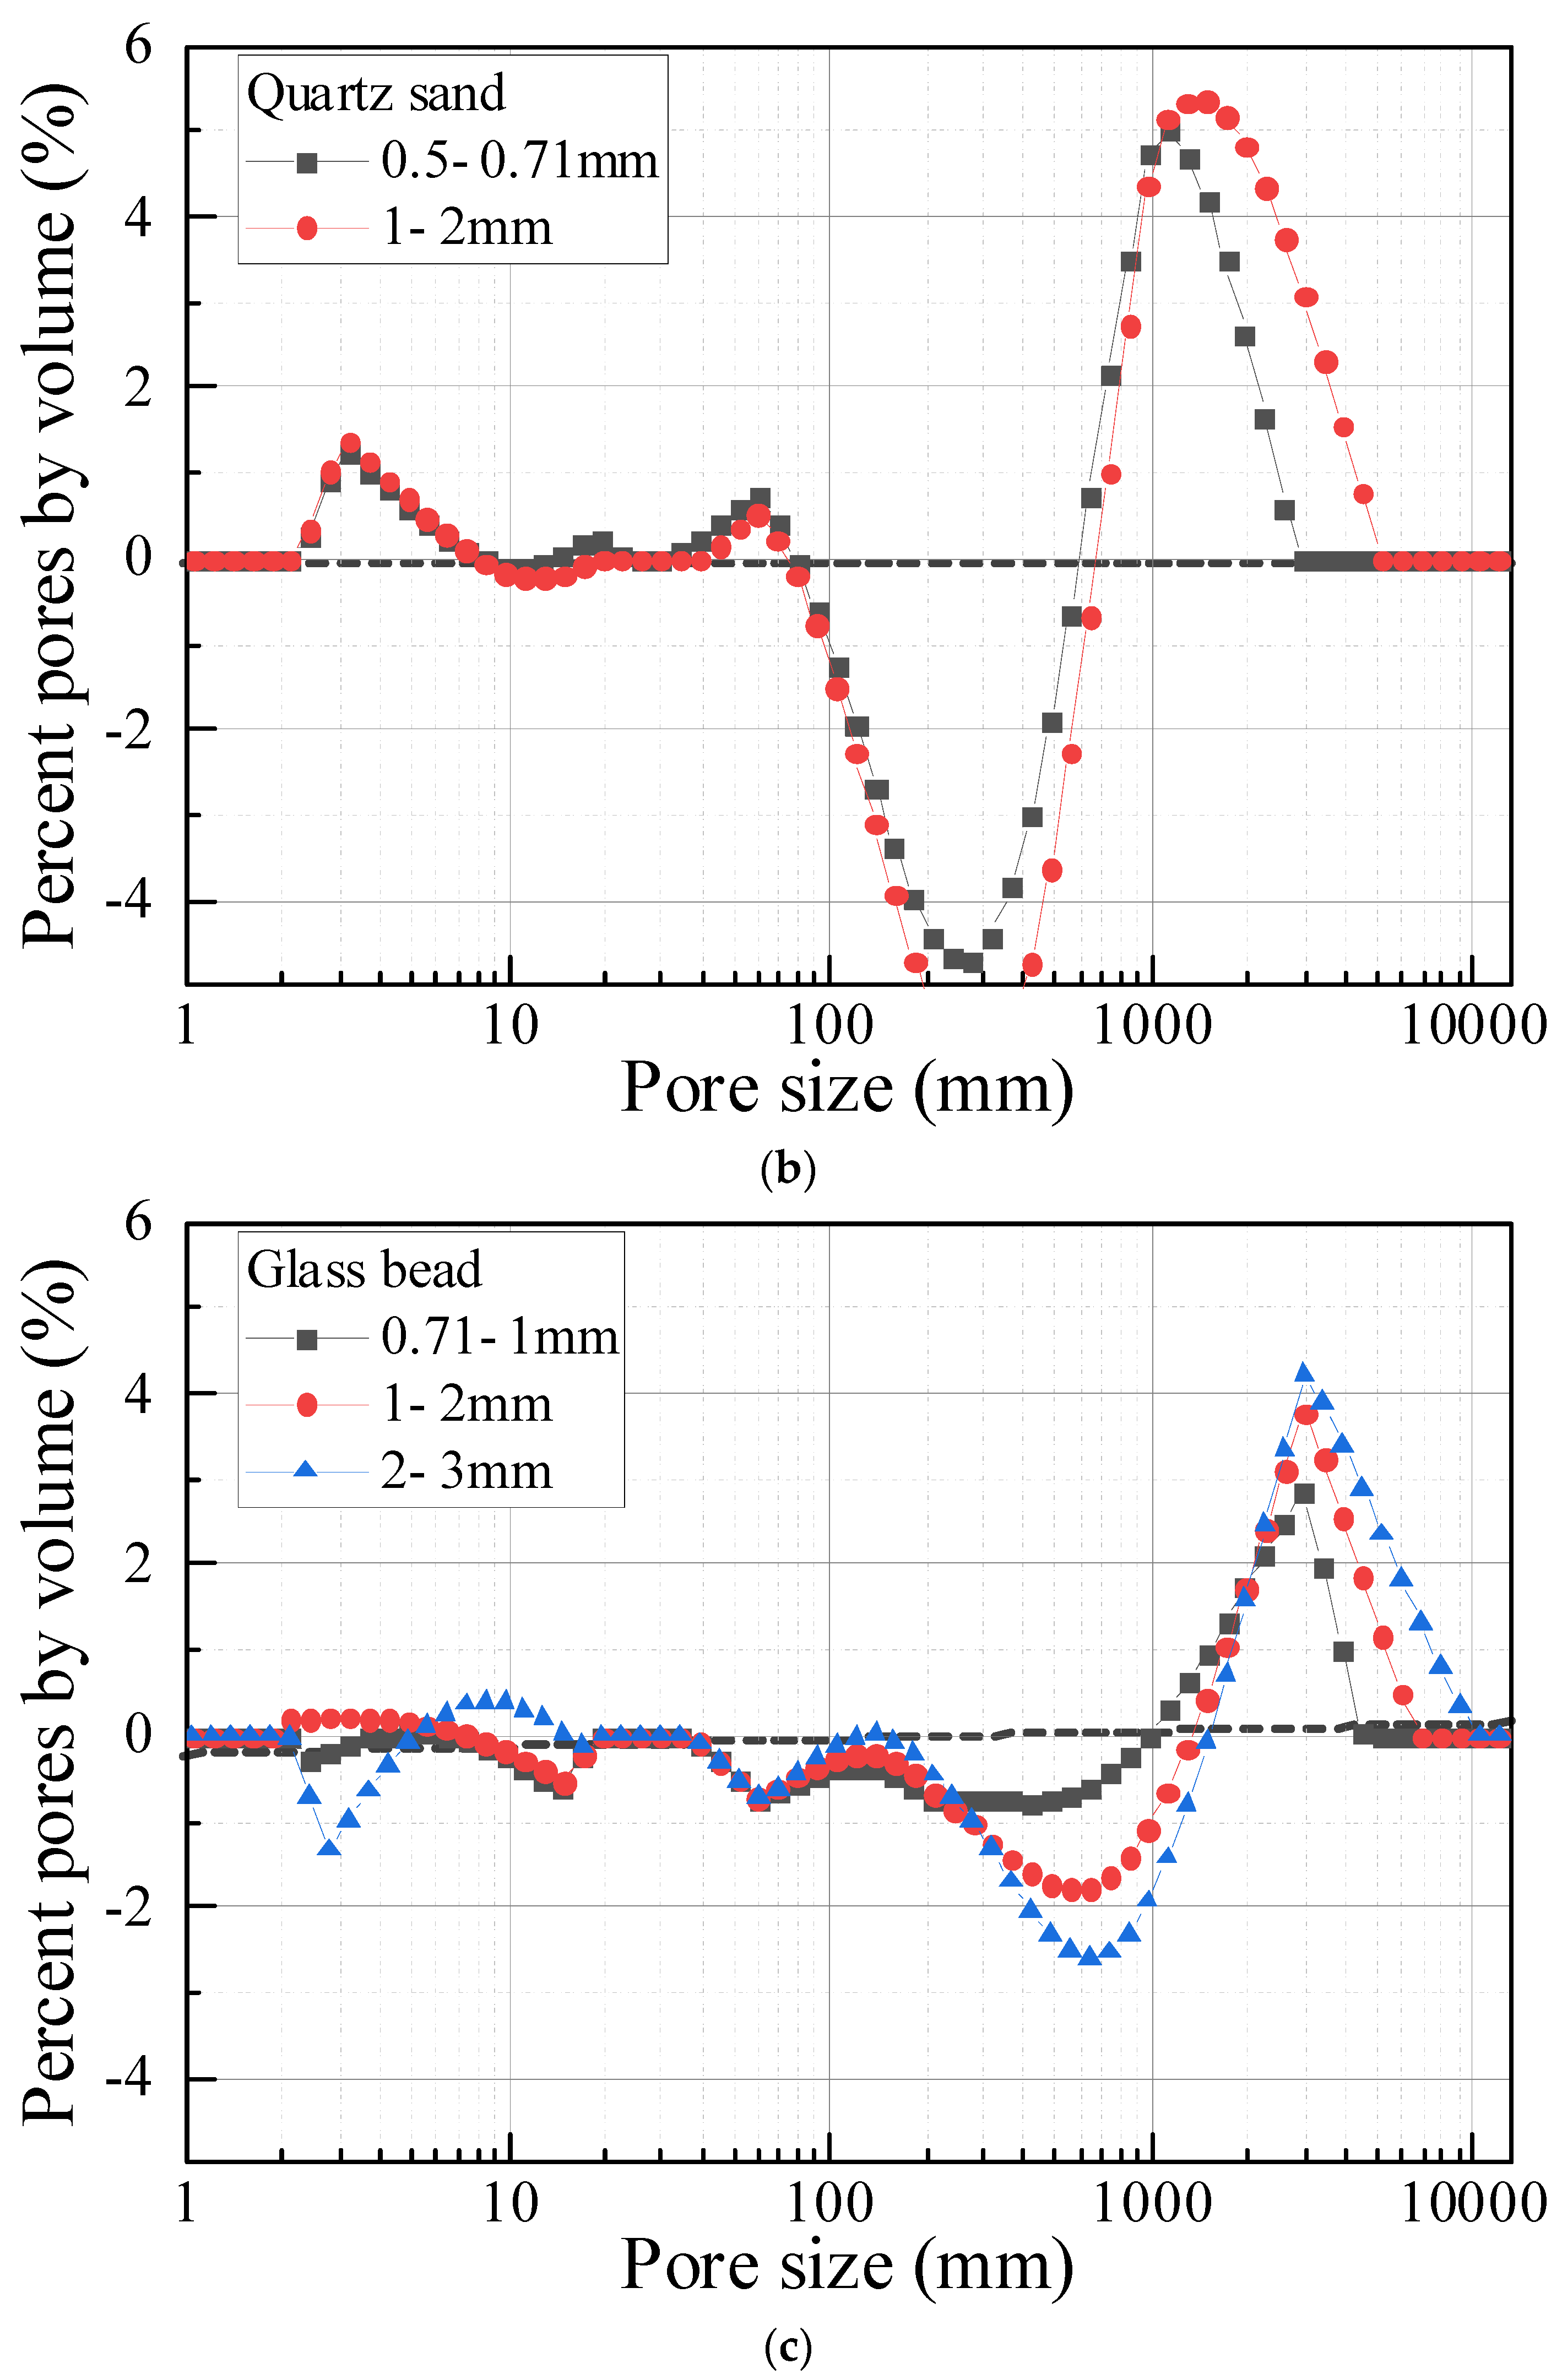
Grain size had a significant effect on the pore size distribution of carbonate-based sand and silicate-based sand. As the grain size increased, the pore size distribution curve of sands gradually evolved from a binary structure with two peaks to a ternary structure with three peaks. The increase in the grain size could cause a remarkable increase in the maximum pore size. Moreover, the increase in grain size increased the proportion of large pores with a size larger than 1000 μm, and correspondingly reduced the proportion of medium pores with a size between 100 μm–1000 μm. However, grain size had a minor effect on small pores with a size less than 100 um.
(2)
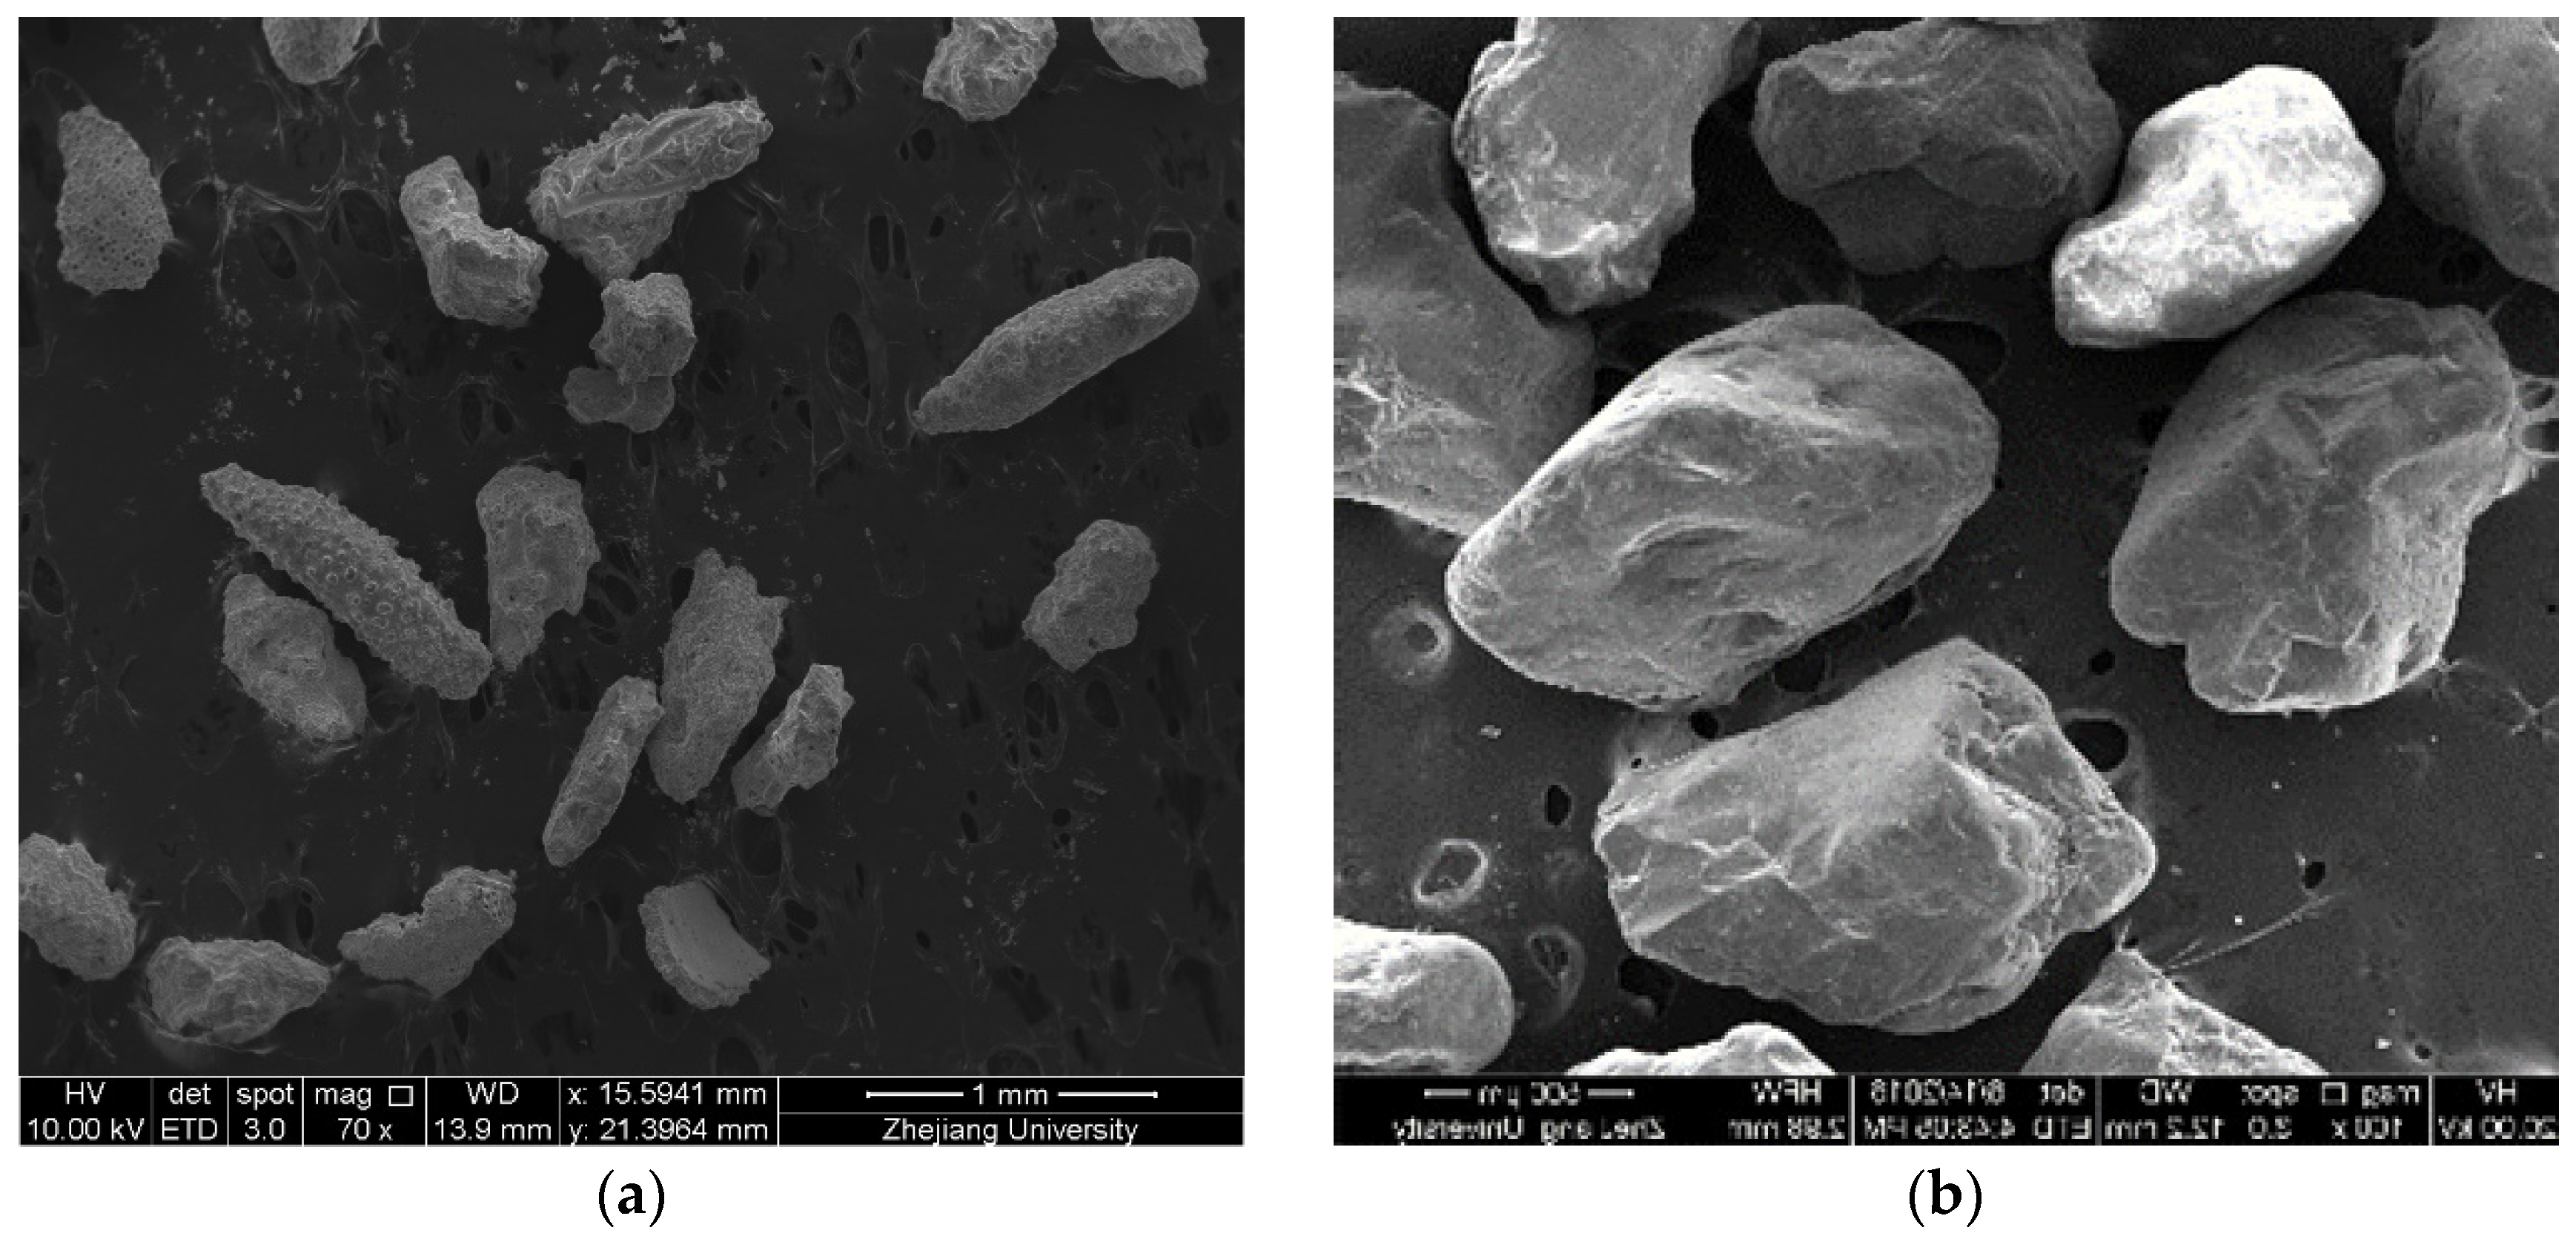
Carbonate-based sand differed significantly from silicate-based sand with respect to the pore size distribution, owing to the significant divergence in particle shapes. In the pore size range between 100 μm and 1000 μm, carbonate-based sand had a continuous pore size distribution, whereas the pore size distribution of silicate-based sand was discontinuous. This indicated that the more irregular the particle shape, the better the continuity between the large and medium pores.
(3)
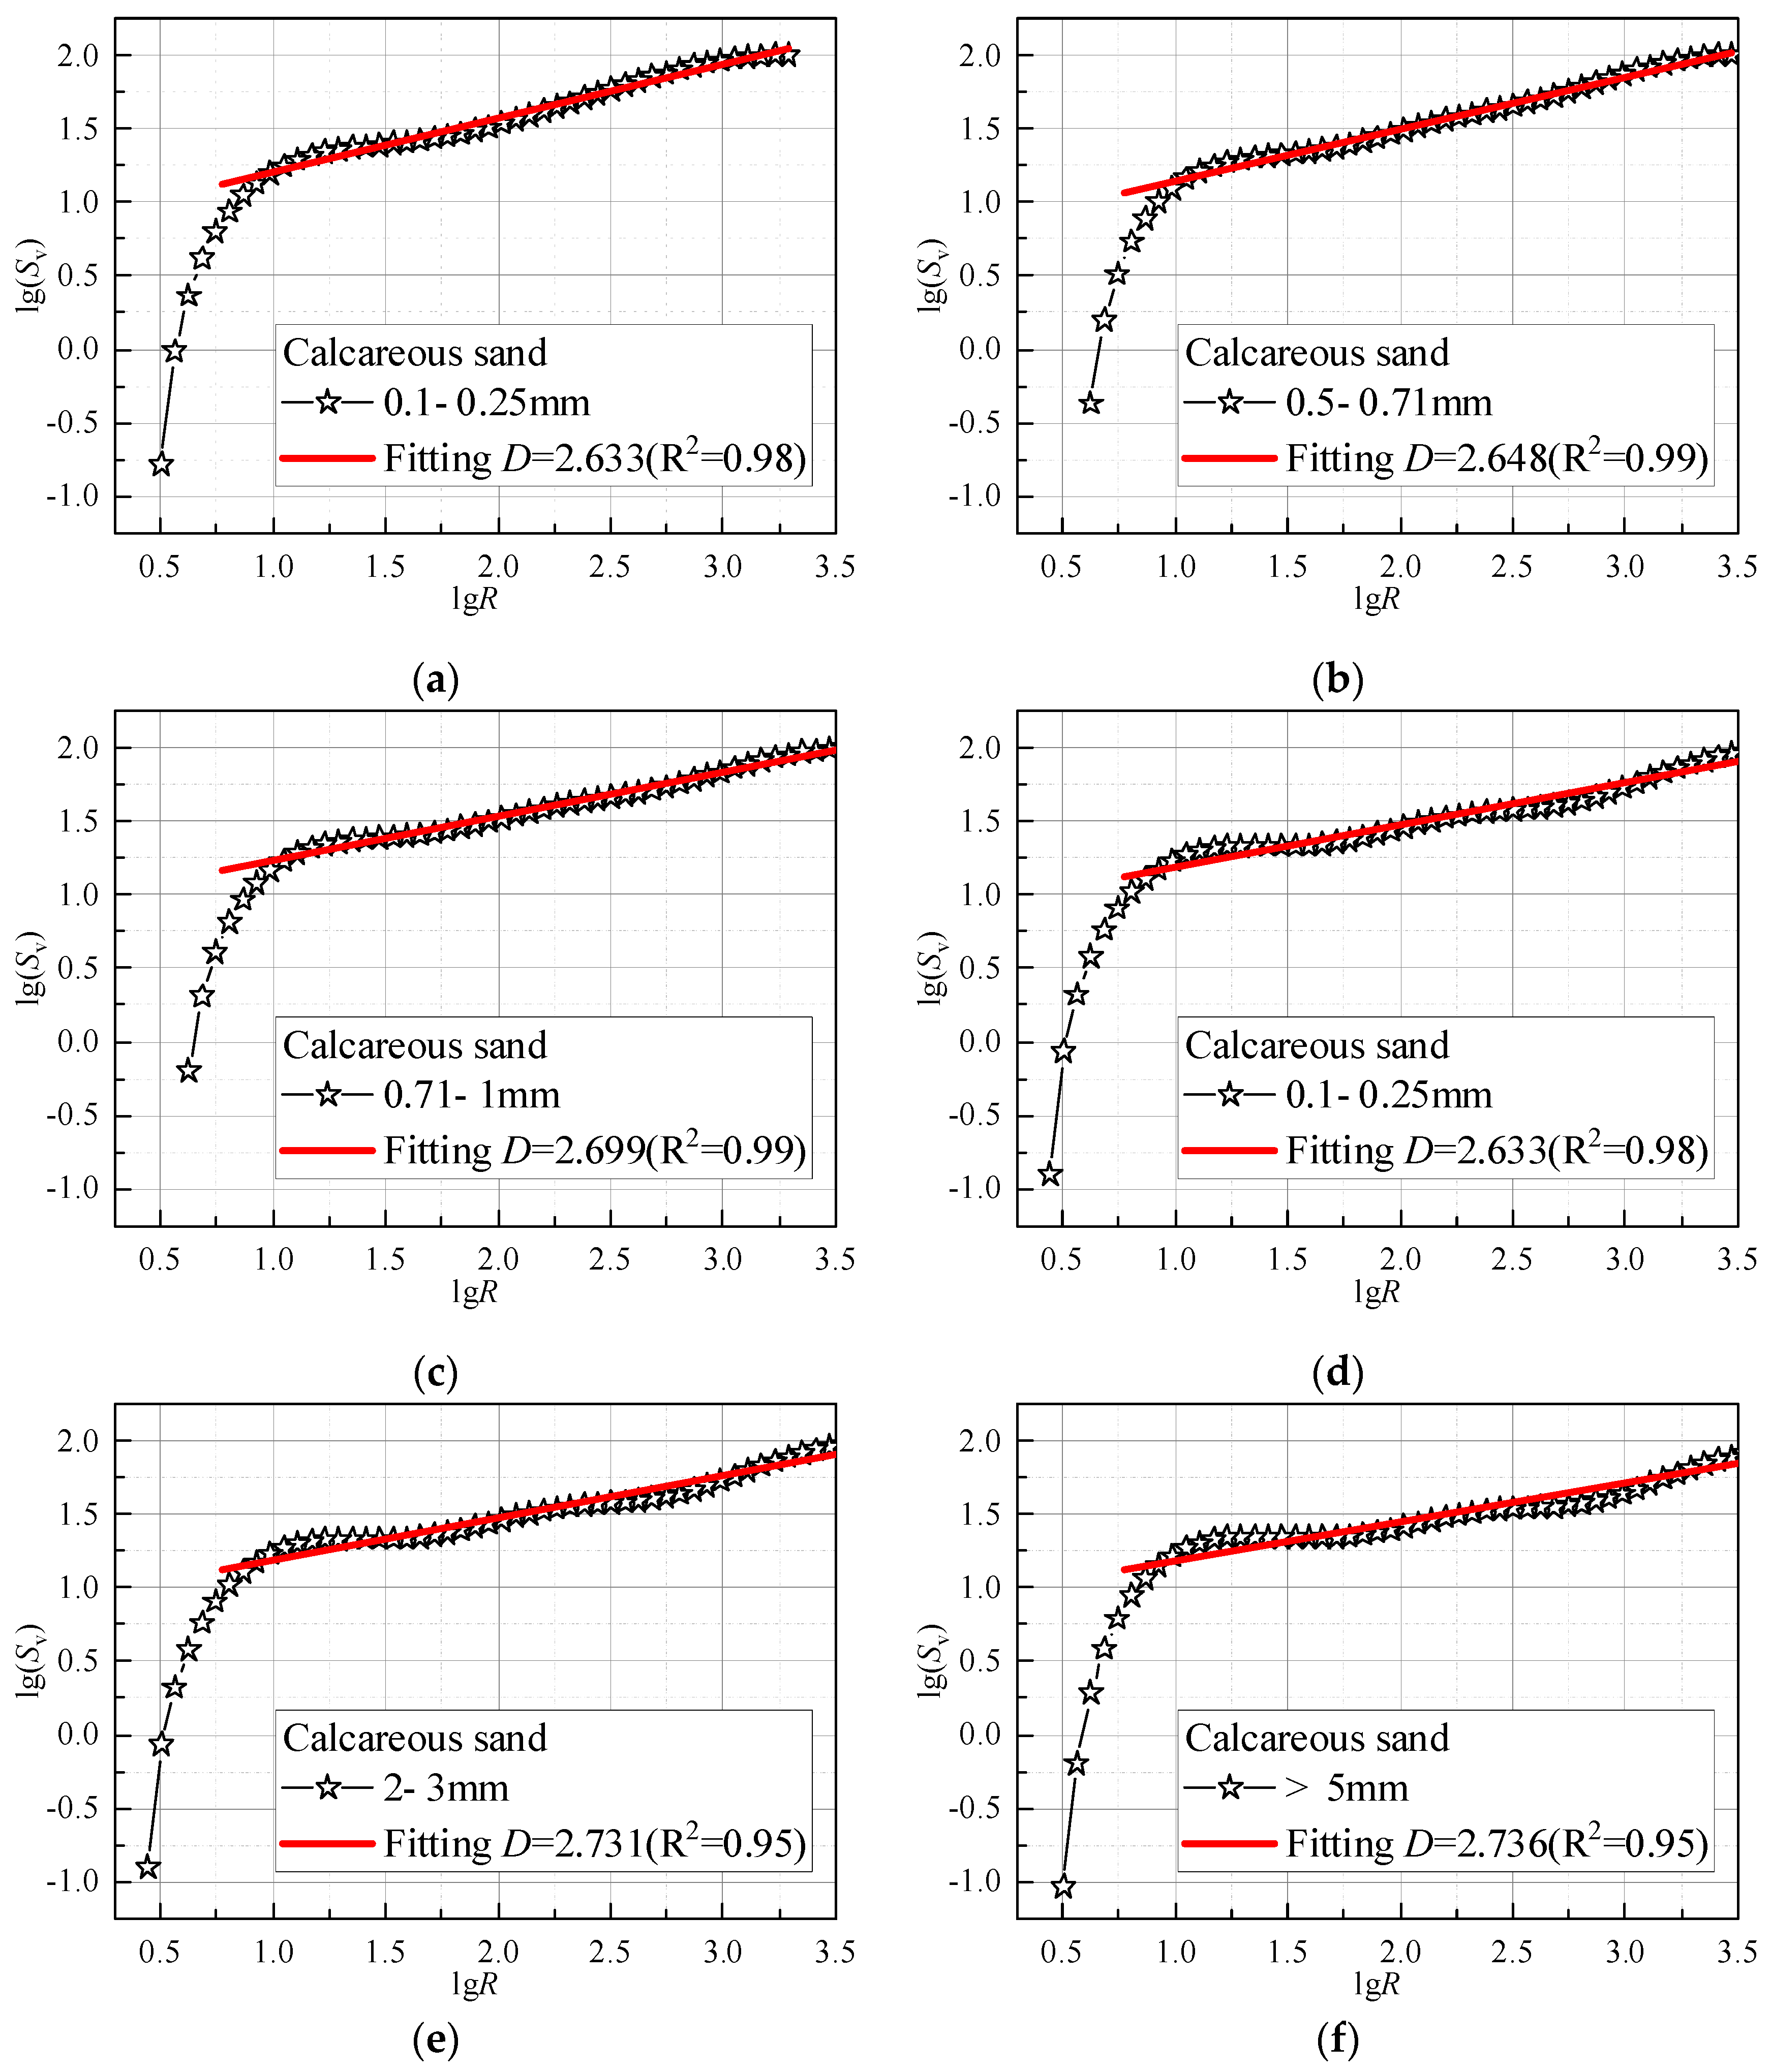
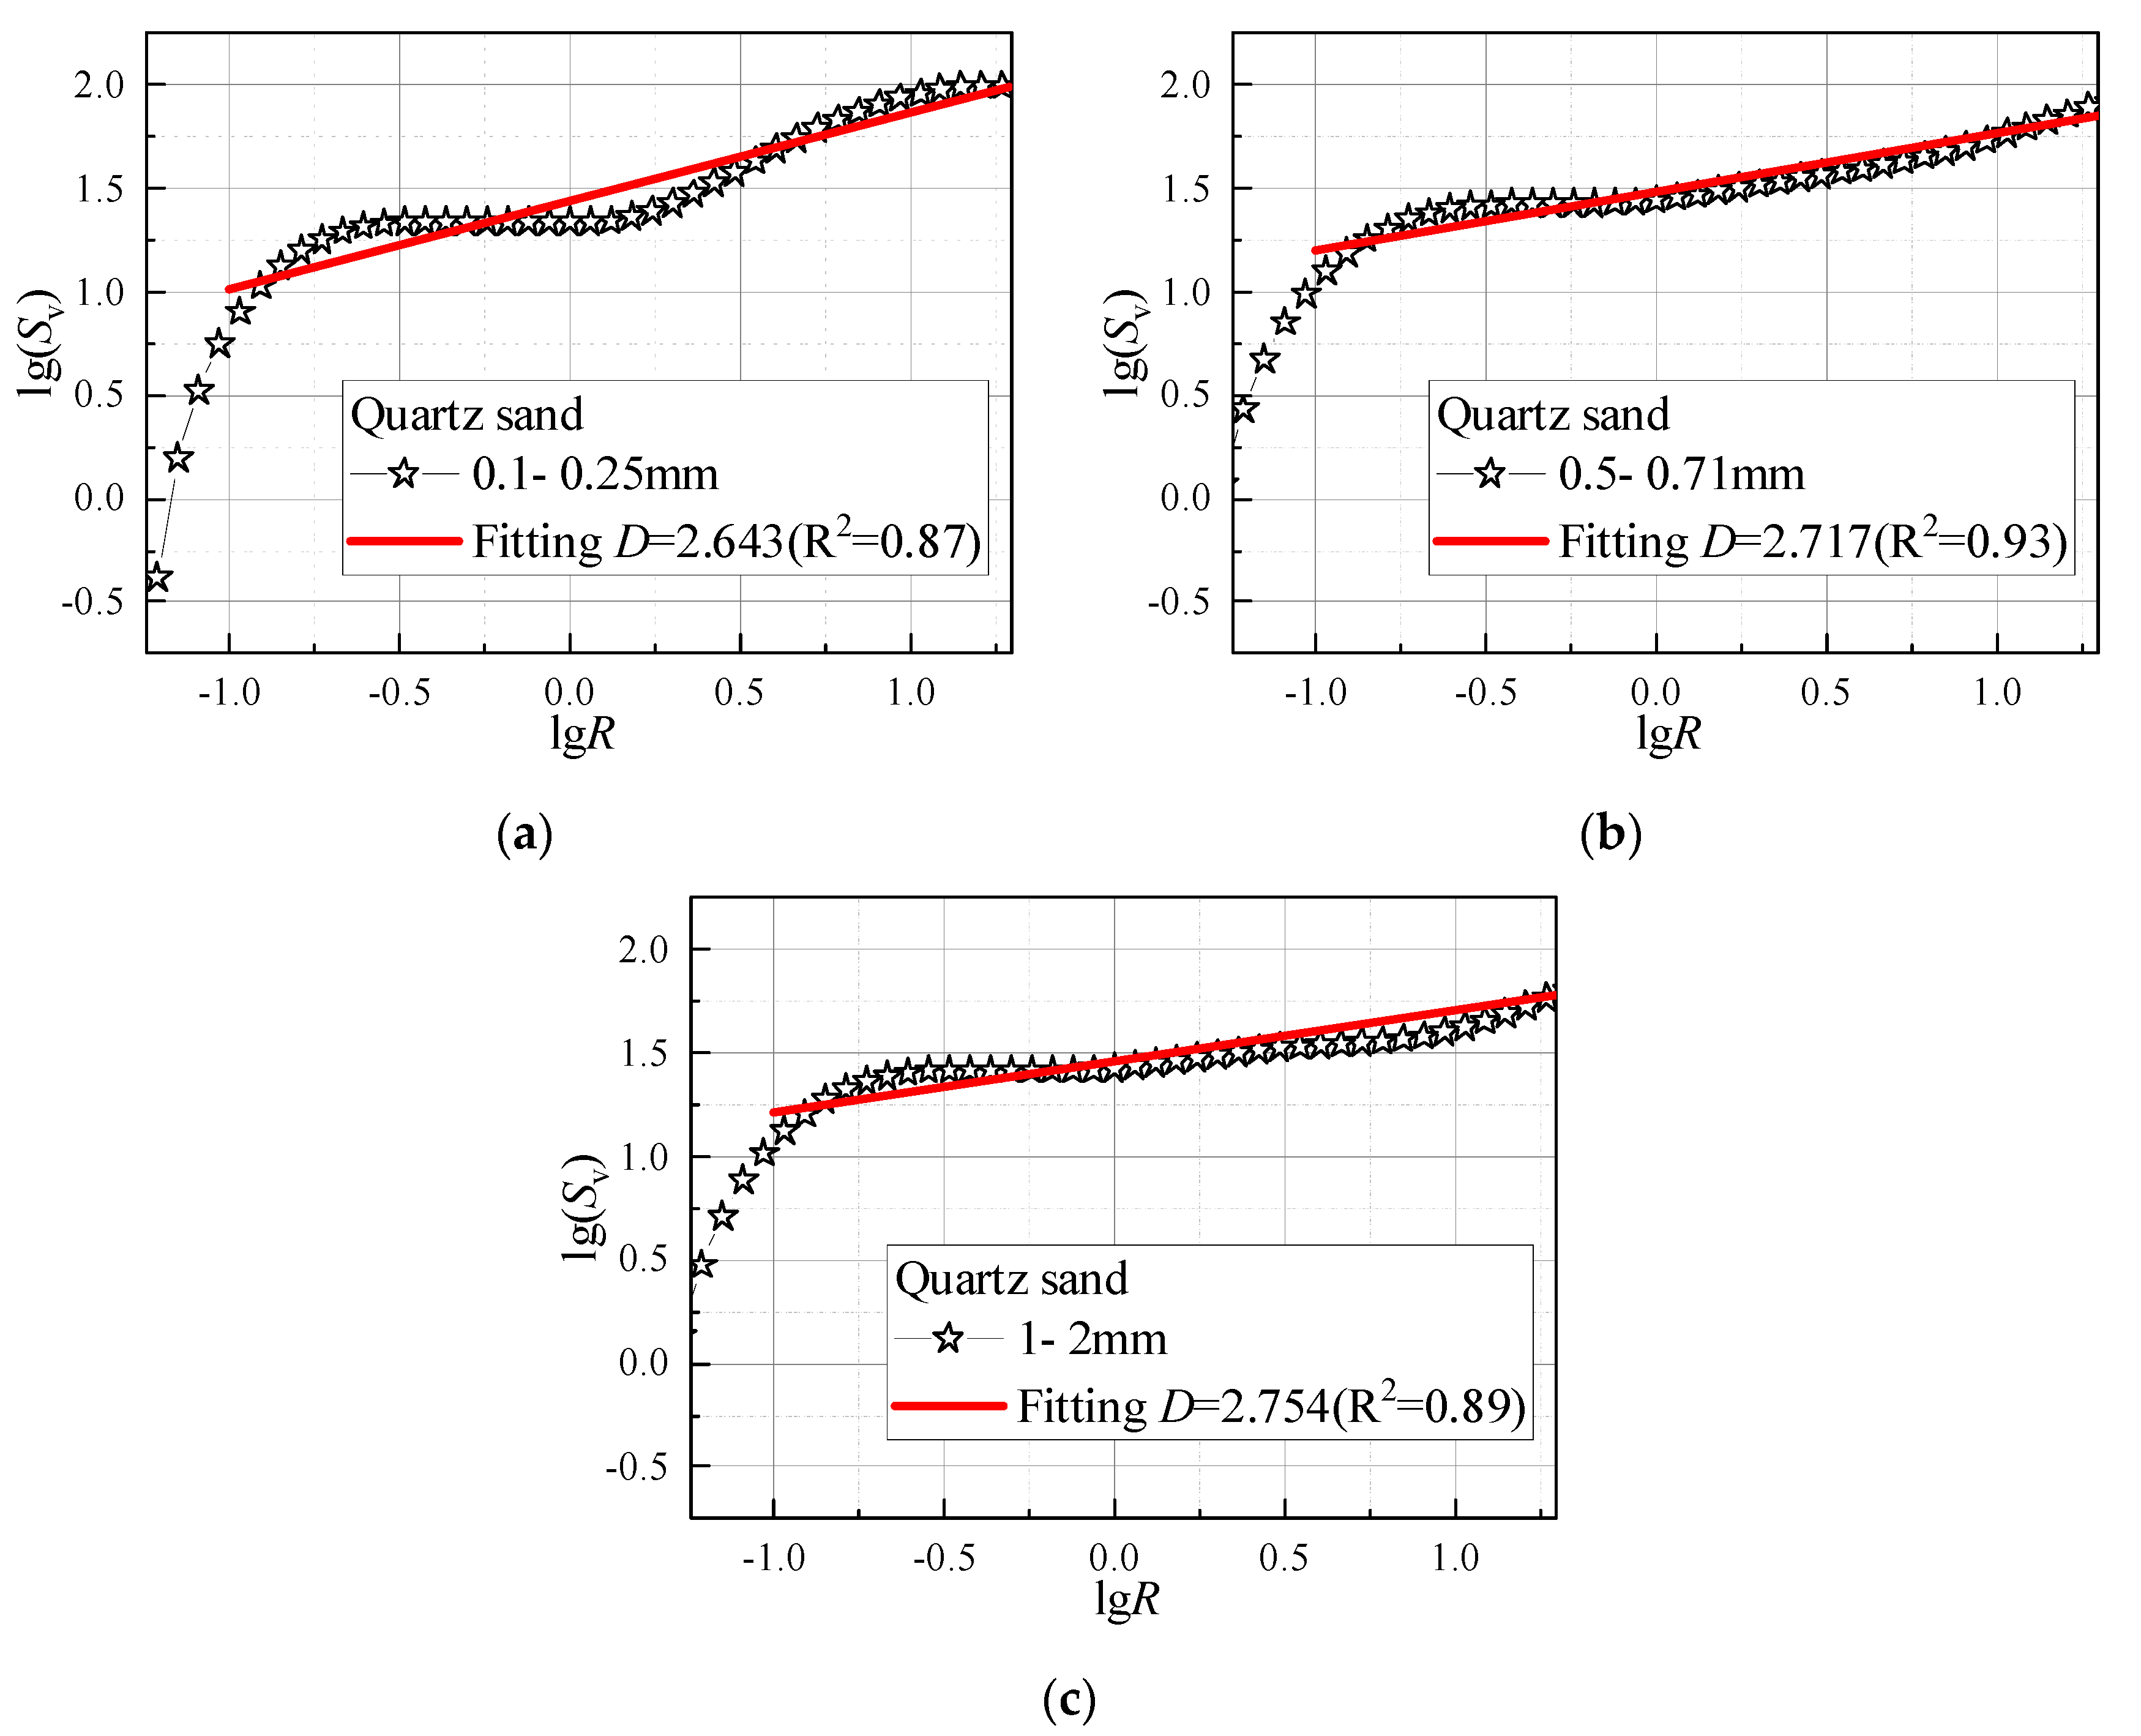
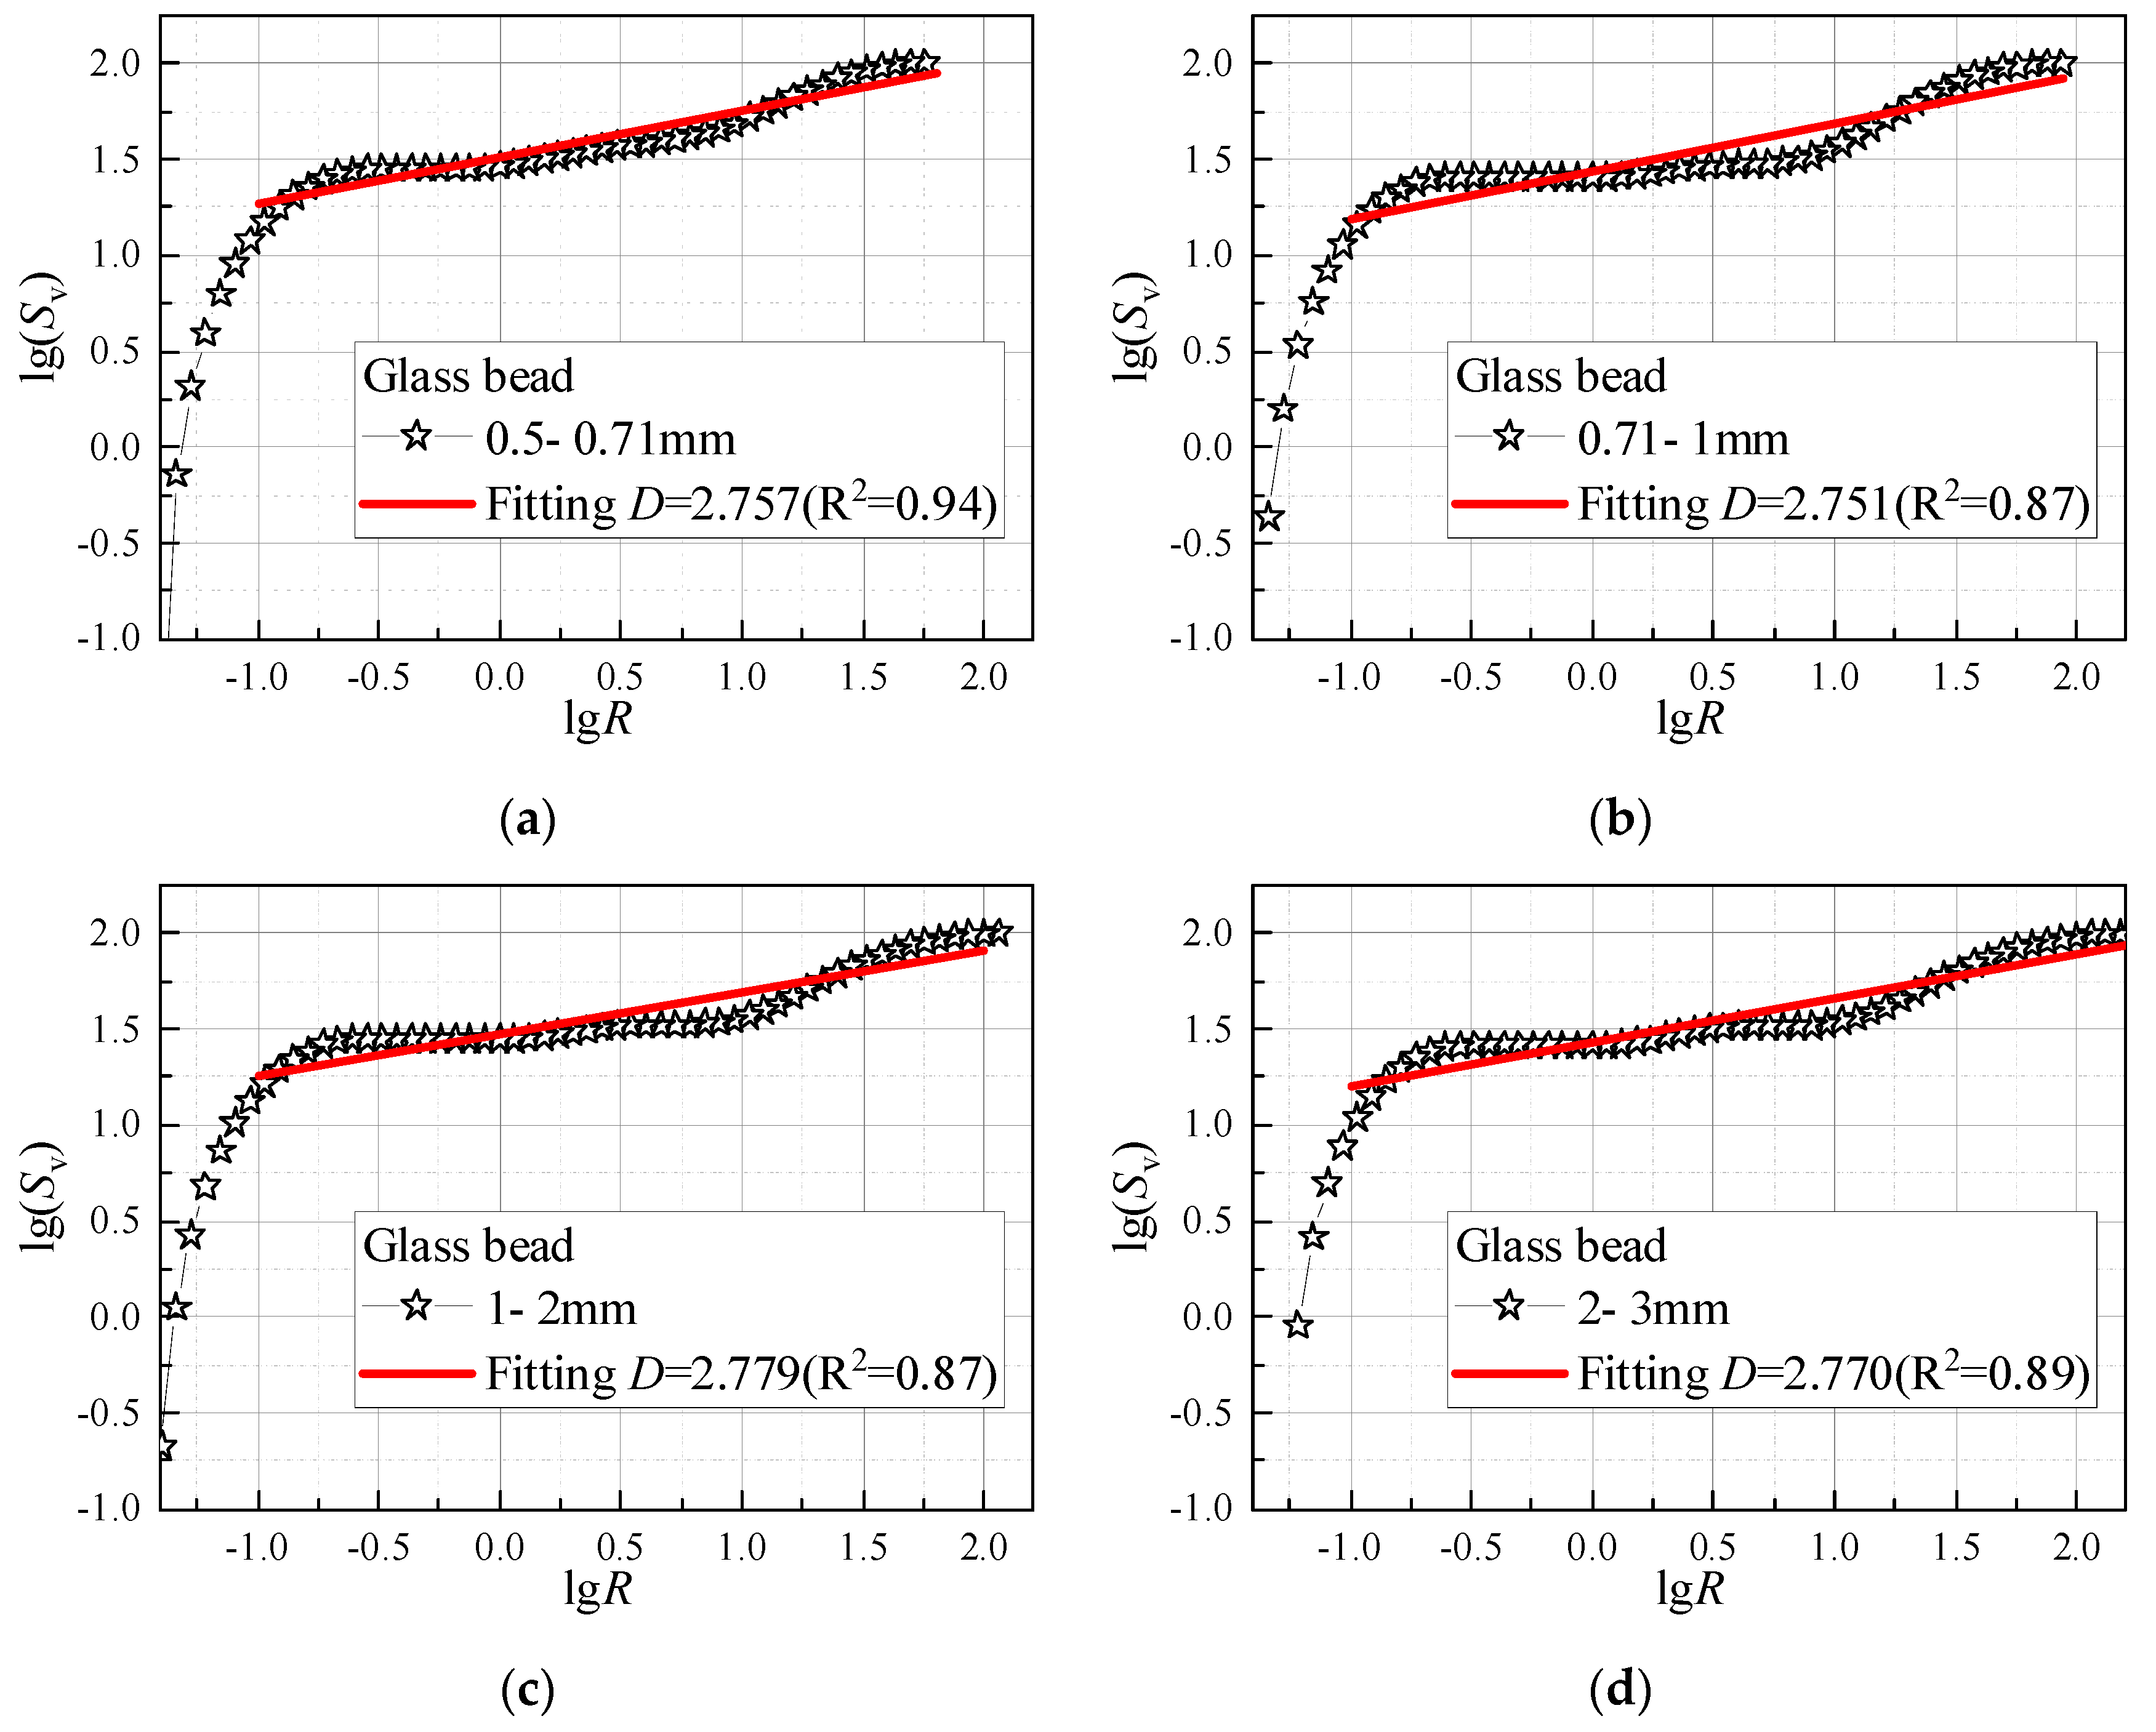
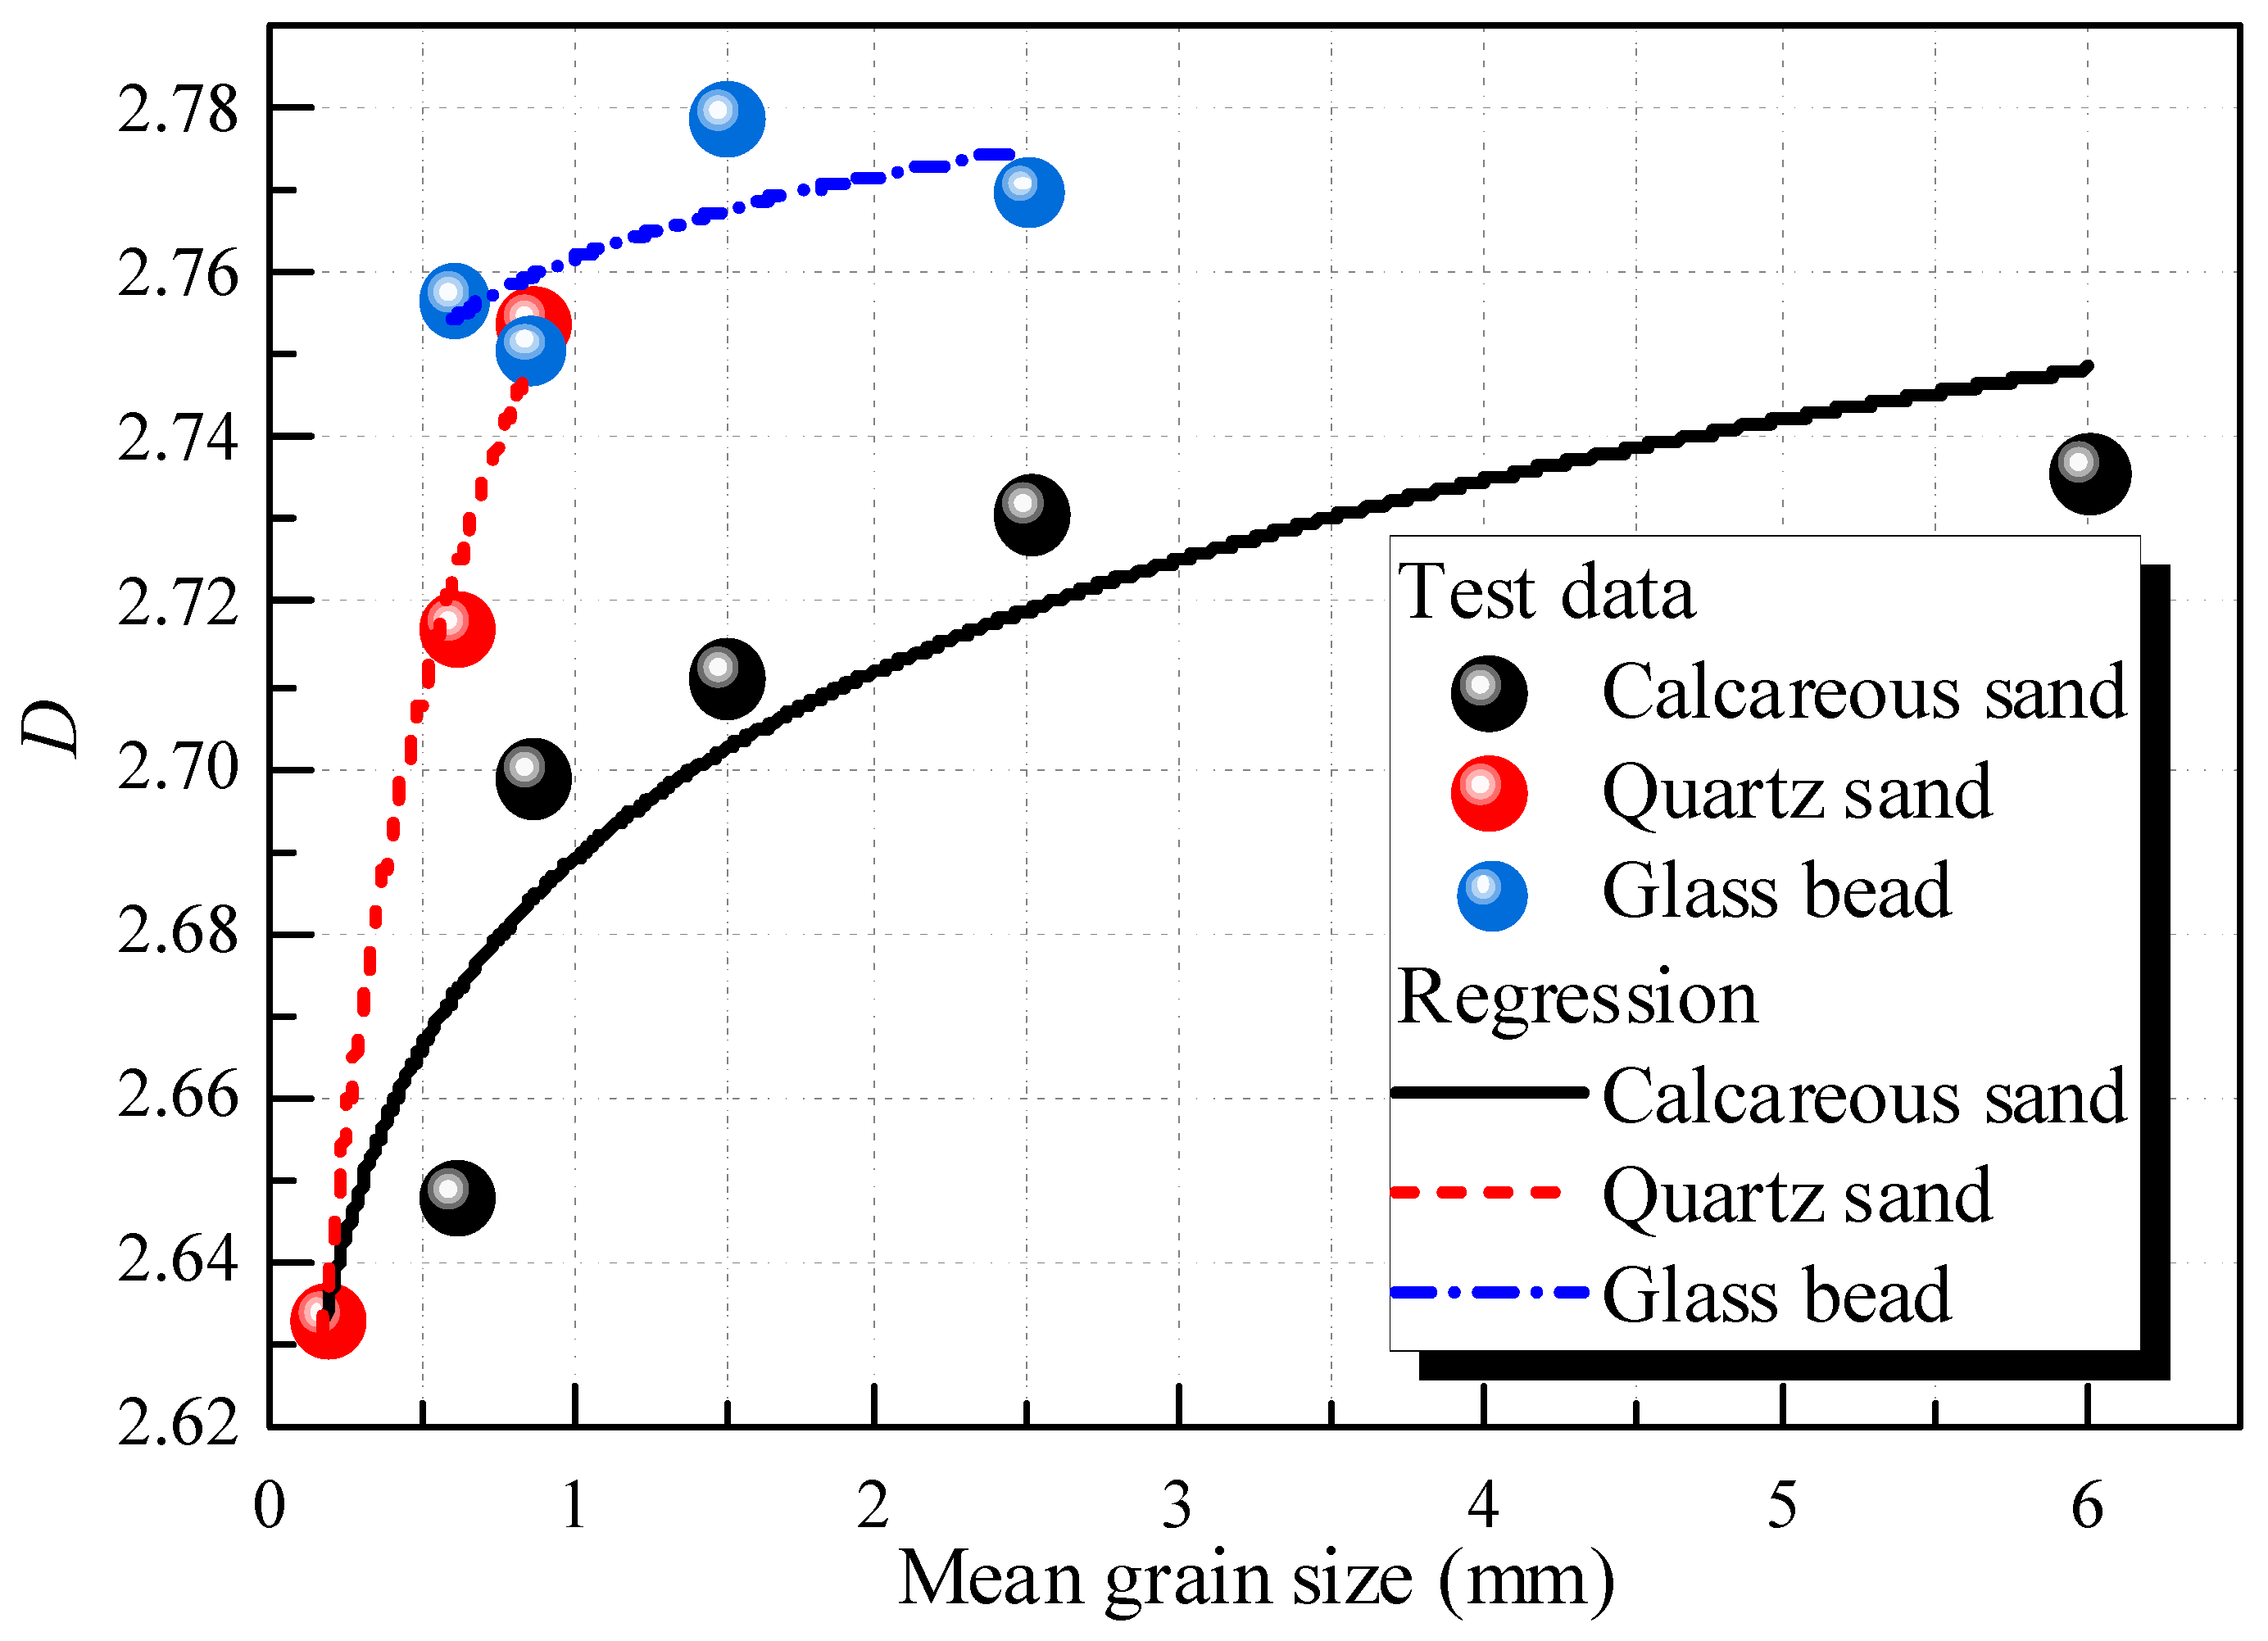
The pore size distribution of calcareous sand, quartz sand and glass beads all exhibited good fractal characteristics. The fractal dimension (D) of the pore size distribution of the three materials was determined by fractal theory. Compared with the quartz sand and glass beads, the calcareous sand with the most complex particle shape had the most significant fractal characteristics. Moreover, grain size had a considerable effect on the fractal dimension of the carbonate-based sand and the silicate-based sand. The increase of grain size could lead to a significant increase of D for calcareous sand, quartz sand and glass bead, indicating that the increase of grain size would increase the heterogeneity of pore structure distribution in sands. A refined correlation was proposed to determine D for carbonate-based sand and silicate-based sand with different grain sizes.

Author Contributions

Conceptualization, Z.D.; methodology, S.-H.H. and Z.D.; formal analysis, S.-H.H. and H.-B.H.; investigation, S.-H.H. and M.G.; resources, Z.D.; writing—original draft preparation, S.-H.H. and Z.D.; visualization, H.-B.H. and M.G.; funding acquisition, S.-H.H. and Z.D. All authors have read and agreed to the published version of the manuscript.

Funding

This work was financially supported by the Chinese National Natural Science Foundation (Grant No. 51508506), Joint Fund of Zhejiang Provincial Natural Science Foundation (Grant No. LHZ20E080001), Hangzhou Science Technology Plan Project (Grant No. 20172016A06, 20180533B06, 20180533B12, 20191203B44), Scientific Research Cultivation Fund of Zhejiang University City College (J-202112), and the China Scholarship Council.

Institutional Review Board Statement

Not applicable.

Informed Consent Statement

Not applicable.

Data Availability Statement

The data are available from the corresponding author upon request.

Acknowledgments

The authors are very grateful to Yifei Sun from Ruhr University Bochum for his kind guidance and help in writing this article.

Conflicts of Interest

The authors declare no conflict of interest.

References

  1. Ding, Z.; He, S.-H.; Sun, Y.; Xia, T.-D.; Zhang, Q.-F. Comparative study on cyclic behavior of marine calcareous sand and terrigenous siliceous sand for transportation infrastructure applications. Constr. Build. Mater. 2021, 283, 122740. [Google Scholar] [CrossRef]
  2. He, S.H.; Ding, Z.; Xia, T.D.; Zhou, W.H.; Gan, X.L.; Chen, Y.Z.; Xia, F. Long-term behaviour and degradation of calcareous sand under cyclic loading. Eng. Geol. 2020, 276, 105756. [Google Scholar] [CrossRef]
  3. Peng, Y.; Ding, X.; Xiao, Y.; Deng, X.; Deng, W. Detailed amount of particle breakage in non-uniformly graded sands under one-dimensional compression. Can. Geotech. J. 2019, 57, 1239–1246. [Google Scholar] [CrossRef]
  4. Rui, S.; Wang, L.; Guo, Z.; Cheng, X.; Wu, B. Monotonic behavior of interface shear between carbonate sands and steel. Acta Geotech. 2021, 16, 167–187. [Google Scholar] [CrossRef]
  5. Shahnazari, H.; Rezvani, R. Effective parameters for the particle breakage of calcareous sands: An experimental study. Eng. Geol. 2013, 159, 98–105. [Google Scholar] [CrossRef]
  6. Sharma, S.S.; Ismail, M.A. Monotonic and Cyclic Behavior of Two Calcareous Soils of Different Origins. J. Geotech. Geoenviron. 2006, 132, 1581–1591. [Google Scholar] [CrossRef]
  7. Wang, G.; Wang, Z.; Ye, Q.; Wei, X. Particle Breakage and Deformation Behavior of Carbonate Sand under Drained and Undrained Triaxial Compression. Int. J. Geomech. 2020, 20, 04020012. [Google Scholar] [CrossRef]
  8. Wang, G.; Wang, Z.; Ye, Q.; Zha, J. Particle breakage evolution of coral sand using triaxial compression tests. J. Rock Mech. Geotech. Eng. 2021, 13, 321–334. [Google Scholar] [CrossRef]
  9. Wang, H.; Sun, P.; Liu, E.; Li, R. Dynamic properties of Tianshui saturated remolded loess: A laboratory study. Eng. Geol. 2020, 272, 105570. [Google Scholar] [CrossRef]
  10. Wang, J.; Li, P.; Ma, Y.; Vanapalli, S. Evolution of pore-size distribution of intact loess and remolded loess due to consolidation. J. Soils Sediments 2019, 19, 1226–1238. [Google Scholar] [CrossRef]
  11. Wang, J.-D.; Li, P.; Ma, Y.; Vanapalli, S.; Wang, X. Change in pore-size distribution of collapsible loess due to loading and inundating. Acta Geotech. 2020, 15, 1081–1094. [Google Scholar] [CrossRef]
  12. Wang, X.Z.; Weng, Y.L.; Wei, H.Z.; Meng, Q.S.; Hu, M.J. Particle obstruction and crushing of dredged calcareous soil in the Nansha Islands, South China Sea. Eng. Geol. 2019, 261, 105274. [Google Scholar] [CrossRef]
  13. Wu, Y.; Li, N.; Wang, X.Z.; Cui, J.; Chen, Y.L.; Wu, Y.H.; Yamamoto, H. Experimental investigation on mechanical behavior and particle crushing of calcareous sand retrieved from South China Sea. Eng. Geol. 2021, 280, 105932. [Google Scholar] [CrossRef]
  14. Cao, Z.; Chen, J.; Ye, X.; Gu, C.; Guo, Z.; Cai, Y. Experimental study on particle breakage of carbonate gravels under cyclic loadings through large-scale triaxial tests. Transp. Geotech. 2021, 30, 100632. [Google Scholar] [CrossRef]
  15. Donohue, S.; O’sullivan, C.; Long, M. Particle breakage during cyclic triaxial loading of a carbonate sand. Géotechnique 2009, 59, 477–482. [Google Scholar] [CrossRef]
  16. Gao, Q.-F.; Jrad, M.; Hattab, M.; Fleureau, J.-M.; Ighil Ameur, L. Pore Morphology, Porosity, and Pore Size Distribution in Kaolinitic Remolded Clays under Triaxial Loading. Int. J. Geomech. 2020, 20, 04020057. [Google Scholar] [CrossRef]
  17. Li, Y.; Zhang, H.; Huang, M.; Yin, H.; Jiang, K.; Xiao, K.; Tang, S. Influence of Different Alkali Sulfates on the Shrinkage, Hydration, Pore Structure, Fractal Dimension and Microstructure of Low-Heat Portland Cement, Medium-Heat Portland Cement and Ordinary Portland Cement. Fractal Fract. 2021, 5, 79. [Google Scholar] [CrossRef]
  18. Fujikura, Y. Estimation of Permeability for Sand and Gravel Based on Pore-Size Distribution Model. J. Mater. Civ. Eng. 2019, 31, 04019289. [Google Scholar] [CrossRef]
  19. Gao, Q.-F.; Zhao, D.; Zeng, L.; Dong, H. A Pore Size Distribution-based Microscopic Model for Evaluating the Permeability of Clay. KSCE J. Civ. Eng. 2019, 23, 5002–5011. [Google Scholar] [CrossRef]
  20. Romero, E.; Gens, A.; Lloret, A. Water permeability, water retention and microstructure of unsaturated compacted Boom clay. Eng. Geol. 1999, 54, 117–127. [Google Scholar] [CrossRef]
  21. Tang, S.; Wang, Y.; Geng, Z.; Xu, X.; Yu, W.; Hubao, A.; Chen, J. Structure, Fractality, Mechanics and Durability of Calcium Silicate Hydrates. Fractal Fract. 2021, 5, 47. [Google Scholar] [CrossRef]
  22. Ullah, A.S.; D’Addona, D.M.; Seto, Y.; Yonehara, S.; Kubo, A. Utilizing Fractals for Modeling and 3D Printing of Porous Structures. Fractal Fract. 2021, 5, 40. [Google Scholar] [CrossRef]
  23. Feng, S.; Xu, Z.; Chai, J.; Li, Y. Using pore size distribution and porosity to estimate particle size distribution by nuclear magnetic resonance. Soils Found. 2020, 60, 1011–1019. [Google Scholar] [CrossRef]
  24. Griffiths, F.; Joshi, R. Discussion: Change in pore size distribution due to consolidation of clays. Geotechnique 1990, 40, 303–309. [Google Scholar] [CrossRef]
  25. Kong, B.; Xia, F.; Yu, B.; Xia, T.; Ding, Z. Pore Size Changes in Marine Soft Soil under Various Freezing Conditions. J. Mar. Sci. Eng. 2020, 8, 170. [Google Scholar] [CrossRef] [Green Version]
  26. Li, X.; Zhang, L. Characterization of dual-structure pore-size distribution of soil. Can. Geotech. J. 2009, 46, 129–141. [Google Scholar] [CrossRef] [Green Version]
  27. Mukunoki, T.; Miyata, Y.; Mikami, K.; Shiota, E. X-ray CT analysis of pore structure in sand. Solid Earth 2016, 7, 929–942. [Google Scholar] [CrossRef] [Green Version]
  28. Cai, Y.Q.; Hao, B.B.; Gu, C.; Wang, J.; Pan, L.Y. Effect of anisotropic consolidation stress paths on the undrained shear behavior of reconstituted Wenzhou clay. Eng. Geol. 2018, 242, 23–33. [Google Scholar] [CrossRef]
  29. Tang, l.; Song, Y.; Jiang, Z.; Jiang, S.; Li, Q. Pore Structure and Fractal Characteristics of Distinct Thermally Mature Shales. Energy Fuels 2019, 33, 5116–5128. [Google Scholar] [CrossRef]
  30. Yao, Y.; Liu, D.; Tang, D.; Tang, S.; Huang, W. Fractal characterization of adsorption-pores of coals from North China: An investigation on CH4 adsorption capacity of coals. Int. J. Coal Geol. 2008, 73, 27–42. [Google Scholar] [CrossRef]
  31. Sun, Y.; Gao, Y.; Zhu, Q. Fractional Order Plasticity Modelling of State-Dependent Behaviour of Granular Soils without Using Plastic Potential. Int. J. Plast. 2018, 102, 53–69. [Google Scholar] [CrossRef]
  32. Sun, Y.; Sumelka, W. Multiaxial stress-fractional plasticity model for anisotropically overconsolidated clay. Int. J. Mech. Sci. 2021, 205, 106598. [Google Scholar] [CrossRef]
  33. Shao, X.; Pang, X.; Li, H.; Zhang, X. Fractal Analysis of Pore Network in Tight Gas Sandstones Using NMR Method: A Case Study from the Ordos Basin, China. Energy Fuels 2017, 31, 10358–10368. [Google Scholar] [CrossRef]
  34. Sun, W.; Zuo, Y.; Zhonghu, W.; Liu, H.; Xi, S.; Shui, Y.; Wang, J.; Liu, R.; Lin, J. Fractal analysis of pores and the pore structure of the Lower Cambrian Niutitang shale in northern Guizhou province: Investigations using NMR, SEM and image analyses. Mar. Pet. Geol. 2018, 99, 416–428. [Google Scholar] [CrossRef]
  35. Li, A.; Ding, W.; Jiu, K.; Wang, Z.; Wang, R.; He, J. Investigation of the pore structures and fractal characteristics of marine shale reservoirs using NMR experiments and image analyses: A case study of the Lower Cambrian Niutitang Formation in northern Guizhou Province, South China. Mar. Pet. Geol. 2017, 89, 530–540. [Google Scholar] [CrossRef]
  36. Gao, Y.; Zhang, N.; Li, D.; Liu, H.; Cai, Y.; Wu, Y. Effects of Topographic Amplification Induced by a U-Shaped Canyon on Seismic Waves. Bull. Seismol. Soc. Am. 2012, 102, 1748–1763. [Google Scholar] [CrossRef]
  37. Gao, Y.; Wu, Y.; Li, D.; Liu, H.; Zhang, N. An improved approximation for the spectral representation method in the simulation of spatially varying ground motions. Probabilistic Eng. Mech. 2012, 29, 7–15. [Google Scholar] [CrossRef]
  38. Zhang, N.; Gao, Y.; Cai, Y.; Li, D.; Wu, Y. Scattering of SH waves induced by a non-symmetrical V-shaped canyon. Geophys. J. Int. 2012, 191, 243–256. [Google Scholar] [CrossRef] [Green Version]
  39. Jafarian, Y.; Javdanian, H. Small-strain dynamic properties of siliceous-carbonate sand under stress anisotropy. Soil Dyn. Earthq. Eng. 2020, 131, 106045. [Google Scholar] [CrossRef]
  40. Tian, H.; Wei, C.; Wei, H.; Yan, R.; Chen, P. An NMR-Based Analysis of Soil–Water Characteristics. Appl. Magn. Reson. 2013, 45, 49–61. [Google Scholar] [CrossRef]
  41. Zhou, S.; Liu, D.; Cai, Y.; Yao, Y. Fractal characterization of pore–fracture in low-rank coals using a low-field NMR relaxation method. Fuel 2016, 181, 218–226. [Google Scholar] [CrossRef]
  42. Turcotte, D.L. Fractals and fragmentation. J. Geophys. Res. Atmos. 1986, 91, 1921–1926. [Google Scholar] [CrossRef]
  43. Tyler, S.; Wheatcraft, S. Fractal Scaling of Soil Particle-Size Distributions: Analysis and Limitations. Soil Sci. Soc. Am. J. 1992, 56, 362–369. [Google Scholar] [CrossRef]
  44. Liang, Z.K.; Li, Z.; Jiang, Z.X.; Gao, F.L.; Zhang, Y.H.; Xiao, L.; Yang, Y.D.; Hou, Y.F.; Wang, L.W. Characteristics of pore structure and fractal dimension in continental shale based on NMR experiments and SEM image analyses—A case study of Shahezi formation shale in Changling fault depression of Songliao Basin, China. J. Earth Sci. Environ. 2020, 42, 313–328. [Google Scholar]
  45. Huang, Y.; Zhang, P.; Zhang, J.; Tang, X.; Liu, C.; Yang, J. Fractal Characteristics of Pores in the Longtan Shales of Guizhou, Southwest China. Geofluids 2020, 2020, 8834758. [Google Scholar] [CrossRef]
  46. Dou, W.; Liu, L.; Jia, L.; Xu, Z.; Wang, M.; Du, C. Pore structure, fractal characteristics and permeability prediction of tight sandstones: A case study from Yanchang Formation, Ordos Basin, China. Mar. Pet. Geol. 2021, 123, 104737. [Google Scholar] [CrossRef]
  47. Kong, L.; Ostadhassan, M.; Liu, B.; Li, C.; Liu, K. Multifractal Characteristics of MIP-Based Pore Size Distribution of 3D-Printed Powder-Based Rocks: A Study of Post-Processing Effect. Transp. Porous Media 2019, 129, 599–618. [Google Scholar] [CrossRef]
Figure 1. Photographs of the tested materials: (a) Calcareous sand; (b) Quartz sand; (c) Glass bead.
Fractalfract 05 00152 g001
Figure 2. SEM images of calcareous sand and quartz sand: (a) Calcareous sand; (b) Quartz sand.
Fractalfract 05 00152 g002
Figure 3. Photograph of the NMR device.
Fractalfract 05 00152 g003
Figure 4. Photograph of the tested specimens.
Fractalfract 05 00152 g004
Figure 5. Schematic diagram of the changes in the longitudinal and transverse components in the relaxation process: (a) Longitudinal components; (b) Transverse components.
Fractalfract 05 00152 g005
Figure 6. Pore size distribution of the tested materials with different grain sizes: (a) Calcareous sand; (b) Quartz sand; (c) Glass bead.
Fractalfract 05 00152 g006aFractalfract 05 00152 g006b
Figure 7. Differences in the pore size distribution of tested materials: (a) Calcareous sand; (b) Quartz sand; (c) Glass bead.
Fractalfract 05 00152 g007aFractalfract 05 00152 g007b
Figure 8. Determination of fractal dimension of calcareous sand with different grain sizes: (a) 0.1–0.25 mm; (b) 0.5–0.71 mm; (c) 0.71–1 mm; (d) 0.1–0.25 mm; (e) 2–3 mm; (f) >5 mm.
Fractalfract 05 00152 g008
Figure 9. Determination of fractal dimension of quartz sand with different grain sizes: (a) 0.1–0.25 mm; (b) 0.5–0.71 mm; (c) 1–2 mm.
Fractalfract 05 00152 g009
Figure 10. Determination of fractal dimension of glass bead with different grain sizes: (a) 0.5–0.71 mm; (b) 0.71–1 mm; (c) 1–2 mm; (d) 2–3 mm.
Fractalfract 05 00152 g010
Figure 11. Fractal dimensions of the tested materials with different grain sizes.
Fractalfract 05 00152 g011
Table 1. Test program of this study.
No.MaterialGrain Size (mm)Void Ratio
C-D-1Calcareous sand0.1–0.251.143
C-D-2 0.5–0.711.142
C-D-3 0.71–11.146
C-D-4 1–21.145
C-D-5 2–31.144
C-D-6 >51.143
S-D-1Quartz sand0.1–0.250.507
S-D-2 0.5–0.710.508
S-D-3 1–20.509
G-D-1Glass sand0.5–0.710.631
G-D-2 0.71–1.00.630
G-D-3 1–20.632
G-D-4 2–30.633
Table 2. Summaries of model parameters for carbonate-based sand and silicate-based sand.
ParameterCalcareous SandQuartz SandGlass Bead
α2.6892.7612.762
β0.01220.02760.00524
Publisher’s Note: MDPI stays neutral with regard to jurisdictional claims in published maps and institutional affiliations.

