Article

Highly Sensitive and Selective Hydrogen Gas Sensor with Humidity Tolerance Using Pd-Capped SnO2 Thin Films of Various Thicknesses

1
Smart Materials and Sensor Laboratory, Department of Physics, CCS University Campus Meerut, Meerut 250004, India
2
Institute Instrumentation Centre, Indian Institute of Technology Roorkee, Roorkee 247667, India
3
Department of Physics, Graphic Era (Deemed to Be University), Dehradun 248002, India
*
Authors to whom correspondence should be addressed.
Submission received: 19 April 2023 / Revised: 9 May 2023 / Accepted: 20 June 2023 / Published: 6 July 2023
(This article belongs to the Special Issue Clean and Renewable Hydrogen Fuel)

Abstract

:
Detecting and identifying hydrogen gas leakage before a potential disaster is a critical safety concern. To address this issue, a low-cost and simple-design sensor is required with high response and fast sensing time, capable of detecting hydrogen gas even at low concentrations of 5–500 ppm. This study investigates the use of magnetron-sputtered SnO2 thin films with palladium as a catalytic layer to achieve better sensing output. The developed Pd-caped SnO2 thin film sensors showed increased sensitivity with increasing thickness, up to 246.1 nm at an operating temperature of 250 °C. The sensor with a thickness of 246.1 nm exhibited excellent selectivity for H2 gas, even in humid conditions, and was able to distinguish it from other gases such as CO, NH3, and NO2. The sensor demonstrated high response (99%) with a response/recovery time of 58 s/35 s for (5–500 ppm) hydrogen gas. The sensor showed linear response to H2 gas concentration variation (5–500 ppm) at 250 °C. The sensor was found to be mechanically stable even after 60 days in a high-humidity environment. The LOD of sensor was 151.6 ppb, making it a suitable candidate for applied sensing applications. The Pd-caped SnO2 thin film sensor with thickness of ~245 nm could potentially improve the safety of hydrogen gas handling.

1. Introduction

The operation of resistive sensors is based on the resistance variation due to adsorption or desorption of gas molecules in nanostructured metal oxide semiconductors. These sensors are simple, low-cost, and effective for detecting the leakage of various gases [1]. The gas sensing mechanism is primarily based on surface-controlled oxidation and reduction properties, and various parameters like porosity, voids, grain size, stoichiometry, structure, and surface morphology in thin films affect the sensing properties [2,3,4]. Nanomaterials such as nanowires, nanotubes, and nanorod-based gas sensors can be highly sensitive and suitable for commercialization. However, the mass production of these sensors is constrained due to limited low-cost fabrication techniques [5]. Sanjay Kumar et al.’s utilized pure ZnO, and Pt nanoparticles loaded ZnO pencil-like microstructures for H2 gas sensing at low temperature, but the sensor fabrication takes longer time and not suitable for industrial purpose [6]. Thin film nanostructures are mostly investigated for gas sensing due to their improved surface properties, simple configuration/design, and scalable fabrication for commercialization. The most investigated nanostructures for gas sensing are the thin film form because of their simple design, configuration, and scalable fabrication for commercialization.
The size and magnitude of the increment of the sensor response depend on the variation in thin film thickness. Salman Ali et al. focused on the ribbon-like morphology and thickness variation based on organic materials based on hydrazine and ammonia gas sensors [7]. The importance of optimizing the porosity and thickness of the sensing layer of oxide semiconductors for improved selectivity and durability has been reported by Yamazoe et al. [8]. The variation of sensor response with the thickness of films has also been explained by X. Du and George. The lower sensor response was found for films thicker than Debye length due to the space charge region over the film [9]. J. Klober et al. [10] showed that the gas sensitivity of thin film sensors for hydrogen detection exhibits a maximum at about 30–45 nm thickness and palladium concentration due to changes in the Debye length. Bruno et al. [11] reported that for SnO2 thin films, there is an optimal thickness at which the gas sensor response is the highest. Specifically, when the film thickness is much larger than the size of the grains within the film, the gas sensor response increases. However, when the film thickness is lower than the size of the grains, the gas sensor response decreases. H. Xie et al. have shown that the ZnO-modified graphene sensor’s sensitivity decreases in response to an increase in the thickness of ZnO film [12]. Abdelghaffar Nasri et al. [13] reported many organic semiconductors and other organic materials that have been used as the sensing layer. The layers are deposited with SnO2, MoS2 and materials such as polyvinylpyrrolidone (PNVP), polyimide (PI), polypyrrole/nitrogen-doped MWCNTs (PPy/NMWCNT), PANI, cellulose, nanocellulose, and CNTs or graphene because they have unique properties for selectivity and stability of sensors [13].
The stoichiometry of elements helps to improve gas sensing. Yulin Kong et al. shows how SnO2 nanostructure affect the gas-sensing properties of adsorbed oxygen [14]. W. Izydorczyk et al. stated that sensor selectivity and sensitivity can be modified by adding noble elements to the sensor material in small quantities [15]. Furthermore, it is also noted that the performance of gas sensors based on two or more components is typically much better than single-component sensors which is reported by Zhang et al. [16].
There are two ways to improve gas-sensing performance: synergistic effects and heterojunction interactions between two components [17]. Heterojunction interactions between oxide/oxide are particularly effective in improving gas sensor performance, resulting in an excellent response and selectivity [18]. Palladium oxide (PdOx) can be used for the selective detection of H2, as it reacts with H2 to form PdHx, which can lead to high selectivity [19].
Moreover, studies have shown that some gas-sensing layers can work well even in humid atmospheres. For instance, Kwak et al. demonstrated that a Terbium-doped SnO2 sensor was humidity independent and worked well in wet humidity [20]. However, the response of gas sensors can be affected by humidity.
In some cases, the sensor response is reduced with increasing humidity. For example, undoped SnO2 nanoparticles exhibit a reduced sensor response with increasing humidity due to increasing hydroxyl poisoning [21]. Guo et al. fabricated Bi @ rGO/SnO2-based benzene sensors and observed a three times reduction in the sensing response without humidity [22]. Z. Wang et al. have also reported a 20% reduction in the sensor response of Pd-SnO2-rGO-based NO2 sensors in the presence of 80% RH [23].
Overall, the studies suggest that the development of gas sensors with improved selectivity and response in humid environments can be achieved by optimizing the composition and design of the sensing material, as well as the operating conditions. Kumar et al. [24] synthesized hydrophobic poly (methyl methacrylate) (PMMA) coatings that showed changes in electrical response to H2 gas at room temperature under different humidity conditions. They found that the sensor response was better in the presence of moisture, particularly at higher humidity levels (65%) [24].
We have developed a process for making H2 gas sensors with high sensitivity, stability, and selectivity, as well as high tolerance to humidity, using Pd-capped SnO2 thin films. Our technique involves depositing Pd-SnO2 thin films onto glass substrates using the RF-reactive magnetron-sputtering method. By incorporating Pd as a capping layer, we were able to improve the H2 gas sensing performance of the SnO2 thin films, resulting in enhanced selectivity of the sensor, particularly in humid environments.
To further investigate the hydrogen gas sensing capabilities of the Pd-caped SnO2 film sensors, we studied three different film thicknesses of SnO2: L1 (146.5 nm), L2 (246.1 nm), and L3 (357.4 nm). Our analysis revealed the sensing characteristics and the mechanisms responsible for the enhanced sensor performance.

2. Experimental

2.1. Fabrication of Sensing Materials

The sensing material was fabricated on a cleaned glass substrate using an RF-sputtering technique. The Tin Oxide (SnO2) and Palladium (Pd) targets were used to prepare the sensing material, and both targets were 2 inches in diameter and 3 mm in thickness. The purity of the targets was 99.99%. The gases used in the process were Argon (Ar) and Oxygen (O2) synthetic air, Hydrogen (H2), Nitric oxide (NO2), Ammonia (NH3), and Carbon monoxide (CO), all 99.99% pure. Before the fabrication process, the glass substrates were cleaned with laboratory reagent and ultrasonically cleaned for 30 min at 50 °C temperature and dried at 100 °C for 20 min.
The substrates were then kept in the sputtering chamber at a distance of 5 cm from the targets. The sputtering chamber was initially pumped up to a base pressure of 7 × 10⁻⁵ mbar using the turbo molecular pump (TMP) and rotary pump. During the deposition process of SnO2, the pressure of the sputtering chamber was kept constant at 5 × 10⁻³ mbar at a constant flow of Ar (30 sccm) and O2 (10 sccm) gases using mass flow controllers (MFC). All sensors were fabricated at a substrate temperature of 450 °C and applied 100 W (RF) power with varying deposited time (5, 10, and 15 min) for each sensor, i.e., L1, L2, and L3, respectively. During the Pd deposition process, we have taken the same parameters of sputtering except deposition of 3 s for each sensor with 30 W (DC) sputtering power without any oxidized atmosphere at the same 450 °C temperature.

2.2. Characterization

X-ray diffraction (XRD) was used to confirm the crystal structure of the SnO2 thin film sensors. The XRD measurements were conducted using a Bruker AXS D8 advance instrument with CuKα radiation (k = 1.5418 Å) and (θ–2θ) geometry. The surface topography of the sensors was analyzed using atomic force microscopy (AFM) with an NT-MDT, NTEGRA instrument. The stoichiometry of the fabricated sensors was analyzed using energy=dispersive X-ray analysis (EDAX). The optical properties of the sensors were investigated using double-beam UV-Vis spectroscopy with a wavelength range of 300–600 nm. The composition and bonding characteristics of the SnO2 thin film were studied using X-ray photoelectron spectroscopy (XPS) with a Perkin Elmer, 1257 instrument.

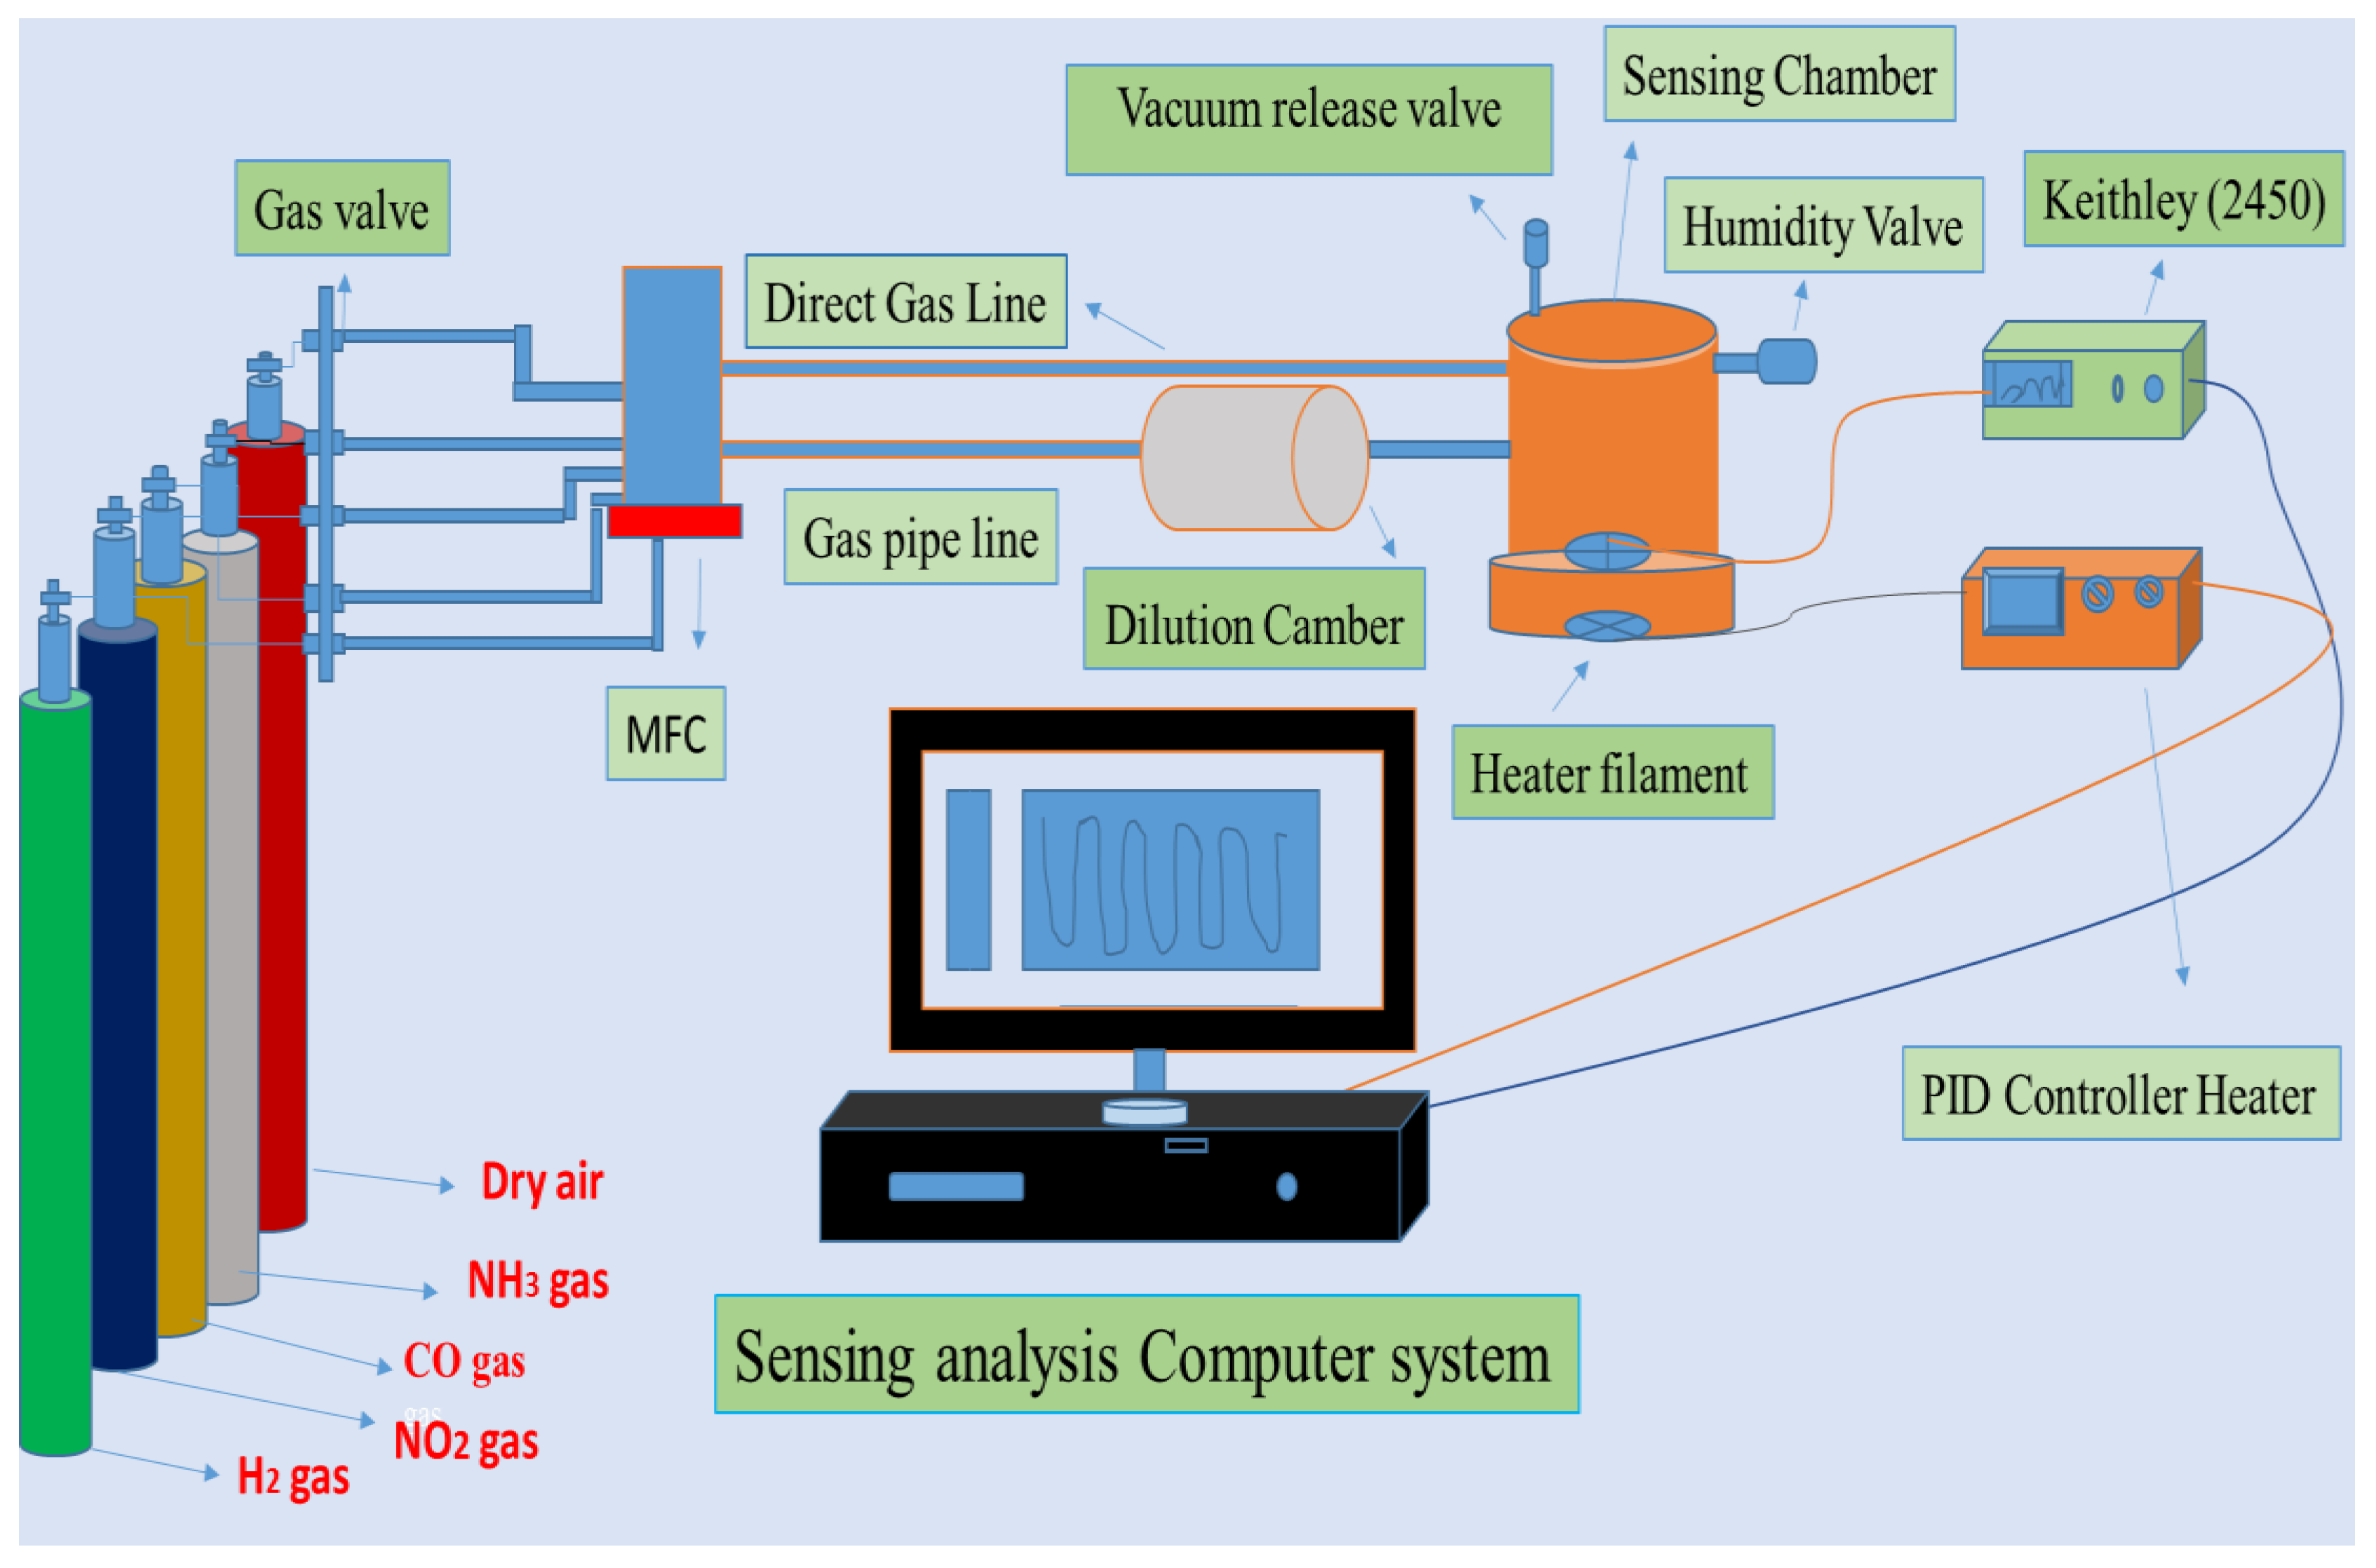
2.3. Gas Sensing Setup

The gas sensing measurements were carried out in a custom build setup made by Excel Instruments, Mumbai, India. The setup included a PID controller for temperature control. Before the sensing test, the silver paste was applied on the surface of the H2 gas sensors as electrodes. The sensing chamber was evacuated to 6 mbar using a rotary pump. The gas flow rates were controlled by mass flow controllers (MFCs) and the mixed ratio of high-purity H2 gas (balance N2) and synthetic air was adjusted. The gases were diluted in a dilution chamber (1-L capacity) and controlled by an Alicat Scientific MFC in the sensing chamber. The electrical response of the sensors was monitored using a current source meter and nano voltmeter (Keithley 2450) with either of the two probes as shown in Figure 1. Humidity was introduced into the sensing chamber by a humidity valve attached to an external chamber (1-L capacity) and was analyzed by a humidity meter (% RH).

3. Results and Discussion

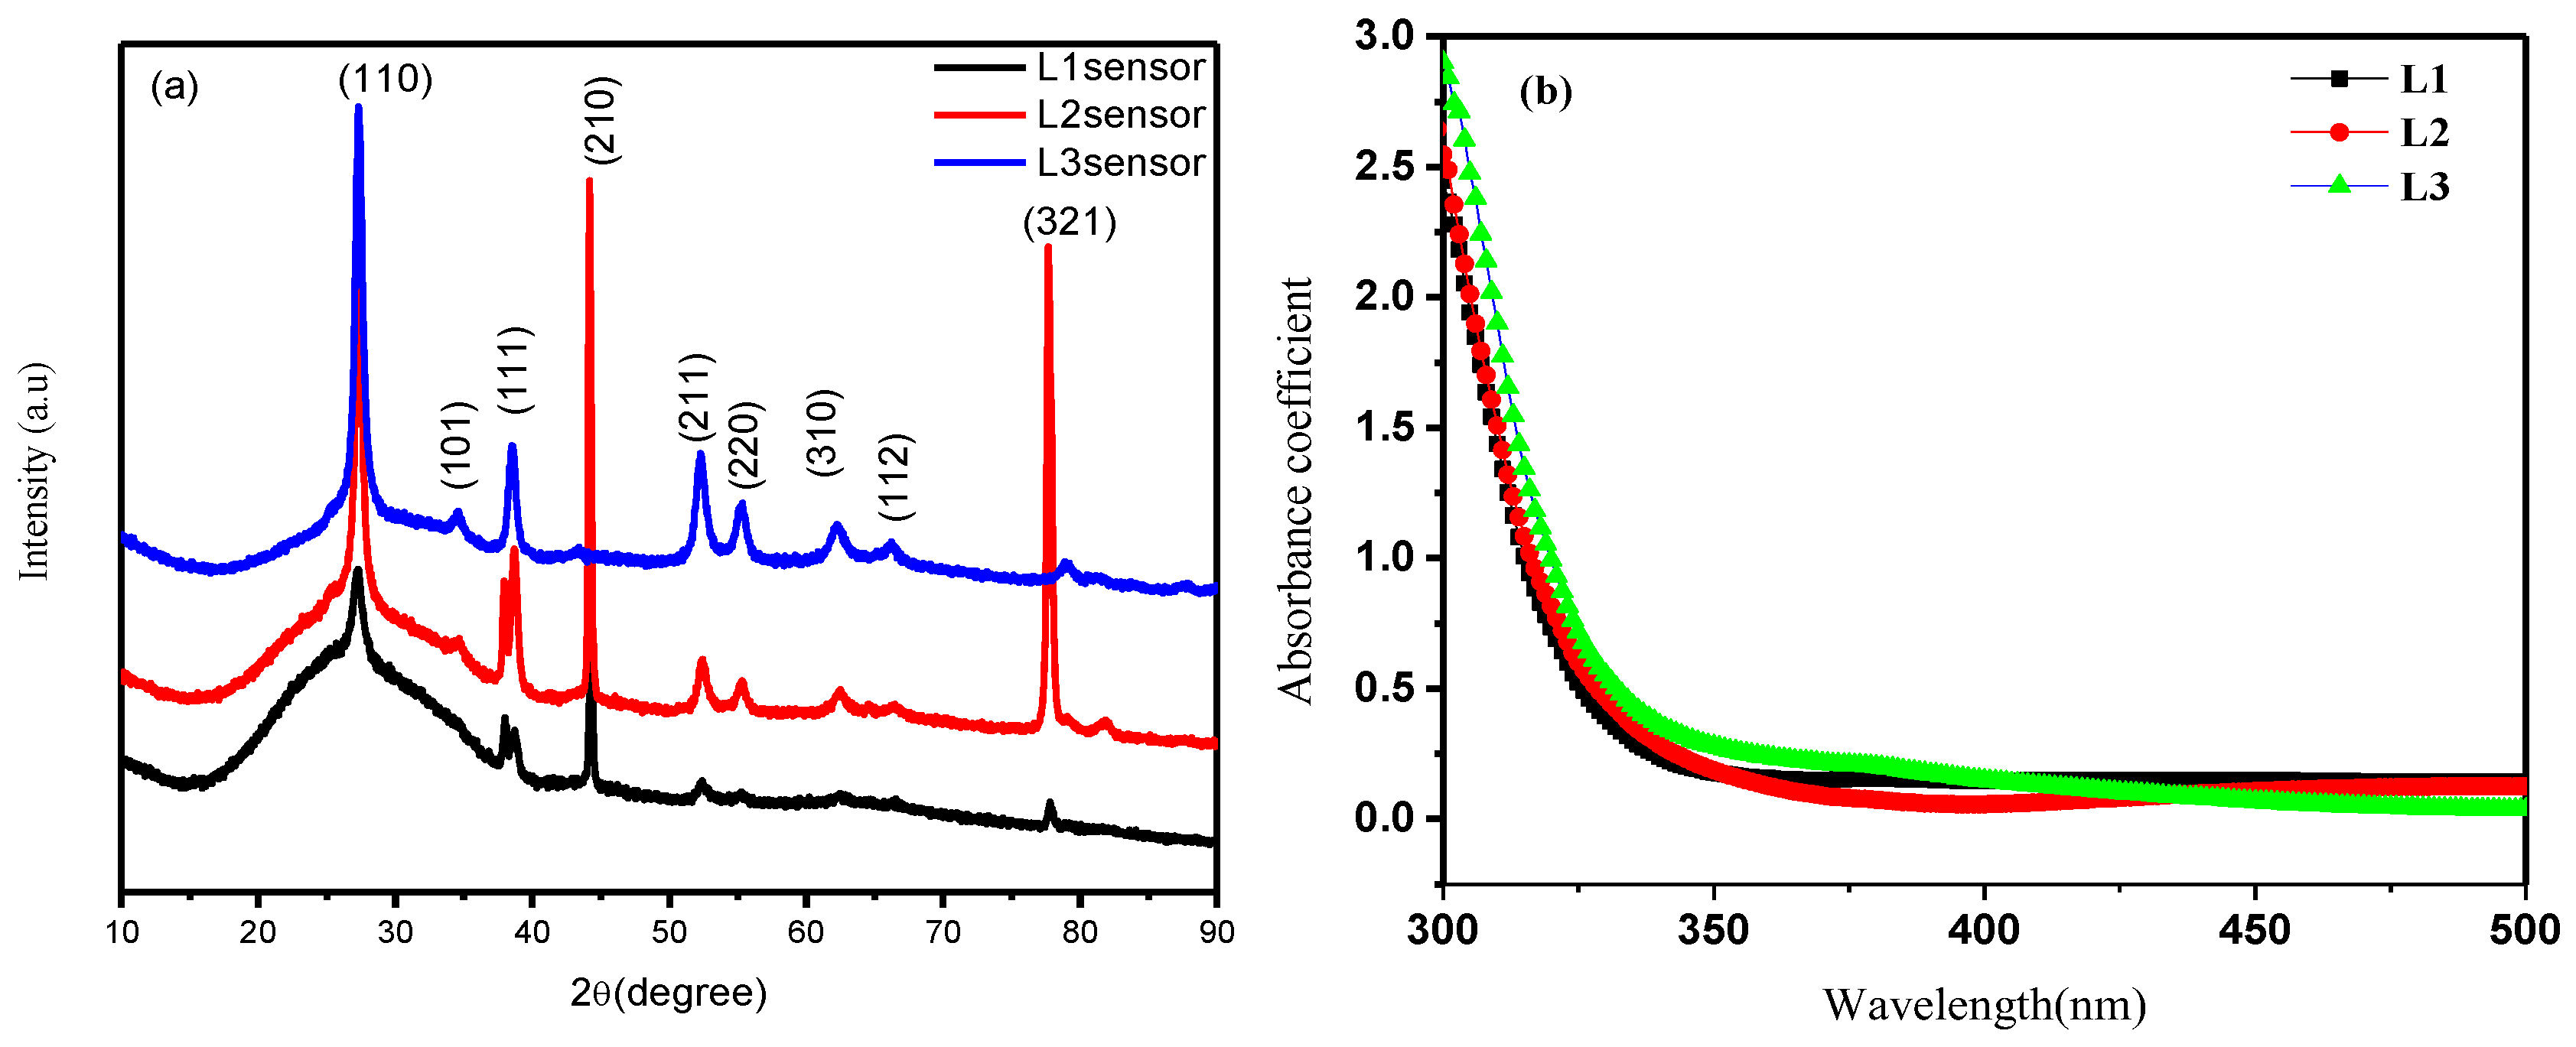
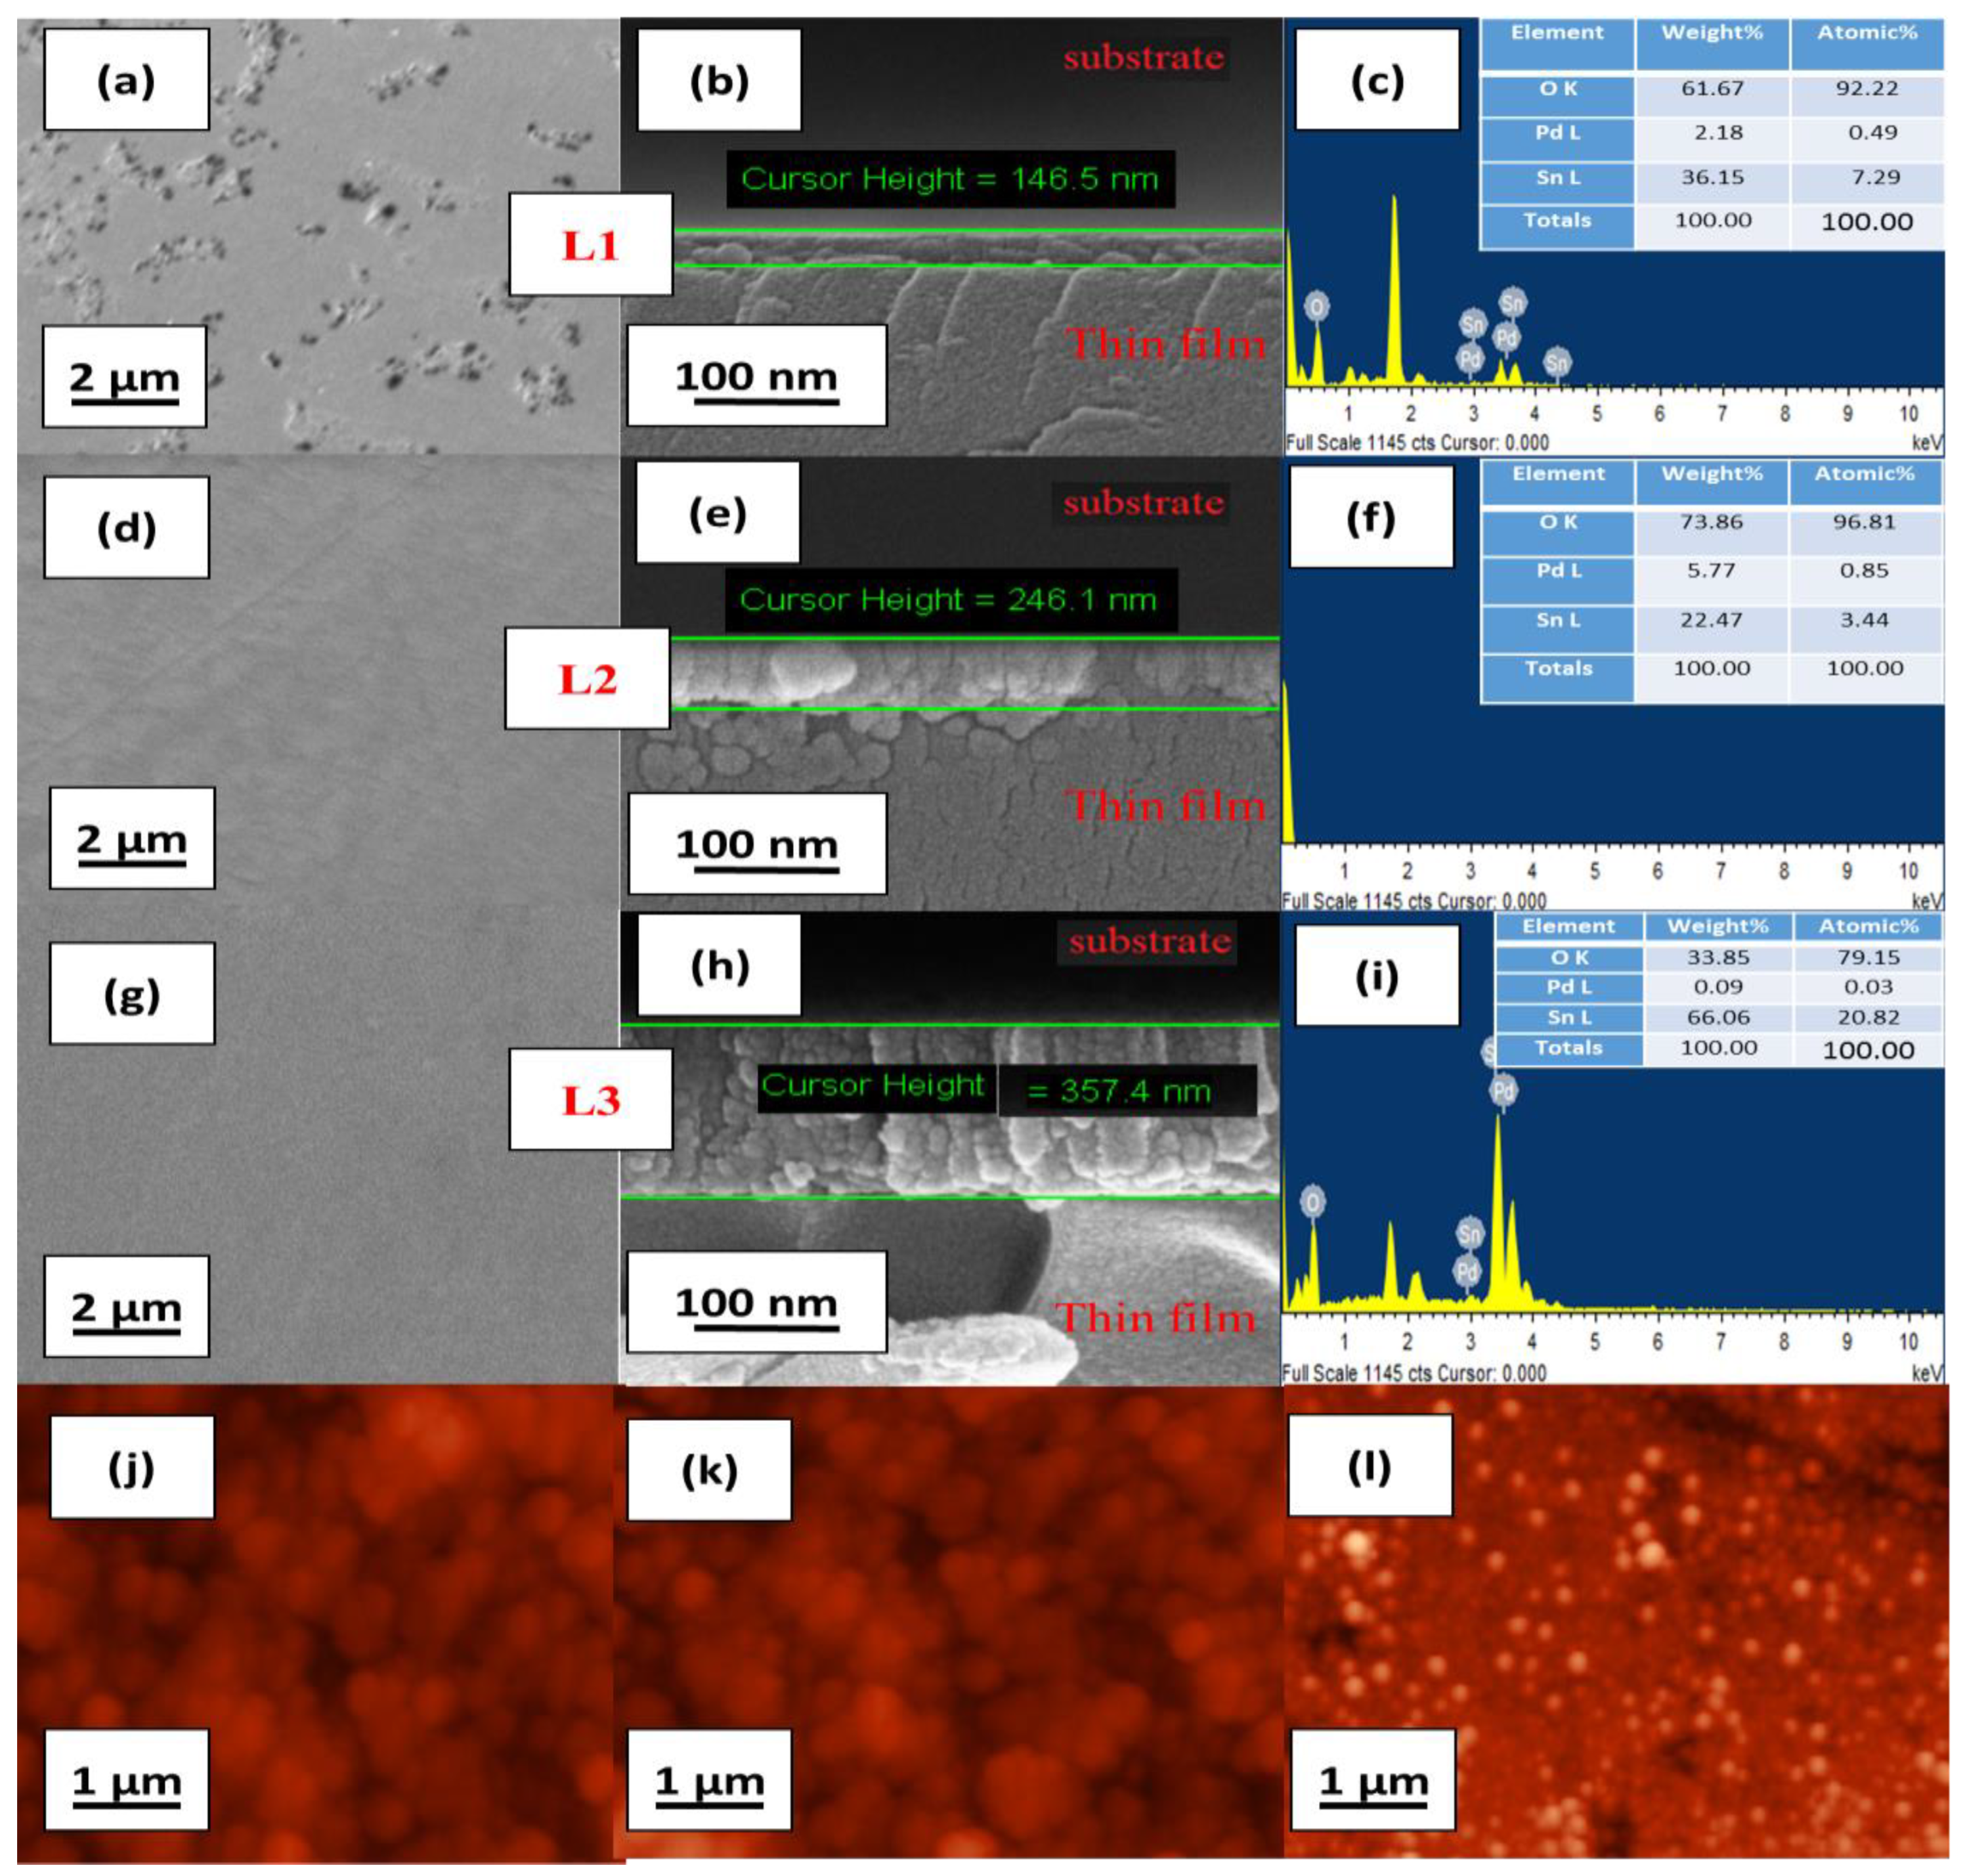
3.1. Structural, Optical, Morphology, Stoichiometry and Topography Analysis
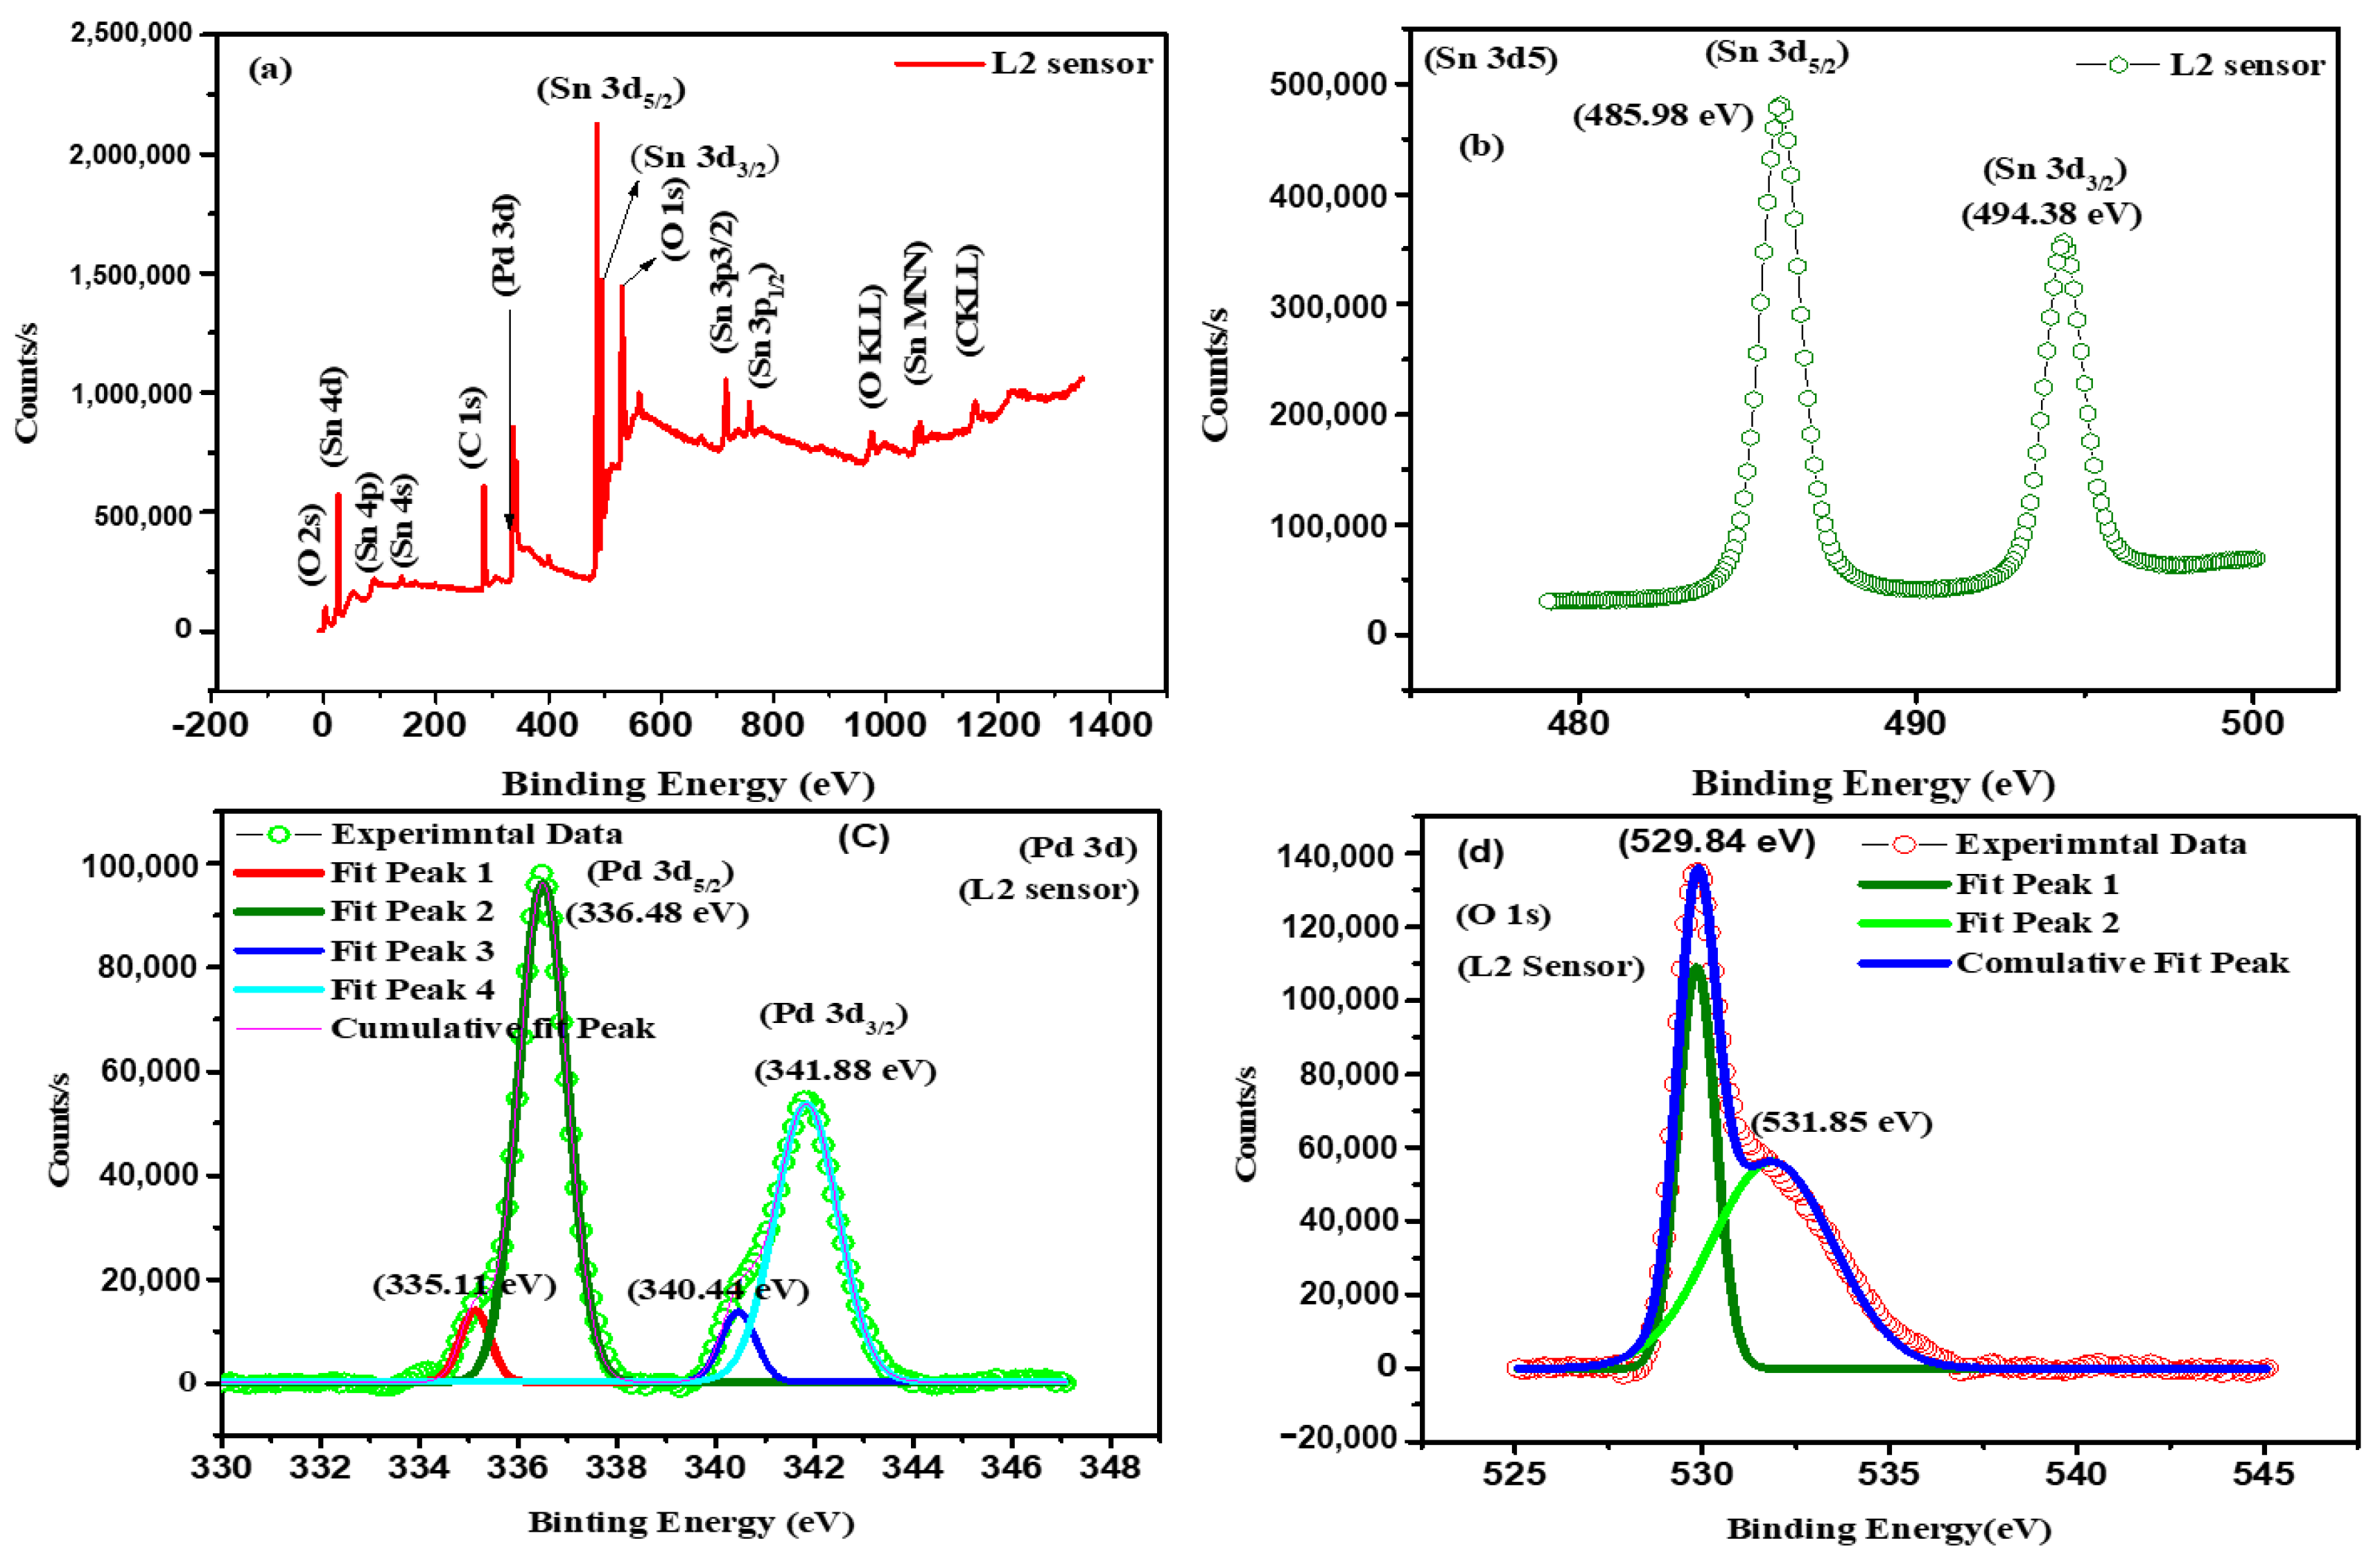
In Figure 2a, the XRD patterns demonstrate the tetragonal phase of SnO2, revealing the (110), (111), and (211) planes at 27.36, 38.8, and 52.46, respectively (JCPDS ICDD no. 41-1445 [25]). The XRD patterns of the L1 sensor exhibit low-intensity peaks, while the XRD patterns of the L2 and L3 thin film sensors display high-intensity peaks including (101) and (112). The crystallite size of the thin films was calculated using the Scherrer formula, indicating an increase in crystallite size with increasing film thickness up to 357.4 nm [26,27]. Additionally, the micro-strain decreased with increased film thickness, indicating an improvement in the film’s crystallinity [28]. The XRD pattern in Figure 2a did not reveal the Pd peak [29], indicating a very low crystallinity content.
To determine the energy band gap of the Pd caped SnO2 thin films, we used the Tauc relation and optical absorption spectra. The relation αhʋ = A (αh − Eg)n was applied, where hʋ represents photon energy, α represents the absorption coefficient, Eg represents the optical energy band gap, A is a constant, and the exponent n depends on the nature of the optical transition, with n = ½ for direct allowed transitions [30,31]. We found that the optical band gap of the Pd caped SnO2 thin films ranges from 3.91 to 3.78 eV. For more detailed information regarding the crystallite sizes, lattice parameters, micro strain, and dislocation densities of the thin films, please refer to Table 1.
Figure 3 displays FE-SEM images of the Pd-caped SnO2 samples with varying thicknesses, taken at a scale of 2 μm. The top-view image illustrates a clear and well-defined sensing area, while the high-magnification SEM image reveals the uniformity of the thin films. Due to the polycrystalline nature of the oxide, the Pd-caped SnO2 thin films possess high porosity, which is a result of using the sputtering deposition method. Notably, no cracks were observed in the thin films as seen in the SEM images of the top surface. Figure 3 also presents the cross-sectional thicknesses of L1, L2, and L3 sensing films. The Pd-decorated SnO2 thin films on the glass substrate measure 146.5 nm, 246.1 nm, and 357.4 nm, respectively.
To verify the presence of Pd, Sn, and Oxygen in the thin films, we utilized EDAX analysis. The inset of Figure 3 presents the EDAX images of L1, L2, and L3 thin film sensors, which confirms a non-stoichiometric composition of Tin and Oxygen in SnO2 thin film. The 2D-AFM (atomic force microscopy) topography shows that the Pd-caped SnO2 thin films have a uniform surface, free of any wrinkles or cluster pinholes.
The AFM micrographs of L1, L2, and L3 sensors indicate that the SnO2 thin films consist of ellipsoid-shaped particles with different sizes, forming a nano-granular morphology that fully extends over the substrates [26,32]. The root mean square surface roughness (δrms) of the sensing material was evaluated using AFM images, as shown in Figure 3j,k,l, and the results demonstrate a decrease in roughness as the thickness of the thin film sensors increases, as indicated in Table 1. These AFM results further confirm that the thin films possess a highly dense structure and a uniform distribution of grains. The RMS values of L1, L2, and L3 sensors are also listed in Table 1.

3.2. XPS Analysis

X-ray photoelectron spectroscopy (XPS) was employed to confirm the presence of Pd in the Pd-caped SnO2 thin film (L2 sensor) by analyzing the surface compositions and chemical states of the elements in the as-deposited film. The spectra of Sn, Pd, and O are shown in Figure 4. The XPS survey spectra in Figure 4a revealed signals for Sn 3d, O 1s, C 1s, Sn 3s, Sn 3p, Sn 4d, and Sn 4s. The C1s peak at 284.48 eV was used as a reference for the other XPS peaks. During sputtering, the Sn (MNN) stable intensity and O (KLL) signals were clearly visible, reflecting the analytical results at various depths of the sample within the tin oxide layer. The peak spectrum of Sn 3d5/2 at 485.98 eV and 3d3/2 at 494.38 eV were observed, and the binding energies of the peaks were consistent with Sn4+ species, confirming the formation of SnO2 thin film. The difference between the binding energy of Sn 3d3/2 and Sn 3d5/2 was 8.4 eV, confirming the oxidation state of Sn (IV), as reported in the literature [33].
Pd 3d5/2 (336.48 eV) and Pd 3d3/2 (341.88 eV) peaks were observed, indicating the presence of Pd (IV). Another couple of Pd 3d5/2 (335.8 eV) and Pd 3d3/2 (340.44 eV) were assigned to oxygen-chemisorbed Pd (Pd-Oab) in the prepared sensor (L2), as shown in Figure 4c [34,35]. This indicates that the PdOx and Pd-Oab species formed at the surface of the Pd atoms are connected with the oxidation of Pd. The Pd-Oab and PdO2 arise as Pd atoms at the outer surface, which are highly exposed to ambient air and water [36]. This XPS analysis revealed that the majority of Pd atoms are present as PdO and Pd metal species at the surface and form a heterostructure with SnO2 thin films [36,37].
The XPS high-resolution spectra of the O 1s region (Figure 4d) consist of an asymmetrical peak, which was deconvoluted into two peaks indexed to O 1s [38]. One of them, centered at 529.84 eV, corresponds to oxygen, while the other peak, having a higher binding energy (531.85 eV), is ascribed to the adsorbed oxygen bonded to the material’s surface, which plays a vital role in the sensing mechanism [38].
The ratio of atomic% of [O]/[Sn] = 1.3 indicated a non-stoichiometric composition in sensor L2 [15], and the atomic % of Pd 3d, Sn 3d, and O 1s were obtained as 7.76%, 10.89%, and 14.2%, respectively.

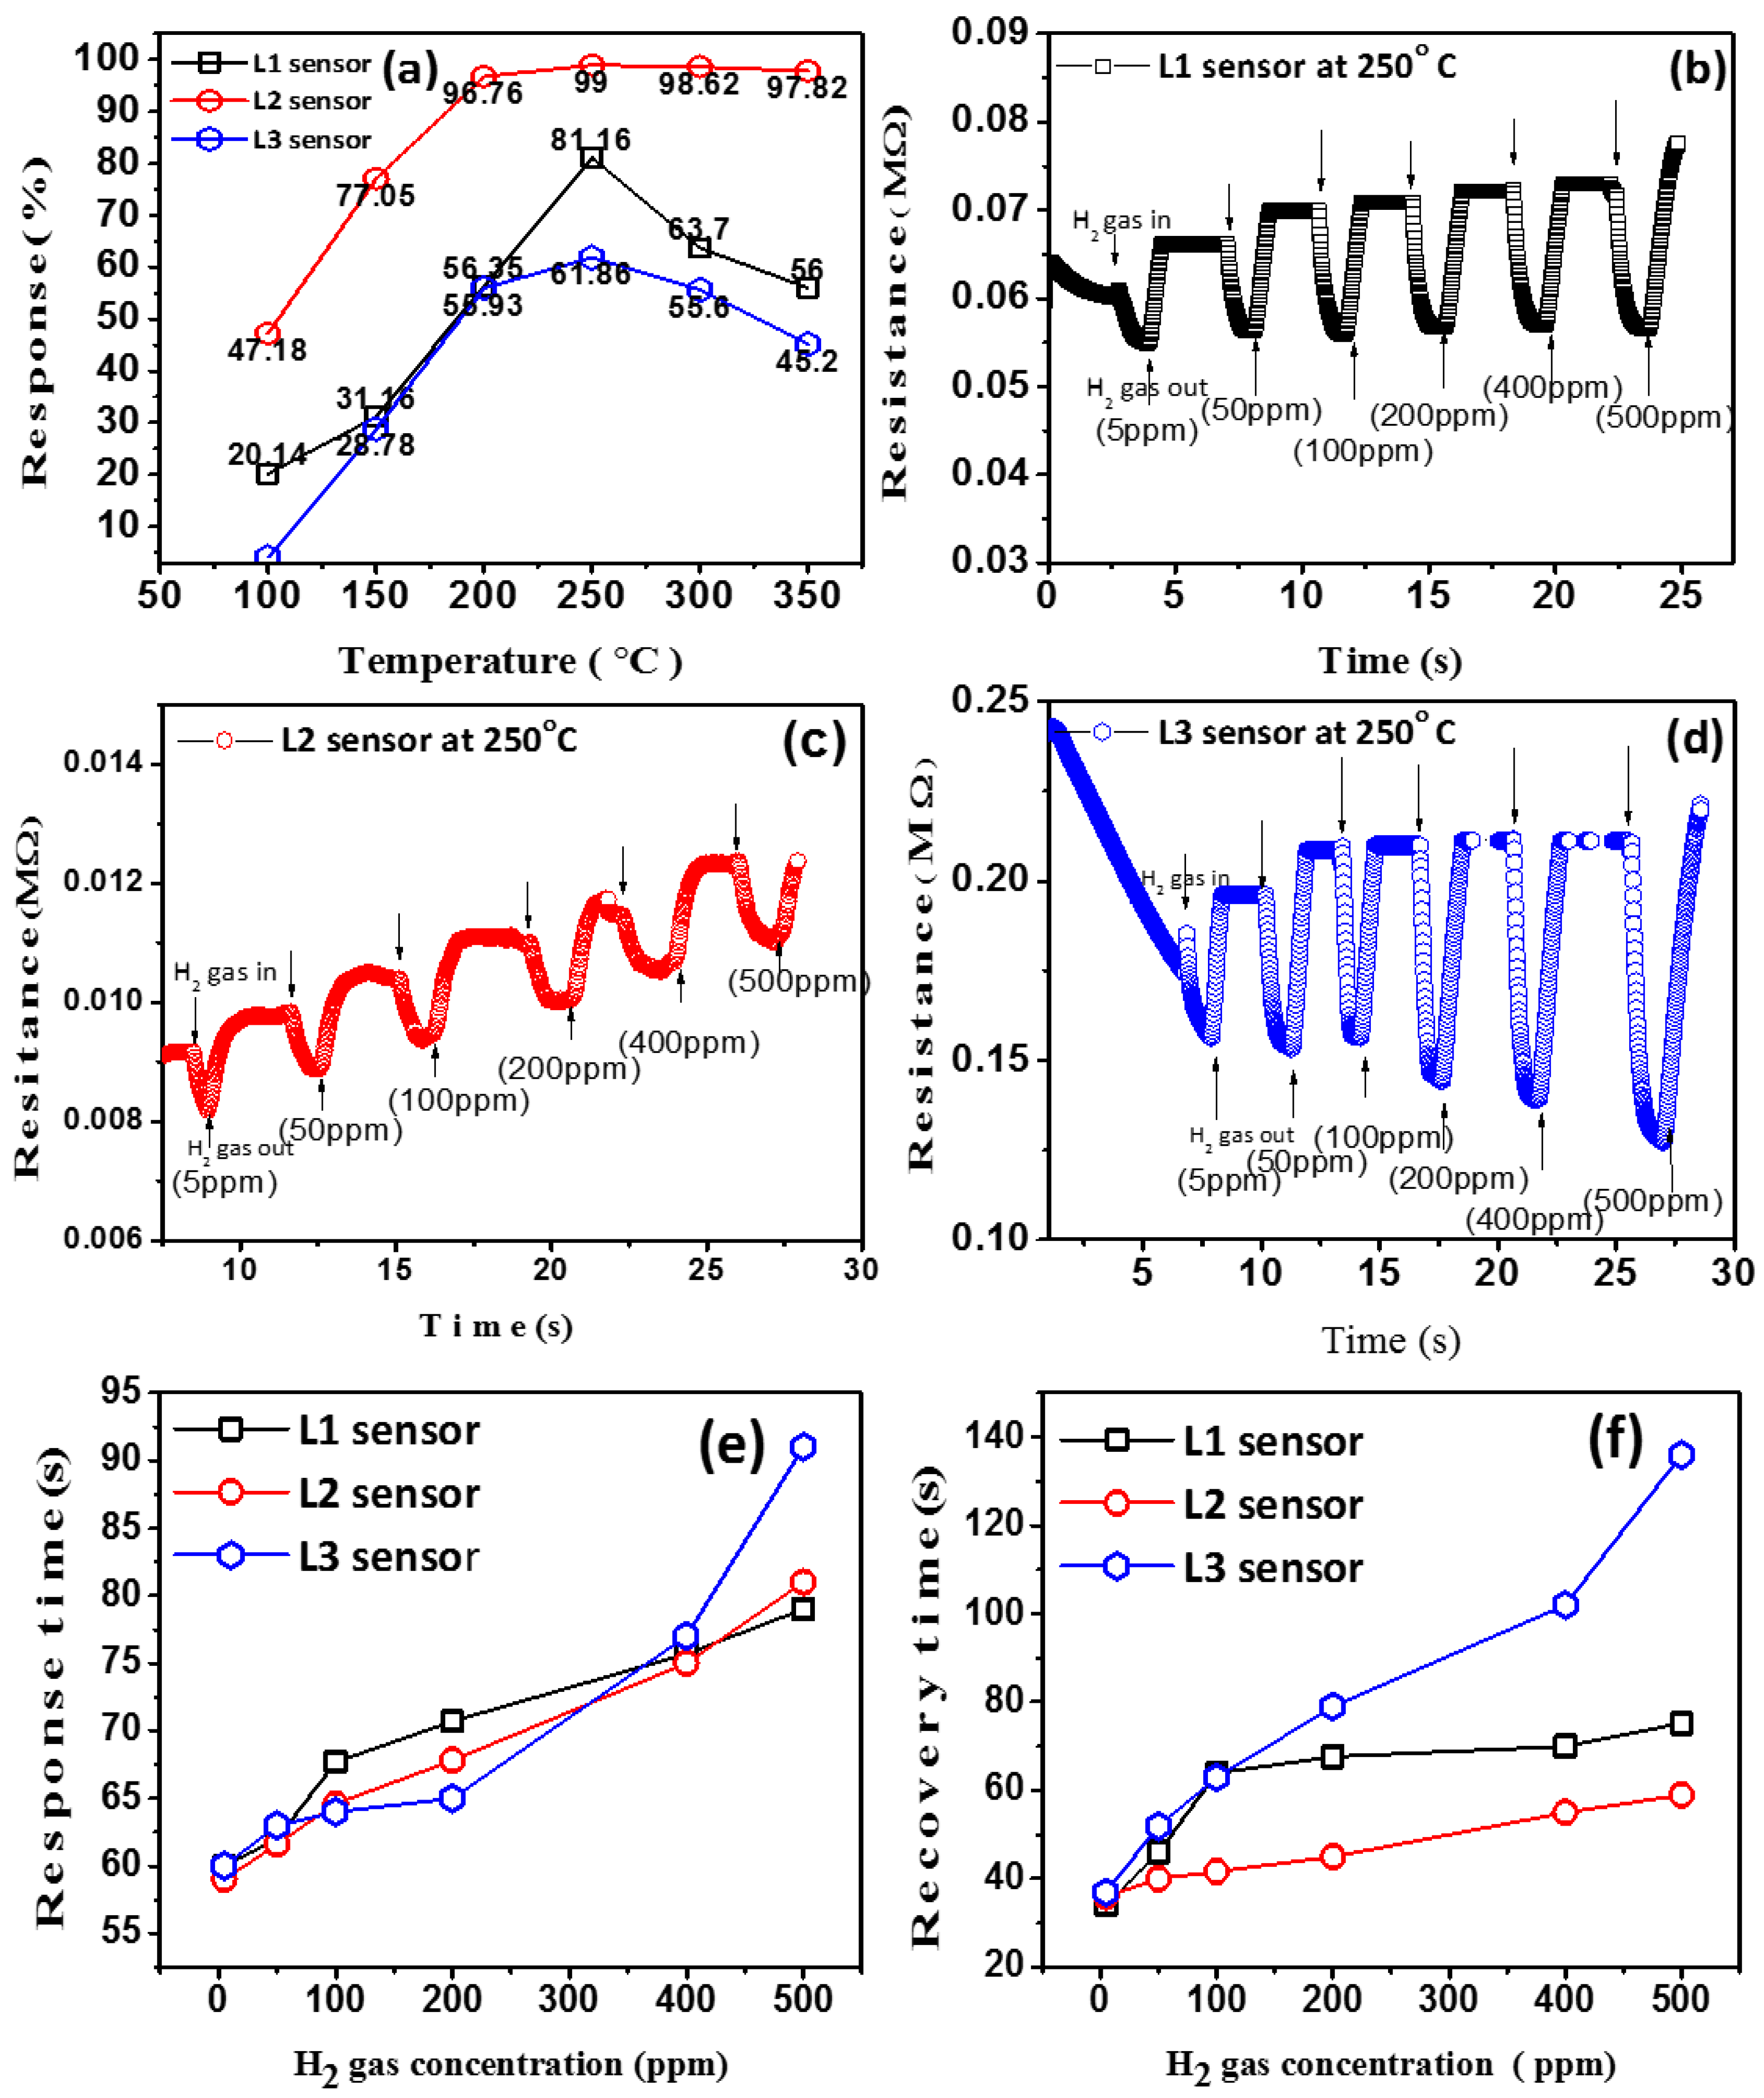
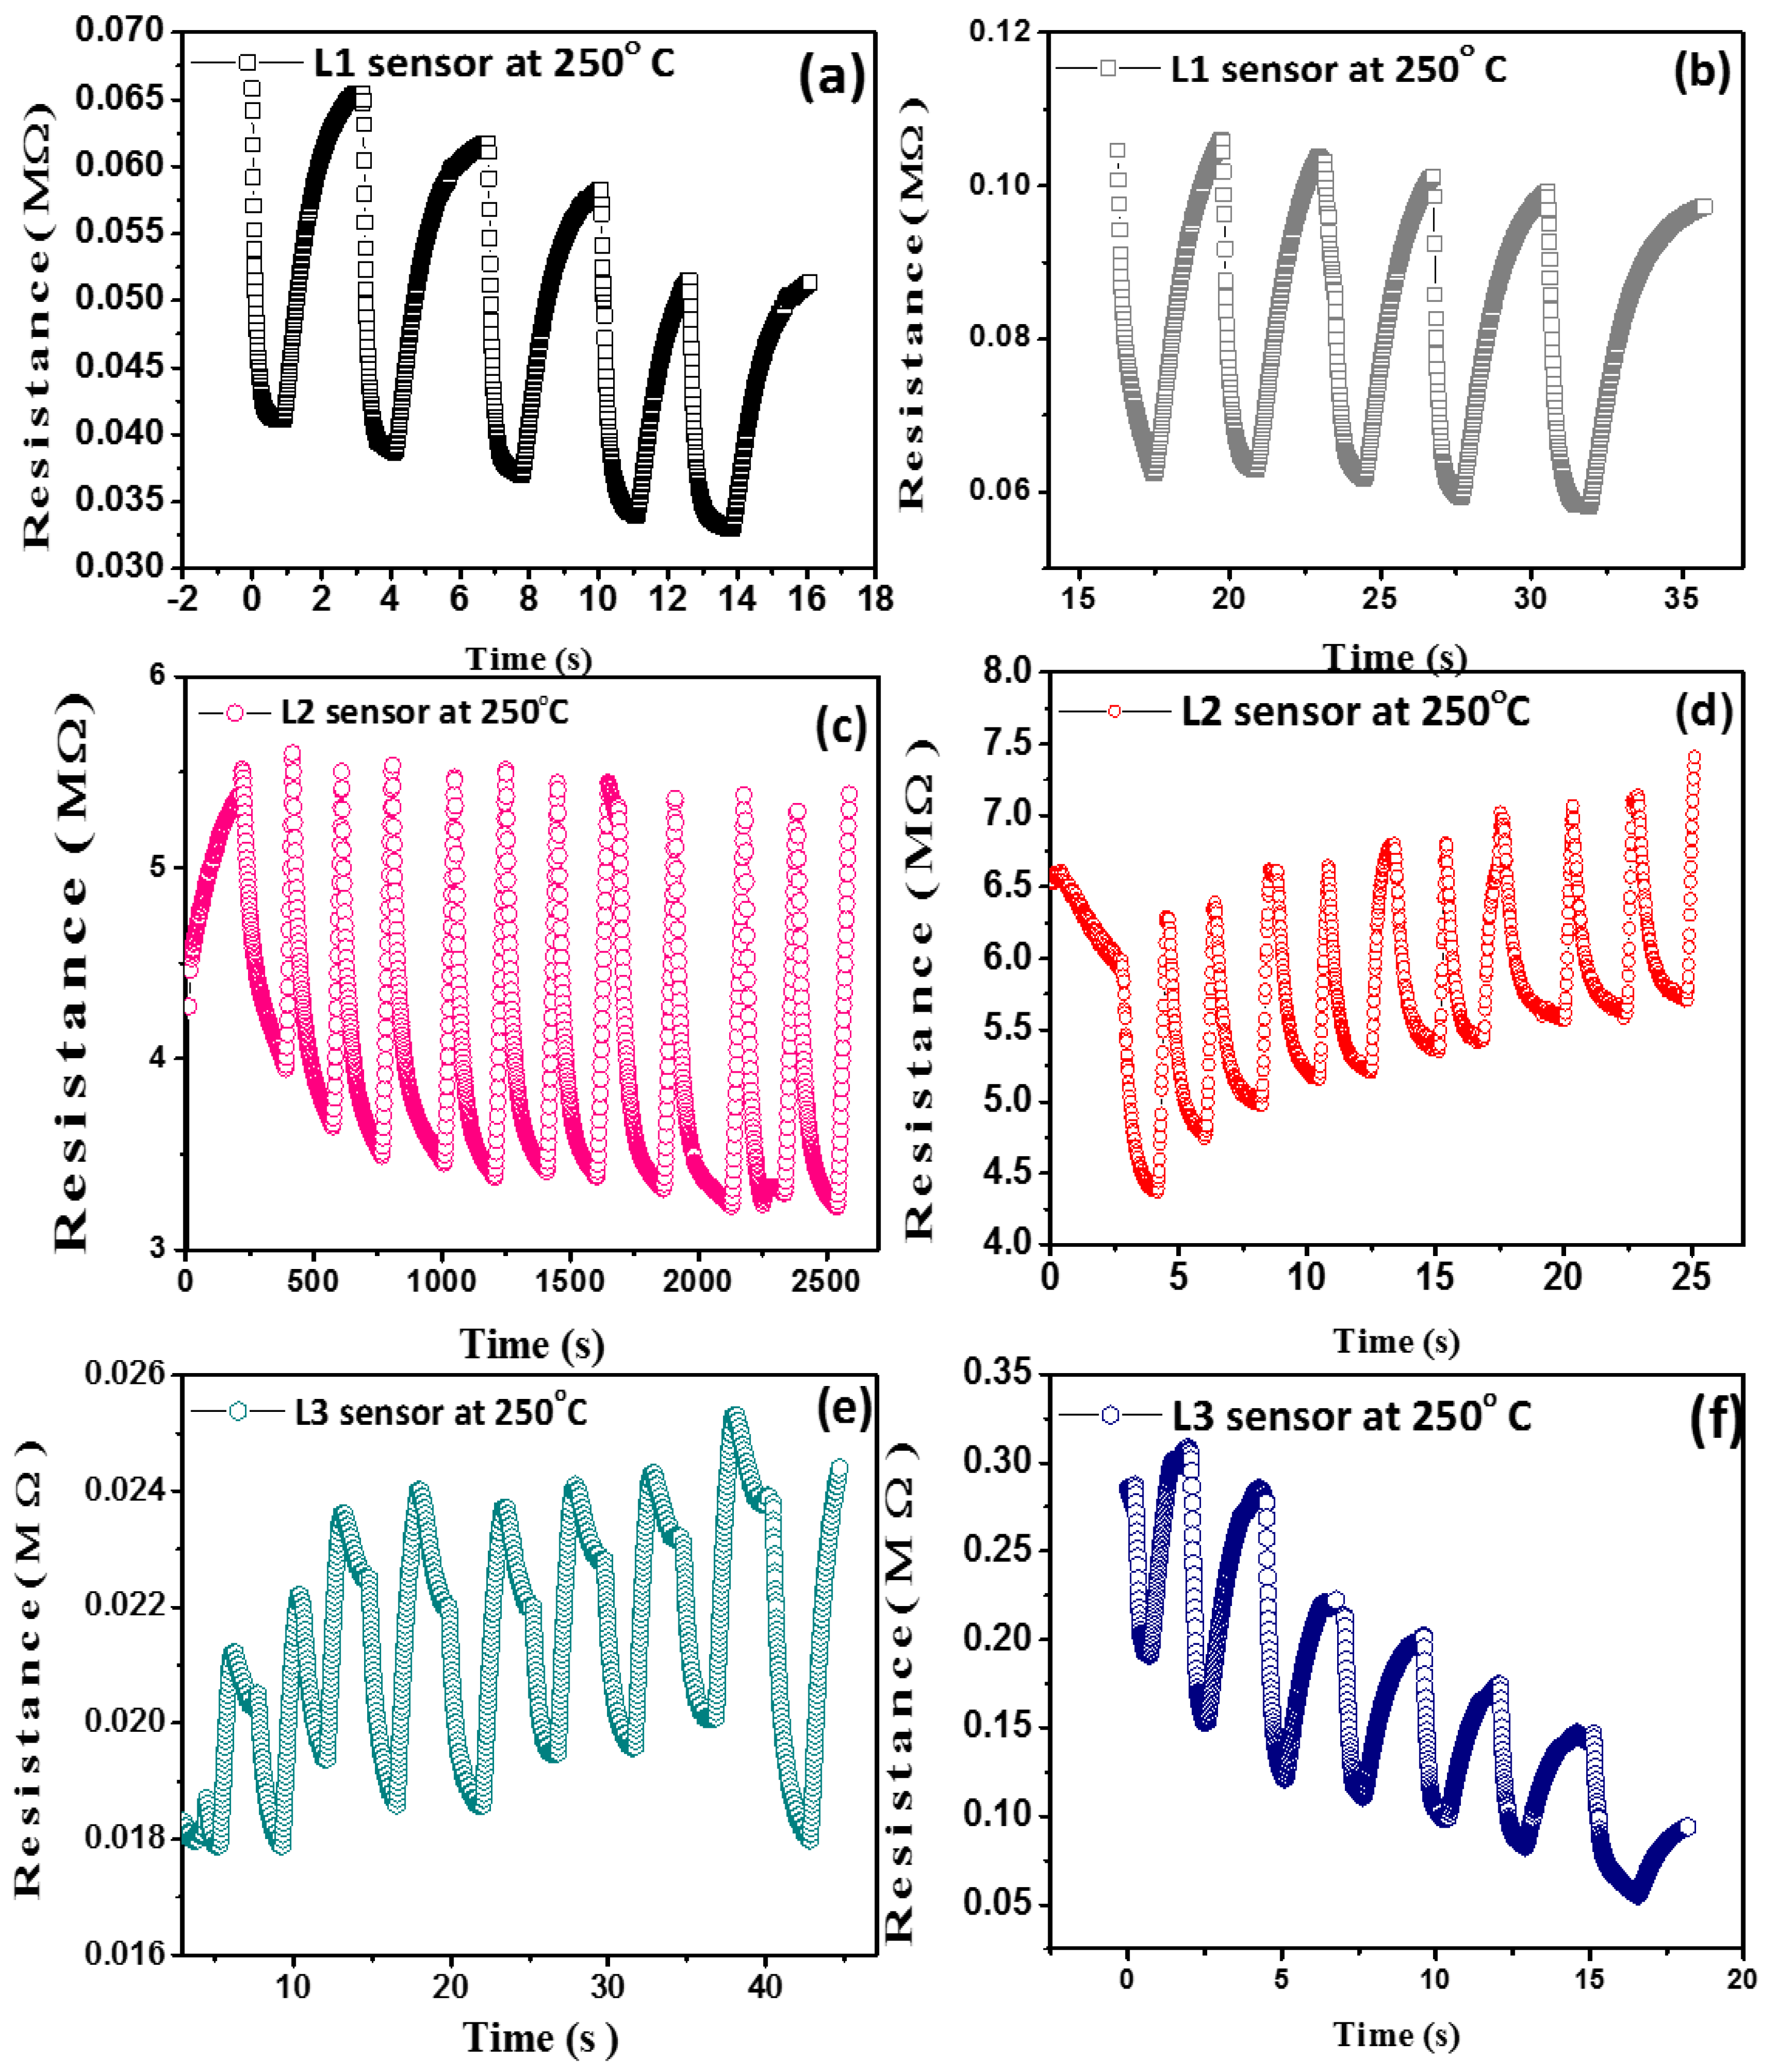
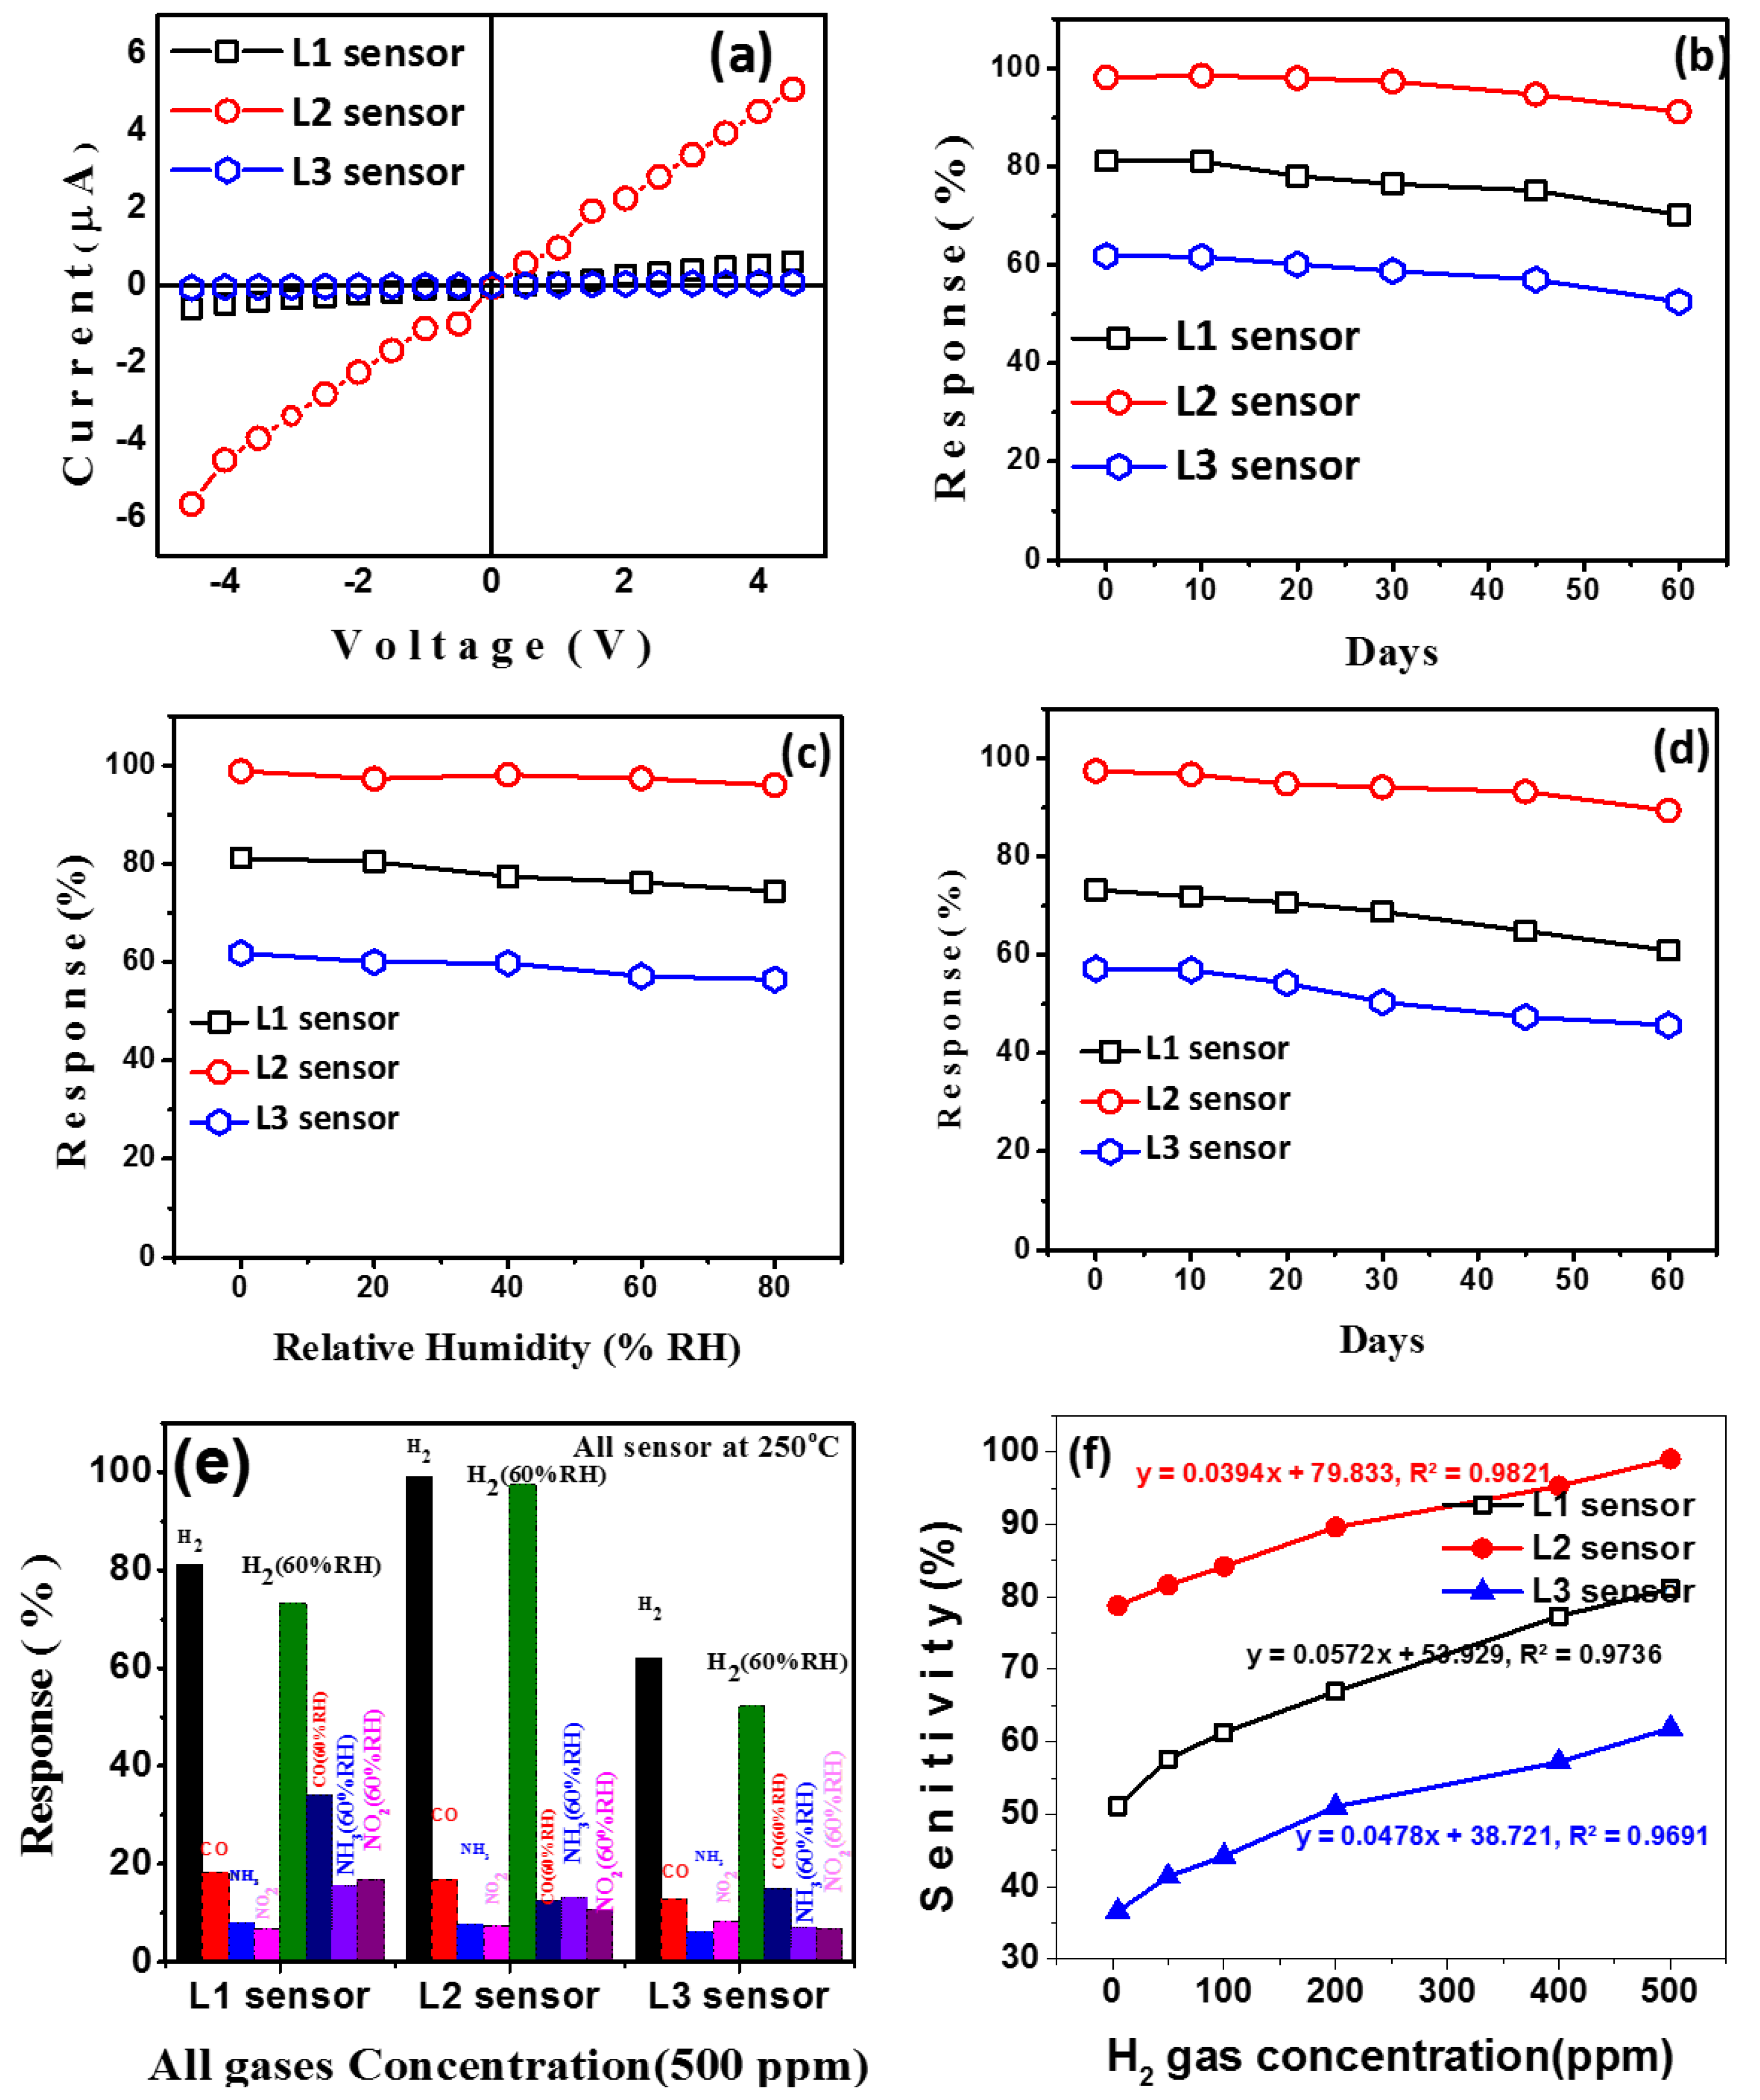
3.3. Gas Sensing Analysis

The response of the deposited thin film to H2 gas was analyzed by varying the operating temperature between 100 °C and 350 °C. The sensor response was determined using the following relation,
S ( % ) = R a R g R a × 100 ,
where Ra and Rg represent the resistances of the sensing material in the presence of air and the target gas, respectively [39]. Figure 5a shows the response of L1, L2, and L3 thin film sensors to 500 ppm concentration of H2 gas. As depicted in the figure, the sensor response increases with temperature due to the adsorption/desorption equilibrium of gas molecules, which governs the chemical reaction kinetics [40]. The maximum sensor response was observed at 250 °C, which was the operating temperature for all sensors. At temperatures below 250 °C, gas molecules lack the thermal and kinetic energy required to overcome the surface barrier, leading to low-adsorption capacity of gas molecules [41]. However, when the temperature of the Pd-caped SnO2 thin film exceeds 250 °C, the gas molecules adsorb on the sensing material and desorb before the electron transfer due to their high activation energy, resulting in a decrease in the sensor response of the sensing material [28]. Additionally, the difference in the magnitude of the sensor response among different sensors may be due to the variation in the thickness of the deposited materials. Sensor L2 exhibited a higher response than L1 and L3 sensors, which may be attributed to the non-stoichiometric composition of tin and oxide as deduced from EDAX Figure 3 and XPS spectra Figure 4 [15]. When the sensor comes in contact with the gas under detection, the gas molecules react with the adsorbed oxygen anions. The oxygen-trapped electrons are released back to the conduction band of SnO2, which makes the resistance of the SnO2 gas sensor decrease. The change of resistance of the thin film-based gas sensor is converted into an electrical signal, which can detect the target gas [14]. Therefore, the conductivity of SnO2 depends on the density of oxygen ions adsorbed on the surface [14]. In the L2 sensor, there are more oxides species (EDAX and XPS results) to improve the active sites of SnO2 through the surface, further improving the gas sensing performance of the gas sensor compared to L1 and L3 sensors.
The operating temperature of 250 °C was chosen to measure the sensitivity of the sensors L1, L2, and L3 towards H2 gas concentration in the range of 5 to 500 ppm, as shown in Figure 5b–d. The resistance of the sensing material was decreased upon exposure to H2 gas but returned to its initial value upon removal of the gas, confirming reversible adsorption and desorption.
The response and recovery time improved with increasing H2 concentration due to the catalytic and thermal activity of Pd. Figure 5e,f shows the response and recovery time of the sensors as a function of H2 concentration. The recovery time decreased with increasing Pd loading due to enhanced catalytic activity. The sensor response for different cycles in the presence of 500 ppm H2 gas is shown in Figure 6, where L1(a), L2(c), and L3(e) correspond to sensing duration and L1(b), L2(d), and L3(f) after 60 days. The L1 and L3 sensors showed incomplete recovery after multiple cycles, whereas the L2 sensor showed good repeatability up to the tenth cycle. The I-V characteristics of the sensors with H2 gas at 250 °C are shown in Figure 7a, and the stability of the sensors after 60 days at 500 ppm H2 gas is shown in Figure 7b. The selectivity of the sensors was tested with different gases such as H2, CO, NH3, and NO2 at 250 °C. The response of the L2 sensor to carbon monoxide (CO), ammonia (NH3), and Nitrous Oxide (NO2) gases were found to be very small as compared to L1 and L3 sensors, as depicted in Figure 7e. The results suggest that L2 thin film sensor exhibits a high response to hydrogen gas [42,43]. The instigation energy of hydrogen gas is small than CO, NH3, and NO2 gases. The gases (CO, NH3 and NO2) with large molecular weight and size are less reactive to the Pd layer [26]. Hence, hydrogen with its lower instigation energy, weight, and size is highly reactive and sensitive on the Pd surface, making it highly selectivity for hydrogen gas [26].
However, humidity can affect the sensor performance, causing water poisoning, which leads to reduced sensor response, response time, recovery time, and stability [44]. Water vapor adsorption on the active sites of Pd-caped SnO2 thin film can decrease H2 response and change the base resistance of sensors [45]. Therefore, the response, selectivity, and stability of the sensors were observed to be lower in humid environments than in dry ones. The reduction in sensing response of L1, L2, and L3 sensors at 80% relative humidity was 6.76%, 2.85%, and 5.33%, respectively, as shown in Figure 7c. However, the humidity effect on the sensing performance was minimal.
The sensor stability for 60 days and selectivity at 60% relative humidity were also studied. The sensors L1, L2, and L3 worked at 60% relative humidity, and after 60 days, the observed reduction in response was 12.32%, 8.06%, and 11.44%, respectively, as shown in Figure 7d. In 60% relative humidity, L2 sensor exhibited higher sensitivity (97.36%) compared to L1 (73.14%) and L3 (52.14%), as shown in Figure 7e. Thus, the L2 sensor performed well in 60% relative humidity even after 60 days and exhibited better stability in humid atmospheres. These results indicate that the fabricated Pd-caped SnO2 thin film sensor (L2 sensor) is highly selective to H2 gas at lower concentrations (ppm levels) with high sensitivity and good stability in humid environments. A linear relationship as concentration of H2 gas (5–500 ppm) vs. sensitivity (%) of all sensors at 250 °C is shown in Figure 7f. The lower detection limits (LOD) of L1, L2, and L3 sensors were observed 184.61, 151.60, and 200.04 ppb. respectively [6]. Here, L2 sensor shows better linearity and lower LOD comparison other sensors. A comparative summary of the sensor characteristics of previously reported Pd caped SnO2 sensors is presented in Table 2.
Our study demonstrates that the use of hydrophobic coatings may not be necessary for certain types of sensors, as our sensor showed only a small reduction in response in the 0 to 80% moisture range. Furthermore, we observed that the thickness of the sensor film played a crucial role in its performance, with films between 150 nm to 250 nm exhibiting high response and stability, as well as a low reduction in high humidity. These findings suggest that selecting the appropriate thickness of the sensor film is essential for optimizing sensor performance in certain applications.

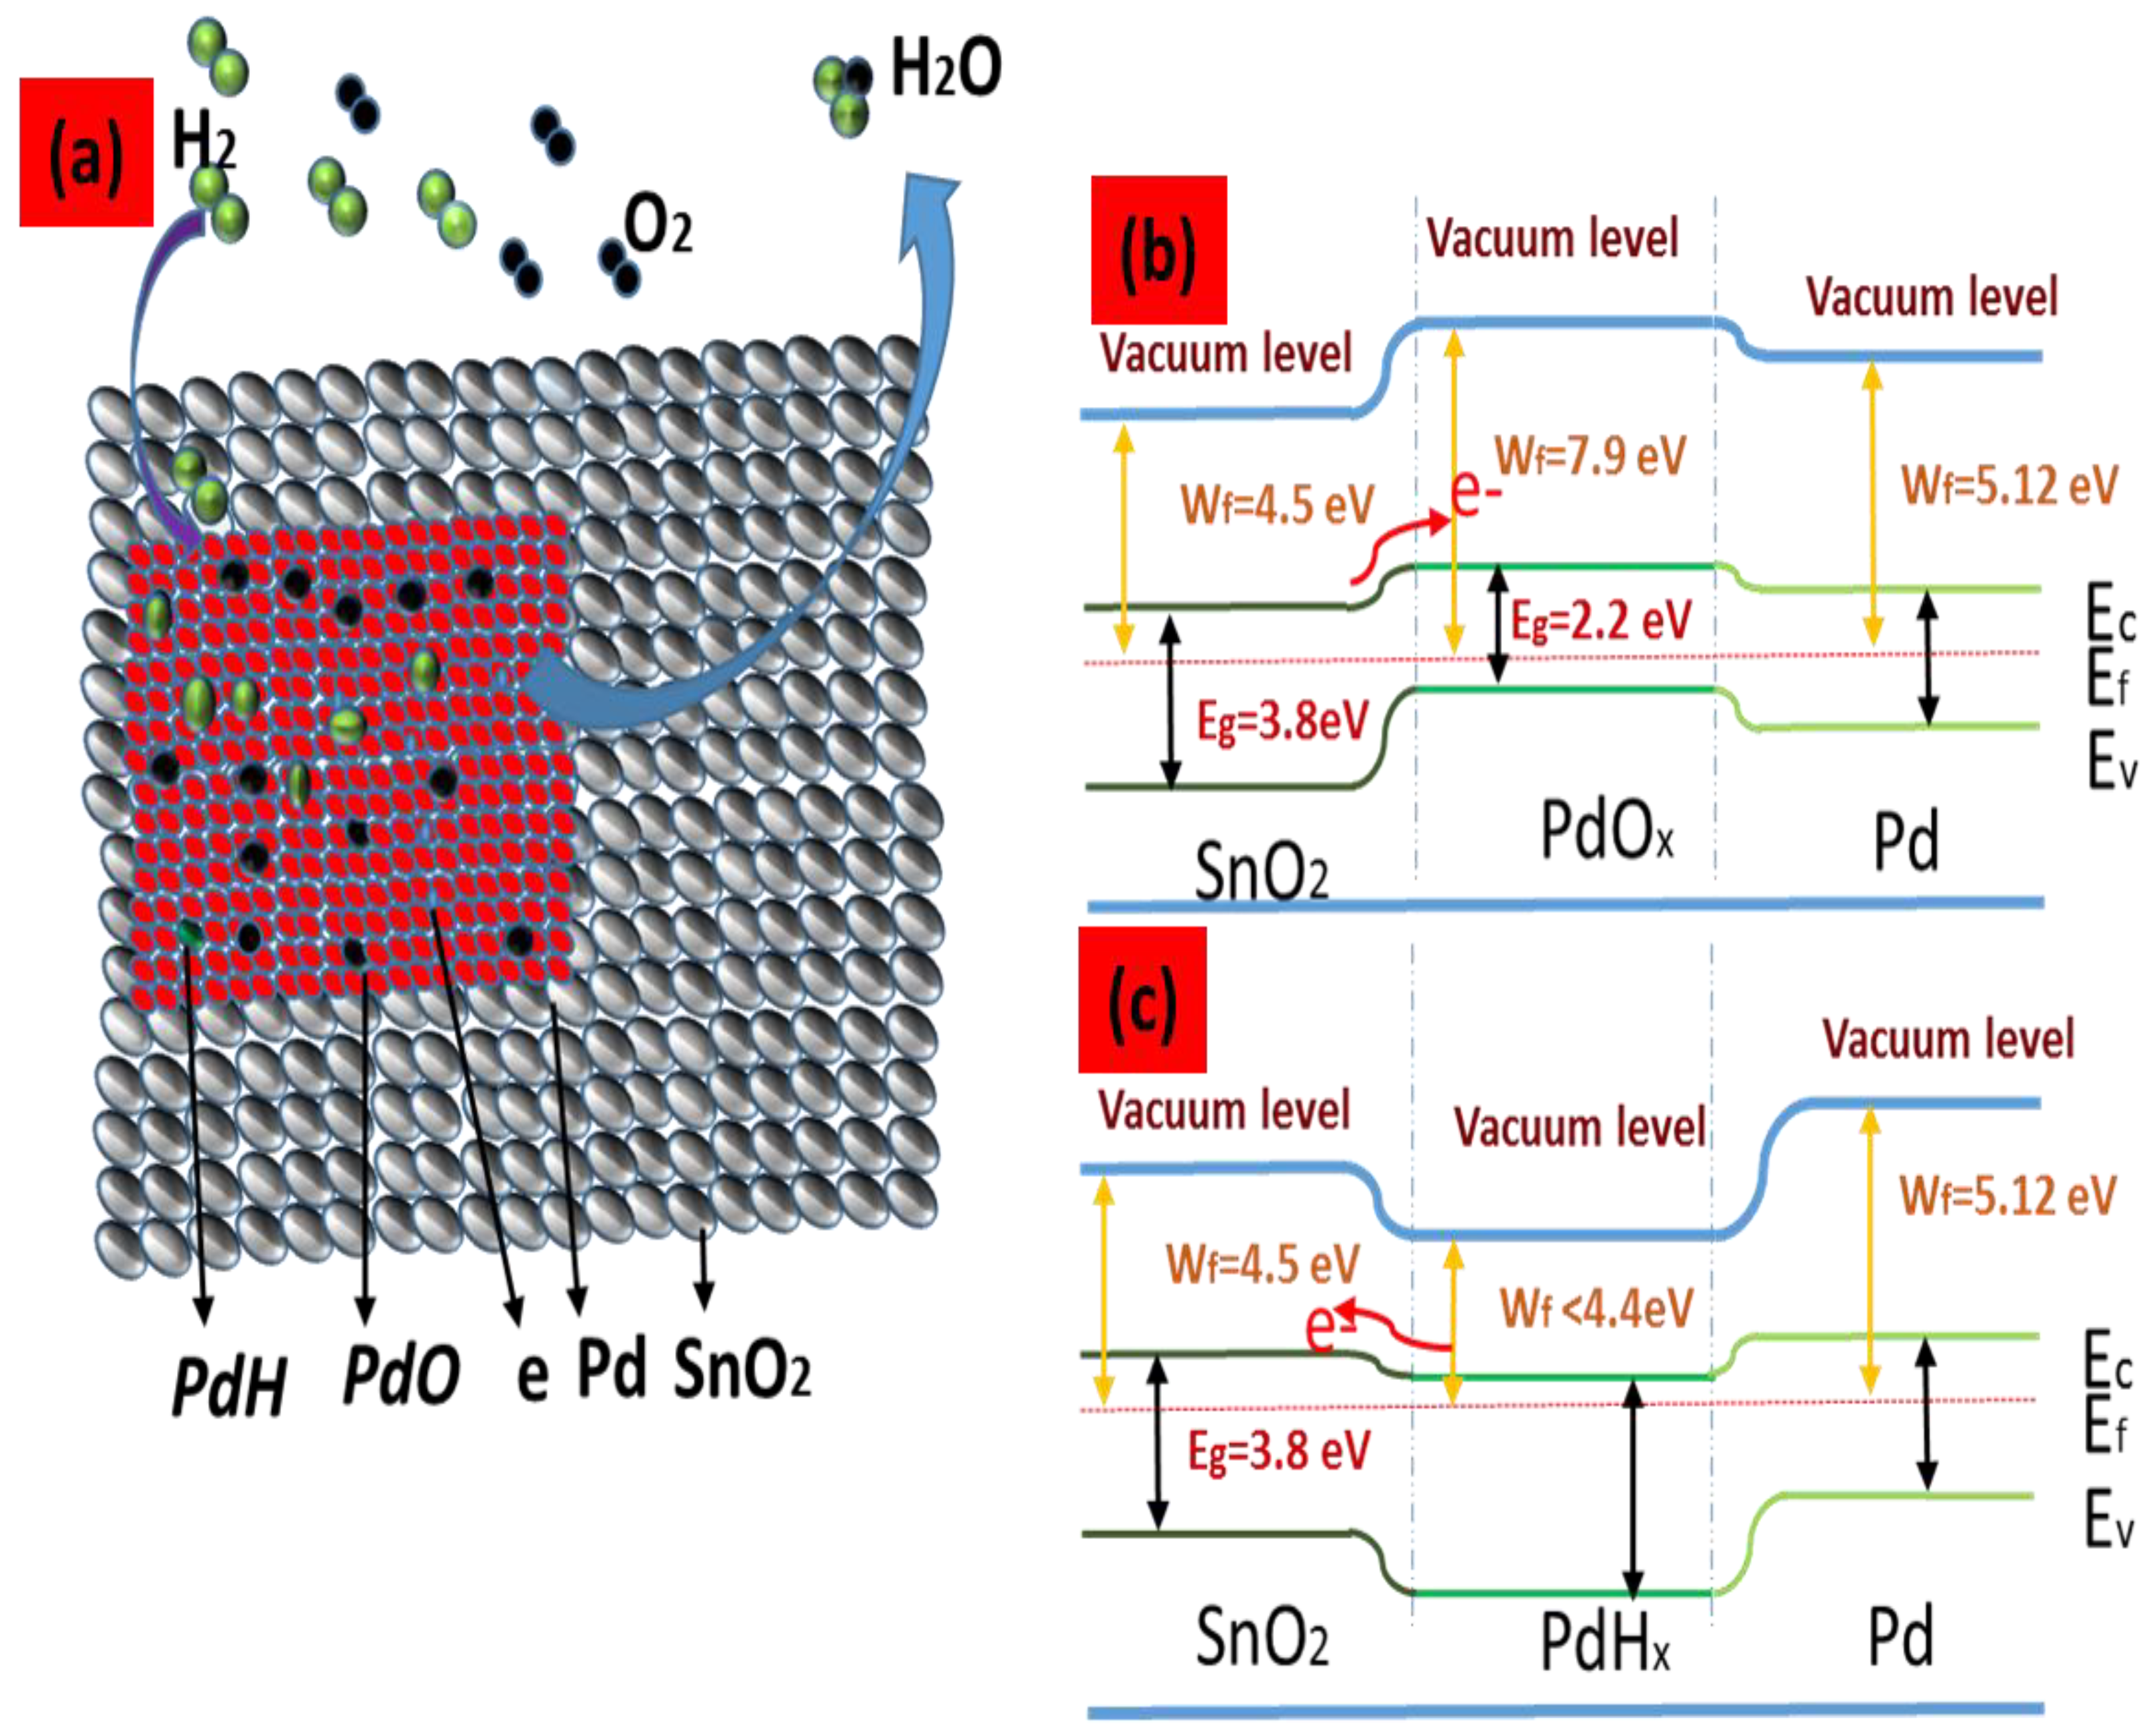
3.4. Sensing Mechanism

The sensing material operates based on a depletion conduction model, where exposure of H2 gas to the surface of the pristine SnO2 thin film sensor interacts with pre-adsorbed oxygen species (O2, O, and O2−), resulting in electron release and an increase in the total carrier concentration. This reduces sensor resistance by collapsing the electron depletion region, which is a region of the sensor where there is a shortage of mobile charge carriers [5,49]. In the Pd-capped SnO2 thin film sensor, both electronic and chemical response mechanisms play a role in the sensing characteristics [50,51]. The catalytic activity of Pd leads to the chemical response mechanism, which speeds up the dissociation of oxygen and hydrogen molecules, causing a greater interaction between H2 gas molecules and pre-adsorbed oxygen on the surface of the sensor material. This results in an increase in sensor response to H2 gas [23]. The chemical response reactions are demonstrated in Equations (1)–(4) and can be observed in Figure 8a [41].
H 2   ( ads ) P d 2 H   ( ads )
H (ads) + O (ads) → OH (ads)
OH (ads) + H (ads) → H2O + e
PdO + H2 → Pd + H2O
It is challenging to provide experimental measurements to determine whether the catalytic dissociation of oxygen or hydrogen is responsible for improving the sensor response. While the dominance of oxygen dissociation due to Pd catalyst could enhance the sensor response for all gases such as NH3, CO, and NO2, the observed results showed the highest response corresponding to H2 gas due to Pd catalyzing the dissociation of H2 molecules into two active hydrogen atoms. As a result, SnO2 thin films are functionalized with Pd catalyst to enhance their response to hydrogen gas. The Pd catalyst exhibits the highest response to hydrogen gas because of its work function (Wf) of ~5.12 eV, which is higher than that of n-type SnO2 (~4.4 eV). This modification of the conduction region of the sensing material enhances its response to the analyte gas.
The dissociation of H2 molecules through Pd catalysis into active hydrogen atoms and the Pd-capped SnO2 heterojunction junction dominates the significant enhancement of hydrogen sensing for SnO2 thin films through the formation of PdOx during chemical reactions Figure 8b. This chemical reaction further modifies the conduction region of the sensing material and enhances its response to hydrogen gas. Both chemical and electronic mechanisms are responsible for the sensing response, but the chemical mechanism dominates over the electrical mechanism [51].
To enhance the sensitivity of the sensing material, the thin film decorated with a noble metal like Pd should have high catalytic activity towards the desired gas. The advantage of the catalytic activity of Pd in the dissociation of oxygen is that it results in a higher number of pre-adsorbed oxygen species on the surface of the Pd-caped SnO2 thin film compared to the un-decorated SnO2 thin film. This higher number of pre-adsorbed oxygen species can interact with H2 gas molecules, leading to an increased response of the sensor to the analyte gas.
X-ray photoelectron spectroscopy (XPS) results confirm the presence of PdO in Pd-caped SnO2, and the work function of PdOx (~7.9 eV) is higher than that of SnO2. Electrons flow from SnO2 to PdO, which leads to the formation of a p-n heterojunction. The expansion in SnO2 due to the generation of the Schottky barrier and p-n heterojunction results in an increase in baseline resistance (Va). Once Pd caped SnO2 sensors are exposed to H2 gas, part of Pd is converted into PdHx, and it has a lower work function (~4.4 eV) than SnO2. Electrons flow from PdHx to SnO2, increasing the number of electrons in the SnO2 region and decreasing the resistance (Vg) of the Pd caped SnO2 thin film. These simultaneous conduction effects lead to a large variation in resistance and enhanced sensing characteristics, as shown in Figure 8c.

4. Conclusions

The sputter-deposited Pd-caped SnO2 thin film sensors were thoroughly investigated for their ability to detect hydrogen gas. The sensor with a thickness of (246.1 nm) exhibited the highest response to hydrogen gas, as well as fast response and recovery characteristics. Moreover, the sensor’s performance was only minimally affected by time, humidity, and the presence of other gases, indicating a high degree of stability and selectivity. The sensor maintained good mechanical stability even after 60 days and 10 cycles, with 100% recovery.
Taken together, these results demonstrate that the Pd-caped SnO2 thin film sensor possesses superior sensing performance, including moderate operating temperature, high response, fast response and recovery time, good repeatability, and selectivity towards H2 gas. Therefore, the Pd-caped SnO2 thin film is a highly promising material for H2 gas sensors, particularly for detecting low concentrations.

Author Contributions

Conceptualization, Y.K.G.; methodology and experiments, V.K., Y.K.G. and D.G.; manuscript original draft preparation, V.K.; data analysis and characterization, V.K., A.K., R.A., D.G. and Y.K.G.; manuscript editing: B.P.S., Y.K.G., A.K. and R.A. All authors have read and agreed to the published version of the manuscript.

Funding

This research received no external funding.

Data Availability Statement

The all data that support the findings of this study are included within the article.

Acknowledgments

The authors would like to thank Ramesh Chandra, IIC, IIT Roorkee, India, for providing, XRD and FESEM facilities to carry out this research work.

Conflicts of Interest

The authors declare no conflict of interest.

References

  1. Choi, S.-W.; Jung, S.-H.; Kim, S.S. Significant enhancement of the NO2 sensing capability in networked SnO2 nanowires by Au nanoparticles synthesized via γ-ray radiolysis. J. Hazard. Mater. 2011, 193, 243–248. [Google Scholar] [CrossRef] [PubMed]
  2. Gurlo, A.; Ivanovskaya, M.; Bârsan, N.; Schweizer-Berberich, M.; Weimar, U.; Göpel, W.; Diéguez, A. Grain size control in nanocrystalline In2O3 semiconductor gas sensors. Sens. Actuators B Chem. 1997, 44, 327–333. [Google Scholar] [CrossRef]
  3. Korotcenkov, G.; Brinzari, V.; Stetter, J.R.; Blinov, I.; Blaja, V. The nature of processes controlling the kinetics of indium oxide-based thin film gas sensor response. Sens. Actuators B Chem. 2007, 128, 51–63. [Google Scholar] [CrossRef]
  4. Tiemann, M. Porous metal oxides as gas sensors. Chem. A Eur. J. 2007, 13, 8376–8388. [Google Scholar] [CrossRef] [PubMed]
  5. Van Duy, N.; Hoa, N.D.; Van Hieu, N. Effective hydrogen gas nanosensor based on bead-like nanowires of platinum-decorated tin oxide. Sens. Actuators B Chem. 2012, 173, 211–217. [Google Scholar] [CrossRef]
  6. Kumar, S.; Lawaniya, S.D.; Agarwal, S.; Yu, Y.-T.; Nelamarri, S.R.; Kumar, M.; Mishra, Y.K.; Awasthi, K. Optimization of Pt nanoparticles loading in ZnO for highly selective and stable hydrogen gas sensor at reduced working temperature. Sens. Actuators B Chem. 2023, 375, 132943. [Google Scholar] [CrossRef]
  7. Ali, S.; Gupta, A.; Shafiei, M.; Langford, S.J. Recent Advances in Perylene Diimide-Based Active Materials in Electrical Mode Gas Sensing. J. Chemo Sens. 2021, 9, 30. [Google Scholar] [CrossRef]
  8. Yamazoe, N.; Shimanoe, K. Fundamentals of Semiconductor Gas Sensors, 2nd ed.; Woodhead Publishing: Cambridge, UK, 2019; pp. 3–38. [Google Scholar] [CrossRef]
  9. Du, X.; George, S. Thickness dependence of sensor response for CO gas sensing by tin oxide films grown using atomic layer deposition. Sens. Actuators B Chem. 2008, 135, 152–160. [Google Scholar] [CrossRef]
  10. Klöber, J.; Ludwig, M.; Schneider, H. Effects of thickness and additives on thin-film SnO2 gas sensors. Sens. Actuators B Chem. 1991, 3, 69–74. [Google Scholar] [CrossRef]
  11. Bruno, L.; Pijolat, C.; Lalauze, R. Tin dioxide thin-film gas sensor prepared by chemical vapour deposition: Influence of grain size and thickness on the electrical properties. Sens. Actuators B Chem. 1994, 18, 195–199. [Google Scholar] [CrossRef] [Green Version]
  12. Xie, H.; Wang, K.; Zhang, Z.; Zhao, X.; Liu, F.; Mu, H. Temperature and thickness dependence of the sensitivity of nitrogen dioxide graphene gas sensors modified by atomic layer deposited zinc oxide films. RSC Adv. 2015, 5, 28030–28037. [Google Scholar] [CrossRef]
  13. Nasri, A.; Pétrissans, M.; Fierro, V.; Celzard, A. Gas sensing based on organic composite materials: Review of sensor types, progresses and challenges. J. Mater. Sci. Semicond. Process. 2021, 128, 105744. [Google Scholar] [CrossRef]
  14. Kong, Y.; Li, Y.; Cui, X.; Su, L.; Ma, D.; Lai, T.; Yao, L.; Xiao, X.; Wang, Y. SnO2 nanostructured materials used as gas sensors for the detection of hazardous and flammable gases: A review. J. Nano Mater. Sci. 2021, 4, 339–350. [Google Scholar] [CrossRef]
  15. Izydorczyk, W.; Izydorczyk, J. Structure, Surface morphology, chemical composition, and sensing properties of SnO2 thin films in an oxidizing atmosphere. Sensors 2021, 21, 5741. [Google Scholar] [CrossRef]
  16. Zhang, X.; Teng, L.; Liu, Y.; Liu, Z.; Xue, J.; Ikram, M.; Ullah, M.; Li, L.; Shi, K. 3D flower-like NiZnAl multimetal oxide constructed by ultra-thin porous nanosheets: A long-term and stable sensing material for NOx at room temperature. Sens. Actuators B Chem. 2019, 300, 126899. [Google Scholar] [CrossRef]
  17. Zakaria, S.A.; Ahmadi, S.H.; Amini, M.H. Chemiresistive gas sensors based on layered double hydroxides (LDHs) structures: A review. Sens. Actuators A Phys. 2022, 346, 113827. [Google Scholar] [CrossRef]
  18. Nie, L.; Fan, G.; Wang, A.; Zhang, L.; Guan, J.; Han, N.; Chen, Y. Finely dispersed and highly toluene sensitive NiO/NiGa2O4 heterostructures prepared from layered double hydroxides precursors. Sens. Actuators B Chem. 2021, 345, 130412. [Google Scholar] [CrossRef]
  19. Ihokura, K.; Watson, J. The Stannic Oxide Gas Sensor—Principles and Applications; CRC-Press: Boca Raton, FL, USA, 1994; ISBN 0-8493-2604-4. [Google Scholar] [CrossRef]
  20. Kwak, C.-H.; Kim, T.-H.; Jeong, S.-Y.; Yoon, J.-W.; Kim, J.-S.; Lee, J.-H. Humidity-Independent Oxide Semiconductor Chemiresistors Using Terbium-Doped SnO2 Yolk–Shell Spheres for Real-Time Breath Analysis. ACS Appl. Mater. Interfaces 2018, 10, 18886–18894. [Google Scholar] [CrossRef]
  21. Suematsu, K.; Sasaki, M.; Ma, N.; Yuasa, M.; Shimanoe, K. Antimony-Doped Tin Dioxide Gas Sensors Exhibiting High Stability in the Sensitivity to Humidity Changes. ACS Sens. 2016, 1, 913–920. [Google Scholar] [CrossRef]
  22. Guo, W.; Zhou, Q.; Zhang, J.; Fu, M.; Radacsi, N.; Li, Y. Hydrothermal synthesis of Bi-doped SnO2/rGO nanocomposites and the enhanced gas sensing performance to benzene. Sens. Actuators B Chem. 2019, 299, 126959. [Google Scholar] [CrossRef]
  23. Wang, Z.; Jia, Z.; Li, Q.; Zhang, X.; Sun, W.; Sun, J.; Liu, B.; Ha, B. The enhanced NO2 sensing properties of SnO2 nanoparticles/reduced graphene oxide composite. J. Colloid Interface Sci. 2019, 537, 228–237. [Google Scholar] [CrossRef]
  24. Kumar, A.; Zhang, P.; Vincent, A.; McCormack, R.; Kalyanaraman, R.; Cho, H.J.; Seal, S. Hydrogen selective gas sensor in humid environment based on polymer coated nanostructured-doped tin oxide. Sens. Actuators B Chem. 2011, 155, 884–892. [Google Scholar] [CrossRef]
  25. Li, A.; Zhao, S.; Bai, J.; Gao, S.; Wei, D.; Shen, Y.; Yuan, Z.; Meng, F. Optimal construction and gas sensing properties of SnO2@TiO2 heterostructured nanorods. Sens. Actuators B Chem. 2022, 355, 131261. [Google Scholar] [CrossRef]
  26. Yadav, P.; Kumar, A.; Sanger, A.; Gautam, Y.K.; Singh, B.P. Sputter-Grown Pd-Capped CuO Thin Films for a Highly Sensitive and Selective Hydrogen Gas Sensor. J. Electron. Mater. 2021, 50, 192–200. [Google Scholar] [CrossRef]
  27. Abinaya, M.; Pal, R.; Sridharan, M. Highly sensitive room temperature hydrogen sensor based on undoped SnO2 thin films. Solid State Sci. 2019, 95, 105928. [Google Scholar] [CrossRef]
  28. Musa, A.M.M.; Farhad, S.F.U.; Gafur, M.A.; Jamil, A.T.M.K. Effects of withdrawal speed on the structural, morphological, electrical, and optical properties of CuO thin films synthesized by dip-coating for CO2 gas sensing. AIP Adv. 2021, 11, 115004. [Google Scholar] [CrossRef]
  29. Tyagi, S.; Kumar, A.; Kumar, A.; Gautam, Y.K.; Kumar, V.; Kumar, Y.; Singh, B.P. Enhancement in the sensitivity and selectivity of Cu functionalized MoS2 nanoworm thin films for nitrogen dioxide gas sensor. Mater. Res. Bull. 2022, 150, 111784. [Google Scholar] [CrossRef]
  30. Kumar, A.; Kumar, V.; Chandra, R.; Gautam, Y.K. Effect of sputtering process parameters on structural and optical properties of CdS thin films. Mater. Res. Express 2019, 6, 106448. [Google Scholar] [CrossRef]
  31. Ambedkar, A.K.; Singh, M.; Kumar, V.; Kumar, V.; Singh, B.P.; Kumar, A.; Gautam, Y.K. Structural, optical and thermoelectric properties of Al-doped ZnO thin films prepared by spray pyrolysis. Surf. Interfaces 2020, 19, 100504. [Google Scholar] [CrossRef]
  32. Wang, Y.; Li, J.; Li, S.; Chen, H.; Liu, D.; Kang, J. X-ray reflectivity and atomic force microscopy studies of MOCVD grown AlxGa1−xN/GaN superlattice structures. J. Semicond. 2011, 32, 043006. [Google Scholar] [CrossRef]
  33. Chen, Y.; Qin, H.; Hu, J. CO sensing properties and mechanism of Pd doped SnO2 thick-films. Appl. Surf. Sci. 2018, 428, 207–217. [Google Scholar] [CrossRef]
  34. Guerrero-Ortega, L.P.A.; Ramírez-Meneses, E.; Cabrera-Sierra, R.; Palacios-Romero, L.M.; Philippot, K.; Santiago-Ramírez, C.R.; Lartundo-Rojas, L.; Manzo-Robledo, A. Pd and Pd@PdO core–shell nanoparticles supported on Vulcan carbon XC-72R: Comparison of electroactivity for methanol electro-oxidation reaction. J. Mater. Sci. 2019, 54, 13694–13714. [Google Scholar] [CrossRef]
  35. Miller, A.; Yu, L.; Blickensderfer, J.; Akolkar, R. Electrochemical Copper Metallization of Glass Substrates Mediated by Solution-Phase Deposition of Adhesion-Promoting Layers. J. Electrochem. Soc. 2015, 162, D630–D634. [Google Scholar] [CrossRef] [Green Version]
  36. Zhu, S.; Tian, Q.; Wu, G.; Bian, W.; Sun, N.; Wang, X.; Li, C.; Zhang, Y.; Dou, H.; Gong, C.; et al. Highly sensitive and stable H2 gas sensor based on p-PdO-n-WO3-heterostructure-homogeneously-dispersing thin film. Int. J. Hydrogen Energy 2022, 47, 17821–17834. [Google Scholar] [CrossRef]
  37. Kim, K.S.; Gossmann, A.F.; Winograd, N. X-ray photoelectron spectroscopic studies of palladium oxides and the palladium-oxygen electrode. Anal. Chem. 1974, 46, 197–200. [Google Scholar] [CrossRef]
  38. Masuda, Y. Recent advances in SnO2 nanostructure based gas sensors. Sens. Actuators B Chem. 2022, 364, 131876. [Google Scholar] [CrossRef]
  39. Zhang, L.; Tong, R.; Ge, W.; Guo, R.; Shirsath, S.E.; Zhu, J. Facile one-step hydrothermal synthesis of SnO2 microspheres with oxygen vacancies for superior ethanol sensor. J. Alloys Compd. 2020, 814, 152266. [Google Scholar] [CrossRef]
  40. Van Duy, N.; Thai, N.X.; Ngoc, T.M.; Le, D.T.T.; Hung, C.M.; Nguyen, H.; Tonezzer, M.; Van Hieu, N.; Hoa, N.D. Design and fabrication of effective gradient temperature sensor array based on bilayer SnO2/Pt for gas classification. Sens. Actuators B Chem. 2022, 351, 130979. [Google Scholar] [CrossRef]
  41. Çoban, O.; Tekmen, S.; Gür, E.; Tüzemen, S. High optical response NiO, Pd/NiO and Pd/WO3 hydrogen sensors. Int. J. Hydrogen Energy 2022, 47, 25454–25464. [Google Scholar] [CrossRef]
  42. Walker, J.M.; Akbar, S.A.; Morris, P.A. Synergistic effects in gas sensing semiconducting oxide nano-heterostructures: A review. Sens. Actuators B Chem. 2019, 286, 624–640. [Google Scholar] [CrossRef]
  43. Meng, X.; Bi, M.; Xiao, Q.; Gao, W. Ultrasensitive gas sensor based on Pd/SnS2/SnO2 nanocomposites for rapid detection of H2. Sens. Actuators B Chem. 2022, 359, 131612. [Google Scholar] [CrossRef]
  44. Kumar, M.; Bhati, V.S.; Ranwa, S.; Singh, J.; Kumar, M. Pd/ZnO nanorods based sensor for highly selective detection of extremely low concentration hydrogen. Sci. Rep. 2017, 7, 1–9. [Google Scholar] [CrossRef]
  45. Zhang, H.; Li, Z.; Yi, J.; Zhang, H.; Zhang, Z. Potentiometric hydrogen sensing of ordered SnO2 thin films. Sens. Actuators B Chem. 2020, 321, 128505. [Google Scholar] [CrossRef]
  46. Van Toan, N.; Chien, N.V.; Van Duy, N.; Hong, H.S.; Nguyen, H.; Hoa, N.D.; Van Hieu, N. Fabrication of highly sensitive and selective H2 gas sensor based on SnO2 thin film sensitized with microsized Pd islands. J. Hazard. Mater. 2016, 301, 433–442. [Google Scholar] [CrossRef] [PubMed]
  47. Thai, N.X.; Van Duy, N.; Van Toan, N.; Hung, C.M.; Van Hieu, N.; Hoa, N.D. Effective monitoring and classification of hydrogen and ammonia gases with a bilayer Pt/SnO2 thin film sensor. Int. J. Hydrogen Energy 2020, 45, 2418–2428. [Google Scholar] [CrossRef]
  48. Chang, C.-H.; Chou, T.-C.; Chen, W.-C.; Niu, J.-S.; Lin, K.-W.; Cheng, S.-Y.; Tsai, J.-H.; Liu, W.-C. Study of a WO3 thin film based hydrogen gas sensor decorated with platinum nanoparticles. Sens. Actuators B Chem. 2020, 317, 128145. [Google Scholar] [CrossRef]
  49. Wang, R.-H.; Wen, W.; Zheng, S.; Ye, Z.; Wu, J.-M. Layered mesoporous SnO2 for effective ethanol detection at reduced working temperature. Sens. Actuators B Chem. 2022, 362, 131805. [Google Scholar] [CrossRef]
  50. Yamazoe, N.; Kurokawa, Y.; Seiyama, T. Effects of additives on semiconductor gas sensors. Sens. Actuators 1983, 4, 283–289. [Google Scholar] [CrossRef]
  51. Kolmakov, A.; Klenov, D.O.; Lilach, Y.; Stemmer, S.; Moskovits, M. Enhanced gas sensing by individual SnO2 nanowires and nanobelts functionalized with Pd catalyst particles. Nano Lett. 2005, 5, 667–673. [Google Scholar] [CrossRef]
Figure 1. Schematic of the hydrogen gas sensing test set-up used for electrical resistance measurements of a Pd caped SnO2 thin-film sensor.
Fuels 04 00018 g001
Figure 2. (a): X-ray diffraction (XRD) patterns and (b) UV-Vis absorption spectra of L1, L2, and L3 thin film sensors.
Fuels 04 00018 g002
Figure 3. FE-SEM images of L1 (a), L2 (d), and L3 (g) thin film sensors, along with their corresponding cross-section thickness in L1 (b), L2 (e), and L3 (h) images. The EDAX pattern and chemical composition (inset (c,f,i)) of Tin, Oxide, and Palladium in thin film sensors L1 (c), L2 (f), and L3 (i) are also shown. Additionally, 2D-AFM images of L1 (j), L2 (k), and L3 (l) are included.
Fuels 04 00018 g003
Figure 4. XPS spectra of L2 thin film sensor including (a) XPS survey spectra of Pd caped SnO2 thin films and high resolution spectra for (b) Sn 3d, (c) Pd 3d, and (d) O 1s.
Fuels 04 00018 g004
Figure 5. (a) Response (%) of L1, L2, and L3 sensors at different temperatures. (bd) Transit response and recovery graphs of L1, L2, and L3 sensors in the presence of 5–500 ppm H2 gas at 250 °C. (e,f) Transit response and recovery time graphs of L1, L2, and L3 sensors in the presence of 5–500 ppm H2 gas at 250 °C.
Fuels 04 00018 g005
Figure 6. (a,b) Repeatability of the L1 sensor on the initial day and after 60 days in the presence of 500 ppm H2 gas. (c,d) Repeatability of the L2 sensor on the initial day and after 60 days in the presence of 500 ppm H2 gas. (e,f) Repeatability of the L3 sensor on the initial day and after 60 days in the presence of 500 ppm H2 gas.
Fuels 04 00018 g006
Figure 7. (a) Voltage–Current graph of L1, L2, and L3 sensors in 500 ppm H2 gas at 250 °C. (b) Stability of L1, L2, and L3 sensors after 60 days in the presence of 500 ppm H2 gas. (c) Stability of L1, L2, and L3 sensors in relative humidity (0–80% RH) in the presence of 500 ppm H2 gas. (d) Stability of L1, L2, and L3 sensors after 60 days in 60% RH in the presence of 500 ppm H2 gas. (e) Selectivity of sensors L1, L2, and L3 in different gases (H2, CO, NH3, and NO2) in air and 60% RH, with all gases present at a concentration of 500 ppm, (f) Sensitivity (%) vs. H2 gas concentration (ppm).
Fuels 04 00018 g007
Figure 8. (a) Chemical and electronic reactions occurring on the surface of Pd-caped SnO2 thin film in both air and H2 gas atmospheres. (b) Schematic band diagram of Pd caped SnO2 thin film with p-PdO type heterostructure on n-SnO2 type thin film in air atmosphere. (c) Schematic band diagram of Pd caped SnO2 thin film in the presence of H2 gas.
Fuels 04 00018 g008
Table 1. XRD Results, RMS Value of AFM Images, and Band Gap of L1, L2, and L3. thin film sensors.
Thin FilmsCrystallinity (nm)Inter Planer DistanceLattice Constant (a = b)Lattice Constant (c)Lattice
Strain (ε)
Dislocation
Density (δ) Line/m2
Resistance
(MΩ) (in Air at RT.)
RMS
Values
(nm)
Band Gap
(eV)
L1 sensor8.423.274.633.241.0020.0141.415.893.91
L2 sensor11.583.254.613.290.7250.0071.155.003.84
L3 sensor12.673.244.603.320.6630.0061.654.243.78
Table 2. Comparative Study of Our Sensor’s Sensing Parameters to Other Sensors with Similar Thickness to H2 gas Detection in high Moisture.
S.No.MaterialsMorphologySynthesis
Process
Thickness of SensorsH2 Gas (ppm)Operating Temp. (°C)Sensitivity
S *   ( % )   =   R a R g R a × 100 ,   S   =   R a R g
Response
Time (s)
Recovery Time (s)Ref.
1.Pd/SnO2Thin filmsSputtering40 nm10003002815 (250 ppm)4 (250 ppm)[46]
2.Pt/SnO2Thin filmDC SputteringPt-5 nm, SnO2-150 nm25020051.650320[47]
3.RTE Pt NP/WO3Thin filmRapid thermal evaporation (RTE)/sputtering4 nm (WO3 film)1 ppm2001.41 × 10620126[48]
4.Pd/SnO2Thin filmSputtering300 nm10002502.3__[45]
5.Pd/amorpusWO3Thin filmE-beam evaporation550 nm1%RT57*40016[13]
6.SnO2@TiO2Nano rodsHydrothermal_50010015.411132[25]
7.Pd/CuOThin filmSputtering283 nm10003003.011050[26]
8.1.0 at% Pd/SnS2/SnO2Nano compositesHydrothermal_5003009519[43]
9.Pd/WO3Thin filmSputtering100 nm2%300340*345293[41]
10.Pt/SnO2Thin film arraySputtering150 nm2502418.2__[40]
11.PdO-WO3 filmThin filmPolyol process with metal
organic decomposition (MOD)
2.54 μm10016045.1/29 (40%RH, with N2 atmosphere)4110[36]
12.Pt/In2O3-doped SnO2
sensor
Thin filmSol–gel
dip-coating technique
_600RT.1050* (14% RH)/134 (65%RH)__[24]
13.Pd-SnO2Thin FilmSputtering246.1 nm50025099*/96.15 (80% RH)64 (100 ppm)
58 (5 ppm)
41.7(100 ppm)
35 (5 ppm)
This work
Disclaimer/Publisher’s Note: The statements, opinions and data contained in all publications are solely those of the individual author(s) and contributor(s) and not of MDPI and/or the editor(s). MDPI and/or the editor(s) disclaim responsibility for any injury to people or property resulting from any ideas, methods, instructions or products referred to in the content.

