
Trusting the Trust Game: An External Validity Analysis with a UK Representative Sample

1
Department of Geography and Environment, London School of Economics, London WC2A 2AE, UK
2
Department of Psychological and Behavioural Science, London School of Economics, London WC2A 2AE, UK
3
Department of Government, London School of Economics, London WC2 2AE, UK
*
Author to whom correspondence should be addressed.
Games 2021, 12(3), 66; https://0-doi-org.brum.beds.ac.uk/10.3390/g12030066
Submission received: 15 June 2021
/
Revised: 5 August 2021
/
Accepted: 20 August 2021
/
Published: 3 September 2021
(This article belongs to the Section Behavioral and Experimental Game Theory)
Abstract
:Using a nationally representative sample of 1052 respondents from the United Kingdom, we systematically tested the associations between the experimental trust game and a range of popular self-reported measures for trust, such as the General Social Survey (GSS) and the Rosenberg scale for self-reported trust. We find that, in our UK representative sample, the experimental trust game significantly and positively predicts generalised self-reported trust in the GSS. This association is robust across a number of alternative empirical specifications, which account for multiple hypotheses corrections and control for other social preferences as measured by the dictator game and the public good game, as well as for a broad range of individual characteristics, such as gender, age, education, and personal income. We discuss how these results generalise to nationally representative samples from six other Organisation for Economic Co-operation and Development (OECD) countries (France, Germany, Italy, Korea, Slovenia, and the US).
1. Introduction
Experimental games such as the trust game (Berg et al. [1]) have been extensively used by behavioral economists to elicit key social preferences, such as trust and trustworthiness. Together with the dictator game (Forsythe et al. [2]) and the public good game (Andreoni [3]), the trust game is one of the most widely used experimental games of strategic interaction, by not only economists, but also by researchers in political science, neuroscience, marketing, game theory, sociology, psychology, etc.
In the classic trust game by Berg, Dickhaut, and McCabe (BDM [1]), two participants are randomly matched, and one acts as sender while the other one acts as receiver. Both are initially endowed with £10, and the sender decides the amount to send to the receiver, T ∈ [0, 10]. This amount is tripled and transferred to the receiver. Finally, the receiver decides to send an amount Y back to the sender. T normally captures the experimental trust of the sender, whilst Y captures the experimental trustworthiness of the receiver.
A number of studies, systematically reviewed and summarized by Galizzi and Navarro-Martinez [4], have looked at the external validity of the trust game by trying to predict field behaviors or self-reported trust or trustworthiness using experimental trust games (Ashraf et al. [5]; Baran et al. [6]; Bellemare and Kröger, [7]; Bennett et al. [8]; Bouma et al. [9]; Cardenas et al. [10]; Carter and Castillo [11]; Ermisch et al. [12]; Fehr et al. [13]; Glaeser et al. [14]; H. J. Holm and Danielson [15]; Karlan [16]; Riedl and Smeets [17]). We review in greater detail these studies in the next section, but their main findings are as follows: whilst some studies find that the experimental trust and trustworthiness measured in the trust game can predict some field behaviours, the evidence is much more mixed and contradictory for predicting survey questions on self-reported trust or trustworthiness.
In this article we contribute to the existing literature by systematically testing the associations between the trust game and a range of popular self-reported measures for trust and trustworthiness, such as the General Social Survey (GSS) question on trust and the Rosenberg scale for self-reported trust. We do so by using data collected by the Organisation for Economic Co-operation and Development (OECD) Trustlab in the UK (Murtin et al. [18]), a large nationally representative sample of the UK population (n = 1052). In our estimates, we control for other social preferences as measured by other games, such as the dictator game and the public good game, and we correct for multiple hypothesis testing.
Our main finding is that trust, measured by the experimental trust game, significantly and positively predicts generalised self-reported trust in the GSS question. To the best of our knowledge, this is the first time that such an association is documented. This is also the first time that such an association is documented using a nationally representative sample. We also add a variety of robustness checks in our estimates, including alternative empirical specifications controlling for a broad range of individual characteristics, as well as a replication of our results using nationally representative samples of six other OECD countries (France, Italy, Germany, Korea, Slovenia, and the US).
2. Literature Review
Galizzi and Navarro-Martinez [4] conducted a systematic review of the literature and meta-analysis of all the studies that have looked at the external validity of social preferences games, such as the dictator game, the ultimatum game, the trust game, and the public good game. Focusing on the trust game, they found a total of 13 studies that have analysed the external validity of experimental trust and trustworthiness as measured in incentive-compatible trust games. Their review shows that the experimental trust and trustworthiness, in particular, have been used to predict a variety of variables outside of the lab, including survey questions on self-reported trust, and a range of field behaviours as diverse as: hours spent volunteering, per-capita household expenditure, frequency of past trustful behaviour, default on loans, dropping out of loans, voluntary savings, household investment in soil and water conservation, household contribution to soil and water maintenance, outcome per worker, earnings, being active in an organization on a regular basis, giving donations to a business school by respondents who previously studied there for a MBA, participating in social organization and attending their meetings, holding a socially responsible investment and its amount.
The studies reviewed by Galizzi and Navarro-Martinez [4] typically test the external validity of the trust games by running regression models where the dependent variables are the field behaviours (including the self-reported measures of trust) and the explanatory variables are the experimental trust games, possibly with further control variables. Those studies interpret the estimated coefficients of the regressions, if statistically significant, as indicators of the fact that the experimental trust games are good predictors of the field behaviours and are therefore ‘externally valid’. When assessing the external validity of the experimental trust games, that literature does not typically focus on the overall goodness of fit of the conducted regressions. In their meta-analysis, Galizzi and Navarro-Martinez [4] indeed discuss the extent to which the considered studies report, and comment on, issues broader than just the analysis of the estimated coefficients, such as the use of control variables and the overall goodness of fit of the regressions. From the same systematic review and meta-analysis by Galizzi and Navarro-Martinez [4], it also emerges that no study to date has considered large representative samples of the population, and none have used corrections for multiple hypothesis testing.
Looking at the findings of the systematic literature review and meta-analysis by Galizzi and Navarro-Martinez [4], one can conclude that the evidence on the external validity of the experimental trust and trustworthiness measured in the trust games is quite mixed. Whilst some studies find trust and trustworthiness predict some important field behaviours, the evidence is much more mixed and contradictory when predicting self-reported survey questions on trust. In particular, four studies have shown that experimental trust is unable to predict thirteen questions on self-reported trust (Ashraf et al. [5]; Fehr et al. [13]; Glaeser et al. [14]; H. J. Holm and Danielson [15]). Experimental trustworthiness seems instead able to predict some of the questions on self-reported trust and self-reported trustworthiness: it predicts three out of ten self-reported trust questions and one out of three self-reported trustworthiness questions (Ashraf et al. [5]; Fehr et al. [13]; Glaeser et al. [14]; Holm and Danielson [15]).
So, to summarise, by looking at the evidence to date one can conclude that experimental trust does not predict self-reported trust, and that experimental trustworthiness fares somehow better at predicting self-reported trust and self-reported trustworthiness.
Galizzi and Navarro-Martinez [4] also critically review and discuss some of the possible arguments and reasons that have been proposed in the literature (e.g., Levitt and List, 2007a,b [19,20]) to explain the lack of external validity of the experimental trust games, and, in general, of the social preferences games: (i) the fact that participants in the lab make decisions under the close scrutiny of an experimenter; (ii) the fact that their decisions are unlikely to be anonymous; (iii) the specific lab setting of the decisions; (iv) the low monetary stakes of the decisions; (v) the characteristics of the participants self-selecting into lab experiments; (vi) the artificiality of the choice sets and of the time horizons; (vii) the lack of repeated interactions over longer periods of time; and (viii) the lack of context in the lab games. Another possible reason is that some of the studies reviewed above (e.g., Fehr et al. [13]; Glaeser et al. [14]) use the strategy method to implement the decisions made by players 2 in the trust games. All these reasons can be used to argue that the trust games typically used in lab experiments can measure individual constructs different, or more nuanced or complex, than just trust and trustworthiness, and therefore might not be expected to be externally valid.
3. Data and Methodology
3.1. Survey Design
We use data collected by the OECD Trustlab survey on social preferences on a sample of 1052 respondents in the United Kingdom (Murtin et al. [18]). Respondents were sampled and surveyed online by a professional company in July 2018, and the sample was nationally representative by age, gender, and income. Respondents were compensated for participation, and all experimental tasks in the survey were incentive compatible. The survey lasted approximately 35 min, and participants were recommended to complete it in one sitting. The survey comprised of three main modules. In module one, respondents were asked to partake in three incentive-compatible experimental tasks using real monetary rewards, namely a trust game (Berg et al. [1]), a public good game (Andreoni [3]), and a dictator game (Forsythe et al. [2]), to elicit their experimental trust (and trustworthiness), cooperation, and altruism, respectively. Following this, respondents participated in the Binswanger, Eckel, and Grossman (Binswanger [21,22]; Eckel and Grossman [23,24]) multiple-lotteries risk elicitation task, including an adapted variant with higher stakes. In module two, respondents’ implicit attitudes towards public institutions were measured using a single category Implicit Association Test (Karpinski and Steinman [25]). Finally, in module three, participants answered a battery of survey questions, including various measures of self-reported trust.
To test the generalization of our findings, we extend our analysis to a pool of 6025 additional respondents from nationally representative samples of six other OECD countries collected as part of the OECD Trustlab project (France, Germany, Italy, Korea, Slovenia, and the US). A list of all the survey questions and variables and their codebook is available in Murtin et al. [18].
3.2. Variables
3.2.1. Outcome Variables
We use five self-reported measures of trust as our primary outcome variables. These include two generalised measures of trust: the first is based on the standard General Social Survey (GSS) question asking respondents ‘Generally speaking, would you say that most people can be trusted or that you need to be very careful in dealing with people’ with answers measured on an 11-point Likert scale; the second question is an adapted version of the Rosenberg [26] question, hereby referred to as the OECD Generalised Trust question, asking participants ‘In general, how much do you trust most people?’, with answers measured on an 11-point Likert scale as well. The third outcome variable is a binary measure of trust using the hypothetical lost wallet question: ‘If you lost a wallet or a purse that contained items of great value to you, and it was found by a stranger, do you think it would be returned with its contents, or not?’. The last two outcome variables are two composite measures of trust, one for institutional trust, the other for interpersonal trust, as obtained by a factor analysis on a battery of self-reported questions measuring trust in a variety of institutions and individuals, respectively. Table 1 below reports the Pearson’s correlation coefficients among these five trust measures. Our five measures of self-reported trust are positively and marginally significantly correlated with each other (for summary statistics, see Table A1).
3.2.2. Explanatory Variables and Covariates
The two main explanatory variables to predict our self-reported measures of trust are the experimental measures of trust and trustworthiness, as elicited by the Berg, Dickhaut, and McCabe (BDM [1]) trust game. Recall that this game has two participants initially endowed with £10. The sender decides how much to send to the receiver, T ∈ [0, 10]. This amount is tripled and transferred to the receiver. The receiver decides to send an amount Y back to the sender. The final payoffs are (10 − T + Y) for the sender and (10 + 3T − Y) for the receiver. T measures our experimental trust (Camerer et al. [27]), while Y measures our experimental trustworthiness. In the Trustlab games, each respondent played both roles, acting as a sender and receiver subsequently. First, respondents decided on the amount they wished to send to their unknown counterparts. Second, we elicited trustworthiness with the strategy method: respondents indicated the amount Y they would return for every possible amount T offered by the other player. Our experimental measure of trustworthiness is the average amount sent back. In terms of payment, we randomly matched two players and selected one of the roles for each player.
Furthermore, we use three covariates, namely altruism, cooperation, and reciprocity, to control for other social preferences of our respondents. Altruism is measured by how much the respondent offers to a matched participant in a dictator game with an initial endowment of £10. Cooperation is measured as the contribution, from an initial endowment of £10, made in a public goods game. Finally, our subjects played two public good games: a standard one and a conditional one. The conditional public good game allows to measure Reciprocity: respondents had to state how much they would contribute to a public game conditional on the average contribution of other players. In this way we were able to control for whether subjects contributed more or less than the average contribution of others, a notion akin to reciprocity. Table 2 below reports the Pearson’s correlation coefficients among our various experimental measures of social preferences. Our experimental measure of trust is positively and marginally significantly correlated with trustworthiness, and also with other social preferences, in particular altruism and cooperation. Reciprocity is not correlated with other experimental measures (for summary statistics, Table A2).
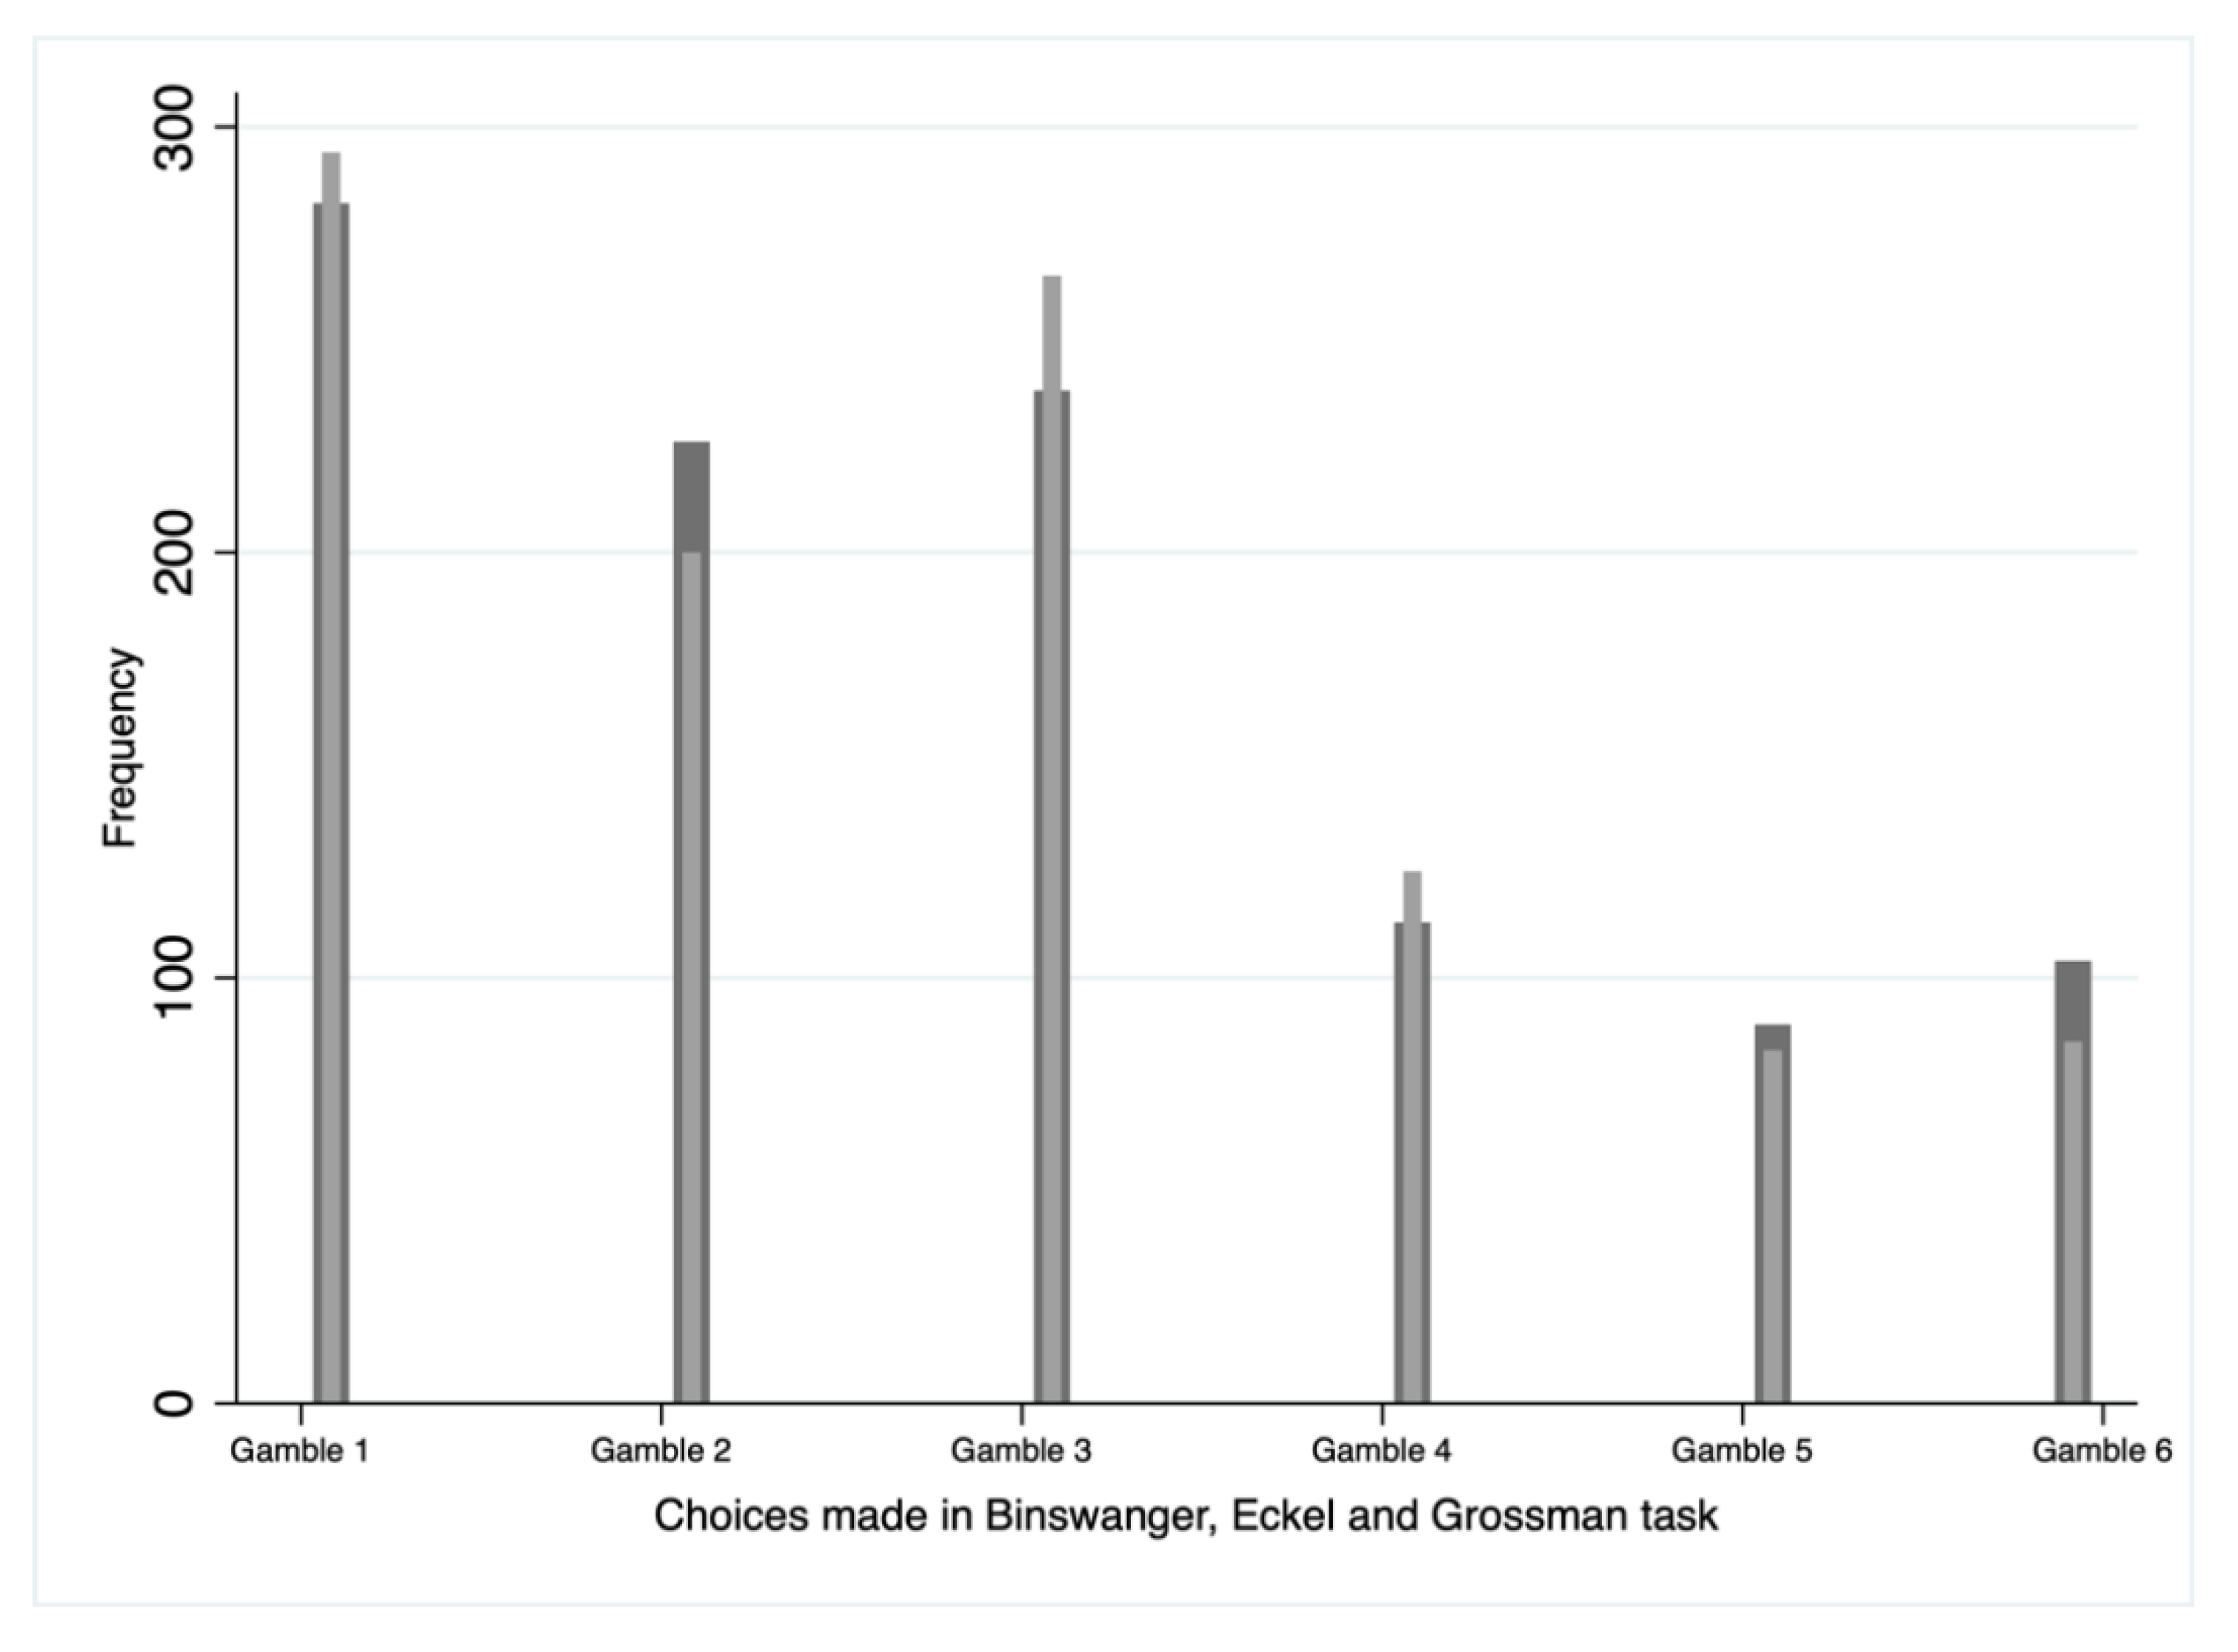
We also control for individual risk aversion as measured by their lottery choice in the Binswanger, Eckel, and Grossman (BEG) task. The risk taken by a respondent corresponds to the standard deviation of the expected payoff from their chosen lottery. Figure 1 below shows the frequency of choosing the six lotteries in the BEG task. The wider grey bars correspond to choices made in the first BEG task where the highest risk attainable is 9 pounds. The narrow grey bars correspond to a second BEG task where the riskiest gamble has a standard deviation of 36 pounds (for details, see Table A3). The proportion of respondents who are considerably risk-averse increases as the risk involved in the tasks increase: for instance, more respondents chose gambles 5–6 in the second BEG task relative to the first task. We also control for socio-demographic characteristics of respondents (for summary statistics, see Table A4).
3.3. Empirical Strategy
Our empirical strategy tests the external validity of experimental trust and trustworthiness by using them to predict a variety of self-reported trust measures. We outline our model specifications to test the following main hypotheses in our UK nationally representative sample:
Hypothesis 1 (H1).
Experimental trust significantly predicts self-reported trust measures, and this holds true when controlling for other social preferences.
Hypothesis 2 (H2).
Experimental trustworthiness significantly predicts self-reported trust measures, and this holds true when controlling for other social preferences.
To test these hypotheses, we use multiple linear regression models with and without a set of control variables. In testing for H1, we estimate the model specification (3) below: (Alternatively, we used an additional specification following Wilson [28] to create a truncated measure of experimental trust. This involves a two-step process. We first regress our experimental measure of trust on measures of altruism, cooperation, and reciprocity, and predict the residuals. This residual trust measure is our truncated indicator of experimental trust, and it is non-confounded with any other regarding preferences. Next, we use this truncated measure of residual trust, independent of any other regarding preferences, to predict our self-reported survey trust measures. We adjust for the standard errors to reflect this two-step estimation procedure. Model specifications (1) and (2) reflect this estimation strategy below:
Experimental Trusti = α1 + β1 Altruismi + β2 Cooperationi + β3 Reciprocityi + ε1i
Self-Reported Trusti = α2 + β4 Residual Experimental Trusti + ε2i
Model specification (2) is repeated for our five different outcome variables, namely the GSS, OECD generalised trust, lost wallet, institutional, and interpersonal trust measures).
Self-Reported Trusti = α2 + β Experimental Trusti + δ11 Altruismi + δ12 Cooperationi + δ13 Reciprocityi + ε3i
In testing H2, we estimate the model specification (4) below:
Self-Reported Trusti = α2 + β Experimental Trustworthinessi + δ11 Altruismi + δ12 Cooperationi + δ13 Reciprocityi + ε3i
For robustness checks, we run simple linear regression without including any additional covariates as reported in (3) and (4). We also add further controls for risk-aversion and socio-demographic characteristics of our respondents. In the results section, we report p-values corrected for multiple hypotheses testing using the Holm (Holm [29]) correction procedure. We have also replicated all the analyses and results using the alternative Romano-Wolf correction for multiple hypotheses testing (Clarke et al. [30]) with no substantial difference in the findings (available on request). We present these findings in the next section.
4. Results
4.1. Descriptive Statistics
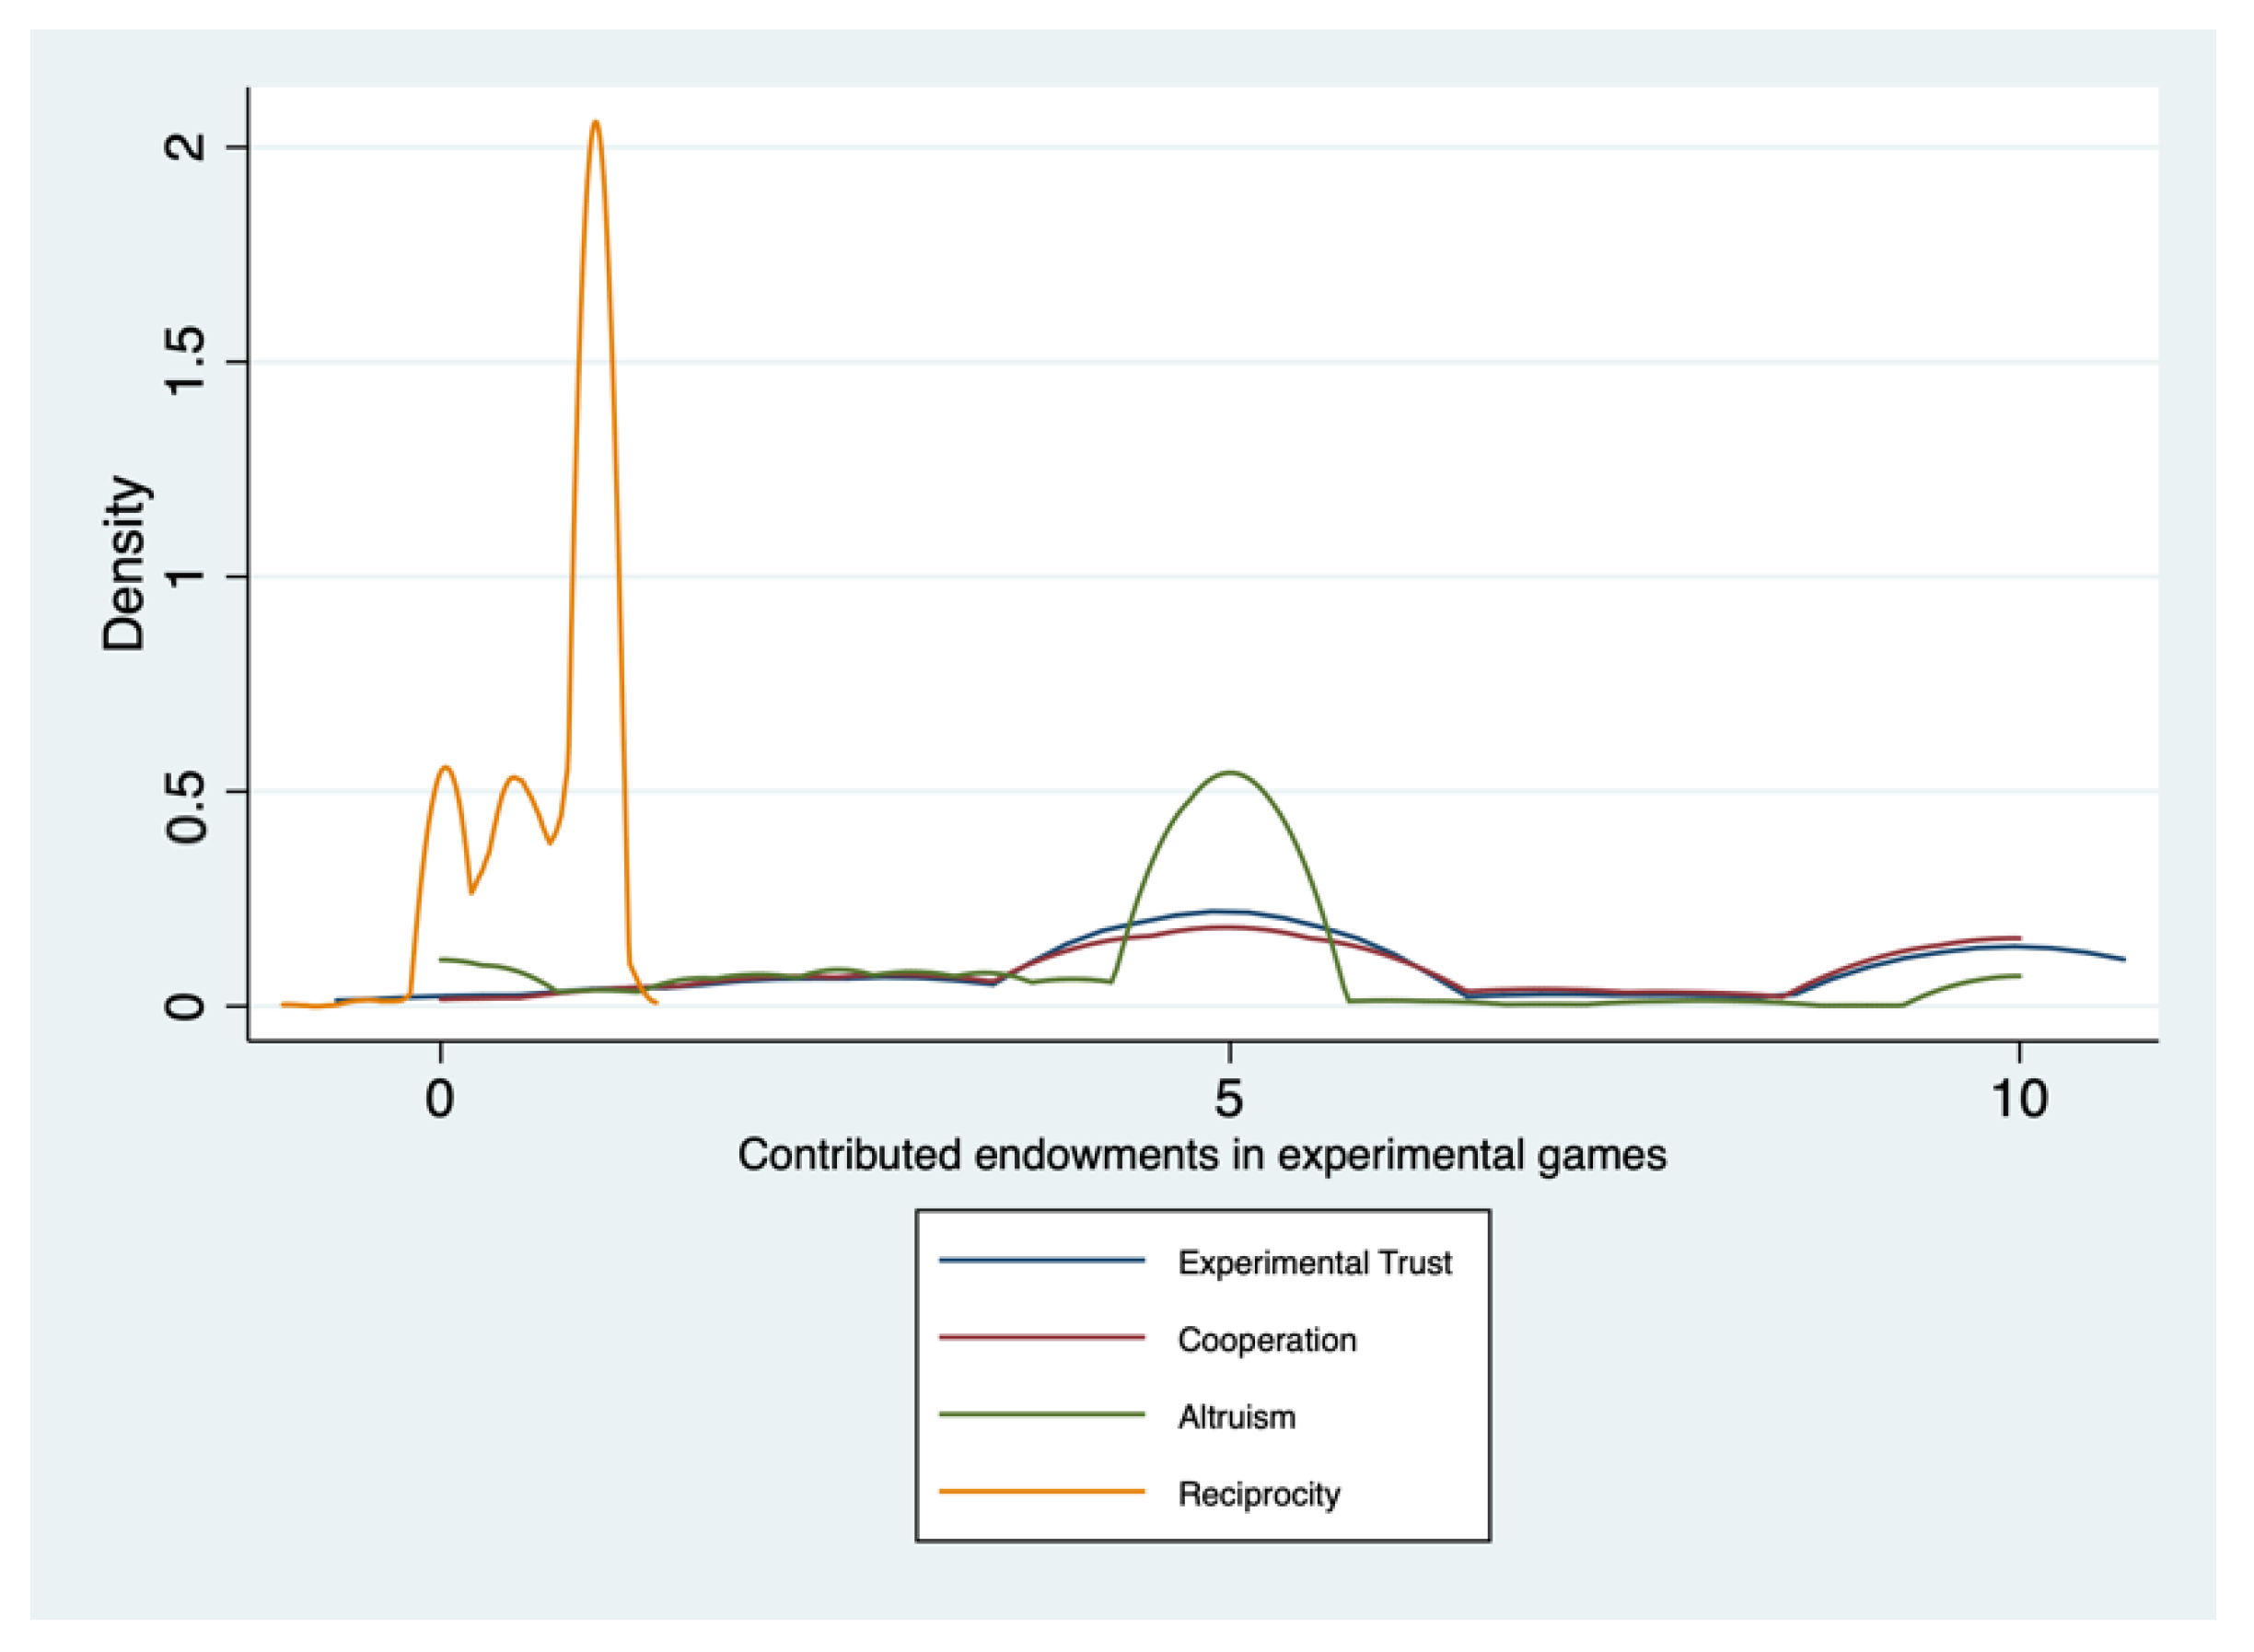
Our sample of respondents is representative by age, gender, and income. Table A4 reports the demographic characteristics of the sample. In line with prior experimental evidence, we find that our sample exhibits trusting behaviour, with a mean experimental contribution of £5.89 (σ = 2.95) in the trust game (experimental trust). In the public goods game, we find an unconditional (cooperation) and conditional (reciprocity) contribution of £6.19 (σ = 2.99) and £0.69 (σ = 1.36), respectively. Finally, in the dictator game, respondents send on average £4.29 (σ = 2.39) to their counterparts (altruism). The density plots of these contributions are shown in Figure 2: in the cases of trust and cooperation we observe a bimodal distribution with peaks in the middle point (£5) and the top (£10); in the case of altruism, we observe three typical responses: give nothing, give half the amount, and give the whole amount.
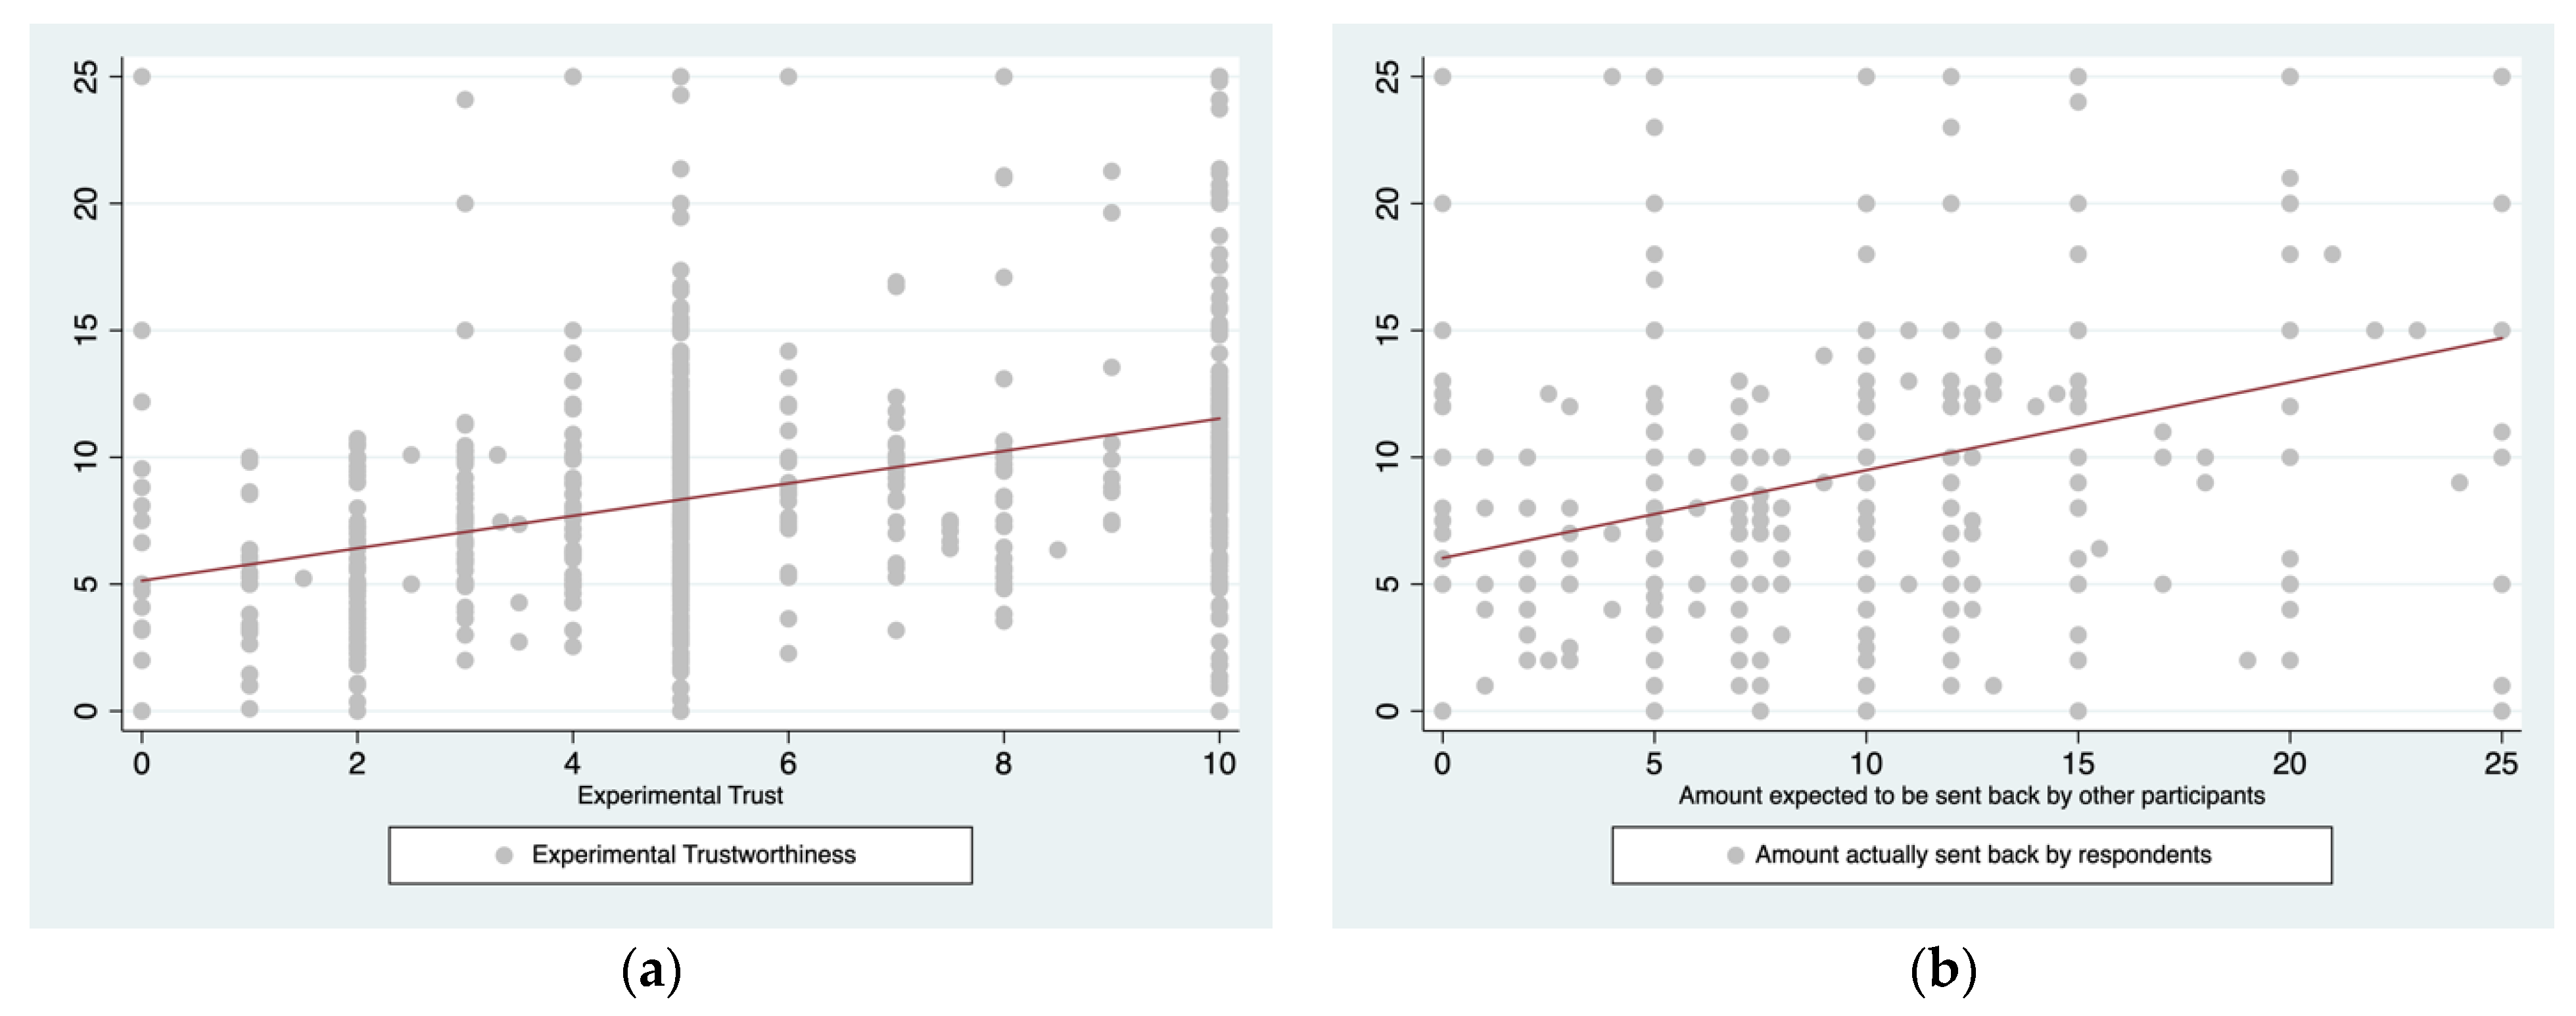
Respondents also exhibit high trustworthiness, with an average of £8.9 (σ = 4.74) returned by each respondent. Furthermore, in line with Wilson [28], we find that trust pays off: senders often receive more than they have paid out and, on average, expectations of receiving a certain payoff are matched (for details, see Figure A1). This is contrary to the seminal work by BDM in which first-movers had sent 5.16 USD, while second movers had paid back only 4.66 USD. This led to the proposition: trust does not payback. A plethora of similar findings in the literature often raises the concern that trust is on the decline (i.e., investment does not yield return at a given time). Nonetheless, like Wilson [28], our findings further demonstrate trust begets trustworthiness.
Experimental trust varies significantly with age: trust measures are highest in the group of 40–60-year-old individuals. Similarly, levels of cooperation increase with age. Furthermore, trust levels are higher for males (p = 0.0083) and lower for those who identify as Catholics (p = 0.0276). Both cooperation and altruism levels are also seen to be lower for Catholics. Experimental trust and cooperation are decreasing in the size of the household (p = 0.02). There are no significant differences in levels of trustworthiness by these demographic characteristics.
4.2. Are Self-Reported and Experimental Measures Correlated?
Table 3a presents Pearson correlation coefficients for our experimental and self-reported measures of trust and other-regarding preferences, adjusted for Bonferroni corrections. We find positive correlations between the GSS and the lost wallet self-reported measure of trust and the experimental measures of trust. The former is also positively correlated with experimental measure of trustworthiness.
4.3. Does Experimental Trust Predict Self-Reported Generalised Trust?
Table 3b presents our findings using model specification (3) to test for H1. The five columns in Table 3 correspond to different estimations for the five different survey measures of trust, namely, the OECD generalised trust, the General Social Survey, the lost wallet, and the interpersonal and institutional trust. When the estimations account for multiple hypotheses testing, we find that the experimental trust significantly and positively predicts self-reported trust as measured by the GSS question. Our results are robust across alternative specifications, such as a simple linear regression without any additional covariates or by including further control variables, such as risk aversion and using truncated experimental trust (see Table A5).
We further find that altruism, as measured by the contribution in the dictator game, significantly and positively predicts self-reported trust measures, with the only exception of the lost wallet question: for example, one standard deviation increase in experimental altruism is associated with an increase of ~0.13 standard deviation points in our generalised measures of trust. On the contrary, cooperation, as measured by the unconditional contribution in the public goods game, significantly and negatively predicts the OECD generalised trust measure: one standard-deviation point increase in cooperation is associated with a ~0.15 standard deviation point decrease in this generalised trust measure. Risk-preferences, as measured by the BEG game, do not significantly predict any self-reported trust measures.
Finally, we generalise our findings to an additional 6025 representative responses from the OECD Trustlab surveys in six other OECD countries, namely, France, Germany, Italy, Korea, Slovenia, and the United States. To this aim, we modify model specification (3) to include country-fixed effects. Our findings are presented in Table A5d for three outcome measures of survey trust, which were measured in all these countries. Controlling for individual country fixed effects besides demographic characteristics and other regarding preferences (The standard BEG risk game was played only in Germany, Italy, United Kingdom, and the United States; while the high stake BEG game was only played in the United Kingdom. We do not report these results because it limits our responses to a few countries. Nonetheless, the results in Table 3 are robust when controlled for risk-aversion), we find again that experimental trust significantly predicts generalised trust measured by the GSS. Unlike in Table 1, we also find experimental trust to significantly predict the OECD generalised trust and the lost wallet measure as well: while a standard-deviation increase in experimental trust is associated with ~0.04 standard-deviation increase in the GSS generalised trust, the same is associated with ~0.02 and ~0.01 standard-deviation increase in OECD generalised trust and lost wallet measures, respectively. These results are robust to multiple hypotheses correction as indicated in Table A5. In line with our prior findings, the predictive power of altruism towards the OECD, GSS, and lost wallet trust measures is robust to our country-fixed effects specification: a standard-deviation increase in altruism is associated with a ~0.1 standard-deviation increase in survey trust measures, ceteris paribus. A joint F-test comparing the larger model with country fixed effects to the nested model without such effects returns a p-value less than 0.001 for each of all three outcome measures of self-reported trust, indicating that the country fixed-effects model has a better fit than its nested counterpart.
4.4. Does Experimental Trustworthiness Predict Self-Reported Generalised Trust?
Table 4 presents our findings using model specifications (1) and (2) to test for H2. In this case, in the specification with control variables, we further control for reciprocity, as measured by the conditional contribution in the public good game, which is often found to be correlated with trustworthiness.
The main result is that experimental trustworthiness does not significantly predict the self-reported trust measures. It should be noticed here that our experimental measure of trustworthiness is derived by decisions made by players 2 in the trust games elicited with the strategy method. Whilst the use of the strategy method is common in the literature (Fehr et al. [13]; Glaeser et al. [14]), it may introduce some measurement errors in our experimental measure of trustworthiness. Our finding that experimental trustworthiness does not significantly predict self-reported trust measures can be explained by an attenuation bias related to the fact that our only explanatory variable (experimental trustworthiness) is indeed affected by such measurement errors.
In line with our findings in Table 3, altruism significantly predicts survey trust measures, with the exception, again, of the hypothetical lost wallet. We further find that reciprocity, as measured by conditional contribution to the public goods game, significantly and negatively predicts the OECD generalised measure of trust and also institutional trust. Our results are also robust to a simple linear regression specification without any additional covariates (see Table A5b).
Finally, we also generalise our analysis to evaluate the relationship between experimental trustworthiness and the survey trust measures using the country fixed effects. We find that a significant and positive correlation between the two measures is akin to our findings in Table 2. This correlation between experimental trustworthiness and the GSS trust measure is robust when controlling for experimental trust: conditional on controls, on average, a standard-deviation increase in experimental trustworthiness is significantly and positively correlated with a 0.05 standard-deviation increase in generalised trust.
5. Conclusions
We have systematically tested the associations between the experimental trust game and a range of popular self-reported measures for trust and trustworthiness, such as the General Social Survey (GSS) question on trust and the Rosenberg scale for self-reported trust. Innovatively, we have done this using a large, nationally representative sample of the UK population (n = 1052), controlling in our estimates for other social preferences as measured by other games such as the dictator game and the public good game, and correcting for multiple hypothesis testing.
Our main finding is that trust, as measured by the experimental trust game, significantly and positively predicts generalised self-reported trust in the GSS question. We have also conducted a variety of robustness checks in our estimates, including alternative empirical specifications controlling for a broad range of individual characteristics, as well as a replication of our results using nationally representative samples of six other OECD countries (France, Italy, Germany, Korea, Slovenia, and the US). To the best of our knowledge, this is the first time that evidence is provided that trust, as measured in an experimental trust game, significantly predicts self-reported trust. This is also the first time that such an association has been documented using a large nationally representative sample. This finding sheds a new, positive, light on the debate about the external validity of social preferences games (Campos-Mercade et al. [31]; Charness and Fehr [32]; Galizzi and Navarro-Martinez [4]; Levitt and List, 2007a,b [19,20]).
Author Contributions
Conceptualization, S.B., M.M.G. and R.H.-V.; methodology, S.B., M.M.G. and R.H.-V.; validation, M.M.G. and R.H.-V.; formal analysis, S.B.; investigation, S.B., M.M.G. and R.H.-V.; writing—original draft preparation, S.B., M.M.G. and R.H.-V.; writing—review and editing, S.B., M.M.G. and R.H.-V.; supervision, S.B., M.M.G. and R.H.-V.; funding acquisition, M.M.G. and R.H.-V. All authors have read and agreed to the published version of the manuscript.
Funding
This research was funded by the LSE Department of Psychological and Behavioural Science and by the LSE Department of Government. Funding is gratefully acknowledged.
Institutional Review Board Statement
The study was conducted according to the guidelines of the Declaration of Helsinki, and complied with the Research Ethics Policy by the Research Ethics Committee of the London School of Economics and Political Science (https://info.lse.ac.uk/staff/divisions/research-and-innovation/research/research-ethics/research-ethics) (accessed on 2 September 2021).
Informed Consent Statement
Informed consent was obtained from all the subjects involved in the study.
Data Availability Statement
More information about the OECD Trustlab project, its variables, data and results is publicly available here: https://0-www-oecd--ilibrary-org.brum.beds.ac.uk/economics/trust-and-its-determinants_869ef2ec-en (accessed on 2 September 2021).
Conflicts of Interest
The authors declare no conflict of interest.
Appendix A

Table A1.
Summary statistics of self-reported measures of trust.
| Variable | N | Mean | Standard Deviation | Minimum | Maximum |
|---|---|---|---|---|---|
| Rosenberg (Adapted) | 1043 | 6.562 | 2.227 | 0 | 10 |
| GSS | 1040 | 5.484 | 2.32 | 0 | 10 |
| Trust in wallet | 750 | 0.363 | 0.481 | 0 | 1 |
| Interpersonal Trust | 904 | 0 | 1 | −3.396 | 2.504 |
| Institutional Trust | 974 | 0 | 1 | −2.156 | 2.627 |
Table A2.
Summary statistics of experimental measures.
| Variable | N | Mean | Standard Deviation | Minimum | Maximum |
|---|---|---|---|---|---|
| Trust | 1052 | 5.889 | 2.947 | 0 | 10 |
| Trustworthiness | 1052 | 8.901 | 4.736 | 0 | 25 |
| Altruism | 1052 | 4.293 | 2.393 | 0 | 10 |
| Cooperation | 1052 | 6.195 | 2.996 | 0 | 10 |
| Reciprocity | 1052 | 0.699 | 0.384 | −1 | 1.364 |
Table A3.
Summary Statistics of BEG task 1.
| Risk Nature | Choice (50/50 Gamble) | Low Payoff (A) | High Payoff (B) | Expected Payoff (V) | Risk | Proportion of Sample | Proportion of Sample: Males |
|---|---|---|---|---|---|---|---|
| Highly Risk Averse | Gamble 1 | 8 | 8 | 8 | 0 | 0.268 | 0.26 |
| Moderately Risk Averse | Gamble 2 | 7 | 10 | 8.5 | 1.5 | 0.215 | 0.2 |
| Gamble 3 | 6 | 12 | 9 | 3 | 0.226 | 0.225 | |
| Gamble 4 | 5 | 14 | 9.5 | 4.5 | 0.107 | 0.094 | |
| Low Risk Seeker/Neutral | Gamble 5 | 4 | 16 | 10 | 6 | 0.085 | 0.105 |
| High Risk Seeker/Neutral | Gamble 6 | 1 | 19 | 10 | 9 | 0.099 | 0.113 |
Table A4.
Descriptive statistics of socio-demographic characteristics.
| Variables | Summary Statistics | ||||
|---|---|---|---|---|---|
| N | Mean | Std. Dev. | Min | Max | |
| Age | 1052 | 41.194 | 13.358 | 18 | 77.5 |
| Household Size | 1052 | 2.569 | 1.244 | 1 | 7 |
| Household Income | 1052 | 2829.38 | 22,639.039 | 0 | 692,820.31 |
| Proportions | |||||
| Region of United Kingdom | East Midlands | 7.79 | |||
| East of England | 10.17 | ||||
| London | 11.79 | ||||
| North East | 4.85 | ||||
| North West | 11.03 | ||||
| Northern Ireland | 2.28 | ||||
| Scotland | 8.37 | ||||
| South East | 12.17 | ||||
| South West | 9.51 | ||||
| Wales | 5.70 | ||||
| West Midlands | 7.70 | ||||
| Yorkshire and Humber | 8.65 | ||||
| Education | Less than high school | 2.85 | |||
| GCSE, O level or equivalent | 27.09 | ||||
| A level, International Baccalaureate, tech level or equivalent | 20.44 | ||||
| Certificate of higher education, diploma of higher education or other post school qualification other than university | 15.30 | ||||
| Undergraduate university degree (e.g., BA, BS) | 26.43 | ||||
| Post-graduate degree (e.g., MA, PhD) | 7.89 | ||||
| Nativity | Non-native | 10.46 | |||
| Native | 89.54 | ||||
| Race | White British | 83.94 | |||
| Other white | 6.08 | ||||
| Mixed/multiple ethnic groups | 2.38 | ||||
| Asian/Asian British | 4.09 | ||||
| Black/African Caribbean/Black British | 3.04 | ||||
| Other | 0.48 | ||||
| Religion | Not religious | 54.37 | |||
| Catholic | 11.88 | ||||
| Christian (Other) | 9.89 | ||||
| Muslim | 2.76 | ||||
| Jewish | 0.29 | ||||
| Buddhist | 0.67 | ||||
| Hindu | 0.76 | ||||
| Other | 2.00 | ||||
| Gender | Male | 46.39 | |||
| Female | 53.61 | ||||
Figure A1.
(a) Trust versus Trustworthiness (b) Expected Trustworthiness.

Table A5.
(a) Regression analysis of Trust without economic and other regarding preferences. (b) Regression analysis of Trustworthiness without economic and other regarding preferences. (c) Regression Analysis with Residual Experimental Trust. (d) Regression Analysis controlling for country fixed effects.
| (a) | |||||
| Outcome Measure | Model 1 | Model 2 | Model 3 | Model 4 | Model 5 |
| OECD Generalised Trust | GSS | Lost Wallet | Interpersonal Trust | Institutional Trust | |
| β (Robust se) Holm’s p-Value | |||||
| Experimental Trust | 0.038 | 0.097 *** | 0.021 *** | 0.031 ** | 0.018 |
| (0.025) | (0.026) | (0.006) | (0.012) | (0.013) | |
| 0.2777 | 0.0050 | 0.0080 | 0.0180 | 0.1708 | |
| Constant | 4.987 *** | 1.957 ** | −0.210 | −1.583 *** | −0.758 * |
| (0.698) | (0.714) | (0.157) | (0.332) | (0.378) | |
| Demographics | YES | YES | YES | YES | YES |
| N | 1043 | 1040 | 750 | 904 | 769 |
| Degrees of Freedom | 1019.000 | 1016.000 | 726.000 | 880.000 | 745.000 |
| R-Squared | 0.051 | 0.059 | 0.054 | 0.055 | 0.048 |
| (b) | |||||
| Outcome Measure | Model 1 | Model 2 | Model 3 | Model 4 | Model 5 |
| OECD Generalised Trust | GSS | Lost Wallet | Interpersonal Trust | Institutional Trust | |
| β (Robust se) p-Value | |||||
| Experimental Trust | 0.018 | 0.053 ** | 0.007 | 0.016 * | 0.013 |
| 0.015 | 0.016 | 0.004 | 0.008 | 0.009 | |
| 0.2208 | 0.0013 | 0.0518 | 0.0355 | 0.1415 | |
| Constant | 5.109 *** | 2.199 *** | −0.132 | −1.504 *** | −0.739 * |
| 0.688 | 0.696 | 0.157 | 0.329 | 0.373 | |
| 0.0000 | 0.0016 | 0.4007 | 0.0000 | 0.0479 | |
| Demographics | YES | YES | YES | YES | YES |
| N | 1043 | 1040 | 750 | 904 | 769 |
| Degrees of Freedom | 1019.000 | 1016.000 | 726.000 | 880.000 | 745.000 |
| R-Squared | 0.050 | 0.056 | 0.043 | 0.053 | 0.049 |
| (c) | |||||
| Outcome Measure | Model 1 | Model 2 | Model 3 a | Model 4 | Model 5 |
| OECD Generalised Trust | GSS | Lost Wallet | Interpersonal Trust | Institutional Trust | |
| β (Robust se) Holm’s p-Value | |||||
| Residual Experimental Trust | 0.054 | 0.080 ** | 0.015 * | 0.023 | 0.018 |
| (0.029) | (0.030) | (0.007) | (0.014) | (0.014) | |
| 0.2278 | 0.0350 | 0.1199 | 0.1778 | 0.2138 | |
| Risk-Aversion (BEG) | 0.002 | −0.002 | −0.008 | 0.011 | −0.016 |
| (0.038) | (0.038) | (0.008) | (0.019) | (0.020) | |
| 0.9530 | 1.00 | 1.00 | 1.00 | 1.00 | |
| Risk-Aversion (adapted BEG) | 0.018 | 0.014 | 0.003 | −0.003 | 0.004 |
| (0.010) | (0.010) | (0.002) | (0.005) | (0.005) | |
| 0.3397 | 0.7832 | 0.8691 | 0.4665 | 0.8132 | |
| Constant | 4.977 *** | 2.397 *** | −0.092 *** | −1.373 *** | −0.662 *** |
| (0.686) | (0.706) | (0.157) | (0.338) | (0.378) | |
| Demographics b | YES | YES | YES | YES | YES |
| N | 1043 | 1040 | 750 | 904 | 769 |
| Degrees of Freedom | 1017.000 | 1014.000 | 724.000 | 878.000 | 743.000 |
| R-squared | 0.059 | 0.056 | 0.046 | 0.051 | 0.048 |
| (d) | |||||
| Outcome Measure | Model 11 | Model 12 | Model 13 a | ||
| OECD Generalised Trust | GSS | Lost Wallet | |||
| β (Robust se) Holm’s p-Value | |||||
| Experimental Trust | 0.023 ** | 0.037 ** | 0.011 ** | ||
| (0.011) | (0.011) | (0.003) | |||
| 0.030 | 0.006 | 0.003 | |||
| Altruism | 0.103 ** | 0.094 ** | 0.011 ** | ||
| (0.014) | (0.013) | (0.003) | |||
| 0.003 | 0.002 | 0.004 | |||
| Cooperation | −0.002 | 0.018 | 0.008 ** | ||
| (0.011) | (0.011) | (0.003) | |||
| 0.8601 | 0.3037 | 0.003 | |||
| Country Effects (Baseline UK) | |||||
| United States | −0.537 *** | −0.048 | 0.014 | ||
| (0.119) | (0.111) | (0.027) | |||
| Slovenia | −0.254 * | −0.643 *** | 0.127 *** | ||
| (0.100) | (0.121) | (0.029) | |||
| Italy | −0.712 *** | −0.752 *** | −0.159 *** | ||
| (0.102) | (0.104) | (0.025) | |||
| Germany | −0.067 | 0.251 * | 0.051 | ||
| (0.101) | (0.100) | (0.026) | |||
| Korea | −0.309 * | −0.203 *** | |||
| (0.132) | (0.033) | ||||
| France | −0.557 *** | −0.177 *** | |||
| (0.131) | (0.027) | ||||
| Constant | 4.954 *** | 3.654 *** | 0.075 | ||
| (0.273) | (0.284) | (0.061) | |||
| Demographics b | YES | YES | YES | ||
| N | 5591 | 6676 | 4569 | ||
| Degrees of Freedom | 5563.000 | 6645.000 | 4538.000 | ||
| R-squared | 0.074 | 0.088 | 0.099 | ||
Legend: Holm’s * p < 0.05; ** p < 0.01; *** p < 0.001. Notes: superscript a. Linear Probability Model; superscript b. Includes age, highest educational qualification, country of nativity, household income, household size, gender, religion and region of residence in the UK.
References
- Berg, J.; Dickhaut, J.; McCabe, K. Trust, reciprocity, and social history. Games Econ. Behav. 1995, 10, 122–142. [Google Scholar] [CrossRef] [Green Version]
- Forsythe, R.; Horowitz, J.L.; Savin, N.E.; Sefton, M. Fairness in simple bargaining experiments. Games Econ. Behav. 1994, 6, 347–369. [Google Scholar] [CrossRef]
- Andreoni, J. Cooperation in public-goods experiments: Kindness or confusion? Am. Econ. Rev. 1995, 85, 891–904. [Google Scholar]
- Galizzi, M.M.; Navarro-Martinez, D. On the external validity of social preference games: A systematic lab-field study. Manag. Sci. 2019, 65, 976–1002. [Google Scholar] [CrossRef]
- Ashraf, N.; Karlan, D.; Yin, W. Tying odysseus to the mast: Evidence from a commitment savings product in the philippines *. Q. J. Econ. 2006, 121, 635–672. [Google Scholar] [CrossRef] [Green Version]
- Baran, N.M.; Sapienza, P.; Zingales, L. Can We Infer Social Preferences from the Lab? Evidence from the Trust Game; National Bureau of Economic Research: Cambridge, MA, USA, 2010. [Google Scholar] [CrossRef]
- Bellemare, C.; Kröger, S. On representative social capital. Eur. Econ. Rev. 2007, 51, 183–202. [Google Scholar] [CrossRef] [Green Version]
- Bennett, A.B.; Chi-Ham, C.; Barrows, G.; Sexton, S.; Zilberman, D. Agricultural biotechnology: Economics, environment, ethics, and the future. Annu. Rev. Environ. Resour. 2013, 38, 249–279. [Google Scholar] [CrossRef] [Green Version]
- Bouma, J.; Bulte, E.; van Soest, D. Trust and cooperation: Social capital and community resource management. J. Environ. Econ. Manag. 2008, 56, 155–166. [Google Scholar] [CrossRef]
- Cardenas, J.-C.; Janssen, M.; Bousquet, F. Dynamics of rules and resources: Three new field experiments on water, forests and fisheries. In Handbook on Experimental Economics and the Environment; Edward Elgar Publishing: Cheltenham, UK, 2013; Available online: https://www.elgaronline.com/view/edcoll/9781847206459/9781847206459.00020.xml (accessed on 24 August 2021).
- Carter, M.R.; Castillo, M. Trustworthiness and social capital in south africa: Analysis of actual living standards data and artifactual field experiments. Econ. Dev. Cult. Chang. 2011, 59, 695–722. [Google Scholar] [CrossRef] [Green Version]
- Ermisch, J.; Gambetta, D.; Laurie, H.; Siedler, T.; Uhrig, S.C.N. Measuring people’s trust. J. R. Stat. Soc. Ser. A (Stat. Soc.) 2009, 172, 749–769. [Google Scholar] [CrossRef] [Green Version]
- Fehr, E.; Fischbacher, U.; von Rosenbladt, B.; Schupp, J.; Wagner, G. A Nation-Wide Laboratory: Examining Trust and Trustworthiness by Integrating Behavioral Experiments into Representative Surveys; Institute for Empirical Research in Economics-University of Zurich: Zurich, Switzerland, 2003; Available online: https://econpapers.repec.org/paper/zuriewwpx/141.htm (accessed on 24 August 2021).
- Glaeser, E.L.; Laibson, D.I.; Scheinkman, J.A.; Soutter, C.L. Measuring trust *. Q. J. Econ. 2000, 115, 811–846. [Google Scholar] [CrossRef] [Green Version]
- Holm, H.J.; Danielson, A. Tropic trust versus nordic trust: Experimental evidence from tanzania and sweden *. Econ. J. 2005, 115, 505–532. [Google Scholar] [CrossRef]
- Karlan, D.S. Using experimental economics to measure social capital and predict financial decisions. Am. Econ. Rev. 2005, 95, 1688–1699. [Google Scholar] [CrossRef] [Green Version]
- Riedl, A.; Smeets, P. Why do investors hold socially responsible mutual funds? J. Financ. 2017, 72, 2505–2550. [Google Scholar] [CrossRef] [Green Version]
- Murtin, F.; Fleischer, L.; Siegerink, V.; Aassve, A.; Algan, Y.; Boarini, R.; González, S.; Lonti, Z.; Grimalda, G.; Vallve, R.H.; et al. Trust and Its Determinants: Evidence from the Trustlab Experiment; OECD Statistics Working Paper No. 2018/02; OECD Publishing: Paris, France, 2018. [Google Scholar] [CrossRef]
- Levitt, S.D.; List, J.A. Viewpoint: On the generalizability of lab behaviour to the field. Can. J. Econ./Rev. Can. D’économique 2007, 40, 347–370. [Google Scholar] [CrossRef] [Green Version]
- Levitt, S.D.; List, J.A. What do laboratory experiments measuring social preferences reveal about the real world? J. Econ. Perspect. 2007, 21, 153–174. [Google Scholar] [CrossRef] [Green Version]
- Binswanger, H.P. Attitudes Toward risk: Theoretical implications of an experiment in rural India. Econ. J. 1981, 91, 867–890. [Google Scholar] [CrossRef]
- Binswanger, H.P. Empirical estimation and use of risk preferences: Discussion. Am. J. Agric. Econ. 1982, 64, 391–393. [Google Scholar] [CrossRef]
- Eckel, C.C.; Grossman, P.J. Sex differences and statistical stereotyping in attitudes toward financial risk. Evol. Hum. Behav. 2002, 23, 281–295. [Google Scholar] [CrossRef]
- Eckel, C.C.; Grossman, P.J. Forecasting risk attitudes: An experimental study using actual and forecast gamble choices. J. Econ. Behav. Organ. 2008, 68, 1–17. [Google Scholar] [CrossRef]
- Karpinski, A.; Steinman, R.B. The single category implicit association test as a measure of implicit social cognition. J. Personal. Soc. Psychol. 2006, 91, 16–32. [Google Scholar] [CrossRef]
- Rosenberg, M.J. Cognitive structure and attitudinal affect. J. Abnorm. Soc. Psychol. 1956, 53, 367–372. [Google Scholar] [CrossRef]
- Camerer, C.; Loewenstein, G.; Rabin, M. Advances in Behavioral Economics; Russell Sage Foundation; Princeton University Press: Princeton, NJ, USA, 2004; Available online: https://0-ebookcentral-proquest-com.brum.beds.ac.uk/lib/londonschoolecons/detail.action?docID=5710059 (accessed on 24 August 2021).
- Wilson, R.K. Trust Experiments, Trust Games, and Surveys. The Oxford Handbook of Social and Political Trust; Oxford University Press: Oxford, UK, 2018. [Google Scholar] [CrossRef]
- Holm, S. A simple sequentially rejective multiple test procedure. Scand. J. Stat. 1979, 6, 65–70. [Google Scholar]
- Clarke, D.; Romano, J.P.; Wolf, M. The romano–wolf multiple-hypothesis correction in Stata. Stata J. 2020, 20, 812–843. [Google Scholar] [CrossRef]
- Campos-Mercade, P.; Meier, A.N.; Schneider, F.H.; Wengström, E. Prosociality predicts health behaviors during the COVID-19 pandemic. J. Public Econ. 2021, 195, 104367. [Google Scholar] [CrossRef] [PubMed]
- Charness, G.; Fehr, E. From the lab to the real world. Science 2015, 350, 512–513. [Google Scholar] [CrossRef] [PubMed]
Figure 1.
Frequency of choosing different gambles in the Binswanger, Eckel, and Grossman risk tasks. Legend: wider grey bars indicate choices in BEG task 1; narrow grey bars indicate choice in BEG task 2.
Figure 1.
Frequency of choosing different gambles in the Binswanger, Eckel, and Grossman risk tasks. Legend: wider grey bars indicate choices in BEG task 1; narrow grey bars indicate choice in BEG task 2.

Figure 2.
Contributions made in experimental games.

Table 1.
Pairwise correlation between self-reported trust measures with Bonferroni correction.
| Variables | OECD Generalised Trust | GSS | Returning Wallet | Interpersonal Trust | Institutional Trust |
|---|---|---|---|---|---|
| (1) OECD Generalised Trust | 1.000 | ||||
| (2) GSS | 0.576 * | 1.000 | |||
| (3) Trust in wallet | 0.241 * | 0.357 * | 1.000 | ||
| (4) Interpersonal Trust | 0.476 * | 0.597 * | 0.283 * | 1.000 | |
| (5) Institutional Trust | 0.452 * | 0.499 * | 0.234 * | 0.513 * | 1.000 |
* p < 0.1.
Table 2.
Pairwise correlation between experimental trust measures with Bonferroni correction.
| Variables | Trust | Trustworthiness | Altruism | Cooperation | Reciprocity |
|---|---|---|---|---|---|
| (1) Trust | 1.000 | ||||
| (2) Trustworthiness | 0.398 * | 1.000 | |||
| (3) Altruism | 0.270 * | 0.304 * | 1.000 | ||
| (4) Cooperation | 0.457 * | 0.307 * | 0.314 * | 1.000 | |
| (5) Reciprocity | −0.009 | 0.075 | −0.068 | 0.067 | 1.000 |
* p < 0.1.
Table 3.
(a) Correlation Analysis between self-reported and experimental social preference measures. (b) Regression Analysis with Experimental Trust as predictor.
Table 3.
(a) Correlation Analysis between self-reported and experimental social preference measures. (b) Regression Analysis with Experimental Trust as predictor.
| (a) | |||||
| OECD Generalised Trust | GSS | Lost Wallet | Interpersonal Trust | Institutional Trust | |
| Pearson Correlation Coefficient | |||||
| Experimental Trust | 0.046 | 0.120 * | 0.125 * | 0.086 | 0.054 |
| (0.134) | (0.000) | (0.001) | (0.010) | (0.135) | |
| Experimental Trustworthiness | 0.037 | 0.106 * | 0.077 | 0.072 | 0.066 |
| (0.239) | (0.001) | (0.035) | (0.031) | (0.069) | |
| Cooperation | −0.068 | 0.057 | 0.103 | 0.032 | −0.005 |
| (0.028) | (0.067) | (0.005) | (0.329) | (0.884) | |
| Reciprocity | −0.127 * | −0.090 | −0.025 | −0.042 | −0.113 |
| (0.000) | (0.004) | (0.500) | (0.204) | (0.002) | |
| Altruism | 0.112 * | 0.120 * | 0.074 | 0.116* | 0.109 |
| (0.000) | (0.000) | (0.042) | (0.000) | (0.002) | |
| (b) | |||||
| Outcome Measure | Model 1 | Model 2 | Model 3 a | Model 4 | Model 5 |
| OECD Generalised Trust | GSS | Lost Wallet | Interpersonal Trust | Institutional Trust | |
| β (Robust se) Holm’s p-Value | |||||
| Experimental Trust | 0.057 | 0.082 ** | 0.016 * | 0.025 | 0.019 |
| (0.028) | (0.030) | (0.007) | (0.013) | (0.014) | |
| 0.1469 | 0.025 | 0.0679 | 0.1179 | 0.1948 | |
| Altruism | 0.133 ** | 0.115 ** | 0.009 | 0.055 ** | 0.055 ** |
| (0.032) | (0.034) | (0.008) | (0.016) | (0.017) | |
| 0.005 | 0.003 | 0.2388 | 0.004 | 0.006 | |
| Cooperation | −0.108 ** | −0.026 | 0.007 | −0.011 | −0.027 * |
| (0.027) | (0.028) | (0.006) | (0.013) | (0.014) | |
| 0.005 | 0.7273 | 0.8511 | 0.4166 | 0.1878 | |
| Risk-Aversion (BEG) | 0.045 | −0.023 | −0.003 | −0.001 | −0.007 |
| (0.028) | (0.028) | (0.006) | (0.014) | (0.015) | |
| 0.5045 | 1.00 | 1.00 | 0.9680 | 1.00 | |
| Constant | 4.638 *** | 1.458 * | −0.262 | −1.811 *** | −0.870 * |
| (0.694) | (0.716) | (0.161) | (0.335) | (0.391) | |
| Demographics b | YES | YES | YES | YES | YES |
| N | 1043 | 1040 | 750 | 904 | 769 |
| Degrees of Freedom | 1016.000 | 1013.000 | 723.000 | 877.000 | 742.000 |
| R-squared | 0.081 | 0.072 | 0.058 | 0.070 | 0.065 |
(a) note: * p < 0.1. (b) note: Legend: Holm’s * p < 0.05; ** p < 0.01; *** p < 0.001; Notes: superscript a. Linear Probability Model; superscript b. Includes age, highest educational qualification, country of nativity, household income, household size, gender, religion, and region of residence in the UK.
Table 4.
Regression Analysis with Experimental Trustworthiness as predictor.
| Outcome Measure | Model 6 | Model 7 | Model 8 a | Model 9 | Model 10 |
| OECD Generalised Trust | GSS | Lost Wallet | Interpersonal Trust | Institutional Trust | |
| β (Robust se) Holm’s p-Value | |||||
| Experimental Trustworthiness | 0.017 | 0.039 * | 0.004 | 0.010 | 0.012 |
| (0.016) | (0.017) | (0.004) | (0.008) | (0.009) | |
| 0.2913 | 0.0237 | 0.2970 | 0.2165 | 0.1871 | |
| Altruism | 0.125 ** | 0.104 | 0.010 | 0.053 ** | 0.048 |
| (0.032) | (0.035) | (0.008) | (0.016) | (0.017) | |
| 0.0001 | 0.0031 | 0.2169 | 0.0007 | 0.0053 | |
| Cooperation | −0.084 ** | −0.001 | 0.012 | −0.002 | −0.021 |
| (0.025) | (0.026) | (0.006) | (0.013) | (0.013) | |
| 0.0007 | 0.9649 | 0.0583 | 0.8463 | 0.0995 | |
| Reciprocity | −0.603 ** | −0.494 | −0.020 | −0.128 | −0.282 |
| (0.174) | (0.195) | (0.048) | (0.091) | (0.095) | |
| 0.0005 | 0.0114 | 0.6769 | 0.1592 | 0.0031 | |
| Risk-Aversion (BEG) | 0.043 | 0.019 | −0.003 | −0.001 | −0.008 |
| (0.028) | (0.028) | (0.006) | (0.014) | (0.015) | |
| 0.1256 | 0.5033 | 0.6130 | 0.9303 | 0.5643 | |
| Constant | 5.223 *** | 1.975 ** | −0.209 | −1.667 *** | −0.638 |
| (0.708) | (0.723) | (0.163) | (0.346) | (0.408) | |
| Demographics b | YES | YES | YES | YES | YES |
| N | 1043 | 1040 | 750 | 904 | 769 |
| Degrees of Freedom | 1015.000 | 1012.000 | 722.000 | 876.000 | 741.000 |
| R-squared | 0.087 | 0.074 | 0.052 | 0.070 | 0.075 |
Legend: Holm’s * p < 0.05; ** p < 0.01; *** p < 0.001. Notes: superscript a. Linear Probability Model; superscript b. Includes age, highest educational qualification, country of nativity, household income, household size, gender, religion, and region of residence in the UK.
Publisher’s Note: MDPI stays neutral with regard to jurisdictional claims in published maps and institutional affiliations. |
© 2021 by the authors. Licensee MDPI, Basel, Switzerland. This article is an open access article distributed under the terms and conditions of the Creative Commons Attribution (CC BY) license (https://creativecommons.org/licenses/by/4.0/).
Share and Cite
MDPI and ACS Style
Banerjee, S.; Galizzi, M.M.; Hortala-Vallve, R. Trusting the Trust Game: An External Validity Analysis with a UK Representative Sample. Games 2021, 12, 66. https://0-doi-org.brum.beds.ac.uk/10.3390/g12030066
AMA Style
Banerjee S, Galizzi MM, Hortala-Vallve R. Trusting the Trust Game: An External Validity Analysis with a UK Representative Sample. Games. 2021; 12(3):66. https://0-doi-org.brum.beds.ac.uk/10.3390/g12030066
Chicago/Turabian StyleBanerjee, Sanchayan, Matteo M. Galizzi, and Rafael Hortala-Vallve. 2021. "Trusting the Trust Game: An External Validity Analysis with a UK Representative Sample" Games 12, no. 3: 66. https://0-doi-org.brum.beds.ac.uk/10.3390/g12030066
Note that from the first issue of 2016, this journal uses article numbers instead of page numbers. See further details here.