Changing Accretion Geometry of Seyfert 1 Mrk 335 with NuSTAR: A Comparative Study


Indian Institute of Astrophysics, II Block, Koramangala, Bangalore 560034, India
*
Author to whom correspondence should be addressed.
Galaxies 2021, 9(2), 21; https://0-doi-org.brum.beds.ac.uk/10.3390/galaxies9020021
Submission received: 19 February 2021
/
Revised: 20 March 2021
/
Accepted: 23 March 2021
/
Published: 25 March 2021
(This article belongs to the Special Issue Global Understanding of Accretion and Ejection around Black Holes)
Abstract
:We present a detailed spectral study of the narrow-line Seyfert 1 galaxy, Markarian 335, using eight epoch observations made between 2013 and 2020 with the Nuclear Spectroscopic Telescope Array. The source was variable during this period both in spectral flux and flow geometry. We estimated the height of the Compton cloud from the model fitted parameters for the whole observation period. This allowed us to investigate the underlying physical processes that drive the variability in X-rays. Our model fitted mass varies in a narrow range, between , however, given the large error bars, it is consistent with being constant and is in agreement with that known from optical reverberation mapping observations. The disk mass accretion rate reached a maximum of 10% of the Eddington rate during June 2013. Our study sheds light on mass outflows from the system and also compares different aspects of accretion with X-ray binaries.
1. Introduction
Active galactic nuclei (AGN) host an accretion disk with an energetic X-ray-producing Compton cloud (so-called corona) around a supermassive black hole at the center. The emitted X-ray radiation also acts as one of the most direct probes of accretion onto AGN. AGN show rapid flux and polarization variations, which indicate that the observed high energy radiation mainly originates from the inner few to tens of Schwarzschild radii (; , G, and c are the mass of the black hole, gravitational constant, and the speed of light, respectively) from the event horizon of the black hole [1]. The power-law (PL) component is widely accepted as the effect of inverse Compton scattering (ICS) of thermally produced soft photons from the accretion disk by a corona of hot electrons at the inner edge of the disk [2,3]. However, the geometry and size of the corona, as well as the physical mechanisms governing the energy transfer between the disk and the corona, are not well understood, which necessitates a physical model to better understand the observed signatures in them.
There are proposed models in the literature [4] that consider the corona to be the region between the truncation radius and the innermost stable circular orbit. However, it is not clear why the disk truncates at a certain radius from the central black hole and how the truncation radius is connected with the corona. Furthermore, most of the models in the literature [5,6] use optical depth, the coronal temperature, or the spectral index as a parameter to compute the spectrum from the corona. None of these are the basic physical quantities of accretion. According to the two-component advective flow (TCAF) model [7,8], at a certain distance from the black hole (BH) where the gravitational force balances with the centrifugal force, shock forms by the low angular momentum, hot, sub-Keplerian halo, and satisfies Rankine–Hugoniot conditions, which is the region of the truncation of the disk. Apart from that, as the two forces balance each other, accretion of matter virtually stops and its velocity decreases, which also increases the optical depth of the corona region. As the gravitational force dominates closer to the BH, velocity again increases and the flow passes through the inner sonic point and falls onto the BH, therefore the flow is transonic [7]. Beyond this shocked region, both the disk and halo matter pile up to decide the optical depth and temperature of the corona region. The same region also upscatters the incoming soft radiation from the disk via ICS. A typical X-ray spectrum of AGN in the 2–10 keV region shows primarily the signature of a PL. Due to ICS, the corona cools down and its area decreases, leading to a low brightness level and a softer spectrum [9]. These physical properties and the dynamics of the flow make TCAF more favorable as a physical model than other existing models in the literature. In addition to the above, TCAF uses mass accretion rates and the mass of the BH as model parameters, which are the basic physical quantities of a flow. Furthermore, the same shock location, which can explain the spectral features, may also be able to explain the temporal features from its oscillation [10,11]. Therefore, among the various models available in the literature to understand the observed X-ray emission in AGN, we preferred to consider the TCAF model for our study.
The TCAF model has five parameters: (i) mass of the black hole (), (ii) disk accretion rate (), (iii) halo accretion rate (), (iv) location of the shock (), and (v) shock compression ratio (R). Increasing and keeping the other parameters fixed increases the number of soft photons from the Keplerian disk [12], making the spectrum softer. Higher increases the corona temperature and hardens the spectrum. Similarly, increase of either or R leads to hardening of the spectrum. However, in reality all parameters change in multidimensional space. Therefore, such variations may not sustain due to non-linear changes in optical depth and coronal temperature in different epochs. A detailed parameter study has been made in [13]. In recent years, the TCAF model has been implemented in XSPEC and has been used widely to study both X-ray binaries (XRBs) [14,15,16] and AGN [17,18,19]. However, there are physical processes that are not yet incorporated in the current TCAF model, e.g., jets, bulk motion Comptonization, and the spin effect of the BH.
Apart from the above components, many AGN exhibit extra features in their X-ray spectra that likely originate from the accretion disk [20]. The so-called X-ray reflection features produced by an accretion disk might be because of its illumination from the central compact object, such as a magnetically dominated corona residing above the surface of the disk (e.g., [2,21,22]). A prominent feature in the X-ray spectrum is the Fe K emission line at around 6.4 keV, which is due to fluorescence in a dense and relatively cold medium [23,24,25]. The shape of the Fe K line is a powerful probe of the general relativistic effects close to the BH [26,27], leading to estimates of the spin of the BH [28,29,30]. Indeed, observations over the last decades by X-ray satellites have uncovered relativistically broadened Fe K lines in the spectra of several AGN [31,32,33] and black hole XRBs (e.g., [34]). Models of X-ray reflection spectra [5,35] show additional features that can collectively constrain the ionization state, heating, and cooling of the illuminated surface [36].
Mrk 335 is a bright, narrow-line Seyfert 1 (NLS1) galaxy at a redshift of z = 0.026 [37], with a black hole mass [38], and shows ionized absorption in the X-ray and ultra-violet (UV) bands [39]. It has been observed to go into extremely low-flux states [40] where the soft X-ray flux dropped by a factor of up to ∼30, while the hard flux dropped only by a factor of ∼2 in 7 years. Using observations from XMM-Newton, Ref. [41] found signatures of absorption and high reflection fractions in the spectrum of Mrk 335 in its lowest flux state, whereas at the intermediate flux state the observed X-ray spectrum is explained well by a blurred reflection model without the requirement of variable absorption [42]. Ref. [43] estimated a high-frequency lag of ∼150 s between the continuum-dominated energy bands and the iron line and soft excess components for this source. This time lag suggests that the continuum source is located very close to the central black hole and that relativistic effects are worth considering. Using combined Swift and NuSTAR observations, Ref. [44] interpreted the X-ray flare during 2014 as arising from the vertical collimation and ejection of the X-ray-emitting corona at a mildly relativistic velocity, which causes the continuum emission to be relativistically beamed away from the disk. Ref. [45] discussed the effect of the geometry of the corona on the relativistically blurred X-ray reflection arising from the accretion disk, which can also explain the variability between low- and high-flux states. Ref. [46] performed structure function analysis using long-term Swift optical/UV and X-ray data for Mrk 335 and showed that the X-ray low-flux state could be due to the physical changes in the corona or absorption, whereas the variability in the optical/UV band is more consistent with the thermal and dynamic timescales associated with the accretion disk. Ref. [47], studied the low-flux state data using XMM-Newton and observed absorption lines from a highly ionized outflowing wind.
Several studies on Mrk 335 clearly show that the system is highly variable, leaving a range of possibilities for its dynamical behavior and emission features. Mrk 335 is known to show changes in geometry [45], and these can be found from a disk-based model fit such as TCAF to data. It is not clear to date if there is any change in the mass accretion of the source, and if so, what effects it can have on the geometry of the corona in the source. To investigate the above, in this work we chose this object and carried out an analysis of the X-ray data on the source acquired by NuSTAR during the period 2013–2020. This paper is organized as follows: in the next section, we describe the observation details and the analysis procedures. In §3, we explain our results obtained from model fits to the data. We summarize our conclusions in the final section.
2. Observation and Data Analysis
In the present manuscript, we analyzed archival data the present manuscript, we analyzed archival (https://heasarc.gsfc.nasa.gov/docs/cgro/db-perl/W3Browse/w3browse.pl (accessed on 10 June 2020)) from NuSTAR observations of Mrk 335 made during 2013–2020. During this time interval Mrk 335 was observed nine times; for one observation data quality was not good, so we considered the remaining eight observations. The details of the observations are listed in Table 1. The NuSTAR data in the energy range of 3.0–30 keV (as the data are noisy above 30 keV), were extracted using the standard NUSTARDAS v1.3.1 (https://heasarc.gsfc.nasa.gov/docs/nustar/analysis/ (accessed on 10 June 2020)) software. We ran the nupipeline task to produce cleaned event lists and nuproducts for generation of the spectra. We used a region of for the source and for the background using ds9. The data were grouped by the grppha command, with a minimum of 30 counts per energy bin. The same binning was used for all the observations. For spectral analysis of the data we used XSPEC (https://heasarc.gsfc.nasa.gov/xanadu/xspec/ (accessed on 10 June 2020)) [48] version 12.8.1. We used the absorption model TBABS [49] with the Galactic hydrogen column density fixed at 3.6× 10 atoms cm [50] throughout the analysis.
3. Results and Discussion
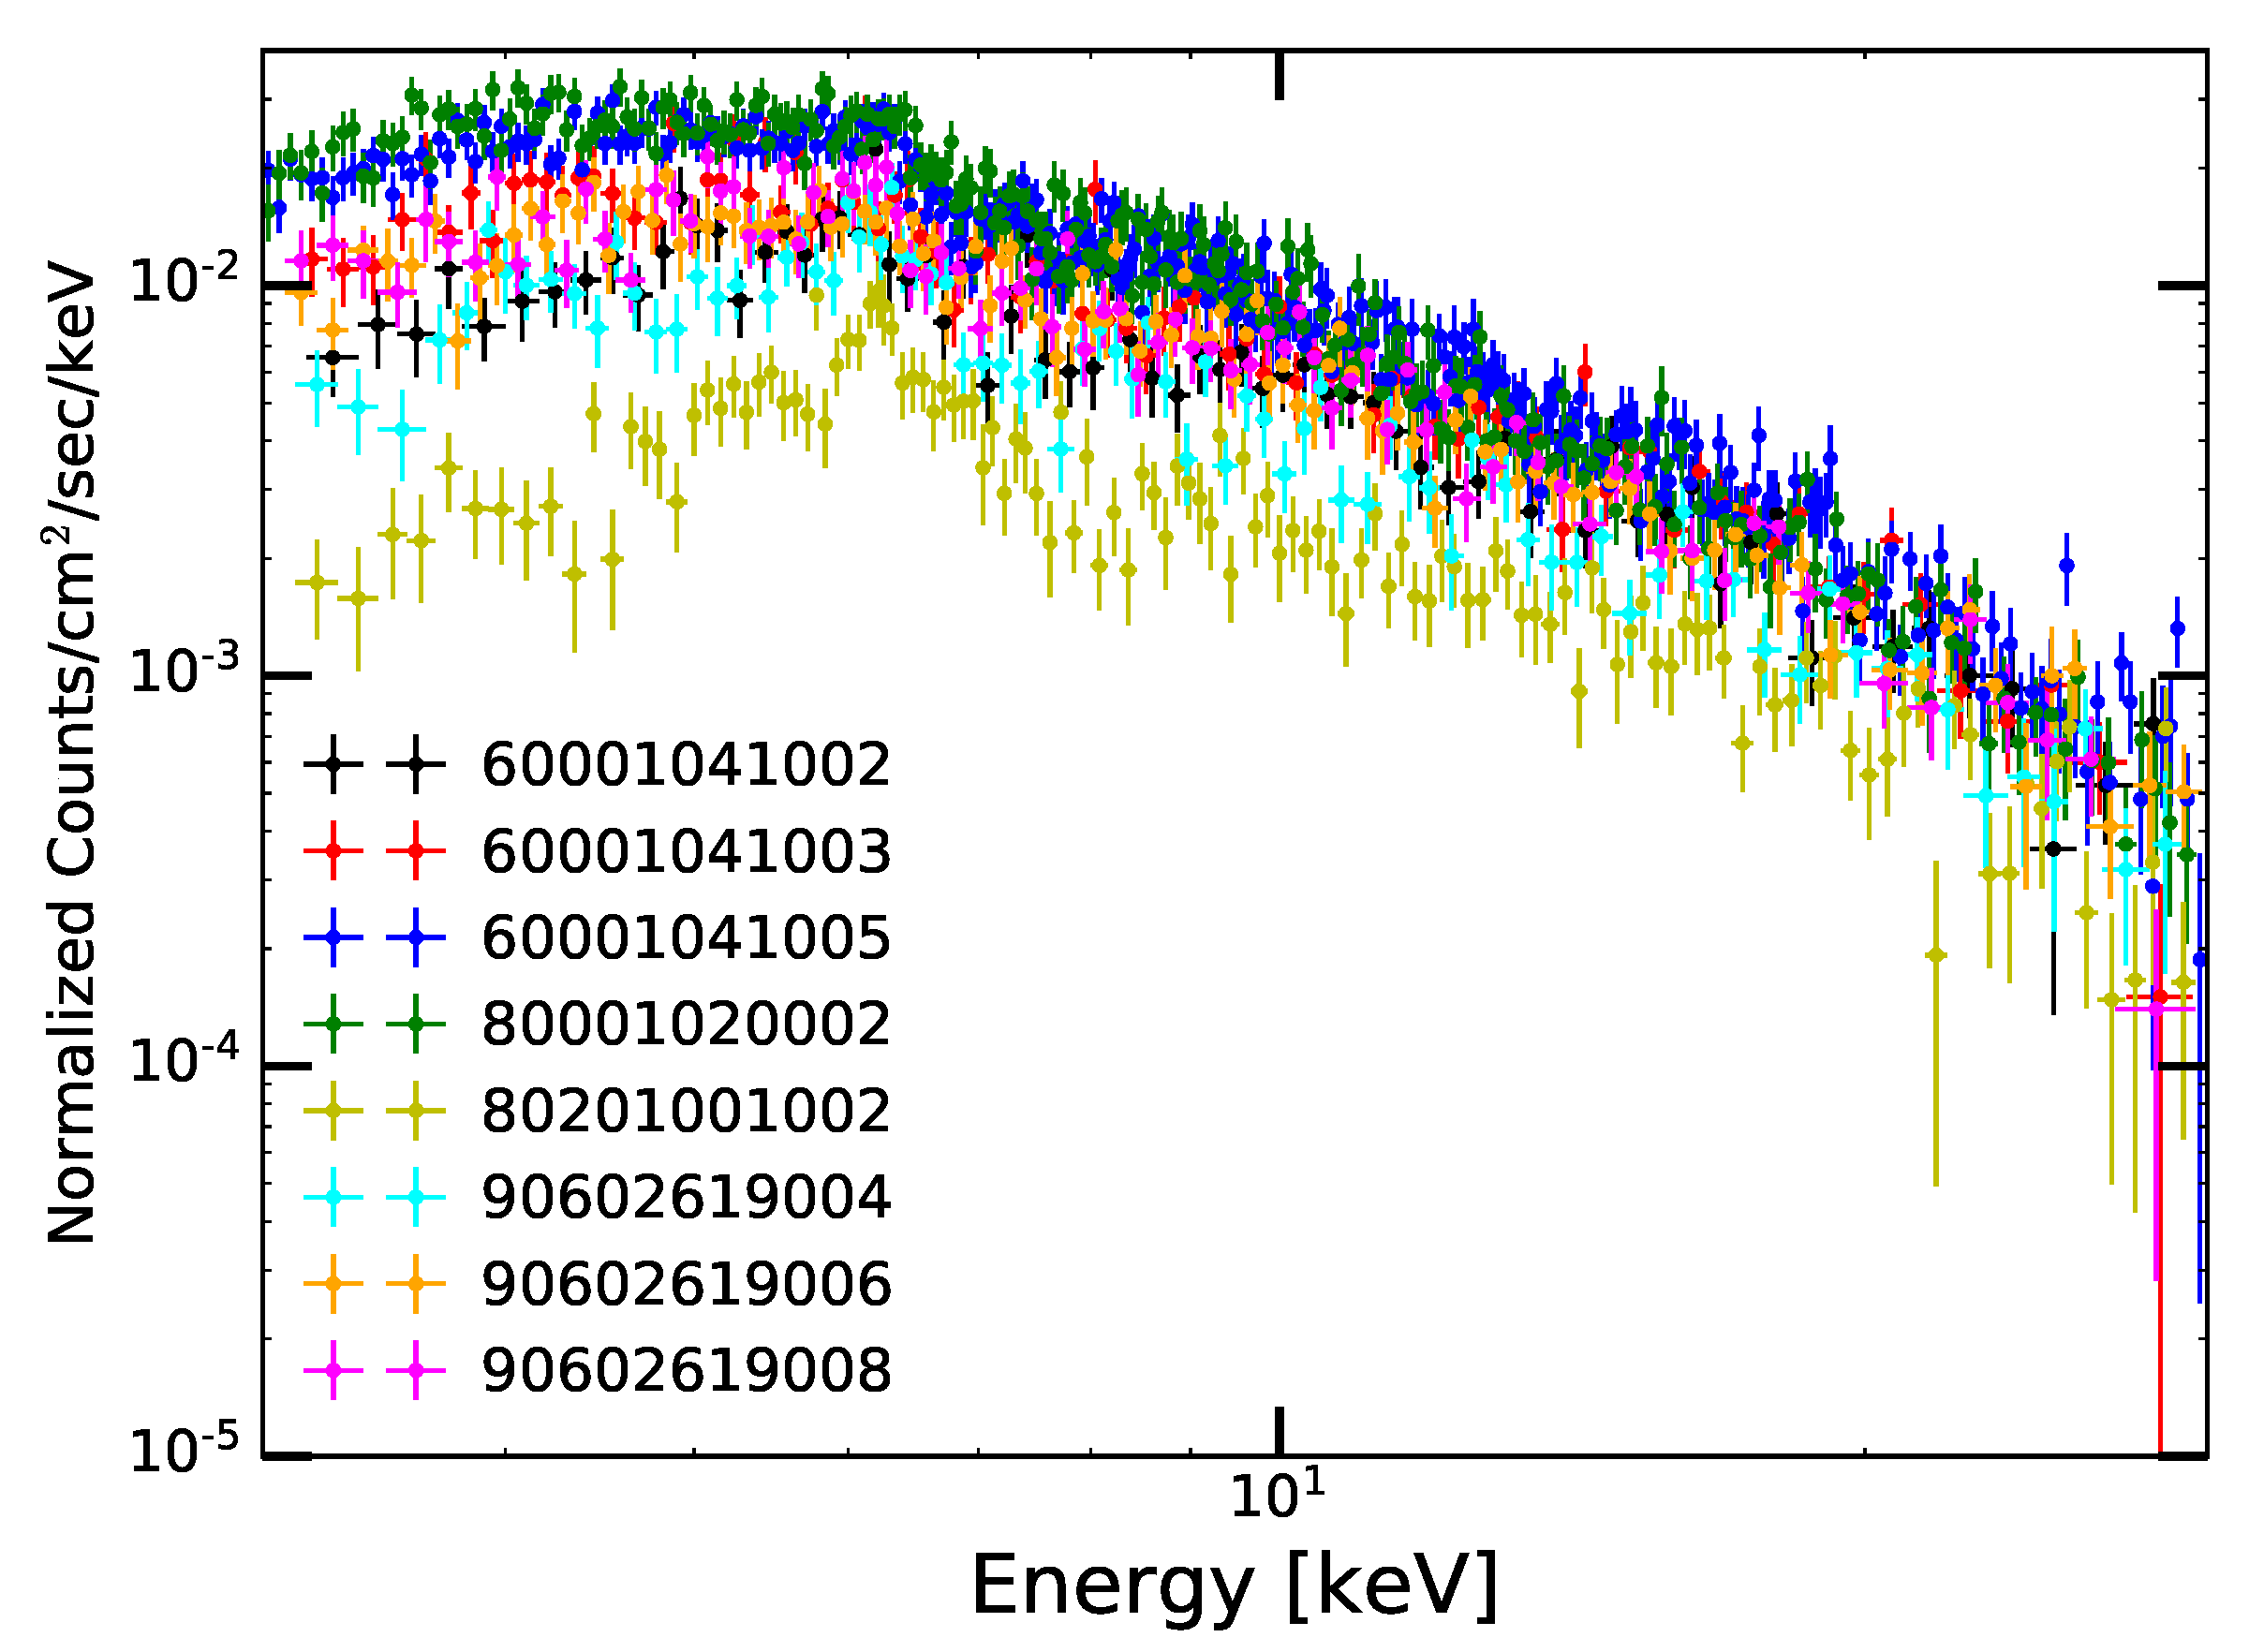
We fit the NuSTAR observations of Mrk 335 taken between 2013 to 2020. During this observation period the source showed significant variability in spectral flux (see Figure 1). We performed spectral analyses using different models. First, we performed spectral fitting using a simple power-law (PL) model as tbabs(gauss+pl), where the PL index () varied from 0.72–1.84, a change by a factor greater than two, which is clearly an indication of significant changes in the flow behavior and corona properties. The model fitted parameters are provided in Table 2. Our model fits show that the line energy and width vary in a broad range, which point to complex geometry changes and gravity effects (more especially line broadening) in the source.
In addition to the simple PL model, we also modeled the observed spectra using the complex phenomenological model pexrav [51] and the physical model TCAF [8]. The results of PEXRAV model fits are given in Table 3. Our PL model fits indicate that the source passed through hard and soft spectral states similar to XRBs, where the timescale for changing from one state to other is in the order of a few days to weeks, which is the viscous timescale ([52] and references therein). We found a similar timescale when the corona changed from its maximum size to its minimum, which is around 12 days. However, as the viscous timescale for AGN is in the order of a few hundred to a few Myr (scaled by the mass of the BH), it may not be possible to observe a similar timescale for other AGN. In future we aim to explore this aspect of accretion to estimate the viscosity of the flow.
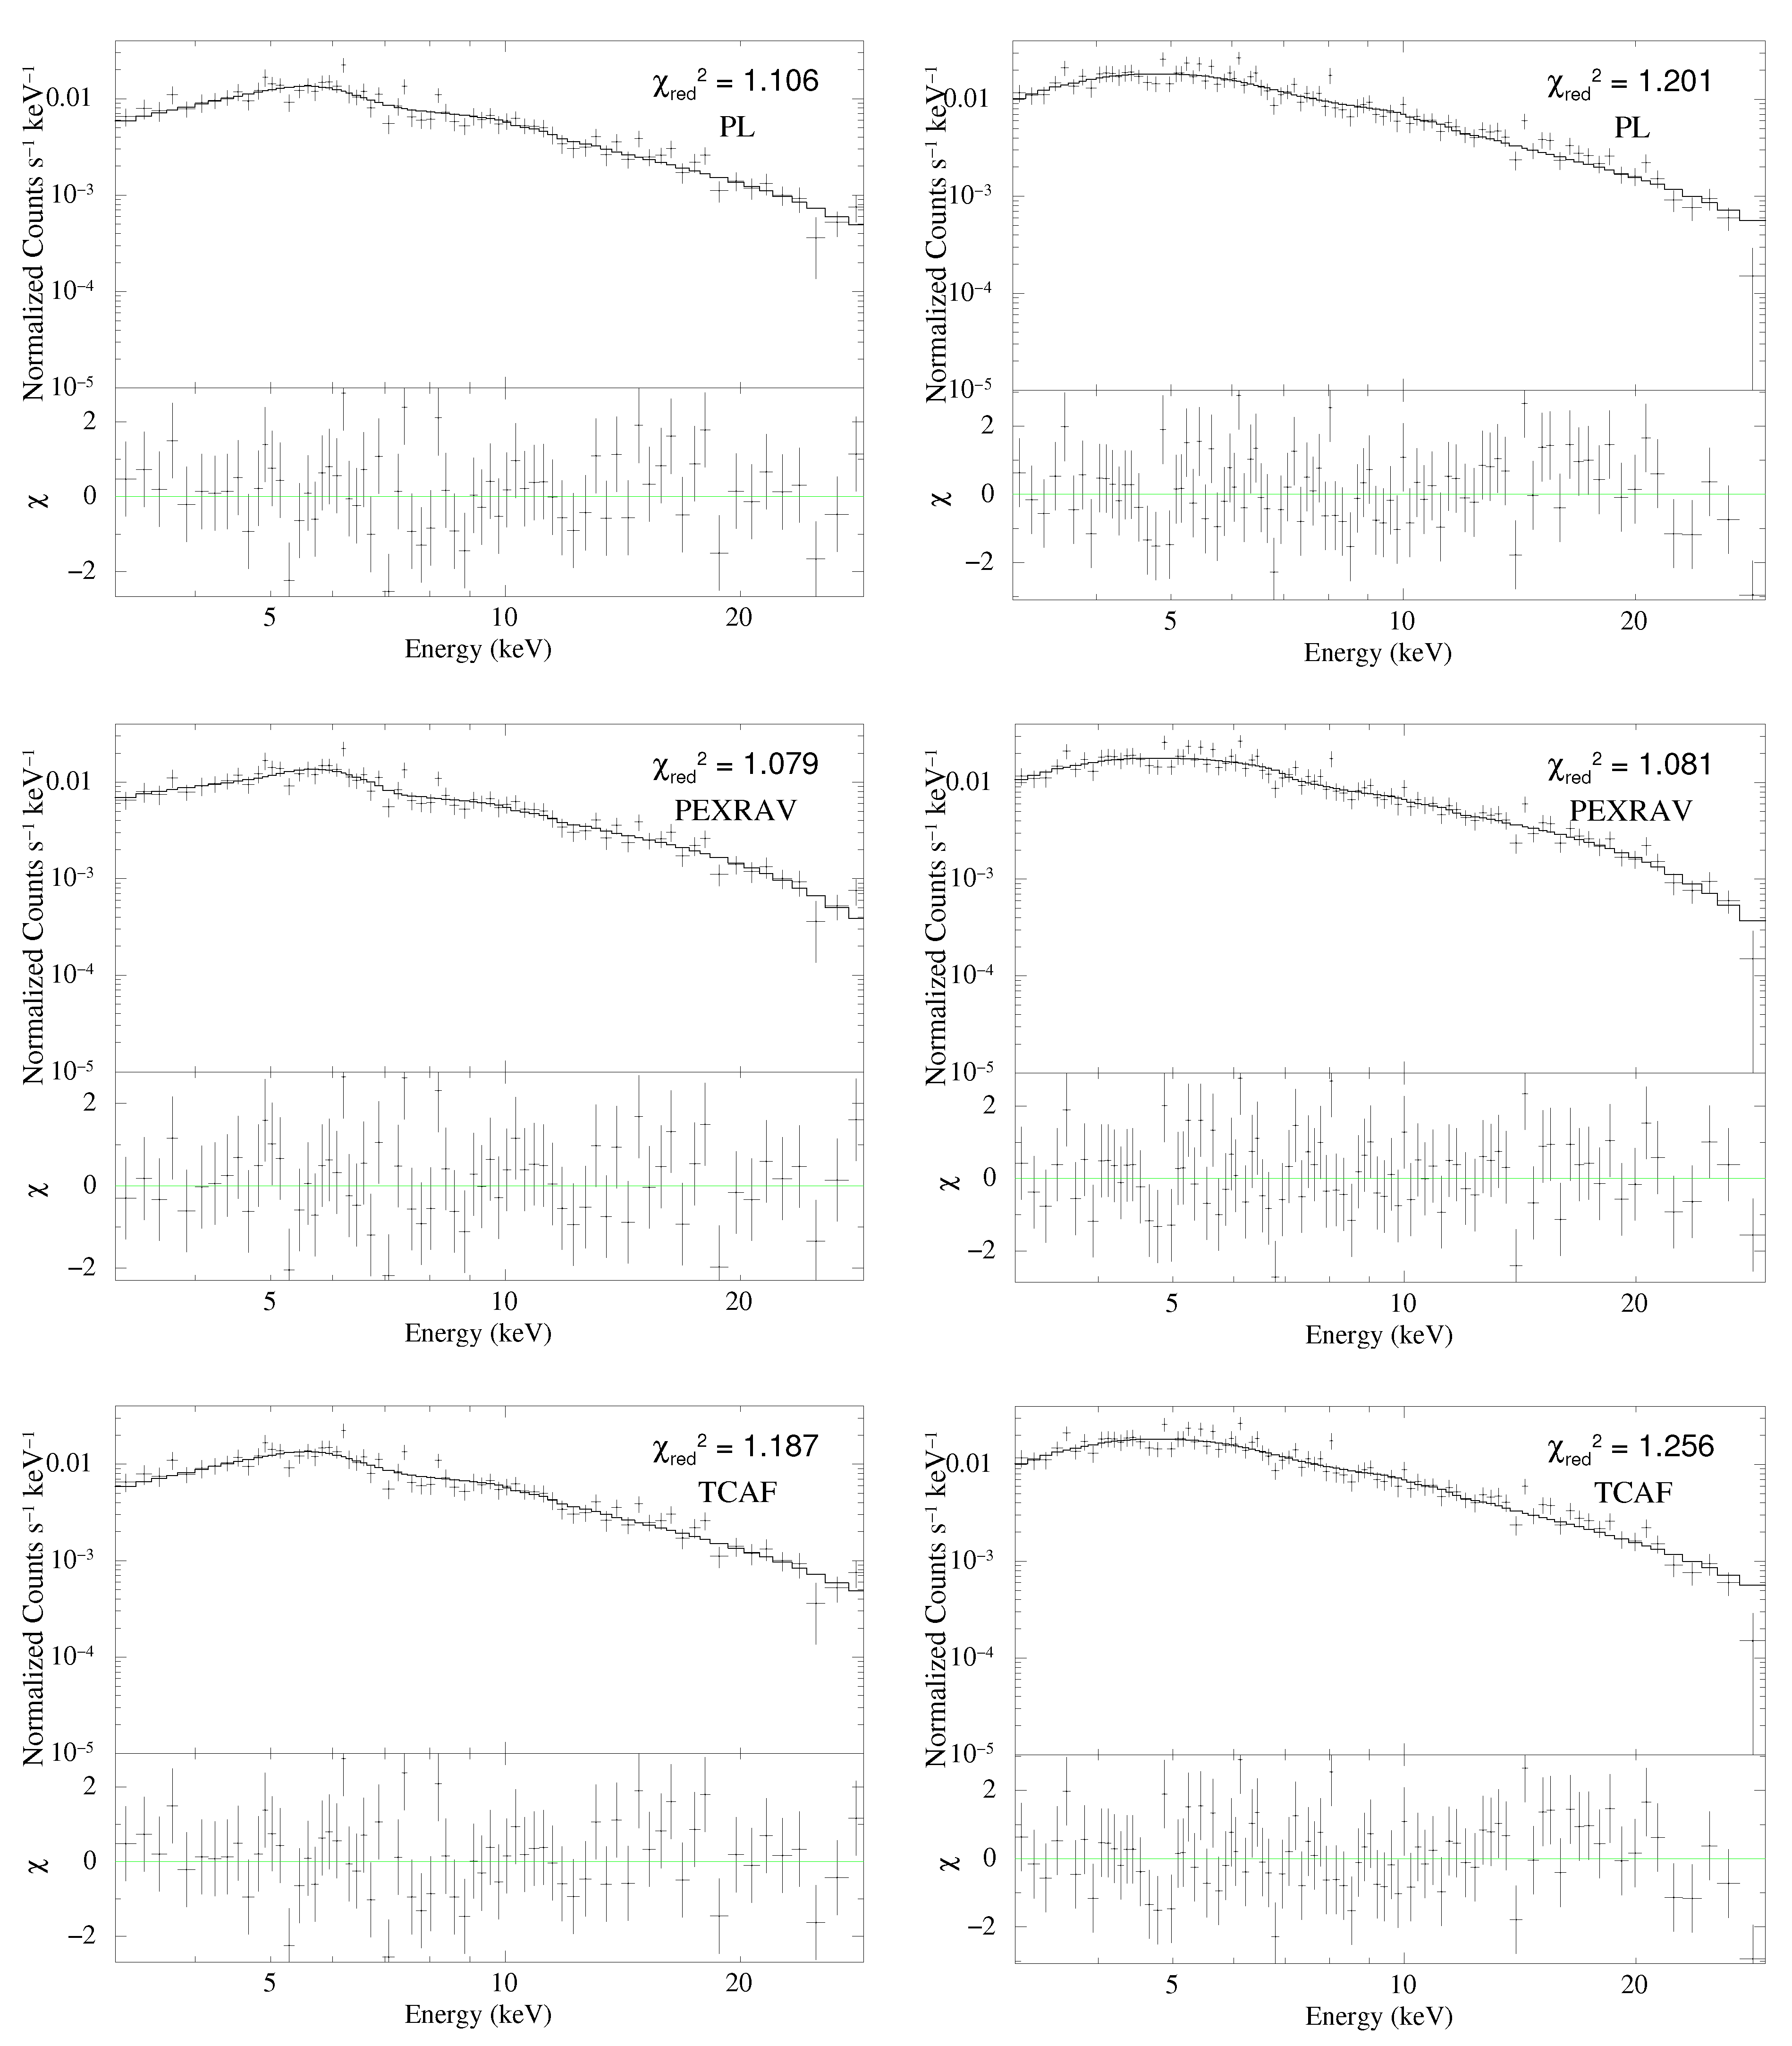
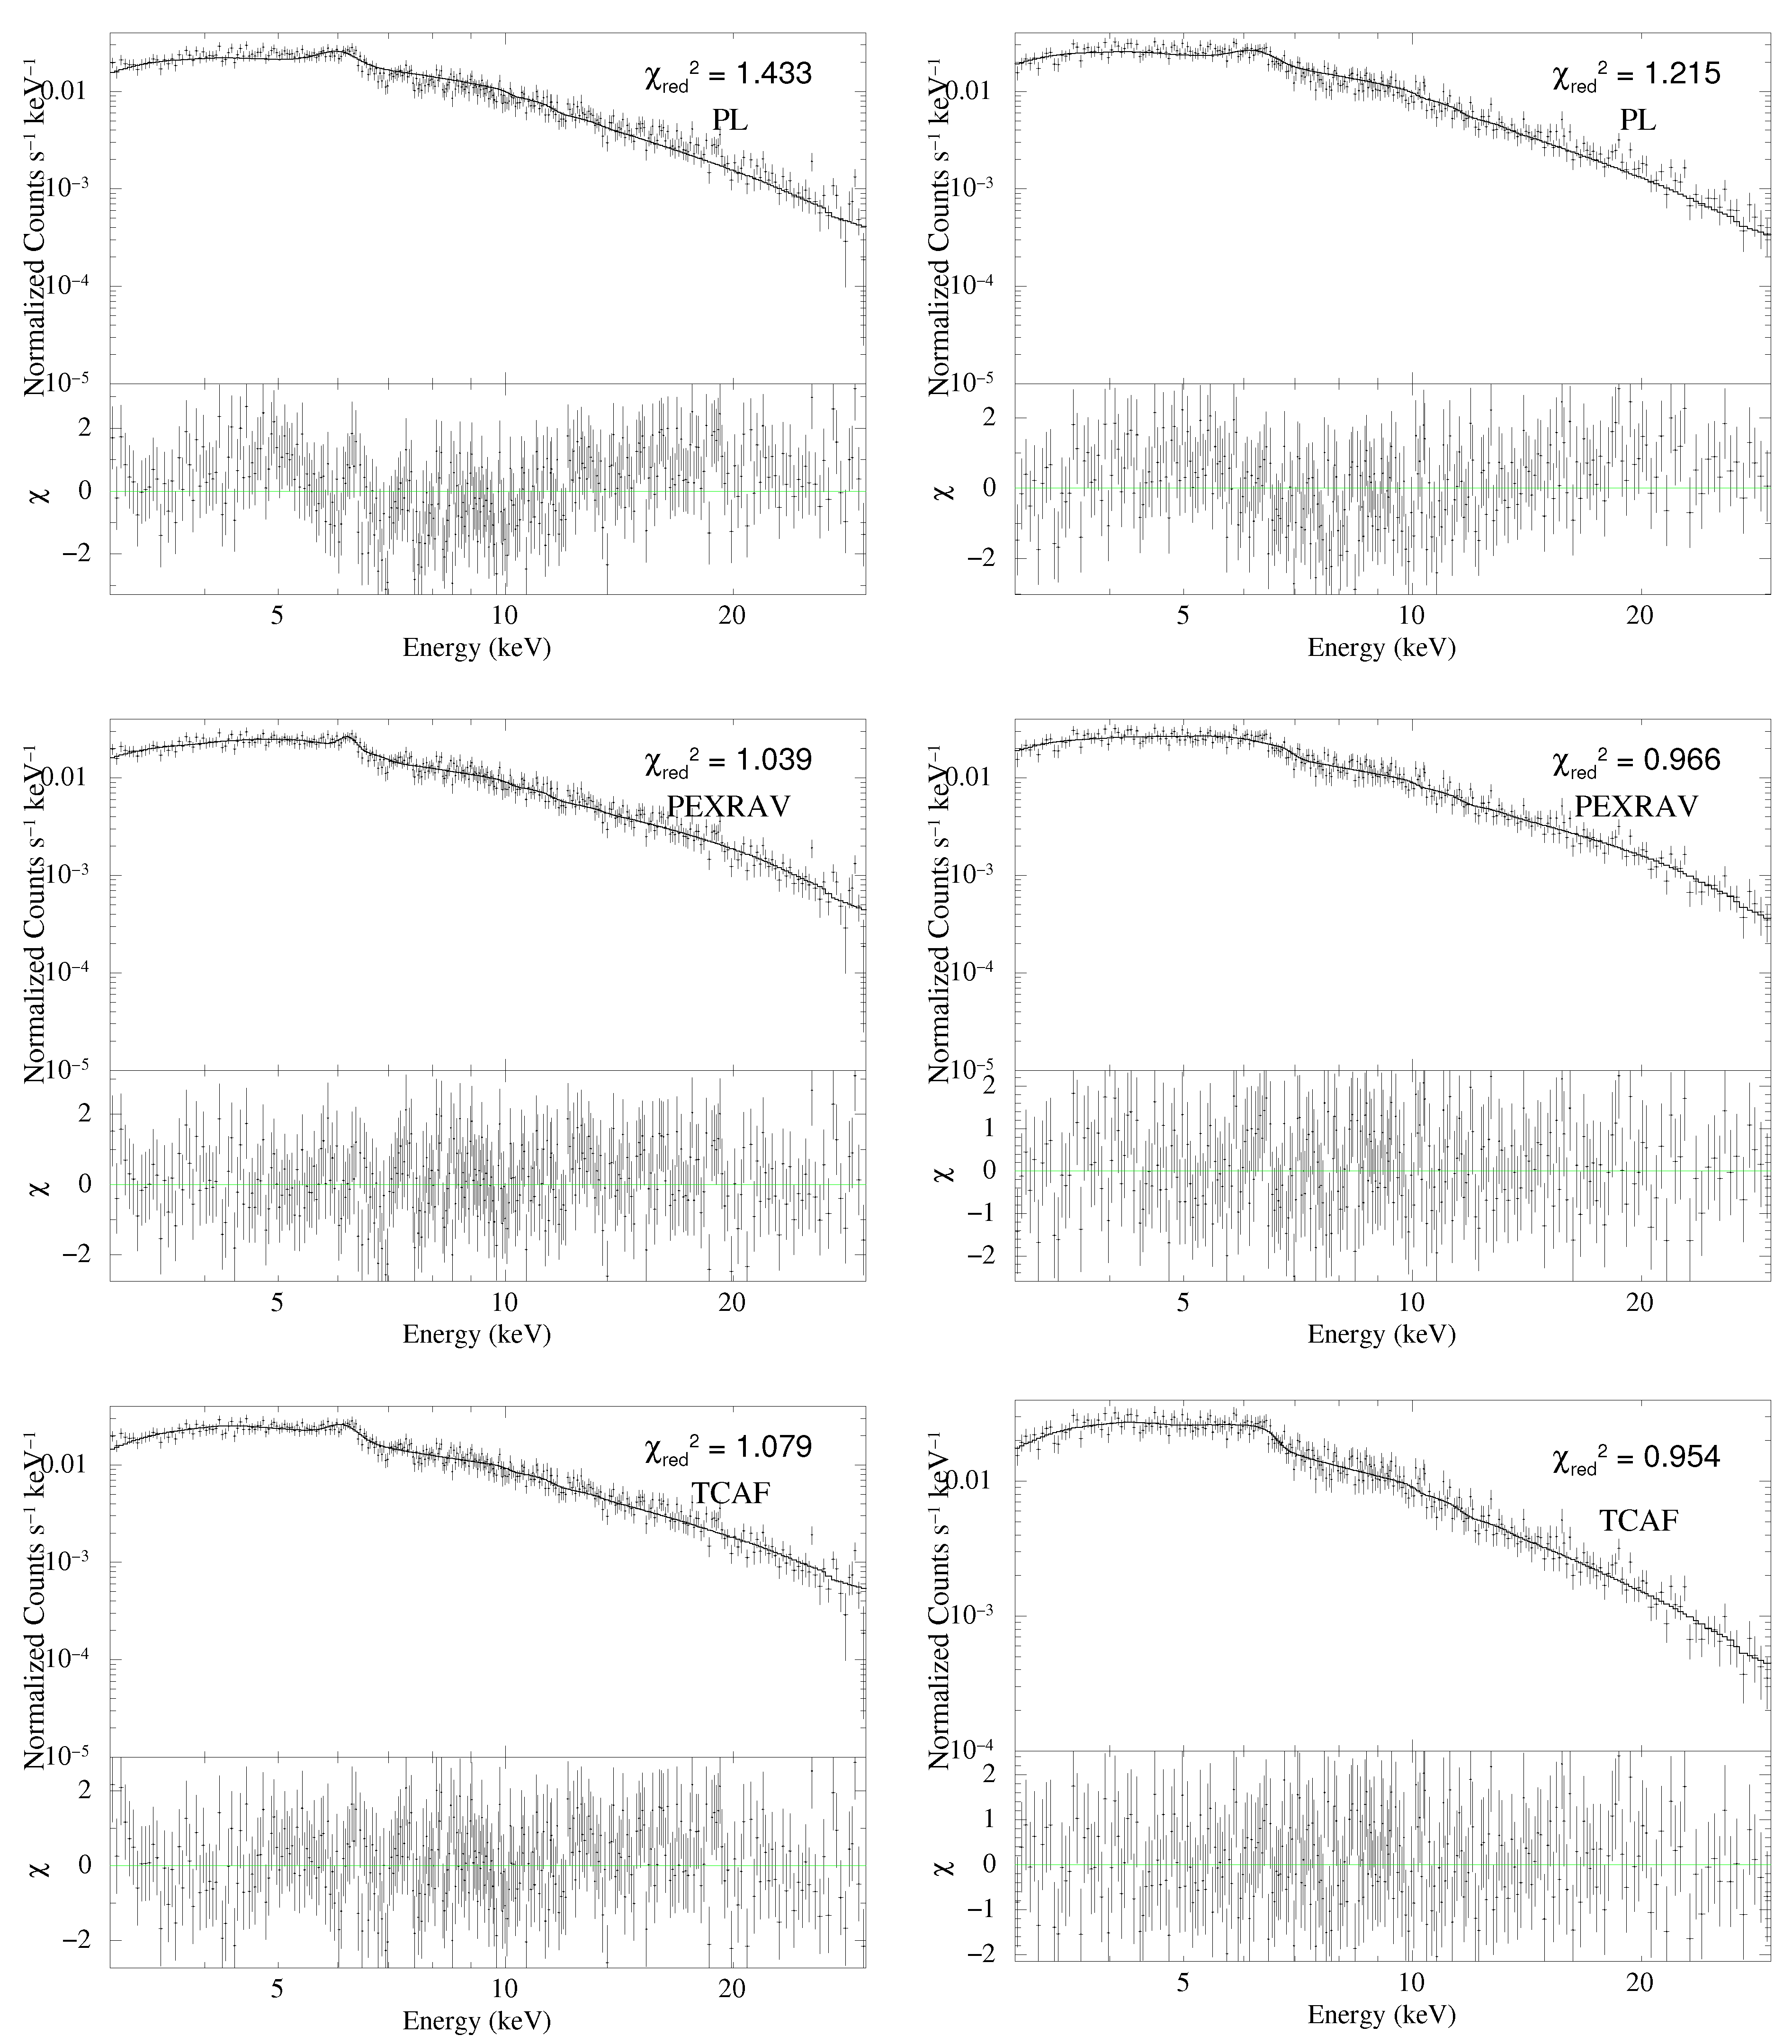
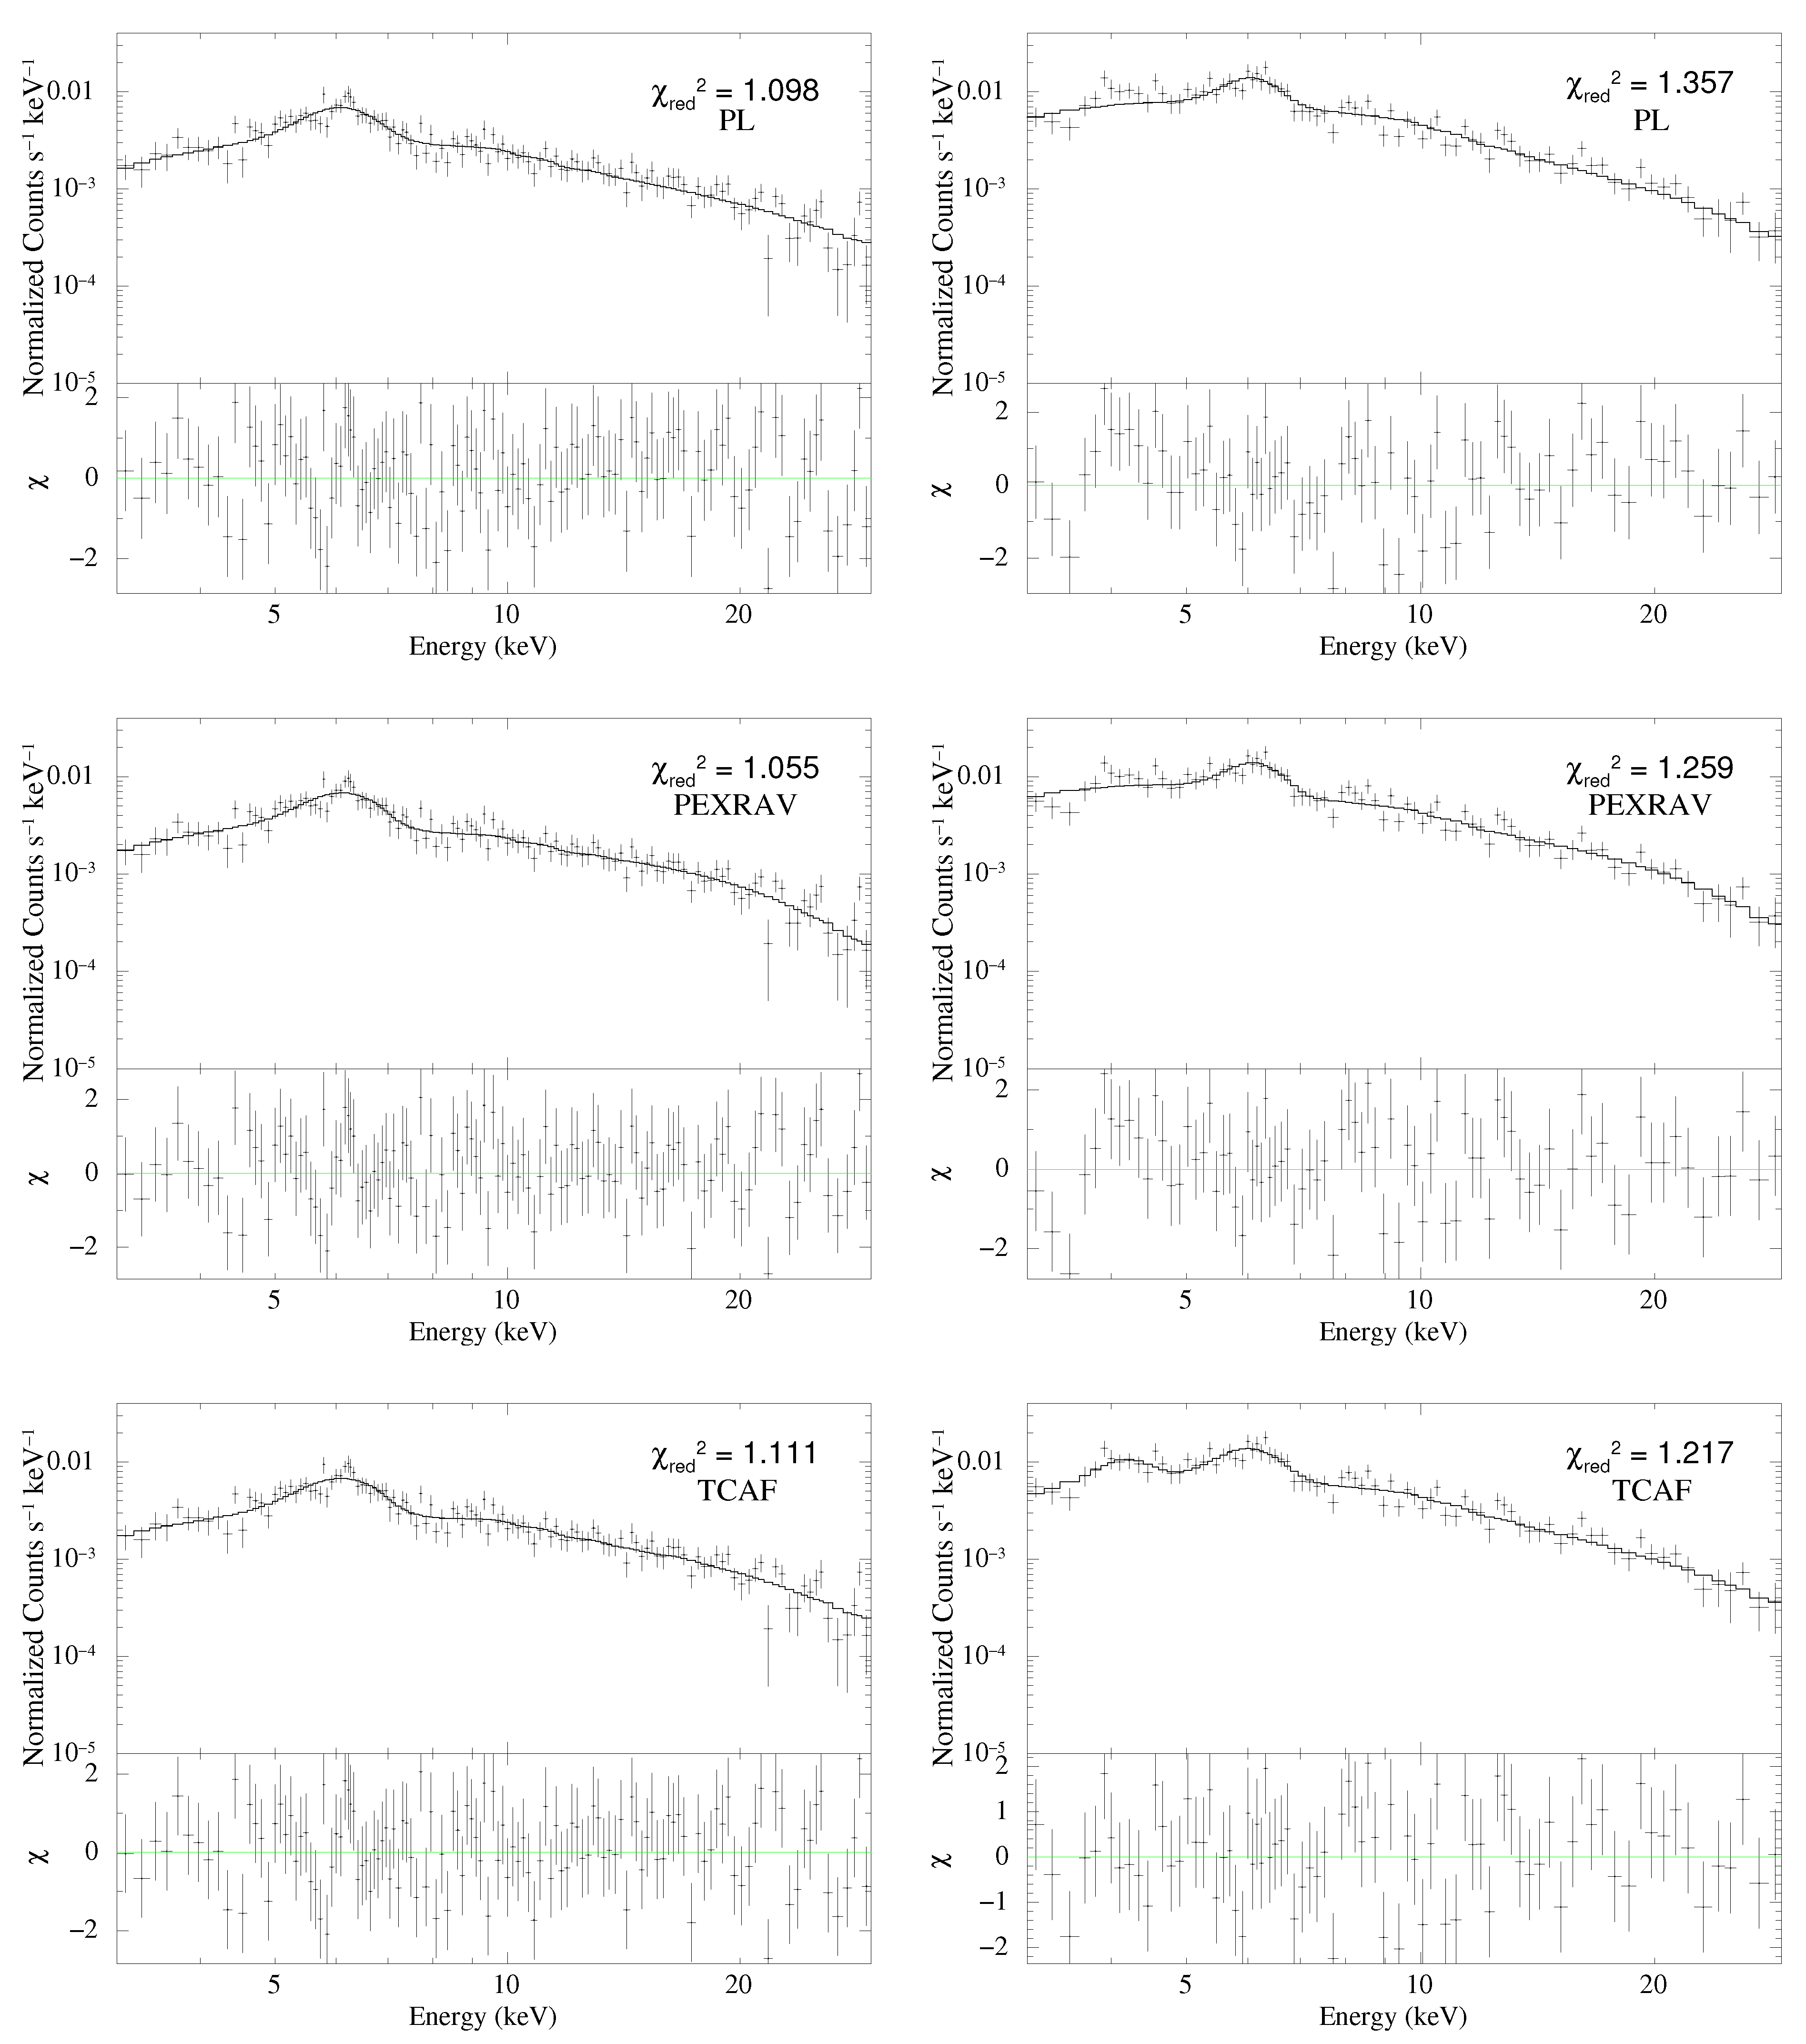
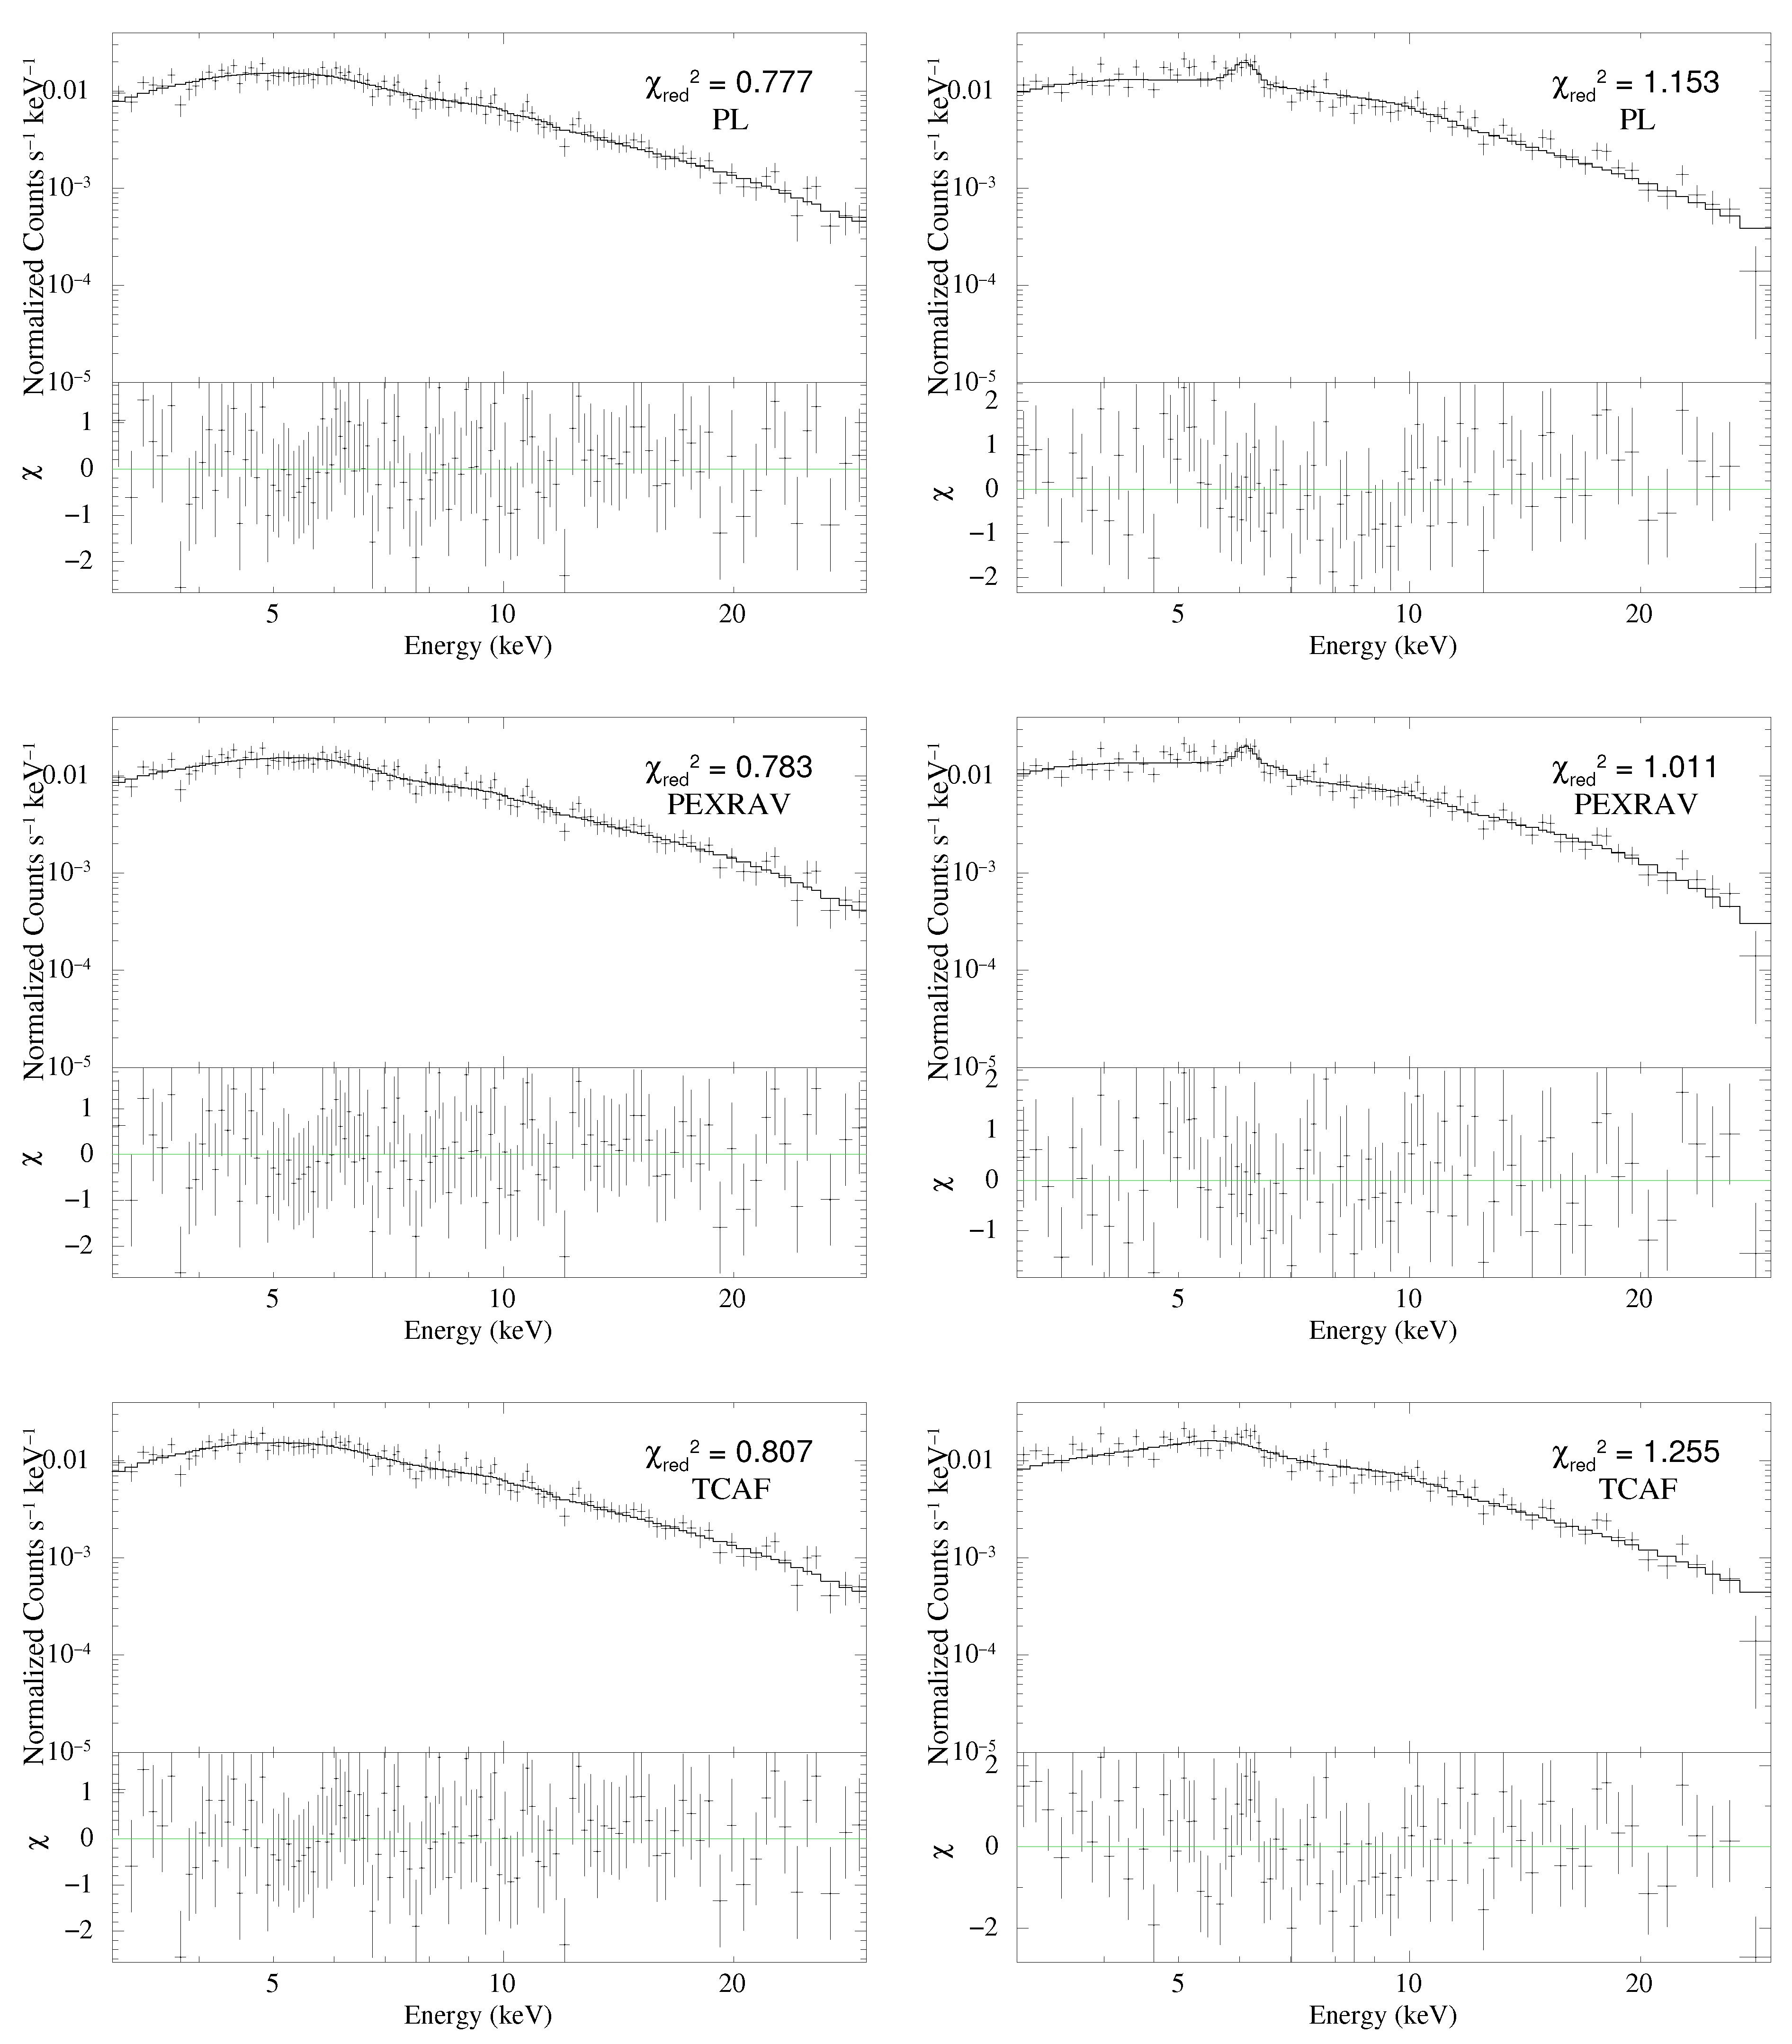
From PEXRAV model fits, we found the reflection fraction to be high with for all the epochs. When the Fe abundance () was made a free parameter, was found to vary from sub-solar to super-solar values during the epochs analyzed here, which is quite unphysical. It has been pointed out by [53] that reflection model fits to observed X-ray spectra are generally found to yield high values. In addition, according to [54], the high obtained from model fits to data could be due to some unknown physical effects being overlooked in current models. Therefore, for PEXRAV model fits, we froze to solar value. For the observation day MJD = 56,468, we required one extra Gaussian line component at low energy ∼5 keV. From the line component and its width, it can be seen that both narrow and broad lines are present in this epoch. We kept the disk inclination () fixed to throughout [55]. Next we applied the physical model tcaf, having the form tbabs(tcaf+gauss), to extract the accretion flow parameters. For all observations, goodness of fit is more or less similar to the PEXRAV model. The tcaf model fitted parameters are provided in Table 4. For some observations, better fits were achieved after adding some additive model components, which are detailed in the table. For the majority of the epochs, the obtained from PEXRAV and TCAF model fits are in agreement, whereas for three epochs, the from TCAF fits are marginally larger than those obtained from PEXRAV model fits. This might be due to differences in the spectral components between models, e.g., TCAF does not include line features, which may give relatively higher . In Figure 2, we show different model fitted spectra for the OBSID 60001041002/3 in the left/right panels of the figure. Figure 3 shows the same spectral fitting but for the OBSID 60001041005 (left panel) and 80001020002 (right panel). The rest of the observational fits are shown in Appendix A.
We used tcaf model fitted parameters to estimate the geometrical height of the shock (). The height of the corona is basically the height of the shock, as the shock is the boundary layer of the corona. We estimated () using the equation below (see also [14]):
where is the adiabatic index, is the location of the shock or the boundary of the corona, and R is the shock compression ratio (), a ratio of the density of the downstream to the density of the upstream of the flow.
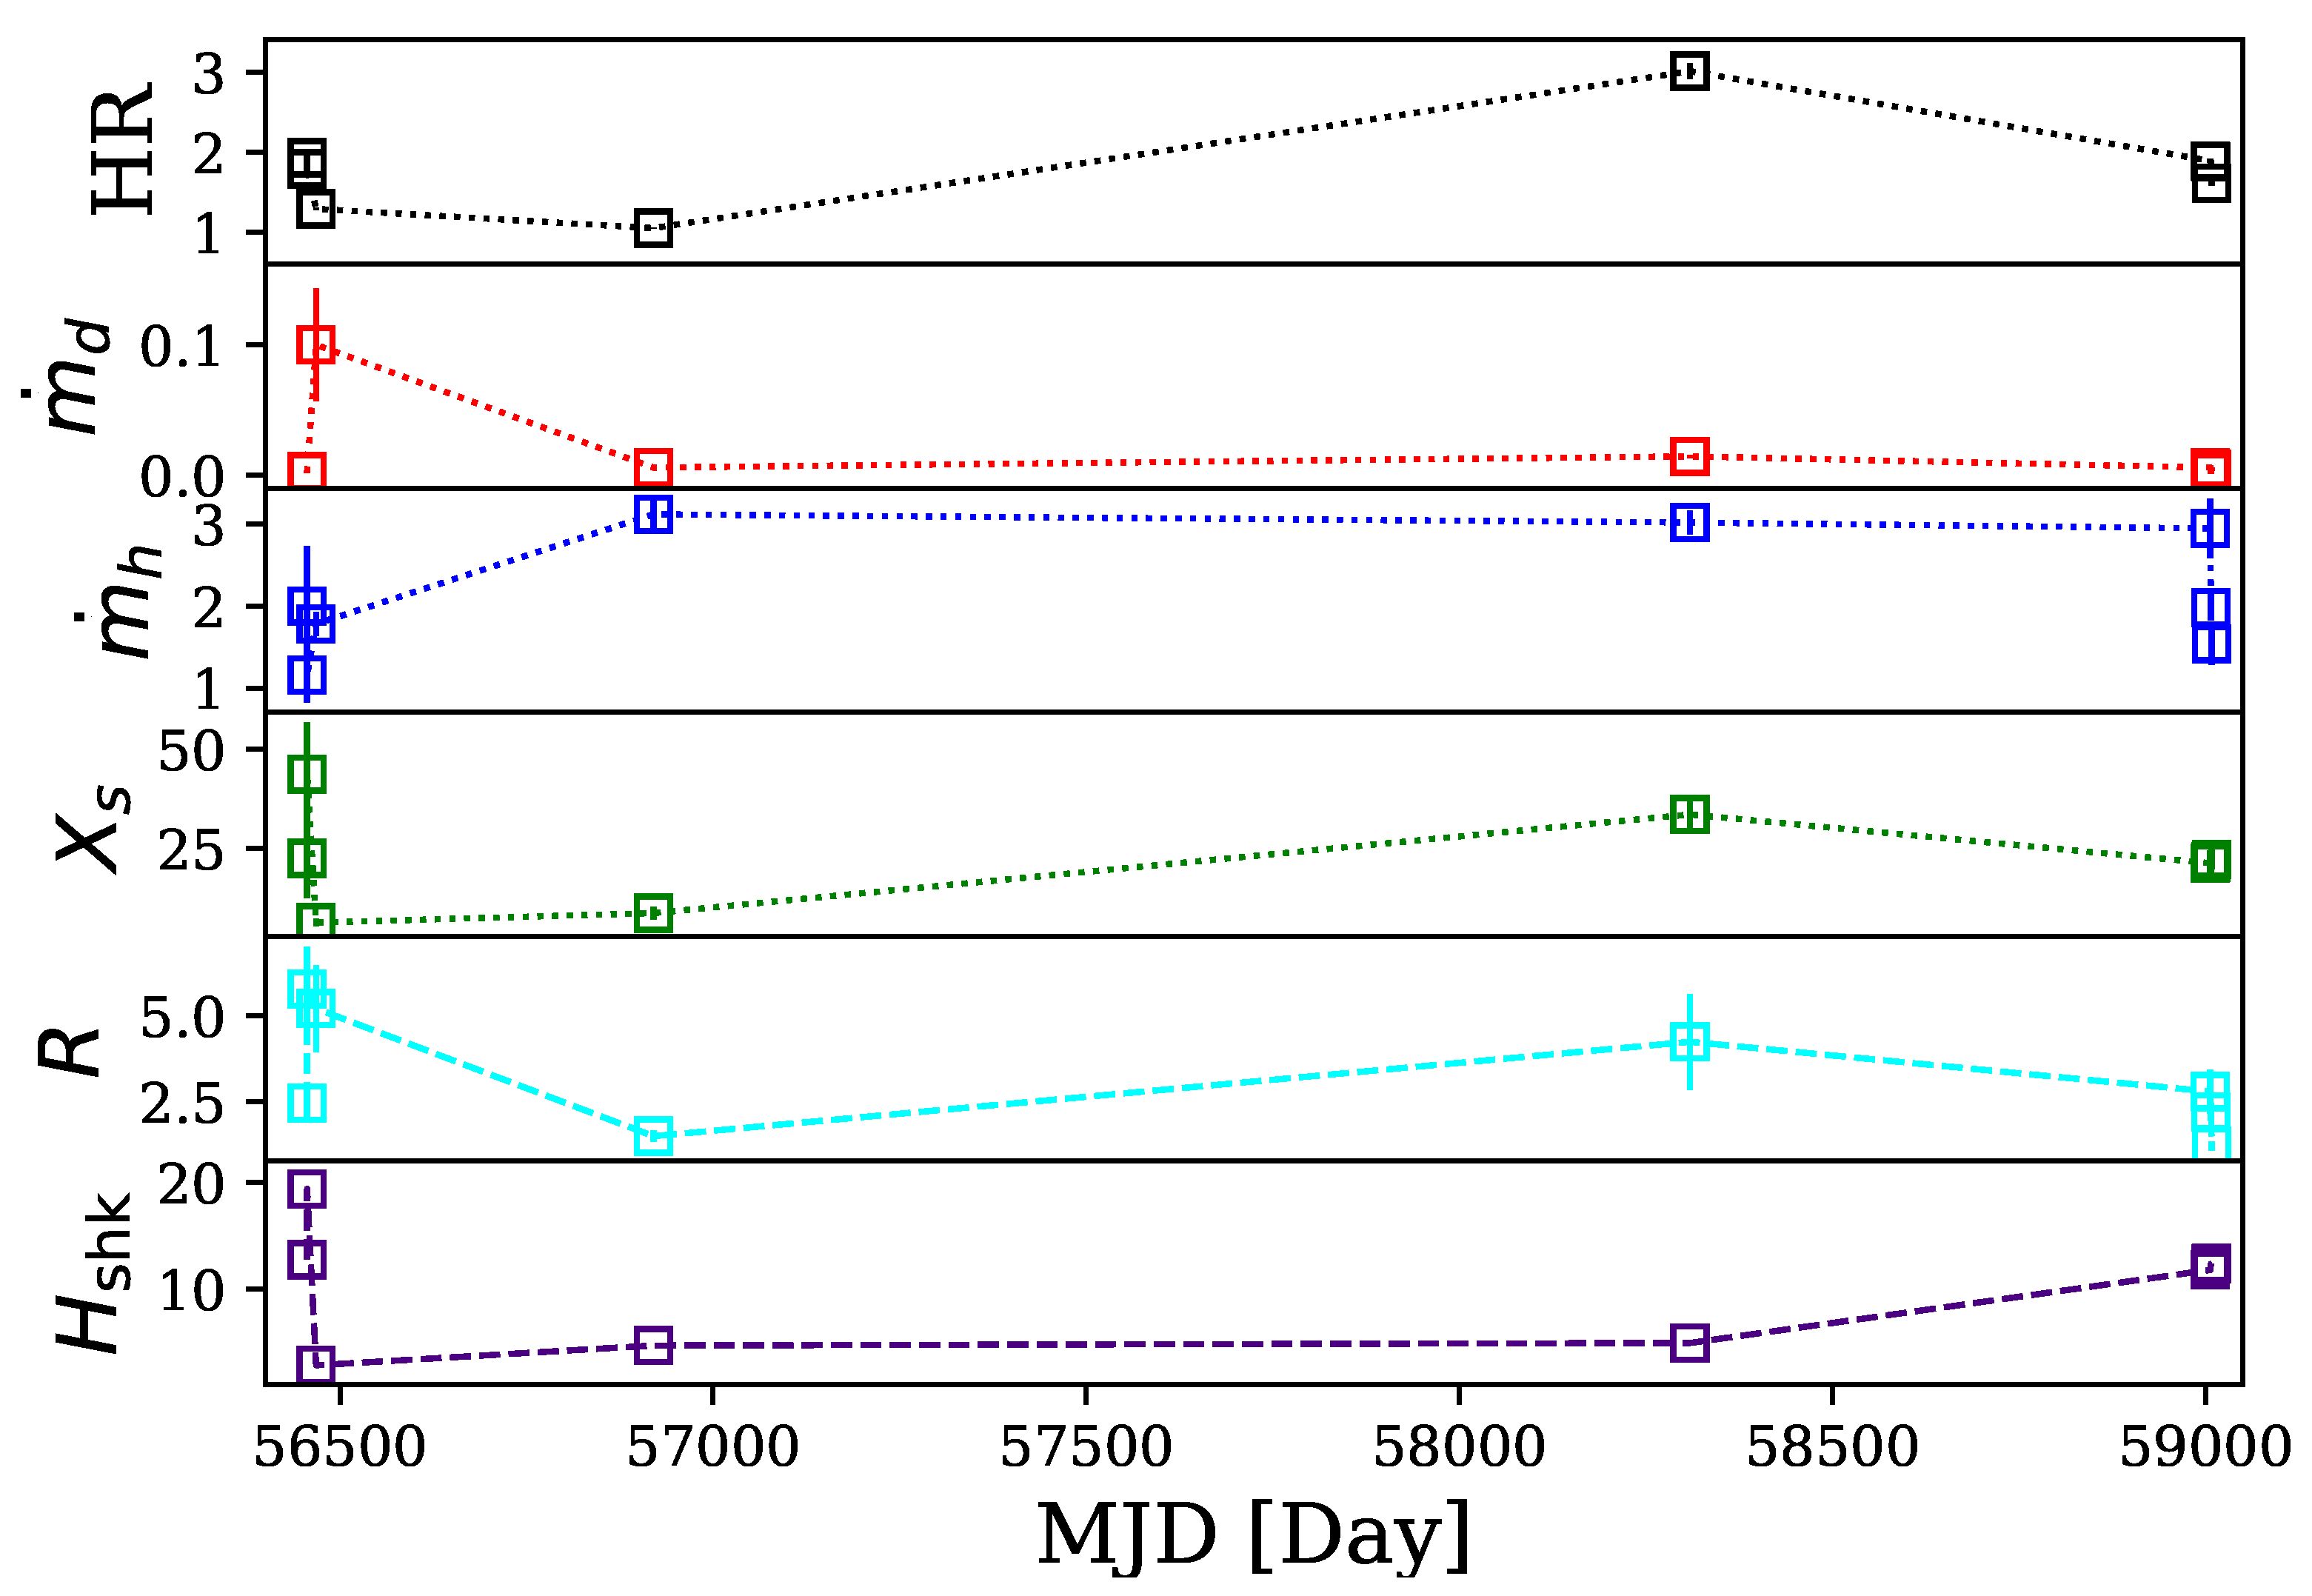
In Figure 4, we show the variation of various model parameters obtained from TCAF model fits as well as the variation of the hardness ratio (HR) with time. The halo rate was always higher than the disk rate by an order of magnitude or more, which implies that the flow was dominated by low angular momentum matter, which might be accreted from the wind or host galaxies. The was found to vary by a factor of ∼40 from 0.24 to 10% of the Eddington rate and the varied between 1.2–3.1 times the Eddington rate. The size of the shock location () or corona changed significantly and reached up to 6 during 25 June 2013 (60001041005) and 8 during 2014 (80001020002). For OBSID 60001041005, we required an extra-broad (1.55 keV) Gaussian component at a low energy of 3.44 keV, which was also found to be broadened by strong gravitational effects [27]. For OBSID 80001020002, we required an additive diskline [26] component at a line energy of 6.12 keV, with emissivity power-law index () and , as the current TCAF model does not include line emission due to gravitational effects in the fit. It is worth noting that the is achieved for the highest , which might be due to the cooling effect inside the corona. As the accretion rate increased, more disk photons got intercepted by the corona. This cooled the corona, causing the shock to move inwards and thus causing a significant change in the size of the corona. Such change in the corona could also be due to the activity of the jet, which extracted a significant amount of thermal energy and contracted the corona [58]. Therefore, it is also possible to establish a jet–disk connection using TCAF model fits to AGN spectra similar to XRBs ([59,60,61] and references therein).
Such movement of the shock can give rise to the observed variability in spectral and temporal properties [62]. During 2014, further increased and made the corona hotter and the shock receded slightly. During 2018 the shock moved further away and the corona became bigger, therefore intercepting more soft photons and generating high-energy photons, which can also ionize the disk atmosphere. For this particular observation, we required the partial covering fraction model (zxipcf), with a covering factor ( = 0.45) and low ionization parameter ( = 1.2). For OBSID 90602619004, during 2020, we required another narrow line (0.29 keV) component, when the shock again moved inward. The model-fitted shock compression ratio also varied in a broad range, which also dictates the strength of the shock and the optical depth of the corona. The 5th panel of Figure 4 (from the top) shows the variation of this parameter. The bottom panel of Figure 4 shows the estimated height of the corona, which changes significantly for the whole observation period.
The mass of the BH is one of the parameters in TCAF. Therefore, keeping it as a free parameter in the TCAF model fits to the observed spectra will yield an value for Mrk 335. We kept as a free parameter during our fitting and we found to vary in a range between ( to ) . Considering the large error bars, the derived BH mass is consistent with being constant. Our derived is consistent with that estimated by [38] using optical reverberation mapping observations, however, it is an order of magnitude larger than that obtained by [53]. Such a low mass found by [53] could be due to them not considering an expanded corona in their model fit to the data. Our results on also show that by fitting accretion-disk-based models such as TCAF to observed X-ray spectra, one can estimate the mass of BHs in AGN. We also found that freezing to some fixed value from the above range and redoing the fit has a negligible effect on other derived parameters, such as , , , and R.
The viscous timescale in AGN is much longer compared to that of XRBs. At small timescales (in the order of a few days or months), significant changes in the accretion rate are not expected, similar to the case for heating and cooling rates. Thus, at such timescales, variability is expected to be less. This is in fact observed in the radio-quiet category of AGN and accretion-disk-based models can explain the observed flux variations in them. However, this might not be the case in the radio-loud category of AGN, as relativistic jets play a dominant role in the flux variations observed in them. Even in those sources where the ejection of jets extracts thermal energy from the corona, the change in the shock location can be drastic in them even though the cooling is less. Results on this will be reported elsewhere.
4. Conclusions
In the present paper, we analyzed NuSTAR data for Mrk 335, observed between 2013 and 2020, to understand the dynamics of the flow and the accretion behavior of the source. We found that the source was significantly variable both in spectral flux, accretion geometry, and reflection fraction. We also found the geometry of the corona to change between epochs. Such a change can affect the reflection fraction and the spectral energy distribution of the illuminating radiation, and consequently the ionization rate. From the TCAF model fits we obtained the dynamics of the flow along with the geometry change of the corona and accretion rates. In our TCAF model fits, the line profiles due to relativistic effects were taken into account using an additive DISKLINE model wherever needed rather than using it throughout for all observations. Among other models, even though the XILLVER model has relativistic and reflection effects incorporated, the accretion dynamics and the origin of corona are still lacking in the model. Therefore we did not take into account such models in our current study. Below we provide the key findings on the variable nature of the source.
- During 2013, the corona at the inner region changed significantly from its elongated stage (∼) to destruction stage ∼, consistent with [44]. As the compression ratio changed and the corona contracted significantly, it could be possible that a jet/mass outflow was launched around 13 June 2013, therefore a significant amount of thermal energy was extracted by the jet/outflow and the corona contracted.
- The observation during 2014 required a blurred reflection component along with tcaf to fit the spectra. This is quite natural as the corona contracted and the inner edge of the disk moved significantly inward, therefore the gravitational effect became dominant [26,27] and blurred the Fe K line. We also required a broad Gaussian line component at ∼2 keV.
- The HR was roughly constant during 2013, and was also similar to that obtained during 2014.
- There was a significant change in between the 2013 and 2014 spectra, which may be due to a sudden change in accretion rates. During this period, disk accretion had increased by a factor of a few and also the size of the corona contracted significantly.
- The steepening of the emissivity profile of Mrk 335 indicates that the corona is compact for this source [44]. In our study, we found that the size of the corona was indeed small and compact during 25 June 2013 and 20 September 2014 (see Table 4). It is also noticeable that the height of the corona reduced significantly during these two epochs.
- During 2014, spectral flux between 3 and 30 keV changed/increased by a factor of ∼3 compared to 2013 and 2018. This could be due to an increase in accretion rates as well as the change in corona. As the accretion rate increased (in 25 June 2013 and 10 July 2018), the number of soft photons increased, thereby increasing the cooling rate, i.e., reduction of more energy from the corona by the seed photons from the Keplerian disk (see theoretical aspects in [9]). It should be noted that although the shock location changed significantly, the other parameters triggered that change, mainly the increase in disk accretion rate, and therefore the cooling rate. This also infers that not only the shock location but other parameters are equally important to explain the observed variability.
- During 2018 and onward, the corona and again elongated. During this period the HR also increased. This also implies that there is a correlation between HR and the geometry of the corona.
- During 2018, to take into account the disk ionization effects along with TCAF, we required partial covering and the zxipcf model to better fit the data. The model fit showed that an absorption column density with is present. The fit also required a low ionization with erg cm , with a partial covering fraction of 0.45. This added component also indicates the presence of mass outflow from the system, which is evident in the monitoring observations of the source in optical/UV and X-rays ([63,64], and references therein).
- The reflection fraction, R, is measured as the ratio of the photon fluxes from the blurred reflection and power-law continuum model components. From pexrav model fitting we found this value was .
- The mass of the black hole, which was kept as a free parameter, was found to vary in a very narrow range (2.44–3.04), and considering the error bars is consistent with a constant. This is in agreement with that of [38].
Author Contributions
Conceptualization, methodology, formal analysis, writing—original draft preparation, S.M.; conceptualization, supervision, writing—review and editing, C.S.S. All authors have read and agreed to the published version of the manuscript.
Funding
This research received no external funding.
Institutional Review Board Statement
Not applicable.
Informed Consent Statement
Not applicable.
Data Availability Statement
We used archival data for our analysis in this manuscript. Appropriate links are given in the manuscript. For the details of the data fitting, one can directly contact the first author.
Acknowledgments
We thank both referees for their constructive and insightful suggestions that improved the quality of the manuscript. SM acknowledges the Ramanujan Fellowship (# RJF/2020/000113) by SERB, Govt. of India. This research made use of the NuSTAR Data Analysis Software (NUSTARDAS) jointly developed by the ASI Science Data Center (ASDC), Italy, and the California Institute of Technology (Caltech), USA. This research also made use of data obtained through the High Energy Astrophysics Science Archive Research Center Online Service, provided by NASA/Goddard Space Flight Center.
Conflicts of Interest
The authors declare no conflict of interest.
Appendix A
Here we show the spectral fitting plots for the rest of the observations using all three models.
Figure A1.
Same as Figure 2 but for the OBSIDs 80201001002 (left panel) and 90602619004 (right panel) along with the residuals.
Figure A1.
Same as Figure 2 but for the OBSIDs 80201001002 (left panel) and 90602619004 (right panel) along with the residuals.

Figure A2.
Same as Figure 2 but for the OBSIDs 90602619006 (left panel) and 90602619008 (right panel) along with the residuals.
Figure A2.
Same as Figure 2 but for the OBSIDs 90602619006 (left panel) and 90602619008 (right panel) along with the residuals.

References
- McHardy, I.M.; Koerding, E.; Knigge, C.; Uttley, P.; Fender, R.P. Active galactic nuclei as scaled-up Galactic black holes. Nature 2006, 444, 730. [Google Scholar] [CrossRef] [PubMed]
- Haardt, F.; Maraschi, L. A Two-Phase Model for the X-Ray Emission from Seyfert Galaxie. Astrophys. J. 1991, 380, L51. [Google Scholar] [CrossRef]
- Zdziarski, A.A.; Poutanen, J.; Johnson, W.N. Observations of Seyfert Galaxies by OSSE and Parameters of Their X-ray/Gamma-Ray Sources. Astrophys. J. 2000, 542, 703. [Google Scholar] [CrossRef]
- Esin, A.A.; McClintock, J.E.; Narayan, R. Advection-Dominated Accretion and the Spectral States of Black Hole X-ray Binaries: Application to Nova Muscae 1991. Astrophys. J. 1997, 489, 865. [Google Scholar] [CrossRef] [Green Version]
- Garcia, J.; Dauser, T.; Reynolds, C.S.; Kallman, T.R.; McClintock, J.E.; Wilms, J.; Eikmann, W. X-Ray Reflected Spectra from Accretion Disk Models. III. A Complete Grid of Ionized Reflection Calculations. Astrophys. J. 2013, 768, 146. [Google Scholar] [CrossRef] [Green Version]
- Titarchuk, L. Generalized Comptonization Models and Application to the Recent High-Energy Observations. Astrophys. J. 1994, 434, 570. [Google Scholar] [CrossRef]
- Chakrabarti, S.K. Standing Rankine-Hugoniot Shocks in the Hybrid Model Flows of the Black Hole Accretion and Winds. Astrophys. J. 1989, 347, 365. [Google Scholar] [CrossRef]
- Chakrabarti, S.; Titarchuk, L.G. Spectral Properties of Accretion Disks around Galactic and Extragalactic Black Holes. Astrophys. J. 1995, 455, 623. [Google Scholar] [CrossRef] [Green Version]
- Mondal, S.; Chakrabarti, S.K. Spectral properties of two-component advective flows with standing shocks in the presence of Comptonization. Mon. Not. R. Astron. Soc. 2013, 431, 2716. [Google Scholar] [CrossRef] [Green Version]
- Chakrabarti, S.K.; Mondal, S.; Debnath, D. Resonance condition and low-frequency quasi-periodic oscillations of the outbursting source H 1743- 322. Mon. Not. R. Astron. Soc. 2015, 452, 3451. [Google Scholar] [CrossRef] [Green Version]
- Molteni, D.; Sponholtz, H.; Chakrabarti, S.K. Resonance oscillation of radiative shock waves in accretion disks around compact objects. Astrophys. J. 1996, 457, 805. [Google Scholar] [CrossRef] [Green Version]
- Shakura, N.I.; Sunyaev, R.A. Black holes in binary systems. Observational appearance. Astron. Astrophys. 1973, 24, 337. [Google Scholar]
- Chakrabarti, S.K. Spectral properties of accretion disks around black holes. II. Sub-Keplerian flows with and without shocks. Astrophys. J. 1997, 484, 313. [Google Scholar] [CrossRef] [Green Version]
- Debnath, D.; Chakrabarti, S.K.; Mondal, S. Implementation of two-component advective flow solution in xspec. Mon. Not. R. Astron. Soc. 2014, 440L, 121. [Google Scholar] [CrossRef] [Green Version]
- Debnath, D.; Mondal, S.; Chakrabarti, S.K. Characterization of GX 339-4 outburst of 2010-11: Analysis by XSPEC using two component advective flow model. Mon. Not. R. Astron. Soc. 2015, 447, 1984. [Google Scholar] [CrossRef] [Green Version]
- Mondal, S.; Debnath, D.; Chakrabarti, S.K. Inference on Accretion Flow Dynamics Using TCAF Solution from the Analysis of Spectral Evolution of H 1743-322 during the 2010 Outburst. Astrophys. J. 2014, 786, 4. [Google Scholar] [CrossRef] [Green Version]
- Mandal, S.; Chakrabarti, S.K. Spectrum of Two-Component Flows around a Supermassive Black Hole: An Application to M87. Astrophys. J. 2008, 689, 17. [Google Scholar] [CrossRef] [Green Version]
- Mondal, S.; Rani, P.; Stalin, C.S. Flux and spectral variability of Mrk 421 during its low activity state using NuSTAR. Mon. Not. R. Astron. Soc. 2021. submitted. [Google Scholar]
- Nandi, P.; Chakrabarti, S.K.; Mondal, S. Spectral Properties of NGC 4151 and the Estimation of Black Hole Mass Using TCAF Solution. Astrophys. J. 2019, 877, 65. [Google Scholar] [CrossRef] [Green Version]
- Fabian, A.C.; Ross, R.R. X-ray reflection. SSRv 2010, 157, 167. [Google Scholar]
- Galeev, A.A.; Rosner, R.; Vaiana, G.S. Structured coronae of accretion disks. Astrophys. J. 1979, 229, 318. [Google Scholar] [CrossRef]
- Merloni, A.; Fabian, A.C. Thunderclouds and accretion discs: A model for the spectral and temporal variability of Seyfert 1 galaxies. Mon. Not. R. Astron. Soc. 2001, 328, 958. [Google Scholar] [CrossRef] [Green Version]
- Barr, P.; White, N.E.; Page, C.G. The discovery of low-level iron K line emission from CYG X-1. Mon. Not. R. Astron. Soc. 1985, 216, 65. [Google Scholar] [CrossRef] [Green Version]
- Nandra, K.; Pounds, K.A.; Stewart, G.C.; Fabian, A.C.; Rees, M.J. Detection of iron features in the X-ray spectrum of the Seyfert I galaxy MCG -6-30-15. Mon. Not. R. Astron. Soc. 1989, 236, 39. [Google Scholar] [CrossRef] [Green Version]
- Pounds, K.A.; Nandra, K.; Stewart, G.C.; George, I.M.; Fabian, A.C. X-ray reflection from cold matter in the nuclei of active galaxies. Nature 1990, 344, 132. [Google Scholar] [CrossRef]
- Fabian, A.C.; Rees, M.J.; Stella, L.; White, N.E. X-ray fluorescence from the inner disc in Cygnus X-1. Mon. Not. R. Astron. Soc. 1989, 238, 729. [Google Scholar] [CrossRef]
- Laor, A. Line Profiles from a Disk around a Rotating Black Hole. Astrophys. J. 1991, 376, 90. [Google Scholar] [CrossRef]
- Brenneman, L.W.; Reynolds, C.S. Constraining Black Hole Spin via X-Ray Spectroscopy. Astrophys. J. 2006, 652, 1028. [Google Scholar] [CrossRef]
- Reynolds, C.S. The spin of supermassive black holes. Class. Quantum Gravity 2013, 30, 244004. [Google Scholar] [CrossRef] [Green Version]
- Reynolds, C.S.; Fabian, A.C. Broad Iron-Kα Emission Lines as a Diagnostic of Black Hole Spin. Astrophys. J. 2008, 675, 1048. [Google Scholar] [CrossRef] [Green Version]
- Ballantyne, D.R.; Vaughan, S.; Fabian, A.C. A two-component ionized reflection model of MCG-6-30-15. Mon. Not. R. Astron. Soc. 2003, 342, 239. [Google Scholar] [CrossRef] [Green Version]
- Iwasawa, K. The variable iron K emission line in MCG-6-30-15. Mon. Not. R. Astron. Soc. 1996, 282, 1038. [Google Scholar] [CrossRef] [Green Version]
- Risaliti, G. A rapidly spinning supermassive black hole at the centre of NGC 1365. Nature 2013, 494, 449. [Google Scholar] [CrossRef] [Green Version]
- Mondal, S.; Chakrabarti, S.K.; Debnath, D. Spectral study of GX 339-4 with TCAF using Swift and NuSTAR observation. Astrophys. Space Sci. 2016, 361, 309. [Google Scholar] [CrossRef]
- Ross, R.R.; Fabian, A.C. A comprehensive range of X-ray ionized-reflection models. Mon. Not. R. Astron. Soc. 2005, 358, 211. [Google Scholar] [CrossRef]
- Ross, R.R.; Fabian, A.C.; Young, A.J. X-ray reflection spectra from ionized slabs. Mon. Not. R. Astron. Soc. 1999, 306, 461. [Google Scholar] [CrossRef] [Green Version]
- Huchra, J.P.; Vogeley, M.S.; Geller, M.J. The CFA Redshift Survey: Data for the South Galactic CAP. Astrophys. J. Suppl. 1999, 121, 287. [Google Scholar] [CrossRef]
- Grier, C.J.; Peterson, B.M.; Pogge, R.W. A Reverberation Lag for the High-ionization Component of the Broad-line Region in the Narrow-line Seyfert 1 Mrk 335. Astrophys. J. 2012, 744, L4. [Google Scholar] [CrossRef]
- Longinotti, A.L.; Krongold, Y.; Kriss, G.A.; Ely, J.; Pradhan, A. The Rise of an Ionized Wind in the Narrow-line Seyfert 1 Galaxy Mrk 335 Observed by XMM-Newton and HST. Astrophys. J. 2013, 766, 104. [Google Scholar] [CrossRef] [Green Version]
- Grupe, D.; Komossa, S.; Gallo, L.C. Discovery of the Narrow-Line Seyfert 1 Galaxy Markarian 335 in a Historical Low X-Ray Flux State. Astrophys. J. 2007, 668, L111. [Google Scholar] [CrossRef] [Green Version]
- Grupe, D. XMM-Newton Observations of the Narrow-Line Seyfert 1 Galaxy Mrk 335 in a Historical Low X-Ray Flux State. Astrophys. J. 2008, 681, 982. [Google Scholar] [CrossRef] [Green Version]
- Gallo, L.C.; Fabian, A.C.; Grupe, D.; Bonson, K.; Komossa, S.; Longinotti, A.L.; Miniutti, G.; Walton, D.J.; Zoghbi, A.; Mathur, S. A blurred reflection interpretation for the intermediate flux state in Mrk 335. Mon. Not. R. Astron. Soc. 2013, 428, 1191. [Google Scholar] [CrossRef] [Green Version]
- Kara, E.; Fabian, A.C.; Cackett, E.M.; Uttley, P.; Wilkins, D.R.; Zoghbi, A. Discovery of high-frequency iron K lags in Ark 564 and Mrk 335. Mon. Not. R. Astron. Soc. 2013, 434, 1129. [Google Scholar] [CrossRef] [Green Version]
- Wilkins, D.R.; Gallo, L.C. Driving extreme variability: The evolving corona and evidence for jet launching in Markarian 335. Mon. Not. R. Astron. Soc. 2015, 449, 129. [Google Scholar] [CrossRef]
- Wilkins, D.R.; Gallo, L.C.; Grupe, D.; Bonson, K.; Komossa, S.; Fabian, A.C. Flaring from the supermassive black hole in Mrk 335 studied with Swift and NuSTAR. Mon. Not. R. Astron. Soc. 2015, 454, 4440. [Google Scholar] [CrossRef] [Green Version]
- Gallo, L.C.; Blue, D.M.; Grupe, D.; Komossa, S.; Wilkins, D.R. Eleven years of monitoring the Seyfert 1 Mrk 335 with Swift: Characterizing the X-ray and UV/optical variability. Mon. Not. R. Astron. Soc. 2018, 478, 2557. [Google Scholar] [CrossRef] [Green Version]
- Gallo, L.C.; Gonzalez, A.G.; Waddell, S.G.H.; Ehler, H.J.S.; Wilkins, D.R.; Longinotti, A.L.; Grupe, D.; Komossa, S.; Kriss, G.A.; Pinto, C. Evidence for an emerging disc wind and collimated outflow during an X-ray flare in the narrow-line Seyfert 1 galaxy Mrk 335. Mon. Not. R. Astron. Soc. 2019, 484, 4287. [Google Scholar] [CrossRef] [Green Version]
- Arnaud, K.A. XSPEC: The First Ten Years. ASP Conf. Ser. 1996, 101, 17. [Google Scholar]
- Wilms, J.; Allen, A.; McCray, R. On the Absorption of X-Rays in the Interstellar Medium. Astrophys. J. 2000, 542, 914. [Google Scholar] [CrossRef] [Green Version]
- Kalberla, P.M.W.; Burton, W.B.; Hartmann, D.; Arnal, E.M.; Bajaja, E.; Morras, R.; Poppel, W.G.L. The Leiden/Argentine/Bonn (LAB) Survey of Galactic HI. Final data release of the combined LDS and IAR surveys with improved stray-radiation corrections. Astron. Astrophys. 2005, 440, 775. [Google Scholar] [CrossRef]
- Magdziarz, P.; Zdziarski, A.A. Angle-dependent Compton reflection of X-rays and gamma-rays. Mon. Not. R. Astron. Soc. 1995, 273, 837. [Google Scholar] [CrossRef] [Green Version]
- Mondal, S.; Chakrabarti, S.K.; Nagarkoti, S.; Arevalo, P. Possible range of viscosity parameter to trigger black hole candidates to exhibit different states of outbursts. Astrophys. J. 2017, 850, 47. [Google Scholar] [CrossRef] [Green Version]
- Mastroserio, G.; Ingram, A.; van der Klis, M. Multi-timescale reverberation mapping of Mrk 335. Mon. Not. R. Astron. Soc. 2020, 498, 4971. [Google Scholar] [CrossRef]
- Garcia, J.A.; Steiner, J.F.; Mcclintock, J.E.; Remillard, R.A.; Grinberg, V.; Dauser, T. X-Ray Reflection Spectroscopy of the Black Hole GX 339–4: Exploring the Hard State with Unprecedented Sensitivity. Astrophys. J. 2015, 813, 84. [Google Scholar] [CrossRef]
- Chainakun, P.; Young, A.J. Simultaneous spectral and reverberation modelling of relativistic reflection in Mrk 335. Mon. Not. R. Astron. Soc. 2015, 452, 333. [Google Scholar] [CrossRef] [Green Version]
- Ezhikode, S.H.; Dewangan, G.C.; Misra, R.; Philip, N.S. Correlation between relativistic reflection fraction and photon index in NuSTAR sample of Seyfert 1 AGN. Mon. Not. R. Astron. Soc. 2020, 495, 3373. [Google Scholar] [CrossRef]
- Reeves, J.; Done, C.; Pounds, K.; Terashima, Y.; Hayashida, K.; Anabuki, N.; Uchino, M.; Turner, M. On why the Iron K-shell absorption in AGN is not a signature of the local Warm/Hot Intergalactic Medium. Mon. Not. R. Astron. Soc. 2008, 385L, 108. [Google Scholar] [CrossRef] [Green Version]
- Chakrabarti, S.K. Estimation and effects of the mass outflow from shock compressed flow around compact objects. Astron. Astrophys. 1999, 351, 185. [Google Scholar]
- Chakrabarti, S.K. Spectral signature of mass loss (and mass gain by) an accretion disk around a black hole. Astrophys. J. 2002, 579L, 21. [Google Scholar] [CrossRef]
- Mondal, S.; Chakrabarti, S.K.; Debnath, D. Spectral signatures of dissipative standing shocks and mass outflow in presence of Comptonization around a black hole. Astrophys. Space Sci. 2014, 353, 223. [Google Scholar] [CrossRef] [Green Version]
- Chatterjee, D.; Debnath, D.; Jana, A.; Chakrabarti, S.K. Properties of the black hole candidate XTE J1118+480 with the TCAF solution during its jet activity induced 2000 outburst. Astrophys. Space Sci. 2019, 364, 14. [Google Scholar] [CrossRef] [Green Version]
- Chakrabarti, S.K.; Wiita, P.J. Spiral Shocks in Accretion Disks As a Contributor to Variability in Active Galactic Nuclei. Astrophys. J. 1993, 411, 602. [Google Scholar] [CrossRef]
- Komossa, S. Lifting the curtain: The Seyfert galaxy Mrk 335 emerges from deep low-state in a sequence of rapid flare events. Astron. Astrophys. 2020, 643L, 7. [Google Scholar] [CrossRef]
- Parker, M.L. The nuclear environment of the NLS1 Mrk 335: Obscuration of the X-ray line emission by a variable outflow. Mon. Not. R. Astron. Soc. 2019, 490, 683. [Google Scholar] [CrossRef] [Green Version]
- Sarma, R.; Tripathi, S.; Misra, R.; Dewangan, G.; Pathak, A.; Sarma, J.K. Relationship between X-ray spectral index and X-ray Eddington ratio for Mrk 335 and Ark 564. Mon. Not. R. Astron. Soc. 2015, 448, 1541. [Google Scholar] [CrossRef] [Green Version]
Figure 1.
Spectra of all eight observations in the 3–30 keV energy range. Variability of the source is evident.
Figure 1.
Spectra of all eight observations in the 3–30 keV energy range. Variability of the source is evident.

Figure 2.
Sample fit of 3–30 keV spectra with PL, pexrav, and tcaf models for OBSIDs 60001041002 (left panel) and 60001041003 (right panel) along with the residuals.
Figure 2.
Sample fit of 3–30 keV spectra with PL, pexrav, and tcaf models for OBSIDs 60001041002 (left panel) and 60001041003 (right panel) along with the residuals.

Figure 3.
Same as Figure 2 but for the OBSIDs 60001041005 (left panel) and 80001020002 (right panel) along with the residuals.
Figure 3.
Same as Figure 2 but for the OBSIDs 60001041005 (left panel) and 80001020002 (right panel) along with the residuals.

Figure 4.
Two-component advective flow (TCAF) model fitted parameter evolutions with observation days are shown along with hardness ratio (HR) estimated from the power-law (PL) model fitted fluxes.
Figure 4.
Two-component advective flow (TCAF) model fitted parameter evolutions with observation days are shown along with hardness ratio (HR) estimated from the power-law (PL) model fitted fluxes.


Table 1.
Log of observations.
| Date | MJD | OBSID | Exposure (s) |
|---|---|---|---|
| 13 June 2013 | 56,456 | 60001041002 | 21,299 |
| 13 June 2013 | 56,456 | 60001041003 | 21,525 |
| 25 June 2013 | 56,468 | 60001041005 | 93,028 |
| 20 September 2014 | 56,920 | 80001020002 | 68,908 |
| 10 July 2018 | 58,309 | 80201001002 | 82,257 |
| 06 June 2020 | 59,006 | 90602619004 | 30,156 |
| 07 June 2020 | 59,007 | 90602619006 | 30,495 |
| 08 June 2020 | 59,008 | 90602619008 | 22,452 |
Table 2.
Best-fitting parameters with the tbabs(gauss+pl) model.
| OBSID | [keV] | [keV] | |||
|---|---|---|---|---|---|
| 60001041002 | 71.91/65 | ||||
| 60001041003 | 102.1/85 | ||||
| 60001041005 | 452.94/316 | ||||
| 80001020002 | 320.71/264 | ||||
| 80201001002 | 136.14/124 | ||||
| 90602619004 | 107.16/79 | ||||
| 90602619006 | 82.39/106 | ||||
| 90602619008 | 92.29/80 |
and are the PL index and normalization. and are the Gaussian line energy and width, respectively.
Table 3.
Best-fitting parameters with the tbabs(pexrav+gauss) model.
| OBSID | [keV] | [keV] | [keV] | |||
|---|---|---|---|---|---|---|
| 60001041002 | 68.01/63 | |||||
| 60001041003 | 89.72/83 | |||||
| 323.19/311 | ||||||
| 80001020002 | 253.39/262 | |||||
| 80201001002 | 128.70/122 | |||||
| 90602619004 | 96.97/77 | |||||
| 90602619006 | 81.39/104 | |||||
| 90602619008 | 78.82/78 |
, , and are model PL photon index, cutoff energy, and reflection scaling factor, respectively. and are the Gaussian line energy and width. We kept the disk inclination fixed at 45[55] and at Solar abundance value. : Gaussian component was added at keV with line width keV. The origin of this line is not clear yet, however, a similar line was observed for Mrk 335 earlier [56].
Table 4.
Best-fitting parameters with the tbabs(tcaf+gauss).
| OBSID | [] | [] | R | [keV] | [keV] | |||
|---|---|---|---|---|---|---|---|---|
| 60001041002 | 72.45/61 | |||||||
| 60001041003 | 101.75/81 | |||||||
| 333.54/309 | ||||||||
| 244.18/256 | ||||||||
| 130.29/117 | ||||||||
| 87.65/72 | ||||||||
| 90602619006 | 82.35/102 | |||||||
| 90602619008 | 95.42/76 |
and represent tbabs(tcaf+Gauss) model fitted sub-Keplerian (halo) and Keplerian (disk) rates, respectively. and R are the model fitted shock location and shock compression ratio values, respectively. and are the Gaussian line energy and width. : Gaussian component was added at keV with line width keV. : diskline [26] component was added with line energy at keV, powerlaw of emissivity () = , inner radius () = , and disk inclination was frozen at . : zxipcf [57] multiplicative model component was used for parameters: column density , covering fraction , . : Gaussian component was added at keV with line width keV.
Publisher’s Note: MDPI stays neutral with regard to jurisdictional claims in published maps and institutional affiliations. |
© 2021 by the authors. Licensee MDPI, Basel, Switzerland. This article is an open access article distributed under the terms and conditions of the Creative Commons Attribution (CC BY) license (http://creativecommons.org/licenses/by/4.0/).
Share and Cite
MDPI and ACS Style
Mondal, S.; Stalin, C.S. Changing Accretion Geometry of Seyfert 1 Mrk 335 with NuSTAR: A Comparative Study. Galaxies 2021, 9, 21. https://0-doi-org.brum.beds.ac.uk/10.3390/galaxies9020021
AMA Style
Mondal S, Stalin CS. Changing Accretion Geometry of Seyfert 1 Mrk 335 with NuSTAR: A Comparative Study. Galaxies. 2021; 9(2):21. https://0-doi-org.brum.beds.ac.uk/10.3390/galaxies9020021
Chicago/Turabian StyleMondal, Santanu, and C. S. Stalin. 2021. "Changing Accretion Geometry of Seyfert 1 Mrk 335 with NuSTAR: A Comparative Study" Galaxies 9, no. 2: 21. https://0-doi-org.brum.beds.ac.uk/10.3390/galaxies9020021
Note that from the first issue of 2016, this journal uses article numbers instead of page numbers. See further details here.