Article

iNOS Gene Ablation Prevents Liver Fibrosis in Leptin-Deficient ob/ob Mice

by
Sara Becerril
1,2,3,*,
Amaia Rodríguez
1,2,3,
Victoria Catalán
1,2,3,
Beatriz Ramírez
1,2,3,
Xabier Unamuno
1,2,4,
Javier Gómez-Ambrosi
1,2,3 and
Gema Frühbeck
1,2,3,5
1
Metabolic Research Laboratory, Clínica Universidad de Navarra, 31009 Pamplona, Spain
2
CIBER Fisiopatología de la Obesidad y Nutrición (CIBEROBN), Instituto de Salud Carlos III, 28029 Madrid, Spain
3
Obesity and Adipobiology Group, Instituto de Investigación Sanitaria de Navarra (IdiSNA), 31009 Pamplona, Spain
4
Medical Engineering Laboratory, University of Navarra, 31009 Pamplona, Spain
5
Department of Endocrinology & Nutrition, Clínica Universidad de Navarra, 31009 Pamplona, Spain
*
Author to whom correspondence should be addressed.
Submission received: 15 January 2019 / Revised: 14 February 2019 / Accepted: 22 February 2019 / Published: 27 February 2019
(This article belongs to the Special Issue Gene-Diet Interactions in Obesity)

Abstract

:
The role of extracellular matrix (ECM) remodeling in fibrosis progression in nonalcoholic fatty liver disease (NAFLD) is complex and dynamic, involving the synthesis and degradation of different ECM components, including tenascin C (TNC). The aim was to analyze the influence of inducible nitric oxide synthase (iNOS) deletion on inflammation and ECM remodeling in the liver of ob/ob mice, since a functional relationship between leptin and iNOS has been described. The expression of molecules involved in inflammation and ECM remodeling was analyzed in the liver of double knockout (DBKO) mice simultaneously lacking the ob and the iNOS genes. Moreover, the effect of leptin was studied in the livers of ob/ob mice and compared to wild-type rodents. Liver inflammation and fibrosis were increased in leptin-deficient mice. As expected, leptin treatment reverted the obesity phenotype. iNOS deletion in ob/ob mice improved insulin sensitivity, inflammation, and fibrogenesis, as evidenced by lower macrophage infiltration and collagen deposition as well as downregulation of the proinflammatory and profibrogenic genes including Tnc. Circulating TNC levels were also decreased. Furthermore, leptin upregulated TNC expression and release via NO-dependent mechanisms in AML12 hepatic cells. iNOS deficiency in ob/ob mice improved liver inflammation and ECM remodeling-related genes, decreasing fibrosis, and metabolic dysfunction. The activation of iNOS by leptin is necessary for the synthesis and secretion of TNC in hepatocytes, suggesting an important role of this alarmin in the development of NAFLD.

1. Introduction

Obesity is associated with a wide spectrum of liver abnormalities, including nonalcoholic fatty liver disease (NAFLD), characterized by an increased intrahepatic triglyceride content. NAFLD is a major contributor to cardiovascular disease and a major cause of obesity-related morbidity and mortality [1]. It represents the most prominent form of liver diseases worldwide and ranges from simple fatty liver and non-alcoholic steatohepatitis (NASH) to liver cirrhosis and hepatocellular carcinoma [2]. Although the cause of NAFLD is unclear, a “multiple-hit” model of NAFLD development has been postulated considering multiple insults acting together on genetically predisposed subjects to develop NAFLD. Such hits include obesity, insulin resistance, hepatic lipid accumulation, activation of the inflammatory cascade, and fibrogenesis, as well as genetic and epigenetic factors [3]. Insulin resistance plays a key role, driving to an excessive de novo lipogenesis, a reduction of lipolysis, and the consequent increase of intrahepatic lipids [4]. Like other metabolic diseases, the generation of oxidative stress is another important contributor in the pathogenesis of NAFLD [5]. The excessive reactive oxygen species (ROS) participate in the development of NAFLD through different mechanisms, including lipid peroxidation and the subsequent activation of the nuclear transcription factor-κB (NF-κB) as well as the activation of hepatic stellate cells (HSC), the primary source of extracellular matrix (ECM) proteins such as collagen or tenascin C (TNC) [6]. NF-κB can bind to the inducible nitric oxide synthase (iNOS) promoter, inducing its expression and triggering the inflammatory process. The large amount of nitric oxide (NO) derived from iNOS stimulation acts in combination with ROS and produces nitrosative stress, creating a deleterious environment that leads to cell death and tissue damage [7].
Tenascin C is a multifunctional hexameric ECM glycoprotein undetectable in most healthy adult tissues, but highly expressed during embryonic development and dynamic tissue remodeling [8]. TNC modulates fibrotic and inflammatory responses in several diseases, including liver fibrosis, through the enhancement of the inflammatory response [9]. In this line, TNC is upregulated and deposited in both fibrotic areas and perisinusoidal spaces during liver diseases, with HSCs being considered its cellular source [10].
Leptin, the product of the obese (ob) gene, is also produced by HSCs after their activation [11]. In addition to its actions in the central nervous system, this adipocyte-derived hormone has direct effects on peripheral tissues, including the liver, the first adipokine directly associated with hepatic fibrosis [12]. Moreover, leptin mediates an inflammatory response by regulating the production of proinflammatory cytokines such as tumor necrosis factor alfa (TNF-α), interleukin-6 (IL-6), and IL-1β [13]. These cytokines also increase the secretion of leptin, sustaining a chronic proinflammatory state [14].
The functional relationship between leptin and iNOS has been described earlier by our group [15,16,17,18,19] and others [20,21]. In order to delve into the knowledge about the functional interplay between leptin and iNOS, which we previously demonstrated in double knockout (DBKO) mice lacking both genes [18,22], we hypothesized that the iNOS gene is involved in the liver inflammation and fibrosis development of ob/ob mice.

2. Material and Methods

2.1. Animals

The generation of a DBKO mouse simultaneously lacking the ob and the iNOS genes was performed as previously described [18]. Briefly, male ob/ob mice were intercrossed with female iNOS knockout mice (iNOS-/-) on a C57BL/6J background (Jackson Laboratories, Bar Harbor, ME, USA). Male mice were weaned at 21 days of age, genotyped, and maintained at room temperature (RT) on an artificial light–dark cycle (lights on from 8:00 a.m. to 8:00 p.m.) with a relative humidity of 50 ± 10% in a pathogen-free barrier facility. Mice had free access to water and were fed ad libitum a normal diet (ND) (12.1 kJ: 4% fat, 82% carbohydrate, and 14% protein, 2014S Teklad Global 14% Protein Rodent Maintenance Diet, Harlan, Barcelona).
In a second subset of experiments, ten-week-old ob/ob mice were subclassified into three groups: control, leptin-treated (1 mg/kg/d), and pair-fed (n = 5 per group), as previously described [23]. The control and pair-fed groups received the vehicle (phosphate-buffered saline (PBS)), while leptin (Bachem, Bubendorf, Switzerland) was injected intraperitoneally twice a day at 8:00 a.m. and 8:00 p.m. for 28 days in the leptin-treated group. Control and leptin-treated groups were fed ad libitum with a standard chow diet (2014S Teklad, Harlan, Barcelona, Spain) [24], while the daily food intake of the pair-fed groups was matched to the amount eaten by the leptin-treated groups the day before to discriminate the inhibitory effect of leptin on appetite.
Body weight and food intake were measured twice a week. The food efficiency ratio (FER) was determined as body weight gained per week divided by total energy (kcal) consumed over this period.
Twelve-week-old mice were sacrificed by CO2 inhalation under fasting conditions. Sera samples were stored at −20 °C. Liver was carefully excised, weighed, frozen in liquid nitrogen, and stored at −80 °C. Hepatic biopsies were also fixed in 4% formaldehyde for immunohistochemical analyses. All experimental procedures conformed to the European Guidelines for the Care and Use of Laboratory Animals (Directive 2010/63/EU), and the study was approved by the Ethical Committee for Animal Experimentation of the University of Navarra.

2.2. Blood Measurements

Blood samples were collected by cardiac puncture. Serum glucose was measured using a blood glucose meter (Ascensia Elite, Bayer, Barcelona, Spain). Concentrations of triglycerides, free fatty acids (FFA) (Wako Chemicals GmbH, Neuss, Germany), and glycerol (Sigma, St. Louis, MO, USA) were measured by enzymatic methods using commercially available kits as previously described [18]. Serum insulin and adiponectin were determined by ELISA (Crystal Chem Inc., Chicago, IL, USA and BioVendor Laboratory Medicine Inc., Modrice, Czech Republic, respectively). Intra- and inter-assay coefficients of variation for measurements of insulin and adiponectin were, respectively, 3.5 and 6.3% for the former, and 5.6 and 7.2% for the latter. The homeostatic model assessment (HOMA) was calculated as an indirect measure of insulin resistance with the formula: [fasting insulin (µU/mL) × fasting glucose (mmol/L)]/22.5. Circulating levels of TNC were determined by ELISA (IBL International GmbH, Hamburg, Germany). Intra- and inter-assay coefficients of variation for measurements of TNC were 3.5 and 6.3%, respectively.

2.3. Intrahepatic Lipid Content

The intrahepatic triglyceride content was measured by enzymatic methods, as previously described [25]. Briefly, tissues were homogenized and diluted in saline at a final concentration of 50 mg/mL. Homogenates were diluted (1:1) in 1% deoxycholate (Sigma) and incubated at 37 °C for 5 min. For triglyceride measurements, samples were diluted 1:100 in the reagent (Infinity Triglycerides Liquid Stable Reagent, Thermo Electron Corporation, Louisville, CO, USA) and incubated for 30 min at 37 °C. The resulting dye was measured based on its absorbance at 550 nm. Concentrations were determined compared with a standard curve of triglycerides (InfinityTM Triglycerides Standard, Thermo Electron). The protein content of the homogenates was measured by the Bradford method, using bovine serum albumin (BSA) (Sigma) as standard. All assays were carried out in duplicate.

2.4. Cell Cultures

A non-tumorigenic mouse hepatocyte cell line AML12 was purchased from American Type Culture Collection (Manassas, VA, USA) and maintained in a DMEM/F-12 medium (Invitrogen, Barcelona Spain) supplemented with 10% fetal bovine serum (FBS) (Invitrogen), 5 μg mL insulin, 5 μg mL transferrin, 5 ng mL selenium (Invitrogen), 40 ng m/L dexamethasone (Sigma), and antibiotic-antimycotic (complete growth medium). AML12 cells were plated 2 × 10⁵ cells/cm2 and grown in complete growth medium. AML12 hepatic cells were serum-starved for 24 h, and quiescent cells were stimulated with recombinant murine leptin (10 nmol/L) (450-31, PeproTech EC Inc., Rocky Hill, NJ, USA) in the presence or absence of L-N6-(1-iminoethyl)-lysine (L-NIL), a specific NOS inhibitor (10 µmol/L) (I8021, Sigma). Moreover, AML12 hepatocytes were serum-starved for 24 h and quiescent cells were stimulated with recombinant tenascin C (10 nmol/L) (3358-TC-050; R&D Systems, Minneapolis, MN, USA). The concentrations of leptin, tenascin C, and pharmacological inhibitor to perform the experiments were chosen on the basis of previous studies carried out by our group [22]. One sample per experiment was used to obtain control responses in the presence of the solvent.

2.5. RNA Extraction and Real-Time PCR

Total RNA was extracted from liver samples by homogenization with an ULTRA-TURRAX T 25 basic (IKA Werke GmbH, Staufen, Germany) using TRIzol Reagent (Invitrogen). RNA purification was carried out using the RNeasy Mini kit (Qiagen, Barcelona, Spain). All samples were treated with DNase (RNase-free DNase Set, Qiagen). The RNA concentration was determined from absorbance at 260 nm. For first-strand cDNA synthesis, constant amounts of total RNA were reverse transcribed using random hexamers as primers and M-MLV reverse transcriptase as previously described [26]. The transcript levels for Tnc, tumor necrosis factor-α (Tnf), toll-like receptor 4 (Tlr4), hypoxia inducible factor 1 alpha (Hif1a), CD11c (Itgax), Cd44, collagen type VI, α3 (Col6a3), collagen type VI, α1 (Col6a1), collagen type I, α1 (Col1a1), egf-like module-containing mucin-like hormone receptor-like 1 (Emr1), matrix metalloproteinase 9 (Mmp9), transforming growth factor β (Tgfb), α smooth muscle actin (α-SMA, Acta2), and osteopontin (Spp1) were quantified by real-time PCR (7300 Real Time PCR System, Applied Biosystems, Foster City, CA, USA).
Primers and probes (Sigma) were designed using the software Primer Express 1.0 (Applied Biosystems) (Table S1). The cDNA was amplified at the following conditions: 95 °C for 10 min, followed by 45 cycles of 15 s at 95 °C and for 1 min at 59 °C, using the TaqMan Universal PCR Master Mix (Applied Biosystems). The primer and probe concentrations for gene amplification were 300 and 200 nmol/L, respectively. All results were normalized to the levels of 18S rRNA (Applied Biosystems), and the relative quantification was calculated using the ΔΔCt formula [27]. Relative messenger RNA (mRNA) expression was expressed as a fold expression over the calibrator sample. All samples were run in duplicate, and the average values were calculated.

2.6. Quantification and Characterization of Fibrotic Depots

Sections of formalin-fixed paraffin-embedded liver (6 µm) were dewaxed with xylene and rehydrated with decreasing concentrations of ethanol. Fibrosis was localized by Sirius Red staining (Sigma). Images of five fields per section from each animal were obtained at 200× magnification and the fibrous tissue area stained with Sirius Red/total amount of tissue was measured using the ImageJ analysis software, as described previously [28].

2.7. Statistical Analysis

Data are presented as the mean ± SEM. Differences between groups were assessed by unpaired two-tailed Student’s t-tests or two-way ANOVA as appropriate. In case of interaction between factors (lack of the iNOS or ob genes), a one-way ANOVA followed by Tukey’s or least significant difference (LSD) post hoc tests were applied. Moreover, comparisons between ob/ob groups and controls were analyzed by one-way ANOVA followed by Tukey’s post hoc tests. Statistics were calculated by the SPSS/Windows version 15.0 software (SPSS, Inc., Chicago, IL, USA). A P-value less than 0.05 was considered statistically significant.

3. Results

3.1. Lack of iNOS Gene Ameliorates the Obese Phenotype of ob/ob Mice

Anthropometric and metabolic variables of 12-week-old wild-type and leptin-deficient mice lacking the iNOS gene are shown in Table 1. As previously described [18,22], leptin-deficient ob/ob mice showed an increased (P < 0.001) body and liver weight that was significantly reduced in the absence of the iNOS gene. The absence of the ob gene was associated with insulin resistance, reflected by the increased (P < 0.001) levels of glucose, insulin, and HOMA index as well as by low adiponectin levels. Moreover, leptin deficiency was related with increased (P < 0.001) serum levels of FFA and glycerol. iNOS deficiency in ob/ob mice was associated with a significant improvement (P < 0.05) in glucose and lipid metabolism as compared to ob/ob mice counterparts. The analysis of intrahepatic TG content also revealed that iNOS deletion significantly (P < 0.05) decreased hepatosteatosis (Table 1).

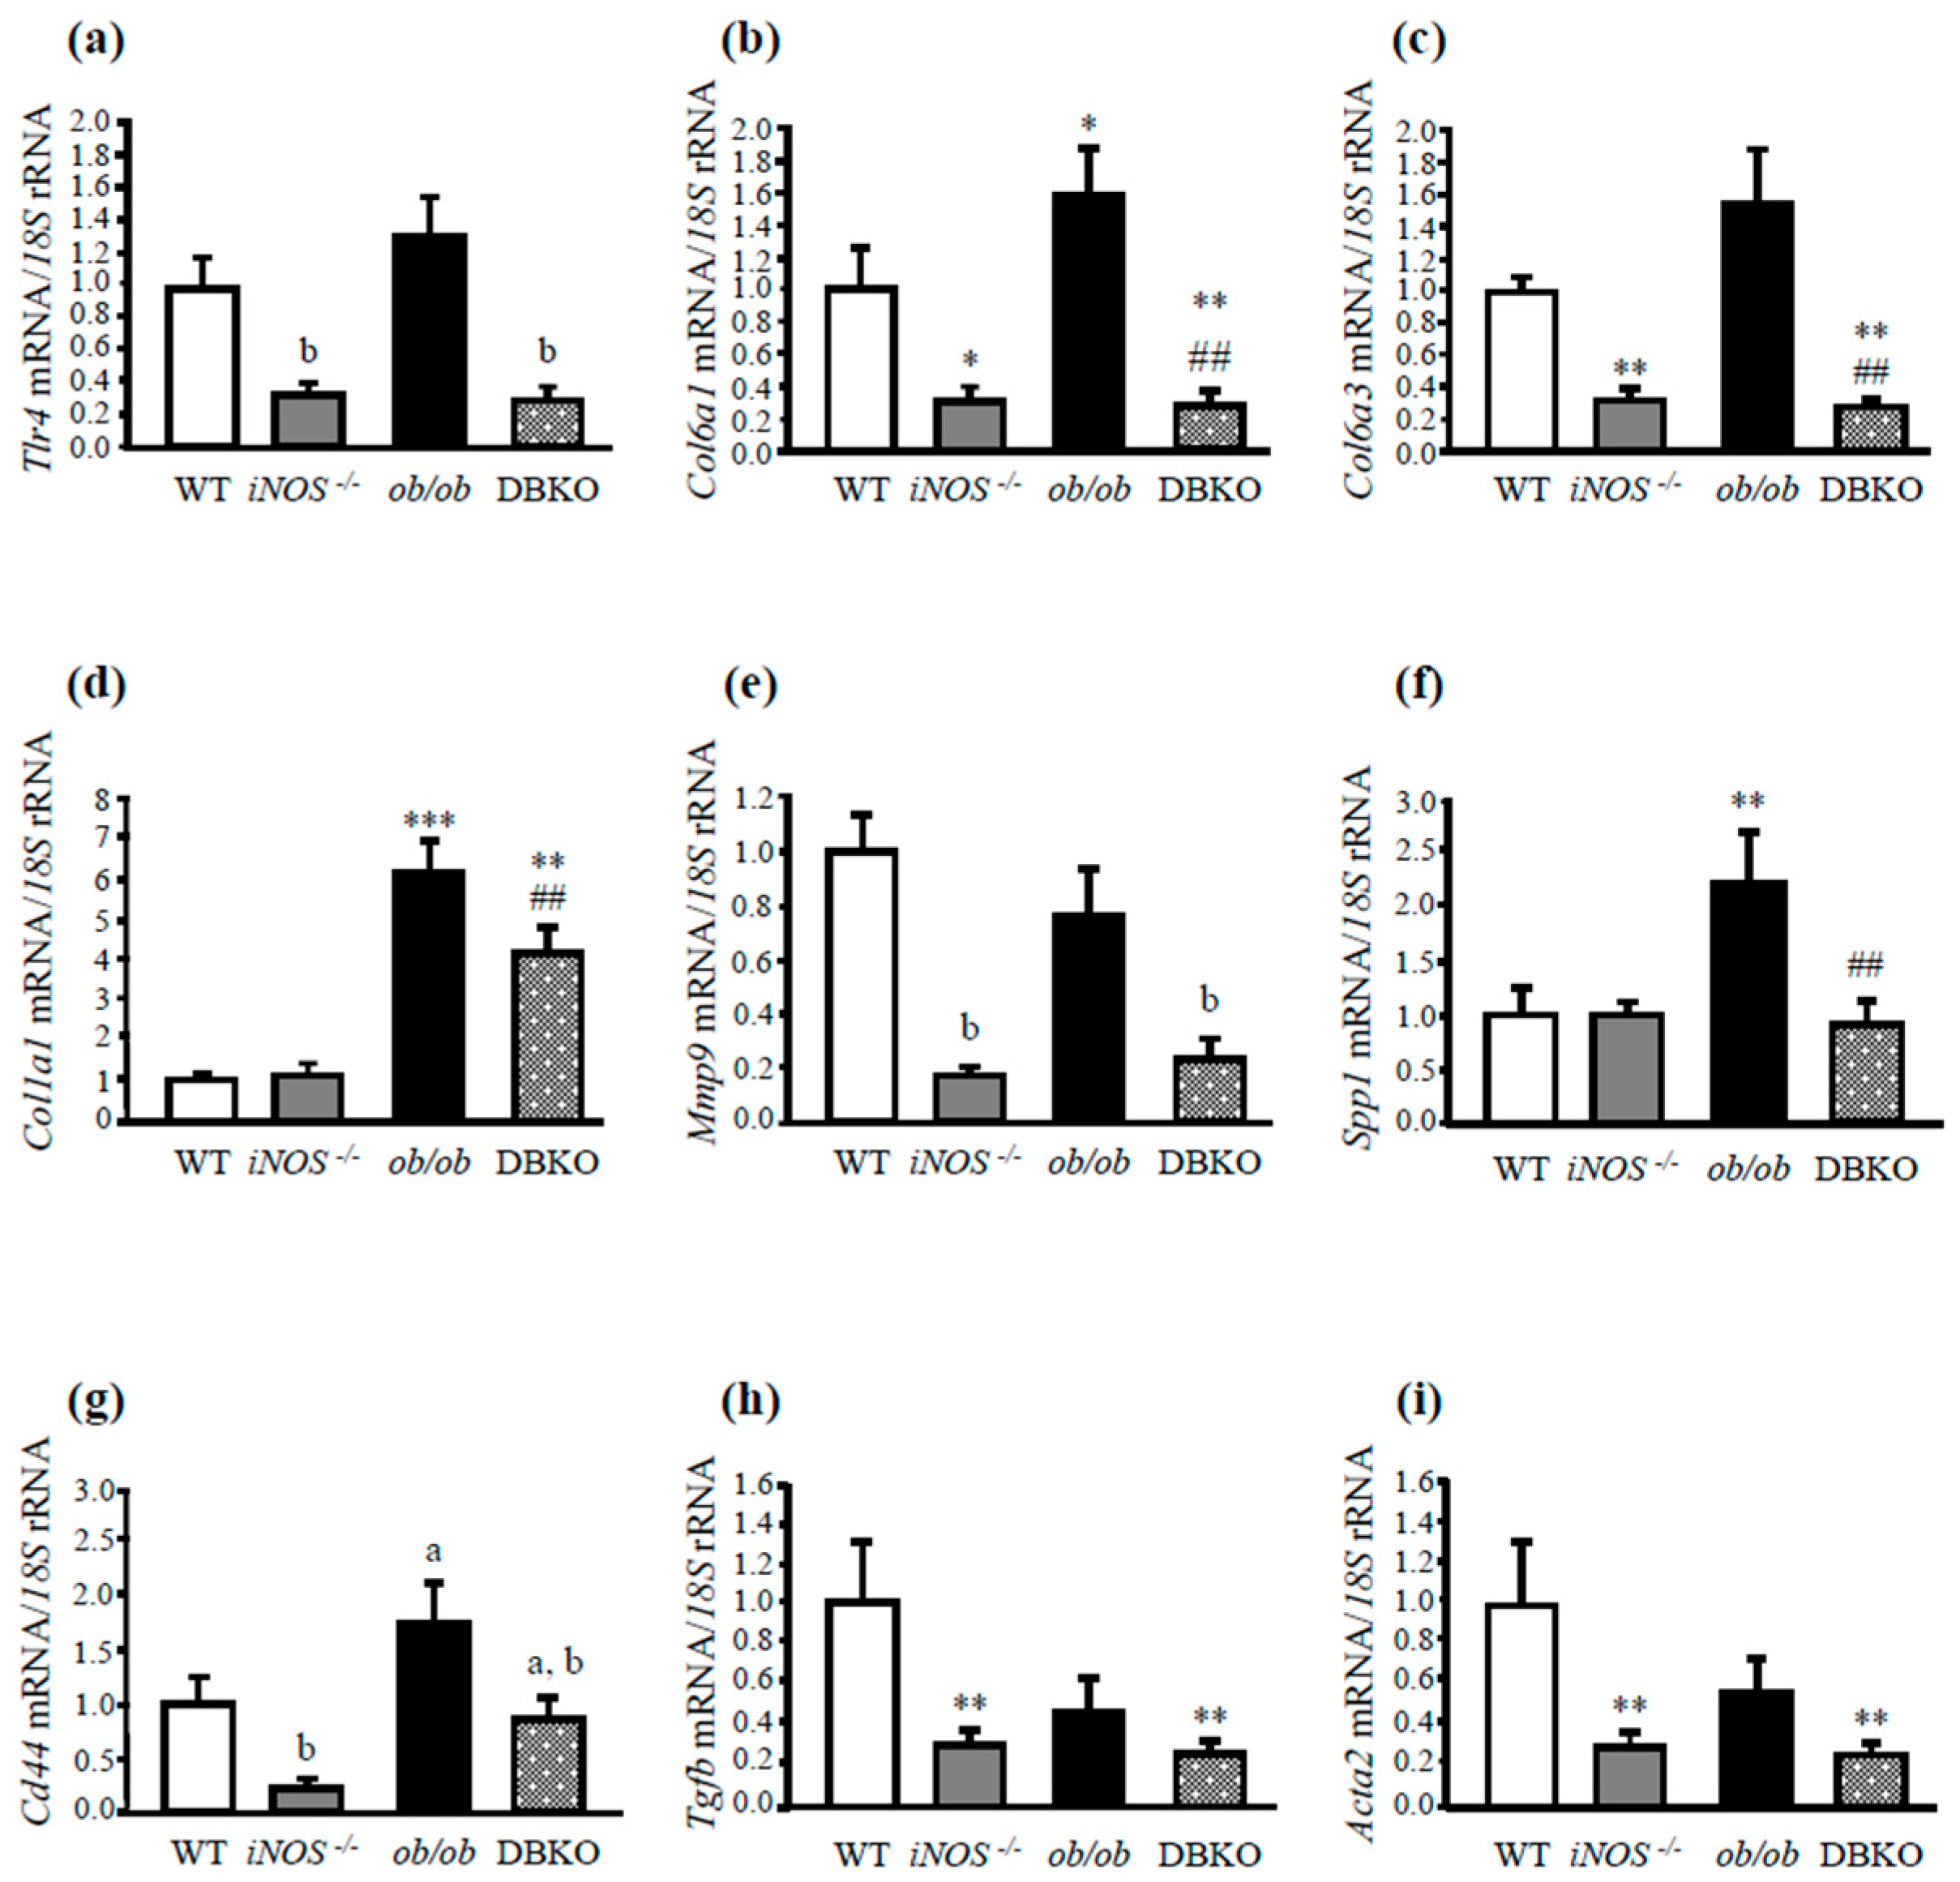
3.2. ob/ob Mice Lacking iNOS Display Changes in the Expression of Molecules Involved in Liver Inflammation

The gene expression levels of key molecules involved in the proinflammatory response were analyzed in the liver of the experimental animals. The mRNA levels of the murine macrophage markers Itgax and Cd68, as well as Tnf and Hif1a were upregulated in ob/ob mice and significantly downregulated in iNOS deficient mice as compared to those of wild-type mice (Figure 1a–d; Figure S1). Furthermore, the gene expression levels of Emr1, Itgax, Cd68, Tnf, and Hifa were significantly downregulated in DBKO mice simultaneously lacking ob and iNOS genes as compared to those of ob/ob mice, revealing decreased liver inflammation (Figure 1a–d; Figure S1).
Compelling evidence has demonstrated a close link between liver inflammation, the production of ECM, and the development of fibrosis [29]. Therefore, the hepatic expression of the alarmin TNC was analyzed in the context of leptin and iNOS deficiency. As shown in Figure 1e, leptin-deficient ob/ob mice exhibited a significant increase in Tnc gene expression levels compared to wild-type mice. Moreover, serum TNC levels were significantly increased (P < 0.05) in ob/ob mice, and deletion of the iNOS gene reduced the circulating levels of this protein, confirming previous data described by our group (Figure 1f) [22].
Since TNC exhibits proinflammatory effects through the activation of TLR4, we compared the expression of genes involved in ECM remodeling in the absence of leptin and iNOS. Transcript levels of Tlr4 were significantly (P < 0.05) increased in the liver of leptin-deficient mice, whereas the deletion of the iNOS gene in ob/ob mice dramatically reduced its expression (Figure 2a). Furthermore, gene expression levels of collagen type VI (Col6a1 and Col6a3) as well as collagen type I (Col1a1) were upregulated in the absence of leptin, while their increased expression was reverted in DBKO mice counterparts (Figure 2b–d), indicating that iNOS is responsible for the collagen production to a certain extent, resulting in less collagen accumulation in iNOS-deficient mice. The gene expression levels of the gelatinase Mmp9 were also markedly decreased (P < 0.01) in iNOS knockout and DBKO mice, whereas no differences where observed in ob/ob animals compared to wild-type mice (Figure 2e).
We next analyzed gene expression levels of osteopontin (Spp1), a multifunctional protein involved in liver diseases. Spp1 mRNA significantly increased (P < 0.001) in leptin-deficient mice (Figure 2f). Moreover, gene expression levels of the osteopontin receptor CD44, recently described as an important marker and a key player of liver diseases, including NAFLD [30], were also determined. Leptin deficiency was associated with higher hepatic Cd44 mRNA, while the deletion of iNOS significantly decreased (P < 0.05) its transcription levels (Figure 2g).
Gene expression levels of the profibrogenic TGF-β were also analyzed. Deletion of iNOS significantly decreased (P < 0.01) Tgfb mRNA expression levels (Figure 2h). In order to elucidate the regulatory effect of the absence of the ob and iNOS genes in the activation of HSC, α-SMA (Acta2) gene expression levels were also determined. mRNA Acta2 was dramatically downregulated (P < 0.01) after iNOS deletion (Figure 2i). Notably, a significant correlation between hepatic gene expression levels of Tnc and Tlr4 (r = 0.442; P = 0.045) as well as with Tnf (r = 0.67; P = 0.001), Col6a1 (r = 0.36; P = 0.048), Col6a3 (r = 0.66; P = 0.001), Col1a1 (r = 0.56; P = 0.008), Acta2 (r = 0.68; P = 0.001), and Tgfb (r = 0.49; P = 0.023) was found.

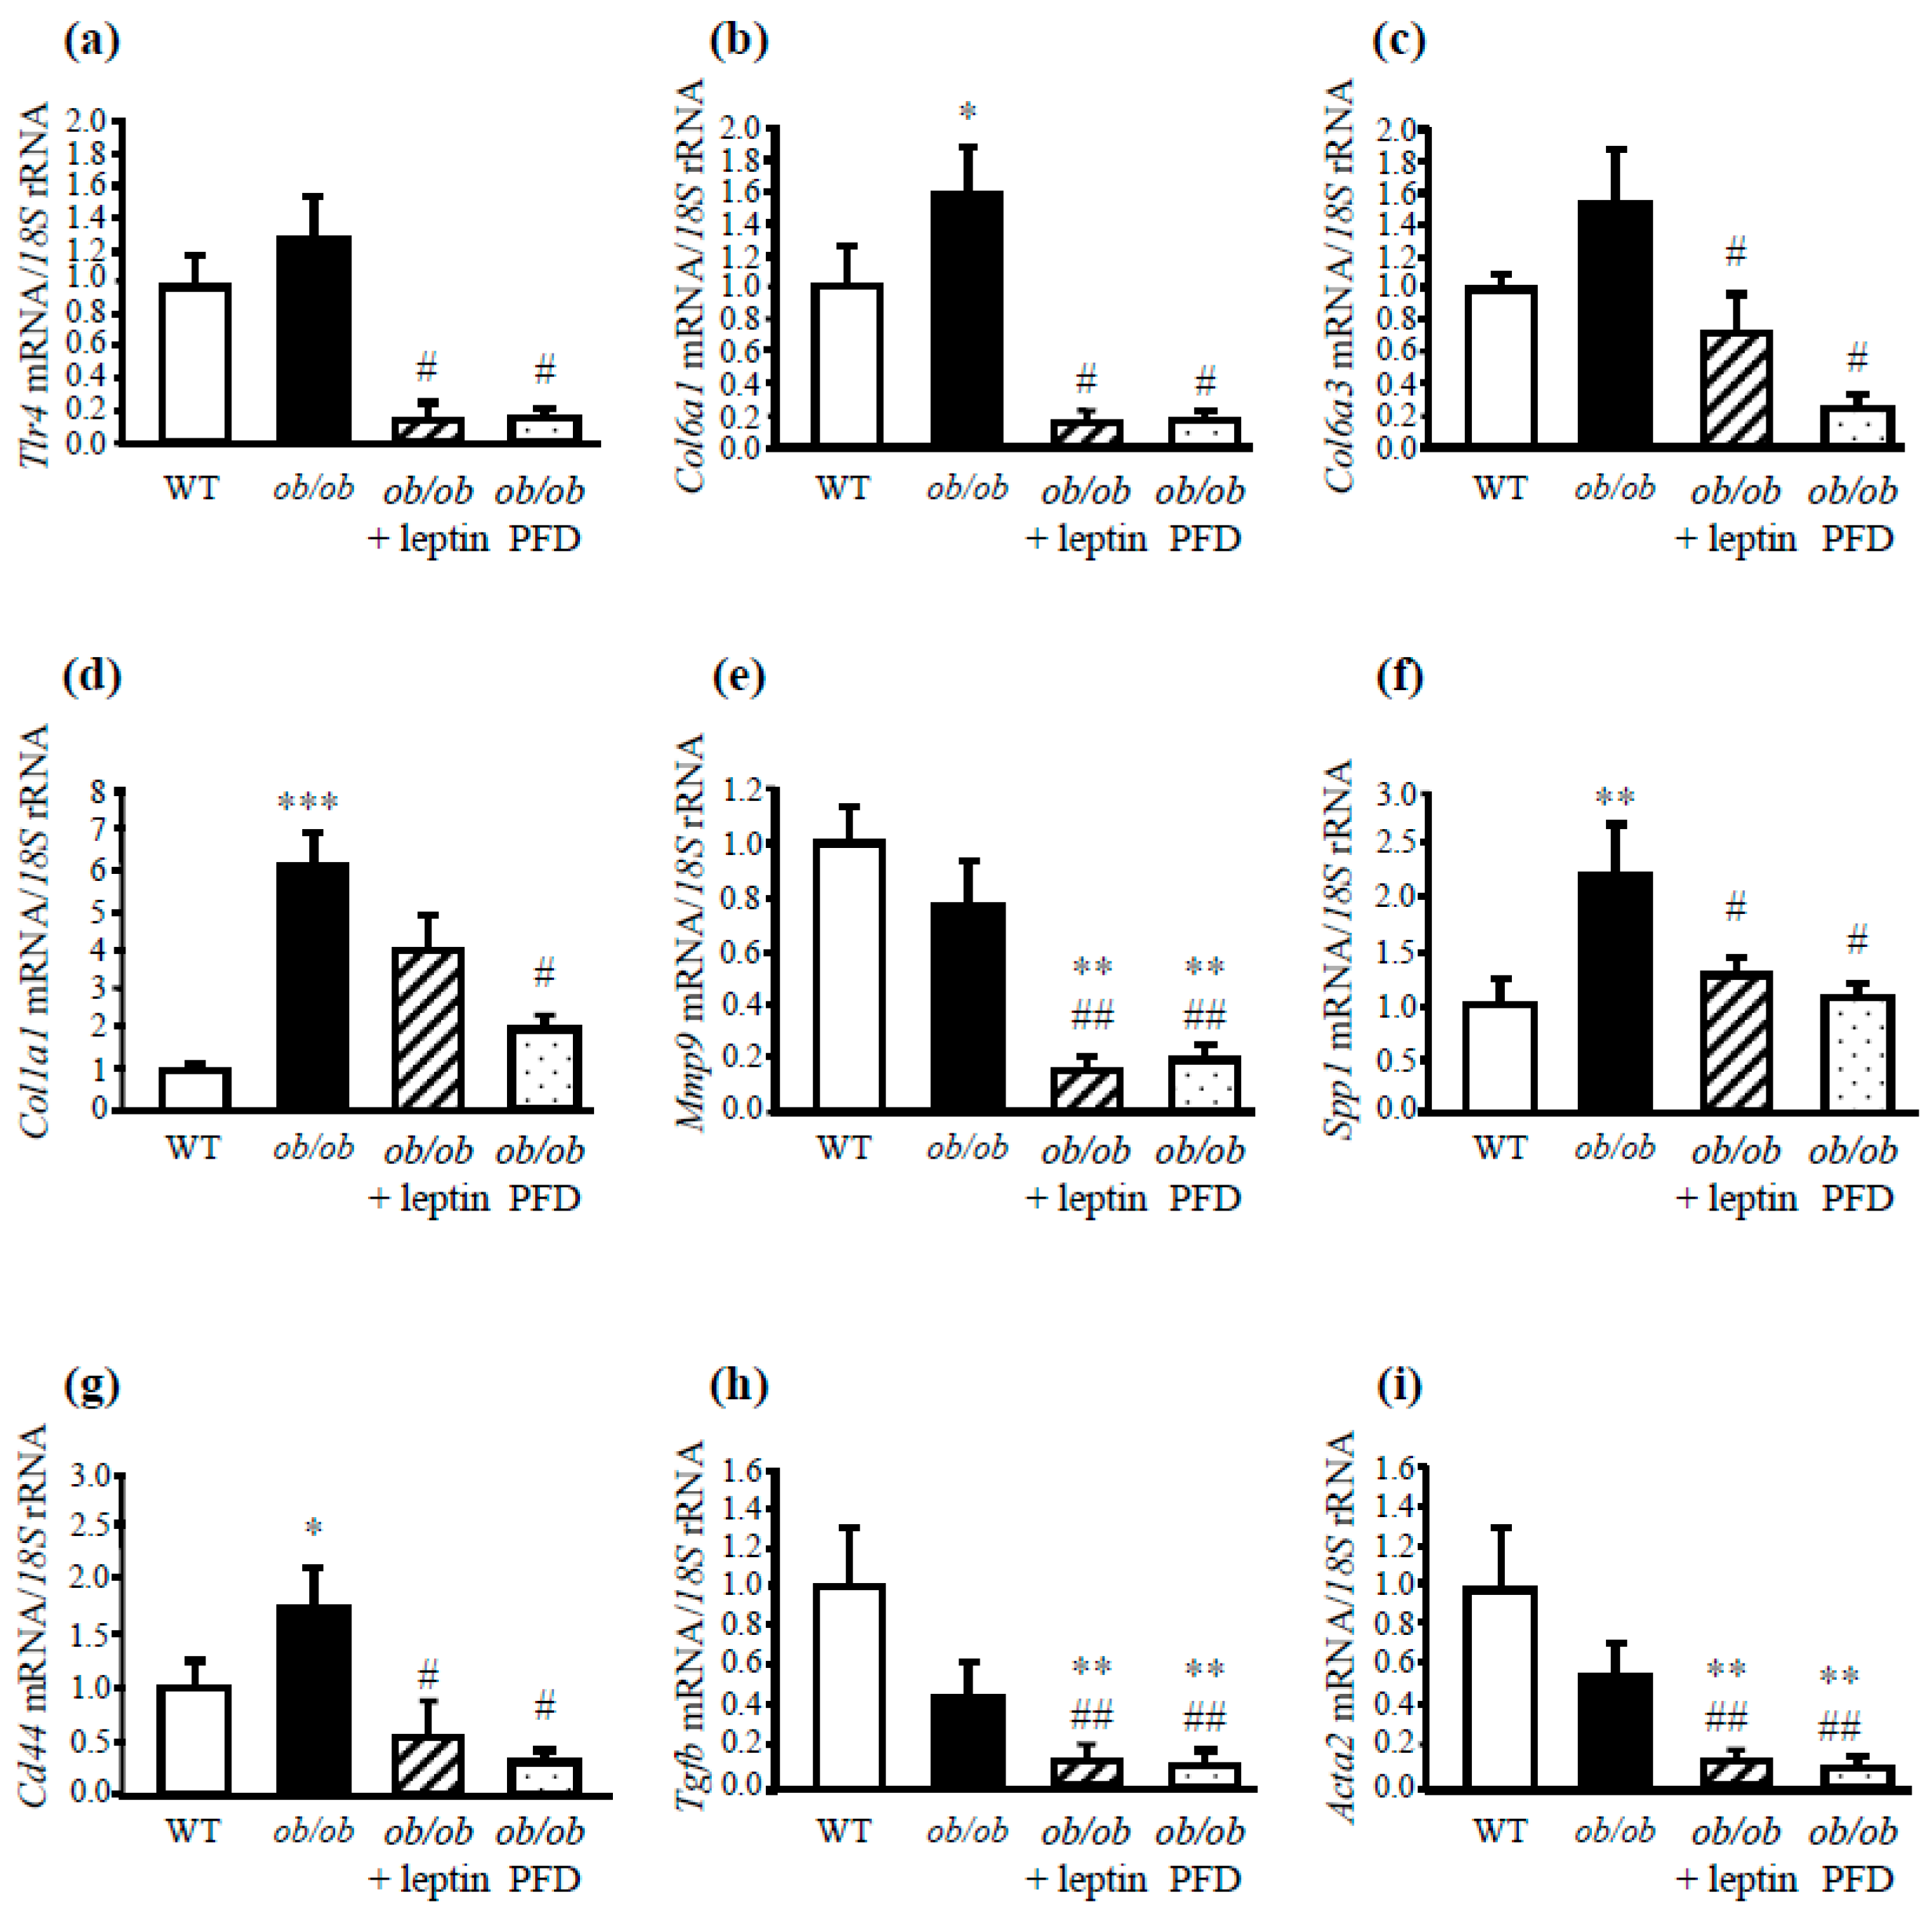
3.3. Leptin Administration Protects from Inflammation and Fibrosis in the Liver of ob/ob Mice

The anthropometric and metabolic characteristics of ob/ob mice after leptin replacement or pair-feeding are reported in Table S2. As expected, leptin administration ameliorated the obese and diabetic phenotype as well as improved lipid metabolism of ob/ob mice, corroborating previous findings of our group [22,31] and others [32,33]. Moreover, the increased liver weight observed in the absence of leptin was reversed (P < 0.001) by either caloric restriction or leptin replacement. The histological examination supported the results of the serum biochemical analysis: ob/ob liver sections exhibited macrovesicular steatosis that was completely reversed after leptin administration for 28 days, but not by caloric restriction (Figure 3a and Table S2).
The influence of leptin deficiency in liver fibrosis was next investigated. Analysis of Sirius Red-stained sections revealed that, in the control group of WT mice, staining was only observed in areas surrounding the blood vessels, whereas in ob/ob mice a slight intralobulillar liver fibrosis was observed. Liver fibrosis was less evident after leptin administration and caloric restriction (Figure 3a). Moreover, as shown in Figure 3b, ob/ob mice exhibited higher hepatic TG content, with the leptin administration and caloric restriction decreasing (P < 0.05) intrahepatic TG.
The inflammatory and fibrotic condition was also reversed in leptin-treated and pair-fed ob/ob mice, as evidenced by the decreased (P < 0.05) mRNA levels of factors related with the proinflammatory response, including Emr1, Itgax, Tnfa, Hifa, and Tnc (Figure 3c–g). Serum TNC levels were also normalized after leptin administration (Figure 3h). Moreover, it was also observed that leptin administration, as well as pair-feeding of ob/ob mice, prevented the increased mRNA expression of genes related to ECM remodeling such as Tlr4, Col6a1, Col6a3, Col1a1, Mmp9, and the marker of liver injury Cd44, the profibrogenic Tgfb, and the marker of activated of HSCs Acta2 (Figure 4a–h). These data support the idea that the obese state is strongly associated with the inflammatory response and the extracellular matrix remodeling.

3.4. Leptin Treatment Increases Inflammatory and Fibrotic Genes in AML12 Hepatocytes

The direct effect of leptin treatment on the expression of inflammatory and fibrogenic genes was demonstrated in vitro using the non-tumorigenic mouse hepatocyte AML12 cell line. Upon 24 h leptin stimulation at physiological concentrations (10 nmol/L), Hifa mRNA expression was significantly upregulated (P < 0.05), and the gene expression levels of Mmp9 and Tlr4, although differences were not statistically significant (P = 0.103 and P = 0.150, respectively) (Figure 5a–c). As expected, the expression of Emr1 was not detected in AML12 hepatic cells (data not shown). Remarkably, leptin administration in AML12 hepatocytes significantly increased (P < 0.01) the expression of one of the most potent profibrogenic cytokine Tgfb, producing also a tendency towards an increased α-SMA (Acta2) gene expression (P = 0.150) (Figure 5d,e). Furthermore, leptin treatment upregulated the transcription of the Tnc gene (P = 0.09) with a significantly increased (P < 0.05) release of TNC (Figure 5f,g).
In order to determine the contribution of iNOS in mediating leptin-induced inflammation in AML12 hepatocytes, the effect of the pharmacological inhibition of iNOS with L-NIL, a selective iNOS inhibitor, was analyzed. Pharmacological inhibition of iNOS blunted the leptin-induced increase in Tnc mRNA after leptin stimulation as well as TNC release to the control media (Figure 5h,i). These results directly demonstrate the contribution of iNOS in Tnc expression in hepatic cells.
The stimulation with TNC significantly increased the expression levels of genes Tlr4, Hif, Col6a1, and Col6a3 (P < 0.05) as well as Tnf (P = 0.08) in AML12 hepatic cells, without differences in Mmp9 gene expression levels (data not shown) (Figure 6a–e), corroborating that this alarmin can induce a potent fibrogenic response. Noteworthy, TNC stimulation significantly increased the expression of both Tgfb and Acta2 (P < 0.05) (Figure 6f,g).

4. Discussion

Adipose tissue is not only involved in energy storage but also functions as an endocrine organ secreting different bioactive adipokines [13,34]. The proinflammatory adipokine leptin regulates body weight and metabolism, exerting pleiotropic effects in many physiological systems including the liver, thereby linking obesity, insulin resistance, type 2 diabetes, and NAFLD [35,36,37]. Despite the wide range of reports regarding the participation of leptin in inflammation, its role in the pathogenesis of NAFLD remains unclear. However, increased serum leptin levels have been correlated with the amount of inflammation and fibrosis in liver diseases [38]. One of the key events in the promotion of liver diseases is the activation of HSCs [29]. Activated HSCs are the primary source of extracellular matrix components such as collagen or TNC, and accordingly fibrosis. Activated HSCs also express leptin, pointing to the implication of this factor during hepatic fibrogenesis and disease progression [11]. Moreover, our results also showed that leptin significantly and directly increased the proliferation of HSCs in a dose-dependent manner, confirming the ability of leptin to stimulate HSCs by the increased Acta2 mRNA levels, a marker of HSC activation [39], in AML12 hepatic cells. Moreover, upon 24 h leptin stimulation, AML12 hepatocytes increased the expression of Tgfb1, considered a key driver in the activation of HSCs [40]. These results suggest that leptin, produced by HSC, increases Tgfb1 expression, which, in turn, stimulates fibrogenesis in HSC in an intricate paracrine loop. Furthermore, the pro-inflammatory capacity of leptin promotes or sustains low-grade inflammation [41,42]. In this context, leptin administration increases both inflammation and fibrogenesis in AML12 hepatocytes. Leptin also stimulated the synthesis and release of TNC in the liver, which interacts with several ECM proteins and cell receptors, including TLR4. TLRs are not only important in the regulation of innate and adaptive immune responses, but they are also involved in inflammatory diseases of the cardiovascular system and liver [43]. The TNC/TLR4 signaling axis is fundamental for the induction of proinflammatory cytokines and the ECM remodeling, among other functions [44]. In this regard, our group has recently reported that TNC, through TLR4, is implicated in the etiopathology of obesity adipose tissue inflammation [22]. Several studies support that TNC is involved in liver fibrosis, in part due to its distribution in areas of lymphocytic infiltration, contributing to liver fibrogenesis through the enhancement of the inflammatory response, the promotion of HSC activation, and the enhancement of TGF-β expression [9]. In order to determine if TNC induces potent fibrotic and inflammatory responses not only in fibroblasts [45] but also in hepatocytes, AML12 cells were stimulated with this alarmin. The stimulation of murine AML12 hepatocytes with TNC increased the expression of Tlr4, Hif1a, Tnfa, and the fibrogenic genes Col6a1 and Col6a3, confirming the important role of TNC in both liver fibrogenesis by increasing the synthesis of collagen and in the hepatic inflammatory response.
Converging lines of evidence have demonstrated that leptin exerts a regulatory role in the connection between energy metabolism and the immune system, being a crucial adipokine responsible for the inflammatory state found in obesity [46]. Leptin-deficient ob/ob mice exhibited increased liver inflammatory and fibrotic response, as evidenced by the increased infiltration of liver macrophages, collagen production, and fibrotic matrix deposition. In this context, hypoxia is considered another key microenvironmental factor contributing to inflammation and fibrosis in liver diseases. Hif1a can be activated by different mediators in addition to hypoxia, including pro-inflammatory cytokines or oxidative stress, and regulates the activation of the profibrogenic factor TGF-β, promoting fibrogenesis. In line with these observations, our results showed that genes related to the regulation of hypoxic response (Hif1a), inflammation (Tnfa, Itgax, Cd68), and fibrogenesis (Col6a1, Col6a3, Col1a1) were highly upregulated in the liver of leptin-deficient mice. Furthermore, circulating levels as well as liver expression of TNC were also highly increased in ob/ob mice, contributing to inflammation, to the activation of matrix-producing cells, and to matrix deposition and remodeling associated to obesity. According to previous studies from our group, the obese and diabetic phenotype of ob/ob mice, as well as the elevated expression of hypoxic, proinflammatory, and profibrotic genes were restored after chronic leptin administration, and may contribute, together with the reduction in lipogenesis and the increase in fatty-acid oxidation, to an improvement of hepatic function. These data support that leptin administration in ob/ob mice reverses the conditions of inflammation, fibrogenesis, and extracellular matrix remodeling, normalizing the metabolic status and exerting anti-steatotic effects in the liver. Nonetheless, our data suggest that these phenomena are not exclusively produced by leptin, since similar results were obtained in the pair-fed group, suggesting that other factors might be involved in the beneficial effect observed in the inflammatory and fibrotic response independently of weight loss [31,47]. In this sense, increased oxidative stress and elevated systemic inflammation constitute a general phenomenon of the obese state, also observed in the context of leptin deficiency [23,48]. The increased levels of pro-inflammatory cytokines observed in ob/ob mice may interact with HSCs, inducing collagen gene deposition and hepatic fibrogenesis. Leptin potentiates fibrosis but does not constitute an essential factor for fibrogenesis in the liver.
Excessive fat accumulation in the liver augments ROS formation, inducing the expression of pro-inflammatory genes including TNF-α, IL-6, and cyclooxygenase-2. This, in turn, induces the expression of additional inflammatory mediators that interact with HSCs, increasing the profibrotic response [49]. Although under normal physiological conditions NO is generated constitutively and iNOS expression is absent, different disease conditions, including hepatic fibrosis, induce its expression, mainly in Kupffer cells and HSCs. The excessive NO generation triggers key processes involved in NAFLD progression, including mitochondrial biogenesis and function [50], Kupffer cell polarization [51], and HSC fibrogenesis [52], demonstrating an important role of iNOS in liver inflammation and fibrogenic response [53]. In line with this, iNOS deletion significantly reduced the activation of HSCs as confirmed by the reduced gene expression levels of both Tgfb and a-SMA (Acta2), suggesting that iNOS deficiency could regress the activation of HSC by interfering with the TGF-β pathway, protecting from liver fibrosis.
Given that many biological actions of leptin are mediated by NO [15,16,18,20,21,22], we aimed to evaluate if a functional relationship among them in liver inflammation and fibrosis in the context of obesity. For that purpose, we examined the effects of iNOS gene disruption in genetically ob/ob mice. We provide evidence, for the first time, that iNOS is involved in liver inflammation and fibrosis linked to leptin deficiency. Several evidences support the improved metabolic profile as well as liver inflammation and fibrosis in the DBKO mice. First of all, a causal relationship between excess fat accumulation, insulin resistance, and progression of hepatic fibrosis is well established [54]. The improved metabolic profile observed in DBKO mice, in line with previous work of our group [22], may constitute an important cornerstone of liver improvement: the decreased accumulation of lipids in hepatocytes together with the increased levels of adiponectin and the reduced liver inflammatory profile in DBKO mice is in accordance with the improved obese and diabetic phenotype of our DBKO model [22].
Moreover, we found that genes involved in inflammation, in the regulation of hypoxic response, and in the excessive collagen deposition are highly enriched in livers of ob/ob mice, whereas this upregulation was completely reverted by iNOS deletion, similar to previous results described in adipose tissue [22]. Of note, hypoxia induces and regulates iNOS expression, and NO produced by iNOS participates in the stability control of HIF-1α [55]. In line with these observations, iNOS deletion, via decreased transcription and stability of HIF-1α, might improve liver hypoxia in ob/ob mice.
Another important finding of the present study is that the upregulation of osteopontin (Spp1) and its receptor Cd44 observed in ob/ob mice was completely prevented by iNOS inhibition. The transmembrane protein CD44 has been recently described as a marker and key player of NASH development [30] and one of the main osteopontin (OPN) receptors [56]. OPN expression is upregulated by proinflammatory cytokines including TNF-α and TGF-β and, among other functions, plays a major role in the adipose tissue expansion and in the development of liver statosis [57,58,59]. It is reported that NO enhances the expression of OPN in the context of hepatic carcinoma associated with high levels of iNOS expression [60]. Our group has previously reported that the absence of OPN reversed HFD-induced fatty liver [57], suggesting that OPN and its corresponding receptor CD44 play a critical role in liver fibrosis, as both are decreased in the absence of the iNOS gene. iNOS deletion is also related with a profound downregulation of genes encoding collagen, a main structural component of ECM, including Col61a1, Col6a1, and Col613. Besides the regulatory function of NO on Mmp9 activation [61], the present study demonstrates that Mmp9 gene expression levels were also significantly reduced in the absence of iNOS.
It is necessary to emphasize that iNOS ablation significantly reduces circulating levels and liver expression of TNC and its potential role in the stimulation of proinflammatory cytokine expression. Moreover, iNOS inhibition also induced a downregulation of basal and leptin-induced Tnc transcript levels, suggesting that leptin induces TNC via the activation of the iNOS enzyme, with leptin-induced TNC upregulation preventing iNOS inhibition.
Collectively, the present study identified a novel relationship for iNOS and leptin in mediating liver fibrogenesis. iNOS deficiency improves liver inflammation as well as the expression of ECM remodeling-related genes in the context of leptin deficiency, attenuating the development of fibrosis. The weakening of the ECM due to ablation of the iNOS gene could be associated with improved insulin sensitivity, reduced inflammation, and metabolic benefits. Moreover, iNOS activation induced by leptin is needed and crucial for the synthesis and release of the profibrogenic and proinflammatory TNC, suggesting an important role of this alarmin in the development of hepatic inflammation and fibrosis (Figure 6h). Leptin, together with other important factors involved in increased oxidative stress and elevated systemic inflammation, may contribute to liver steatosis in ob/ob mice. Thus, the participation of other factors altered by obesity that impinge on both adipose tissue and liver like fibroblast growth factors (FGFs) should be considered [62]. Further research is needed to discern the specific role of leptin and iNOS in liver fibrogenesis.

Supplementary Materials

The following are available online at https://0-www-mdpi-com.brum.beds.ac.uk/2073-4425/10/3/184/s1, Figure S1: Gene expression levels of Cd68 in the liver. Leptin-deficient ob/ob mice exhibited a significantly increase in Cd68 mRNA levels compared to wild type mice, with iNOS disruption reducing Cd68 transcripts levels. Values are mean ± SEM (n = 5 per group). The gene expression in WT mice was assumed to be 1. Differences between groups were analyzed by two-way ANOVA. aP < 0.05 effect of the absence of the ob gene. bP < 0.05 effect of the absence of the iNOS gene.; Table S1: Sequences of the primers and TaqMan® probes; Table S2: Metabolic characteristics of 12-week-old experimental animals.

Author Contributions

S.B., A.R. and G.F. designed the study, collected and analyzed data, wrote the first draft of the manuscript, contributed to discussion, and reviewed the manuscript. J.G.-A., V.C., A.R., B.R. and X.U. collected and analyzed data, contributed to discussion, and reviewed the manuscript. S.B. is guarantor for the contents of the article, had full access to all the data in the study and take responsibility for the integrity of the data and the accuracy of the data analysis.

Funding

This work was supported by the Instituto de Salud Carlos III and fondos FEDER (PI16/00221, PI16/01217, PI17/02183 and PI17/02188) and by the Department of Health of Gobierno de Navarra (61/2014). CIBER de Fisiopatología de la Obesidad y Nutrición (CIBEROBN) is an initiative of the Instituto de Salud Carlos III, Spain.

Conflicts of Interest

The authors declare that they have no conflict of interest.

References

  1. Blond, E.; Disse, E.; Cuerq, C.; Drai, J.; Valette, P.J.; Laville, M.; Thivolet, C.; Simon, C.; Caussy, C. EASL-EASD-EASO clinical practice guidelines for the management of non-alcoholic fatty liver disease in severely obese people: Do they lead to over-referral? Diabetologia 2017, 60, 1218–1222. [Google Scholar] [CrossRef] [PubMed]
  2. Chalasani, N.; Younossi, Z.; Lavine, J.E.; Charlton, M.; Cusi, K.; Rinella, M.; Harrison, S.A.; Brunt, E.M.; Sanyal, A.J. The diagnosis and management of nonalcoholic fatty liver disease: Practice guidance from the American Association for the Study of Liver Diseases. Hepatology 2018, 67, 328–357. [Google Scholar] [CrossRef] [PubMed]
  3. Buzzetti, E.; Pinzani, M.; Tsochatzis, E.A. The multiple-hit pathogenesis of non-alcoholic fatty liver disease (NAFLD). Metabolism 2016, 65, 1038–1048. [Google Scholar] [CrossRef] [PubMed]
  4. Samuel, V.T.; Liu, Z.X.; Qu, X.; Elder, B.D.; Bilz, S.; Befroy, D.; Romanelli, A.J.; Shulman, G.I. Mechanism of hepatic insulin resistance in non-alcoholic fatty liver disease. J. Biol. Chem. 2004, 279, 32345–32353. [Google Scholar] [CrossRef] [PubMed]
  5. Browning, J.D.; Horton, J.D. Molecular mediators of hepatic steatosis and liver injury. J. Clin. Investig. 2004, 114, 147–152. [Google Scholar] [CrossRef] [PubMed]
  6. Day, C.P.; James, O.F. Steatohepatitis: A tale of two “hits”? Gastroenterology 1998, 114, 842–845. [Google Scholar] [CrossRef]
  7. Rolo, A.P.; Teodoro, J.S.; Palmeira, C.M. Role of oxidative stress in the pathogenesis of nonalcoholic steatohepatitis. Free Radic. Biol. Med. 2012, 52, 59–69. [Google Scholar] [CrossRef] [PubMed]
  8. Midwood, K.S.; Hussenet, T.; Langlois, B.; Orend, G. Advances in tenascin-C biology. Cell Mol. Life Sci. 2011, 68, 3175–3199. [Google Scholar] [CrossRef] [PubMed]
  9. El-Karef, A.; Yoshida, T.; Gabazza, E.C.; Nishioka, T.; Inada, H.; Sakakura, T.; Imanaka-Yoshida, K. Deficiency of tenascin-C attenuates liver fibrosis in immune-mediated chronic hepatitis in mice. J. Pathol. 2007, 211, 86–94. [Google Scholar] [CrossRef] [PubMed]
  10. Van Eyken, P.; Sciot, R.; Desmet, V.J. Expression of the novel extracellular matrix component tenascin in normal and diseased human liver. An immunohistochemical study. J. Hepatol. 1990, 11, 43–52. [Google Scholar] [CrossRef]
  11. Marra, F. Leptin and liver fibrosis: A matter of fat. Gastroenterology 2002, 122, 1529–1532. [Google Scholar] [CrossRef] [PubMed]
  12. Bertolani, C.; Marra, F. Role of adipocytokines in hepatic fibrosis. Curr. Pharm. Des. 2010, 16, 1929–1940. [Google Scholar] [CrossRef] [PubMed]
  13. Rodríguez, A.; Ezquerro, S.; Méndez-Gimenez, L.; Becerril, S.; Frühbeck, G. Revisiting the adipocyte: A model for integration of cytokine signaling in the regulation of energy metabolism. Am. J. Physiol. Endocrinol. Metab. 2015, 309, E691–E714. [Google Scholar] [CrossRef] [PubMed]
  14. Gómez-Ambrosi, J.; Salvador, J.; Paramo, J.A.; Orbe, J.; de Irala, J.; Díez-Caballero, A.; Gil, M.J.; Cienfuegos, J.A.; Frübeck, G. Involvement of leptin in the association between percentage of body fat and cardiovascular risk factors. Clin. Biochem. 2002, 35, 315–320. [Google Scholar] [CrossRef]
  15. Frühbeck, G. Pivotal role of nitric oxide in the control of blood pressure after leptin administration. Diabetes 1999, 48, 903–908. [Google Scholar] [CrossRef] [PubMed]
  16. Frühbeck, G.; Gómez-Ambrosi, J. Modulation of the leptin-induced white adipose tissue lipolysis by nitric oxide. Cell Signal. 2001, 13, 827–833. [Google Scholar] [CrossRef]
  17. Rodríguez, A.; Fortuño, A.; Gómez-Ambrosi, J.; Zalba, G.; Díez, J.; Frühbeck, G. The inhibitory effect of leptin on angiotensin II-induced vasoconstriction in vascular smooth muscle cells is mediated via a nitric oxide-dependent mechanism. Endocrinology 2007, 148, 324–331. [Google Scholar]
  18. Becerril, S.; Rodríguez, A.; Catalán, V.; Sáinz, N.; Ramírez, B.; Collantes, M.; Peñuelas, I.; Gómez-Ambrosi, J.; Frübeck, G. Deletion of inducible nitric-oxide synthase in leptin-deficient mice improves brown adipose tissue function. PLoS ONE 2010, 5, e10962. [Google Scholar] [CrossRef] [PubMed]
  19. Frühbeck, G.; Gómez-Ambrosi, J.; Salvador, J. Leptin-induced lipolysis opposes the tonic inhibition of endogenous adenosine in white adipocytes. FASEB J. 2001, 15, 333–340. [Google Scholar] [CrossRef] [PubMed]
  20. Shiuchi, T.; Nakagami, H.; Iwai, M.; Takeda, Y.; Cui, T.; Chen, R.; Minokoshi, Y.; Horiuchi, M. Involvement of bradykinin and nitric oxide in leptin-mediated glucose uptake in skeletal muscle. Endocrinology 2001, 142, 608–612. [Google Scholar] [CrossRef] [PubMed]
  21. Dixit, V.D.; Mielenz, M.; Taub, D.D.; Parvizi, N. Leptin induces growth hormone secretion from peripheral blood mononuclear cells via a protein kinase C- and nitric oxide-dependent mechanism. Endocrinology 2003, 144, 5595–5603. [Google Scholar] [CrossRef] [PubMed]
  22. Becerril, S.; Rodríguez, A.; Catalán, V.; Méndez-Gimenez, L.; Ramírez, B.; Sainz, N.; Llorente, M.; Unamuno, X.; Gómez-Ambrosi, J.; Frübeck, G. Targeted disruption of the iNOS gene improves adipose tissue inflammation and fibrosis in leptin-deficient ob/ob mice: Role of tenascin C. Int. J. Obes. (Lond.) 2018, 42, 1458–1470. [Google Scholar] [CrossRef] [PubMed]
  23. Sainz, N.; Rodríguez, A.; Catalán, V.; Becerril, S.; Ramírez, B.; Gómez-Ambrosi, J.; Frübeck, G. Leptin administration downregulates the increased expression levels of genes related to oxidative stress and inflammation in the skeletal muscle of ob/ob mice. Mediat. Inflamm. 2010, 2010, 784343. [Google Scholar] [CrossRef] [PubMed]
  24. Frühbeck, G.; Alonso, R.; Marzo, F.; Santidrián, S. A modified method for the indirect quantitative analysis of phytate in foodstuffs. Anal. Biochem. 1995, 225, 206–212. [Google Scholar]
  25. Rodríguez, A.; Catalán, V.; Gómez-Ambrosi, J.; García-Navarro, S.; Rotellar, F.; Valentí, V.; Silva, C.; Gil, M.J.; Salvador, J.; Burrell, M.A.; et al. Insulin- and leptin-mediated control of aquaglyceroporins in human adipocytes and hepatocytes is mediated via the PI3K/Akt/mTOR signaling cascade. J. Clin. Endocrinol. Metab. 2011, 96, E586–E597. [Google Scholar] [CrossRef] [PubMed]
  26. Catalán, V.; Gómez-Ambrosi, J.; Rodríguez, A.; Silva, C.; Rotellar, F.; Gil, M.J.; Cienfuegos, J.A.; Salvador, J.; Frühbeck, G. Expression of caveolin-1 in human adipose tissue is upregulated in obesity and obesity-associated type 2 diabetes mellitus and related to inflammation. Clin. Endocrinol. (Oxf.) 2008, 68, 213–219. [Google Scholar] [CrossRef] [PubMed]
  27. Catalán, V.; Gómez-Ambrosi, J.; Rotellar, F.; Silva, C.; Rodríguez, A.; Salvador, J.; Gil, M.J.; Cienfuegos, J.A.; Frühbeck, G. Validation of endogenous control genes in human adipose tissue: Relevance to obesity and obesity-associated type 2 diabetes mellitus. Horm. Metab. Res. 2007, 39, 495–500. [Google Scholar] [CrossRef] [PubMed]
  28. Halberg, N.; Khan, T.; Trujillo, M.E.; Wernstedt-Asterholm, I.; Attie, A.D.; Sherwani, S.; Wang, Z.V.; . Landskroner-Eiger, S.; Dineen, S.; Magalang, U.J.; et al. Hypoxia-inducible factor 1a induces fibrosis and insulin resistance in white adipose tissue. Mol. Cell Biol. 2009, 29, 4467–4483. [Google Scholar] [CrossRef] [PubMed]
  29. Koyama, Y.; Brenner, D.A. Liver inflammation and fibrosis. J. Clin. Investig. 2017, 127, 55–64. [Google Scholar] [CrossRef] [PubMed]
  30. Patouraux, S.; Rousseau, D.; Bonnafous, S.; Lebeaupin, C.; Luci, C.; Canivet, C.M.; Schenck, A.S.; Bertola, A.; Saint-Paul, M.C.; Iannelli, A.; Gugenheim, J.; et al. CD44 is a key player in non-alcoholic steatohepatitis. J. Hepatol. 2017, 67, 328–338. [Google Scholar] [CrossRef] [PubMed]
  31. Sáinz, N.; Rodríguez, A.; Catalán, V.; Becerril, S.; Ramírez, B.; Gómez-Ambrosi, J.; Frühbeck, G. Leptin administration favors muscle mass accretion by decreasing FoxO3a and increasing PGC-1a in ob/ob mice. PLoS ONE 2009, 4, e6808. [Google Scholar] [CrossRef] [PubMed]
  32. Halaas, J.L.; Gajiwala, K.S.; Maffei, M.; Cohen, S.L.; Chait, B.T.; Rabinowitz, D.; Lallone, R.L.; Burley, S.K.; Friedman, J.M. Weight-reducing effects of the plasma protein encoded by the obese gene. Science 1995, 269, 543–546. [Google Scholar] [CrossRef] [PubMed]
  33. Pelleymounter, M.A.; Cullen, M.J.; Baker, M.B.; Hecht, R.; Winters, D.; Boone, T.; Collins, F. Effects of the obese gene product on body weight regulation in ob/ob mice. Science 1995, 269, 540–543. [Google Scholar] [CrossRef] [PubMed]
  34. Frühbeck, G.; Gómez-Ambrosi, J. Control of body weight: A physiologic and transgenic perspective. Diabetologia 2003, 46, 143–172. [Google Scholar] [CrossRef] [PubMed]
  35. Petersen, K.F.; Oral, E.A.; Dufour, S.; Befroy, D.; Ariyan, C.; Yu, C.; Cline, G.W.; DePaoli, A.M.; Taylor, S.I.; Gorden, P.; et al. Leptin reverses insulin resistance and hepatic steatosis in patients with severe lipodystrophy. J. Clin. Investig. 2002, 109, 1345–1350. [Google Scholar] [CrossRef] [PubMed]
  36. Polyzos, S.A.; Aronis, K.N.; Kountouras, J.; Raptis, D.D.; Vasiloglou, M.F.; Mantzoros, C.S. Circulating leptin in non-alcoholic fatty liver disease: A systematic review and meta-analysis. Diabetologia 2016, 59, 30–43. [Google Scholar] [CrossRef] [PubMed]
  37. Muruzábal, F.J.; Frühbeck, G.; Gómez-Ambrosi, J.; Archanco, M.; Burrell, M.A. Immunocytochemical detection of leptin in non-mammalian vertebrate stomach. Gen. Comp. Endocrinol. 2002, 128, 149–152. [Google Scholar] [CrossRef]
  38. Polyzos, S.A.; Kountouras, J.; Zavos, C.; Deretzi, G. The potential adverse role of leptin resistance in nonalcoholic fatty liver disease: A hypothesis based on critical review of the literature. J. Clin. Gastroenterol. 2011, 45, 50–54. [Google Scholar] [CrossRef] [PubMed]
  39. Perugorria, M.J.; Wilson, C.L.; Zeybel, M.; Walsh, M.; Amin, S.; Robinson, S.; White, S.A.; Burt, A.D.; Oakley, F.; Tsukamoto, H.; et al. Histone methyltransferase ASH1 orchestrates fibrogenic gene transcription during myofibroblast transdifferentiation. Hepatology 2012, 56, 1129–1139. [Google Scholar] [CrossRef] [PubMed]
  40. Tang, L.Y.; Heller, M.; Meng, Z.; Yu, L.R.; Tang, Y.; Zhou, M.; Zhang, Y.E. Transforming Growth Factor-β (TGF-β) Directly Activates the JAK1-STAT3 Axis to Induce Hepatic Fibrosis in Coordination with the SMAD Pathway. J. Biol. Chem. 2017, 292, 4302–4312. [Google Scholar] [CrossRef] [PubMed]
  41. Shen, J.; Sakaida, I.; Uchida, K.; Terai, S.; Okita, K. Leptin enhances TNF-a production via p38 and JNK MAPK in LPS-stimulated Kupffer cells. Life Sci. 2005, 77, 1502–1515. [Google Scholar] [CrossRef] [PubMed]
  42. Faggioni, R.; Jones-Carson, J.; Reed, D.A.; Dinarello, C.A.; Feingold, K.R.; Grunfeld, C.; Fantuzzi, G. Leptin-deficient (ob/ob) mice are protected from T cell-mediated hepatotoxicity: Role of tumor necrosis factor a and IL-18. Proc. Natl. Acad. Sci. USA 2000, 97, 2367–2372. [Google Scholar] [CrossRef] [PubMed]
  43. Schwabe, R.F.; Seki, E.; Brenner, D.A. Toll-like receptor signaling in the liver. Gastroenterology 2006, 130, 1886–1900. [Google Scholar] [CrossRef] [PubMed]
  44. Midwood, K.; Sacre, S.; Piccinini, A.M.; Inglis, J.; Trebaul, A.; Chan, E.; Sofat, N.; Kashiwagi, M.; Orend, G. Tenascin-C is an endogenous activator of Toll-like receptor 4 that is essential for maintaining inflammation in arthritic joint disease. Nat. Med. 2009, 15, 774–780. [Google Scholar] [CrossRef] [PubMed]
  45. Bhattacharyya, S.; Wang, W.; Morales-Nebreda, L.; Feng, G.; Wu, M.; Zhou, X.; Lafyatis, R.; Lee, J.; Hinchcliff, M.; Feghali-Bostwick, C.; et al. Tenascin-C drives persistence of organ fibrosis. Nat. Commun. 2016, 7, 11703. [Google Scholar] [CrossRef] [PubMed]
  46. Pérez-Pérez, A.; Vilarino-García, T.; Fernández-Riejos, P.; Martín-González, J.; Segura-Egea, J.J.; Sánchez-Margalet, V. Role of leptin as a link between metabolism and the immune system. Cytokine Growth Factor Rev. 2017, 35, 71–84. [Google Scholar] [CrossRef] [PubMed]
  47. Cousin, B.; Bascands-Viguerie, N.; Kassis, N.; Nibbelink, M.; Ambid, L.; Casteilla, L.; Pénicaud, L. Cellular changes during cold acclimatation in adipose tissues. J. Cell Physiol. 1996, 167, 285–289. [Google Scholar] [CrossRef]
  48. Bankoglu, E.E.; Seyfried, F.; Rotzinger, L.; Nordbeck, A.; Corteville, C.; Jurowich, C.; Germer, C.T.; Otto, C.; Stopper, H.; et al. Impact of weight loss induced by gastric bypass or caloric restriction on oxidative stress and genomic damage in obese Zucker rats. Free Radic. Biol. Med. 2016, 94, 208–217. [Google Scholar] [CrossRef] [PubMed]
  49. Saxena, N.K.; Anania, F.A. Adipocytokines and hepatic fibrosis. Trends Endocrinol. Metab. 2015, 26, 153–161. [Google Scholar] [CrossRef] [PubMed]
  50. Nisoli, E.; Clementi, E.; Paolucci, C.; Cozzi, V.; Tonello, C.; Sciorati, C.; Bracale, R.; Valerio, A.; Francolini, M.; Moncada, S.; et al. Mitochondrial biogenesis in mammals: The role of endogenous nitric oxide. Science 2003, 299, 896–899. [Google Scholar] [CrossRef] [PubMed]
  51. Tateya, S.; Rizzo, N.O.; Handa, P.; Cheng, A.M.; Morgan-Stevenson, V.; Daum, G.; Clowes, A.W.; Morton, G.J.; Schwartz, M.W.; Kim, F. Endothelial NO/cGMP/VASP signaling attenuates Kupffer cell activation and hepatic insulin resistance induced by high-fat feeding. Diabetes 2011, 60, 2792–2801. [Google Scholar] [CrossRef] [PubMed]
  52. Xie, G.; Wang, X.; Wang, L.; Atkinson, R.D.; Kanel, G.C.; Gaarde, W.A.; Deleve, L.D. Role of differentiation of liver sinusoidal endothelial cells in progression and regression of hepatic fibrosis in rats. Gastroenterology 2012, 142, 918.e6–927.e6. [Google Scholar] [CrossRef] [PubMed]
  53. Anavi, S.; Eisenberg-Bord, M.; Hahn-Obercyger, M.; Genin, O.; Pines, M.; Tirosh, O. The role of iNOS in cholesterol-induced liver fibrosis. Lab. Investig. 2015, 95, 914–924. [Google Scholar] [CrossRef] [PubMed]
  54. Hui, J.M.; Hodge, A.; Farrell, G.C.; Kench, J.G.; Kriketos, A.; George, J. Beyond insulin resistance in NASH: TNF-alpha or adiponectin? Hepatology 2004, 40, 46–54. [Google Scholar] [CrossRef] [PubMed]
  55. Brune, B.; Zhou, J. Hypoxia-inducible factor-1a under the control of nitric oxide. Methods Enzymol. 2007, 435, 463–478. [Google Scholar] [PubMed]
  56. Scatena, M.; Liaw, L.; Giachelli, C.M. Osteopontin: A multifunctional molecule regulating chronic inflammation and vascular disease. Arterioscler. Thromb. Vasc. Biol. 2007, 27, 2302–2309. [Google Scholar] [CrossRef] [PubMed]
  57. Lancha, A.; Rodríguez, A.; Catalán, V.; Becerril, S.; Sainz, N.; Ramírez, B.; Burrell, M.A.; Salvador, J.; Frühbeck, G.; Gómez-Ambrosi, J. Osteopontin deletion prevents the development of obesity and hepatic steatosis via impaired adipose tissue matrix remodeling and reduced inflammation and fibrosis in adipose tissue and liver in mice. PLoS ONE 2014, 9, e98398. [Google Scholar] [CrossRef] [PubMed]
  58. Wen, Y.; Jeong, S.; Xia, Q.; Kong, X. Role of Osteopontin in Liver Diseases. Int. J. Biol. Sci. 2016, 12, 1121–1128. [Google Scholar] [CrossRef] [PubMed]
  59. Nagoshi, S. Osteopontin: Versatile modulator of liver diseases. Hepatol. Res. Off. J. Jpn. Soc. Hepatol. 2014, 44, 22–30. [Google Scholar] [CrossRef] [PubMed]
  60. Guo, H.; Marroquin, C.E.; Wai, P.Y.; Kuo, P.C. Nitric oxide-dependent osteopontin expression induces metastatic behavior in HepG2 cells. Dig. Dis. Sci. 2005, 50, 1288–1298. [Google Scholar] [CrossRef] [PubMed]
  61. Hamada, T.; Duarte, S.; Tsuchihashi, S.; Busuttil, R.W.; Coito, A.J. Inducible nitric oxide synthase deficiency impairs matrix metalloproteinase-9 activity and disrupts leukocyte migration in hepatic ischemia/reperfusion injury. Am. J. Pathol. 2009, 174, 2265–2277. [Google Scholar] [CrossRef] [PubMed]
  62. Gallego-Escuredo, J.M.; Gómez-Ambrosi, J.; Catalán, V.; Domingo, P.; Giralt, M.; Frühbeck, G.; Villarroya, F. Opposite alterations in FGF21 and FGF19 levels and disturbed expression of the receptor machinery for endocrine FGFs in obese patients. Int. J. Obes. (Lond.) 2015, 39, 121–129. [Google Scholar] [CrossRef] [PubMed]
Figure 1. Hepatic expression of genes involved in inflammation and fibrosis. Gene expression levels of proinflammatory markers Emr1 (a), CD11c (Itgax) (b), Tnf (c), Hif1a (d), and tenascin C (Tnc) (e) in the liver (n = 5–6). The gene expression in wild type (WT) mice was assumed to be 1. Serum TNC levels (f) of the different experimental groups (n = 5 per group). Differences between groups were analyzed by two-way ANOVA or one-way ANOVA followed by Tukey’s post hoc test when an interaction between factors was detected. aP < 0.05 effect of the absence of the ob gene. bP < 0.05 effect of the absence of the iNOS gene. *P < 0.05, **P < 0.01 vs WT mice; #P < 0.05, ##P < 0.01 vs ob/ob mice. iNOS: Inducible nitric oxide synthase; DBKO: double knockout.
Genes 10 00184 g001
Figure 2. Effect of the absence of the iNOS gene in liver fibrosis in the context of leptin deficiency. Gene expression levels of Tlr4 (a), Col6a1 (b), Col6a3 (c), Col1a1 (d), Mmp9 (e), Spp1 (f), and Cd44 (g) in the liver. Gene expression levels of liver Tgfb (h) and α-SMA (Acta2) (i) (n = 5) were also analyzed. The gene expression in WT mice was assumed to be 1. Differences between groups were analyzed by two-way ANOVA or one-way ANOVA followed by Tukey’s post hoc test when an interaction between factors was detected. aP < 0.05 effect of the absence of the ob gene. bP < 0.05 effect of the absence of the iNOS gene. *P < 0.05, **P < 0.01, ***P < 0.001 vs WT mice; ##P < 0.01 vs ob/ob mice.
Genes 10 00184 g002
Figure 3. Effect of in vivo leptin administration on the liver phenotype and expression of genes involved in hepatic inflammation in ob/ob mice. Representative Sirius Red staining (magnification 200×, scale bar = 50 µm, n = 3/per group) (a) and intrahepatic TG content (n = 4–5 per group) (b). Gene expression levels of Emr1 (c), CD11c (Itgax) (d), Tnfa (e), Hif1a (f), and Tnc (g) in the liver (n = 5–6) in wild-type (WT), ob/ob, leptin-treated, and pair-fed ob/ob mice (n = 5–6 per group). Gene expression levels in WT mice in liver were assumed to be 1. Serum TNC levels (h) of the different experimental groups (n = 5 per group). Comparisons between ob/ob groups and controls were analyzed by one-way ANOVA followed by Tukey’s post hoc tests. *P < 0.05, **P < 0.01, ***P < 0.001 vs WT mice; #P < 0.05, ##P < 0.01 vs ob/ob mice. PFD: Pair-fed group.
Genes 10 00184 g003
Figure 4. Effect of leptin replacement on the expression of genes involved in liver fibrosis in ob/ob mice. Gene expression levels of Tlr4 (a), Col6a1 (b), Col6a3 (c), Col1a1 (d), Mmp9 (e), Spp1 (f), and Cd44 (g) in the liver of WT, ob/ob, leptin-treated, and pair-fed ob/ob mice (n = 5–6 per group). Gene expression levels of Tgfb (h) and α-SMA (Acta2) (i) were also evaluated. Gene expression levels in WT mice were assumed to be 1. Comparisons between ob/ob groups and controls were analyzed by one-way ANOVA followed by Tukey’s post hoc tests. *P < 0.05, **P < 0.01, ***P < 0.001 vs WT mice; #P < 0.05, ##P < 0.01 vs ob/ob mice.
Genes 10 00184 g004
Figure 5. Effect of leptin stimulation for 24 h on the expression of markers of inflammation and fibrosis in AML12 hepatocytes. Effect of leptin stimulation (10 nmol L−1) for 24 h on gene expression levels of Hif1a (a), Tlr4 (b), Mmp9 (c), α-SMA (Acta2) (d), Tgfb (e), and Tnc (f) as well as TNC release to the culture media (g) in AML12 liver cells (n = 6 per group). Tnc transcript levels (h) and TNC release (i) to the culture media in AML12 adipocytes stimulated with leptin (10 nmol/L) in the absence or presence of the iNOS inhibitor l-NIL (10 mmol/L) for 24 h. Gene expression levels in the unstimulated cells were assumed to be 1. Values are the mean ± SEM (n = 5 per group). Differences between groups were analyzed by unpaired two-tailed Student’s t-tests. *P < 0.05; **P < 0.01 vs unstimulated cells.
Genes 10 00184 g005
Figure 6. Effect of tenascin C (TNC) stimulation for 24 h on the expression of markers of inflammation and fibrosis in AML12 hepatocytes. Effect of TNC stimulation (10 nmol/L) for 24 h on gene expression levels of Tnfa (a), Hif1a (b), Tlr4 (c), Col6a1 (d), Col6a3 (e), as well as Tgfb (f) and a-SMA (Acta2) (g) in AML12 hepatocytes (n = 5 per group). Differences between groups were analyzed by unpaired two-tailed Student’s t-tests. *P < 0.05 vs unstimulated cells. Summary graph for the regulation of liver fibrosis induced by leptin through iNOS activation (h).
Genes 10 00184 g006
Table 1. Anthropometric and metabolic characteristics of 12-week-old experimental animals.
Wild TypeiNOS-/-ob/obDBKO
Body weight (g)24.0 ± 0.423.1 ± 0.444.9 ± 1.543.1 ± 0.8
Liver weight (g)1.04 ± 0.021.00 ± 0.033.15 ± 0.122.97 ± 0.11
FFA (mmol/L)0.74 ± 0.080.58 ± 0.031.07 ± 0.06***0.85 ± 0.06
TG (mg/dL)66.3 ± 4.477.1 ± 3.997.3 ±5.3**90.4 ± 0.1
Glycerol (mg/dL)0.025 ± 0.0010.022 ± 0.0030.036 ±.0.001***0.030 ± 0.003***, ††
Intrahepatic TG (mg/g)19.0 ± 2.216.8 ± 1.528.5 ± 3.024.5 ± 2.6
Glucose (mg/dL)83 ± 577± 2410 ±42***96 ± 5***, ††
Insulin (ng/mL)0.42 ± 0.040.32 ± 0.049.66 ± 0.61***8.89 ± 1.17***,†††
HOMA1.6 ± 0.21.1 ± 0.2172.3.0 ± 21.5***34.5 ± 5.2***, ††
Adiponectin (μg/mL)22.6 ± 4.125.6 ± 3.116.6 ± 0.9***20.1 ± 5.0**,††
BW: body weight; DBKO: double knockout mice simultaneously lacking ob and iNOS genes; FFA: free fatty acids; HOMA: homeostasis model assessment; iNOS: Inducible nitric oxide synthase. TG: triacylglycerols. Data are mean ± SEM (n = 4–5 per group). Differences between groups were analyzed by two-way ANOVA or one-way ANOVA followed by Tukey’s post hoc test when an interaction between factors was detected. *P < 0.05, **P < 0.01, ***P < 0.001 vs wild type mice; P < 0.05, ††P < 0.01 vs ob/ob mice.

