ACTN3 R577X Genotype and Exercise Phenotypes in Recreational Marathon Runners

 ,
,  ,
,  , ,
, ,  ,
, 
Abstract
:1. Introduction
2. Materials and Methods
2.1. Subjects
2.2. Experimental Design
2.3. Experimental Protocol
2.4. Genetic Testing
2.5. Statistical analysis
3. Results
4. Discussion
5. Conclusions
Author Contributions
Funding
Acknowledgments
Conflicts of Interest
References
- Del Coso, J.; Hiam, D.; Houweling, P.J.; Pérez, L.M.; Eynon, N.; Lucía, A. More than a “speed gene”: ACTN3 R577X genotype, trainability, muscle damage, and the risk for injuries. Eur. J. Appl. Physiol. 2019, 119, 49–60. [Google Scholar] [CrossRef]
- Houweling, P.J.; Papadimitriou, I.D.; Seto, J.T.; Pérez, L.M.; Del Coso, J.; North, K.N.; Lucia, A.; Eynon, N. Is evolutionary loss our gain? The role of ACTN3 p.Arg577Ter (R577X) genotype in athletic performance, ageing, and disease. Hum. Mutat. 2018, 39, 1774–1787. [Google Scholar] [CrossRef]
- North, K.N.; Yang, N.; Wattanasirichaigoon, D.; Mills, M.; Easteal, S.; Beggs, A.H. A common nonsense mutation results in α-actinin-3 deficiency in the general population. Nat. Genet. 1999, 21, 353–354. [Google Scholar] [CrossRef]
- Seto, J.T.; Lek, M.; Quinlan, K.G.R.; Houweling, P.J.; Zheng, X.F.; Garton, F.; MacArthur, D.G.; Raftery, J.M.; Garvey, S.M.; Hauser, M.A.; et al. Deficiency of α-actinin-3 is associated with increased susceptibility to contraction-induced damage and skeletal muscle remodeling. Hum. Mol. Genet. 2011, 20, 2914–2927. [Google Scholar] [CrossRef]
- Pickering, C.; Kiely, J. ACTN3, morbidity, and healthy aging. Front. Genet. 2018, 9, 15. [Google Scholar] [CrossRef]
- MacArthur, D.G.; Seto, J.T.; Raftery, J.M.; Quinlan, K.G.; Huttley, G.A.; Hook, J.W.; Lemckert, F.A.; Kee, A.J.; Edwards, M.R.; Berman, Y.; et al. Loss of ACTN3 gene function alters mouse muscle metabolism and shows evidence of positive selection in humans. Nat. Genet. 2007, 39, 1261–1265. [Google Scholar] [CrossRef]
- amazon.com Test de ADN 24Genetics. Available online: https://www.amazon.es/Test-24Genetics-Todo-Nutrigenética-Farmacogenética/dp/B071ZVNWXL/ref=sr_1_fkmr1_1?ie=UTF8&qid=1552053631&sr=8-1-fkmr1&keywords=24+genetics+deporte (accessed on 8 March 2019).
- Walsh, S.; Liu, D.; Metter, E.J.; Ferrucci, L.; Roth, S.M. ACTN3 genotype is associated with muscle phenotypes in women across the adult age span. J. Appl. Physiol. 2008, 105, 1486–1491. [Google Scholar] [CrossRef]
- Clarkson, P.M.; Devaney, J.M.; Gordish-Dressman, H.; Thompson, P.D.; Hubal, M.J.; Urso, M.; Price, T.B.; Angelopoulos, T.J.; Gordon, P.M.; Moyna, N.M.; et al. ACTN3 genotype is associated with increases in muscle strength in response to resistance training in women. J. Appl. Physiol. 2005, 99, 154–163. [Google Scholar] [CrossRef]
- Broos, S.; Van Leemputte, M.; Deldicque, L.; Thomis, M.A. History-dependent force, angular velocity and muscular endurance in ACTN3 genotypes. Eur. J. Appl. Physiol. 2015, 115, 1637–1643. [Google Scholar] [CrossRef]
- Norman, B.; Esbjörnsson, M.; Rundqvist, H.; Osterlund, T.; von Walden, F.; Tesch, P.A. Strength, power, fiber types, and mRNA expression in trained men and women with different ACTN3 R577X genotypes. J. Appl. Physiol. 2009, 106, 959–965. [Google Scholar] [CrossRef]
- Hanson, E.D.; Ludlow, A.T.; Sheaff, A.K.; Park, J.; Roth, S.M. ACTN3 genotype does not influence muscle power. Int. J. Sports Med. 2010, 31, 834–838. [Google Scholar] [CrossRef]
- Kikuchi, N.; Nakazato, K.; Min, S.; Ueda, D.; Igawa, S. The ACTN3 R577X polymorphism is associated with muscle power in male Japanese athletes. J. Strength Cond. Res. 2014, 28, 1783–1789. [Google Scholar] [CrossRef]
- Norman, B.; Esbjörnsson, M.; Rundqvist, H.; Österlund, T.; Glenmark, B.; Jansson, E. ACTN3 genotype and modulation of skeletal muscle response to exercise in human subjects. J. Appl. Physiol. 2014, 116, 1197–1203. [Google Scholar] [CrossRef] [PubMed]
- Broos, S.; Malisoux, L.; Theisen, D.; van Thienen, R.; Ramaekers, M.; Jamart, C.; Deldicque, L.; Thomis, M.A.; Francaux, M. Evidence for ACTN3 as a speed gene in isolated human muscle fibers. PLoS ONE 2016, 11, e0150594. [Google Scholar] [CrossRef]
- Delmonico, M.J.; Kostek, M.C.; Doldo, N.A.; Hand, B.D.; Walsh, S.; Conway, J.M.; Carignan, C.R.; Roth, S.M.; Hurley, B.F. α-actinin-3 (ACTN3) R577X polymorphism influences knee extensor peak power response to strength training in older men and women. J. Gerontol. A. Biol. Sci. Med. Sci. 2007, 62, 206–212. [Google Scholar] [CrossRef]
- Del Coso, J.; Valero, M.; Salinero, J.J.; Lara, B.; Díaz, G.; Gallo-Salazar, C.; Ruiz-Vicente, D.; Areces, F.; Puente, C.; Carril, J.C.; et al. ACTN3 genotype influences exercise-induced muscle damage during a marathon competition. Eur. J. Appl. Physiol. 2017, 117, 409–416. [Google Scholar] [CrossRef]
- Del Coso, J.; Salinero, J.J.; Lara, B.; Gallo-Salazar, C.; Areces, F.; Puente, C.; Herrero, D. ACTN3 X-allele carriers had greater levels of muscle damage during a half-ironman. Eur. J. Appl. Physiol. 2017, 117, 151–158. [Google Scholar] [CrossRef]
- Del Coso, J.; Valero, M.; Salinero, J.J.; Lara, B.; Gallo-Salazar, C.; Areces, F. Optimum polygenic profile to resist exertional rhabdomyolysis during a marathon. PLoS ONE 2017, 12, e0172965. [Google Scholar] [CrossRef]
- Zempo, H.; Fuku, N.; Murakami, H.; Miyachi, M. The relationship between α-Actinin-3 gene R577X polymorphism and muscle flexibility. Juntendo Med. J. 2016, 62, 118. [Google Scholar] [CrossRef]
- Kikuchi, N.; Zempo, H.; Fuku, N.; Murakami, H.; Sakamaki-Sunaga, M.; Okamoto, T.; Nakazato, K.; Miyachi, M. Association between ACTN3 R577X polymorphism and trunk flexibility in 2 different cohorts. Int. J. Sports Med. 2017, 38, 402–406. [Google Scholar] [CrossRef]
- Kikuchi, N.; Tsuchiya, Y.; Nakazato, K.; Ishii, N.; Ochi, E. Effects of the ACTN3 R577X genotype on the muscular strength and range of motion before and after eccentric contractions of the elbow flexors. Int. J. Sports Med. 2018, 39, 148–153. [Google Scholar] [CrossRef]
- Kim, J.H.; Jung, E.S.; Kim, C.-H.; Youn, H.; Kim, H.R. Genetic associations of body composition, flexibility and injury risk with ACE, ACTN3 and COL5A1 polymorphisms in Korean ballerinas. J. Exerc. Nutr. Biochem. 2014, 18, 205–214. [Google Scholar] [CrossRef]
- Chen, C.-H.; Nosaka, K.; Chen, H.-L.; Lin, M.-J.; Tseng, K.-W.; Chen, T.C. Effects of flexibility training on eccentric exercise-induced muscle damage. Med. Sci. Sport. Exerc. 2011, 43, 491–500. [Google Scholar] [CrossRef]
- Houweling, P.J.; Berman, Y.D.; Turner, N.; Quinlan, K.G.R.; Seto, J.T.; Yang, N.; Lek, M.; Macarthur, D.G.; Cooney, G.; North, K.N. Exploring the relationship between α-actinin-3 deficiency and obesity in mice and humans. Int. J. Obes. 2017, 41, 1154–1157. [Google Scholar] [CrossRef]
- Moran, C.N.; Yang, N.; Bailey, M.E.S.; Tsiokanos, A.; Jamurtas, A.; MacArthur, D.G.; North, K.; Pitsiladis, Y.P.; Wilson, R.H. Association analysis of the ACTN3 R577X polymorphism and complex quantitative body composition and performance phenotypes in adolescent Greeks. Eur. J. Hum. Genet. 2007, 15, 88–93. [Google Scholar] [CrossRef]
- Riedl, I.; Osler, M.E.; Benziane, B.; Chibalin, A.V.; Zierath, J.R. Association of the ACTN3 R577X polymorphism with glucose tolerance and gene expression of sarcomeric proteins in human skeletal muscle. Physiol. Rep. 2015, 3, e12314. [Google Scholar] [CrossRef]
- Amorim, C.E.G.; Acuña-Alonzo, V.; Salzano, F.M.; Bortolini, M.C.; Hünemeier, T. Differing evolutionary histories of the ACTN3*R577X polymorphism among the major human geographic groups. PLoS ONE 2015, 10, e0115449. [Google Scholar] [CrossRef]
- MacArthur, D.G.; Seto, J.T.; Chan, S.; Quinlan, K.G.R.; Raftery, J.M.; Turner, N.; Nicholson, M.D.; Kee, A.J.; Hardeman, E.C.; Gunning, P.W.; et al. An Actn3 knockout mouse provides mechanistic insights into the association between α-actinin-3 deficiency and human athletic performance. Hum. Mol. Genet. 2008, 17, 1076–1086. [Google Scholar] [CrossRef]
- Deschamps, C.L.; Hittel, D.S. ACTN3: A thrifty gene for speed? Endocr. Pract. 2016, 22, 897–898. [Google Scholar] [CrossRef]
- Pasqua, L.A.; Bueno, S.; Matsuda, M.; Marquezini, M.V.; Lima-Silva, A.E.; Saldiva, P.H.N.; Bertuzzi, R. The genetics of human running: ACTN3 polymorphism as an evolutionary tool improving the energy economy during locomotion. Ann. Hum. Biol. 2016, 43, 255–260. [Google Scholar] [CrossRef]
- Papadimitriou, I.D.; Lockey, S.J.; Voisin, S.; Herbert, A.J.; Garton, F.; Houweling, P.J.; Cieszczyk, P.; Maciejewska-Skrendo, A.; Sawczuk, M.; Massidda, M.; et al. No association between ACTN3 R577X and ACE I/D polymorphisms and endurance running times in 698 Caucasian athletes. BMC Genom. 2018, 19, 13. [Google Scholar] [CrossRef]
- Guilherme, J.P.L.F.; Bertuzzi, R.; Lima-Silva, A.E.; Pereira, A.d.C.; Lancha Junior, A.H. Analysis of sports-relevant polymorphisms in a large Brazilian cohort of top-level athletes. Ann. Hum. Genet. 2018, 82, 254–264. [Google Scholar] [CrossRef]
- Stewart, A.; Marfell-Jones, M. International Society for Advancement of Kinanthropometry. In International Standards for Anthropometric Assessment; International Society for the Advancement of Kinanthropometry: Lower Hutt, New Zealand, 2011; ISBN 0620362073. [Google Scholar]
- Durnin, J.V.; Womersley, J. Body fat assessed from total body density and its estimation from skinfold thickness: Measurements on 481 men and women aged from 16 to 72 years. Br. J. Nutr. 1974, 32, 77–97. [Google Scholar] [CrossRef]
- Jones, P.R.; Pearson, J. Anthropometric determination of leg fat and muscle plus bone volumes in young male and female adults. J. Physiol. 1969, 204, 63P–66P. [Google Scholar]
- Brouwer, E. On simple formulae for calculating the heat expenditure and the quantities of carbohydrate and fat oxidized in metabolism of men and animals, from gaseous exchange (Oxygen intake and carbonic acid output) and urine-N. Acta Physiol. Pharmacol. Neerl. 1957, 6, 795–802. [Google Scholar]
- Tam, E.; Rossi, H.; Moia, C.; Berardelli, C.; Rosa, G.; Capelli, C.; Ferretti, G. Energetics of running in top-level marathon runners from Kenya. Eur. J. Appl. Physiol. 2012, 112, 3797–3806. [Google Scholar] [CrossRef] [Green Version]
- Salinero, J.J.; Soriano, M.L.; Lara, B.; Gallo-Salazar, C.; Areces, F.; Ruiz-Vicente, D.; Abián-Vicén, J.; González-Millán, C.; Del Coso, J. Predicting race time in male amateur marathon runners. J. Sports Med. Phys. Fitness 2017, 57, 1169–1177. [Google Scholar]
- Calatayud, J.; Martin, F.; Gargallo, P.; García-Redondo, J.; Colado, J.C.; Marín, P.J. The validity and reliability of a new instrumented device for measuring ankle dorsiflexion range of motion. Int. J. Sports Phys. Ther. 2015, 10, 197–202. [Google Scholar]
- Bennell, K.; Talbot, R.; Wajswelner, H.; Techovanich, W.; Kelly, D.; Hall, A. Intra-rater and inter-rater reliability of a weight-bearing lunge measure of ankle dorsiflexion. Aust. J. Physiother. 1998, 44, 175–180. [Google Scholar] [CrossRef] [Green Version]
- Driller, M.W.; Overmayer, R.G. The effects of tissue flossing on ankle range of motion and jump performance. Phys. Ther. Sport 2017, 25, 20–24. [Google Scholar] [CrossRef]
- Sambrook, J.; Fritsch, E.; Maniatis, T. Molecular Cloning: A Laboratory Manual, 2nd ed.; Cold Spring Harbor Laboratory Press: Cold Spring Harbor, NY, USA, 1989. [Google Scholar]
- Consorcio Candela Análisis de la Diversidad y Evolución de Latinoamérica. Available online: https://www.ucl.ac.uk/candela/spanish/inicio (accessed on 10 April 2019).
- Cohen, J. Statistical Power Analysis for the Behavioral Sciences, 2nd ed.; L. Erlbaum Associates: Hillsdale, NJ, USA, 1988; ISBN 9780805802832. [Google Scholar]
- Hopkins, W.G.; Marshall, S.; Batterham, A.; Hanin, J. Progressive statistics for studies in sports medicine and exercise science. Med. Sci. Sport. Exerc. 2009, 41, 3–13. [Google Scholar] [CrossRef]
- Eynon, N.; Ruiz, J.R.; Femia, P.; Pushkarev, V.P.; Cieszczyk, P.; Maciejewska-Karlowska, A.; Sawczuk, M.; Dyatlov, D.A.; Lekontsev, E.V.; Kulikov, L.M.; et al. The ACTN3 R577X polymorphism across three groups of elite male European athletes. PLoS ONE 2012, 7, e43132. [Google Scholar] [CrossRef]
- Seto, J.T.; Chan, S.; Turner, N.; MacArthur, D.G.; Raftery, J.M.; Berman, Y.D.; Quinlan, K.G.R.; Cooney, G.J.; Head, S.; Yang, N.; et al. The effect of α-actinin-3 deficiency on muscle aging. Exp. Gerontol. 2011, 46, 292–302. [Google Scholar] [CrossRef]
- Erskine, R.M.; Williams, A.G.; Jones, D.A.; Stewart, C.E.; Degens, H. The individual and combined influence of ACE and ACTN3 genotypes on muscle phenotypes before and after strength training. Scand. J. Med. Sci. Sports 2014, 24, 642–648. [Google Scholar] [CrossRef]
- Lee, F.X.Z.; Houweling, P.J.; North, K.N.; Quinlan, K.G.R. How does α-actinin-3 deficiency alter muscle function? Mechanistic insights into ACTN3, the ‘gene for speed.’ Biochim. Biophys. Acta—Mol. Cell Res. 2016, 1863, 686–693. [Google Scholar] [CrossRef]
- Quinlan, K.G.R.; Seto, J.T.; Turner, N.; Vandebrouck, A.; Floetenmeyer, M.; Macarthur, D.G.; Raftery, J.M.; Lek, M.; Yang, N.; Parton, R.G.; et al. α-actinin-3 deficiency results in reduced glycogen phosphorylase activity and altered calcium handling in skeletal muscle. Hum. Mol. Genet. 2010, 19, 1335–1346. [Google Scholar] [CrossRef]
- Seto, J.T.; Quinlan, K.G.R.; Lek, M.; Zheng, X.F.; Garton, F.; MacArthur, D.G.; Hogarth, M.W.; Houweling, P.J.; Gregorevic, P.; Turner, N.; et al. ACTN3 genotype influences muscle performance through the regulation of calcineurin signaling. J. Clin. Investig. 2013, 123, 4255–4263. [Google Scholar] [CrossRef]
- Garton, F.C.; Seto, J.T.; Quinlan, K.G.R.; Yang, N.; Houweling, P.J.; North, K.N. α-Actinin-3 deficiency alters muscle adaptation in response to denervation and immobilization. Hum. Mol. Genet. 2014, 23, 1879–1893. [Google Scholar] [CrossRef]
- Friedlander, S.M.; Herrmann, A.L.; Lowry, D.P.; Mepham, E.R.; Lek, M.; North, K.N.; Organ, C.L. ACTN3 allele frequency in humans covaries with global latitudinal gradient. PLoS ONE 2013, 8, e52282. [Google Scholar] [CrossRef]
- Silva, M.S.M.; Bolani, W.; Alves, C.R.; Biagi, D.G.; Lemos, J.R.; da Silva, J.L.; de Oliveira, P.A.; Alves, G.B.; de Oliveira, E.M.; Negrão, C.E.; et al. Elimination of influences of the ACTN3 R577X variant on oxygen uptake by endurance training in healthy individuals. Int. J. Sports Physiol. Perform. 2015, 10, 636–641. [Google Scholar] [CrossRef] [PubMed]
- Pasqua, L.A.; Bueno, S.; Artioli, G.G.; Lancha, A.H.; Matsuda, M.; Marquezini, M.V.; Lima-Silva, A.E.; Saldiva, P.H.N.; Bertuzzi, R. Influence of ACTN3 R577X polymorphism on ventilatory thresholds related to endurance performance. J. Sports Sci. 2016, 34, 163–170. [Google Scholar] [CrossRef] [PubMed]
- Jones, A.M. Running economy is negatively related to sit-and-reach test performance in international-standard distance runners. Int. J. Sports Med. 2002, 23, 40–43. [Google Scholar] [CrossRef]
- Craib, M.W.; Mitchell, V.A.; Fields, K.B.; Cooper, T.R.; Hopewell, R.; Morgan, D.W. The association between flexibility and running economy in sub-elite male distance runners. Med. Sci. Sports Exerc. 1996, 28, 737–743. [Google Scholar] [CrossRef] [PubMed]
- Schrödter, E.; Brüggemann, G.-P.; Willwacher, S. Is soleus muscle-tendon-unit behavior related to ground-force application during the sprint start? Int. J. Sports Physiol. Perform. 2017, 12, 448–454. [Google Scholar] [CrossRef]
- Goodwin, J.S.; Blackburn, J.T.; Schwartz, T.A.; Williams, D.S.B. Clinical predictors of dynamic lower extremity stiffness during running. J. Orthop. Sport. Phys. Ther. 2019, 49, 98–104. [Google Scholar] [CrossRef]
- Hogarth, M.W.; Garton, F.C.; Houweling, P.J.; Tukiainen, T.; Lek, M.; Macarthur, D.G.; Seto, J.T.; Quinlan, K.G.R.; Yang, N.; Head, S.I.; et al. Analysis of the ACTN3 heterozygous genotype suggests that α-actinin-3 controls sarcomeric composition and muscle function in a dose-dependent fashion. Hum. Mol. Genet. 2016, 25, 866–877. [Google Scholar] [CrossRef] [PubMed]
- Santos-Concejero, J.; Oliván, J.; Maté-Muñoz, J.L.; Muniesa, C.; Montil, M.; Tucker, R.; Lucia, A. Gait-cycle characteristics and running economy in elite Eritrean and European runners. Int. J. Sports Physiol. Perform. 2015, 10, 381–387. [Google Scholar] [CrossRef] [PubMed]
- Kreutzer, A.; Martinez, C.A.; Kreutzer, M.; Stone, J.D.; Mitchell, J.B.; Oliver, J.M. Effect of ACTN3 polymorphism on self-reported running times. J. Strength Cond. Res. 2019, 33, 80–88. [Google Scholar] [CrossRef] [PubMed]
- Webborn, N.; Williams, A.; McNamee, M.; Bouchard, C.; Pitsiladis, Y.; Ahmetov, I.; Ashley, E.; Byrne, N.; Camporesi, S.; Collins, M.; et al. Direct-to-consumer genetic testing for predicting sports performance and talent identification: Consensus statement. Br. J. Sports Med. 2015, 49, 1486–1491. [Google Scholar] [CrossRef]


| Variable (Units) | RR | RX | XX | p | η2 |
|---|---|---|---|---|---|
| n (frequency) | 37 (27.2%) | 67 (49.3%) | 32 (23.5%) | - | - |
| Men/women (frequency) | 31/6 (83.8/16.2%) | 58/9 (86.6/13.4%) | 27/5 (84.4/15.6%) | 0.922 | - |
| Age (years) | 41.2 ± 10.2 | 40.3 ± 8.8 | 40.7 ± 9.8 | 0.880 | <0.01 |
| Body mass (kg) | 70.9 ± 7.1 | 71.6 ± 10.8 | 72.8 ± 10.5 | 0.731 | <0.01 |
| Body height (m) | 1.73 ± 0.06 | 1.73 ± 0.08 | 1.72 ± 0.10 | 0.723 | <0.01 |
| Body mass index (kg/m2) | 23.7 ± 1.7 | 23.8 ± 1.2 | 24.5 ± 1.5 | 0.26.9 | 0.03 |
| Running experience (years) | 9.0 ± 7.5 | 8.1 ± 7.8 | 8.3 ± 6.0 | 0.880 | <0.01 |
| Best race time in the marathon (min) | 218 ± 27 | 223 ± 38 | 219 ± 39 | 0.881 | <0.01 |
| Completed marathons (number) | 5 ± 4 | 5 ± 3 | 5 ± 3 | 0.776 | <0.01 |
| Average training distance /week (km) | 50.7 ± 14.6 | 52.5 ± 17.0 | 51.7 ± 16.9 | 0.889 | <0.01 |
| Training sessions /week (number) | 4 ± 1 | 4 ± 1 | 4 ± 1 | 0.794 | <0.01 |
| Variable (Units) | RR | RX | XX | ES ± 95% CIRR vs. RX | ES ± 95% CIRR vs. XX | ES ± 95% CIRX vs. XX | p | η2 |
|---|---|---|---|---|---|---|---|---|
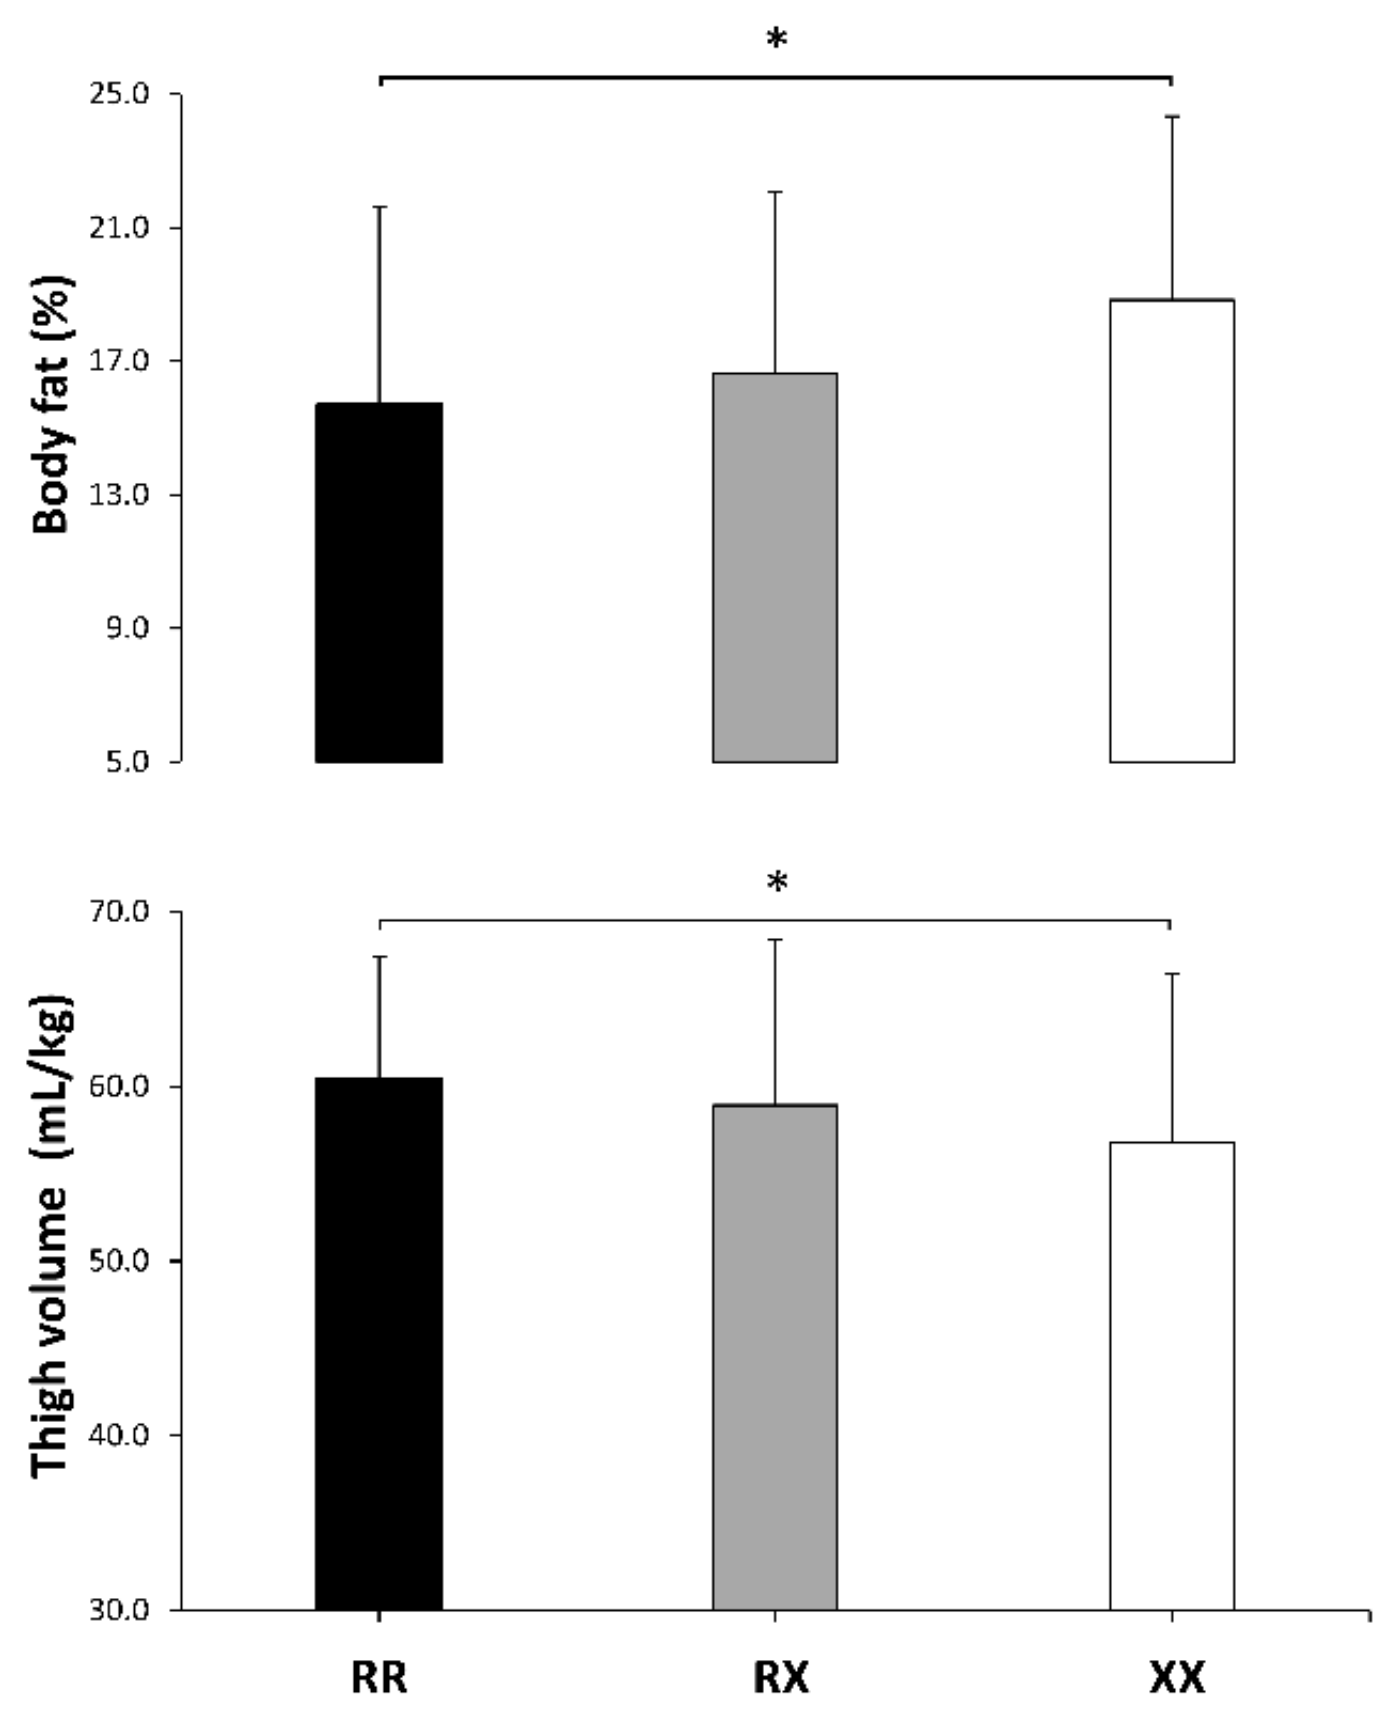
| Body fat (%) | 15.7 ± 5.8 | 16.2 ± 6.1 | 18.8 ± 5.5 | 0.1 ± 0.3 | 0.5 ± 0.4 | 0.4 ± 0.3 | 0.024 | 0.06 |
| Thigh volume (mL/kg) | 60.5 ± 6.9 | 58.9 ± 9.5 | 56.8 ± 9.6 | −0.2 ± 0.3 | −0.4 ± 0.3 | −0.2 ± 0.3 | 0.043 | 0.05 |
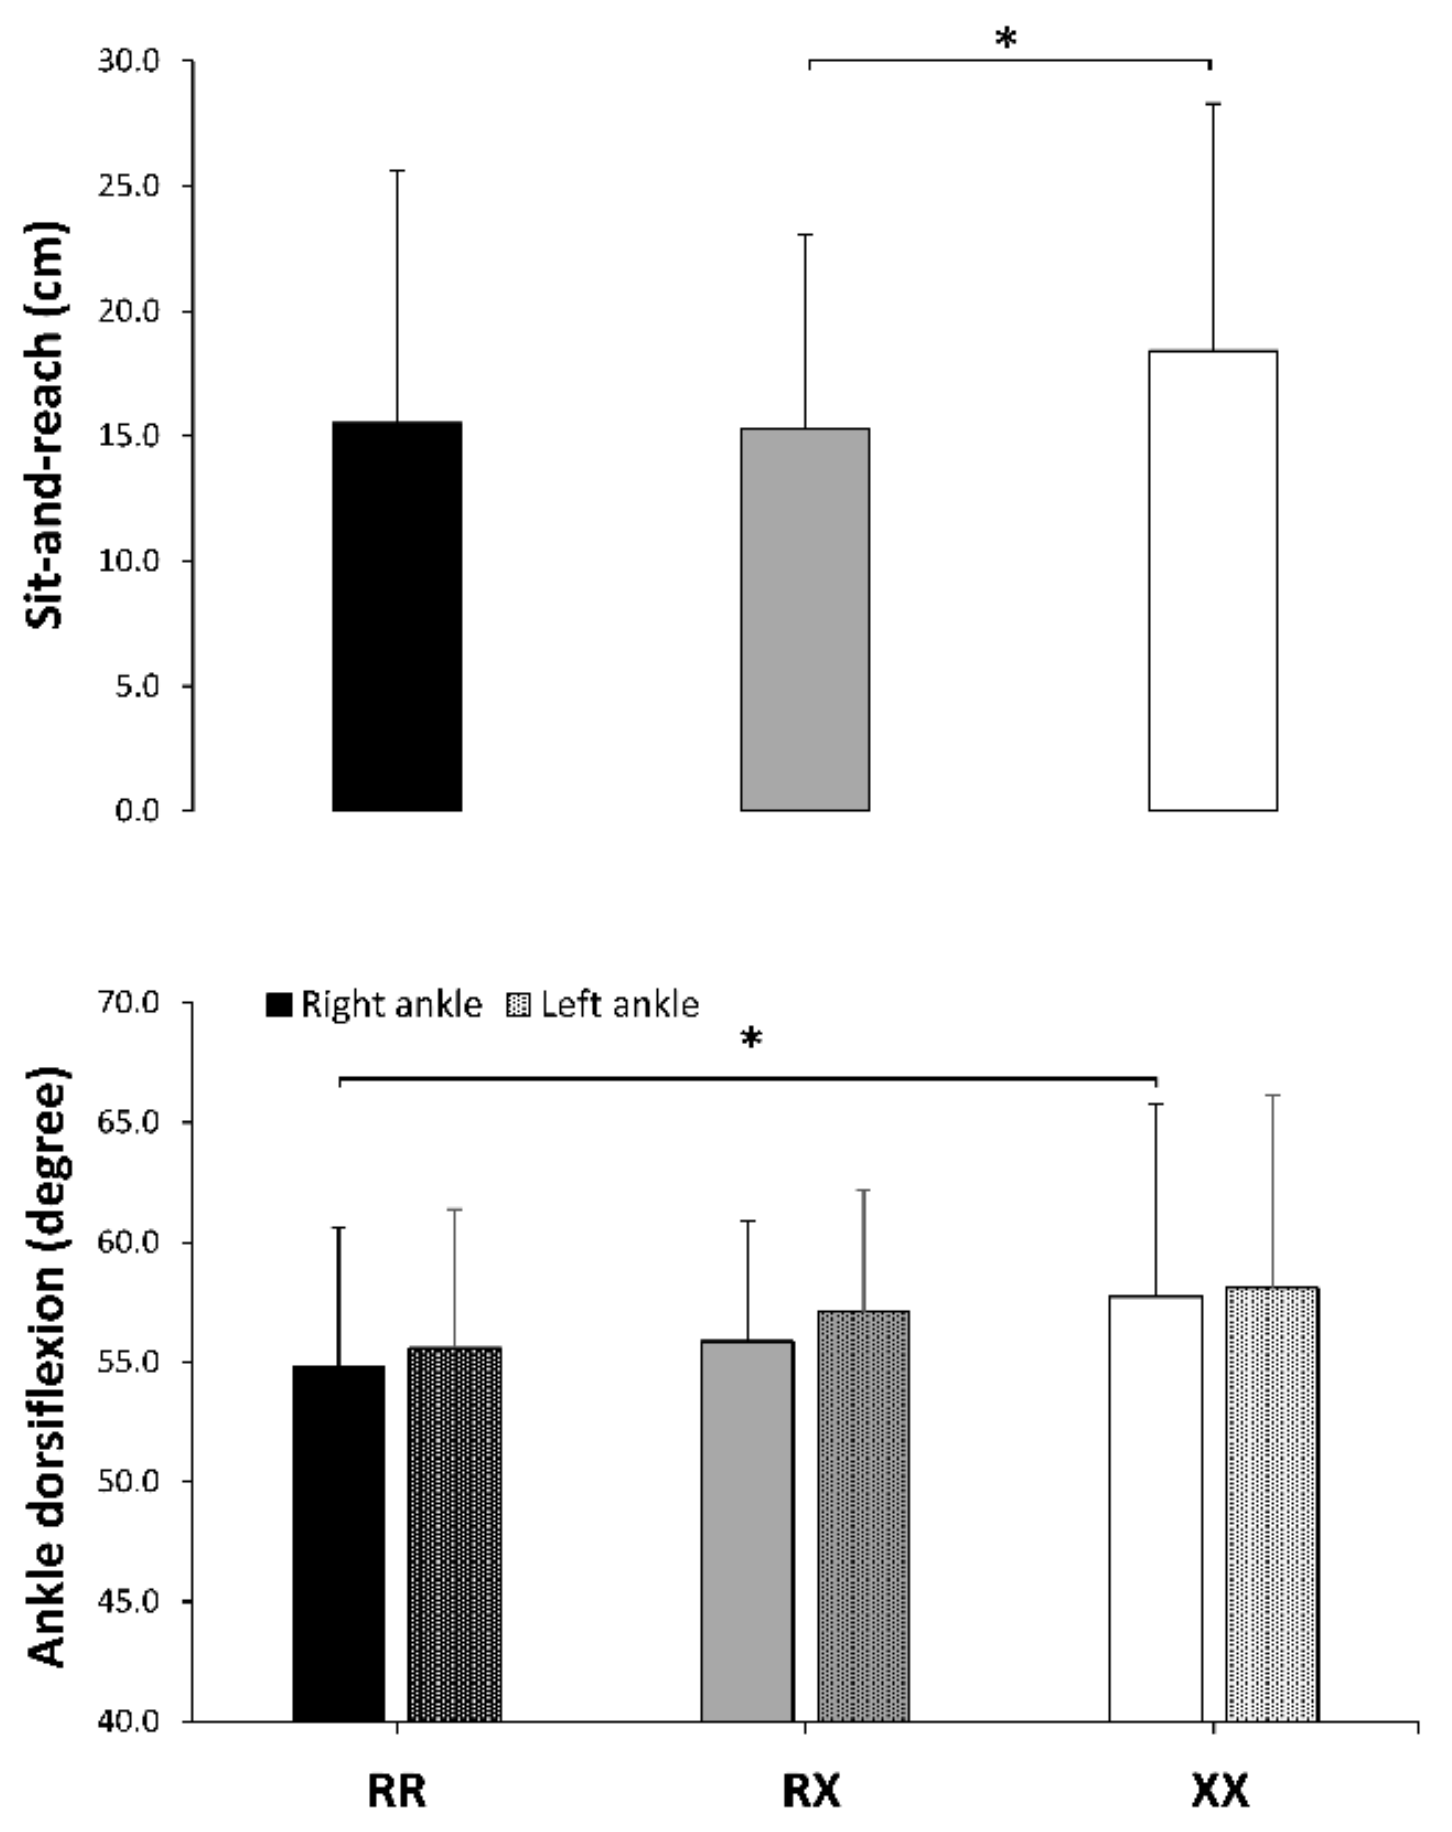
| Sit-and-reach test (cm) | 15.5 ± 10.1 | 15.3 ± 7.8 | 18.4 ± 9.9 | 0.0 ± 0.3 | 0.3 ± 0.4 | 0.4 ± 0.4 | 0.046 | 0.04 |
| Right-ankle dorsiflexion (degrees) | 54.8 ± 5.8 | 55.9 ± 5.0 | 57.7 ± 5.1 | 0.2 ± 0.3 | 0.5 ± 0.5 | 0.4 ± 0.4 | 0.044 | 0.05 |
| Left-ankle dorsiflexion (degrees) | 55.6 ± 4.8 | 57.1 ± 5.6 | 58.1 ± 5.1 | 0.3 ± 0.3 | 0.5 ± 0.5 | 0.2 ± 0.5 | 0.103 | 0.03 |
| Variable (Units) | RR | RX | XX | ES ± 95% CIRR vs. RX | ES ± 95% CIRR vs. XX | ES ± 95% CIRX vs. XX | p | η2 |
|---|---|---|---|---|---|---|---|---|
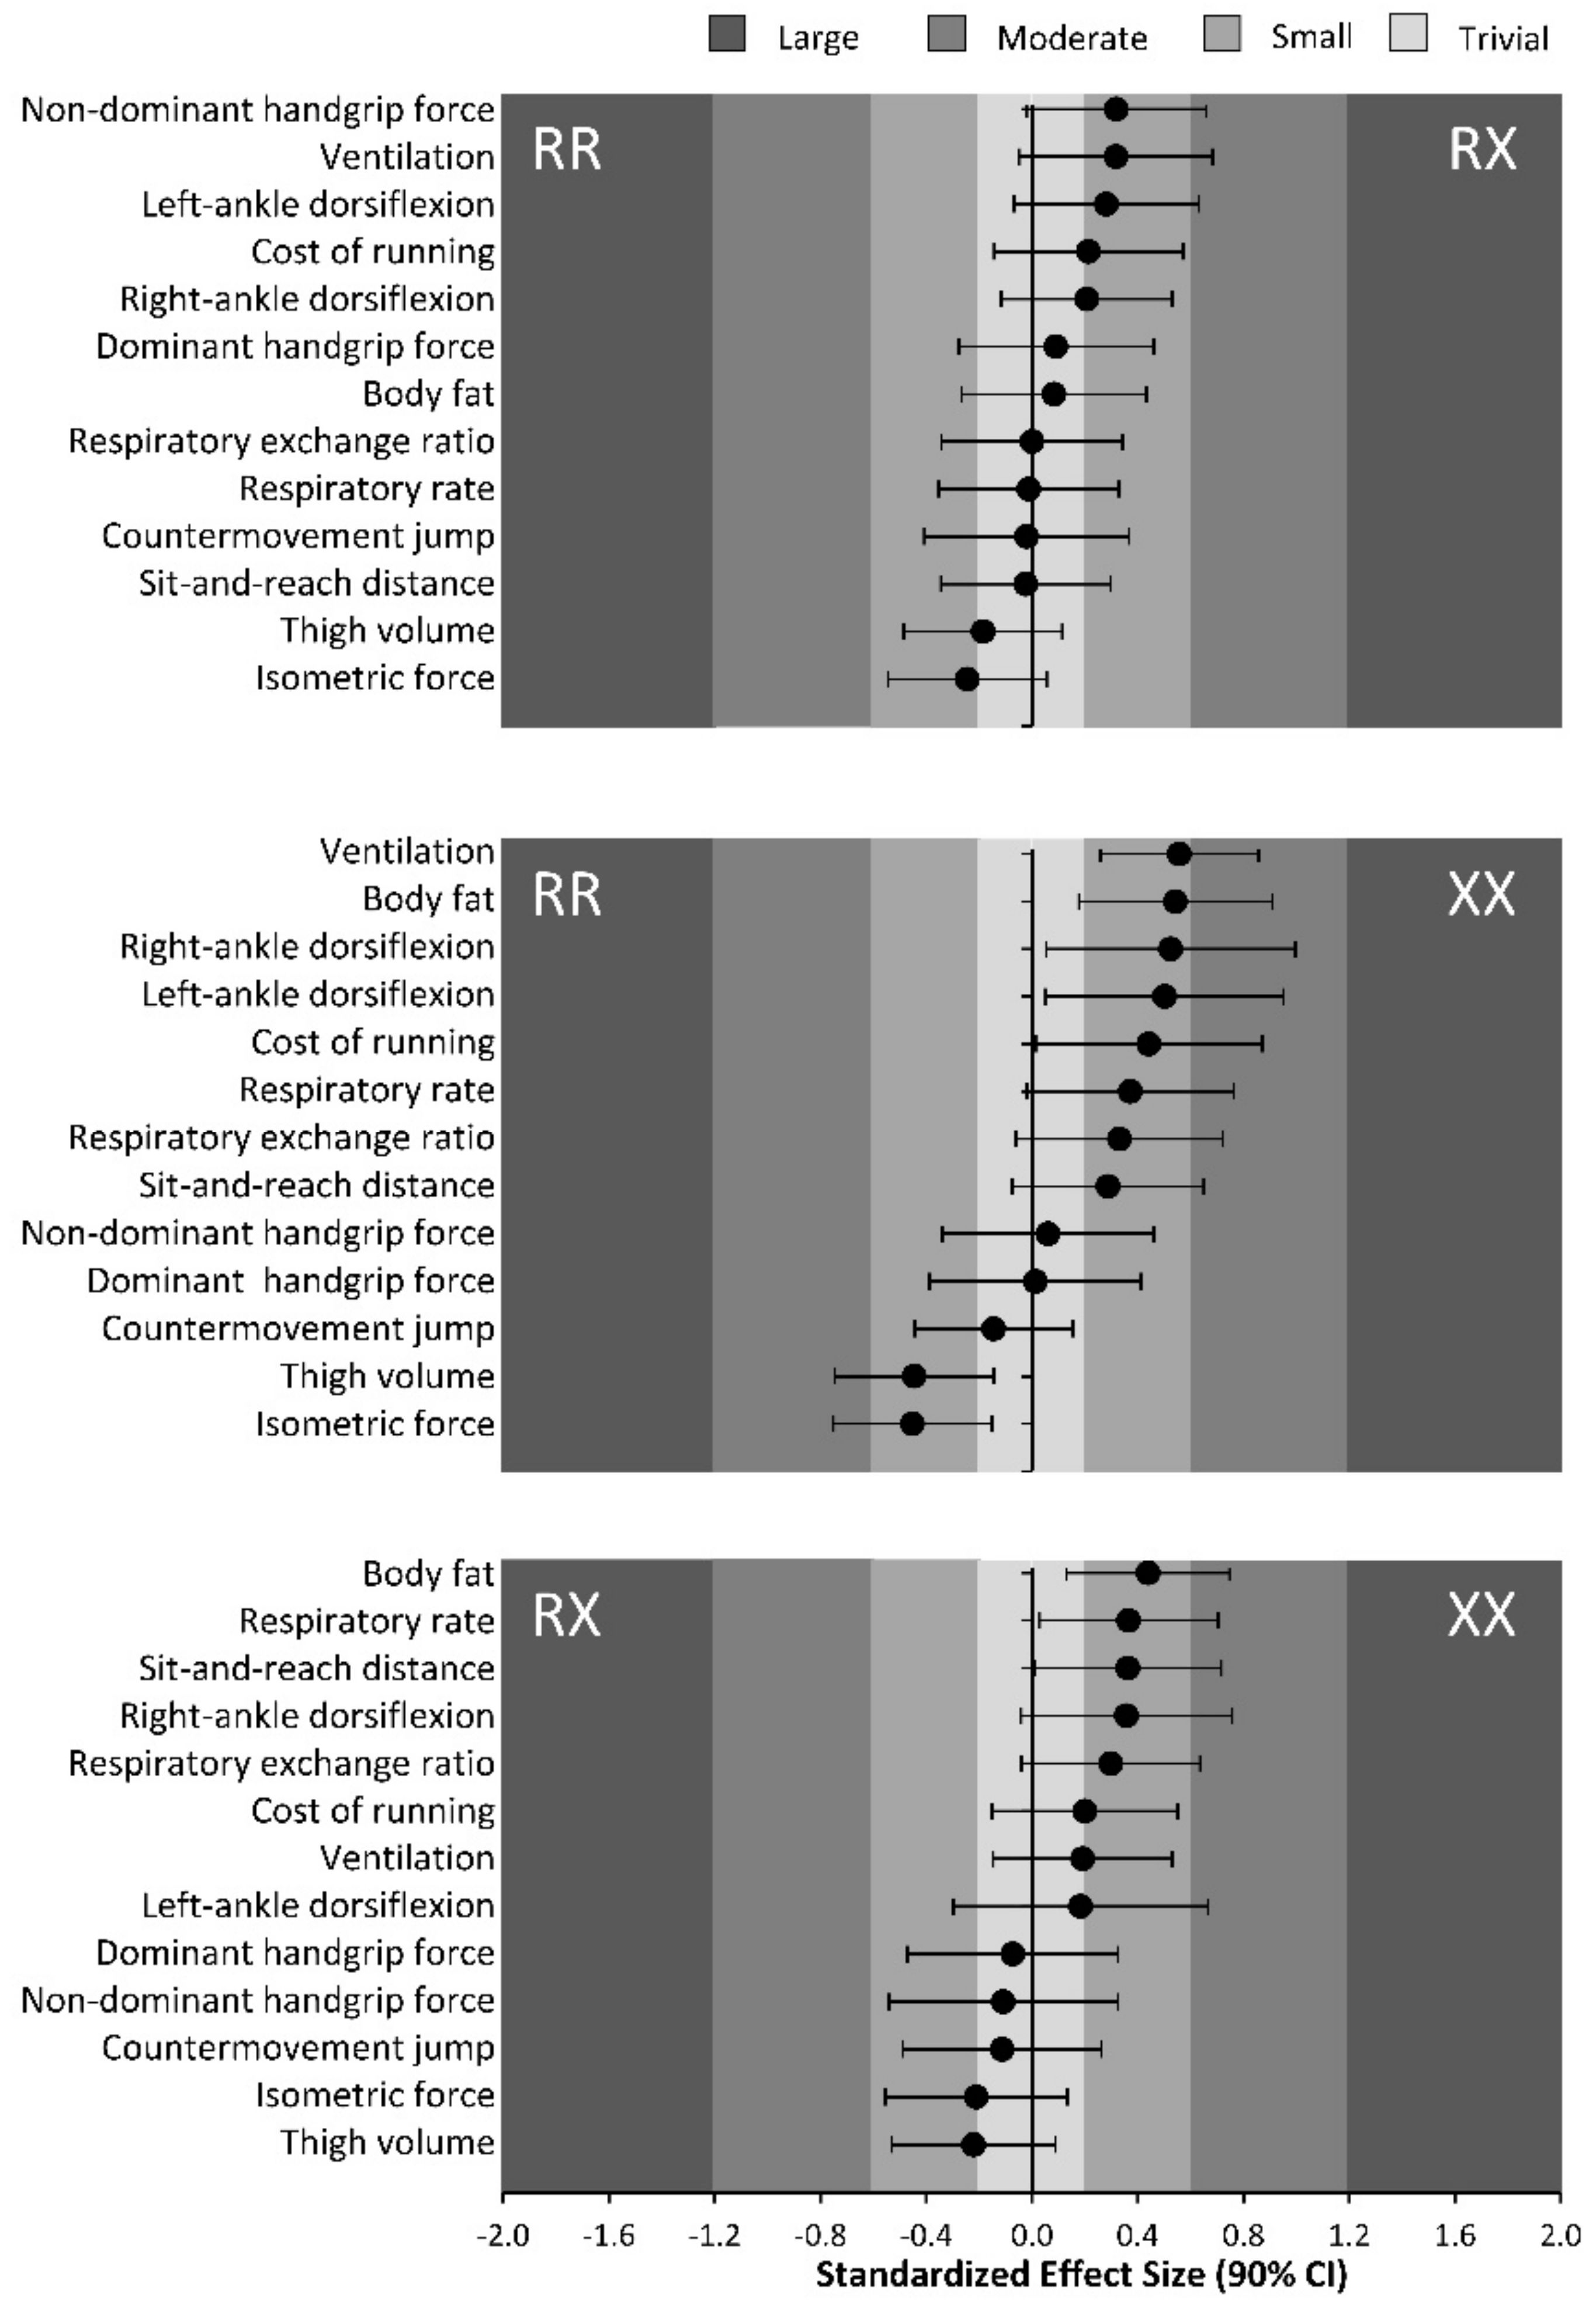
| Non-dominant handgrip force (N) | 388 ± 73 | 402 ± 79 | 393 ± 91 | 0.3 ± 0.3 | 0.1 ± 0.4 | −0.1 ± 0.4 | 0.663 | <0.01 |
| Dominant handgrip force (N) | 414 ± 67 | 421 ± 81 | 415 ± 89 | 0.1 ± 0.4 | 0.0 ± 0.4 | −0.1 ± 0.4 | 0.897 | <0.01 |
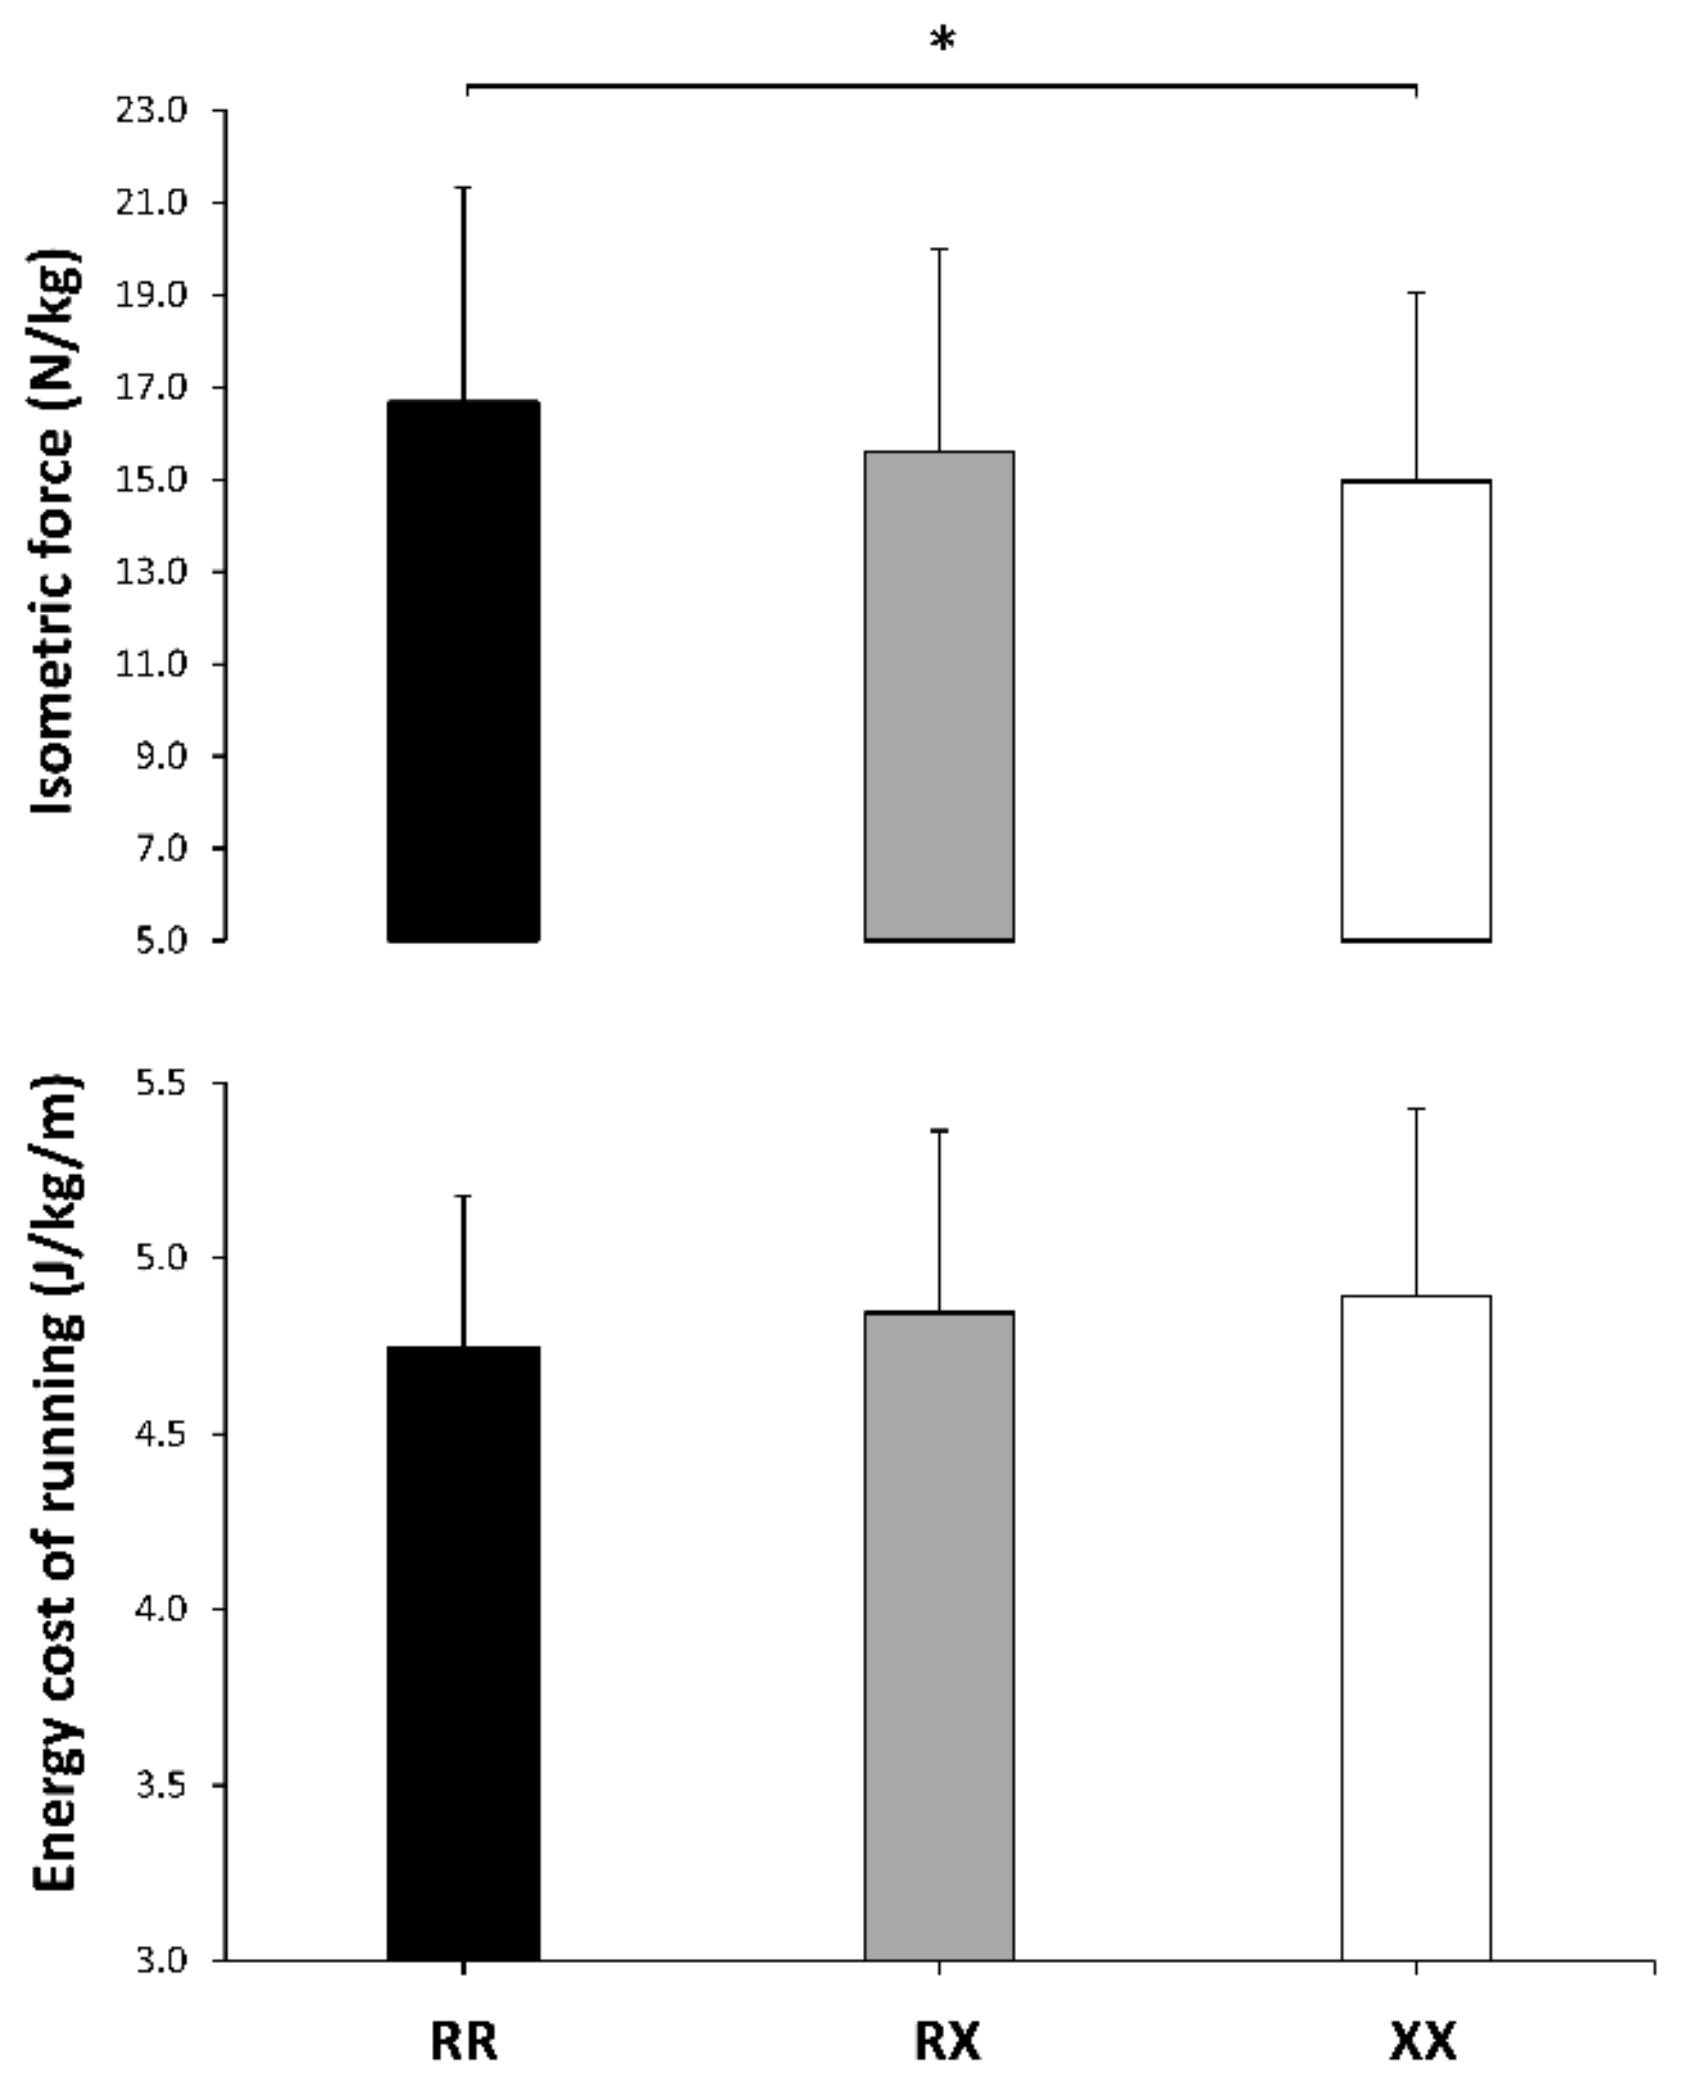
| Isometric force (N/kg) | 16.7 ± 4.7 | 15.6 ± 4.4 | 14.7 ± 4.0 | −0.2 ± 0.3 | −0.5 ± 0.3 | −0.2 ± 0.3 | 0.038 | 0.03 |
| Countermovement jump height (cm) | 26.9 ± 4.2 | 26.8 ± 5.3 | 26.2 ± 5.4 | 0.0 ± 0.4 | −0.1 ± 0.3 | −0.1 ± 0.4 | 0.818 | <0.01 |
| Tidal volume (L/respiration) | 2.3 ± 0.7 | 2.5 ± 0.6 | 2.3 ± 0.6 | −0.2 ± 0.3 | 0.0 ± 0.4 | −0.2 ± 0.3 | 0.388 | 0.01 |
| Respiratory rate (respirations/min) | 28.7 ± 7.7 | 28.6 ± 8.7 | 31.8 ± 8.9 | 0.0 ± 0.3 | 0.4 ± 0.4 | 0.4 ± 0.3 | 0.188 | 0.03 |
| Ventilation (L/min) | 62.0 ± 9.5 | 65.8 ± 13.1 | 68.3 ± 12.9 | 0.3 ± 0.4 | 0.6 ± 0.3 | 0.2 ± 0.3 | 0.012 | 0.09 |
| VO2 (mL/kg/min) | 38.4 ± 3.3 | 39.0 ± 3.9 | 39.3 ± 4.1 | 0.2 ± 0.4 | 0.2 ± 0.4 | 0.1 ± 0.4 | 0.389 | <0.01 |
| Respiratory exchange ratio | 0.89 ± 0.06 | 0.89 ± 0.07 | 0.91 ± 0.06 | 0.0 ± 0.3 | 0.3 ± 0.4 | 0.3 ± 0.3 | 0.130 | 0.02 |
| Energy cost of running (J/kg/m) | 4.7 ± 0.4 | 4.8 ± 0.5 | 4.9 ± 0.5 | 0.2 ± 0.4 | 0.4 ± 0.4 | 0.2 ± 0.4 | 0.448 | 0.01 |
© 2019 by the authors. Licensee MDPI, Basel, Switzerland. This article is an open access article distributed under the terms and conditions of the Creative Commons Attribution (CC BY) license (http://creativecommons.org/licenses/by/4.0/).
Share and Cite
Del Coso, J.; Moreno, V.; Gutiérrez-Hellín, J.; Baltazar-Martins, G.; Ruíz-Moreno, C.; Aguilar-Navarro, M.; Lara, B.; Lucía, A. ACTN3 R577X Genotype and Exercise Phenotypes in Recreational Marathon Runners. Genes 2019, 10, 413. https://0-doi-org.brum.beds.ac.uk/10.3390/genes10060413
Del Coso J, Moreno V, Gutiérrez-Hellín J, Baltazar-Martins G, Ruíz-Moreno C, Aguilar-Navarro M, Lara B, Lucía A. ACTN3 R577X Genotype and Exercise Phenotypes in Recreational Marathon Runners. Genes. 2019; 10(6):413. https://0-doi-org.brum.beds.ac.uk/10.3390/genes10060413
Chicago/Turabian StyleDel Coso, Juan, Victor Moreno, Jorge Gutiérrez-Hellín, Gabriel Baltazar-Martins, Carlos Ruíz-Moreno, Millán Aguilar-Navarro, Beatriz Lara, and Alejandro Lucía. 2019. "ACTN3 R577X Genotype and Exercise Phenotypes in Recreational Marathon Runners" Genes 10, no. 6: 413. https://0-doi-org.brum.beds.ac.uk/10.3390/genes10060413