Article

Identification and Characterization of a Thermotolerant TILLING Allele of Heat Shock Binding Protein 1 in Tomato

by
Dominik Marko
1,2,
Asmaa El-shershaby
1,3,
Filomena Carriero
2,
Stephan Summerer
2,
Angelo Petrozza
2,
Rina Iannacone
2,
Enrico Schleiff
1,4,5,* and
Sotirios Fragkostefanakis
1
1
Department of Biosciences, Molecular Cell Biology of Plants, Goethe University, D-60438 Frankfurt am Main, Germany
2
ALSIA Research Center Metapontum Agrobios S.S. Jonica 106 Km 448,2 -75100 Matera, Italy
3
Department of Molecular Biology, Genetic Engineering and Biotechnology Division, National Research Centre, 12311 Dokki, Giza, Egypt
4
Frankfurt Institute of Advanced Studies (FIAS), D-60438 Frankfurt am Main, Germany
5
Buchmann Institute for Molecular Life Sciences (BMLS), Goethe University, D-60438 Frankfurt am Main, Germany
*
Author to whom correspondence should be addressed.
Submission received: 30 May 2019 / Revised: 30 June 2019 / Accepted: 4 July 2019 / Published: 7 July 2019
(This article belongs to the Special Issue TILLING and CRISPR to design the varieties of tomorrow)

Abstract

:
The identification of heat stress (HS)-resilient germplasm is important to ensure food security under less favorable environmental conditions. For that, germplasm with an altered activity of factors regulating the HS response is an important genetic tool for crop improvement. Heat shock binding protein (HSBP) is one of the main negative regulators of HS response, acting as a repressor of the activity of HS transcription factors. We identified a TILLING allele of Solanum lycopersicum (tomato) HSBP1. We examined the effects of the mutation on the functionality of the protein in tomato protoplasts, and compared the thermotolerance capacity of lines carrying the wild-type and mutant alleles of HSBP1. The methionine-to-isoleucine mutation in the central heptad repeats of HSBP1 leads to a partial loss of protein function, thereby reducing the inhibitory effect on Hsf activity. Mutant seedlings show enhanced basal thermotolerance, while mature plants exhibit increased resilience in repeated HS treatments, as shown by several physiological parameters. Importantly, plants that are homozygous for the wild-type or mutant HSBP1 alleles showed no significant differences under non-stressed conditions. Altogether, these results indicate that the identified mutant HSBP1 allele can be used as a genetic tool in breeding, aiming to improve the thermotolerance of tomato varieties.

1. Introduction

Heat stress (HS) is one of the most devastating environmental stresses that a plant can face during its life cycle. At the cellular level, HS impacts membrane fluidity, microtubule organization and activity, and the general stability of enzymes participating in a variety of physiological processes [1,2,3]. Consequently, high temperatures negatively affect the growth of vegetative and floral organs, induce flower abortion, and cause deviations from physiological developmental transitions, including gametophytic defects [4,5,6,7].
At the molecular level, HS causes the accumulation of misfolded proteins, which is a condition referred to as proteotoxicity. This hampers the functionality and stability of structural, enzymatic, and regulatory proteins [8]. Protection and recovery from HS depend on the activation of a complex network of molecular responses, which are collectively called the HS response (HSR). A major feature of HSR is the transcriptional upregulation of hundreds of genes coding for proteins with a variety of biological functions, including reactive oxygen species scavengers, hormone metabolism, transcription and translation, signaling, and protein fate [9,10,11,12,13,14]. Among them, a special focus has been placed on heat shock proteins (Hsps), acting as molecular chaperones, for their essential role in the maintenance of protein homeostasis under both physiological and stress conditions [15,16,17].
The majority of HS-induced genes are controlled by members of the HS transcription factor (Hsf) family [18,19]. Plants encode for a large number of Hsfs, which, based on the structure, domain, and functional peculiarities are categorized in classes A, B, and C [20,21]. In plants, HsfA1 members are considered as essential regulators of the initial response and basal thermotolerance; these are required for the upregulation of stress-induced Hsfs, which further contribute to stress response maintenance and stimulation [11,22,23,24,25,26]. Class B Hsfs are mostly involved in the repression of HSR during attenuation after heat stress, but in some cases, a co-activator function with class-A Hsfs has been reported as well [27,28,29,30]. The function of the class C Hsfs remains to be explored.
The misregulation of Hsf and chaperone networks cause deviations from physiological growth and development both in vegetative and reproductive tissues [11,30,31,32]. Therefore, Hsfs are embedded in a regulatory network involving different layers of control mechanisms that adjust their activity based on the cellular demands. Such a post-translational mechanism has been exemplified on the level of interaction of Hsf with chaperones, co-chaperones, and other associated factors that eventually control the activity, stability, and nucleocytoplasmic equilibrium of Hsfs [33,34,35,36,37,38].
Heat shock binding protein (HSBP) is a conserved eukaryotic protein that primarily acts as a negative regulator of Hsfs via interaction with the oligomerization region of Hsfs [39]. The HSBP monomer has an α-helical structure that can form trimers and hexamers via coiled-coil interactions [39,40]. The nuclear translocation of HSBP upon stress and during recovery from HS is related to the inactivation of Hsfs [41]. It has been proposed that HSBP modulates the attenuation phase of HSR. Arabidopsis thaliana HSBP, Zea mays EMP2/HSBP1, and Oryza sativa HSBP1 and HSBP2 are induced by HS, but also show enhanced expression under physiological conditions in siliques, embryos, and panicles, respectively [41,42,43]. Maize EMP2/HSBP1 functions in the early stages of kernel development under physiological conditions, which is consistent with a developmental role [42]. Interestingly, HSBP only interacts with class A Hsfs, and the different HSBPs show a specificity for different HsfA members. Maize EMP1/HSBP1 interacts with HsfA2e, HsfA3, HsfA4d, and HsfA5, while HSBP2 binds to HsfA2c and HsfA4a [43]. Consistent with a distinct interaction profile that pairs OsHSBP1 and OsHSBP2 with different Hsfs, transgenic lines show differences in the transcript regulation of Hsf-dependent genes such as Hsps [44].
We explored the capacity of ethyl methanesulfonate (EMS)-induced mutations in the HSBP coding gene to have a positive impact on the thermotolerance of tomato plants. Tomato is an economically and dietary important crop world-wide, and has long served as a model plant for flesh fruit development [45]. Considering that tomato is cultivated in areas that are and will be heavily affected by global warming (e.g., the Mediterranean basin) the identification or development of heat-resilient germplasm is of utmost importance for farmers and consumers. Through a TILLING screening performed on a Red Setter mutant population, we identified a mutation in the tomato HSBP1 gene. This mutation causes a Met to Ile substitution in one of the helical heptad repeats. The effect of the mutation on the HSBP activity on important Hsfs was examined in tomato protoplasts, while the impact of the mutation on plant performance under high temperatures was examined by monitoring the physiological parameters of thermotolerance. We observed a reduction of the negative regulation of the HSBP mutant on Hsf activity resulting in plants with increased thermotolerance in the absence of significant phenotype alterations under non-stressed conditions. Thereby, the HSBP1 mutant line that is identified can be further used for the genetic improvement of thermotolerance in tomato.

2. Materials and Methods

2.1. Plant Material and Stress Treatment

Phenotyping was performed in a greenhouse under controlled conditions via a Scanalyzer 3D platform (LemnaTec Gmbh) in 2-L pots, containing 1.5 kg of soil (50:50 peat moss and river sand). Before sowing, 30 units of nitrogen, 40 units of anhydrous phosphate, and 30 units of potassium oxide were added to the substrate mixture. Growth conditions were 25/20 °C day/night temperature, 65%, relative humidity with a 16 h per day photoperiod. Plants were irrigated with 100 ml of water every 3 days during the analyses. For leaf surface temperature monitoring, plants were either kept at 25 °C or exposed to a gradual temperature increase from 8:00 to 13:00, at which point the temperature reached 36 °C, remained there for 1 hour, and then gradually declined to 25 °C until 18:00. The temperature was recorded on either the youngest fully emerged leaf, or the third oldest leaf of each plant using a PAM 2500 (Walz, Germany).

2.2. TILLING Screening

For the identification of induced point mutation in HSBP1, a TILLING platform based on Red Setter cultivar was used [46]. DNA amplification was performed using nested PCR with gene-specific primers (HSBP1-For-ext: GGCCCTTTAAAGAACTCTCTCTG, HSBP1-Rev-ext: ATAGGCGGGTGTAGGGTTCT, HSBP1-For-int: TTGGTTCAATTTTCATGCACTT, HSBP1-Rev-int: AAAAAGGCTATAAATTTTCTATTATTGC. Internal primers were 5’-end labeled with IRDye 700 and IRDye 800 dye (LI-COR, Lincoln, NE, USA), respectively. The PCR amplifications were carried out according to the experimental conditions described previously [47]. Mutation detection was performed by using Endonuclease ENDO I [48] and LI-COR 4300 DNA Analyzer (LI-COR, Lincoln, NE, USA). Adobe Photoshop software was used for image analysis (Adobe Systems Inc., San Jose, CA, USA). Mutation was validated by Sanger sequencing, and its position was defined at nt 761 from the first nucleotide of the amplicon generated by primers HSBP1-For-ext/HSBP1-Rev-ext. Prediction of the impact of amino acid change on protein function was done using SIFT software [49].

2.3. Genotyping of Mutant Plants

The genotyping of plants was performed as previously described [50]. M3 seeds of families containing the HSBP1 mutant allele (HSBP1m) were grown in a greenhouse under standard conditions and confirmed by Sanger sequencing. Homozygous plants for G761A HSBP1 mutation were identified and backcrossed to the Red Setter parent line. BC1F1 plants were selfed, and BC1F2 progenies were genotyped for G761A HSBP1 mutation. Using homozygous BC1F2 mutant plants, a further selfing was adopted to obtain BC1F3 seed stocks. BC1F3 progeny carrying the wild-type HSBP1 allele were used as control plants and are referred to here as HSBP1wt.

2.4. Seedling Thermotolerance

Four-day-old seedlings were germinated in the dark at 25 °C on wet paper towels in sealed petri dishes, and were exposed to 25 °C, 39 °C, 42 °C, or 45 °C for 1 hour in a water bath. Thermotolerance was evaluated by measuring the hypocotyl length for the following 7 days.

2.5. Image Based Phenotyping: Data Acquisition and Processing

Phenotyping through image analysis was performed with a Scanalyzer 3D System (LemnaTec GmbH). Plants from each genotype were divided into two groups: control (non-stressed) and heat-shocked (1 hour at 39 °C) daily for four days. Visible light images of the plants were captured immediately after heat shock treatment.
The imaging involving three mutually orthogonal vantage points was used to evaluate the morphometric parameters of the plant, such as height and biomass [51]. The digital biovolume was calculated from the three orthogonal images of the same plant according to the formula [52]:
p i x e l s i d e v i e w 0 ° + p i x e l s i d e v i e w 90 ° + log ( p i x e l t o p v i e w 3 )
The color classes that were chosen were determined experimentally for each experiment by examining the hue histogram. Here, only yellow and dark green are shown. The number of fruits was recorded in full maturity from the second truss. In addition, the seed number for each fruit from this truss was also determined.

2.6. Expression Constructs

The expression constructs of HSBP1 wild-type and HSBPm genes were cloned either with an N-terminal green fluorescence protein (GFP) or HA-tag, using the appropriate primers (Table S1). Plasmids encoding for HsfA1a, HsfA2, and HsfB1 as well as PGmHsp17-CI::GUS have been described elsewhere [20,53]. For the repressor assay, the pRT103 GUS vector was used with three inserted heat stress element (HSE) oligonucleotides downstream of the TATA box of the CaMV35S promoter. Therefore, the high constitutive activity of the CaMV35S of the vector was reduced in the presence of HSE-binding factors [53].

2.7. Protoplast Preparation and GUS Reporter Assays

Mesophyll protoplasts from sterile grown tomato plants cv. Moneymaker were isolated and transformed as previously described [22]. Fifty thousand protoplasts were transformed with a total of 10 μg of plasmid DNA per sample consisting of 0.5 μg of each Hsf or HSBP1-expressing plasmid and 1 μg of the reporter plasmid DNA construct. The total amount of plasmids was complemented to 10 μg with a pRT-Neo mock plasmid. Following transformation, protoplasts were incubated for 6 hours at 25 °C, and β-glucuronidase (GUS) activities were determined as described previously [53,54]. Alternatively, protoplasts were exposed to the indicated temperature in a water bath, collected by centrifugation, and then snap frozen in liquid nitrogen.

2.8. RNA Extraction and Transcript Analysis

Total RNA was extracted using the E.Z.N.A. Plant RNA Kit (Omega Bio-Tek, Norcross, GA, USA) following the manufacturer’s instructions. cDNA was synthesized using 1 μg of total RNA with Revert Aid reverse transcriptase (Thermo Scientific) following the manufacturer’s protocol. The expression of HSP70-1, Hsp70-5, and HsfA2 genes was determined using quantitative real-time PCR (qRT-PCR) on a StepOnePlus (Thermo Fisher Scientific). The reaction (10 μl) consisted of gene primers (Table S1), PerfeCTa® SYBR® Green FastMix Low ROX (Quanta Biosciencies), and the template. Thermal cycling conditions were 95 °C/3 min followed by 95 °C/15 s, 60 °C/30 s, and 72 °C/30 s for 40 cycles. Gene primers were designed using PRIMER3 (www-genome.wi.mit.edu/cgi-bin/primer/primer3.cgi/). Data were analyzed by standard methods [55] and presented as relative levels of gene expression using the EF1α (Solyc06g005060) and Actin (Solyc11g005330) genes as internal standards.

2.9. Microscopy

The subcellular localization of GFP-tagged HSBP1 and HSBP1m proteins was performed under a Leica SP5 confocal laser-scanning microscope. GFP was excited at 488 nm and mCherry at 561 nm. ENP1-mCherry was used as a nuclear marker protein [56]. Fluorescence emission was measured at 490–548 nm (GFP) and 570–656 nm (mCherry).

2.10. Orthology Search and in Silico Structure Prediction

Orthologous genes to At-HSBP1 were identified via OrthoDB [57]. The secondary structure was predicted and visualized by I-TASSER based on the models with lower C scores [58]. CCBuilder with an implemented BUDE algorithm was used for the calculation of force fields scores for interaction energies based on an analysis of the wild-type MSESIISKIDEMGNRIDELE or mutant MSESIISKIDEIGNRIDELE peptide, using the following parameters: trimer oligomeric state, radius 5.1, Pitch 226, and interface angle 24 [59].

2.11. Transcriptome Data

Information on the expression of selected genes was obtained by the TOMEXPRESS database. The comparison of expression profiles between Sl-HSBP1 and Hsfs or Hsps was done by Pearson correlation analysis based on transcript levels across 106 individual samples of different organs, tissues, and tomato genotypes at different developmental stages.

3. Results

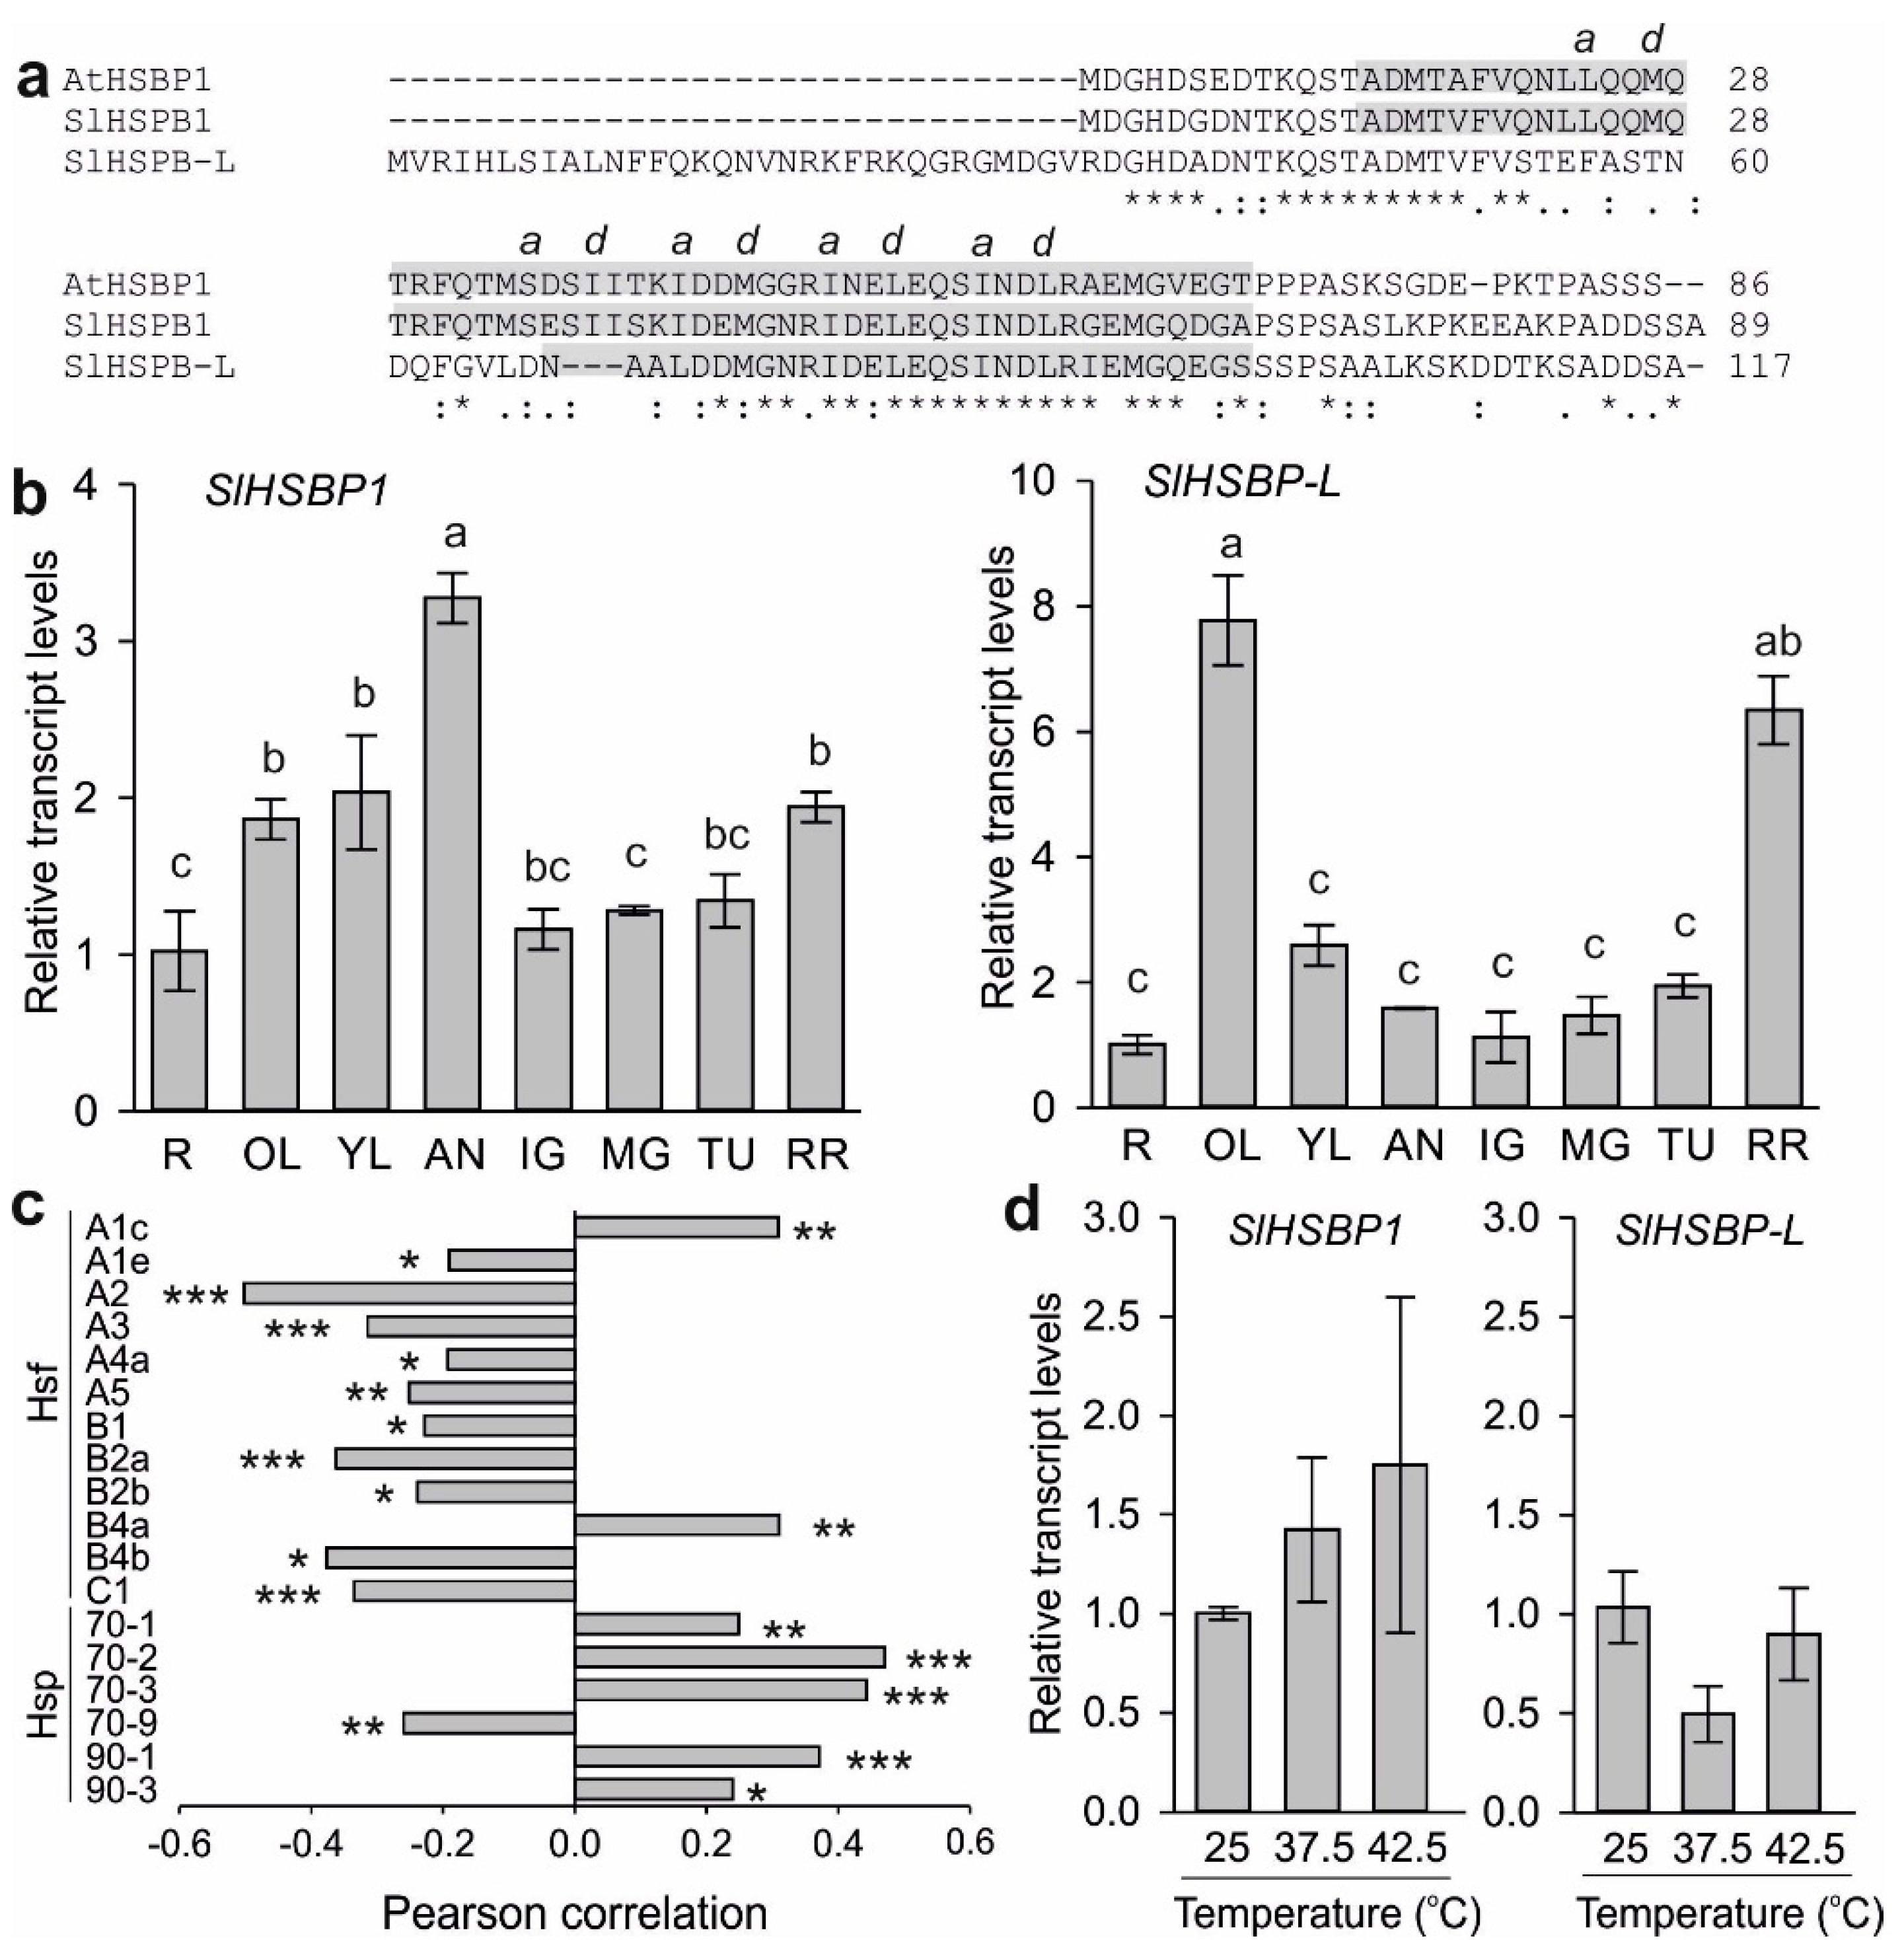
3.1. Expression of Putative HSBP Genes in Tomato

Two genes, Solyc01g067905 and Solyc12g099570, are annotated as orthologs to A. thaliana HSBP1 [57]. Solyc01g067905 encodes for a 12.9-kDa and Solyc12g099570 encodes for a 9.8-kDa protein. Solyc12g099570 shares a higher sequence similarity to At-HSBP1 than Solyc01g067905, and it likely shares similar conformation, since the a and d hydrophobic residues in five hydrophobic heptad repeats are conserved (Figure 1a). The coiled-region of Solyc12g099570 is of similar length to that of At-HSBP1, while this domain of Solyc01g067905 shows variations in length and composition (Figure 1a). Moreover, Solyc01g067905 has an extended N-terminal region compared to other Heat shock binding proteins (HSBPs) (Figure S1). Based on this, Solyc12g099570 is annotated as HSBP1, and Solyc01g067905 is annotated as the HSBP-like (HSBP-L) protein.
The transcript levels of both genes under non-stress conditions in different tomato tissues were determined by qPCR. SlHSBP1 shows the highest levels in anthers, and slightly increased levels in leaves compared to roots (Figure 1b). SlHSBP-L levels peak in old leaves and are increased in red ripe fruits (Figure 1b). As HSBPs are considered negative regulators of Hsfs and consequently of the transcription of HS-induced genes, we examined the correlation of SlHSBP1 with that of all tomato Hsfs and cytosolic Hsp101, Hsp90, Hsp70, and small Hsps, as several of these genes are differentially regulated in various tissues and developmental stages [9]. Pearson correlation was performed on the basis of publicly available RNAseq data for SlHSBP1 and HsfA2, but not for SlHSBP-L, for which transcriptome data is not currently available [60]. Indeed, a weak but significant negative correlation calculated across 106 samples was detected for SlHSBP1 with 10 Hsfs and Hsp70-9 (Figure 1c). As many of these genes are regulated in an Hsf-dependent manner, the negative correlation is in agreement with the assumed repressor function of SlHSBP1. Remarkably, HsfA1c and HsfB4a as well as Hsp70-1, Hsp70-2, Hsp70-3, Hsp90-1, and Hsp90-3 showed a weak but significant positive correlation (Figure 1c). These results suggest that SlHSBP1 and the above-mentioned genes are regulated by similar, probably Hsf-independent, transcriptional networks.
As HSBPs have been described as HS-induced, the levels of HSBP transcripts were determined in leaves exposed for 1 hour at 37.5°C or 42.5 °C, or kept for the same time at 25 °C as control (Figure 1d). Remarkably, neither SlHSBP1 nor SlHSBP-L showed a significant change in transcript levels after one hour at high temperatures.

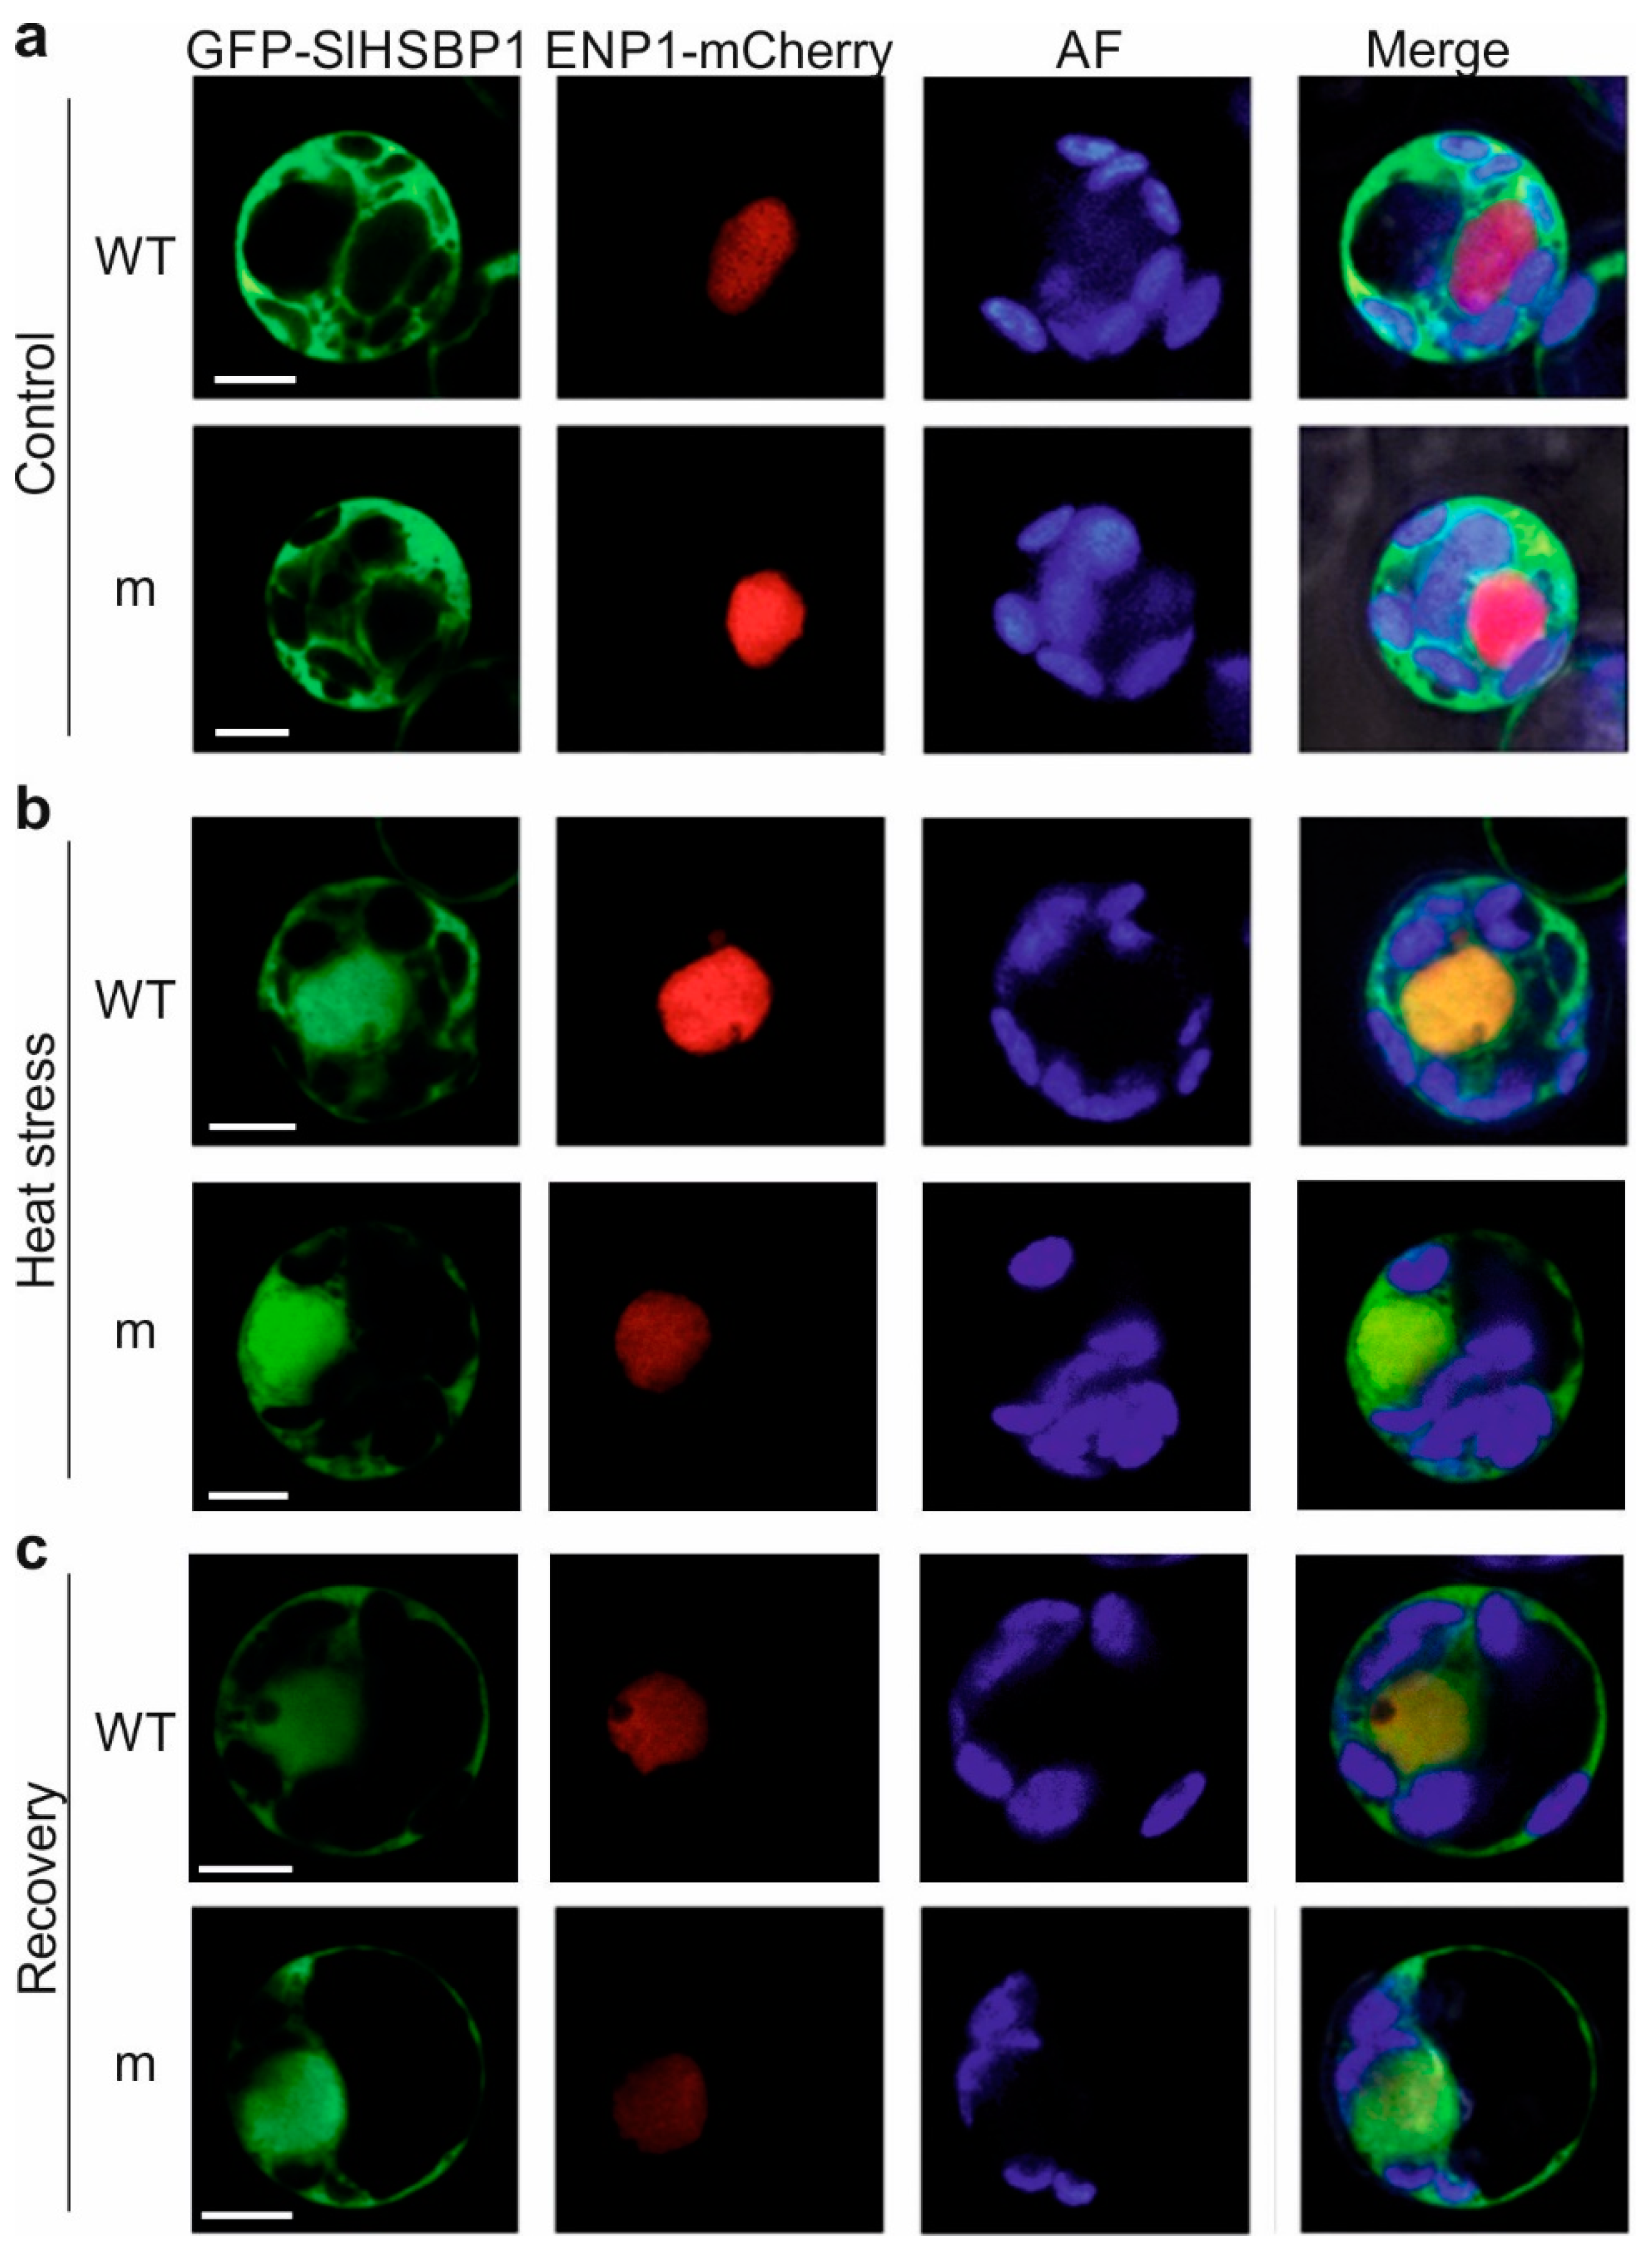
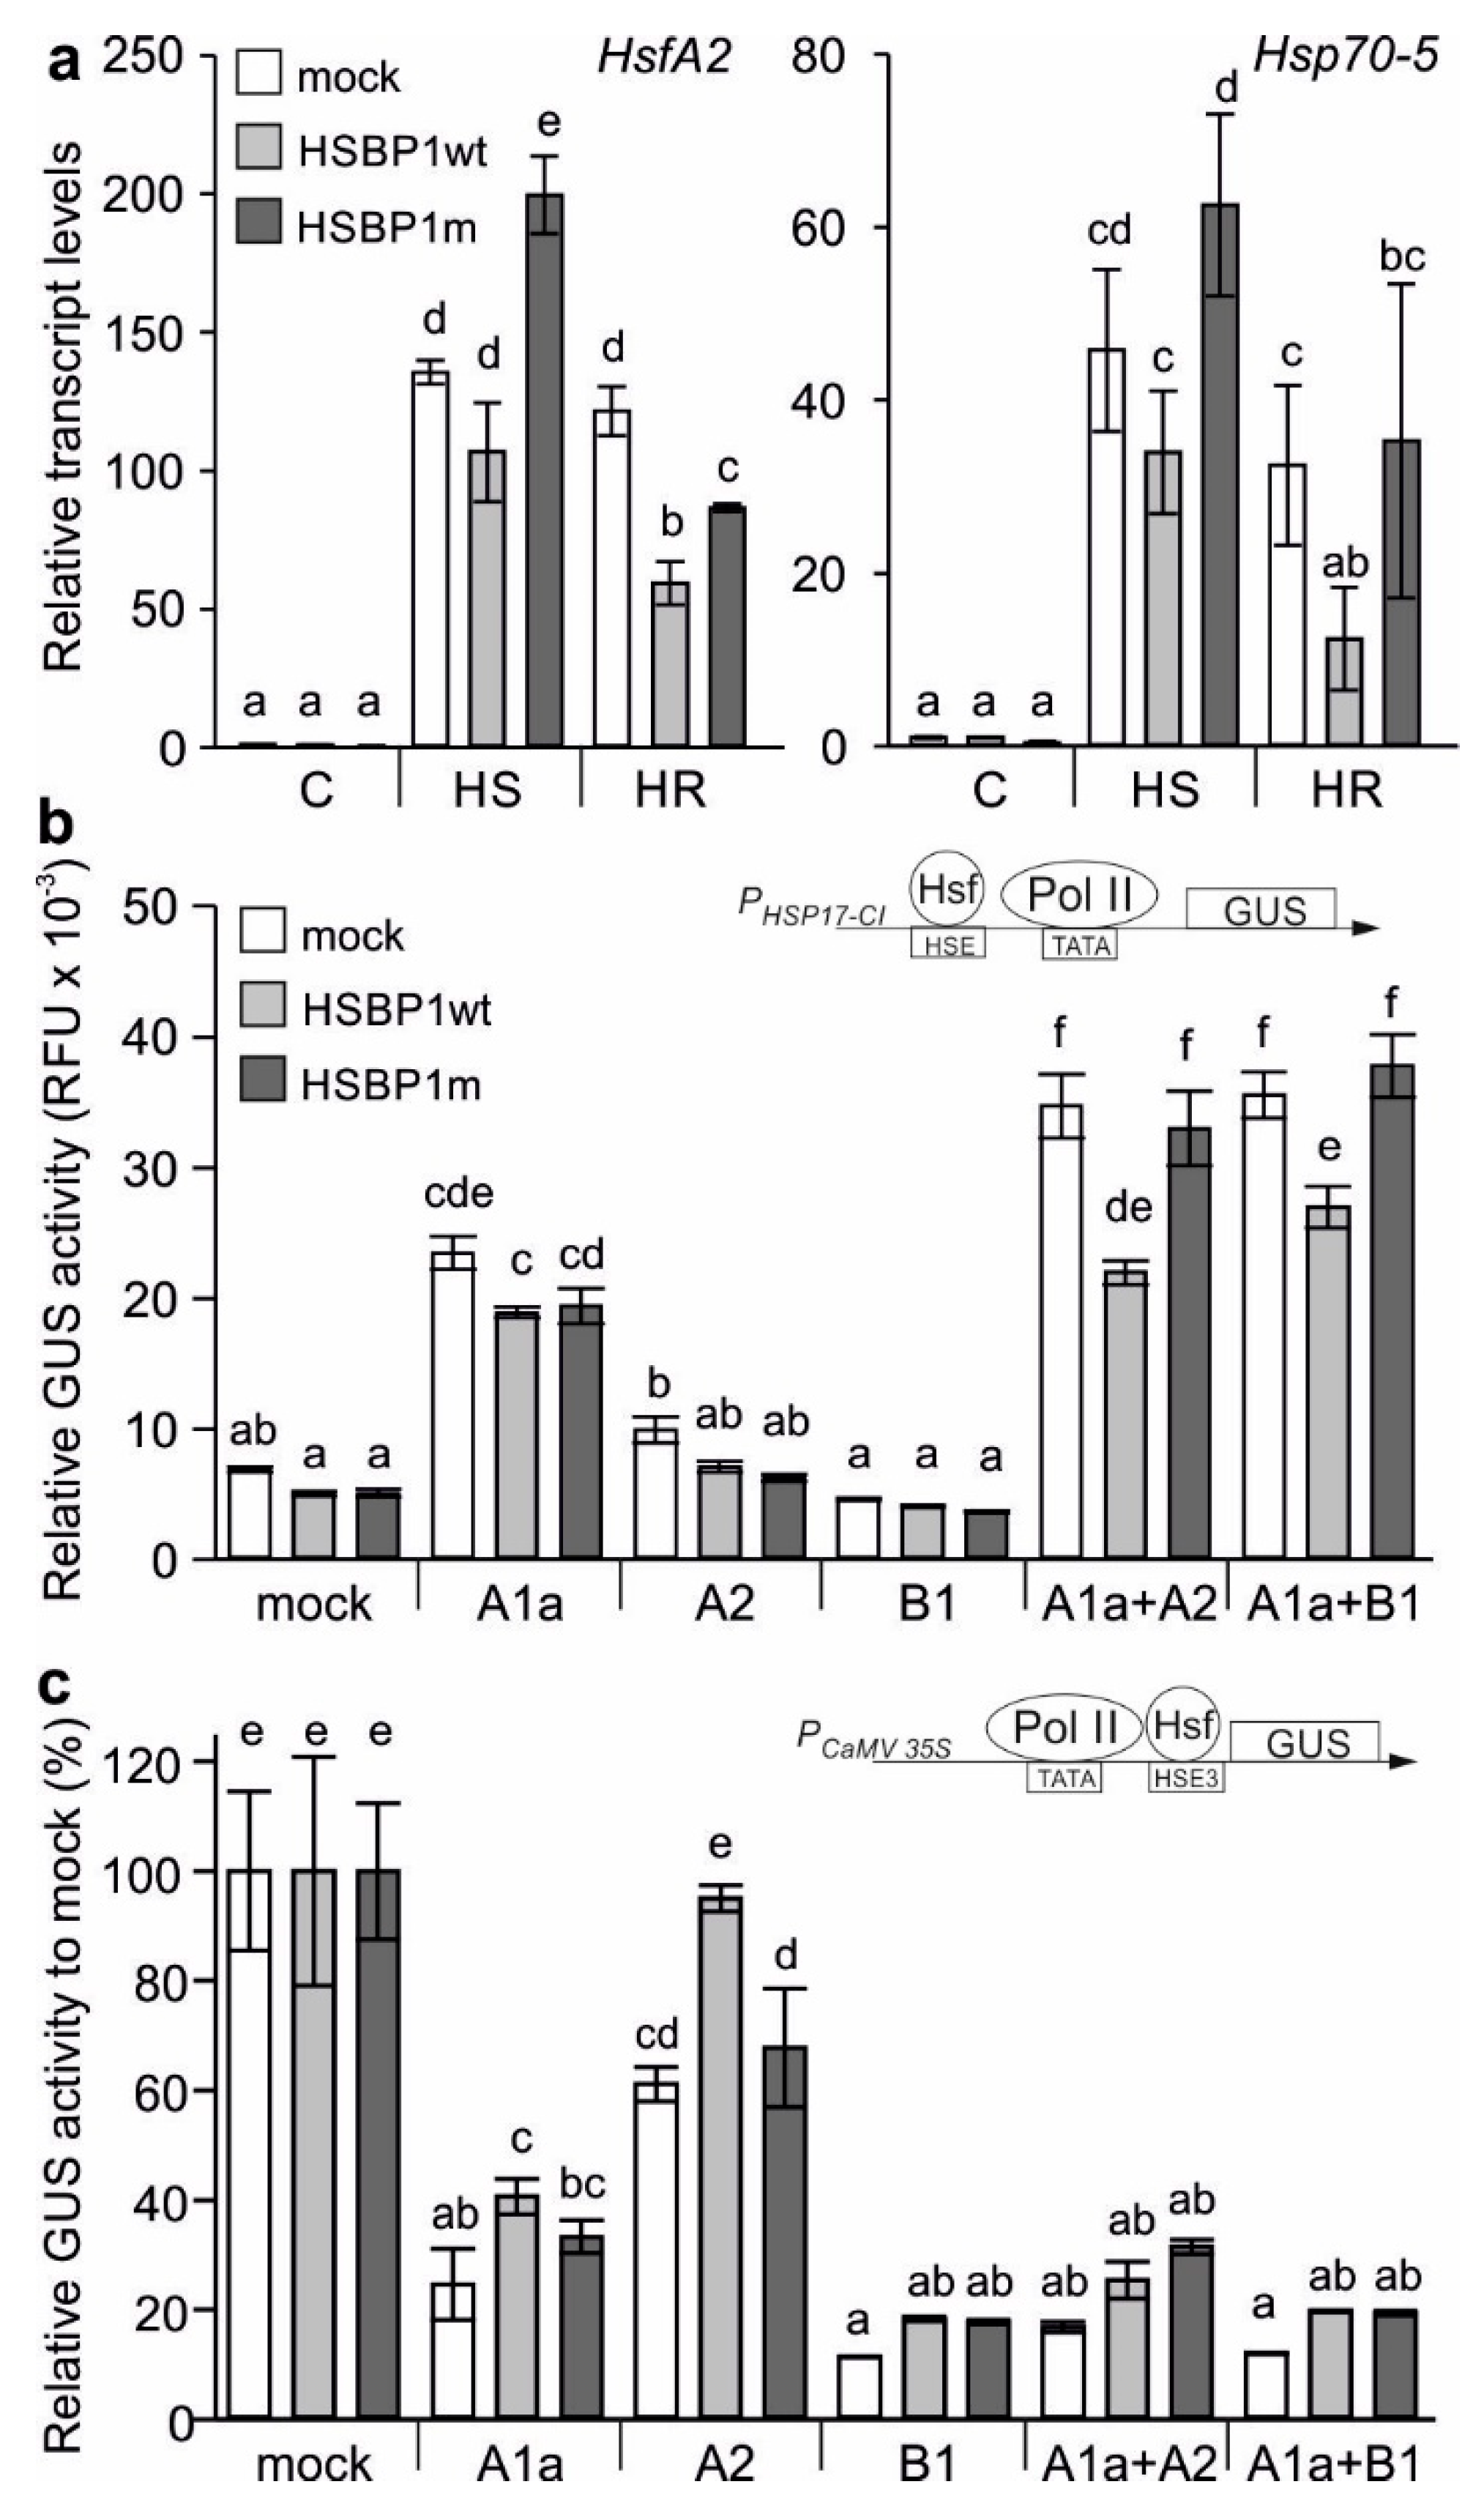
3.2. A Mutation of the Zipper Affects the HSBP Functionality

The homology of SlHSBP1 to AtHSBP1 and the correlation of its expression profile with genes coding for central Hsfs marked SlHSBP1 as a promising candidate for the manipulation of the HSR in tomato. A TILLING approach based on EMS mutagenesis of the cv. Red Setter was carried out [46], and a population of 5200 M3 families was screened with SlHSBP1 specific primers, leading to the identification of a single-base substitution G761A. The mutation causes a change of Met to Ile at position 45 (M45I). Using the CCBuilder, BUDE force fields scores for interaction energies between 20 amino acid residue peptides containing the heptad repeat with the mutation, as well as the N-terminal and C-terminal repeats in the coiled-coil region; values of −22.4 kJ/mol for SlHSBP1 (translating to KD = 100µM at 20 °C) and −29.4 kJ/mol for mutated SlHSBP1 (named SlHSBP1m) (translating to KD = 6µM) were predicted. These results suggest a potential further stabilization of the oligomeric complex due to the Met to Ile substitution.
The localization of both the wild-type and mutated SlHSBP1 protein, which was N-terminally tagged with GFP, was examined in control (non-stressed) and HS protoplasts (Figure 2). Under non-stress conditions, both proteins were localized in the cytosol (Figure 2a), while after 1 hour of HS (Figure 2b) and during the following recovery (Figure 2c), SlHSBP1 and mutated SlHSBP1 (HSBP1m) showed nucleocytoplasmic distribution. These results are in agreement with the nuclear translocation of AtHSBP1 in stressed cells [41], and demonstrate that the translocation is not affected by the Met to Ile mutation (Figure 2).
We further inspected the effect of the mutation on the functionality of SlHSBP1. HA-tagged SlHSBP1 and HSBP1m were expressed in protoplasts, which were either kept at 25 °C (C), or exposed to 40 °C for 1 hour (HS) and then returned to 25 °C for another 1.5 hours (HR) (Figure 3a). Protoplasts expressing SlHSBP1 accumulated levels of HsfA2 and Hsp70-5, which was similar to the mock sample not overexpressing any HSBP protein after HS, but had significantly lower levels of both genes in the recovery samples (Figure 3a). Interestingly, HsfA2 and Hsp70-5 showed increased levels in stressed protoplasts expressing SlHSBP1m when compared to SlHSBP1-expressing cells or to mock stressed samples (Figure 3a). On the basis of these results, we can infer that SlHSBP1m has a stimulatory effect during HS, and is also less inhibitory under recovery than the wild-type protein.
HSBP1 is a negative regulator of Hsfs, as shown in other plants [41,43,44]. Therefore, we examined the effect of SlHSBP1 and SlHSBP1m on the activity of the two major tomato Hsfs, namely HsfA1a and HsfA2, using a GUS activity assay with the PHsp17-CI::GUS reporter construct (Figure 3b). In parallel, we used HsfB1 as control since, on one hand—according to the current model—HSBP only regulates HsfA-type proteins [41,43]. However, on the other hand, HsfB1 is also a co-activator of HsfA1a [61]. Neither SlHSBP1 nor SlHSBP1m caused a significant reduction in the transactivation activity of HsfA1a and HsfA2, but also had neither had an effect on HsfB1. Interestingly, only SlHSBP1 had a negative effect on the activity of HsfA1a/HsfA2 and HsfA1a/HsfB1 complexes, while SlHSBP1m has no effect (Figure 3b).
A GUS repressor assay was used to further examine whether the observed reduced Hsf activity in the presence of SlHSBP1 is due to an altered Hsf DNA binding capacity (Figure 3c). Here, HSE3 has been cloned between the TATA box of the CaMV 35S promoter and the initiation codon of the GUS gene, and therefore, the binding of an Hsf to the HSE results in reduced GUS activity [53]. As previously established, HsfA1a, HsfA2, and HsfB1 bind to the used promoter (Figure 3c, white bar [36,38]). SlHSBP1, but not SlHSBP1m, reduced the DNA binding capacity of HsfA1a and HsfA2, and had no effect on HsfB1. Remarkably, both SlHSBP1 and SlHSBP1m caused a mild reduction in the DNA binding capacity of HsfA1a/HsfA2 and HsfA1a/HsfB1 complexes, which is consistent with the mild effect on the DNA binding of the individual Hsfs (Figure 3c).

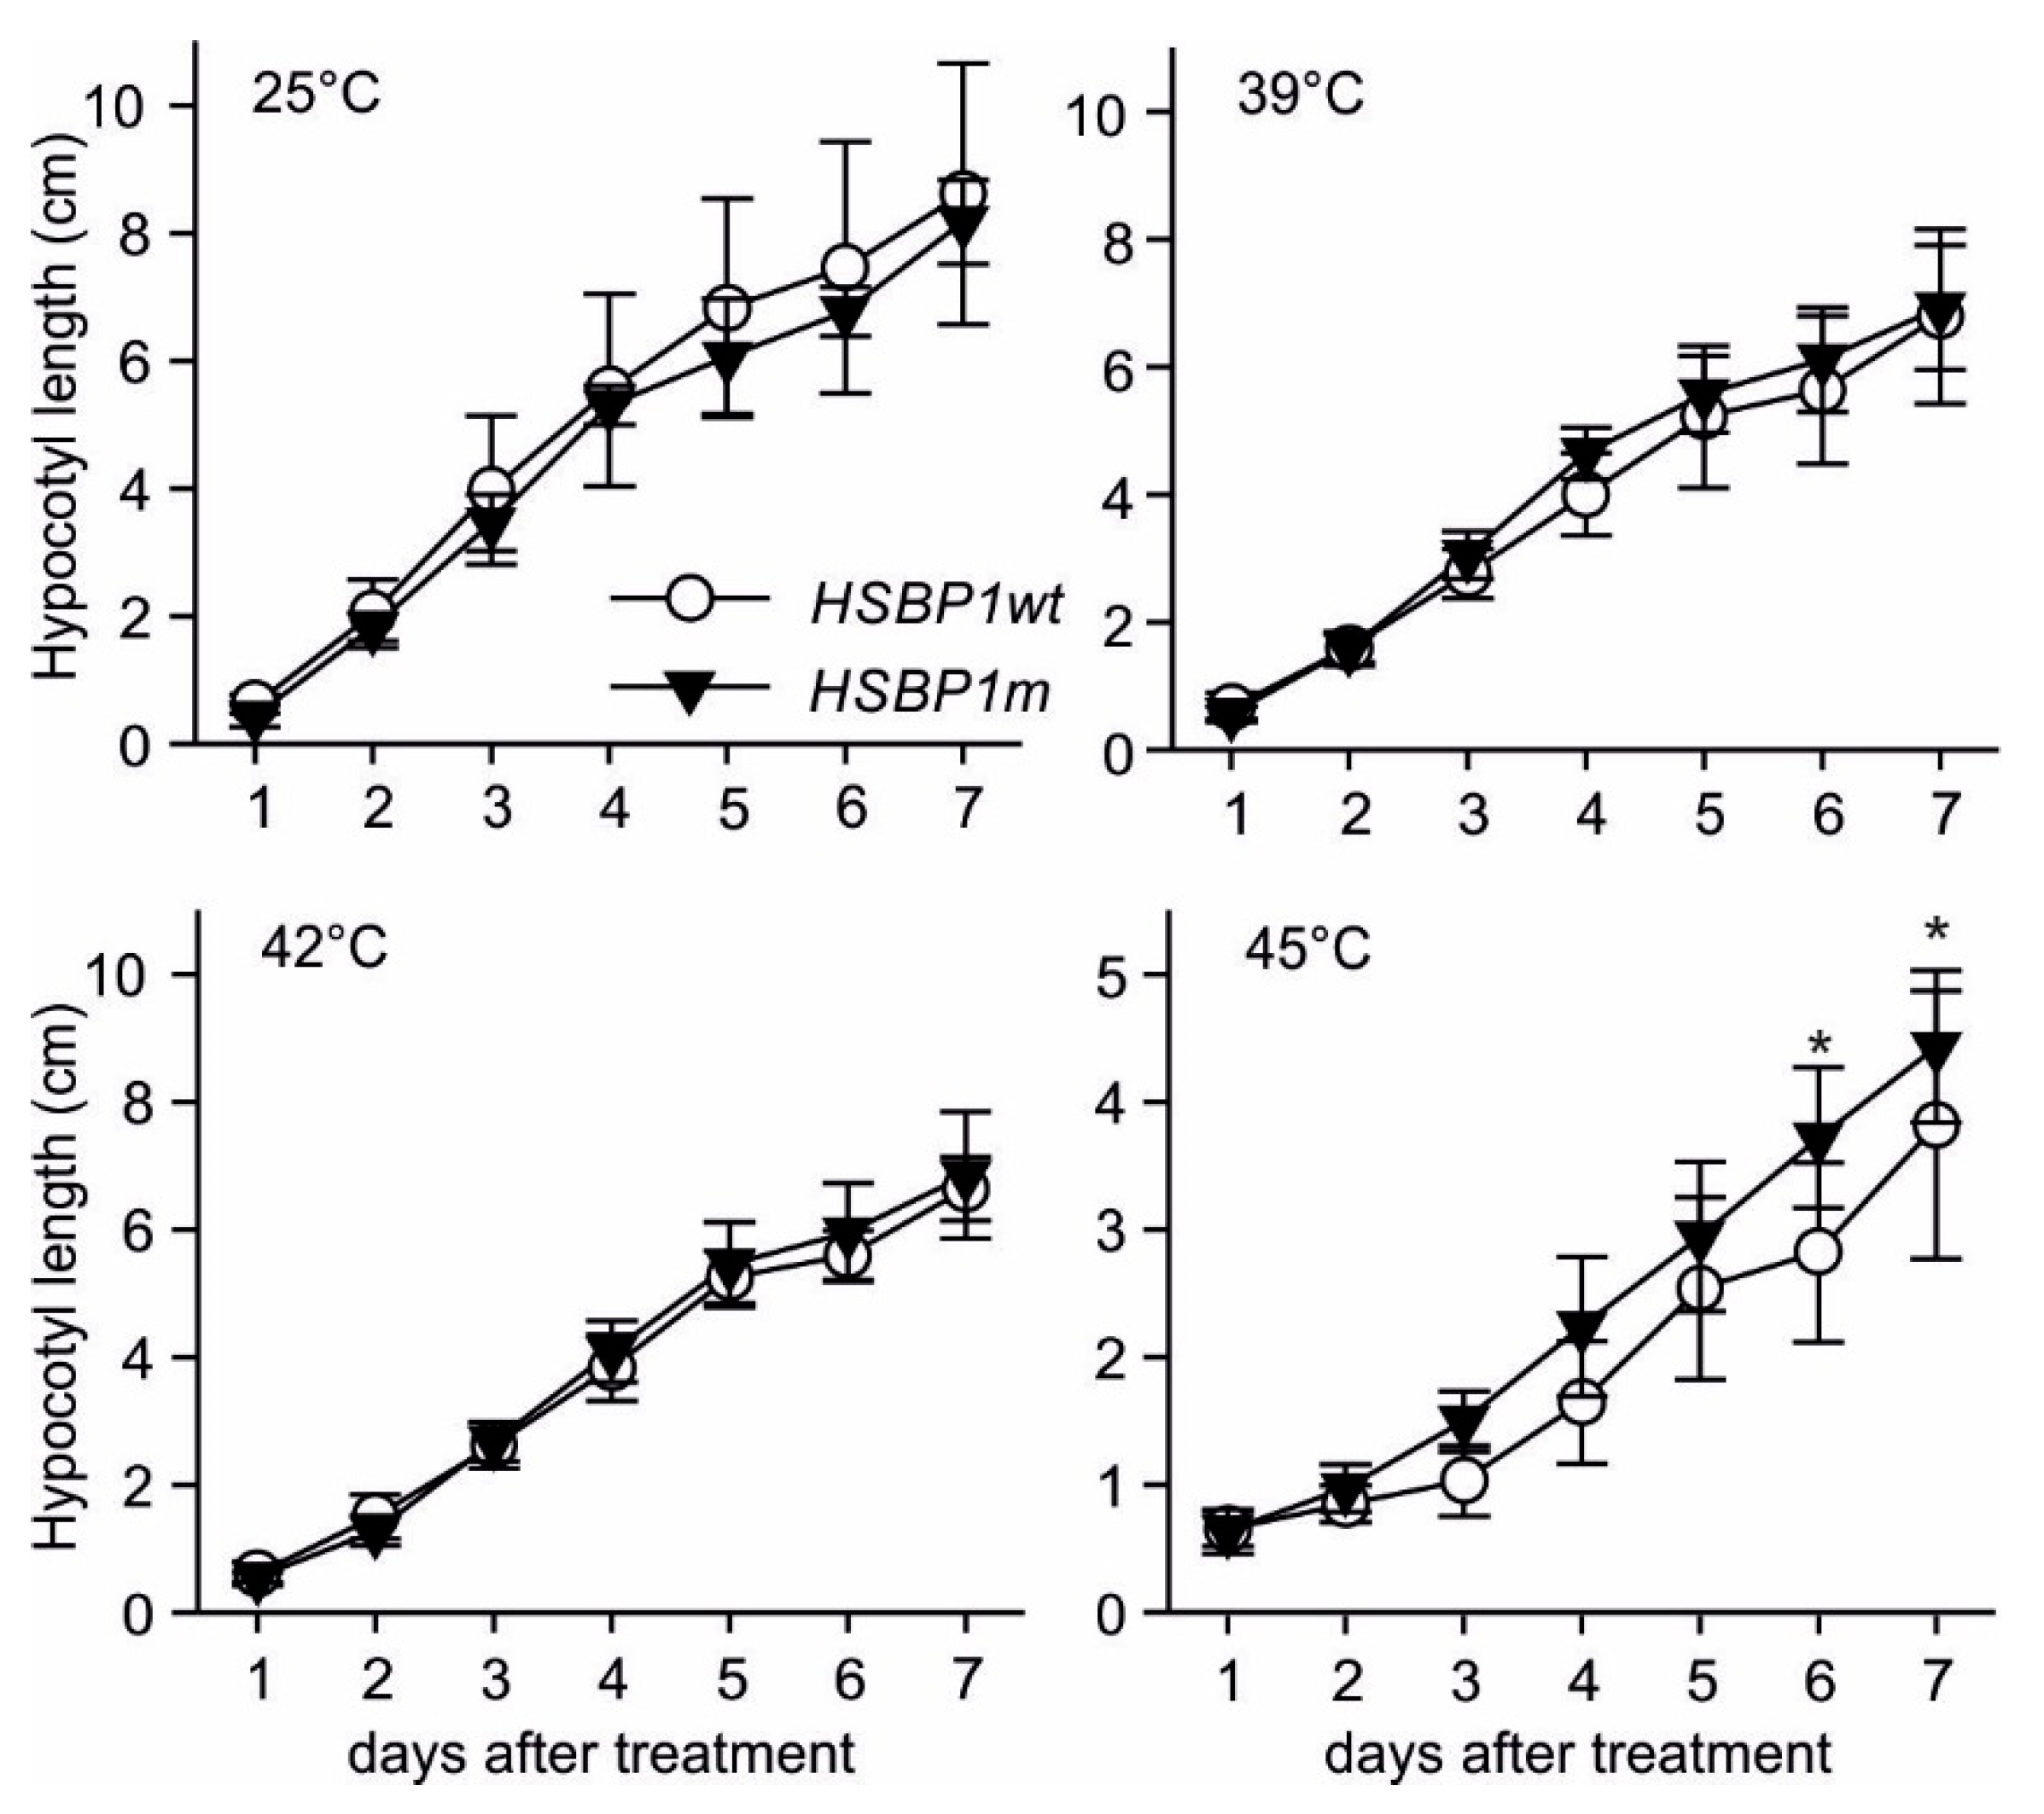
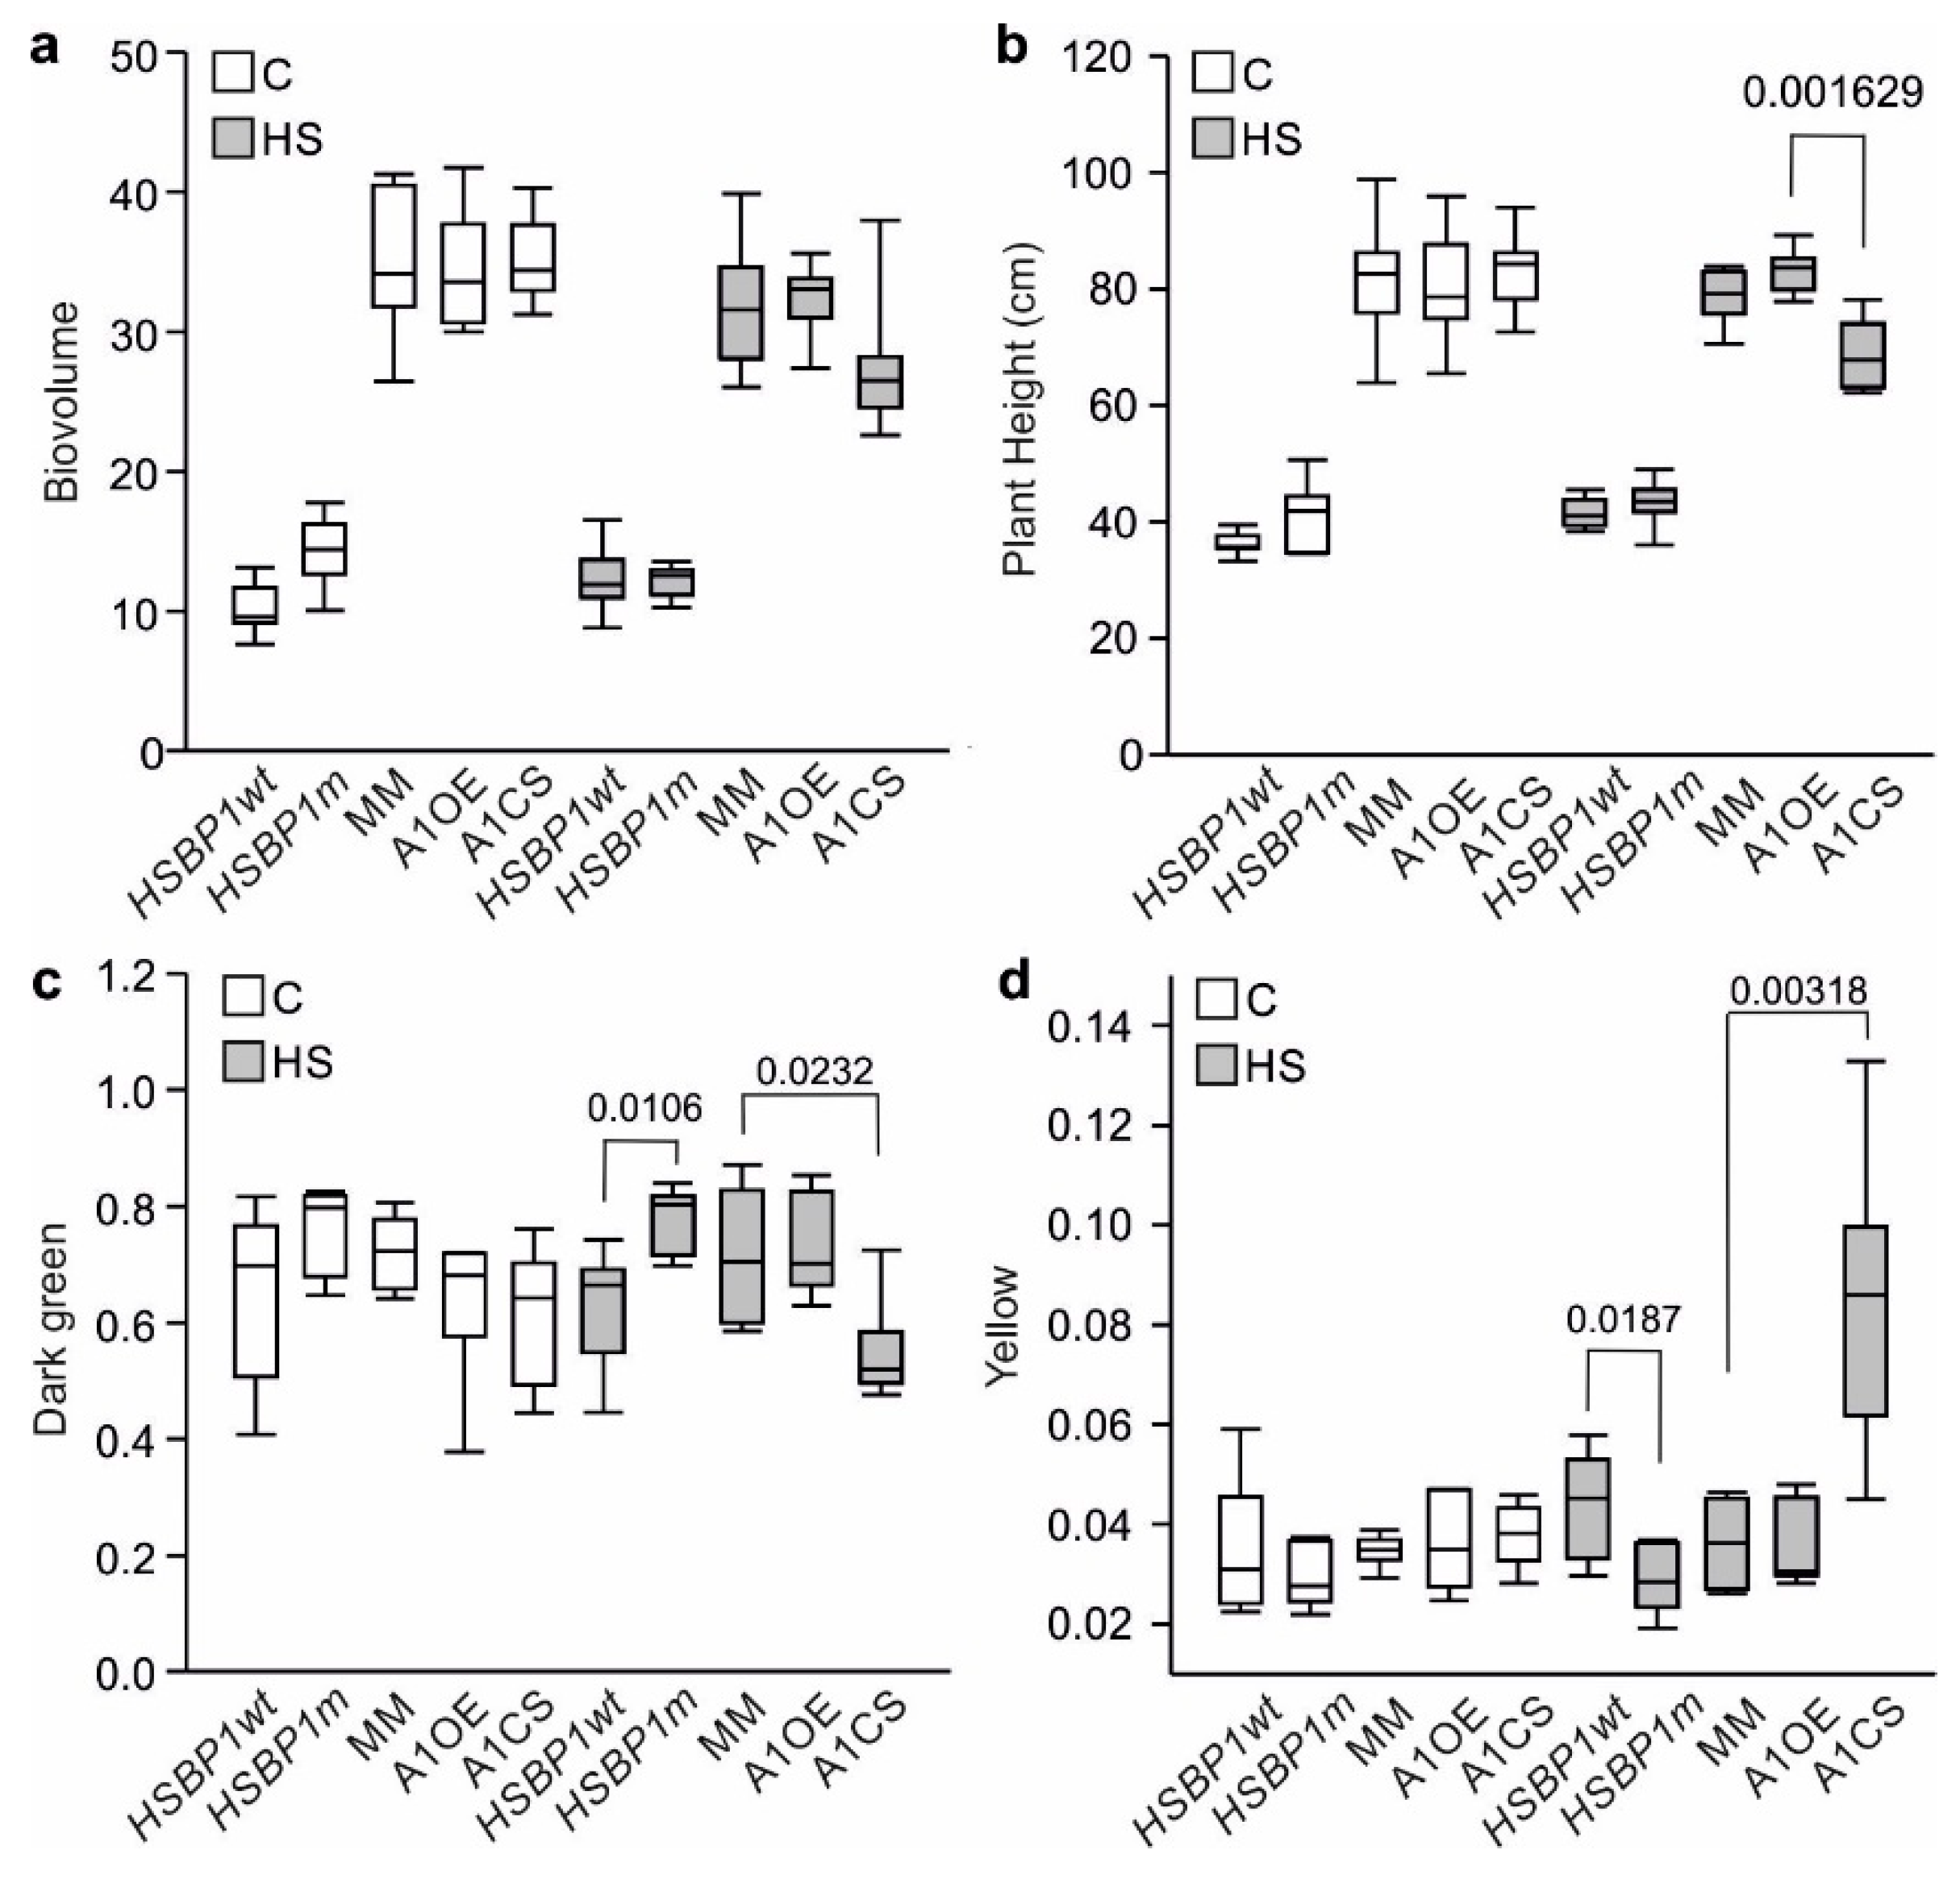
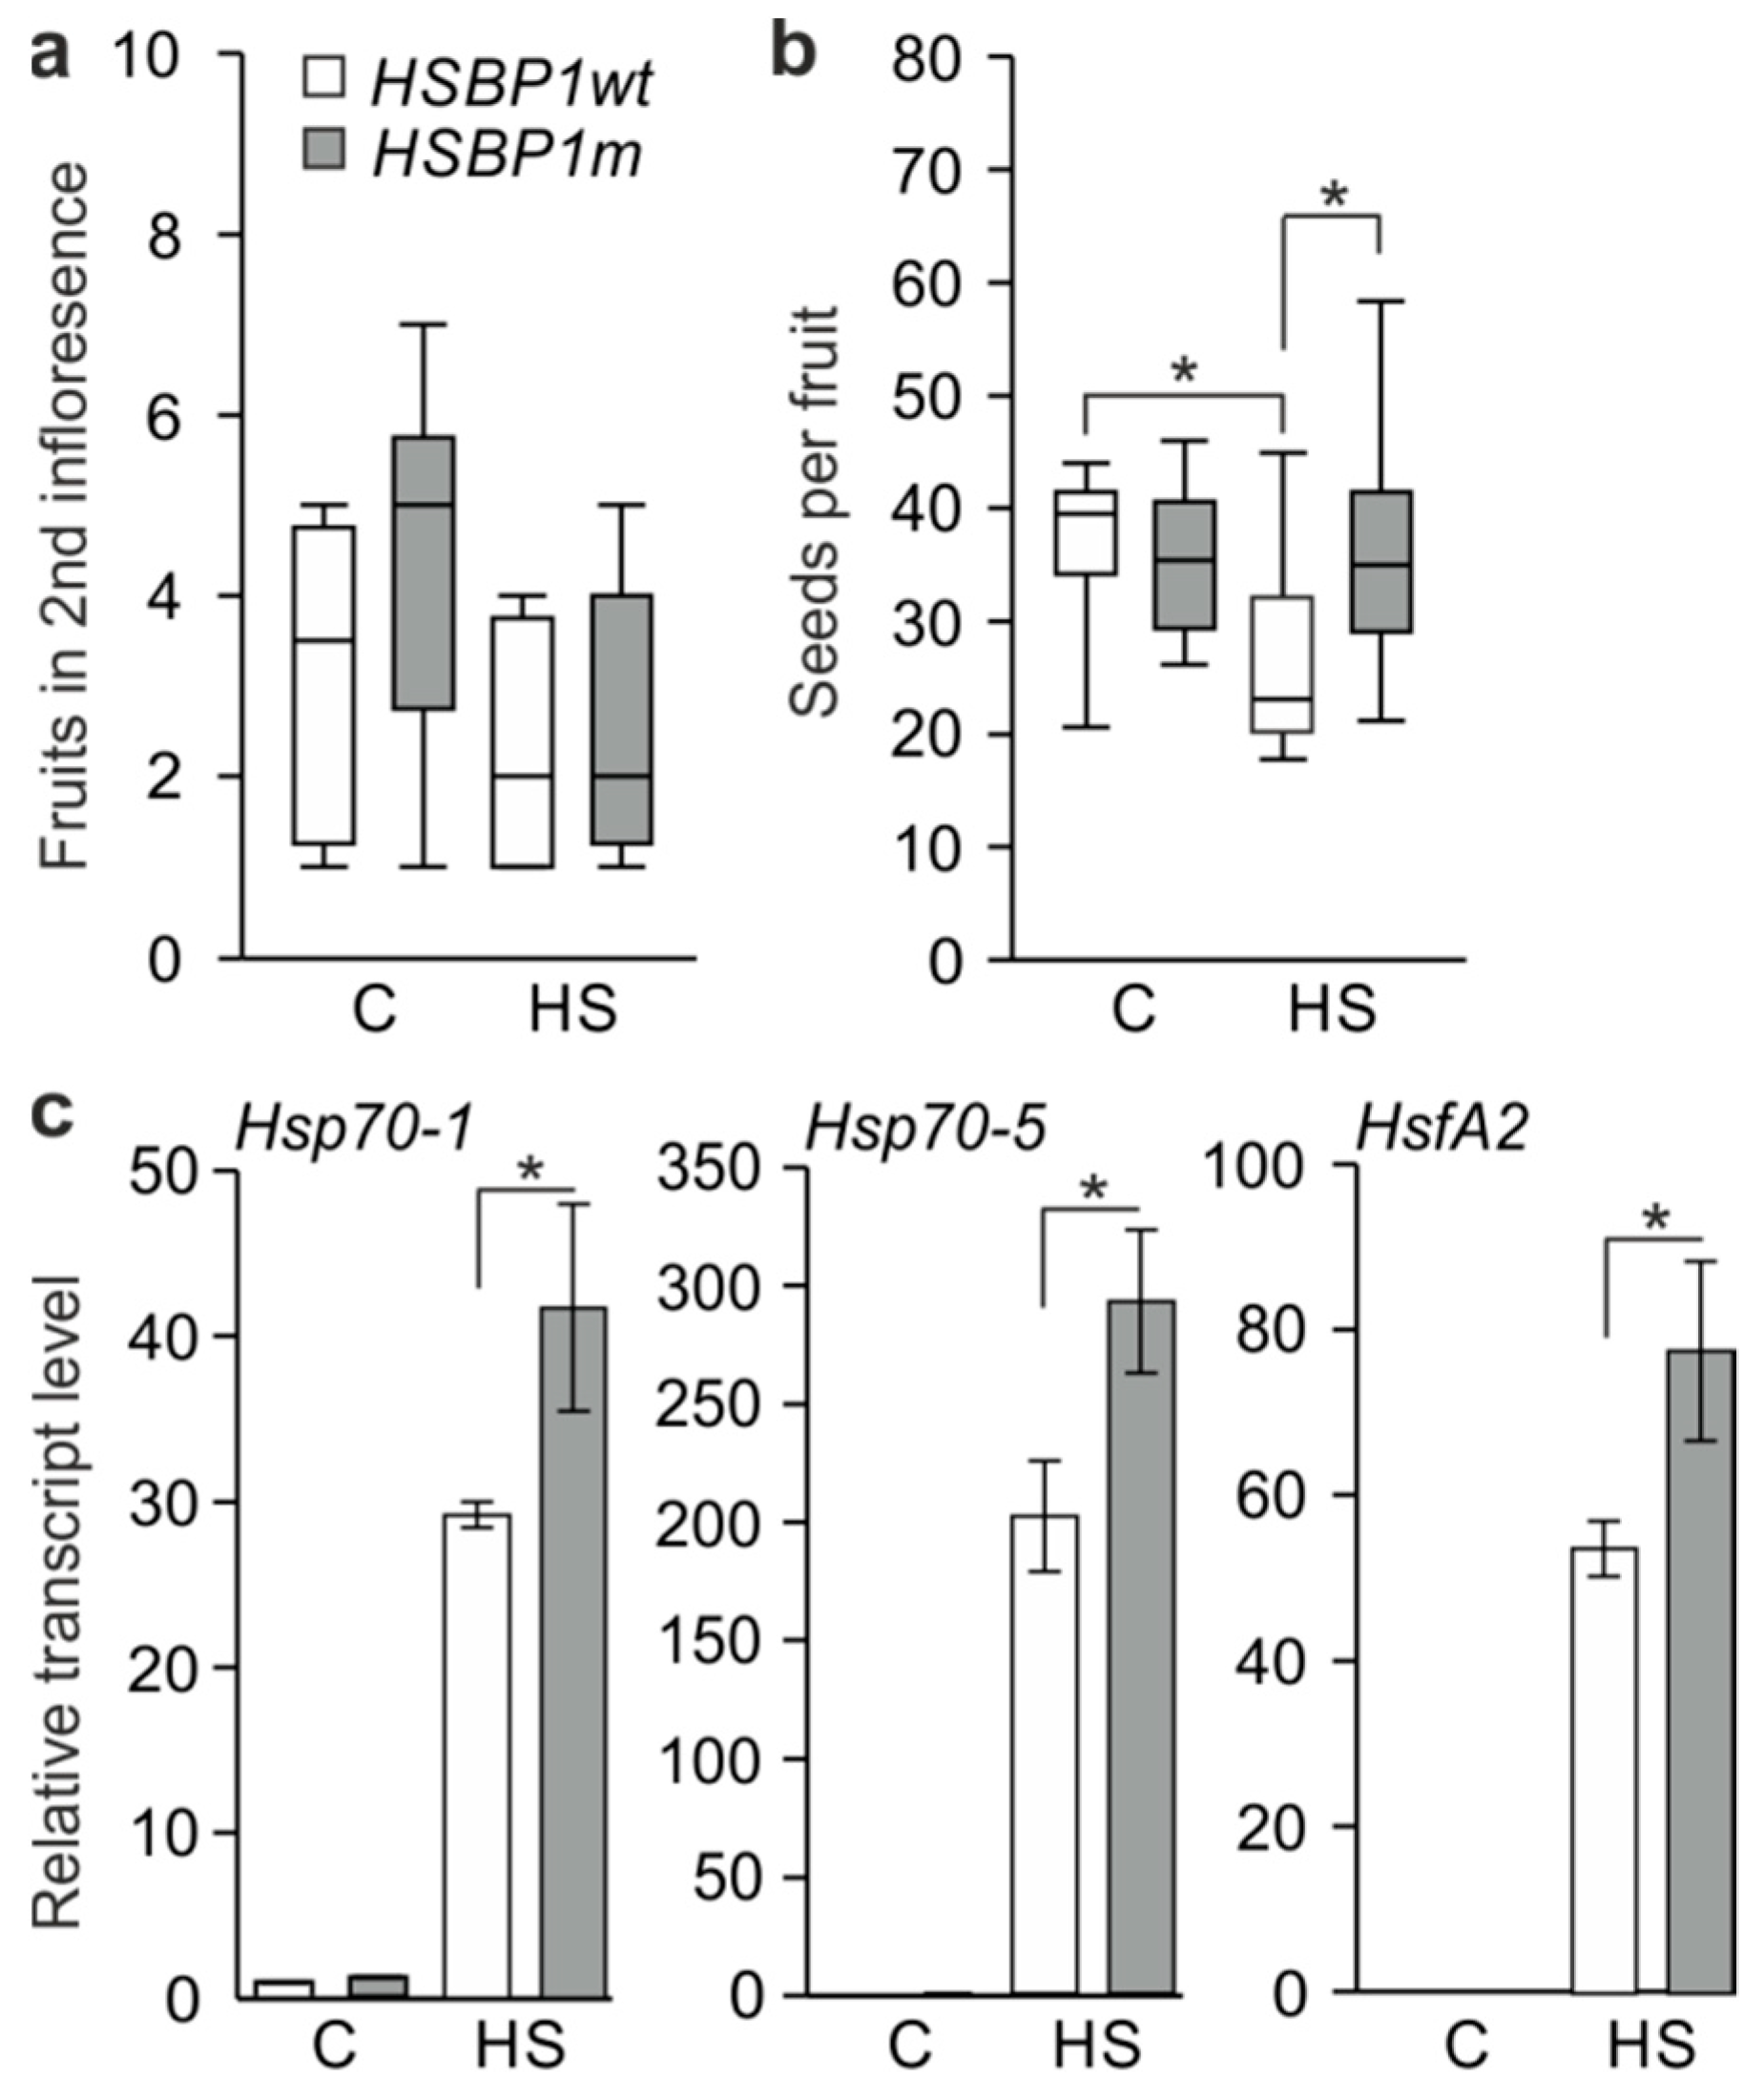
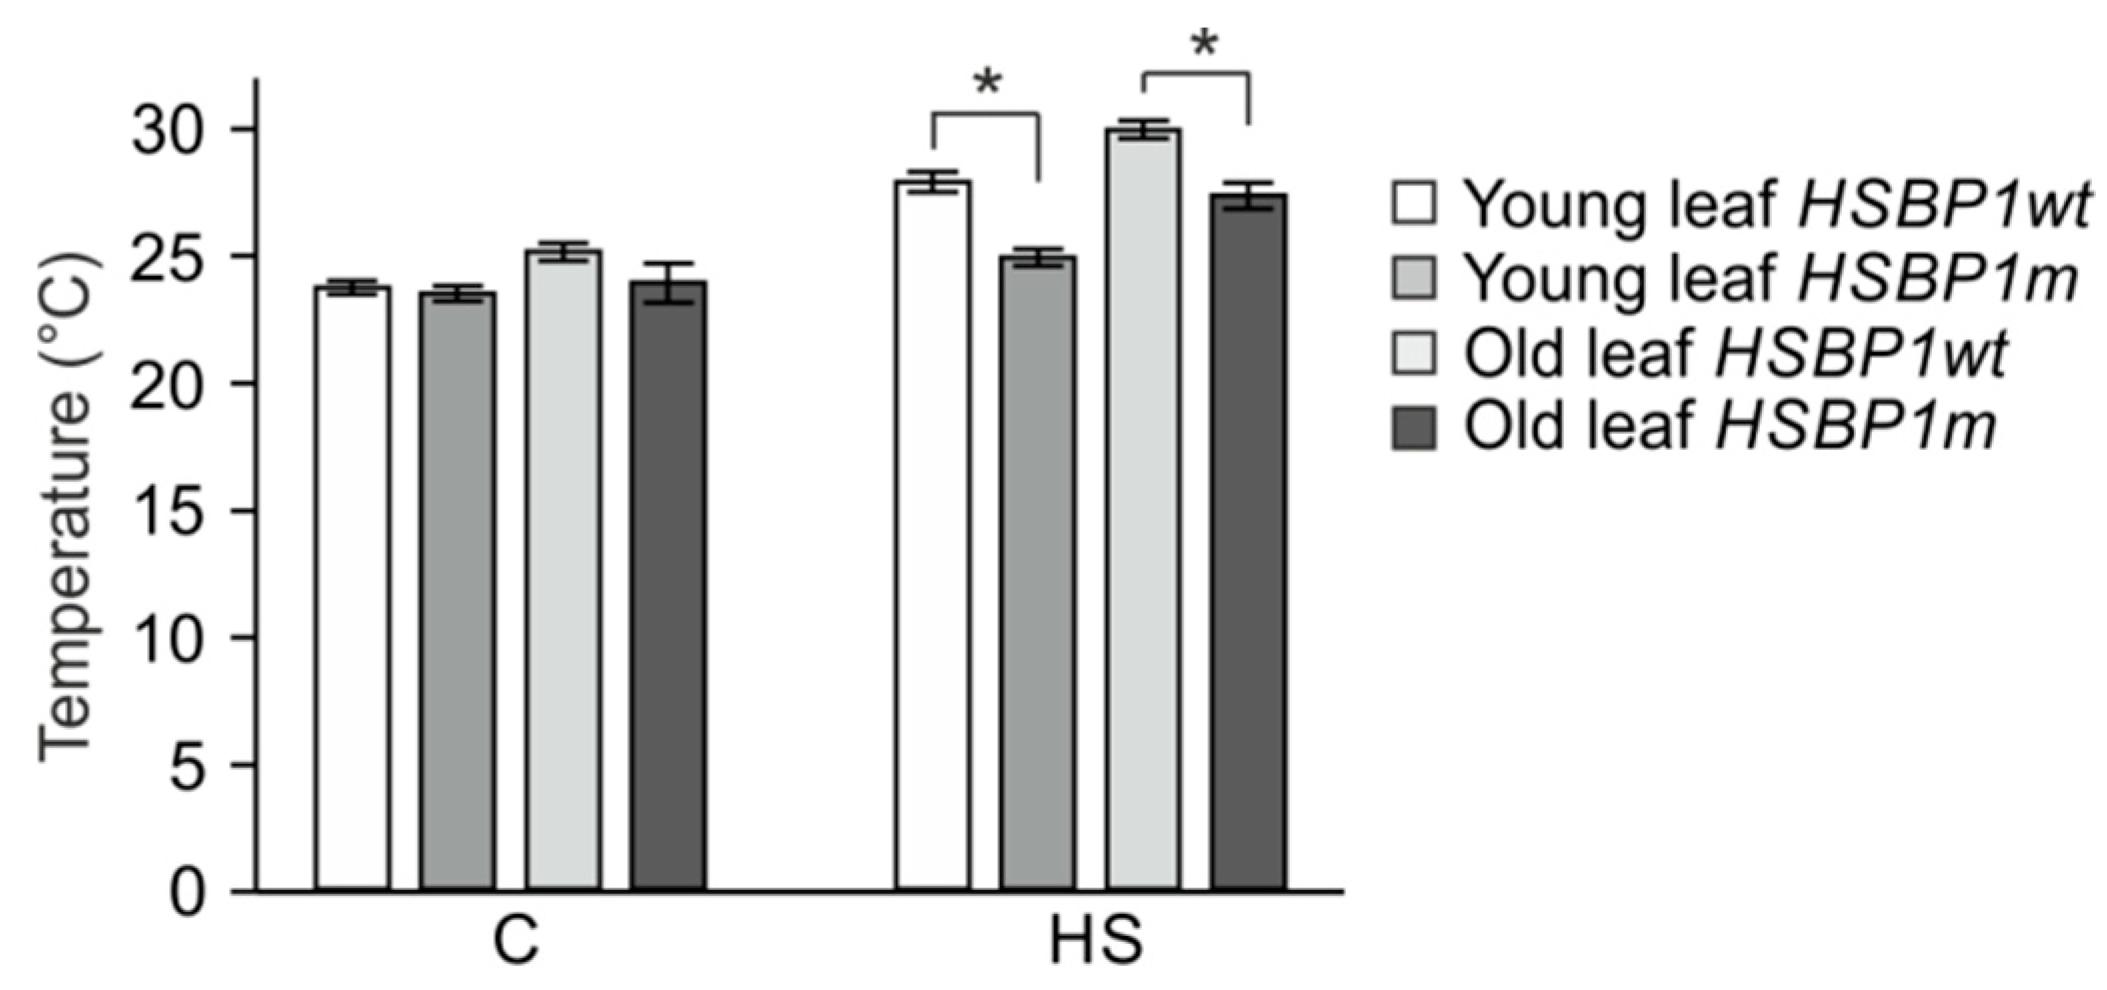
3.3. Thermotolerance of SlHSBP1 Plants

The experiments described in the previous sections provide evidence that the Met to Ile substitution, at position 45, has a significant effect on the functionality of SlHSBP1. Thus, we examined whether the mutation affects the capacity of plants to tolerate heat stress. To reduce the rate of background mutation in the tomato genome, the mutant line, which is homozygous for the HSBP1 G761A mutation, was backcrossed to the wild-type Red Setter. The BC1F2 segregant plants were selected for homozygosity in the wild-type (SlHSBP1wt) and mutated (SlHSBP1m) allele. BC1F3 tomato plants carrying the SlHSBP1wt or SlHSBP1m allele were used for thermotolerance experiments.
Four-day-old seedlings were exposed to different temperatures ranging from 25 to 45 °C for 1.5 hours; then, the hypocotyl elongation rate was determined for the following 7 days. SlHSBP1wt and SlHSBP1m seedlings showed a similar growth rate under non-stress or when exposed to 39 °C or 42 °C stress treatment (Figure 4). In turn, SlHSBP1m seedlings have an increased elongation rate after the 45 °C treatment when compared to SlHSBP1wt (Figure 4). Therefore, SlHSBP1m seedlings show higher tolerance to strong HS treatment.
Next, six-week-old plants were exposed to a 39 °C treatment for 1 hour for five consecutive days. Every day, various physiological parameters were recorded using the plant phenotyping platform. As controls, HsfA1a overexpression (A1OE) and co-suppression lines (A1CS) were included as well as their wild-type background cv. Moneymaker [22]. The experiment was figured out to verify whether the effect of the SlHSBP1 mutation was similar to the effect of HsfA1a in overexpression lines. Comparisons were made on one side between SlHSBP1wt and SlHSBP1m, and on the other side between the Moneymaker and HsfA1a transgenic lines.
Stressed and non-stressed SlHSBP1wt and SlHSBP1m plants did not show any significant differences in plant height or biovolume after 4 days, while only A1CS showed a significantly reduced height after 4 days of stress when compared to Moneymaker (Figure 5a,b). The dark green color is associated with healthy tissue, while yellow is an indicator of chlorosis [61]. No differences between the mutant and the transgenic lines were observed in non-stressed plants after 4 days of treatment (Figure 5c,d). Instead, SlHSBP1m shows a significantly higher dark green color and a lower yellow color compared to SlHSBP1wt (Figure 5c,d). A1OE has similar dark green and yellow values to Moneymaker, whilst A1CS shows a significantly reduced dark green and increased yellow color. These results indicate a higher thermotolerance for SlHSBP1m and enhanced thermosensitivity for A1CS. The latter gives strong indication that the thermotolerance in response to the applied stress treatment is Hsf-dependent.
Furthermore, after the treatment, the plants were allowed to grow under non-stress conditions, and the fruit set and seed number per fruit were recorded (Figure 6a,b). Although the fruit number was not affected by the treatment or by the mutation (Figure 6a), the number of seeds per fruit was significantly reduced in SlHSBP1wt-stressed plants but not in SlHSBP1m (Figure 6b). Overall, the SlHSBP1m plants exhibit increased thermotolerance compared to the SlHSBP1wt, which was probably due to the increased accumulation of Hsfs and Hsps.
The expression profiles of the stress-induced HsfA2, Hsp70-1, and Hsp70-5 were monitored in SlHSBP1wt and SlHSBP1m control and stressed leaves (Figure 6c). In all cases, the levels of the transcripts are higher in SlHSBP1m stressed leaves when compared to SlHSBP1wt, which is in agreement with the results described earlier using protoplasts, while no significant differences were detected for non-stressed samples between the lines.
Plants cool their canopies when exposed to high temperatures via transpiration; therefore, the maintenance of lower leaf temperature is a major protection mechanism against HS. Consequently, we monitored the leaf surface temperature of plants subjected to a gradual daily temperature increase that reached a maximum of 36 °C. Consistent with the higher thermotolerance observed with image analysis, heat-stressed SlHSBP1m young and old leaves were able to maintain a lower temperature when compared to SlHSBP1wt leaves (Figure 7).

4. Discussion

4.1. Characterization of Tomato HSBP1 Protein

HSBP is a well-studied protein in several eukaryotes with a conserved function as an Hsf repressor, and is therefore a potential target for manipulation and, subsequently potential breeding interest for crops. An orthology search revealed the presence of two putative orthologues of the A. thaliana HSBP gene in tomato (Figure 1; Figure S1), with SlHSBP1 showing the highest sequence homology and predicted structure similarity (Figure 1). SlHSBP-L has an extended N-terminal region that is also found in other plant HSBP orthologues, including Glycine max and Brassica rapa, but also a variable N-terminal region of the helix region compared to SlHSBP1 (Figure 1 and Figure 2). Interestingly, neither SlHSBP1 nor SlHSBP-L are heat stress-induced in leaves, which might indicate regulation at the post-transcriptional level or even induction in specific tissues and cell types (Figure 1). Under non-stress conditions, SlHSBP-L shows high transcription in old leaves and red ripe fruits, with both mature tissues progressing to senescence (Figure 1). However, at this stage, we cannot conclude on the possible functionality of SlHSBP-L, as it requires further studies.
SlHSBP1 shows enhanced transcription levels in reproductive tissue such as anthers, which is similar to the HSBP genes from other plants showing increased expression in siliques, embryos, and panicles [41,42,43,44]. We observed an accumulation of the GFP-tagged SlHSBP1 in the nucleus of protoplasts exposed to heat stress (Figure 2), which is consistent with the findings for AtHSBP1 [41]. Interestingly, in our recent study, the SlHSBP1 protein was identified in a proteomic analysis of leaves, and also showed no accumulation in response to heat stress, but was significantly reduced in both control and heat-stress leaves from transgenic HsfB1 knockdown plants [30]. Therefore, the regulation of SlHSBP1 in tomato seems to be different than in other plants.
It is of note that several Hsfs such as HsfA2 were expressed in anthers and early stages of pollen development in tomato, which could support a regulatory role of SlHSBP1 for the developmental regulation of Hsfs [14,26,62]. In agreement with this, we found a significant negative correlation between SlHSBP1 and several Hsfs in various tomato tissues and organs, supporting a potential negative regulatory function of SlHSBP1 for stress-induced but also developmentally regulated genes (Figure 1). Within this line, SlHSBP1 had a negative effect on DNA binding when HsfA1a and HsfA2 were expressed alone or in combination, while it did not affect HsfB1 function (Figure 3). These results are in agreement with previous studies where a repressor function of HSBP1 has been shown [41,43,44].
In contrast to this finding, several Hsp70 and Hsp90 genes—both stress-induced and constitutively expressed—showed a positive correlation in expression with SlHSBP1 (Figure 1). This indicates that SlHSBP1 belongs to the same regulatory module with Hsps, which might be Hsf-independent.
A Met-to-Ile exchange in the d position of a central heptad repeat is subtle, as both residues are hydrophobic and typically found in coiled-coil structures. Nevertheless, we observed an altered functionality for the SlHSBP1 mutant protein (SlHSBP1m). SlHSBP1m is mainly cytosolic, and accumulates under stress conditions in the nucleus as the wild-type protein (Figure 2). Therefore, the mutation does not affect the nucleocytoplasmic distribution of the protein. However, it has a weaker repressor effect on the transactivation activity of Hsf complexes (Figure 3).
HSBP builds functional hexamers that consist of two trimers [39,40]. We found by prediction that the mutation might have a stabilizing effect on the trimer. Although more biophysical information is required, based on this, one could suggest that HSBP1 forms a heterotrimer with the coiled-coil domain of the HsfA family proteins. A higher affinity for self-oligomerization would inhibit the regulatory function, which in turn results in higher activity for the HsfAs. Indeed, protoplasts expressing SlHSBP1m accumulated higher levels of HsfA2 and Hsp70-5 upon HS when compared to mock samples or SlHSBP1-expressing cells (Figure 3). Based on these results, we conclude that the mutation causes a partial loss of SlHSBP1 function.

4.2. SlHSBP1m Plants Exhibit Higher Thermotolerance

SlHSBP1m tomato plants show enhanced thermotolerance in response to a cycle of four days heat stress for 1 hour. Although the growth of the SlHSBP1m or SlHSBP1wt plants was not significantly affected during the treatment, the dark green color of the plants, which was indicative of the health of the tissue, was higher in SlHSBP1m plants, while the yellow color, which was indicative of reduced chlorophyll, was reduced when compared to SlHSBP1wt (Figure 5). These results are in agreement with the ability of SlHSBP1m leaves to maintain a lower leaf surface temperature, which was probably due to the enhanced transpiration rate, and can protect the photosynthetic apparatus from thermal damages (Figure 5). Furthermore, SlHSBP1m plants accumulated higher transcript levels of Hsp70-1, Hsp70-5, and HsfA2 as typically heat stress-induced genes (Figure 6). Remarkably, SlHSBP1m seedlings exhibited higher thermotolerance after an acute 45 °C stress compared to SlHSBP1wt seedlings, suggesting that SlHSBP1 is involved in basal thermotolerance (Figure 4).
In addition, SlHSBP1m plants produced a number of fruits similar to SlHSBP1wt but with a higher number of seeds (Figure 6). Considering that developing flower buds also received the stress during the time of the treatment, we can assume that the mutation in SlHSBP1 resulted in the enhanced protection of gametophytes. Altogether, these results point to a higher capacity of SlHSBP1m plants to withstand heat stress.
In conclusion, we were able to show that a tomato mutant genotype carrying a missense mutation in SlHSBP1 gene exhibits increased thermotolerance. In contrast to maize, the mutation does not cause significant developmental defects; therefore, this mutant line could be used in breeding programs for the generation of heat stress-resilient plants.

Supplementary Materials

The following are available online at https://www.mdpi.com/2073-4425/10/7/516/s1, Figure S1: Secondary structure of tomato HSBP proteins. Table S1: Oligonucleotides used in this study.

Author Contributions

Conceptualization, R.I., E.S. and S.F.; Data curation, S.S. and S.F.; Funding acquisition, R.I. and E.S.; Methodology, D.M., A.E., F.C., S.S. and A.P.; Supervision, R.I., E.S. and S.F.; Writing—original draft, D.M., E.S. and S.F.; Writing—review & editing, D.M., A.E.-s., F.C., S.S., A.P., R.I., E.S. and S.F.

Funding

This research was funded by SPOT-ITN/Marie-Curie, grant number 289220.

Acknowledgments

We would like to thank Klaus-Dieter Scharf for the useful suggestions, Yangjie Hu for assistance in microscopy, all members of the SPOT-ITN for their valuable comments, Francesco Cellini for his contribution to discussion and useful suggestions, and Giancarla Taddonio and Rosalba Grillo for their valuable technical assistance.

Conflicts of Interest

The authors declare no conflict of interest. The funders had no role in the design of the study; in the collection, analyses, or interpretation of data; in the writing of the manuscript, or in the decision to publish the results.

References

  1. Bokszczanin, K.L.; Fragkostefanakis, S. Perspectives on deciphering mechanisms underlying plant heat stress response and thermotolerance. Front. Plant Sci. 2013, 4, 315. [Google Scholar] [CrossRef] [PubMed]
  2. Wahid, A.; Gelani, S.; Ashraf, M.; Foolad, M. Heat tolerance in plants: An overview. Environ. Exp. Bot. 2007, 61, 199–223. [Google Scholar] [CrossRef]
  3. Mittler, R.; Finka, A.; Goloubinoff, P. How do plants feel the heat? Trends Biochem. Sci. 2012, 37, 118–125. [Google Scholar] [CrossRef] [PubMed]
  4. Rieu, I.; Twell, D.; Firon, N. Pollen Development at High Temperature: From Acclimation to Collapse. Plant Physiol. 2017, 173, 1967–1976. [Google Scholar] [CrossRef] [PubMed] [Green Version]
  5. Müller, F.; Xu, J.; Kristensen, L.; Wolters-Arts, M.; De Groot, P.F.M.; Jansma, S.Y.; Mariani, C.; Park, S.; Rieu, I. High-temperature-induced defects in tomato (Solanum lycopersicum) anther and pollen development are associated with reduced expression of B-class floral patterning genes. PLoS ONE 2016, 11, e0167614. [Google Scholar] [CrossRef] [PubMed]
  6. Firon, N.; Shaked, R.; Peet, M.M.; Pharr, D.M.; Zamski, E.; Rosenfeld, K.; Althan, L.; Pressman, E. Pollen grains of heat tolerant tomato cultivars retain higher carbohydrate concentration under heat stress conditions. Sci. Hortic. 2006, 109, 212–217. [Google Scholar] [CrossRef]
  7. Sato, S.; Peet, M.M.; Thomas, J.F. Physiological factors limit fruit set of tomato (Lycopersicon esculentum Mill.) under chronic, mild heat stress. Plant Cell Environ. 2000, 23, 719–726. [Google Scholar] [CrossRef]
  8. Hartl, F.U.; Bracher, A.; Hayer-Hartl, M. Molecular chaperones in protein folding and proteostasis. Nature 2011, 475, 324–332. [Google Scholar] [CrossRef]
  9. Fragkostefanakis, S.; Simm, S.; Paul, P.; Bublak, D.; Scharf, K.D.; Schleiff, E. Chaperone network composition in Solanum lycopersicum explored by transcriptome profiling and microarray meta-analysis. Plant Cell Environ. 2015, 38, 693–709. [Google Scholar] [CrossRef]
  10. Keller, M.; Consortium, S.; Simm, S. The coupling of transcriptome and proteome adaptation during development and heat stress response of tomato pollen. BMC Genom. 2018, 19, 447. [Google Scholar] [CrossRef]
  11. Liu, H.-C.; Charng, Y.-Y. Common and Distinct Functions of Arabidopsis Class A1 and A2 Heat Shock Factors in Diverse Abiotic Stress Responses and Development. Plant Physiol. 2013, 163, 276–290. [Google Scholar] [CrossRef] [PubMed] [Green Version]
  12. Iwata, Y.; Sakiyama, M.; Lee, M.H.; Koizumi, N. Transcriptomic response of Arabidopsis thaliana to tunicamycin-induced endoplasmic reticulum stress. Plant Biotechnol. 2010, 27, 161–171. [Google Scholar] [CrossRef] [Green Version]
  13. Jiang, J.; Liu, X.; Liu, C.; Liu, G.; Li, S.; Wang, L. Integrating Omics and Alternative Splicing Reveals Insights into Grape Response to High Temperature. Plant Physiol. 2017, 173, 1502–1518. [Google Scholar] [CrossRef] [PubMed] [Green Version]
  14. Frank, G.; Pressman, E.; Ophir, R.; Althan, L.; Shaked, R.; Freedman, M.; Shen, S.; Firon, N. Transcriptional profiling of maturing tomato (Solanum lycopersicum L.) microspores reveals the involvement of heat shock proteins, ROS scavengers, hormones, and sugars in the heat stress response. J. Exp. Bot. 2009, 60, 3891–3908. [Google Scholar] [CrossRef] [PubMed]
  15. Queitsch, C.; Hong, S.W.; Vierling, E.; Lindquist, S. Heat shock protein 101 plays a crucial role in thermotolerance in Arabidopsis. Plant Cell 2000, 12, 479–492. [Google Scholar] [CrossRef] [PubMed]
  16. Mishra, R.C.; Grover, A. ClpB/Hsp100 proteins and heat stress tolerance in plants. Crit. Rev. Biotechnol. 2015, 36, 862–874. [Google Scholar] [CrossRef] [PubMed]
  17. McLoughlin, F.; Basha, E.; Fowler, M.E.; Kim, M.; Bordowitz, J.; Katiyar-Agarwal, S.; Vierling, E. Class I and II small heat-shock proteins protect protein translation factors during heat stress. Plant Physiol. 2016, 172, 1221–1236. [Google Scholar] [CrossRef] [Green Version]
  18. Scharf, K.D.; Berberich, T.; Ebersberger, I.; Nover, L. The plant heat stress transcription factor (Hsf) family: Structure, function and evolution. Biochim. Biophys. Acta 2012, 1819, 104–119. [Google Scholar] [CrossRef]
  19. Berz, J.; Simm, S.; Schuster, S.; Scharf, K.; Schleiff, E.; Ebersberger, I. HEATSTER: A Database and Web Server for Identification and Classification of Heat Stress Transcription Factors in Plants. Bioinform. Biol. Insights 2019, 13. [Google Scholar] [CrossRef] [Green Version]
  20. Nover, L.; Bharti, K.; Döring, P.; Mishra, S.K.; Ganguli, A.; Scharf, K.D. Arabidopsis and the heat stress transcription factor world: How many heat stress transcription factors do we need? Cell Stress Chaperones 2001, 6, 177–189. [Google Scholar] [CrossRef]
  21. von Koskull-Döring, P.; Scharf, K.-D.; Nover, L. The diversity of plant heat stress transcription factors. Trends Plant Sci. 2007, 12, 452–457. [Google Scholar] [CrossRef] [PubMed]
  22. Mishra, S.K.; Tripp, J.; Winkelhaus, S.; Tschiersch, B.; Theres, K.; Nover, L.; Scharf, K.-D. In the complex family of heat stress transcription factors, HsfA1 has a unique role as master regulator of thermotolerance in tomato. Genes Dev. 2002, 16, 1555–1567. [Google Scholar] [CrossRef] [PubMed] [Green Version]
  23. Liu, H.C.; Liao, H.T.; Charng, Y.Y. The role of class A1 heat shock factors (HSFA1s) in response to heat and other stresses in Arabidopsis. Plant Cell Environ. 2011, 34, 738–751. [Google Scholar] [CrossRef] [PubMed]
  24. Schramm, F.; Ganguli, A.; Kiehlmann, E.; Englich, G.; Walch, D.; Von Koskull-Döring, P. The heat stress transcription factor HsfA2 serves as a regulatory amplifier of a subset of genes in the heat stress response in Arabidopsis. Plant Mol. Biol. 2006, 60, 759–772. [Google Scholar] [CrossRef] [PubMed]
  25. Charng, Y.-Y.; Liu, H.-C.; Liu, N.-Y.; Chi, W.-T.; Wang, C.-N.; Chang, S.-H.; Wang, T.-T. A Heat-Inducible Transcription Factor, HsfA2, Is Required for Extension of Acquired Thermotolerance in Arabidopsis. Plant Physiol. 2006, 143, 251–262. [Google Scholar] [CrossRef] [PubMed] [Green Version]
  26. Fragkostefanakis, S.; Mesihovic, A.; Simm, S.; Paupière, M.J.; Hu, Y.; Paul, P.; Mishra, S.K.; Tschiersch, B.; Theres, K.; Bovy, A.; et al. HsfA2 Controls the Activity of Developmentally and Stress-Regulated Heat Stress Protection Mechanisms in Tomato Male Reproductive Tissues. Plant Physiol. 2016, 170, 2461–2477. [Google Scholar] [CrossRef]
  27. Bharti, K.; Von Koskull-Döring, P.; Bharti, S.; Kumar, P.; Tintschl-Körbitzer, A.; Treuter, E.; Nover, L. Tomato Heat Stress Transcription Factor HsfB1 Represents a Novel Type of General Transcription Coactivator with a Histone-Like Motif Interacting with the Plant CREB Binding Protein Ortholog HAC1. Plant Cell 2004, 16, 1521–1535. [Google Scholar] [CrossRef] [PubMed]
  28. Ikeda, M.; Mitsuda, N.; Ohme-Takagi, M. Arabidopsis HsfB1 and HsfB2b act as repressors of the expression of heat-inducible Hsfs but positively regulate the acquired thermotolerance. Plant Physiol. 2011, 157, 1243–1254. [Google Scholar] [CrossRef]
  29. Kumar, M.; Busch, W.; Birke, H.; Kemmerling, B.; Nürnberger, T.; Schöffl, F. Heat shock factors HsfB1 and HsfB2b are involved in the regulation of Pdf1.2 expression and pathogen resistance in Arabidopsis. Mol. Plant 2009, 2, 152–165. [Google Scholar] [CrossRef]
  30. Fragkostefanakis, S.; Simm, S.; El-Shershaby, A.; Hu, Y.; Bublak, D.; Mesihovic, A.; Darm, K.; Mishra, S.K.; Tschiersch, B.; Theres, K.; et al. The repressor and co-activator HsfB1 regulates the major heat stress transcription factors in tomato. Plant Cell Environ. 2018, 42, 874–890. [Google Scholar] [CrossRef] [PubMed]
  31. Wunderlich, M.; Groß-Hardt, R.; Schöffl, F. Heat shock factor HSFB2a involved in gametophyte development of Arabidopsis thaliana and its expression is controlled by a heat-inducible long non-coding antisense RNA. Plant Mol. Biol. 2014, 85, 541–550. [Google Scholar] [CrossRef] [PubMed] [Green Version]
  32. Margaritopoulou, T.; Kryovrysanaki, N.; Megkoula, P.; Prassinos, C.; Samakovli, D.; Milioni, D.; Hatzopoulos, P. HSP90 canonical content organizes a molecular scaffold mechanism to progress flowering. Plant J. 2016, 87, 174–187. [Google Scholar] [CrossRef] [PubMed]
  33. Meiri, D.; Breiman, A. Arabidopsis ROF1 (FKBP62) modulates thermotolerance by interacting with HSP90.1 and affecting the accumulation of HsfA2-regulated sHSPs. Plant J. 2009, 59, 387–399. [Google Scholar] [CrossRef] [PubMed]
  34. Meiri, D.; Tazat, K.; Cohen-Peer, R.; Farchi-Pisanty, O.; Aviezer-Hagai, K.; Avni, A.; Breiman, A. Involvement of arabidopsis ROF2 (FKBP65) in thermotolerance. Plant Mol. Biol. 2010, 72, 191–203. [Google Scholar] [CrossRef]
  35. Ohama, N.; Kusakabe, K.; Mizoi, J.; Zhao, H.; Kidokoro, S.; Koizumi, S.; Takahashi, F.; Ishida, T.; Yanagisawa, S.; Shinozaki, K.; et al. The transcriptional cascade in the heat stress response of Arabidopsis is strictly regulated at the expression levels of transcription factors. Plant Cell 2016, 28, 181–201. [Google Scholar] [CrossRef]
  36. Hahn, A.; Bublak, D.; Schleiff, E.; Scharf, K.-D. Crosstalk between Hsp90 and Hsp70 chaperones and heat stress transcription factors in tomato. Plant Cell 2011, 23, 741–755. [Google Scholar] [CrossRef] [PubMed]
  37. Baniwal, S.K.; Bharti, K.; Chan, K.Y.; Fauth, M.; Ganguli, A.; Kotak, S.; Mishra, S.K.; Nover, L.; Port, M.; Scharf, K.D.; et al. Heat stress response in plants: A complex game with chaperones and more than twenty heat stress transcription factors. J. Biosci. 2004, 29, 471–487. [Google Scholar] [CrossRef]
  38. Röth, S.; Mirus, O.; Bublak, D.; Klaus-Dieter, S.; Schleiff, E. DNA-binding and repressor function are prerequisite for the turnover of the tomato heat stress transcription factor HsfB1. Plant J. 2016, 89, 31–44. [Google Scholar] [CrossRef]
  39. Fox, S.G.; Morimoto, R.I.; Satyal, S.H.; Chen, D.; Kramer, J.M. Negative regulation of the heat shock transcriptional response by HSBP1. Genes Dev. 2008, 12, 1962–1974. [Google Scholar]
  40. Liu, X.; Xu, L.; Liu, Y.; Tong, X.; Zhu, G.; Zhang, X.C.; Li, X.; Rao, Z. Crystal structure of the hexamer of human heat shock factor binding protein 1. Proteins Struct. Funct. Bioinforma. 2009, 75, 1–11. [Google Scholar] [CrossRef]
  41. Hsu, S.-F.; Lai, H.-C.; Jinn, T.-L. Cytosol-Localized Heat Shock Factor-Binding Protein, AtHSBP, Functions as a Negative Regulator of Heat Shock Response by Translocation to the Nucleus and Is Required for Seed Development in Arabidopsis. Plant Physiol. 2010, 153, 773–784. [Google Scholar] [CrossRef] [PubMed] [Green Version]
  42. Fu, S. empty pericarp2 Encodes a Negative Regulator of the Heat Shock Response and Is Required for Maize Embryogenesis. Plant Cell 2002, 14, 3119–3132. [Google Scholar] [CrossRef] [PubMed]
  43. Fu, S.; Rogowsky, Æ.P.; Nover, Æ.L.; Scanlon, M.J. The maize heat shock factor-binding protein paralogs EMP2 and HSBP2 interact non-redundantly with specific heat shock factors. Planta 2006, 224, 42–52. [Google Scholar] [CrossRef] [PubMed]
  44. Rana, R.M.; Dong, S.; Tang, H.; Ahmad, F.; Zhang, H. Functional analysis of OsHSBP1 and OsHSBP2 revealed their involvement in the heat shock response in rice (Oryza sativa L.). J. Exp. Bot. 2012, 63, 6003–6016. [Google Scholar] [CrossRef] [PubMed]
  45. Tomato, T.; Consortium, G. The tomato genome sequence provides insights into fleshy fruit evolution. Nature 2012, 485, 635–641. [Google Scholar] [Green Version]
  46. Minoia, S.; Cellini, F.; Bendahmane, A.; D’Onofrio, O.; Petrozza, A.; Carriero, F.; Piron, F.; Mosca, G.; Sozio, G. A new mutant genetic resource for tomato crop improvement by TILLING technology. BMC Res. Notes 2010, 3, 69. [Google Scholar] [CrossRef] [PubMed]
  47. Dalmais, M.; Schmidt, J.; Le Signor, C.; Moussy, F.; Burstin, J.; Savois, V.; Aubert, G.; Brunaud, V.; de Oliveira, Y.; Guichard, C.; et al. UTILLdb, a Pisum sativum in silico forward and reverse genetics tool. Genome Biol. 2008, 9, R43. [Google Scholar] [CrossRef]
  48. Triques, K.; Sturbois, B.; Gallais, S.; Dalmais, M.; Chauvin, S.; Clepet, C.; Aubourg, S.; Rameau, C.; Caboche, M.; Bendahmane, A. Characterization of Arabidopsis thaliana mismatch specific endonucleases: Application to mutation discovery by TILLING in pea. Plant J. 2007, 51, 1116–1125. [Google Scholar] [CrossRef]
  49. Ng, P.C.; Henikoff, S. SIFT: Predicting amino acid changes that affect protein function. Nucleic Acids Res. 2003, 31, 3812–3814. [Google Scholar] [CrossRef]
  50. Mazzucato, A.; Cellini, F.; Bouzayen, M.; Zouine, M.; Mila, I.; Minoia, S.; Petrozza, A.; Picarella, M.E.; Ruiu, F.; Carriero, F. A TILLING allele of the tomato Aux/IAA9 gene offers new insights into fruit set mechanisms and perspectives for breeding seedless tomatoes. Mol. Breed. 2015, 35, 22. [Google Scholar] [CrossRef]
  51. Petrozza, A.; Santaniello, A.; Summerer, S.; Di Tommaso, G.; Di Tommaso, D.; Paparelli, E.; Piaggesi, A.; Perata, P.; Cellini, F. Physiological responses to Megafol® treatments in tomato plants under drought stress: A phenomic and molecular approach. Sci. Hortic. 2014, 174, 185–192. [Google Scholar] [CrossRef]
  52. Eberius, M.; Lima-Guerra, J. High-throughput plant phenotyping-Data acquisition, transformation, and analysis. In Bioinformatics: Tools and Applications; Springer: New York, NY, USA, 2007; ISBN 9783540241669. [Google Scholar]
  53. Treuter, E.; Nover, L.; Ohme, K.; Scharf, K.D. Promoter specificity and deletion analysis of three heat stress transcription factors of tomato. Mol. Gen. Genet. 1993, 240, 113–125. [Google Scholar] [CrossRef] [PubMed]
  54. Chan-Schaminet, K.Y.; Baniwal, S.K.; Bublak, D.; Nover, L.; Scharf, K.-D. Specific interaction between tomato HsfA1 and HsfA2 creates hetero-oligomeric superactivator complexes for synergistic activation of heat stress gene expression. J. Biol. Chem. 2009, 284, 20848–20857. [Google Scholar] [CrossRef] [PubMed]
  55. Livak, K.J.; Schmittgen, T.D. Analysis of relative gene expression data using real-time quantitative PCR and. Methods 2001, 25, 402–408. [Google Scholar] [CrossRef] [PubMed]
  56. Missbach, S.; Weis, B.L.; Martin, R.; Simm, S.; Bohnsack, M.T.; Schleiff, E. 40S Ribosome Biogenesis Co-Factors Are Essential for Gametophyte and Embryo Development. PLoS ONE 2013, 8, e54084. [Google Scholar] [CrossRef] [PubMed]
  57. Zdobnov, E.M.; Tegenfeldt, F.; Kuznetsov, D.; Waterhouse, R.M.; Simao, F.A.; Ioannidis, P.; Seppey, M.; Loetscher, A.; Kriventseva, E.V. OrthoDB v9.1: Cataloging evolutionary and functional annotations for animal, fungal, plant, archaeal, bacterial and viral orthologs. Nucleic Acids Res. 2017, 45, D744–D749. [Google Scholar] [CrossRef] [PubMed]
  58. Yang, J.; Yan, R.; Roy, A.; Xu, D.; Poisson, J.; Zhang, Y. The I-TASSER suite: Protein structure and function prediction. Nat. Methods 2014, 12, 7–8. [Google Scholar] [CrossRef]
  59. Wood, C.W.; Woolfson, D.N. CCBuilder 2.0: Powerful and accessible coiled-coil modeling. Protein Sci. 2018, 27, 103–111. [Google Scholar] [CrossRef] [PubMed]
  60. Zouine, M.; Maza, E.; Djari, A.; Lauvernier, M.; Frasse, P.; Smouni, A.; Pirrello, J.; Bouzayen, M. TomExpress, a unified tomato RNA-Seq platform for visualization of expression data, clustering and correlation networks. Plant J. 2017, 92, 727–735. [Google Scholar] [CrossRef] [PubMed] [Green Version]
  61. Marko, D.; Briglia, N.; Summerer, S.; Petrozza, A.; Cellini, F.; Iannacone, R. High-Throughput Phenotyping in Plant Stress Response: Methods and Potential Applications to Polyamine Field. In Polyamines; Humana Press: New York, NY, USA, 2018; Volume 1694, pp. 373–388. ISBN 978-1-4939-7397-2. [Google Scholar]
  62. Giorno, F.; Wolters-Arts, M.; Grillo, S.; Scharf, K.D.; Vriezen, W.H.; Mariani, C. Developmental and heat stress-regulated expression of HsfA2 and small heat shock proteins in tomato anthers. J. Exp. Bot. 2010, 61, 453–462. [Google Scholar] [CrossRef]
Figure 1. Domain structure and expression analysis of tomato heat shock binding protein (HSBP) genes. (a) Amino acid sequence alignment of A. thaliana and tomato HSBP proteins by Clustal W. The coiled-coil region is depicted in grey background. Hydrophobic residues at the a and d positions are shown on top. (b) Transcript levels of tomato SlHSBP1 and SlHSBP-L in different organs. R: root; OL: old leaf; YL: young leaf; AN: anther; IG: immature green fruit; MG: mature green fruit; TU: turning fruit; RR: red ripe fruit. Analysis was done by qRT-PCR using EF1a as a housekeeping gene, and the transcript levels were normalized to the root sample. Values are the average of three replicates, and error bars indicate the standard deviation. Different letters denote significant differences (p < 0.05) based on ANOVA analysis and Duncan’s multiple range test. (c) Pearson correlation analysis of transcript levels of SlHSBP1 with heat shock transcription factors (Hsfs) and heat shock proteins (Hsps) in tomato organs and tissues. Transcript levels were obtained from the TOMEXPRESS database (n = 106). Asterisks indicate significance (* p < 0.05, ** p < 0.01 *** p < 0.001) (d) Transcript levels of SlHSBP1 and SlHSBP-L in young tomato leaves exposed to different temperatures for 1 hour. Values for panels b and d are the average of three biological replicates ± SD.
Genes 10 00516 g001
Figure 2. Subcellular localization of GFP-tagged HSBP1 (WT) and HSBP1m (m) proteins (a) before (control) and (b) after heat stress, or (c) during the recovery phase. Protoplasts were either kept at 25 °C or exposed to 40 °C for 1 hour (heat stress), and then allowed to recover for 1.5 hours at 25 °C. AF: chlorophyll autofluorescence. ENP1-mCherry is a nuclear marker protein. Scale bars are 5 μm.
Genes 10 00516 g002
Figure 3. Effect of SlHSBP1 and SlHSBP1m on properties of major Hsfs. (a) Transcript levels of HsfA2 and Hsp70-5 in protoplasts expressing SlHSBP1 or SlHSBP1m in comparison to mock samples. Protoplasts were either kept at 25 °C (control) or exposed to 40 °C for 1 hour (HS) and then allowed to recover for 1.5 hours at 25 °C (HR). Values are expressed relative to the mock control sample and are the average of three replicates and error bars are ±SE. EF1a was used for normalization. (b) The transactivation activity of single or combinations of HsfA1a, HsfA2, or HsfB1 in the presence of HSBP1 or HSBP1m. PHSP17-CI::GUS was used as reporter. (c) GUS repressor for elucidation of Hsf DNA binding capacity using the PCaMV 35S-HSE3::GUS reporter. The repression of activity is calculated relative to a sample where no Hsf was expressed for each HSBP1, HSBP1m, and mock control. Values are the average of three individual replicates ±SD. RFU: relative fluorescence unit. Different letters denote significant differences (p < 0.05) based on ANOVA analysis and Duncan’s multiple-range test.
Genes 10 00516 g003
Figure 4. Effect of heat stress on hypocotyl elongation of SlHSBP1wt and SlHSBP1m seedlings. Four-day-old seedlings were exposed to the indicated temperatures for one hour, and then allowed to grow for 7 days at 25 °C in the dark. Thermotolerance is estimated by the ability of seedlings to recover from stress based on their hypocotyl growth. Values are an average of 10 seedlings ±SD. Asterisks indicate significant difference (p < 0.05) between the two genotypes for the indicated day based on Student’s t-test.
Genes 10 00516 g004
Figure 5. Physiological parameters of control and heat-stressed tomato plants. (a) Biovolume, (b) Plant height, (c) Dark green, and (d) Yellow color of SlHSBP1wt, SlHSBP1m, Moneymaker (MM), A1OE, and A1CS plants kept either under control conditions (25 °C; C) for 4 days or exposed to 1 hour of heat shock (HS) at 39 °C every day. Measurements were conducted by a LemnaTec Scanalyzer 3D System. Box plots show the distribution of measurements from eight plants for each parameter as well as the median and the upper and lower quartiles. Statistical differences (p < 0.05) based on pairwise comparisons by Student’s t-test of the mutant or transgenic plants with SlHSBP1wt or Moneymaker, respectively, are indicated on top of the plots.
Genes 10 00516 g005
Figure 6. Thermotolerance of SlHSBP1wt and SlHSBP1m lines. (a) Number of fruits from the second trust and (b) number of seeds per fruit are shown in box plots, including the median and the upper and lower quartiles (n = 8) in control (non-stressed) and heat-stressed SlHSBP1wt and SlHSBP1m plants treated as described above. Asterisks indicate significant differences between the indicated samples, based on Student’s t-test (p < 0.05). (c) Transcript levels of Hsp70-1, Hsp70-5, and HsfA2 in control and heat-stressed SlHSBP1wt and SlHSBP1m plants. Expression values are normalized against the SlHSBP1wt control sample determined by qRT-PCR. Values are the average of three biological replicates ±SD. Asterisks denote a significant difference (p < 0.05) based on pairwise t-test analysis.
Genes 10 00516 g006
Figure 7. Effect of SlHSBP1 mutation on leaf surface temperature. Young and old leaf temperature of SlHSBP1wt and SlHSBP1m plants after a gradual exposure to HS that reached 36 °C at maximum or were kept at 25 °C for the same period as the control (sample C). Values are the average of eight plants from a representative experiment. Asterisks denote significant differences (p < 0.05) based on t-test analysis.
Genes 10 00516 g007

