Article

Comparative Transcriptomic Analysis of Subcutaneous Adipose Tissue from Local Pig Breeds

1
MED-Mediterranean Institute for Agriculture, Environment and Development, Instituto de Investigação e Formação Avançada & Universidade de Évora, Pólo da Mitra, Ap. 94, 7006-554 Évora, Portugal
2
Departamento de Mejora Genética Animal, Instituto Nacional de Investigación y Tecnología Agraria y Alimentaria (INIA), 28040 Madrid, Spain
3
MED & Departamento de Fitotecnia, Escola de Ciências e Tecnologia, Universidade de Évora, Pólo da Mitra, Ap. 94, 7006-554 Évora, Portugal
4
MED & Departamento de Medicina Veterinária, Escola de Ciências e Tecnologia, Universidade de Évora, Pólo da Mitra, Ap. 94, 7006-554 Évora, Portugal
5
MED & Departamento de Zootecnia, Escola de Ciências e Tecnologia, Universidade de Évora, Pólo da Mitra, Ap. 94, 7006-554 Évora, Portugal
*
Authors to whom correspondence should be addressed.
Submission received: 10 March 2020 / Revised: 7 April 2020 / Accepted: 11 April 2020 / Published: 15 April 2020
(This article belongs to the Section Animal Genetics and Genomics)

Abstract

:
When compared to modern lean-type breeds, Portuguese local Alentejano (AL) and Bísaro (BI) pig breeds present a high potential for subcutaneous and intramuscular fat (IMF) deposition which contributes for better meat quality. The aim of this work was to explore the genome function to better understand the underlying physiological mechanisms associated with body fat accretion. Dorsal subcutaneous fat samples were collected at slaughter from adult animals (n = 4 for each breed) with ~150 kg body weight. Total RNA was obtained and sequenced for transcriptome analysis using DESeq2. A total of 458 differentially expressed (DE) genes (q-value < 0.05) were identified, with 263 overexpressed in AL and 195 in BI. Key genes involved in de novo fatty acid biosynthesis, elongation and desaturation were upregulated in AL such as ACLY, FASN, ME1, ELOVL6 and SCD. A functional enrichment analysis of the DE genes was performed using Ingenuity Pathway Analysis. Cholesterol synthesis is suggested to be higher in AL via SREBF2, SCAP and PPARG, while lipolytic activity may be more active in BI through GH and AMPK signalling. Increased signalling of CD40 together with the predicted activation of INSIG1 and INSIG2 in BI suggests that this breed is more sensitive to insulin whereas the AL is less sensitive like the Iberian breed.

1. Introduction

Pork meat represents one of the main sources of protein, fat and iron for humans, accounting for about 30% of meat consumption worldwide. Fresh meat market is essentially dominated by a few genetically selected breeds with notable productive traits and raised under intensive conditions [1]. However, in the last decades, a growing interest for better meat quality has increased the tendency for native breeds to prosper [2,3]. These breeds are generally well adapted to the local environment and subsist in small populations with diversified and accessible food from natural resources. Alongside their inherent genetic value for biodiversity, local breeds are used to produce high quality dry-cured meat products, representing an important role in local economies, culture and landscape as the basics of sustainable local pork chains [2,4].
Alentejano (AL) and Bísaro (BI) are the two main Portuguese pig breeds. AL evolved from the primitive Sus scrofa mediterraneus, belongs to the Mediterranean group of breeds [5] and is genetically similar to the Iberian (IB) pig [6]. This breed is commonly raised in the south of Portugal and generally characterized by its light bone structure, black color, short and slim extremities and energetic nature [7]. A medium-sized pig, the AL grows at a low rate (except under the finishing phase “montanheira”) and presents a low prolificacy [8]. On the other hand, its high and early adipogenic activity provides a meat and fat composition that is attractive for both fresh meat market and for processing high-grade sausage and dry cured products [9,10]. Traditionally, the AL pig is raised under extensive conditions in an integrated pastoral system (“montado”) and during the fattening season is fed with acorns from the existing Quercus forests from October to February [5,7]. BI breed belongs to the Celtic group [5], sharing ancestors with highly productive breeds such as Large-White and Landrace. Production of BI is distributed throughout the north of Portugal, from the Tagus River to the northern border with Spain. It is characterized by its docile temperament, presenting a large body with large legs, head and shoulders. BI pig presents a higher prolificacy and productivity than AL, though lower than other genotypes with similar origins but raised under intensive production systems and subjected to genetic improvement programs [11,12,13,14]. On the other hand, the BI pig presents a lower adipogenic trend when compared to AL, but still higher than most modern lean breeds, which leads to a medium fat carcass with an overall good sensorial quality of meat and capability to further process into high-grade meat products [15,16]. Traditionally, BI production is based on small-scale family farms with a low number of sows, fed with domestic food scraps and horticultural by-products [17,18]. Nowadays, the number of sows per farm has increased, while reared by smallholders and in medium-sized farms based on free-ranged systems, most of them allowing access to pasture [19].
The old perception of adipocytes as a mere energy storage tissue is nowadays incomplete due to its extensive autocrine, paracrine and endocrine activities via liberation of various specific cytokines that modulate gene expression and nutrient flow to balance current metabolic needs [20]. Identification of these mechanisms and how they interact can help understand and treat associated metabolic diseases such as obesity and type-2 diabetes. Meanwhile, adipocyte size and number set the overall fatness attribute of a carcass that is essential for the marbling trait preferred by consumers which is described by the presence of an acceptable amount of intramuscular fat (IMF) [21]. Subcutaneous fat, on the other hand, is found beneath the skin in several layers separated by connective tissue, with the breeds overall potential for fat deposition affecting the full development of the most inner layer [21].
Lipid accumulation and further deposition precede a shift in the metabolic balance, favoring lipogenesis and adipogenesis over catabolic pathways such as β-oxidation and is consequence of an excessive caloric intake. The AL, as the Iberian pig and other Mediterranean breeds, feature a genetic predisposition to gain and preserve subcutaneous and IMF, referred as the thrifty genotype [22]. This susceptibility was historically advantageous when animals had to endure seasonal periods of starvation and the excess fat stores developed during periods of abundance were valuable sources of energy for survival [23]. Fatter animals generally present increased levels of circulating leptin and insulin. Leptin is secreted by the adipocytes as an attempt to control appetite and food intake [24], however humans and animals naturally propense to become obese, such as the IB pig, are found to display a pattern of resistance to leptin [25]. In IB pigs, leptin-resistance is at least partially justified by the presence of a fixed functional polymorphism in the leptin receptor gene [26,27] which was recently found as almost fixed in the AL (0.98) and at a much lower frequency in the BI breed (0.26) [6]. Obese animals also secrete more insulin in order to control circulating glucose levels by inducing glucose uptake and storage as glycogen, while triggering lipogenesis and preadipocyte differentiation [28,29]. On the other hand, insulin sensitivity has been previously proposed as a major factor to justify differences in phenotypical traits such as growth and body composition between local and lean modern breeds [30]. A recent study did, in fact, determine that growing IB pigs can develop insulin resistance at an early stage and that insulin is less effective in IB than in Landrace pigs [30]. A similar pattern of diminished insulin sensitivity and possible insulin resistance is therefore possible to develop in AL, particularly when compared to the leaner BI pig. Insulin resistance is characterized by an over secretion of insulin resulting in hyperinsulinemia that induces triglyceride accumulation and lipolysis inhibition in tissues via glucose transporter-4 (GLUT4), mediated by the phosphatidylinositol 3-kinase (PI3K) signaling pathway [29,31]. Furthermore, obese insulin resistant animals secrete more proinflammatory cytokines, which in turn contribute to the development of an obesity-induced chronic inflammation state [32]. These attributes show the potential and justify the continuing application of local pig breeds as biomedical models to study worldwide growing metabolic related disorders such as obesity, type-2 diabetes mellitus and cardiovascular diseases [25].
Genetic potential, along with specific feeding and production strategies, plays a major role on the development and composition of tissues. This work was intended to explore the genome function of AL and BI pig breeds at the level of adipose tissue, to better understand the underlying mechanisms associated with lipid deposition and productive traits of these breeds. This RNA-seq comparative analysis represents the first high-throughput transcriptomic data involving these local breeds and can help explain the metabolic differences that occur in their adipose tissue.

2. Materials and Methods

2.1. Animals, Experimental Design and Sampling

Purebred male castrated AL and BI pigs (n = 4 for each breed) were reared in a traditional free ranged system and individually fed commercial diets ad libitum until slaughter (~150 kg), under identical conditions to minimize non-genetic effects. AL pigs averaged a total of 155.0 days on trial while BI pigs averaged a total of 140.0 days on trial. Dorsal subcutaneous fat samples (DSF) were collected at slaughter as previously described [33], snap frozen in liquid nitrogen and maintained at −80 °C until total RNA extraction.
All animals were raised and slaughtered in conformity with the regulations and ethical guidelines of the Portuguese Animal Nutrition and Welfare Commission (DGAV, Lisbon, Portugal) following the 2010/63/EU Directive. Staff members of the team involved in animal trials were certified for conducting live animal experiments delivered by the Directorate of Animal Protection (DSPA, DGAV, Lisbon, Portugal).

2.2. RNA Extraction and Sequencing

Total RNA was isolated from 50–100 mg samples of DSF following Ambion® RiboPure™ Kit (Thermo Fisher Scientific, Waltham, MA, USA) instructions. Total extracted quantity was measured using NanoDropTM 1000 spectrophotometer (Thermo Fisher Scientific, Waltham, MA, USA). Quality control was assessed using Agilent 2100 BioanalyzerTM (Agilent Technologies, Santa Clara, CA, USA) following Agilent RNA 6000 Nano Kit instructions, along with NanoDropTM 1000 260/280 and 260/230 coefficients that were checked for protein and chemical contamination, respectively. RIN values ranged from 6.5~8.5. The obtained total RNA was diluted into a concentration of 100 ng/µL and ~3 µg samples were sent for stranded paired-end mRNA-seq sequencing in Centro Nacional de Análisis Genómico (CNAG-CRG, Barcelona, Spain) on a HiSeq2000 sequence analyzer (Ilumina, Inc., San Diego, CA, USA). The raw data was downloaded from CNAG servers and treated accordingly.

2.3. Quality Control, Mapping and Assembly

FastQC program (version 0.11.8) [34] was run to assess the quality of the sequencing Fastq files. Sequence reads were trimmed three consecutive times for Ilumina adapters, poli-A and poli-T tails using Trim Galore (version 0.5.0) [35] while removing resulting low quality nucleotides (Phred Score, Q < 20) and short length reads (<40). The remaining reads were aligned to the reference pig genome version Sscrofa11.1 (Ensembl release 94) using HISAT2 version 2.1.0. Resulting SAM files were then converted to BAM with Samtools-1.9 [36] and HTSeq-count version 0.11.1 [37] was used to count and merge reads based on overlapping paired-end reads.

2.4. Differential Expression Analysis

Previously generated Gcount files were run with the R package DESeq2 [38]. In this tool, gene expression levels are obtained through count of total exon reads for the statistical analysis. DESeq2 sets up normalized counts that were filtered by the rule of minimum 50 reads per group. Genes were considered as DE when presenting a false discovery rate (FDR) or adjusted p-value lower than 0.05. The data discussed in this publication have been deposited in NCBI’s Gene Expression Omnibus [39] and are accessible through GEO Series accession number GSE145956 (https://0-www-ncbi-nlm-nih-gov.brum.beds.ac.uk/geo/query/acc.cgi?acc=GSE145956).

2.5. Functional Enrichment Analysis

To explore causal relationships associated with the resulting DE genes, predict downstream effects, identify new targets and better interpret their biological meaning within the adipose tissue context, a functional enrichment analysis was performed using Ingenuity Pathways Analysis software (IPA; QIAGEN). The list of candidate DE genes (q < 0.05) and their respective log2 FC ratio was uploaded into the application and then converged with IPA’s library (Ingenuity Pathway Knowledge Base) to identify biologically relevant information such as overrepresented pathways and functions, networks and regulators [40].

2.6. Real Time Quantitative PCR and Statistical Analysis

Previously extracted total RNA was reverse transcribed in 20 µL reactions using Maxima® First Strand cDNA Synthesis Kit for RT-qPCR (Thermo Scientific, Waltham, MA, USA) following manufacturer’s instructions. In order to validate the data generated by RNA sequencing, Real Time-qPCR was performed for a set of 9 candidate genes including ACACA, ACLY, ADIPOQ, ELOVL6, FASN, LEP, ME1, PCK1 and SCD (Supplementary Table S1). Standard PCRs were executed to check amplicon sizes.
Quantification reactions containing 12.5 μL of NZY qPCR Green Master Mix (2×) (NZYtech, Lisbon, Portugal), 0.3 μM of each respective sense primer and 12.5 ng of cDNA per sample were prepared in 96-well plates and run in a LineGene9600 Plus system (BIOER, Hangzhou, China). PCR program comprised an initial hold 10 min denaturation stage at 95 °C, followed by a 40 cycles amplification step of 15 s denaturation at 95 °C and 50 s at the respective primer pair annealing temperature (Supplementary Table S1). A melting stage to test PCR specificity was also added at the end involving a single cycle at 95 °C (15 s) followed by 60 °C (60 s), and a ramp-up 0.2 °C/s to 95 °C for 15 s with acquired fluorescence. Single peaks in the dissociation curves confirmed the specific amplification of the genes. A no-template control was run with every assay, and target samples were performed in triplicate as technical replicates. Ct values were regressed on the log of template cDNA concentration. For each gene, PCR efficiency was estimated by standard curve calculation [41] using five points of cDNA serial dilutions (1:4; 1:8; 1:16; 1:32; 1:64). ACTB, RPL19 and TOP2B were selected as endogenous genes for normalization of target genes and their stability was assessed using the Genorm software (0.271 < M < 0.363) [42].
An Independent Samples t-test was performed on the dataset using IBM SPSS Statistics software (IBM SPSS Statistics for Windows, Version 24.0. Armonk, NY: IBM Corp) with significance defined as p < 0.05. Equal variances were tested with Levene’s Test for Equality of Variances. Significance levels lower than 0.05 were not considered as equal variances and another Independent Samples Test was performed assuming no equal variances. Equal variances were not assumed for ACLY (F = 12.5; p = 0.01) and ME1 (F = 32.3; p = 0.001). Pearson correlation coefficients and associated p-values were estimated.
To measure the level of agreement between RNA-seq and Real time qPCR results, the concordance correlation coefficient (CCC) [43] was estimated using the Log2FC values per candidate gene.

3. Results and Discussion

3.1. Alentejano and Bísaro: Local Pig Breeds with Recognizable Meat Quality Traits

The animals tested in this study, purebred AL and BI pigs differ phenotypically, genetically and regarding their respective traditional production systems. These breeds represent the two most important local pig breeds produced in Portugal, and there is a renewed interest in their resulting crosses, the Ribatejano (RI) pig [11]. In a previous study [33], a comparison of productive and meat quality traits was analysed in the AL, BI and RI pigs, with BI presenting significantly better carcass traits than AL and intermediate values for the crossed pigs. From this study, four randomly selected individuals from AL and BI breeds were chosen for transcriptome analysis by RNA-seq. Currently, many RNA-seq experiments are performed at a low replication level and several publications suggest that a minimum of 2–3 replicates can be considered [44,45,46]. Selected AL pigs averaged a total of 155.0 days on trial with an average daily gain of 571.6 g/d while BI pigs averaged a total of 140.0 days on trial and an average daily gain of 619.4 g/d. On the other hand, when compared to BI, AL pigs presented significantly higher fat cuts proportions (32.0 vs. 25.4%, p < 0.05), average backfat thickness (78.6 vs. 45.1 mm, p < 0.01) and fat depth (69.6 vs. 36.5 mm, p < 0.01). BI pigs on the other hand presented higher primal cuts proportions (33.2 vs. 26.1%, p < 0.01), bone cuts proportion (13.8 vs. 11.8%, p < 0.05) and lean-to-fat cuts ratio (1.89 vs. 1.41, p < 0.05).

3.2. Mapping and Annotation

The average number of obtained sequenced reads was 45 million per sample. Length of reads was consistently 76 bp with the average associated quality score roughly close to 40. GC content ranged from 49 to 56%. Resulting trimmed paired-end reads were mapped to the reference genome Sscrofa11.1 with a consistent alignment rate of 97% using HISAT2 over all samples, which is higher than most previous pig transcriptome studies [47,48,49,50,51,52] and is probably due to an improved annotated reference genome.

3.3. Gene Expression Analysis: DESeq2

Previously obtained normalized counts were used to predict and establish the total number of DEG’s between breeds. Over 10.7 K genes were detected across all samples with 458 found to have significantly different expression values between breeds (q < 0.05). A total of 263 genes were found overexpressed in AL and 195 in BI with 47 (20%) of total DEG’s still labelled as novel genes with hardly any information available on most databases. A full detailed list of the total DEG’s can be found in Supplementary Table S2. The novel gene coding for the baculoviral inhibitor of apoptosis protein repeat containing 7 (BIRC7) was the most overexpressed in the AL breed (log2 FC = 4.86, q < 0.01) while Taste receptor type 2 member 39 (TAS2R39) was the most overexpressed in BI (log2 FC = −4.61, q < 0.05). In humans, TAS2R39 plays a role in the perception of bitterness and is linked with the G protein associated with taste and the gustatory system [53]. In pigs, taste perception can influence feeding patterns which can consequently determine production traits and TAS2R39 in particular has been previously associated with increased lipid deposition [54]. A recent study that investigated the allele frequency of known polymorphisms with associated meat quality traits in European local pig breeds [6], including AL and BI, found that the missense mutation p.Leu37Ser in TAS2R39 associated with higher backfat deposition is practically absent in AL (0.01), while in BI is present in 13% of individuals. This contradicts phenotypic data and suggests that regulation of lipid content may occur at different levels and differ in pathways from AL pigs.
Overall, and as expected, genes encoding for enzymes or transcription factors involved in lipid synthesis were found overexpressed in AL. Furthermore, we confirmed that, in this breed, several major genes involved in the cascade of the de novo lipid synthesis, elongation for very long fatty acids and desaturation, were upregulated (Figure 1).
ATP citrate lyase (ACLY) was found significantly overexpressed in AL when compared to BI (log2 FC = 1.853, q < 0.01). ACLY is the primary enzyme responsible for the synthesis of cytosolic acetyl-CoA in many tissues. It catalyses the reaction where the citrate produced through Krebs Cycle, freely transported to the cytoplasm by the Citrate Carrier (CiC), is converted into acetyl-CoA and oxaloacetate [55,56], along with the hydrolysis of ATP, linking the carbohydrate to the lipid metabolisms. Acetyl-CoA is the main non-lipid precursor, with NADPH, for the synthesis of cholesterol and/or palmitic acid through de novo synthesis [57].
The first step to synthesize new fatty acids comprises the carboxylation of acetyl-CoA into malonyl-CoA [57], a reaction catalysed by the enzyme acetyl CoA carboxylase (ACACA) who’s gene was found in our data to be non-statistically different between breeds though a numerical difference was noted (log2 FC = 0.854, q = 0.116). That difference was then confirmed and boosted to trend by qPCR (log2 FC = 1.055, p = 0.077).
Long carbon chain FAs are then assembled in multiple repeated four-step cycles comprehending: condensation, reduction, dehydration, and reduction. In each cycle two carbon atoms are added to the acyl chain, which is the substrate for the next cycle with an activated malonyl CoA group [58]. For the complete synthesis of palmitic acid (16:0) the cycle must be repeated seven consecutive times, a reaction operated by the multifunctional enzyme complex fatty acid synthase (FASN) that requires much NADPH. In our data, FASN was overexpressed in AL (log2 FC = 1.691, q < 0.01) validating the concept of an increased lipid biosynthesis in AL when compared to BI.
Elongation of saturated and/or unsaturated FAs occurs in the cytoplasmic face of the endoplasmic reticulum membrane where the elongation of very long chain fatty acids protein 6 (ELOVL6) plays a pivotal role by adding two-carbon atoms from a malonyl CoA donor [59]. ELOVL6 was found also significantly overexpressed in AL (Log2 FC = 1.236; q < 0.01) suggesting a higher production of long chain FAs, particularly stearic (18:0) and oleic (18:1) acids.
The acyl CoA desaturation also occurs at the endoplasmic reticulum. Stearoyl CoA desaturase (SCD), together with NADH-cytochrome b5 reductase and cytochrome b5, work as a membrane-bound complex to catalyse the reaction that introduces a double bond between C9 and C10 [60] to mainly create palmitoleic (16:1) and/or oleic acid which are major components of membrane phospholipids, triacylglycerols and cholesterol esters [58,60]. Furthermore, oleic acid is the starting point to assemble a variety of unsaturated FAs by a combination of elongation and desaturation reactions. SCD is the rate-limiting step of the reaction and, in our data, SCD gene was also found significantly overexpressed in AL (log2 FC = 2.311, q < 0.026). This suggests a higher synthesis of oleic acid and its derivatives in this genotype, which lead to a higher oleic acid content in meat as found in previous studies [7,9,61].
When citrate is converted to acetyl-CoA and oxaloacetate, the later can be converted to malate through the action of malate dehydrogenase (MDH) and then to pyruvate to enter the glycolytic pathway [62]. The latter reaction is catalysed by malic enzyme 1 (ME1) and is characterized by the reversible oxidative decarboxylation of malate generating much of the NADPH supply required for lipid biosynthesis [63]. In our data, ME1 gene was also found significantly overexpressed in AL (log2 FC = 2.090, q < 0.01) supporting the idea of an overall increased lipid synthesis in this breed.
Phosphoenolpyruvate carboxykinase 1 (PCK1) is responsible for catalysing the reaction where cytosolic oxaloacetate is converted to the intermediate phosphoenolpyruvate which can participate in gluconeogenesis or glycolysis when converted to pyruvate [57]. Moreover, PCK1 has been found to regulate free fatty acid reesterification and glyceroneogenesis in white adipose tissue [64]. Contrarily to what was found in another study using Iberian when compared to Duroc pigs [52], PCK1 gene was found significantly overexpressed in BI (log2 FC = −1.959, q < 0.05) which suggest that in BI the path of gluconeogenesis/glyceroneogenesis pathway is favoured. A single nucleotide polymorphism c.A2456C in the PCK1 gene has been reported to favour higher intramuscular deposition and better meat quality in pigs muscle [65]. The presence of this mutation in AL and BI genotypes was recently studied [51] showing that AL presents the A allele practically fixed (0.97) as do the IB (0.96). However, the C allele is present in BI in approximately 50% of the animals. The C allele causes the integration of leucine instead of methionine at the position 139 of the enzyme, which is associated with higher meat water loss and less favourable fat distribution. PCK1 p.139Met is kinetically more active in the direction of phosphoenolpyruvate synthesis for glyceroneogenesis while the PCK1 p.139Leu (allele A) is more active in the opposite direction, leading to oxaloacetate synthesis [65] which may contribute to the less fatty phenotype of the BI breed contrasting to the higher lipid deposition and lower carcass traits.
Leptin (LEP) is a homeostatic hormone mediator mainly expressed in adipocytes. It is widely recognized for regulating food intake and energy expenditure at the hypothalamic level [66] although the exact working mechanism in the adipose tissue continue unclear. Circulating levels of LEP are consistently higher in fatty animals. LEP targets peripheral tissues favouring FA catabolism over lipogenesis and it has been suggested that leptin can regulate adipose tissue metabolism by autocrine signalling [67]. As in other studies with the Iberian pig breed [52,68,69], genetically similar to AL, compared to the leaner Duroc and Landrace breeds, LEP gene was found significantly overexpressed in the AL pig (log2 FC = 1.376, q < 0.05). This is in agreement with its recognized fatter phenotype and, very similar to the IB breed, suggesting the development of leptin resistance [27,52].
The CCAAT/enhancer-binding protein α (CEBPA) gene encodes a transcription factor, containing a basic-leucine zipper domain that recognizes the CCAAT sequence in the promoter region of specific target genes that indirectly participates in the regulation of multiple pathways, including glucose and lipid metabolism [70,71]. In humans, several studies have found a lower expression of CEBPA in obese groups [72,73] despite being usually associated to adipogenesis, adipose tissue development and lipid accumulation [71,74]. However, in our study, CEBPA was found upregulated in the obese AL (log2 FC = 0.974, q < 0.05) supporting the concept of increased lipid synthesis in this breed.
The fatty acid binding protein 4 (FABP4) gene encodes for a cytoplasmic protein found in adipocytes that binds long-chain fatty acids and plays an essential role in lipid metabolism and homeostasis. In cattle, FABP4 has been associated with better marbling and fat depth [75] and in pigs is a recognized genetic marker for meat tenderness and IMF content [76]. FABP4 is also known to indirectly influence adipogenesis and insulin responsiveness by adjusting the master regulator peroxisome proliferator-activated receptor gamma (PPARG) [77]. In our data, FABP4 was found significantly overexpressed in AL (log2 FC = 1.061, q < 0.01), which agrees with the frequently higher expression values found in obese individuals [77]. Higher FABP4 levels are induced by increased levels of insulin or insulin-like growth factor-1 (IGF1) and are frequently associated with the development of insulin resistance [78].
Adipocyte expression of IGF2 has been previously associated with enhanced foetal growth and subcutaneous preadipocyte differentiation via PPARG activation while decreasing fat deposition in visceral preadipocytes [79]. In pigs, IGF2 is a candidate gene for meat production and carcass traits [80]. An intronic mutation in IGF2 (g.3072G > A) is strongly related to fat depot and muscle development when the G allele is present [81]. In AL pigs the G allele is fixed while in BI the A allele is residual (0.01) [6]. IGF2 was found significantly overexpressed in BI (log2 FC = −0.884, p < 0.05) despite their leaner phenotype which indicates that fat deposition is regulated at other levels. This result is in agreement with previous studies that found IGF2 overexpression in leaner Duroc when compared to the fatter Iberian pig genotype [52].
Similar to what was found in a recent study [52] that compared the transcriptome of animals with distinct tissue distribution (Iberian vs. Duroc), a set of genes that play an important role in growth and development was, within our dataset, consistently found overexpressed in BI, the breed with the highest lean muscle tissue deposition. Those genes included IGF2 (log2 FC = −0.884, q < 0.05), FOS (log2 FC = −1.087, q < 0.05) and FOSB (log2 FC = −2.028, q < 0.01). Moreover, several other genes associated with proliferation of muscle cells and cellular development were consistently found overexpressed in this local breed, including APOD (log2 FC = −1.087, q < 0.05), DUSP1 (log2 FC = −1.539, q < 0.01), EGR1 (log2 FC = −1.172, q < 0.05), ELN (log2 FC = −1.743, q < 0.01), KLF4 (log2 FC = −1.103, q < 0.05) and STAT3 (log2 FC = −0.940, q < 0.05). These findings agree with other previous works [49,52,82] and support the idea that growth and development stimuli, particularly in the more productive breeds, can occur and be regulated at a multiple tissue level.

3.4. Validation by Real Time qPCR

In order to validate the RNA-seq results, the relative expression of a selected group of DE genes as well as some non-DE genes was assessed by semi-quantitative Real Time PCR within the same sampling universe (Table 1). Overall, RNA-seq results agreed with the results obtained from real time qPCR, despite occasional small significance inconsistencies within some genes probably due to particularities of each method regarding accuracy, sensitivity and specificity.
As found in other studies [49], statistically significant differences generally tend to be higher with the RNA-seq approach when compared to the Real-Time qPCR technology where p-values are higher. A concordance correlation coefficient (CCC), usually employed to measure the degree of agreement between two variables in order to evaluate the reproducibility of tested methods, was determined between the RNA-seq and qPCR methods. The obtained value of 0.804 demonstrates a substantial strength-of-agreement between the treatments.

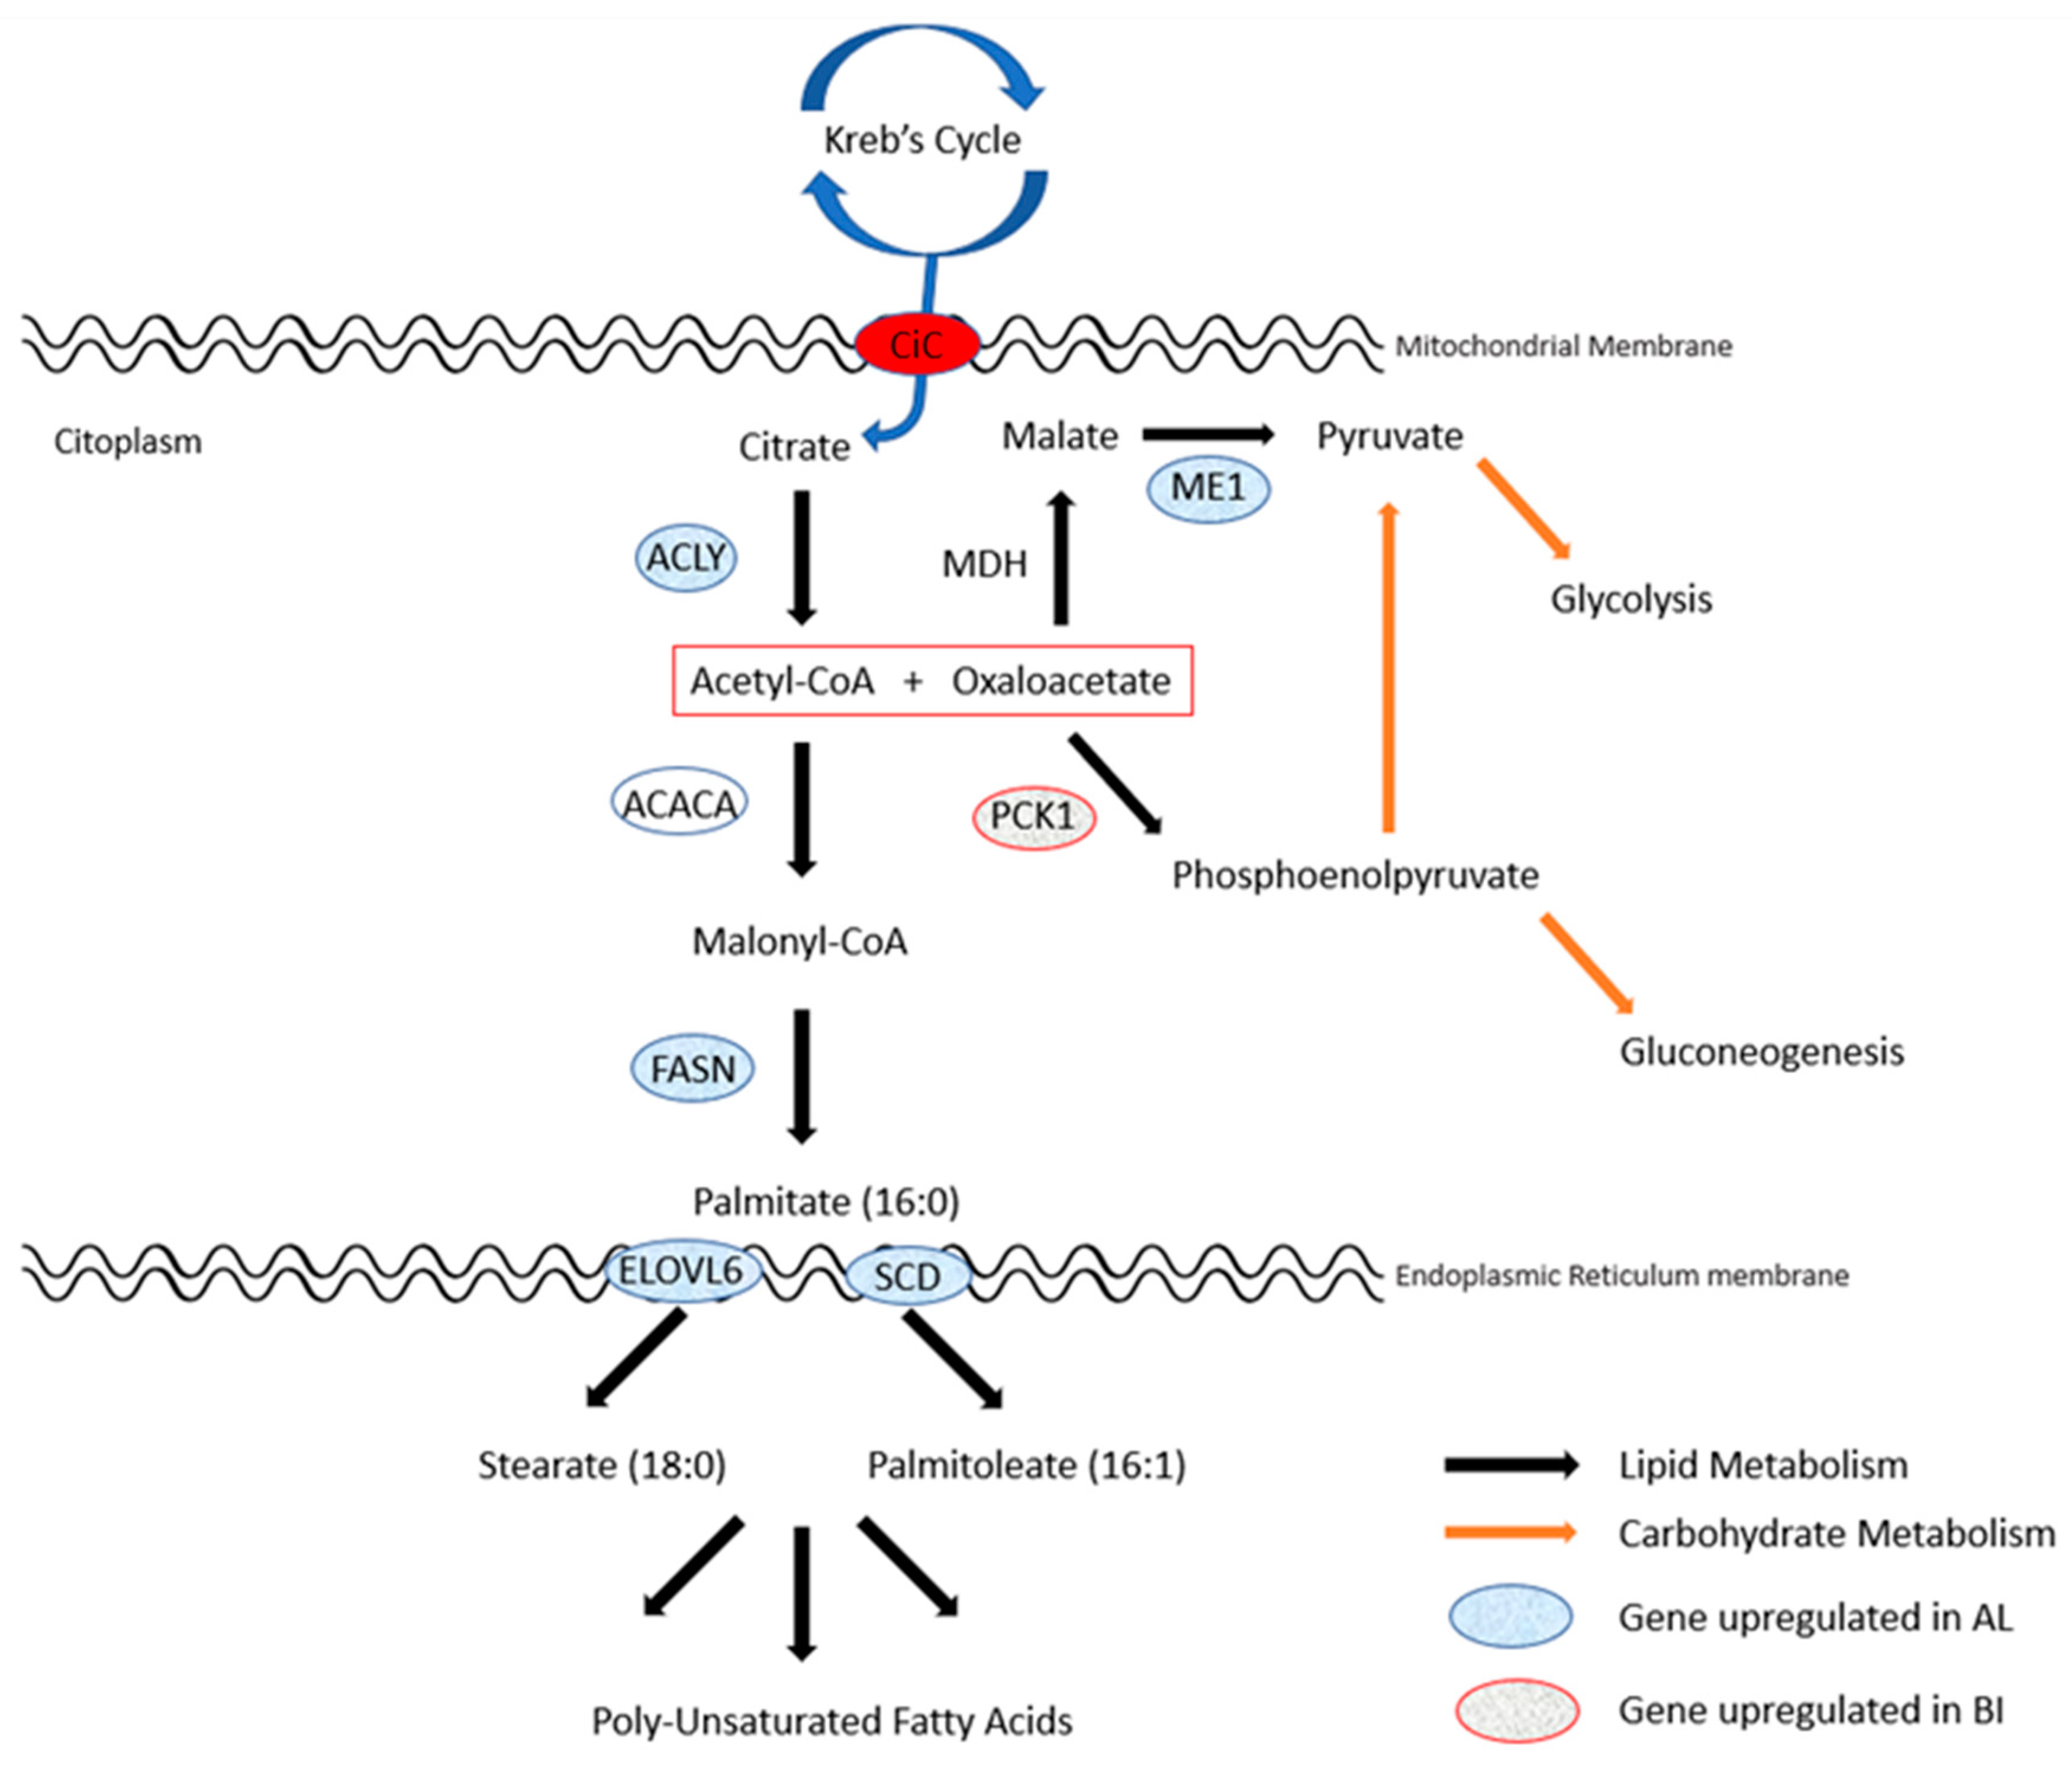
3.5. Functional Analysis

IPA software was used to find overrepresented biological functions, pathways and potential upstream regulators within the candidate DEG dataset, where 380 of the total 458 candidate DEG’s were recognized by its database.
Gene Ontology enrichment analysis revealed a total of 500 involved biological functions (p < 0.05) within our DEG dataset (Supplementary Table S3), with 17 of these being significantly activated (z-score ≤ −2 or ≥2) in a breed. A total of 5 functions related either to development and growth or cell death were predicted to be activated in BI (z-score ≤ −2) including generation of embryonic cell lines, necrosis and cell hypoplasia. On the other hand, 12 biological functions mostly related to cell-signalling and cellular development were predicted to be activated in AL (z-score ≥ 2), including cell proliferation of hepatoma cell lines, activation of myeloid cells, proliferation of fibroblast cell lines and activation of granulocytes. Other biological functions of interest were found significantly associated to our gene dataset, but no directional prediction was attained. Among them, size of animal, gluconeogenesis, quantity of glycogen, synthesis of lipid, concentration of fatty acids, quantity of white adipose tissue, concentration of triacylglycerols, synthesis of sterols, proliferation of muscle cells, inflammatory response and insulin sensitivity. As reported in a similar study that compared the breed effect on the adipose tissue transcriptome [52], our results suggest that a highly activated inflammatory state, frequently defined as meta-inflammation, may have developed in the adipose tissue due to the large fat mass attained, particularly in AL pigs.
A total of 57 canonical pathways were found associated with our DEG dataset (p < 0.05) (Supplementary Table S4). Two of them were found within the scope of a directional prediction (z-score ≤ −2; z-score ≥ 2), namely CD40 signalling (z-score = −2.236) and mouse embryonic stem cell pluripotency (z-score = −2.236). CD40 encodes for a protein member of the TNF-receptor superfamily which operates as a receptor for immune system cells and participate in the regulation of numerous immune and inflammatory responses [83]. Studies in mice [84,85], have pointed the regulatory role of CD40 in obesity-induced insulin resistance and has associated CD40 deficiency with increased inflammation and decreased insulin sensitivity, pointing its potential in preventing obesity and metabolic disorders. The fact that CD40 signalling is one main canonical pathways found and that is significantly favoured in BI, supports the idea that insulin resistance is mainly occurring in the AL breed, where decreased insulin sensitivity is suggested due to the pro-inflammatory effect of the exacerbated level of adipose tissue deposition when compared to the leaner BI.
The top canonical pathway detected was Growth Hormone (GH) Signalling (p = 1.95 × 10⁻⁴), followed by the HOTAIR regulatory pathway (p = 3.80 × 10⁻⁴), both suggested to be activated in BI (−0.378 and −0.632 of z-score, respectively). GH is widely recognized for its anabolic and lipolytic functions, stimulating muscle and bone growth mediated by IGF1 secretion. In adipocytes, stimulated GH receptors induce lipolysis through oxidation and triacylglycerol breakdown [86]. On the other hand, the homeobox transcript antisense intergenic RNA (HOTAIR) is part of the long noncoding RNAs class that is suggested to regulate the expression of numerous signalling transcripts and is a potential biomarker for several types of cancer [87]. Recent studies have also associated upregulated levels of HOTAIR with increased adipogenesis, through upregulation of FASN [88,89], which suggest a different regulatory pathway in BI compared to the AL breed, that presented a higher expression of FASN.
Other interesting canonical pathways associated to BI include prolactin (z-score = −0.447, p = 0.002) and signalling of a few specific regulators such as AMP-activated protein kinase (AMPK) (z-score = −1.134, p = 0.01), IGF1 (z-score = −0.447, p = 0.048) and cytokines interleukin-2 (IL-2) (z-score = −1.000, p = 0.019) and IL-3 (z-score = −1.000, p = 0.019). These pathways suggest a higher lipolytic activity within the BI adipocytes, along with the activation of anti-inflammatory signals that may help control insulin sensitivity. Prolactin plays a major role in lactation and can also regulate the reproductive and immune systems. Metabolically, prolactin has been associated with a reduced ability for glucose and lipid deposition in human adipocytes, leading to higher circulating values of these compounds [90]. Patients with hyperprolactinemia are found with metabolic disorders such as insulin resistance and glucose intolerance [91]. Moreover, prolactin and GH can affect the expression of adiponectin, the adipose tissue regulator of glucose and fatty acid levels [92]. However, and as mentioned before, ADIPOQ expression values were found numerically higher (q = 0.297) in BI with RNA-seq as well as with real-time PCR (p = 0.11). AMPK has a key role in the cellular maintenance of ATP levels and is responsible for the regulation of growth and transcriptional controlling programs [93]. In a recent in vivo study in mice [94], AMPK regulation lipolytic activity in adipose tissue was confirmed, due to the direct phosphorylation of hormone sensitive lipase and adipose triglyceride lipase. AMPK as also been found to suppress lipogenesis by phosphorylating SREBP-1 c, inhibiting its transcriptional activity [95]. More recently, purebred IB foetuses have also been found associated with a downregulation of AMPK when compared to crossbred Iberian × Large White pigs in muscle [96]. Observed leptin overexpression would suggest an activated AMPK in AL, however an impaired leptin signalling as proposed by García-Contreras may also be occurring. IGF1 is the first cell response to GH stimulation. This anabolic factor contributes to cell differentiation and homeostasis though is not mandatory in adipose tissue development [97]. IGF1 is essential in the physical stress response that induce myocyte growth and hypertrophy [98], while regulating adipose tissue metabolism by inhibiting lipolysis similarly to insulin [99].
Another interesting canonical pathway found significantly affected by the DE genes (p < 0.01) include the complex TR/RXR of the nuclear retinoid X family receptors. This pathway is related to thyroid hormone activation, affecting key biological mechanisms such as differentiation, growth and development, lipid and carbohydrate metabolisms, thermogenesis and central nervous system functions [100]. In rats, thyroid hormone has been found to induce differentiation of preadipocytes in white adipose tissue, as well as to increase lipid content in cells, stimulating a variety of lipogenic enzymes including ACLY, ME1 and FASN, etc. [100]. However, in this canonical pathway, the software was not able to predict the direction of the activity pattern.
Other canonical pathways of interest found where no directional activity pattern was predicted included IL-6 and IL-9 signalling, the pentose phosphate pathway, Acetyl-CoA Biosynthesis III (from Citrate), Palmitate Biosynthesis I, Fatty Acid Biosynthesis Initiation II and Stearate Biosynthesis I. IL-6 is a pro-inflammatory cytokine, directly involved in increased fatty acid oxidation and decreased insulin resistance [101]. A group of interleukins, where IL-6 is included, can stimulate AMPK through the activation of signal transducer and activator of transcription 3 (STAT3) which was found upregulated in BI (log2 FC = −0.940, q < 0.05). On the other hand, IL-9 is a cytokine with an associated anti-inflammatory activity [102].
The main canonical pathway associated to the AL breed was Insulin receptor signalling (z-score = 1.633, p < 0.05). As mentioned before, insulin sensitivity plays an elemental role in modulating glucose and lipid deposition. Insulin accumulation induce triglyceride deposition while inhibiting lipolysis culminating in more fat mass, where inflammatory cytokines tend to accumulate and promote more insulin resistance in the individuals.
Identification of potential upstream regulators and their effects at a transcriptional level to help explain the obtained DEG’s was accomplished using IPA. A total of 643 regulator molecules were identified (p < 0.05, Supplementary Table S5) with 16 predicted to be active in AL (z-score ≥ 2) and 20 predicted to be active in BI (z-score ≤ −2).
Activated upstream regulators found in AL include mainly molecules associated with lipid homeostasis, adipogenesis and/or insulin sensitivity such as ADIPOQ, NR1D1, PPARG, SREBF2, SCAP and MED1. ADIPOQ is a gene exclusively expressed in the adipose tissue and its coding protein, adiponectin, is found circulating mostly within the plasma, where it participates in the regulation of several metabolic and hormonal mechanisms [103,104]. Adiponectin is known to trigger AMPK phosphorylation and increase the peroxisome proliferator-activated receptor alpha (PPARA) activity leading to β-oxidation, while being associated with reduced insulin resistance and anti-inflammatory activity through AdipoR1 and AdipoR2 signalling [104]. ADIPOQ circulating levels are inversely related with body fat mass and are higher when a low caloric intake is occurring [104]. In our trial, although animals from both breeds were slaughtered at ~150 kg of body weight, AL pigs have shown a higher ability to deposit fat mass, while BI developed more muscle mass [33], which suggest a higher expression of ADIPOQ in BI than in AL. On the other hand, our results indicate that ADIPOQ gene expression is not statistically different between breeds which would suggest that ADIPOQ activation as regulator could be a consequence of differential regulation at other levels, such as post-transcriptional regulation. NR1D1 has been previously described as a key factor in the coordination of the mammalian circadian rhythm with metabolic pathways in several tissues, including adipose tissue [105]. This transcription factor can stimulate adipogenesis and preadipocyte differentiation via a PPAR response element that induces increased expression of various adipogenic markers including PPARG, at a later adipogenesis stage [106,107].
The family of sterol regulatory element-binding proteins (SREBFs) is responsible for managing cellular lipid homeostasis in vertebrates by adjusting sterol-regulated lipogenic genes to the cell current needs [108]. SREBF2 is a transcriptional activator homolog to SREBF1 but, unlike the latter, is bounded to stimulate genes related to cholesterol synthesis such as HMGCR, HMGCS, MVK and LDLR and not fatty acid synthesis [108,109]. SCAP encodes for the protein responsible for the exportation of SREBF’s to the Golgi complex for cholesterol synthesis by binding to the specific SREBF in the endoplasmic reticulum [110].
MED1 is a transcription factor of the Mediator complex and operates by mediating RNA polymerase II-dependent genes. Metabolically, MED1 is essential for adipocyte differentiation and adipogenesis by stimulating PPARG expression [111]. Adipogenesis comprehend two main steps. Firstly, early proadipogenic factors such as CEBPB, CEBPD and KLF’s are stimulated and participate in the regulation of enhanceosomes formation which prompt the maturation of differentiated adipocytes by the activation of PPARG and CEBPA [112,113]. In this process, PPARG is recognized to have a master regulatory influence since the other factors cannot stimulate adipocyte differentiation without PPARG [112,114]. Upstream regulators associated to AL confirm the suggested hypothesis of an increased adipogenesis and cholesterol synthesis and uptake in this breed which agrees with the phenotypic data that characterises the fatter AL and the leaner BI genotypes [33,115].
Activated upstream regulators found in BI include molecules involved in the immunoregulatory and inflammatory processes such as MYD88, CCL2, IRF2, RELA and TNF, as well as regulators involved in lipid metabolism and insulin signalling such as INSIG1, INSIG2 and FOXO1. INSIG1 and INSIG2 are identical endoplasmic reticulum proteins and are responsible for mediating feedback control of sterol synthesis by binding to the SCAP protein transporter, preventing activated SREBPs transference to the Golgi apparatus to stimulate lipogenesis [116]. Furthermore, INSIG molecules can also bind to HMGCR, inhibiting its use of cytosolic acetyl-CoA for cholesterol biosynthesis [117]. FOXO1 is regularly expressed in insulin responsive cells such as the adipocytes, is involved in their differentiation and can inhibit lipid synthesis by suppressing the transcriptional activity of PPARG [118]. This protein is also a suggested transcription factor with positive effect in myogenic growth, though studies are not consistent [119]. Other regulators also found to be associated with growth, myogenesis and muscle cell differentiation and proliferation were MEF2C and PDGFB.
Regulator effect analysis identified proliferation of fibroblast cell lines and activation of myeloid cells to be amongst the main functions associated with our determined upstream regulators. This is indicative of connective tissue development and an active state of the innate immune system, probably due to the obesity-associated inflammation, respectively. Additionally, regulator effect analysis together with some of the activated functions in BI may suggest a predominance of the stromal-vascular fraction in the cell population and not adipocytes. The complete list of master regulators and their effects on the regulators and genes in our dataset is shown in Table 2.
Regulators and DE genes were used to conceive causal networks using IPA. One of the main networks established is related to lipid metabolism, carbohydrate metabolism and molecular transport (Figure 2). This network attained a total score of 31, summarizes the associated activity of 23 molecules and emphasizes the central role of FASN in the metabolic regulation in adipose tissue.
In normal cells, de novo lipid synthesis is only stimulated in case of lipid depletion, since these needs are usually met via absorption of dietary lipids. AL pigs are characterized by a genetic predisposition to be precociously adipogenic which, according to our data, may be associated to a deregulated de novo fatty acid synthesis leading to increased fatty acid accumulation, regardless of dietary lipid absorption.
In conclusion, the transcriptome analysis of the Alentejano and Bísaro Portuguese local pig breeds allowed the identification of a total of 458 differentially expressed genes and contributed with valuable insight to what is metabolically occurring in the adipose tissue of these breeds. Our data suggest that the determining factor that differentiate the higher fat deposition in AL is related to an increased de novo fatty acid synthesis, due to the upregulation of key genes such as ACLY, FASN and ME1. Cholesterol synthesis is also suggested to be higher in AL via SREBF2, SCAP and PPARG. Lipolytic activity may be more active in BI than AL through GH and AMPK signalling. Moreover, the predicted activation of INSIG1 and INSIG2 in BI suggests that this breed is more sensitive to insulin whereas the AL is less sensitive like the Iberian breed. Our data also suggest that AL pigs, such as previously described in Iberian pigs, have developed patterns of insulin and leptin resistance and obesity-induced chronic inflammation. Moreover, signalling of CD40 may play a dictating role in the development of insulin resistance in AL pigs.

Supplementary Materials

The following are available online at https://0-www-mdpi-com.brum.beds.ac.uk/2073-4425/11/4/422/s1, Table S1: Primer design for qPCR, Table S2: List of differentially expressed genes, Table S3: Enriched biological functions in the set of differentially expressed genes, Table S4: Enriched canonical pathways in the set of differentially expressed genes, Table S5: Predicted upstream regulators for the set of differentially expressed genes.

Author Contributions

Conceptualization, J.M.M. and A.A.; methodology and investigation, A.A., C.Ó., Y.N., R.B., F.G., A.L.-G. and J.M.M.; writing—original draft preparation, A.A.; writing—review and editing, J.M.M., C.Ó., M.L., R.B., Y.N. and R.C.; supervision, J.M.M., C.Ó., M.d.R.F. and M.L.; funding acquisition, J.M.M., C.Ó., R.C., M.d.R.F. and M.L. All authors have read and agreed to the published version of the manuscript.

Funding

This work was funded by European Union’s H2020 RIA program (grant agreement no. 634476) and by Portuguese national funds through FCT/MCTES under project UIDB/05183/2020, and research grant SFRH/BD/132215/2017 to A. Albuquerque.

Conflicts of Interest

The authors declare no conflict of interest.

References

  1. Chen, K.; Baxter, T.; Muir, W.M.; Groenen, M.A.; Schook, L.B. Genetic resources, genome mapping and evolutionary genomics of the pig (Sus scrofa). Int. J. Biol. Sci. 2007, 3, 153–165. [Google Scholar] [CrossRef] [PubMed] [Green Version]
  2. Wood, J.D.; Enser, M.; Fisher, A.V.; Nute, G.R.; Sheard, P.R.; Richardson, R.I.; Hughes, S.I.; Whittington, F.M. Fat deposition, fatty acid composition and meat quality: A review. Meat Sci. 2008, 78, 343–358. [Google Scholar] [CrossRef] [PubMed]
  3. Pugliese, C.; Sirtori, F. Quality of meat and meat products produced from southern European pig breeds. Meat Sci. 2012, 90, 511–518. [Google Scholar] [CrossRef] [PubMed]
  4. Toldrá, F. Ham: Dry-cured Ham. In Encyclopedia of Food and Health; Caballero, B., Finglas, P.M., Toldrá, F., Eds.; Academic Press: Oxford, UK, 2016; pp. 307–310. [Google Scholar] [CrossRef]
  5. Gama, L.T.; Martínez, A.M.; Carolino, I.; Landi, V.; Delgado, J.V.; Vicente, A.A.; Vega-Pla, J.L.; Cortés, O.; Sousa, C.O. Genetic structure, relationships and admixture with wild relatives in native pig breeds from Iberia and its islands. Genet. Sel. Evol. GSE 2013, 45, 18. [Google Scholar] [CrossRef] [Green Version]
  6. Muñoz, M.; Bozzi, R.; García, F.; Núñez, Y.; Geraci, C.; Crovetti, A.; García-Casco, J.; Alves, E.; Škrlep, M.; Charneca, R.; et al. Diversity across major and candidate genes in European local pig breeds. PLoS ONE 2018, 13, e0207475. [Google Scholar] [CrossRef] [Green Version]
  7. Charneca, R.; Martins, J.; Freitas, A.; Neves, J.; Nunes, J.; Paixim, H.; Bento, P.; Batorek-Lukač, N. Alentejano pig. In European Local Pig Breeds—Diversity and Performance; Candek-Potokar, M., Linan, R.M.N., Eds.; IntechOpen: London, UK, 2019; p. 24. [Google Scholar] [CrossRef] [Green Version]
  8. Charneca, R.; Nunes, J.; Dividich, J.L. Reproductive and productive traits of sows from Alentejano compared to sows Large-White x Landrace genotype. Rev. Port. Zootec. Edição Electrón. 2012, 1, 17. [Google Scholar]
  9. Martins, J.M.; Albuquerque, A.; Neves, J.A.; Freitas, A.B.; Charneca, R.; Tirapicos, J.L. Influence of outdoor rearing and oleic acid supplementation on lipid characteristics of muscle and adipose tissues from obese Alentejano pigs. J. Anim. Physiol. Anim. Nutr. 2018, 102, e578–e590. [Google Scholar] [CrossRef]
  10. López-Bote, C.J. Sustained utilization of the Iberian pig breed. Meat Sci. 1998, 49, S17–S27. [Google Scholar] [CrossRef]
  11. Charneca, R.; Martins, J.; Freitas, A.; Neves, J.; Nunes, J.; Elias, M.; Laranjo, M.; Bento, P.; Silva, D.; Paixim, H.; et al. El cruce Alentejano x Bísaro: Un estudio en TREASURE. Sólo Cerdo Ibérico 2018, 39, 26–33. [Google Scholar] [CrossRef]
  12. Santos e Silva, J.; Ferreira-Cardoso, J.; Bernardo, A.; Costa, J.S.P.d. Conservation and development of the Bísaro pig. Characterization and zootechnical evaluation of the breed for production and genetic management. In Proceedings of the Quality of Meat and Fat in Pigs as Affected by Genetics and Nutrition, Zurich, Switzerland, 25 August 1999; pp. 85–92. [Google Scholar]
  13. Araújo, J.P.; Cerqueira, J.; Pires, P.; Amorim, I.; Carneiro, M.; Silva, J.S.; Dominguez, R.; Bermúdez, R.; Lorenzo, J.M. Diversidade das raças locais de suínos e produtos tradicionais de qualidade. In Proceedings of the Forum Politécnico #1: Bio-Regiões, Valorização Agro-Industrial e Produção Animal, Beja, Portugal, 21 April 2016; p. 72. [Google Scholar]
  14. Araújo, J.P.; Cerqueira, J.L.; Pires, P.; Silva, J.S.; Candek-Potokar, M. Influence of traditional and innovative feed on finishing Bísaro pigs in a hoop barn with outdoor access. Rev. Port. Zootec. 2018, III, 436–442. [Google Scholar]
  15. Amorim, A.; Gonçalves, A.; Leite, A.; Paulos, K.; Oliveira, A.; Pereira, E.; Rodrigues, S.; Teixeira, A. Características da Carcaça. In Porco Bísaro—Qualidade da Carcaça e da Carne; Fernandes, A., Teixeira, A., Eds.; Quinta do Bísaro: Bragança, Portugal, 2015; pp. 33–79. [Google Scholar]
  16. Araújo, J.P.; Cerqueira, J.; Pires, P.; Amorim, I.; Carneiro, M.; Silva, J.S.; Dominguez, R.; Bermúdez, R.; Lorenzo, J.M. Influence of rearing systems on carcass quality of Bísaro pig breed. In Proceedings of the X Congresso Ibérico Sobre Recursos Genéticos Animais, Castelo Branco, Portugal, 15 September 2016; p. 72. [Google Scholar]
  17. Santos Silva, J.; Araújo, J.P.; Cerqueira, J.O.; Pires, P.; Alves, C.; Batorek-Lukač, N. Bísaro Pig. In European Local Pig Breeds—Diversity and Performance; Candek-Potokar, M., Linan, R.M.N., Eds.; IntechOpen: London, UK, 2019; p. 13. [Google Scholar] [CrossRef] [Green Version]
  18. Santos e Silva, J.; Nunes, J.L.T. Inventory and characterization of traditional mediterranean pig production systems. Advantages and constraints towards its development. Acta Agric. Slov. 2013, 4, 61–67. [Google Scholar]
  19. Paixão, G.; Esteves, A.; Payan-Carreira, R.; Carolino, N. Demographic structure and genetic diversity of the endangered Bísaro pig: Evolution and current status. Czech J. Anim. Sci. 2018, 63, 452–461. [Google Scholar] [CrossRef] [Green Version]
  20. Trayhurn, P.; Beattie, J.H. Physiological role of adipose tissue: White adipose tissue as an endocrine and secretory organ. Proc. Nutr. Soc. 2001, 60, 329–339. [Google Scholar] [CrossRef] [PubMed] [Green Version]
  21. Lonergan, S.M.; Topel, D.G.; Marple, D.N. Chapter 5—Fat and fat cells in domestic animals. In The Science of Animal Growth and Meat Technology, 2nd ed.; Lonergan, S.M., Topel, D.G., Marple, D.N., Eds.; Academic Press: Cambridge, MA, USA, 2019; pp. 51–69. [Google Scholar] [CrossRef]
  22. Nieto, R.; Miranda, A.; García, M.A.; Aguilera, J.F. The effect of dietary protein content and feeding level on the rate of protein deposition and energy utilization in growing Iberian pigs from 15 to 50 kg body weight. Br. J. Nutr. 2002, 88, 39–49. [Google Scholar] [CrossRef]
  23. Neel, J.V. Diabetes Mellitus: A “Thrifty” Genotype Rendered Detrimental by “Progress”? Am. J. Hum. Genet. 1962, 14, 353–362. [Google Scholar]
  24. Zhang, Y.; Proenca, R.; Maffei, M.; Barone, M.; Leopold, L.; Friedman, J.M. Positional cloning of the mouse obese gene and its human homologue. Nature 1994, 372, 425–432. [Google Scholar] [CrossRef]
  25. Torres-Rovira, L.; Astiz, S.; Caro, A.; Lopez-Bote, C.; Ovilo, C.; Pallares, P.; Perez-Solana, M.L.; Sanchez-Sanchez, R.; Gonzalez-Bulnes, A. Diet-induced swine model with obesity/leptin resistance for the study of metabolic syndrome and type 2 diabetes. Sci. World J. 2012, 2012, 510149. [Google Scholar] [CrossRef] [Green Version]
  26. Muñoz, G.; Ovilo, C.; Silió, L.; Tomás, A.; Noguera, J.L.; Rodríguez, M.C. Single- and joint-population analyses of two experimental pig crosses to confirm quantitative trait loci on Sus scrofa chromosome 6 and leptin receptor effects on fatness and growth traits. J. Anim. Sci. 2009, 87, 459–468. [Google Scholar] [CrossRef] [Green Version]
  27. Óvilo, C.; Fernández, A.; Fernández, A.I.; Folch, J.M.; Varona, L.; Benítez, R.; Nuñez, Y.; Rodríguez, C.; Silió, L. Hypothalamic expression of porcine leptin receptor (LEPR), neuropeptide Y (NPY), and cocaine- and amphetamine-regulated transcript (CART) genes is influenced by LEPR genotype. Mamm. Genome 2010, 21, 583–591. [Google Scholar] [CrossRef]
  28. Kersten, S. Mechanisms of nutritional and hormonal regulation of lipogenesis. EMBO Rep. 2001, 2, 282–286. [Google Scholar] [CrossRef] [Green Version]
  29. Arner, P. The adipocyte in insulin resistance: Key molecules and the impact of the thiazolidinediones. Trends Endocrinol. Metab. TEM 2003, 14, 137–145. [Google Scholar] [CrossRef]
  30. Rodríguez-López, J.M.; Lachica, M.; González-Valero, L.; Fernández-Fígares, I. Determining insulin sensitivity from glucose tolerance tests in Iberian and Landrace pigs. bioRxiv 2019. [Google Scholar] [CrossRef]
  31. Fernandez-Veledo, S.; Nieto-Vazquez, I.; de Castro, J.; Ramos, M.P.; Bruderlein, S.; Moller, P.; Lorenzo, M. Hyperinsulinemia induces insulin resistance on glucose and lipid metabolism in a human adipocytic cell line: Paracrine interaction with myocytes. J. Clin. Endocrinol. Metab. 2008, 93, 2866–2876. [Google Scholar] [CrossRef] [PubMed] [Green Version]
  32. Rask-Madsen, C.; King, G.L. Mechanisms of Disease: Endothelial dysfunction in insulin resistance and diabetes. Nat. Clin. Pract. Endocrinol. Metab. 2007, 3, 46–56. [Google Scholar] [CrossRef]
  33. Martins, J.M.; Fialho, R.; Albuquerque, A.; Neves, J.; Freitas, A.; Nunes, J.T.; Charneca, R. Growth, blood, carcass and meat quality traits from local pig breeds and their crosses. Animal 2020, 14, 636–647. [Google Scholar] [CrossRef]
  34. FastQC. Available online: http://www.bioinformatics.bbsrc.ac.uk/projects/fastqc/ (accessed on 25 October 2019).
  35. Trim Galore. Available online: https://www.bioinformatics.babraham.ac.uk/projects/trim_galore/ (accessed on 25 October 2019).
  36. SAMtools. Available online: http://www.htslib.org/ (accessed on 31 October 2019).
  37. Anders, S.; Pyl, P.T.; Huber, W. HTSeq—A Python framework to work with high-throughput sequencing data. Bioinformatics 2014, 31, 166–169. [Google Scholar] [CrossRef]
  38. Love, M.I.; Huber, W.; Anders, S. Moderated estimation of fold change and dispersion for RNA-seq data with DESeq2. Genome Biol. 2014, 15, 550. [Google Scholar] [CrossRef] [Green Version]
  39. Edgar, R.; Domrachev, M.; Lash, A.E. Gene Expression Omnibus: NCBI gene expression and hybridization array data repository. Nucleic Acids Res. 2002, 30, 207–210. [Google Scholar] [CrossRef] [Green Version]
  40. Krämer, A.; Green, J.; Pollard, J., Jr.; Tugendreich, S. Causal analysis approaches in Ingenuity Pathway Analysis. Bioinformatics 2013, 30, 523–530. [Google Scholar] [CrossRef]
  41. Peffer, P.L.; Lin, X.; Odle, J. Hepatic beta-oxidation and carnitine palmitoyltransferase I in neonatal pigs after dietary treatments of clofibric acid, isoproterenol, and medium-chain triglycerides. Am. J. Physiol. Regul. Integr. Comp. Physiol. 2005, 288, R1518–R1524. [Google Scholar] [CrossRef] [Green Version]
  42. Vandesompele, J.; Preter, K.D.; Pattyn, F.; Poppe, B.; Roy, N.V.; Paepe, A.D.; Speleman, F. Accurate normalization of real-time quantitative RT-PCR data by geometric averaging of multiple internal control genes. Genome Biol. 2002, 3, research0034.1. [Google Scholar] [CrossRef] [PubMed] [Green Version]
  43. Lawrence, I.K.L. A Concordance Correlation Coefficient to Evaluate Reproducibility. Biometrics 1989, 45, 255–268. [Google Scholar] [CrossRef]
  44. Zhou, L.; Wang, L.; Zhao, W.; Ren, S.; Tu, F.; Fu, Y.; Li, B.; Wang, X.; Fang, X. Transcriptome sequencing analysis of porcine MDM response to FSL-1 stimulation. Microb. Pathog. 2020, 138, 103830. [Google Scholar] [CrossRef]
  45. Wang, Y.; Hu, T.; Wu, L.; Liu, X.; Xue, S.; Lei, M. Identification of non-coding and coding RNAs in porcine endometrium. Genomics 2017, 109, 43–50. [Google Scholar] [CrossRef] [PubMed]
  46. Wang, Q.; Qi, R.; Wang, J.; Huang, W.; Wu, Y.; Huang, X.; Yang, F.; Huang, J. Differential expression profile of miRNAs in porcine muscle and adipose tissue during development. Gene 2017, 618, 49–56. [Google Scholar] [CrossRef] [PubMed]
  47. Corominas, J.; Ramayo-Caldas, Y.; Puig-Oliveras, A.; Estellé, J.; Castelló, A.; Alves, E.; Pena, R.N.; Ballester, M.; Folch, J.M. Analysis of porcine adipose tissue transcriptome reveals differences in de novo fatty acid synthesis in pigs with divergent muscle fatty acid composition. BMC Genom. 2013, 14, 843. [Google Scholar] [CrossRef]
  48. Puig-Oliveras, A.; Ramayo-Caldas, Y.; Corominas, J.; Estellé, J.; Pérez-Montarelo, D.; Hudson, N.J.; Casellas, J.; Folch, J.M.; Ballester, M. Differences in Muscle Transcriptome among Pigs Phenotypically Extreme for Fatty Acid Composition. PLoS ONE 2014, 9, e99720. [Google Scholar] [CrossRef] [Green Version]
  49. Ayuso, M.; Fernández, A.; Núñez, Y.; Benítez, R.; Isabel, B.; Barragán, C.; Fernández, A.I.; Rey, A.I.; Medrano, J.F.; Cánovas, A.; et al. Comparative Analysis of Muscle Transcriptome between Pig Genotypes Identifies Genes and Regulatory Mechanisms Associated to Growth, Fatness and Metabolism. PLoS ONE 2015, 10, e0145162. [Google Scholar] [CrossRef] [Green Version]
  50. Ramayo-Caldas, Y.; Mach, N.; Esteve-Codina, A.; Corominas, J.; Castello, A.; Ballester, M.; Estelle, J.; Ibanez-Escriche, N.; Fernandez, A.I.; Perez-Enciso, M.; et al. Liver transcriptome profile in pigs with extreme phenotypes of intramuscular fatty acid composition. BMC Genom. 2012, 13, 18. [Google Scholar] [CrossRef] [Green Version]
  51. Chen, C.; Ai, H.; Ren, J.; Li, W.; Li, P.; Qiao, R.; Ouyang, J.; Yang, M.; Ma, J.; Huang, L. A global view of porcine transcriptome in three tissues from a full-sib pair with extreme phenotypes in growth and fat deposition by paired-end RNA sequencing. BMC Genom. 2011, 12, 448. [Google Scholar] [CrossRef] [Green Version]
  52. Benítez, R.; Trakooljul, N.; Núñez, Y.; Isabel, B.; Murani, E.; De Mercado, E.; Gómez-Izquierdo, E.; García-Casco, J.; López-Bote, C.; Wimmers, K.; et al. Breed, Diet, and Interaction Effects on Adipose Tissue Transcriptome in Iberian and Duroc Pigs Fed Different Energy Sources. Genes (Basel) 2019, 10, 589. [Google Scholar] [CrossRef] [Green Version]
  53. Caicedo, A.; Pereira, E.; Margolskee, R.F.; Roper, S.D. Role of the G-protein subunit alpha-gustducin in taste cell responses to bitter stimuli. J. Neurosci. 2003, 23, 9947–9952. [Google Scholar] [CrossRef] [PubMed] [Green Version]
  54. Ribani, A.; Bertolini, F.; Schiavo, G.; Scotti, E.; Utzeri, V.J.; Dall’Olio, S.; Trevisi, P.; Bosi, P.; Fontanesi, L. Next generation semiconductor based sequencing of bitter taste receptor genes in different pig populations and association analysis using a selective DNA pool-seq approach. Anim. Genet. 2017, 48, 97–102. [Google Scholar] [CrossRef] [PubMed] [Green Version]
  55. Gnoni, G.V.; Priore, P.; Geelen, M.J.; Siculella, L. The mitochondrial citrate carrier: Metabolic role and regulation of its activity and expression. IUBMB Life 2009, 61, 987–994. [Google Scholar] [CrossRef] [PubMed]
  56. Sun, T.; Hayakawa, K.; Bateman, K.S.; Fraser, M.E. Identification of the Citrate-binding Site of Human ATP-Citrate Lyase Using X-ray Crystallography. J. Biol. Chem. 2010, 285, 27418–27428. [Google Scholar] [CrossRef] [PubMed] [Green Version]
  57. Berg, J.M.; Tymoczko, J.L.; Gatto, G.J.; Stryer, L. Biochemistry, 8th ed.; W.H. Freeman: New York, NY, USA, 2015. [Google Scholar]
  58. Lehninger, A.L.; Nelson, D.L.; Cox, M.M. Lehninger Principles of Biochemistry; W.H. Freeman: New York, NY, USA, 2008. [Google Scholar]
  59. Matsuzaka, T.; Shimano, H. Elovl6: A new player in fatty acid metabolism and insulin sensitivity. J. Mol. Med. 2009, 87, 379–384. [Google Scholar] [CrossRef] [Green Version]
  60. Paton, C.M.; Ntambi, J.M. Biochemical and physiological function of stearoyl-CoA desaturase. Am. J. Physiol. Endocrinol. Metab. 2009, 297, E28–E37. [Google Scholar] [CrossRef] [Green Version]
  61. Teixeira, A.; Rodrigues, S. Pork Meat Quality of Preto Alentejano and Commercial Largewhite Landrace Cross. J. Integr. Agric. 2013, 12, 1961–1971. [Google Scholar] [CrossRef]
  62. Liang, Y.-J.; Jiang, J.-G. Characterization of malic enzyme and the regulation of its activity and metabolic engineering on lipid production. RSC Adv. 2015, 5, 45558–45570. [Google Scholar] [CrossRef]
  63. González-Manchón, C.; Ferrer, M.; Ayuso, M.S.; Parrilla, R. Cloning, sequencing and functional expression of a cDNA encoding a NADP-dependent malic enzyme from human liver. Gene 1995, 159, 255–260. [Google Scholar] [CrossRef]
  64. Millward, C.A.; Desantis, D.; Hsieh, C.-W.; Heaney, J.D.; Pisano, S.; Olswang, Y.; Reshef, L.; Beidelschies, M.; Puchowicz, M.; Croniger, C.M. Phosphoenolpyruvate carboxykinase (Pck1) helps regulate the triglyceride/fatty acid cycle and development of insulin resistance in mice. J. Lipid Res. 2010, 51, 1452–1463. [Google Scholar] [CrossRef] [PubMed] [Green Version]
  65. Latorre, P.; Burgos, C.; Hidalgo, J.; Varona, L.; Carrodeguas, J.A.; López-Buesa, P. c.A2456C-substitution in Pck1 changes the enzyme kinetic and functional properties modifying fat distribution in pigs. Sci. Rep. 2016, 6, 19617. [Google Scholar] [CrossRef] [PubMed] [Green Version]
  66. Montez, J.M.; Soukas, A.; Asilmaz, E.; Fayzikhodjaeva, G.; Fantuzzi, G.; Friedman, J.M. Acute leptin deficiency, leptin resistance, and the physiologic response to leptin withdrawal. Proc. Natl. Acad. Sci. USA 2005, 102, 2537–2542. [Google Scholar] [CrossRef] [PubMed] [Green Version]
  67. Stern, J.H.; Rutkowski, J.M.; Scherer, P.E. Adiponectin, Leptin, and Fatty Acids in the Maintenance of Metabolic Homeostasis through Adipose Tissue Crosstalk. Cell Metab. 2016, 23, 770–784. [Google Scholar] [CrossRef]
  68. Benítez, R.; Fernández, A.; Isabel, B.; Núñez, Y.; Mercado, E.D.; Gómez-Izquierdo, E.; García-Casco, J.; López-Bote, C.; Óvilo, C. Modulatory Effects of Breed, Feeding Status, and Diet on Adipogenic, Lipogenic, and Lipolytic Gene Expression in Growing Iberian and Duroc Pigs. Int. J. Mol. Sci. 2018, 19, 22. [Google Scholar] [CrossRef] [Green Version]
  69. Fernández-Fígares, I.; Lachica, M.; Nieto, R.; Rivera-Ferre, M.G.; Aguilera, J.F. Serum profile of metabolites and hormones in obese (Iberian) and lean (Landrace) growing gilts fed balanced or lysine deficient diets. Livest. Sci. 2007, 110, 73–81. [Google Scholar] [CrossRef]
  70. Pedersen, T.A.; Bereshchenko, O.; Garcia-Silva, S.; Ermakova, O.; Kurz, E.; Mandrup, S.; Porse, B.T.; Nerlov, C. Distinct C/EBPalpha motifs regulate lipogenic and gluconeogenic gene expression in vivo. EMBO J. 2007, 26, 1081–1093. [Google Scholar] [CrossRef] [Green Version]
  71. Olofsson, L.E.; Orho-Melander, M.; William-Olsson, L.; Sjoholm, K.; Sjostrom, L.; Groop, L.; Carlsson, B.; Carlsson, L.M.; Olsson, B. CCAAT/enhancer binding protein alpha (C/EBPalpha) in adipose tissue regulates genes in lipid and glucose metabolism and a genetic variation in C/EBPalpha is associated with serum levels of triglycerides. J. Clin. Endocrinol. Metab. 2008, 93, 4880–4886. [Google Scholar] [CrossRef] [Green Version]
  72. Matulewicz, N.; Stefanowicz, M.; Nikołajuk, A.; Karczewska-Kupczewska, M. Markers of Adipogenesis, but Not Inflammation, in Adipose Tissue Are Independently Related to Insulin Sensitivity. J. Clin. Endocrinol. Metab. 2017, 102, 3040–3049. [Google Scholar] [CrossRef] [Green Version]
  73. Acosta, J.R.; Douagi, I.; Andersson, D.P.; Bäckdahl, J.; Rydén, M.; Arner, P.; Laurencikiene, J. Increased fat cell size: A major phenotype of subcutaneous white adipose tissue in non-obese individuals with type 2 diabetes. Diabetologia 2016, 59, 560–570. [Google Scholar] [CrossRef] [Green Version]
  74. Dixon, T.M.; Daniel, K.W.; Farmer, S.R.; Collins, S. CCAAT/enhancer-binding protein alpha is required for transcription of the beta 3-adrenergic receptor gene during adipogenesis. J. Biol. Chem. 2001, 276, 722–728. [Google Scholar] [CrossRef] [PubMed] [Green Version]
  75. Michal, J.J.; Zhang, Z.W.; Gaskins, C.T.; Jiang, Z. The bovine fatty acid binding protein 4 gene is significantly associated with marbling and subcutaneous fat depth in Wagyu x Limousin F2 crosses. Anim. Genet. 2006, 37, 400–402. [Google Scholar] [CrossRef] [PubMed]
  76. Shi-Zheng, G.; Zhao, S.-M. Physiology, Affecting Factors and Strategies for Control of Pig Meat Intramuscular Fat. Recent Pat. Food Nutr. Agric. 2009, 1, 59–74. [Google Scholar] [CrossRef] [Green Version]
  77. Garin-Shkolnik, T.; Rudich, A.; Hotamisligil, G.S.; Rubinstein, M. FABP4 attenuates PPARgamma and adipogenesis and is inversely correlated with PPARgamma in adipose tissues. Diabetes 2014, 63, 900–911. [Google Scholar] [CrossRef] [PubMed] [Green Version]
  78. Furuhashi, M.; Saitoh, S.; Shimamoto, K.; Miura, T. Fatty Acid-Binding Protein 4 (FABP4): Pathophysiological Insights and Potent Clinical Biomarker of Metabolic and Cardiovascular Diseases. Clin. Med. Insights Cardiol. 2015, 8, 23–33. [Google Scholar] [CrossRef] [PubMed]
  79. Alfares, M.N.; Perks, C.M.; Hamilton-Shield, J.P.; Holly, J.M.P. Insulin-like growth factor-II in adipocyte regulation: Depot-specific actions suggest a potential role limiting excess visceral adiposity. Am. J. Physiol. Endocrinol. Metab. 2018, 315, E1098–E1107. [Google Scholar] [CrossRef] [PubMed]
  80. Van Laere, A.-S.; Nguyen, M.; Braunschweig, M.; Nezer, C.; Collette, C.; Moreau, L.; Archibald, A.L.; Haley, C.S.; Buys, N.; Tally, M.; et al. A regulatory mutation in IGF2 causes a major QTL effect on muscle growth in the pig. Nature 2003, 425, 832–836. [Google Scholar] [CrossRef]
  81. Criado-Mesas, L.; Ballester, M.; Crespo-Piazuelo, D.; Castelló, A.; Benítez, R.; Fernández, A.I.; Folch, J.M. Analysis of porcine IGF2 gene expression in adipose tissue and its effect on fatty acid composition. PLoS ONE 2019, 14, e0220708. [Google Scholar] [CrossRef] [Green Version]
  82. Óvilo, C.; Benítez, R.; Fernández, A.; Núñez, Y.; Ayuso, M.; Fernández, A.I.; Rodríguez, C.; Isabel, B.; Rey, A.I.; López-Bote, C.; et al. Longissimus dorsi transcriptome analysis of purebred and crossbred Iberian pigs differing in muscle characteristics. BMC Genom. 2014, 15, 413. [Google Scholar] [CrossRef] [Green Version]
  83. Munroe, M.E.; Bishop, G.A. A costimulatory function for T cell CD40. J. Immunol. 2007, 178, 671–682. [Google Scholar] [CrossRef] [Green Version]
  84. Yi, Z.; Bishop, G.A. Regulatory role of CD40 in obesity-induced insulin resistance. Adipocyte 2014, 4, 65–69. [Google Scholar] [CrossRef] [PubMed]
  85. Guo, C.-A.; Kogan, S.; Amano, S.U.; Wang, M.; Dagdeviren, S.; Friedline, R.H.; Aouadi, M.; Kim, J.K.; Czech, M.P. CD40 deficiency in mice exacerbates obesity-induced adipose tissue inflammation, hepatic steatosis, and insulin resistance. Am. J. Physiol. Endocrinol. Metab. 2013, 304, E951–E963. [Google Scholar] [CrossRef] [PubMed] [Green Version]
  86. Kopchick, J.J.; Berryman, D.E.; Puri, V.; Lee, K.Y.; Jorgensen, J.O.L. The effects of growth hormone on adipose tissue: Old observations, new mechanisms. Nat. Rev. Endocrinol. 2019. [Google Scholar] [CrossRef] [PubMed]
  87. Hajjari, M.; Salavaty, A. HOTAIR: An oncogenic long non-coding RNA in different cancers. Cancer Biol. Med. 2015, 12, 1–9. [Google Scholar] [CrossRef]
  88. Divoux, A.; Karastergiou, K.; Xie, H.; Guo, W.; Perera, R.J.; Fried, S.K.; Smith, S.R. Identification of a novel lncRNA in gluteal adipose tissue and evidence for its positive effect on preadipocyte differentiation. Obesity (Silver Spring) 2014, 22, 1781–1785. [Google Scholar] [CrossRef] [Green Version]
  89. Ma, D.D.; Yuan, L.L.; Lin, L.Q. LncRNA HOTAIR contributes to the tumorigenesis of nasopharyngeal carcinoma via up-regulating FASN. Eur. Rev. Med Pharmacol. Sci. 2017, 21, 5143–5152. [Google Scholar] [CrossRef]
  90. Nilsson, L.A.; Roepstorff, C.; Kiens, B.; Billig, H.; Ling, C. Prolactin suppresses malonyl-CoA concentration in human adipose tissue. Horm. Metab. Res. 2009, 41, 747–751. [Google Scholar] [CrossRef]
  91. Pala, N.A.; Laway, B.A.; Misgar, R.A.; Dar, R.A. Metabolic abnormalities in patients with prolactinoma: Response to treatment with cabergoline. Diabetol. Metab. Syndr. 2015, 7, 99. [Google Scholar] [CrossRef] [Green Version]
  92. Nilsson, L.; Binart, N.; Bohlooly, Y.M.; Bramnert, M.; Egecioglu, E.; Kindblom, J.; Kelly, P.A.; Kopchick, J.J.; Ormandy, C.J.; Ling, C.; et al. Prolactin and growth hormone regulate adiponectin secretion and receptor expression in adipose tissue. Biochem. Biophys. Res. Commun. 2005, 331, 1120–1126. [Google Scholar] [CrossRef] [Green Version]
  93. Mihaylova, M.M.; Shaw, R.J. The AMPK signalling pathway coordinates cell growth, autophagy and metabolism. Nat. Cell Biol. 2011, 13, 1016–1023. [Google Scholar] [CrossRef]
  94. Kim, S.J.; Tang, T.; Abbott, M.; Viscarra, J.A.; Wang, Y.; Sul, H.S. AMPK Phosphorylates Desnutrin/ATGL and Hormone-Sensitive Lipase to Regulate Lipolysis and Fatty Acid Oxidation within Adipose Tissue. Mol. Cell. Biol. 2016, 36, 1961–1976. [Google Scholar] [CrossRef] [Green Version]
  95. Li, Y.; Xu, S.; Mihaylova, M.M.; Zheng, B.; Hou, X.; Jiang, B.; Park, O.; Luo, Z.; Lefai, E.; Shyy, J.Y.J.; et al. AMPK phosphorylates and inhibits SREBP activity to attenuate hepatic steatosis and atherosclerosis in diet-induced insulin-resistant mice. Cell Metab. 2011, 13, 376–388. [Google Scholar] [CrossRef] [Green Version]
  96. García-Contreras, C.; Madsen, O.; Groenen, M.A.M.; López-García, A.; Vázquez-Gómez, M.; Astiz, S.; Núñez, Y.; Benítez, R.; Fernández, A.; Isabel, B.; et al. Impact of genotype, body weight and sex on the prenatal muscle transcriptome of Iberian pigs. PLoS ONE 2020, 15, e0227861. [Google Scholar] [CrossRef] [Green Version]
  97. Chang, H.R.; Kim, H.J.; Xu, X.; Ferrante, A.W., Jr. Macrophage and adipocyte IGF1 maintain adipose tissue homeostasis during metabolic stresses. Obesity (Silver Spring) 2016, 24, 172–183. [Google Scholar] [CrossRef] [Green Version]
  98. Musarò, A.; McCullagh, K.J.A.; Naya, F.J.; Olson, E.N.; Rosenthal, N. IGF-1 induces skeletal myocyte hypertrophy through calcineurin in association with GATA-2 and NF-ATc1. Nature 1999, 400, 581–585. [Google Scholar] [CrossRef]
  99. LeRoith, D.; Yakar, S. Mechanisms of Disease: Metabolic effects of growth hormone and insulin-like growth factor 1. Nat. Clin. Pract. Endocrinol. Metab. 2007, 3, 302–310. [Google Scholar] [CrossRef]
  100. Yen, P.M. Physiological and Molecular Basis of Thyroid Hormone Action. Physiol. Rev. 2001, 81, 1097–1142. [Google Scholar] [CrossRef] [Green Version]
  101. Febbraio, M.A. Role of interleukins in obesity: Implications for metabolic disease. Trends Endocrinol. Metab. 2014, 25, 312–319. [Google Scholar] [CrossRef]
  102. Karagiannis, F.; Wilhelm, C. More Is Less: IL-9 in the Resolution of Inflammation. Immunity 2017, 47, 403–405. [Google Scholar] [CrossRef] [Green Version]
  103. Matsuzawa, Y. Adiponectin: Identification, physiology and clinical relevance in metabolic and vascular disease. Atheroscler. Suppl. 2005, 6, 7–14. [Google Scholar] [CrossRef]
  104. Fang, H.; Judd, R.L. Adiponectin Regulation and Function. In Comprehensive Physiology; Pollock, D.M., Ed.; American Physiological Society: Rockville, MD, USA, 2018; pp. 1031–1063. [Google Scholar] [CrossRef]
  105. Pivovarova, O.; Gogebakan, O.; Sucher, S.; Groth, J.; Murahovschi, V.; Kessler, K.; Osterhoff, M.; Rudovich, N.; Kramer, A.; Pfeiffer, A.F. Regulation of the clock gene expression in human adipose tissue by weight loss. Int. J. Obes. 2016, 40, 899–906. [Google Scholar] [CrossRef] [PubMed]
  106. Nam, D.; Chatterjee, S.; Yin, H.; Liu, R.; Lee, J.; Yechoor, V.K.; Ma, K. Novel Function of Rev-erbα in Promoting Brown Adipogenesis. Sci. Rep. 2015, 5, 11239. [Google Scholar] [CrossRef] [PubMed] [Green Version]
  107. Kojetin, D.J.; Burris, T.P. A role for rev-erbalpha ligands in regulation of adipogenesis. Curr. Pharm. Des. 2011, 17, 320–324. [Google Scholar] [CrossRef]
  108. Madison, B.B. Srebp2: A master regulator of sterol and fatty acid synthesis. J. Lipid Res. 2016, 57, 333–335. [Google Scholar] [CrossRef] [Green Version]
  109. Miserez, A.R.; Muller, P.Y.; Barella, L.; Barella, S.; Staehelin, H.B.; Leitersdorf, E.; Kark, J.D.; Friedlander, Y. Sterol-regulatory element-binding protein (SREBP)-2 contributes to polygenic hypercholesterolaemia. Atherosclerosis 2002, 164, 15–26. [Google Scholar] [CrossRef]
  110. Crewe, C.; Zhu, Y.; Paschoal, V.A.; Joffin, N.; Ghaben, A.L.; Gordillo, R.; Oh, D.Y.; Liang, G.; Horton, J.D.; Scherer, P.E. SREBP-regulated adipocyte lipogenesis is dependent on substrate availability and redox modulation of mTORC1. JCI Insight 2019, 4. [Google Scholar] [CrossRef]
  111. Ge, K.; Cho, Y.-W.; Guo, H.; Hong, T.B.; Guermah, M.; Ito, M.; Yu, H.; Kalkum, M.; Roeder, R.G. Alternative Mechanisms by Which Mediator Subunit MED1/TRAP220 Regulates Peroxisome Proliferator-Activated Receptor γ-Stimulated Adipogenesis and Target Gene Expression. Mol. Cell. Biol. 2008, 28, 1081–1091. [Google Scholar] [CrossRef] [Green Version]
  112. Sarjeant, K.; Stephens, J.M. Adipogenesis. Cold Spring Harb. Perspect. Biol. 2012, 4, a008417. [Google Scholar] [CrossRef] [Green Version]
  113. Watanabe, M.; Takahashi, H.; Saeki, Y.; Ozaki, T.; Itoh, S.; Suzuki, M.; Mizushima, W.; Tanaka, K.; Hatakeyama, S. The E3 ubiquitin ligase TRIM23 regulates adipocyte differentiation via stabilization of the adipogenic activator PPARγ. eLife 2015, 4, e05615. [Google Scholar] [CrossRef]
  114. Rosen, E.D.; MacDougald, O.A. Adipocyte differentiation from the inside out. Nat. Rev. Mol. Cell Biol. 2006, 7, 885–896. [Google Scholar] [CrossRef]
  115. Albuquerque, A.; Neves, J.A.; Redondeiro, M.; Laranjo, M.; Félix, M.R.; Freitas, A.; Tirapicos, J.L.; Martins, J.M. Long term betaine supplementation regulates genes involved in lipid and cholesterol metabolism of two muscles from an obese pig breed. Meat Sci. 2017, 124, 25–33. [Google Scholar] [CrossRef]
  116. Dong, X.-Y.; Tang, S.-Q.; Chen, J.-D. Dual functions of Insig proteins in cholesterol homeostasis. Lipids Health Dis. 2012, 11, 173. [Google Scholar] [CrossRef] [Green Version]
  117. Burg, J.S.; Espenshade, P.J. Regulation of HMG-CoA reductase in mammals and yeast. Prog. Lipid Res. 2011, 50, 403–410. [Google Scholar] [CrossRef] [Green Version]
  118. Junye, C.; Yi, L.; Mengyuan, T.; Qiren, H. Molecular mechanisms of FOXO1 in adipocyte differentiation. J. Mol. Endocrinol. 2019, 62, R239–R253. [Google Scholar] [CrossRef]
  119. Xu, M.; Chen, X.; Chen, D.; Yu, B.; Huang, Z. FoxO1: A novel insight into its molecular mechanisms in the regulation of skeletal muscle differentiation and fiber type specification. Oncotarget 2017, 8, 10662–10674. [Google Scholar] [CrossRef] [Green Version]
Figure 1. Linking lipid biosynthesis with carbohydrate metabolism: direction of upregulated genes in the Portuguese local pig breeds.
Genes 11 00422 g001
Figure 2. Carbohydrate metabolism, Lipid metabolism and Molecular transport Ingenuity Pathway Analysis (IPA) Network.
Genes 11 00422 g002
Table 1. Gene expression comparison through RNA-seq and Real Time qPCR of the selected genes.
GenesRNA-seqReal Time qPCRCorrelation
Log2 FCq-ValueLog2 FCp-Valuerp-Value
ACACA0.8540.1161.0550.0770.9867.07 × 10−6
ACLY1.8530.0051.6010.0680.8640.006
ADIPOQ−0.6250.297−0.6850.1100.7070.050
ELOVL61.2360.0090.6710.1360.6500.081
FASN1.6910.0021.3590.1000.9200.001
LEP1.3760.0370.9290.0460.7390.036
ME12.0908.42 × 10−61.0080.1060.7570.030
PCK1−1.9590.037−2.6600.0010.8200.013
SCD2.3110.0261.3510.0870.6430.086
n = 4
Table 2. Causal regulator effects predicted to be activated and inhibited in AL.
Master RegulatorParticipating RegulatorsPredicted Activation (AL)Z-Scorep-ValueTarget Molecules in Dataset
INSIG2INSIG2Inhibited−2.2363.74 × 10−65
FLCNEsrra, FLCN, MTORC1, PPARGC1AInhibited−2.2367.72 × 10−620
PKIACREB1, Pka, PKIAInhibited−2.8871.26 × 10−512
LRATAkt, INSR, JAK2, LRAT, RPE65, STAT5a/bInhibited−3.3003.03 × 10−518
NRG4NRG4Inhibited−2.0003.76 × 10−54
PDGF BBPDGF BBInhibited−2.3331.54 × 10−49
CREB1CREB1Inhibited−2.8281.69 × 10−48
GNASGNASInhibited−2.2361.97 × 10−45
MFSD2AMFSD2AInhibited−2.0004.85 × 10−44
MEF2CMEF2CInhibited−2.2361.47 × 10−35
HSP27Hsp27Inhibited−2.0001.63 × 10−34
NDFIP1Akt, Jnk, Map3k7, NDFIP1, PTEN, SRCActivated2.4492.31 × 10−624
NR1D1NR1D1Activated2.2365.36 × 10−65
NSUN3NSUN3Activated2.0005.61 × 10−64
ALKBH1ALKBH1Activated2.0005.61 × 10−64
UCHL3Akt, AMPK, FOXO1, GSK3B, INSR, UCHL3Activated2.4491.05 × 10−524
MIR-29B-3P (AND OTHER MIRNAS W/SEED AGCACCA)Akt, ERK, miR-29b-3p (and other miRNAs w/seed AGCACCA), PMP22Activated2.5001.06 × 10−516
ARNTLAkt, ARNTL, CLOCK, NFE2L2Activated2.2002.85 × 10−525
IDH1IDH1Activated2.2362.97 × 10−55
EPCAMEPCAMActivated2.0003.76 × 10−54
ATP7BAkt, ATP7BActivated2.8874.58 × 10−512
DAP3DAP3Activated2.0005.36 × 10−54
BACE1BACE1, CREB1, PkaActivated2.7147.70 × 10−511
ATP7BATP7BActivated2.2363.98 × 10−45
MLXIPLMLXIPLActivated2.0004.02 × 10−44
SCAPSCAPActivated2.4494.21 × 10−46
SREBF2SREBF2Activated2.4496.09 × 10−46
GHRLGHRLActivated2.0008.06 × 10−44
MED1MED1Activated2.4491.00 × 10−36

