The Role of APOSTART in Switching between Sexuality and Apomixis in Poa pratensis

 ,
,  ,
,  , ,
, ,  and
and 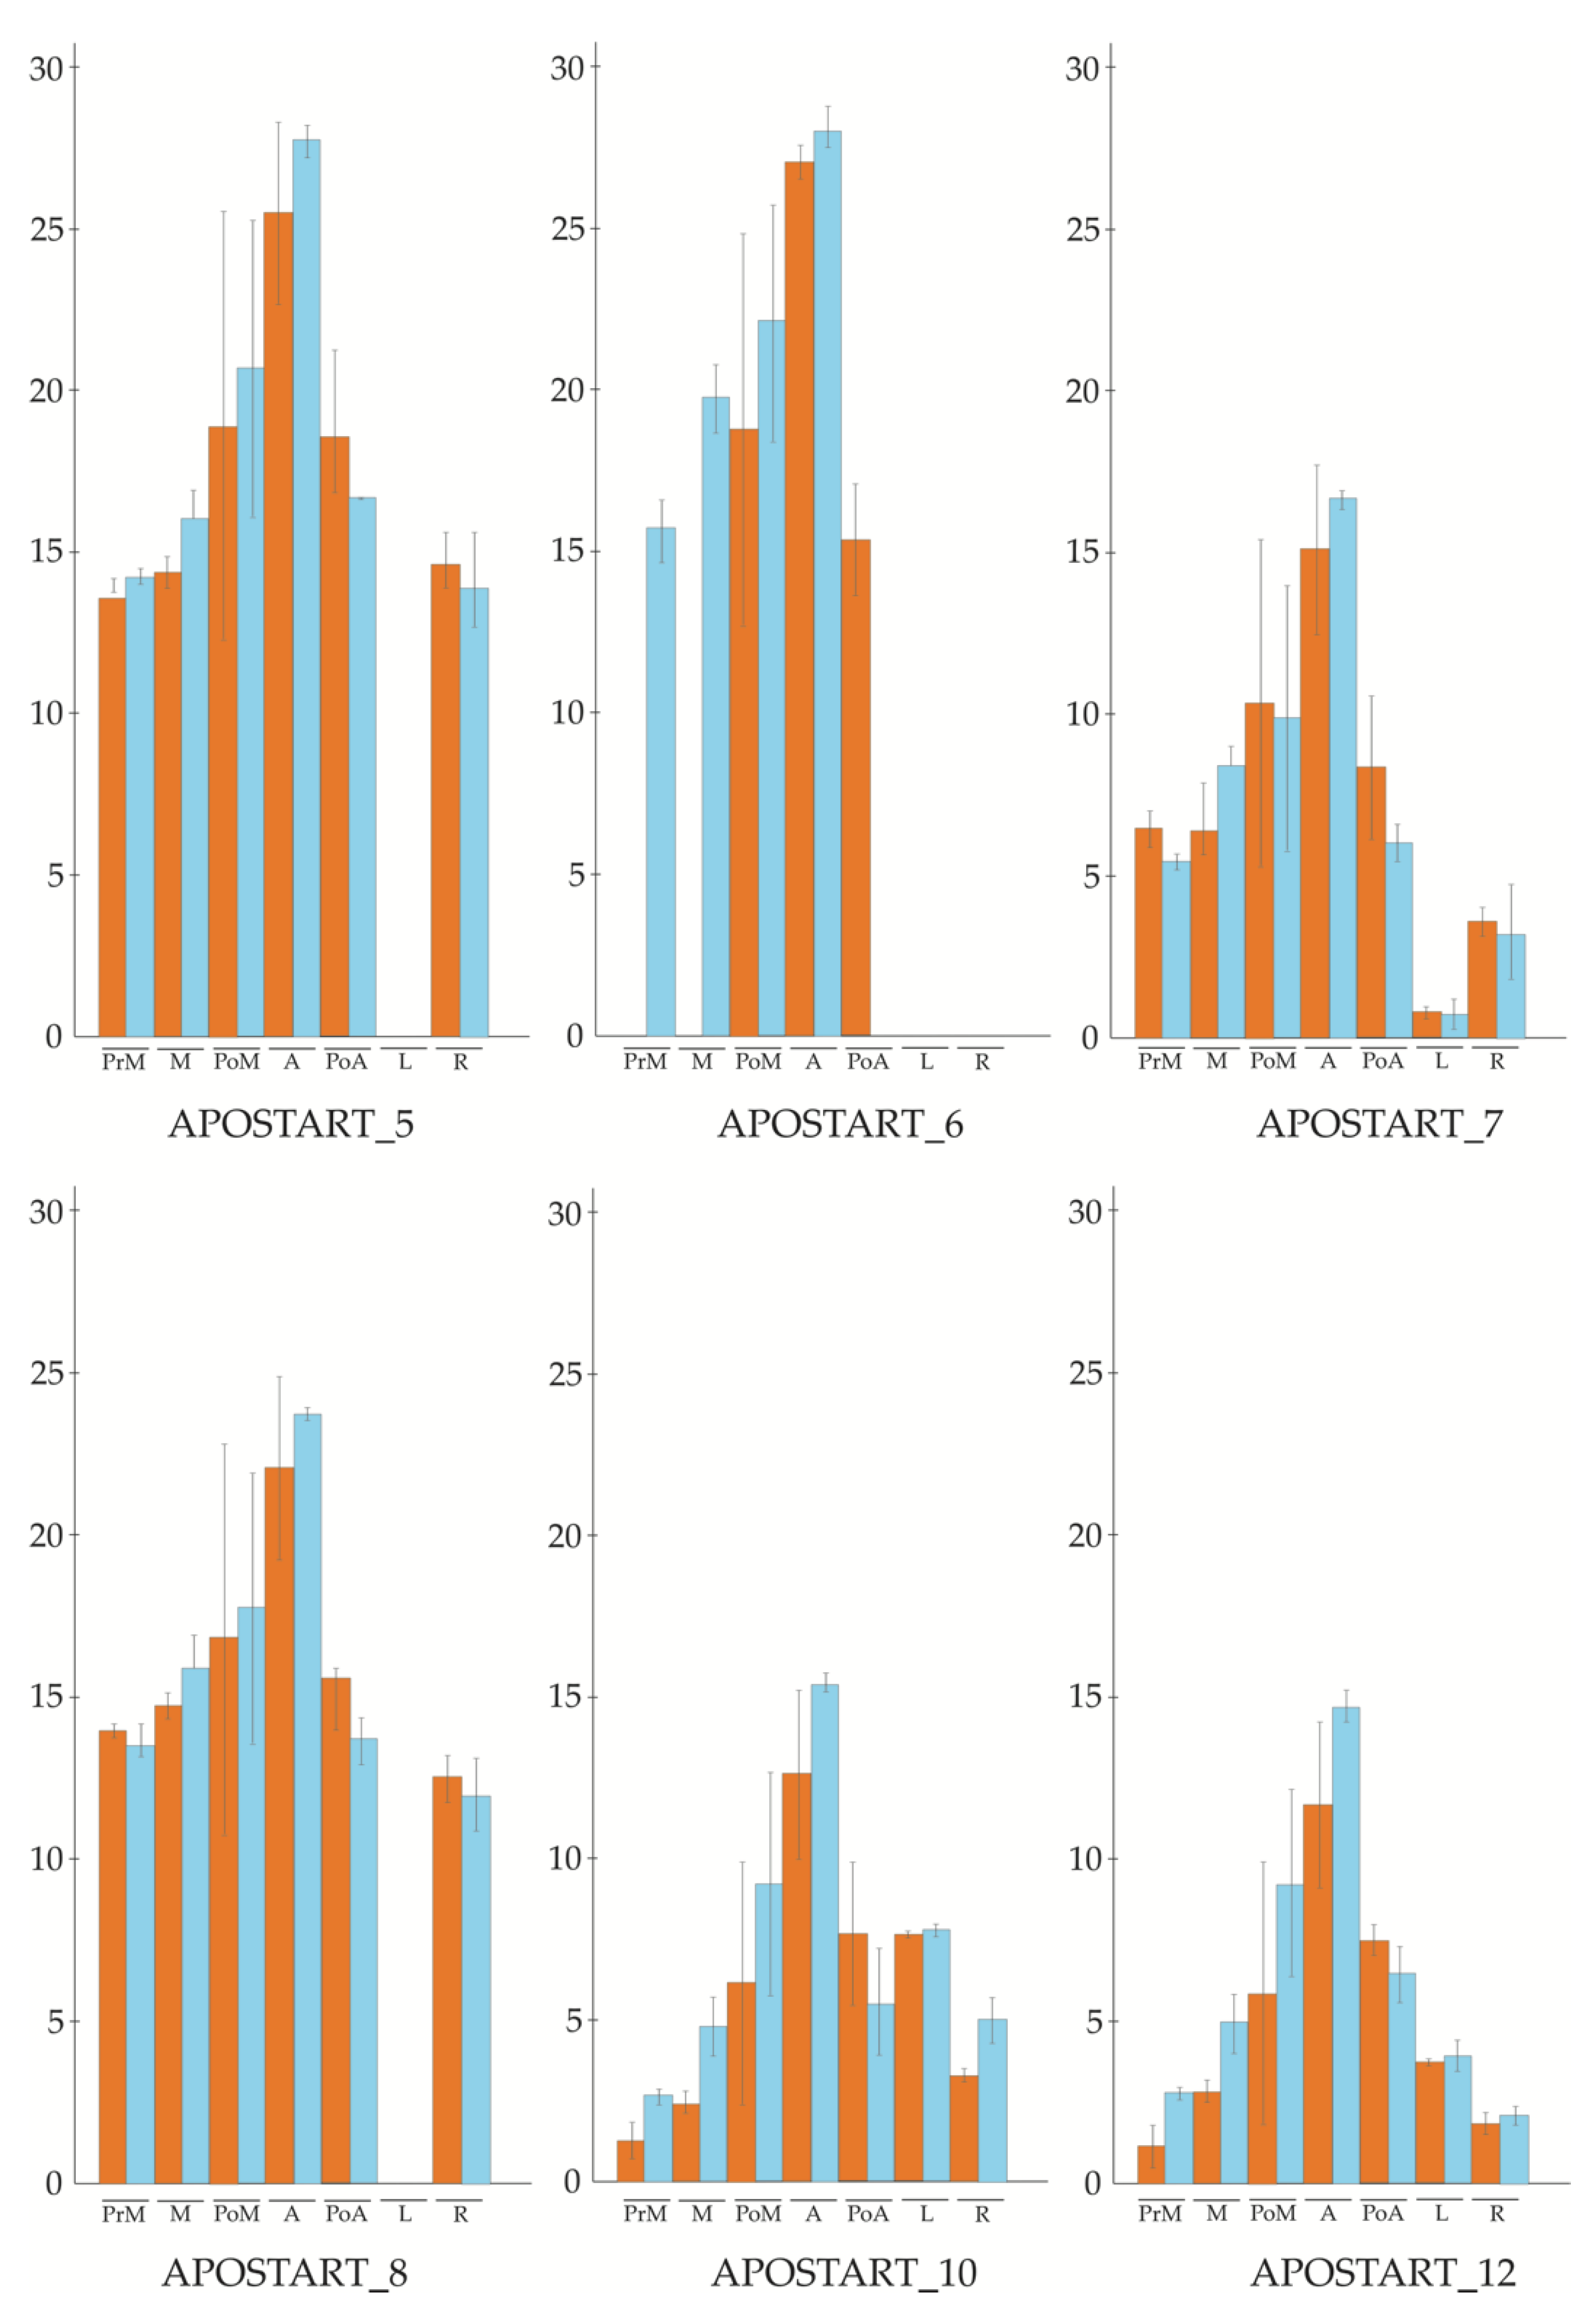
Abstract
:1. Introduction
2. Materials and Methods
2.1. Plant Material
2.2. Rapid Amplification of cDNA Ends Analysis
2.3. Cloning of Full-Length Genomic and cDNAs
2.4. RNA Isolation and cDNA Synthesis
2.5. qPCR
2.6. SCAR Marker Development and Testing
2.7. In Situ Hybridization
2.8. Sequence Data Analysis and Phylogenetic Trees
2.9. Phosphorylation Site, Secondary Structure Predictions, and Subcellular Localization Prediction
2.10. Molecular Modeling
2.11. Consensus Scoring and Molecular Dynamics
3. Results
3.1. Cloning of APOSTART Alleles/Members
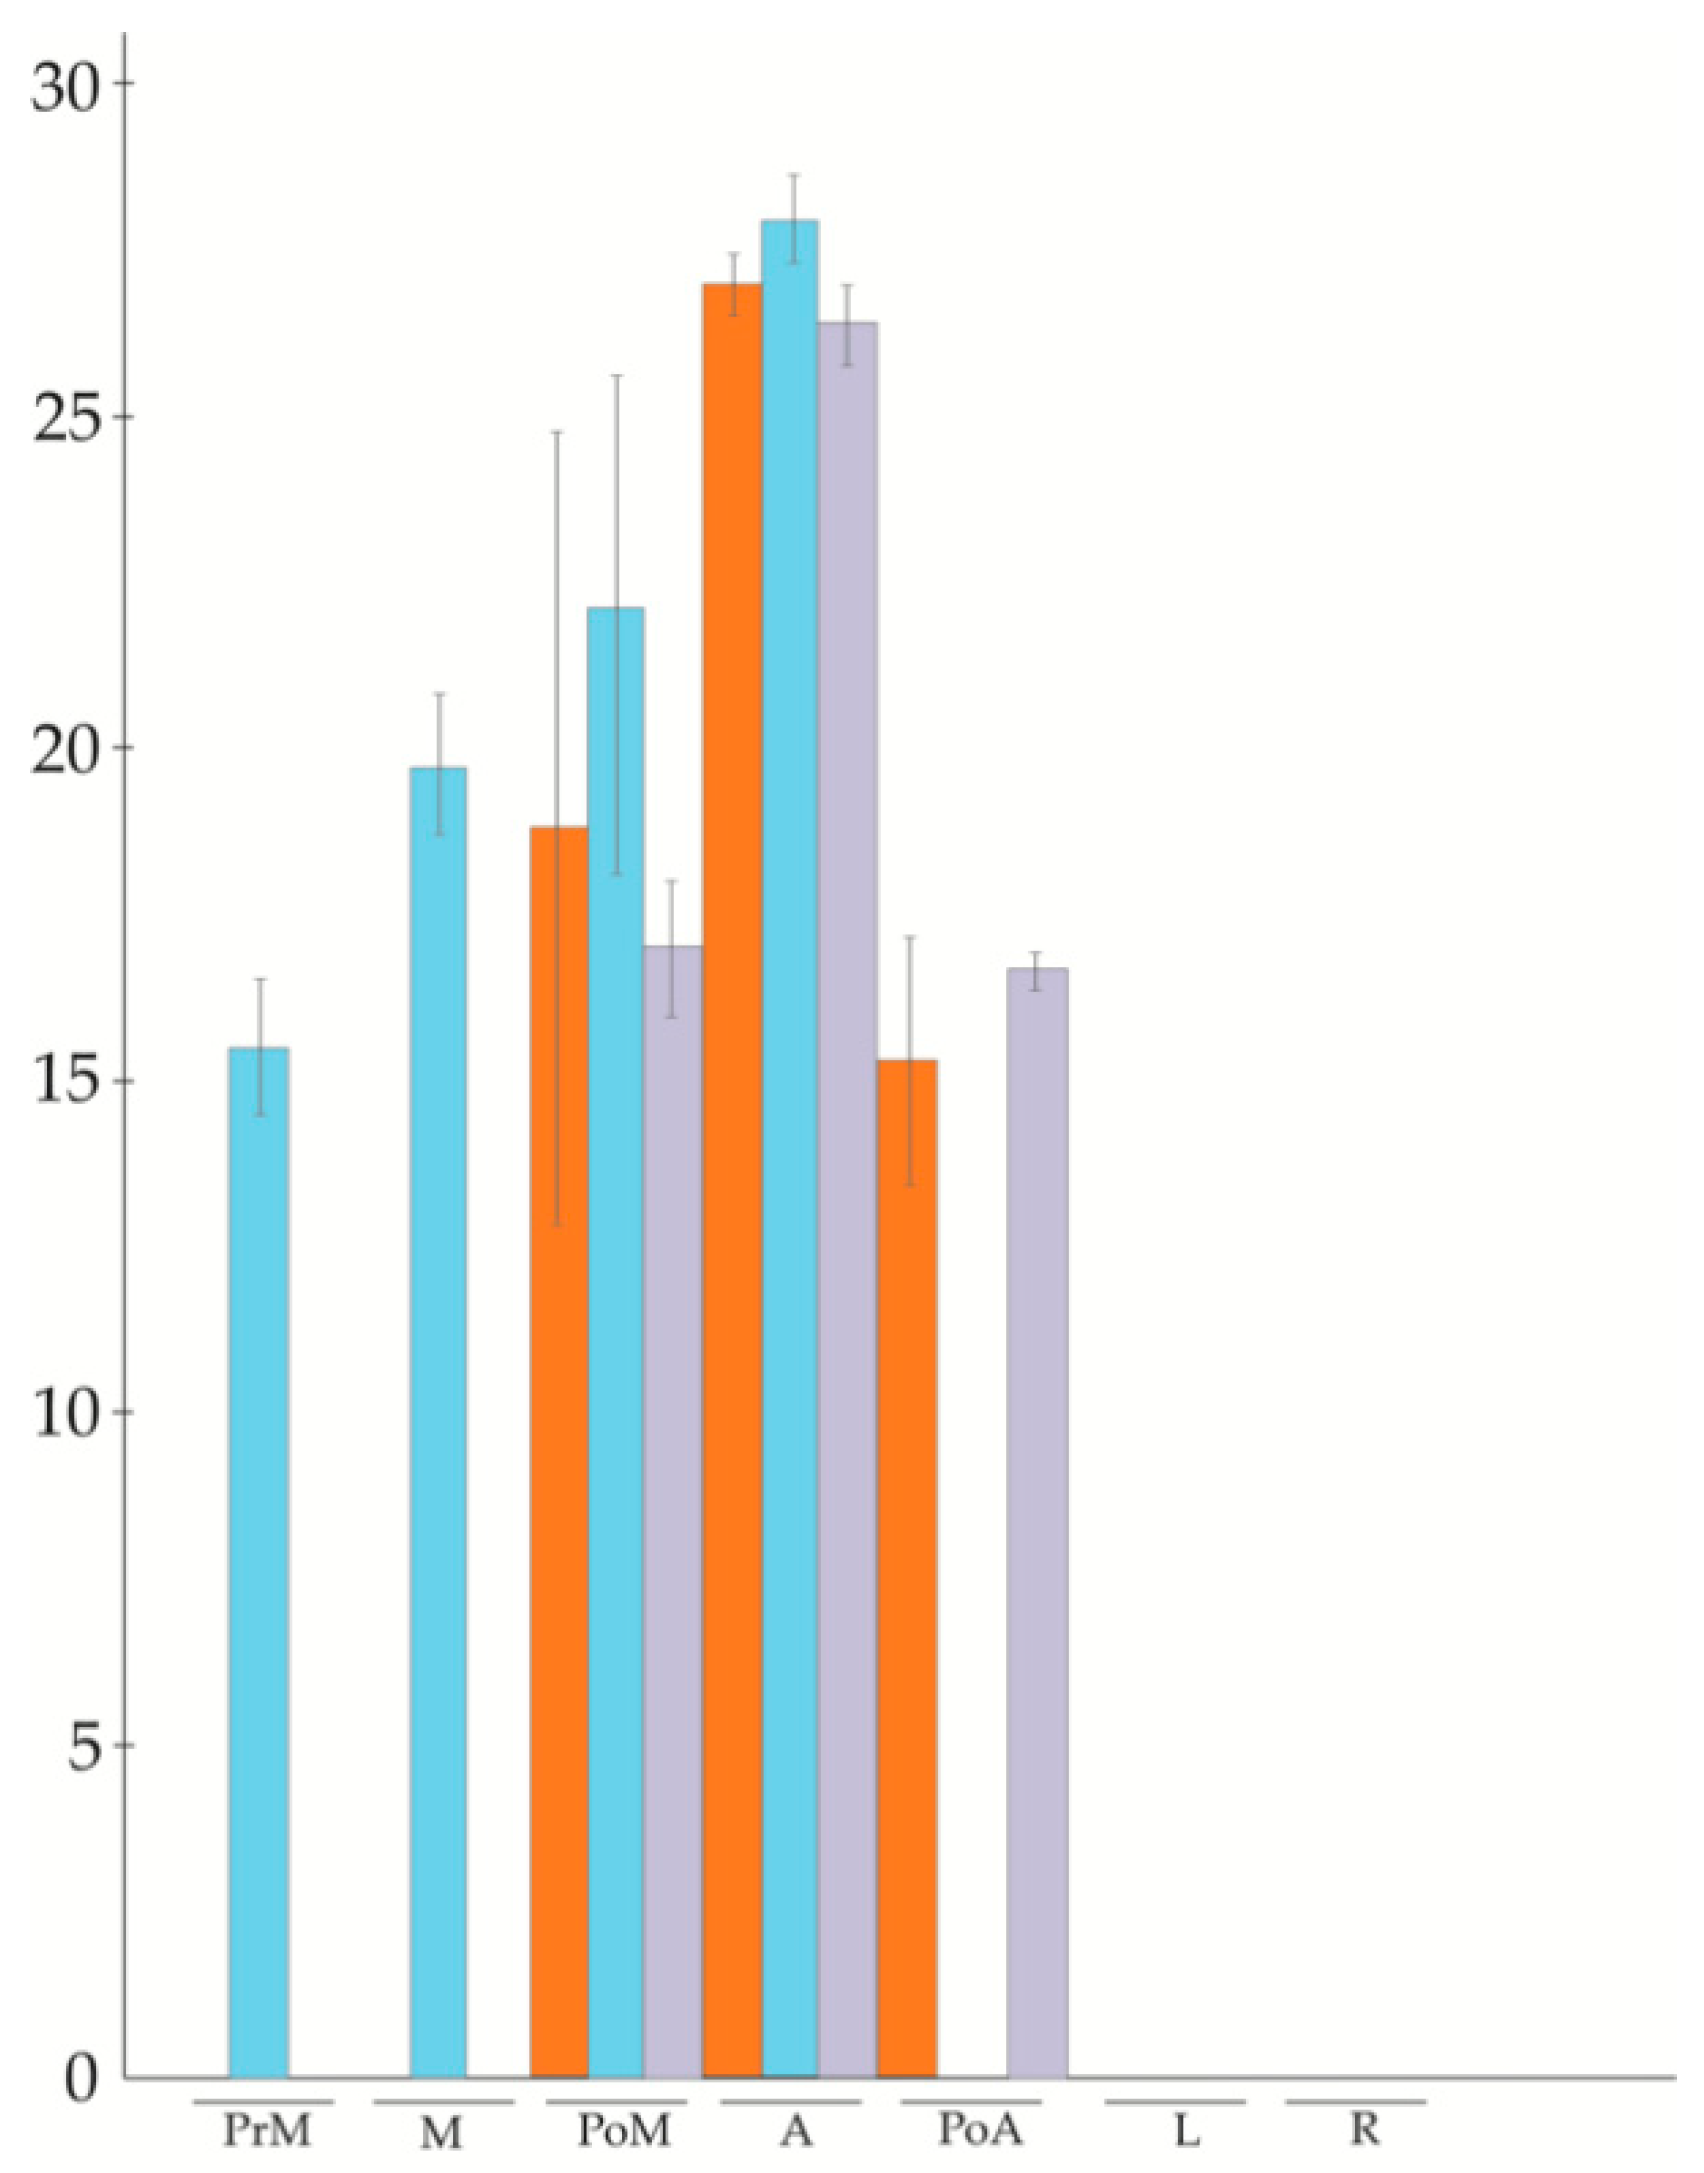
3.2. APOSTART Members Are Also or Exclusively Expressed in Flower Tissues
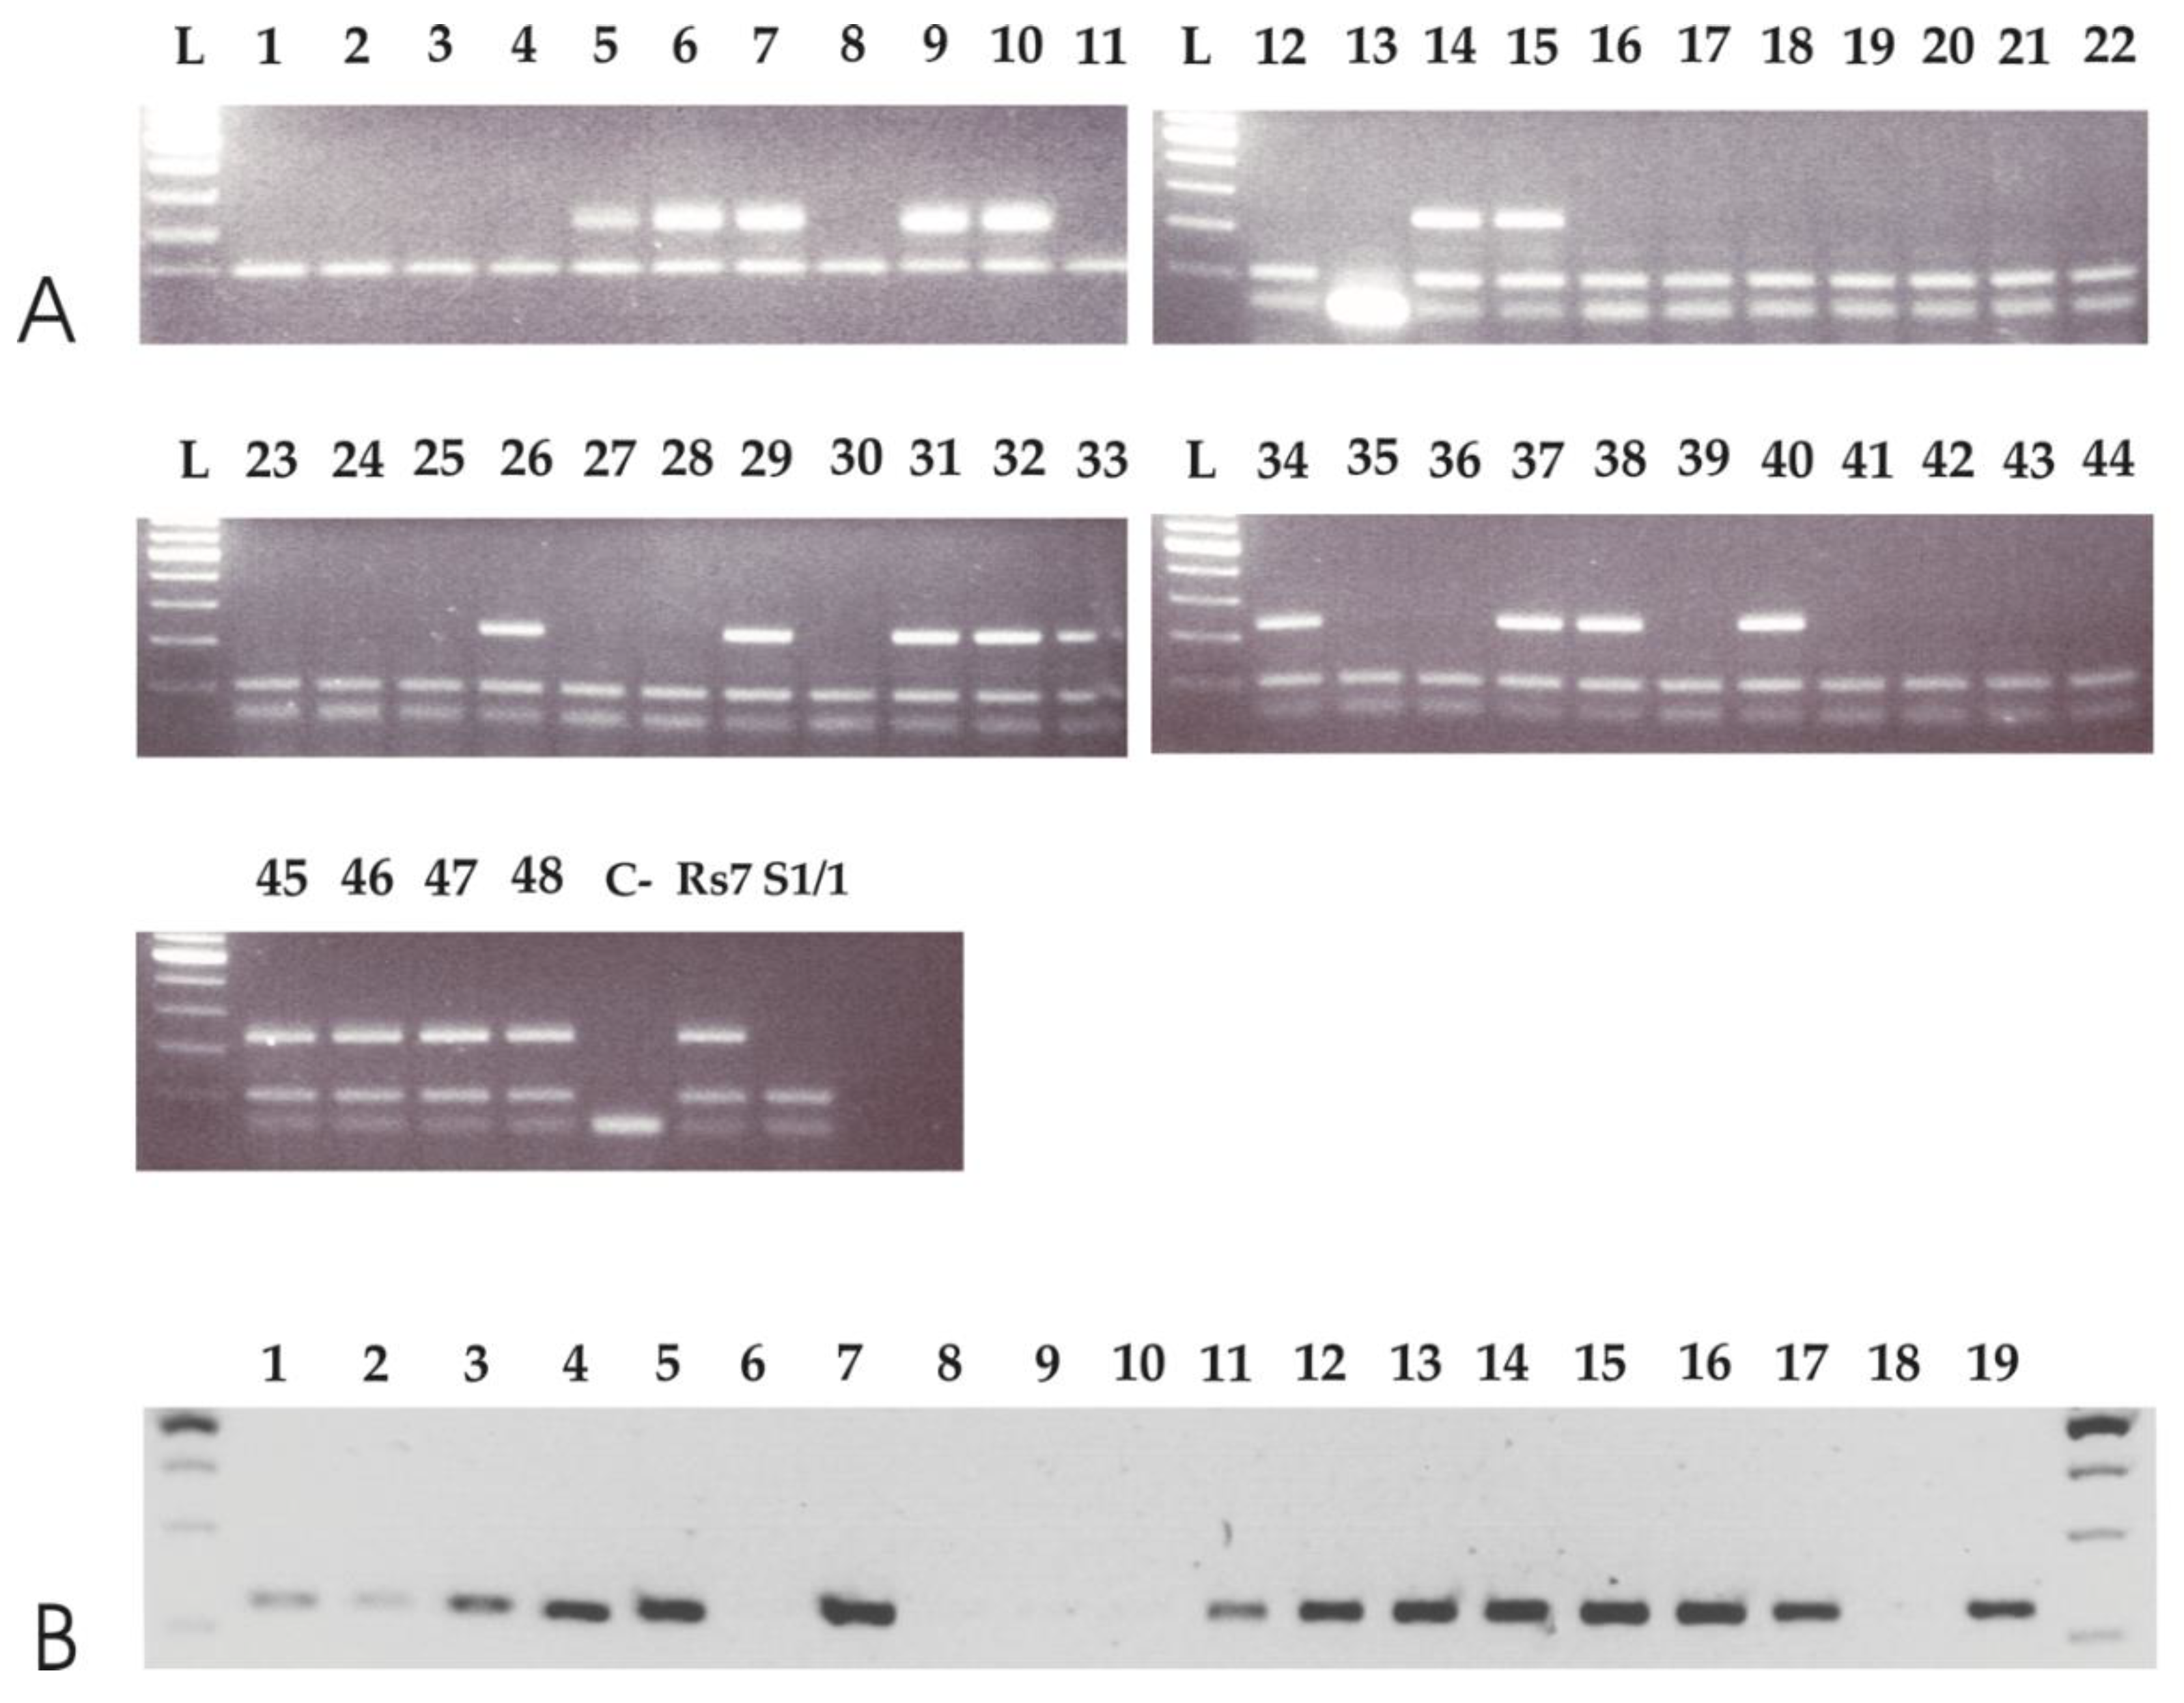
3.3. APO-SCAR Cosegregate with Apomixis
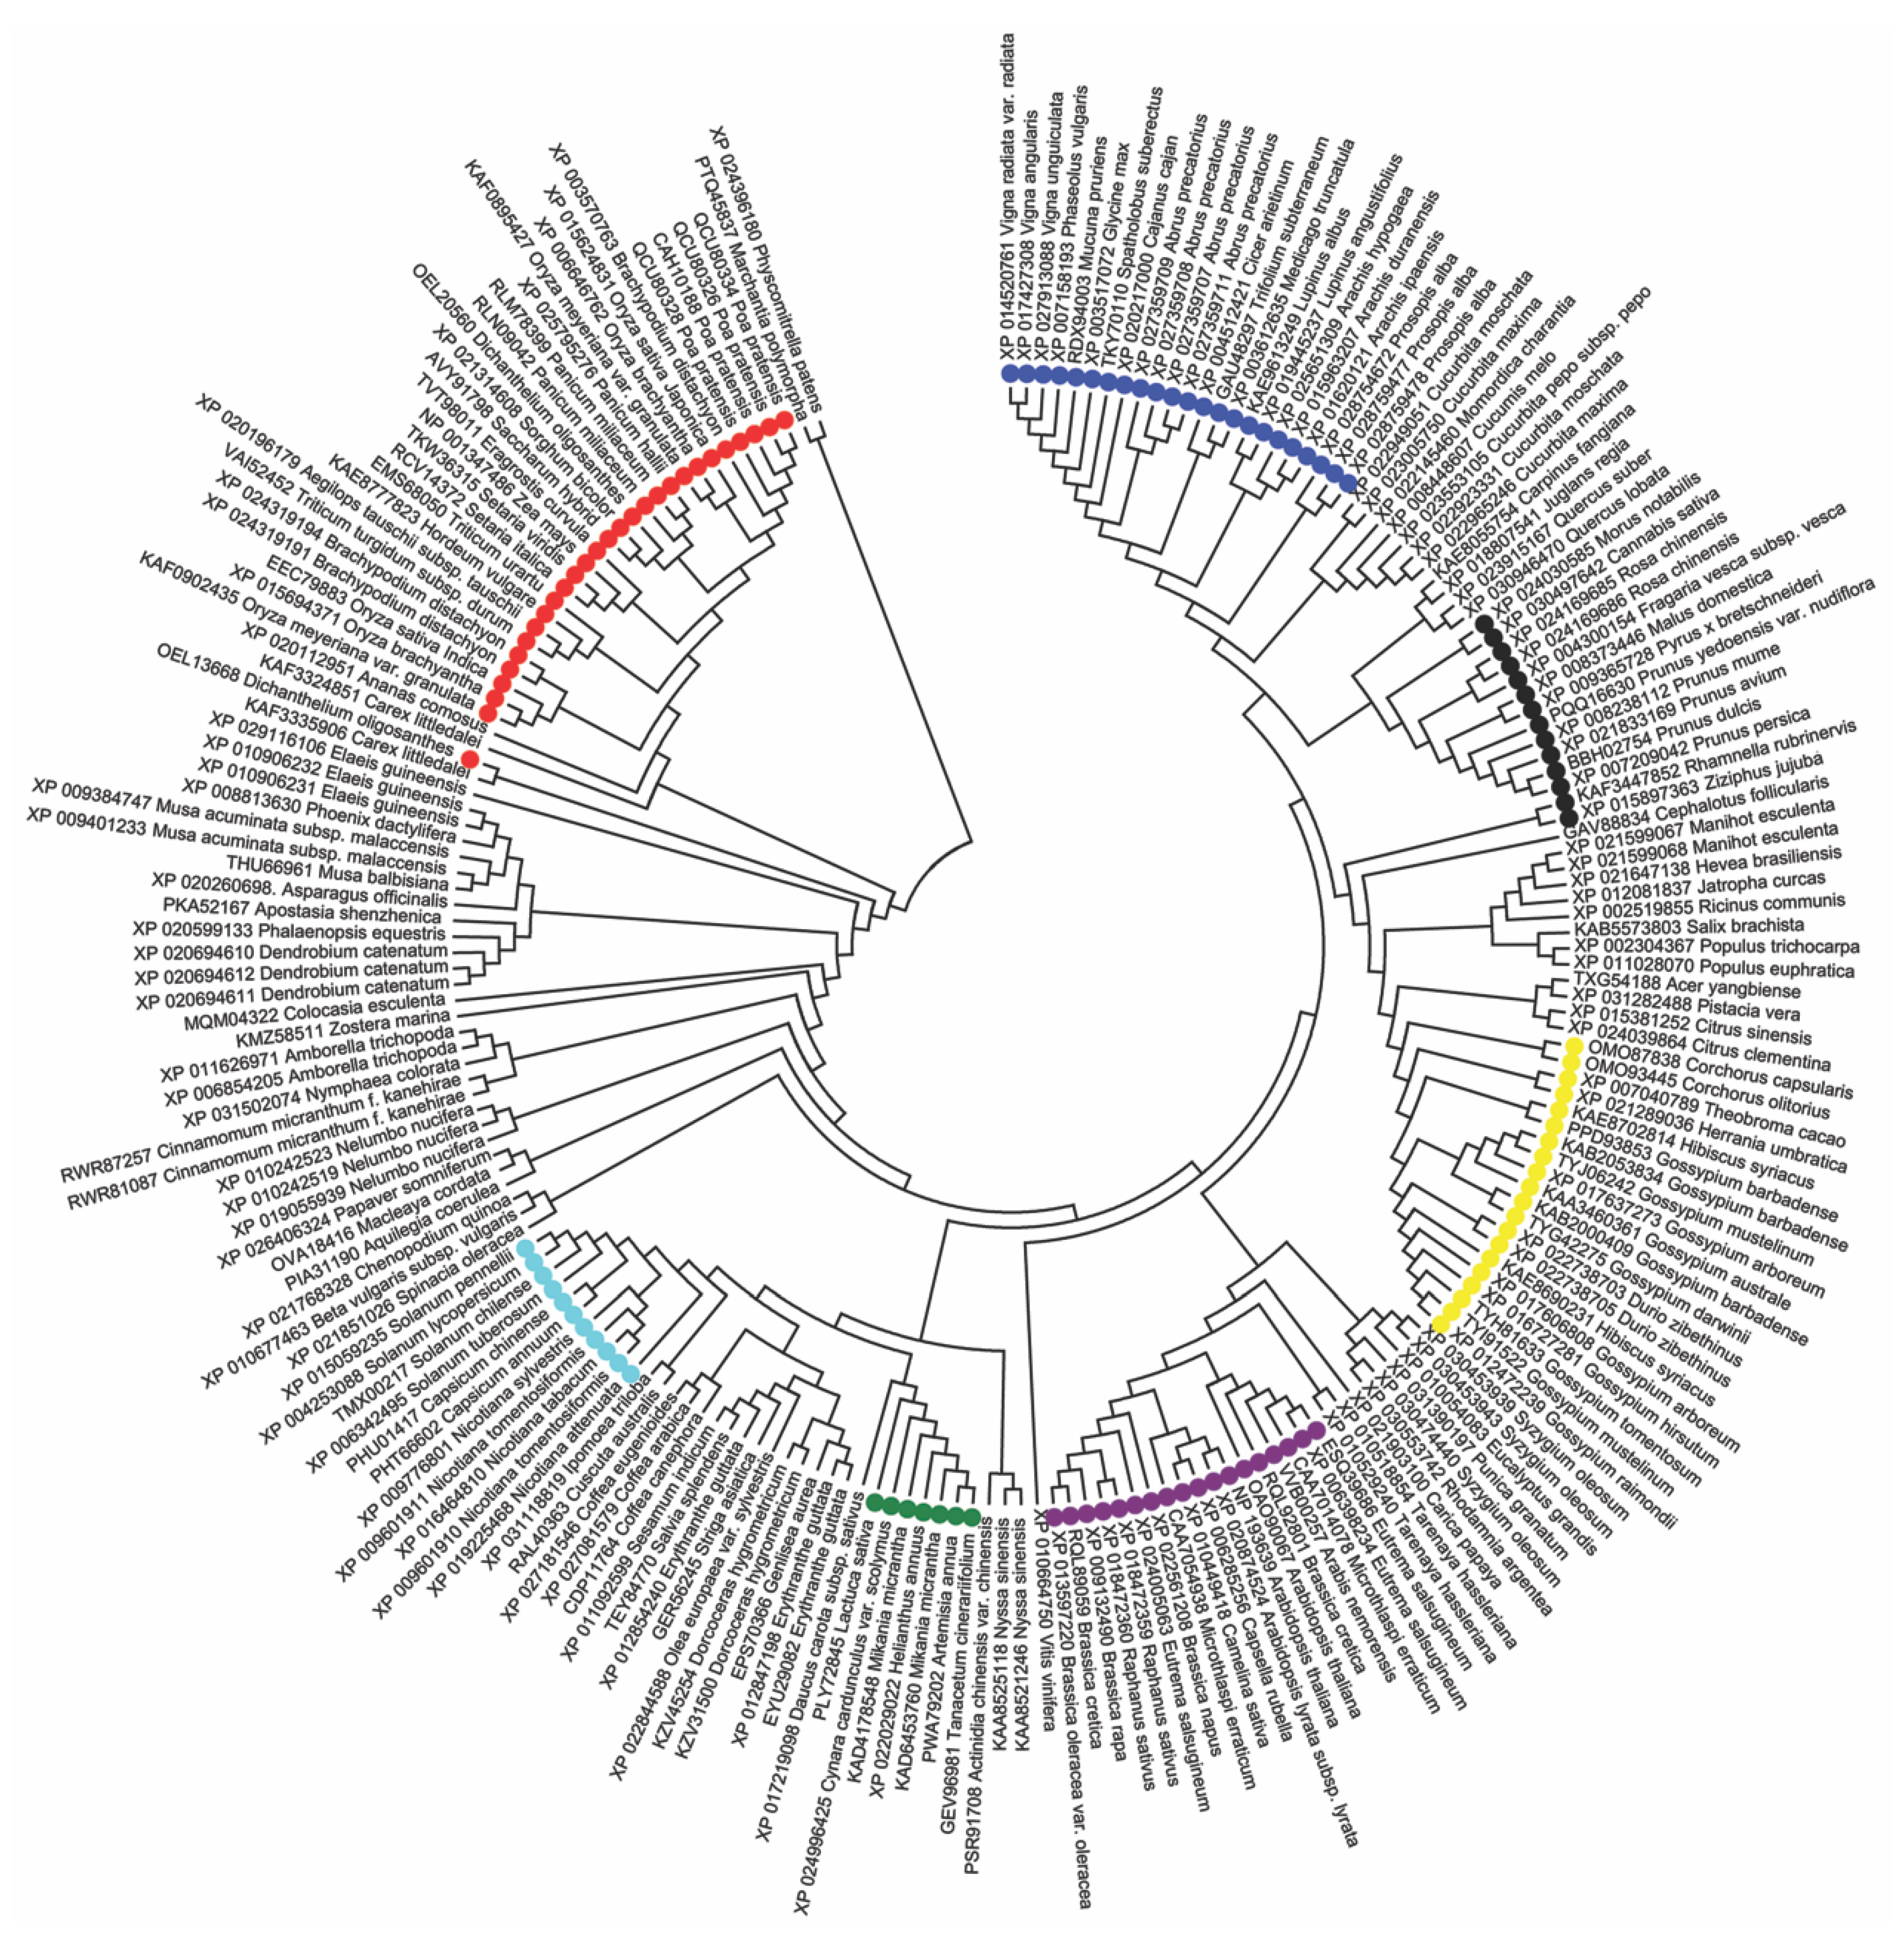
3.4. Phylogenetic Cluster Analysis
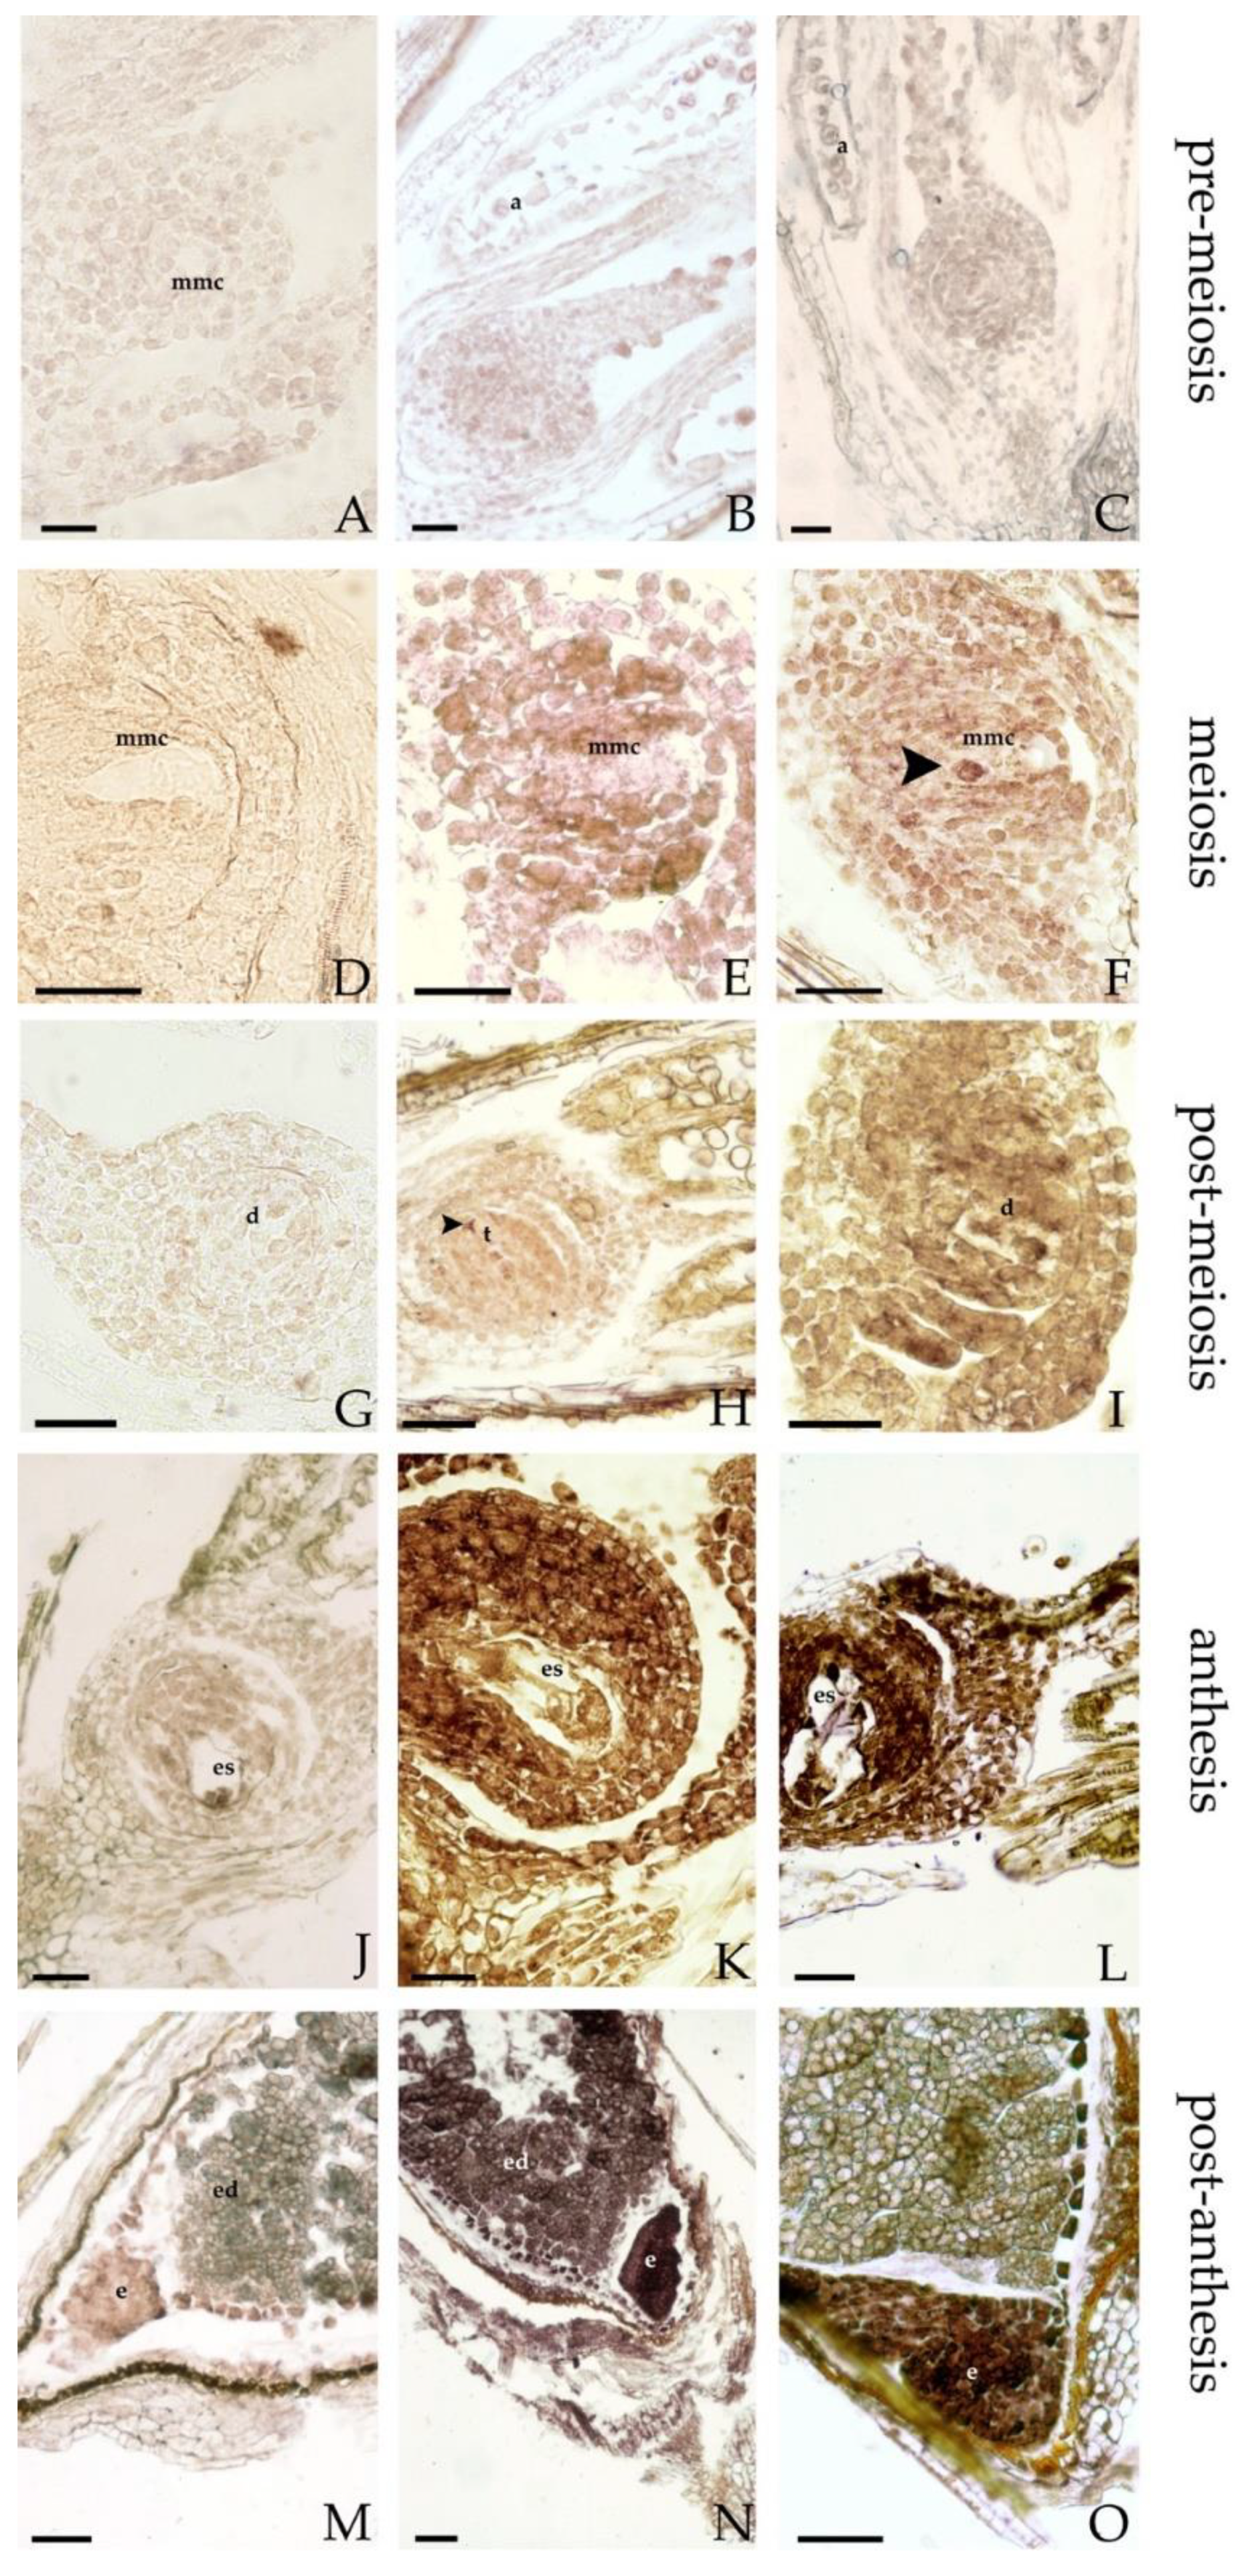
3.5. In Situ Hybridization (ISH)
3.6. Localization, Phosphorylation Sites, and Secondary Structure Predictions of PpAPOSTART Proteins
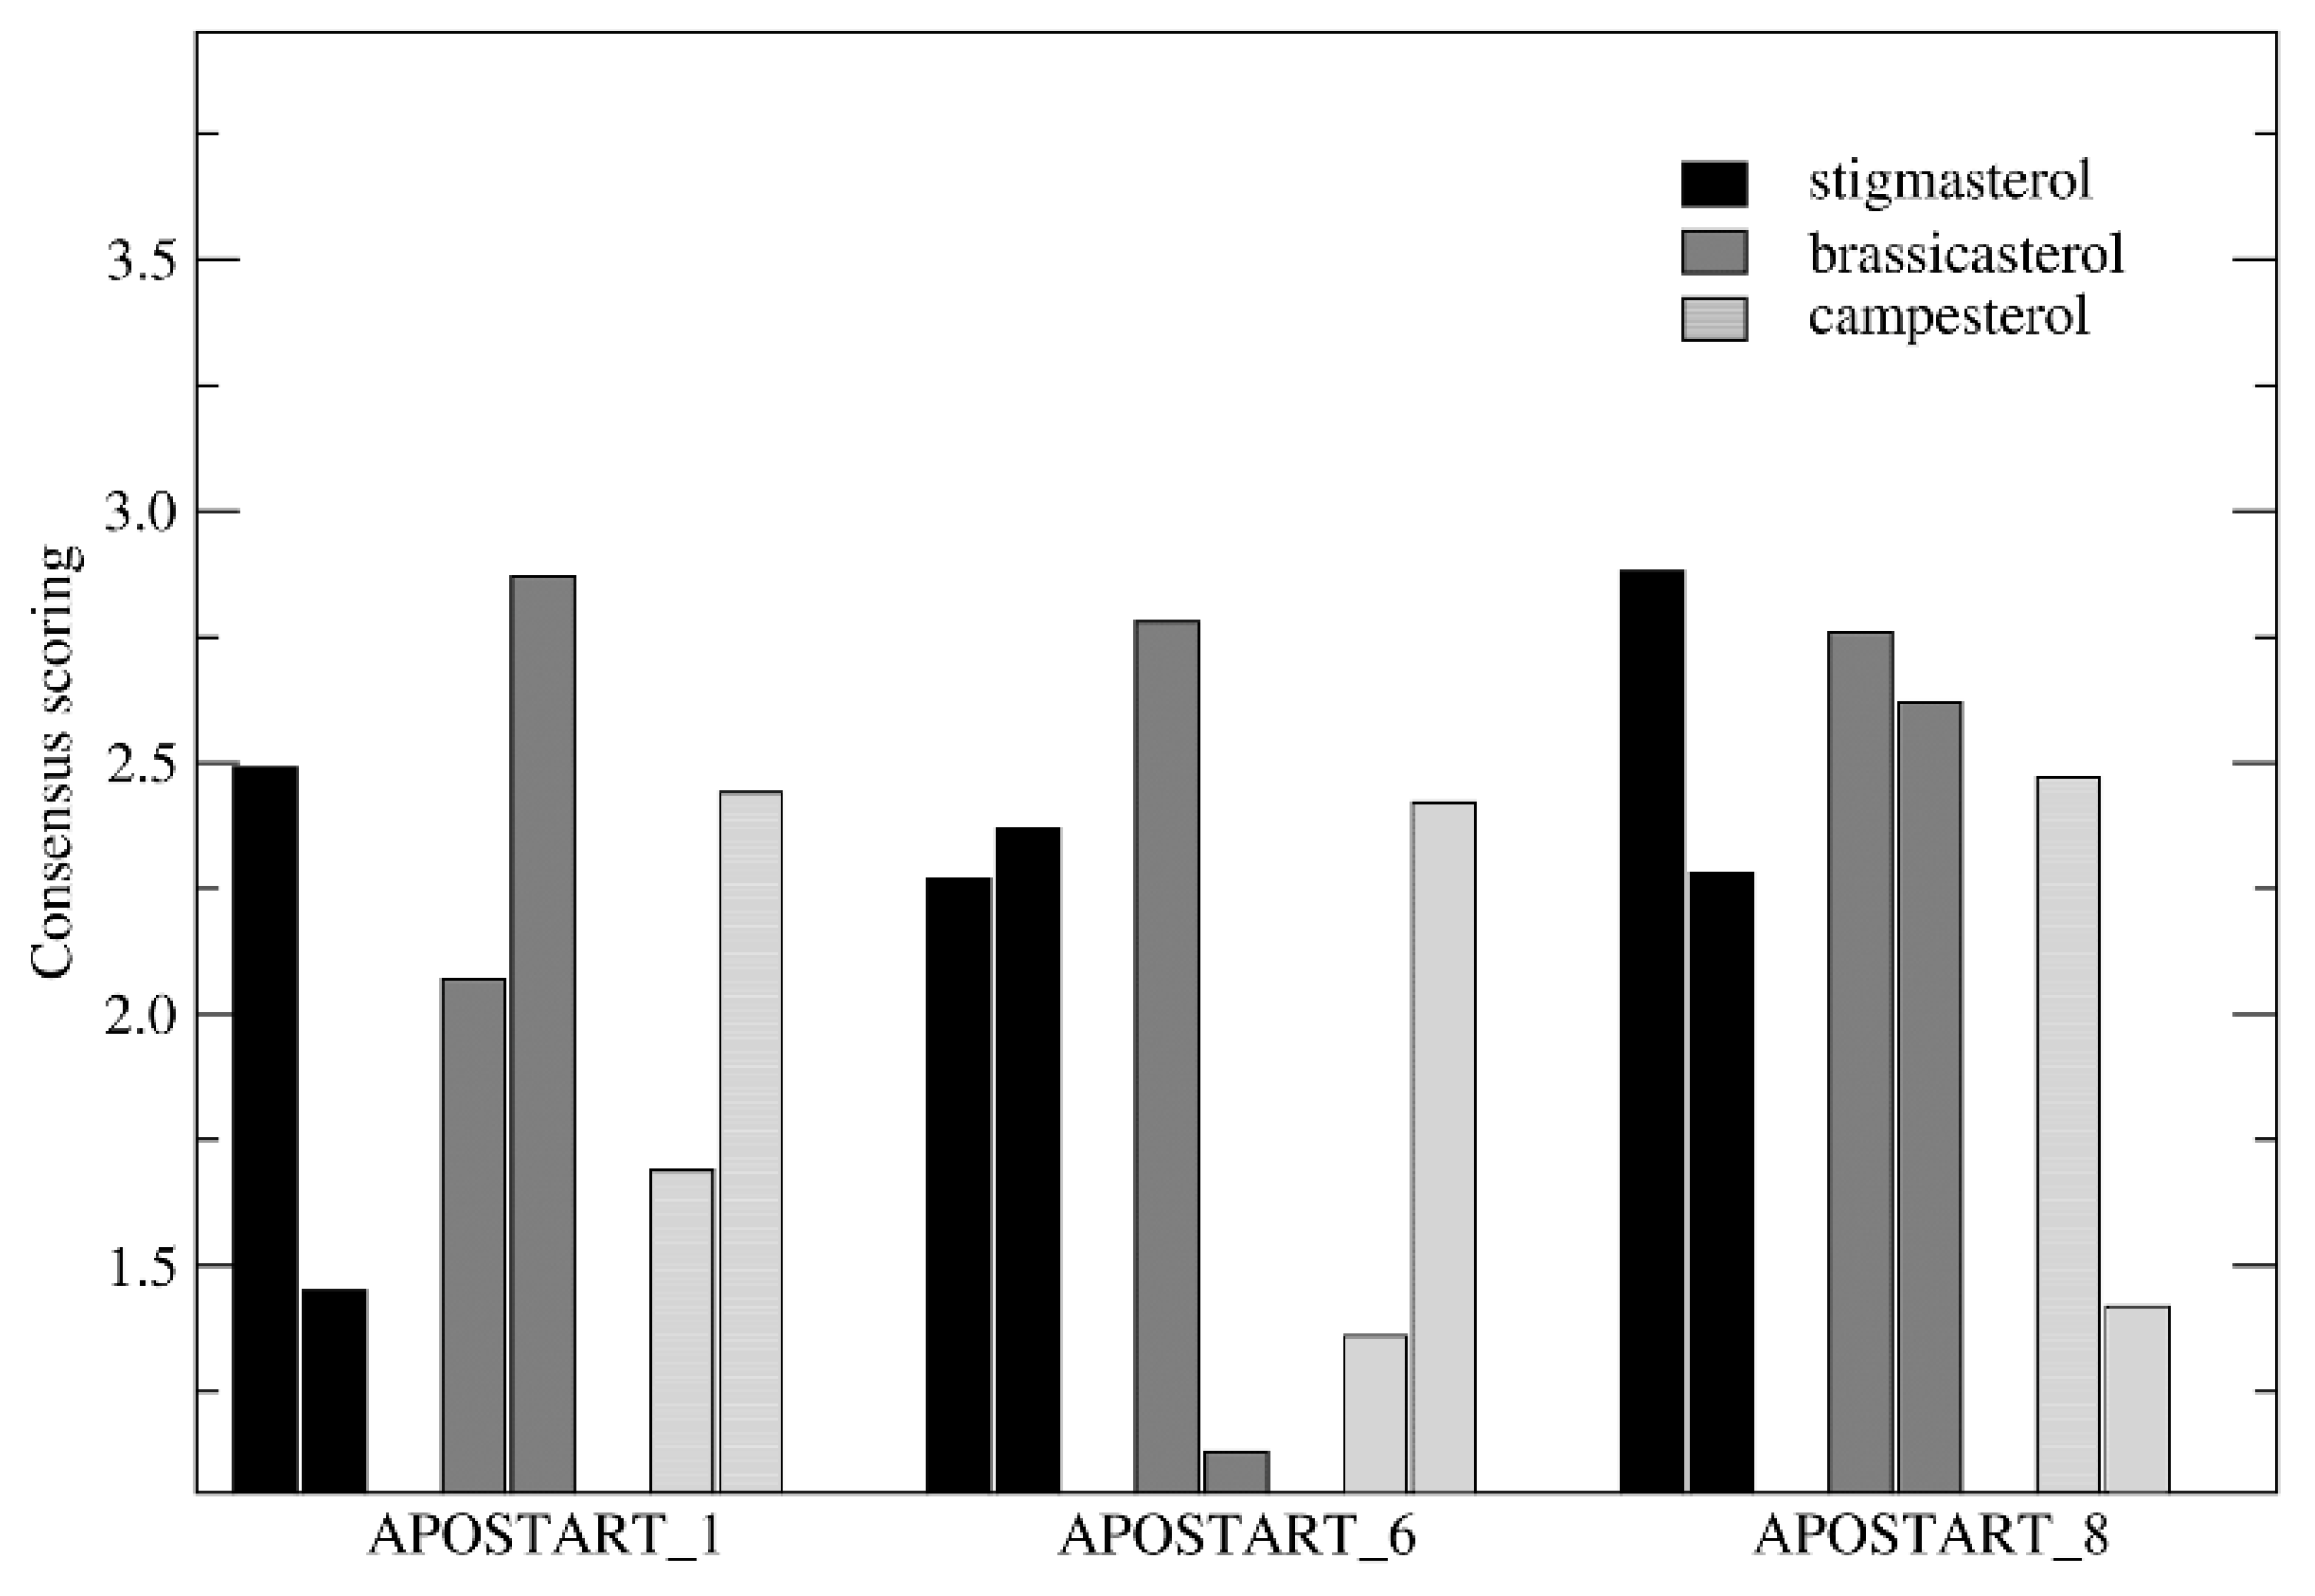
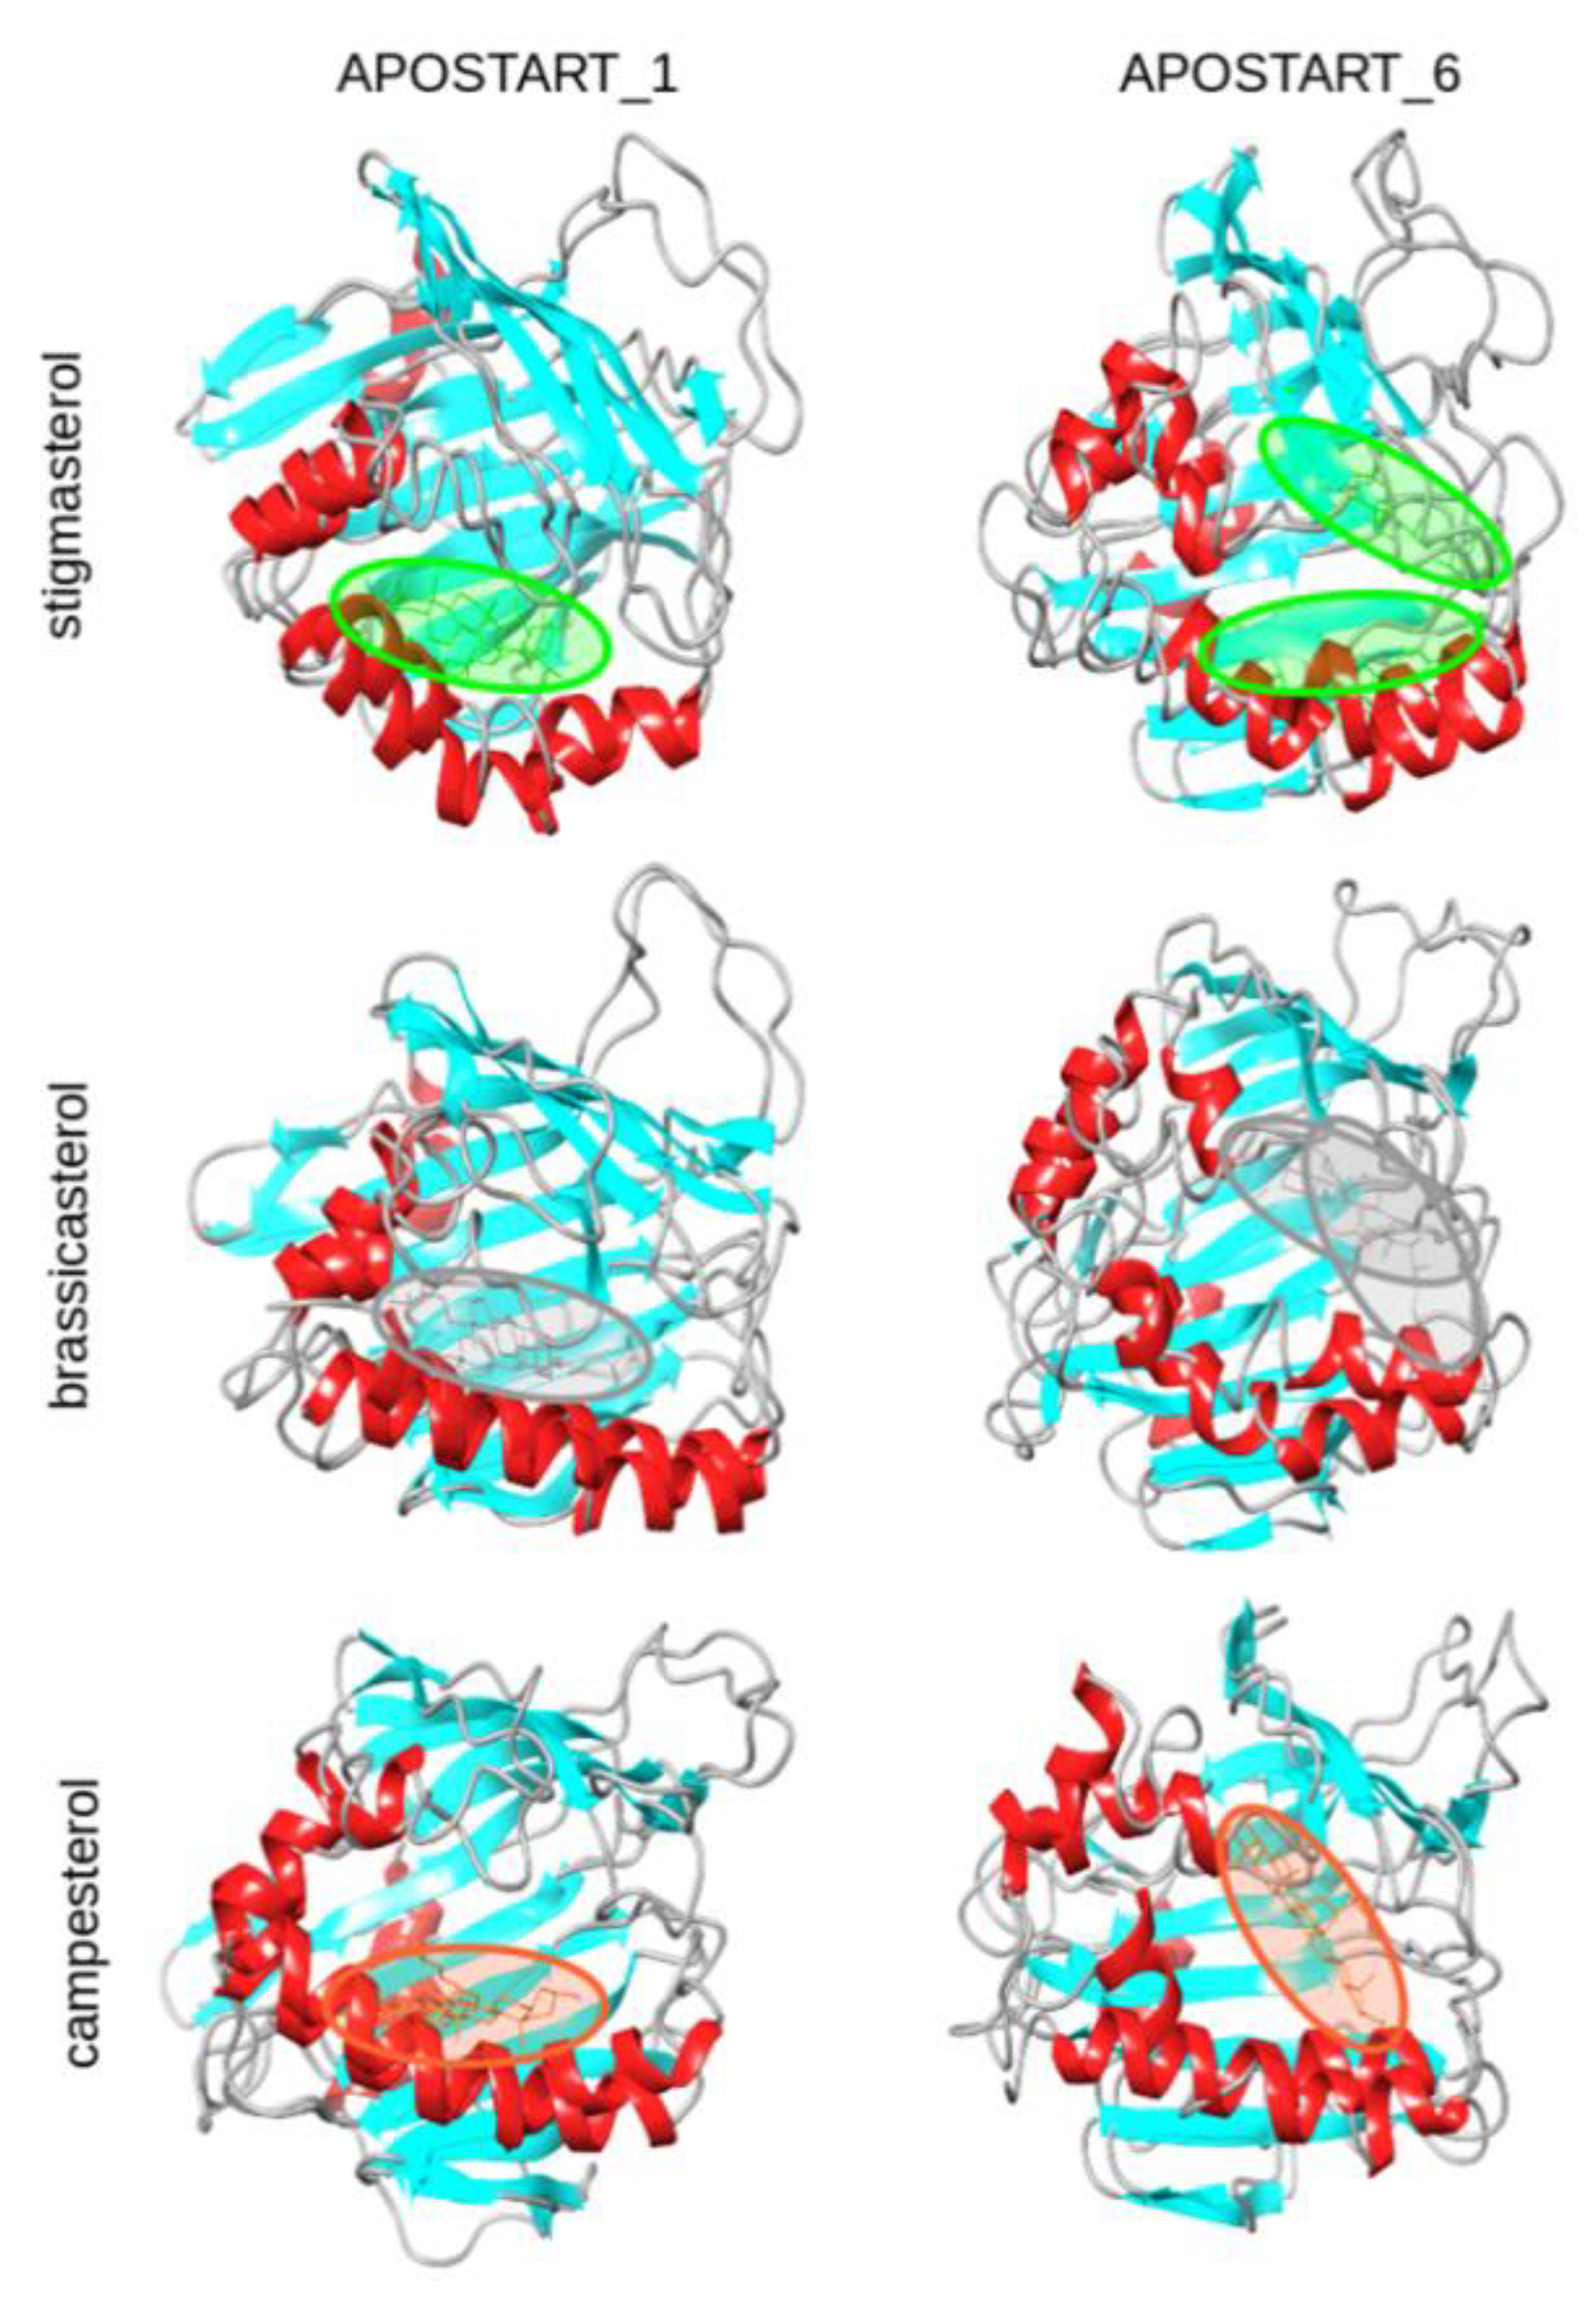
3.7. Molecular Modeling and Dynamics
4. Discussion
Supplementary Materials
Author Contributions
Funding
Conflicts of Interest
References
- Barcaccia, G.; Palumbo, F.; Sgorbati, S.; Albertini, E.; Pupilli, F. A Reappraisal of the Evolutionary and Developmental Pathway of Apomixis and Its Genetic Control in Angiosperms. Genes 2020, 11, 859. [Google Scholar] [CrossRef] [PubMed]
- Albertini, E.; Barcaccia, G.; Carman, J.G.; Pupilli, F. Did apomixis evolve from sex or was it the other way around? J. Exp. Bot. 2019, 70, 2951–2964. [Google Scholar] [CrossRef] [PubMed]
- Bashaw, E.C. Problems and possibilities of apomixis in the improvement of tropical forage grasses. Trop. Forages Livest. Prod. Syst. 1975, 24, 23–30. [Google Scholar]
- Hanna, W.; Bashaw, E.C. Apomixis: Its identification and use in plant breeding 1. Crop Sci. 1987, 27, 1136–1139. [Google Scholar] [CrossRef]
- Savidan, Y.; Dujardin, M. Apomixie: La prochaine révolution verte? Rech. Paris 1970 1992, 23, 326–334. [Google Scholar]
- Koltunow, A.M.; Bicknell, R.A.; Chaudhury, A.M. Apomixis: Molecular strategies for the generation of genetically identical seeds without fertilization. Plant Physiol. 1995, 108, 1345. [Google Scholar] [CrossRef] [Green Version]
- Bicknell, R.A.; Koltunow, A.M. Understanding apomixis: Recent advances and remaining conundrums. Plant Cell 2004, 16, S228–S245. [Google Scholar] [CrossRef] [Green Version]
- Carman, J.G.; Jamison, M.; Elliott, E.; Dwivedi, K.K.; Naumova, T.N. Apospory appears to accelerate onset of meiosis and sexual embryo sac formation in sorghum ovules. BMC Plant Biol. 2011, 11, 9. [Google Scholar] [CrossRef] [Green Version]
- Hojsgaard, D.; Greilhuber, J.; Pellino, M.; Paun, O.; Sharbel, T.F.; Hörandl, E. Emergence of apospory and bypass of meiosis via apomixis after sexual hybridisation and polyploidisation. New Phytol. 2014, 204, 1000–1012. [Google Scholar] [CrossRef] [Green Version]
- Hand, M.L.; Koltunow, A.M. The genetic control of apomixis: Asexual seed formation. Genetics 2014, 197, 441–450. [Google Scholar] [CrossRef] [Green Version]
- Brukhin, V. Molecular and genetic regulation of apomixis. Russ. J. Genet. 2017, 53, 943–964. [Google Scholar] [CrossRef]
- Albertini, E.; Porceddu, A.; Ferranti, F.; Reale, L.; Barcaccia, G.; Romano, B.; Falcinelli, M. Apospory and parthenogenesis may be uncoupled in Poa pratensis: A cytological investigation. Sex. Plant Reprod. 2001, 14, 213–217. [Google Scholar] [CrossRef] [PubMed]
- Albertini, E.; Marconi, G.; Reale, L.; Barcaccia, G.; Porceddu, A.; Ferranti, F.; Falcinelli, M. SERK and APOSTART. Candidate genes for apomixis in Poa pratensis. Plant Physiol. 2005, 138, 2185–2199. [Google Scholar] [CrossRef] [PubMed] [Green Version]
- Albertini, E.; Marconi, G.; Barcaccia, G.; Raggi, L.; Falcinelli, M. Isolation of candidate genes for apomixis in Poa pratensis L. Plant Mol. Biol. 2004, 56, 879–894. [Google Scholar] [CrossRef]
- Porceddu, A.; Albertini, E.; Barcaccia, G.; Falistocco, E.; Falcinelli, M. Linkage mapping in apomictic and sexual Kentucky bluegrass (Poa pratensis L.) genotypes using a two way pseudo-testcross strategy based on AFLP and SAMPL markers. Theor. Appl. Genet. 2002, 104, 273–280. [Google Scholar] [CrossRef]
- Raggi, L.; Bitocchi, E.; Russi, L.; Marconi, G.; Sharbel, T.F.; Veronesi, F.; Albertini, E. Understanding genetic diversity and population structure of a Poa pratensis worldwide collection through morphological, nuclear and chloroplast diversity analysis. PLoS ONE 2015, 10. [Google Scholar] [CrossRef] [Green Version]
- Sambrook, J.; Russell, D.W. Molecular Cloning: A Laboratory Manual, 3rd ed.; Cold Spring Harbor Laboratory Press: Cold Spring Harbor, NY, USA; New York, NY, USA, 2001. [Google Scholar]
- Øvergaard, A.-C.; Nerland, A.H.; Patel, S. Evaluation of potential reference genes for real time RT-PCR studies in Atlantic halibut (Hippoglossus Hippoglossus L.); during development, in tissues of healthy and NNV-injected fish, and in anterior kidney leucocytes. BMC Mol. Biol. 2010, 11, 36. [Google Scholar] [CrossRef] [Green Version]
- Ruan, W.; Lai, M. Actin, a reliable marker of internal control? Clin. Chim. Acta 2007, 385, 1–5. [Google Scholar] [CrossRef]
- Angenent, G.C.; Franken, J.; Busscher, M.; van Dijken, A.; van Went, J.L.; Dons, H.J.; van Tunen, A.J. A novel class of MADS box genes is involved in ovule development in petunia. Plant Cell 1995, 7, 1569–1582. [Google Scholar]
- Cañas, L.A.; Busscher, M.; Angenent, G.C.; Beltrán, J.-P.; Van Tunen, A.J. Nuclear localization of the petunia MADS box protein FBP1. Plant J. 1994, 6, 597–604. [Google Scholar] [CrossRef]
- Altschul, S.F.; Gish, W.; Miller, W.; Myers, E.W.; Lipman, D.J. Basic local alignment search tool. J. Mol. Biol. 1990, 215, 403–410. [Google Scholar] [CrossRef]
- Jones, D.T.; Taylor, W.R.; Thornton, J.M. The rapid generation of mutation data matrices from protein sequences. Bioinformatics 1992, 8, 275–282. [Google Scholar] [CrossRef] [PubMed]
- Kumar, S.; Stecher, G.; Tamura, K. MEGA7: Molecular evolutionary genetics analysis version 7.0 for bigger datasets. Mol. Biol. Evol. 2016, 33, 1870–1874. [Google Scholar] [CrossRef] [PubMed] [Green Version]
- Blom, N.; Gammeltoft, S.; Brunak, S. Sequence and structure-based prediction of eukaryotic protein phosphorylation sites. J. Mol. Biol. 1999, 294, 1351–1362. [Google Scholar] [CrossRef] [PubMed]
- Wang, S.; Li, W.; Liu, S.; Xu, J. RaptorX-Property: A web server for protein structure property prediction. Nucleic Acids Res. 2016, 44, W430–W435. [Google Scholar] [CrossRef]
- Wang, S.; Ma, J.; Xu, J. AUCpreD: Proteome-level protein disorder prediction by AUC-maximized deep convolutional neural fields. Bioinformatics 2016, 32, i672–i679. [Google Scholar] [CrossRef]
- Wang, S.; Peng, J.; Ma, J.; Xu, J. Protein secondary structure prediction using deep convolutional neural fields. Sci. Rep. 2016, 6, 18962. [Google Scholar] [CrossRef] [Green Version]
- Wang, S.; Sun, S.; Xu, J. AUC-maximized deep convolutional neural fields for protein sequence labeling. In Machine Learning and Knowledge Discovery in Databases; Springer: Cham, Switzerland, 2016; Volume 9852, pp. 1–16. [Google Scholar]
- Yu, C.-S.; Cheng, C.-W.; Su, W.-C.; Chang, K.-C.; Huang, S.-W.; Hwang, J.-K.; Lu, C.-H. CELLO2GO: A web server for protein subCELlular LOcalization prediction with functional gene ontology annotation. PLoS ONE 2014, 9, e99368. [Google Scholar] [CrossRef] [Green Version]
- Armenteros, J.J.A.; Sønderby, C.K.; Sønderby, S.K.; Nielsen, H.; Winther, O. DeepLoc: Prediction of protein subcellular localization using deep learning. Bioinformatics 2017, 33, 3387–3395. [Google Scholar] [CrossRef]
- Blum, T.; Briesemeister, S.; Kohlbacher, O. MultiLoc2: Integrating phylogeny and Gene Ontology terms improves subcellular protein localization prediction. BMC Bioinform. 2009, 10, 274. [Google Scholar] [CrossRef] [Green Version]
- Chou, K.-C.; Shen, H.-B. Plant-mPLoc: A top-down strategy to augment the power for predicting plant protein subcellular localization. PLoS ONE 2010, 5. [Google Scholar] [CrossRef] [PubMed] [Green Version]
- Briesemeister, S.; Blum, T.; Brady, S.; Lam, Y.; Kohlbacher, O.; Shatkay, H. SherLoc2: A high-accuracy hybrid method for predicting subcellular localization of proteins. J. Proteome Res. 2009, 8, 5363–5366. [Google Scholar] [CrossRef] [PubMed]
- Briesemeister, S.; Rahnenführer, J.; Kohlbacher, O. Going from where to why—Interpretable prediction of protein subcellular localization. Bioinformatics 2010, 26, 1232–1238. [Google Scholar] [CrossRef] [PubMed] [Green Version]
- Söding, J.; Biegert, A.; Lupas, A.N. The HHpred interactive server for protein homology detection and structure prediction. Nucleic Acids Res. 2005, 33, W244–W248. [Google Scholar] [CrossRef] [PubMed] [Green Version]
- Maestro, version 9.2; Schrödinger, LLC: New York, NY, USA, 2011.
- Šali, A.; Blundell, T.L. Comparative protein modelling by satisfaction of spatial restraints. J. Mol. Biol. 1993, 234, 779–815. [Google Scholar] [CrossRef] [PubMed]
- Sastry, G.M.; Adzhigirey, M.; Day, T.; Annabhimoju, R.; Sherman, W. Protein and ligand preparation: Parameters, protocols, and influence on virtual screening enrichments. J. Comput. Aided Mol. Des. 2013, 27, 221–234. [Google Scholar] [CrossRef]
- Jorgensen, W.L.; Maxwell, D.S.; Tirado-Rives, J. Development and testing of the OPLS all-atom force field on conformational energetics and properties of organic liquids. J. Am. Chem. Soc. 1996, 118, 11225–11236. [Google Scholar] [CrossRef]
- Qiu, D.; Shenkin, P.S.; Hollinger, F.P.; Still, W.C. The GB/SA continuum model for solvation. A fast analytical method for the calculation of approximate Born radii. J. Phys. Chem. A 1997, 101, 3005–3014. [Google Scholar] [CrossRef]
- Kolossváry, I.; Keserü, G.M. Hessian-free low-mode conformational search for large-scale protein loop optimization: Application to c-jun N-terminal kinase JNK3. J. Comput. Chem. 2001, 22, 21–30. [Google Scholar] [CrossRef]
- Watts, K.S.; Dalal, P.; Tebben, A.J.; Cheney, D.L.; Shelley, J.C. Macrocycle conformational sampling with MacroModel. J. Chem. Inf. Model. 2014, 54, 2680–2696. [Google Scholar] [CrossRef]
- Halgren, T.A.; Murphy, R.B.; Friesner, R.A.; Beard, H.S.; Frye, L.L.; Pollard, W.T.; Banks, J.L. Glide: A new approach for rapid, accurate docking and scoring. 2. Enrichment factors in database screening. J. Med. Chem. 2004, 47, 1750–1759. [Google Scholar] [PubMed]
- Friesner, R.A.; Murphy, R.B.; Repasky, M.P.; Frye, L.L.; Greenwood, J.R.; Halgren, T.A.; Sanschagrin, P.C.; Mainz, D.T. Extra precision glide: Docking and scoring incorporating a model of hydrophobic enclosure for protein- ligand complexes. J. Med. Chem. 2006, 49, 6177–6196. [Google Scholar] [PubMed] [Green Version]
- Cross, S.; Ortuso, F.; Baroni, M.; Costa, G.; Distinto, S.; Moraca, F.; Alcaro, S.; Cruciani, G. GRID-based three-dimensional pharmacophores II: PharmBench, a benchmark data set for evaluating pharmacophore elucidation methods. J. Chem. Inf. Model. 2012, 52, 2599–2608. [Google Scholar] [CrossRef] [PubMed]
- Goodford, P. Multivariate characterization of molecules for QSAR analysis. J. Chemom. 1996, 10, 107–117. [Google Scholar] [CrossRef]
- von Itzstein, M.; Wu, W.-Y.; Kok, G.B.; Pegg, M.S.; Dyason, J.C.; Jin, B.; Van Phan, T.; Smythe, M.L.; White, H.F.; Oliver, S.W. Rational design of potent sialidase-based inhibitors of influenza virus replication. Nature 1993, 363, 418–423. [Google Scholar] [CrossRef] [PubMed]
- Milletti, F.; Storchi, L.; Sforna, G.; Cruciani, G. New and original pKa prediction method using grid molecular interaction fields. J. Chem. Inf. Model. 2007, 47, 2172–2181. [Google Scholar] [CrossRef]
- Milletti, F.; Storchi, L.; Sforna, G.; Cross, S.; Cruciani, G. Tautomer enumeration and stability prediction for virtual screening on large chemical databases. J. Chem. Inf. Model. 2009, 49, 68–75. [Google Scholar] [CrossRef]
- Ahlström, M.M.; Ridderström, M.; Luthman, K.; Zamora, I. Virtual screening and scaffold hopping based on grid molecular interaction fields. J. Chem. Inf. Model. 2005, 45, 1313–1323. [Google Scholar] [CrossRef]
- Pastor, M.; Cruciani, G.; McLay, I.; Pickett, S.; Clementi, S. GRid-INdependent descriptors (GRIND): A novel class of alignment-independent three-dimensional molecular descriptors. J. Med. Chem. 2000, 43, 3233–3243. [Google Scholar]
- Cruciani, G.; Carosati, E.; De Boeck, B.; Ethirajulu, K.; Mackie, C.; Howe, T.; Vianello, R. MetaSite: Understanding metabolism in human cytochromes from the perspective of the chemist. J. Med. Chem. 2005, 48, 6970–6979. [Google Scholar]
- Van Der Spoel, D.; Lindahl, E.; Hess, B.; Groenhof, G.; Mark, A.E.; Berendsen, H.J.C. GROMACS: Fast, flexible, and free. J. Comput. Chem. 2005, 26, 1701–1718. [Google Scholar] [CrossRef] [PubMed]
- Berendsen, H.J.C.; Postma, P.M.; van Gunsteren, W.F.; Hermans, J. Interaction models for water in relation to protein hydration. In Intermolecular Forces; Pullman, B., Ed.; D. Reidel Publishing Company: Dordrecht, The Netherlands, 1981; pp. 331–342. [Google Scholar]
- Bussi, G.; Donadio, D.; Parrinello, M. Canonical sampling through velocity rescaling. J. Chem. Phys. 2007, 126, 014101. [Google Scholar] [CrossRef] [PubMed] [Green Version]
- Parrinello, M.; Rahman, A. Polymorphic transitions in single crystals: A new molecular dynamics method. J. Appl. Phys. 1981, 52, 7182–7190. [Google Scholar] [CrossRef]
- Van Gunsteren, W.F.; Eising, A.A.; Hunenberger, P.H.; Kruger, P.; Mark, A.E.; Scott, W.R.P.; Tironi, I.G. Biomolecular Simulation: The GROMOS96 Manual and User Guide; vdf Hochschulverlag AG an der ETH Zürich and BIOMOS b.v.: Zürich, Switzerland; Groningen, The Netherlands, 1996. [Google Scholar]
- Hess, B.; Bekker, H.; Berendsen, H.J.; Fraaije, J.G. LINCS: A linear constraint solver for molecular simulations. J. Comput. Chem. 1997, 18, 1463–1472. [Google Scholar] [CrossRef]
- Darden, T.; York, D.; Pedersen, L. Particle mesh Ewald: An N⋅log (N) method for Ewald sums in large systems. J. Chem. Phys. 1993, 98, 10089–10092. [Google Scholar] [CrossRef] [Green Version]
- Humphrey, W.; Dalke, A.; Schulten, K. VMD: Visual molecular dynamics. J. Mol. Graph. 1996, 14, 33–38. [Google Scholar] [CrossRef]
- Albertini, E.; Barcaccia, G.; Porceddu, A.; Rosellini, D.; Falcinelli, M. Genetic control of parthenogenesis in Kentucky bluegrass: Results from a sexual x apomictic cross. In Proceedings of the International Grassland Congress, Sao Pedro, Sao Paulo, Brazil, 11–21 February 2001; Volume 19, p. 138. [Google Scholar]
- Ramette, A. Multivariate analyses in microbial ecology. FEMS Microbiol. Ecol. 2007, 62, 142–160. [Google Scholar] [CrossRef] [Green Version]
- Berman, H.M.; Westbrook, J.; Feng, Z.; Gilliland, G.; Bhat, T.N.; Weissig, H.; Shindyalov, I.N.; Bourne, P.E. The Protein Data Bank. Nucleic Acids Res. 2000, 28, 235–242. [Google Scholar] [CrossRef] [Green Version]
- Roderick, S.L.; Chan, W.W.; Agate, D.S.; Olsen, L.R.; Vetting, M.W.; Rajashankar, K.R.; Cohen, D.E. Structure of human phosphatidylcholine transfer protein in complex with its ligand. Nat. Struct. Biol. 2002, 9, 507–511. [Google Scholar] [CrossRef]
- Murcia, M.; Faráldo-Gómez, J.D.; Maxfield, F.R.; Roux, B. Modeling the structure of the StART domains of MLN64 and StAR proteins in complex with cholesterol. J. Lipid Res. 2006, 47, 2614–2630. [Google Scholar] [CrossRef] [Green Version]
- Barcaccia, G.; Albertini, E. Apomixis in plant reproduction: A novel perspective on an old dilemma. Plant Reprod. 2013, 26, 159–179. [Google Scholar] [CrossRef] [PubMed] [Green Version]
- Pupilli, F.; Barcaccia, G. Cloning plants by seeds: Inheritance models and candidate genes to increase fundamental knowledge for engineering apomixis in sexual crops. J. Biotechnol. 2012, 159, 291–311. [Google Scholar] [CrossRef] [PubMed]
- Resentini, F.; Vanzulli, S.; Marconi, G.; Colombo, L.; Albertini, E.; Masiero, S. AtAPOSTART1, an Arabidopsis thaliana PH-START domain protein involved in seed germination. Plant Biosyst. Int. J. Deal. Asp. Plant Biol. 2014, 148, 1178–1186. [Google Scholar]
- Vorwerk, S.; Schiff, C.; Santamaria, M.; Koh, S.; Nishimura, M.; Vogel, J.; Somerville, C.; Somerville, S. EDR2 negatively regulates salicylic acid-based defenses and cell death during powdery mildew infections of Arabidopsis thaliana. BMC Plant Biol. 2007, 7, 35. [Google Scholar] [CrossRef] [Green Version]
- Gao, L. Pharmacologically induced meiosis apomeiosis interconversions in Boechera, Arabidopsis and Vigna. Grad. Theses Diss. 2018, 7222, 169. [Google Scholar]
- Hojsgaard, D.; Klatt, S.; Baier, R.; Carman, J.G.; Hörandl, E. Taxonomy and biogeography of apomixis in angiosperms and associated biodiversity characteristics. Crit. Rev. Plant Sci. 2014, 33, 414–427. [Google Scholar] [CrossRef] [Green Version]
- Tang, D.; Ade, J.; Frye, C.A.; Innes, R.W. Regulation of plant defense responses in Arabidopsis by EDR2, a PH and START domain-containing protein: Regulation of plant defenses by EDR2. Plant J. 2005, 44, 245–257. [Google Scholar] [CrossRef] [Green Version]
- Osmark, P.; Boyle, B.; Brisson, N. Sequential and structural homology between intracellular pathogenesis-related proteins and a group of latex proteins. Plant Mol. Biol. 1998, 38, 1243–1246. [Google Scholar] [CrossRef]
- Gamas, P.; de Billy, F.; Truchet, G. Symbiosis-specific expression of two Medicago truncatula nodulin genes, MtN1 and MtN13, encoding products homologous to plant defense proteins. Mol. Plant. Microbe Interact. 1998, 11, 393–403. [Google Scholar] [CrossRef] [Green Version]
- Ponting, C.P.; Aravind, L. START: A lipid-binding domain in StAR, HD-ZIP and signalling proteins. Trends Biochem. Sci. 1999, 24, 130–132. [Google Scholar] [CrossRef]
- Schaller, H. The role of sterols in plant growth and development. Prog. Lipid Res. 2003, 42, 163–175. [Google Scholar] [CrossRef]
- Behmer, S.T.; Elias, D.O. The nutritional significance of sterol metabolic constraints in the generalist grasshopper Schistocerca americana. J. Insect Physiol. 1999, 45, 339–348. [Google Scholar] [CrossRef]
- Bouvaine, S.; Faure, M.-L.; Grebenok, R.J.; Behmer, S.T.; Douglas, A.E. A dietary test of putative deleterious sterols for the aphid Myzus persicae. PLoS ONE 2014, 9, e86256. [Google Scholar] [CrossRef] [PubMed] [Green Version]
- Khanday, I.; Skinner, D.; Yang, B.; Mercier, R.; Sundaresan, V. A male-expressed rice embryogenic trigger redirected for asexual propagation through seeds. Nature 2019, 565, 91–95. [Google Scholar] [CrossRef] [PubMed]
- Wang, C.; Liu, Q.; Shen, Y.; Hua, Y.; Wang, J.; Lin, J.; Wu, M.; Sun, T.; Cheng, Z.; Mercier, R.; et al. Clonal seeds from hybrid rice by simultaneous genome engineering of meiosis and fertilization genes. Nat. Biotechnol. 2019, 37, 283–286. [Google Scholar] [CrossRef]
- Xie, E.; Li, Y.; Tang, D.; Lv, Y.; Shen, Y.; Cheng, Z. A strategy for generating rice apomixis by gene editing. J. Integr. Plant Biol. 2019, 61, 911–916. [Google Scholar] [CrossRef] [Green Version]


© 2020 by the authors. Licensee MDPI, Basel, Switzerland. This article is an open access article distributed under the terms and conditions of the Creative Commons Attribution (CC BY) license (http://creativecommons.org/licenses/by/4.0/).
Share and Cite
Marconi, G.; Aiello, D.; Kindiger, B.; Storchi, L.; Marrone, A.; Reale, L.; Terzaroli, N.; Albertini, E. The Role of APOSTART in Switching between Sexuality and Apomixis in Poa pratensis. Genes 2020, 11, 941. https://0-doi-org.brum.beds.ac.uk/10.3390/genes11080941
Marconi G, Aiello D, Kindiger B, Storchi L, Marrone A, Reale L, Terzaroli N, Albertini E. The Role of APOSTART in Switching between Sexuality and Apomixis in Poa pratensis. Genes. 2020; 11(8):941. https://0-doi-org.brum.beds.ac.uk/10.3390/genes11080941
Chicago/Turabian StyleMarconi, Gianpiero, Domenico Aiello, Bryan Kindiger, Loriano Storchi, Alessandro Marrone, Lara Reale, Niccolò Terzaroli, and Emidio Albertini. 2020. "The Role of APOSTART in Switching between Sexuality and Apomixis in Poa pratensis" Genes 11, no. 8: 941. https://0-doi-org.brum.beds.ac.uk/10.3390/genes11080941