A Revised Model of Anatomically Modern Human Expansions Out of Africa through a Machine Learning Approximate Bayesian Computation Approach


Abstract
:1. Introduction
2. Materials and Methods
2.1. The FDSS
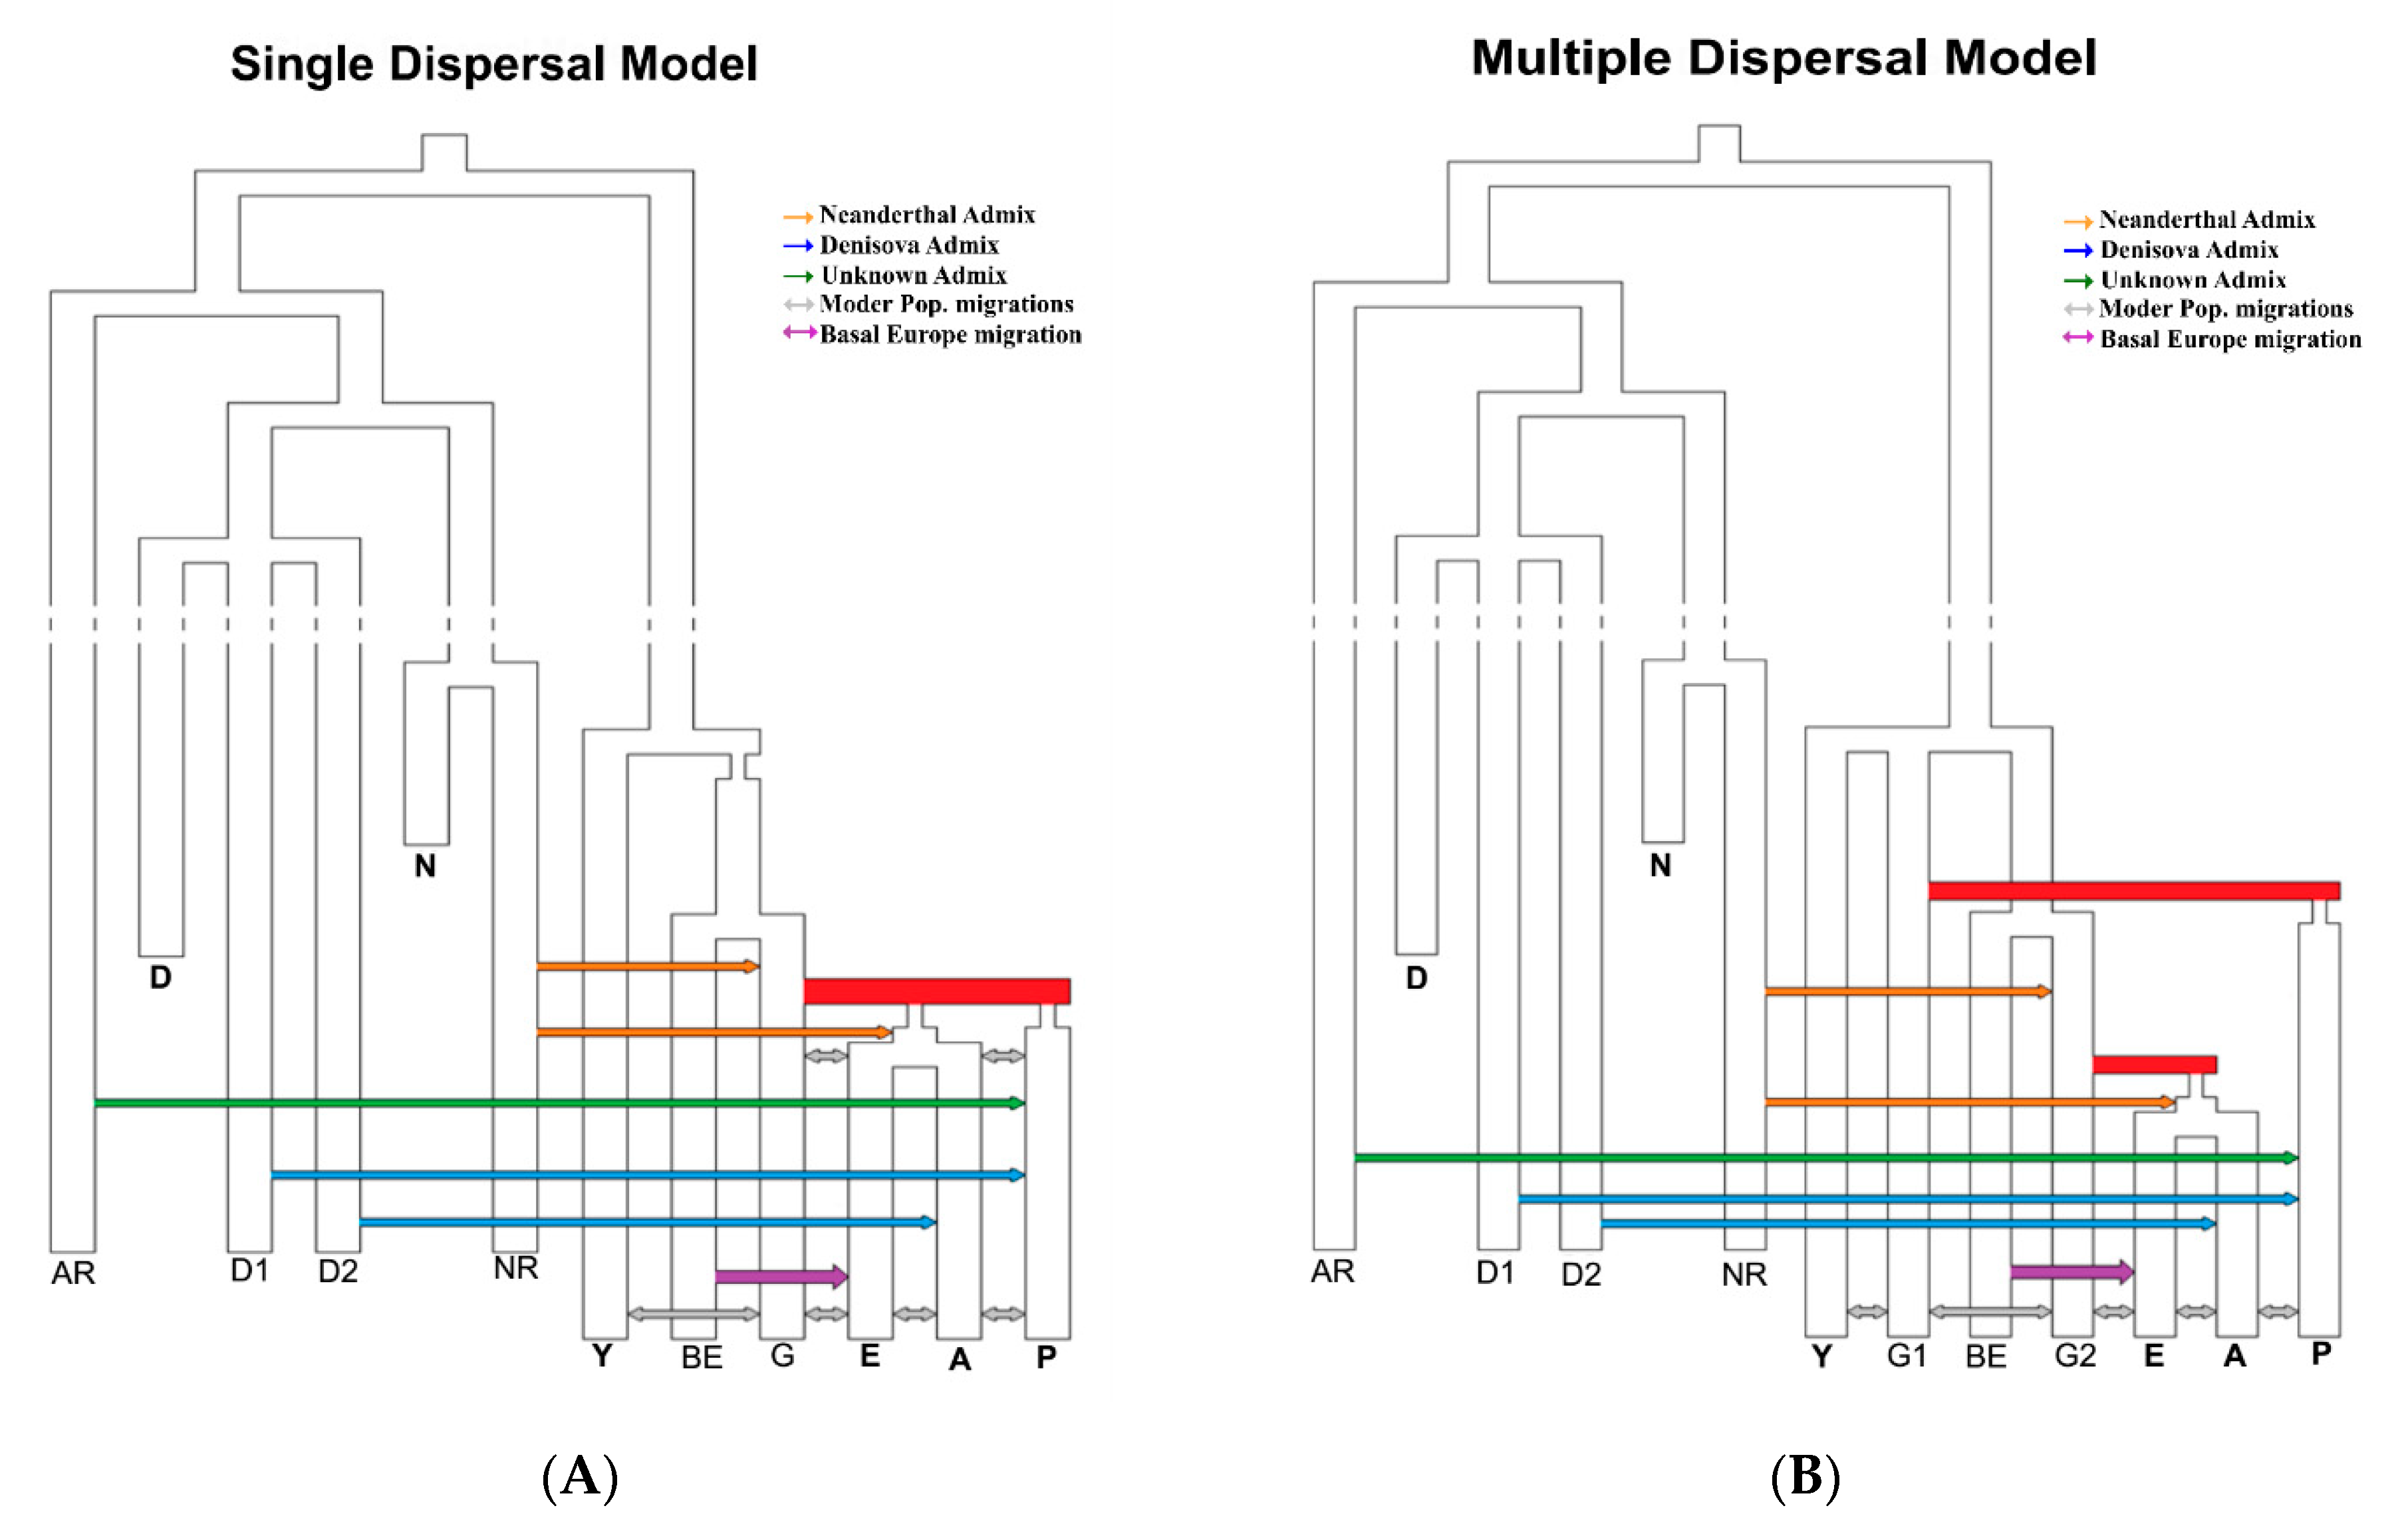
2.2. Simulated Models of Anatomically Modern Humans Expansion Out of Africa
2.3. Observed Genomic Data
2.4. Assessment of the Quality of the Parameters Estimated
- The coefficient of determination (R2). R2 is the fraction of variance of the parameters explained by the summary statistics used to build the regression model. In the absence of an established threshold value, there is a general agreement that when R2 < 0.10, the summary statistics do not convey enough information about the parameter estimates [36].
- The relative bias. To calculate the relative bias, we estimated the parameters for each pod with the same approach used for the observed data. The bias depends on the sum of differences between the 1000 estimates of each parameter thus obtained and the known (true) value, and it is calculated aswhere θi is the estimator of the parameter θ (true value), and n is the number of pods used (1000 in our case). Because bias is relative, a value of 1 corresponds to a bias equal to 100% of the true value.
- The root mean square error (RMSE). To calculate the RMSE we re-estimated parameters using pods. The RMSE depends the sum of squared differences between the 1000 estimates of each parameter thus obtained and the true value and it is calculated as:
- The factor 2, representing the proportion of the 1000 estimated median values lying between 50% and 200% of the true value.
- The 50% and 90% coverage, defined as the proportion of times that the known value lies within the 50% and the 90% credible interval of the 1000 estimates.
3. Results
3.1. Model Selection
3.2. Parameters Estimation
4. Discussion
5. Conclusions
Supplementary Materials
Author Contributions
Funding
Acknowledgments
Conflicts of Interest
References
- Scerri, E.M.L.; Thomas, M.G.; Manica, A.; Gunz, P.; Stock, J.T.; Stringer, C.; Grove, M.; Groucutt, H.S.; Timmermann, A.; Rightmire, G.P.; et al. Did Our Species Evolve in Subdivided Populations across Africa, and Why Does It Matter? Trends Ecol. Evol. 2018, 33, 582–594. [Google Scholar] [CrossRef] [Green Version]
- Mellars, P. Neanderthals and the Modern Human Colonization of Europe. Nature 2004, 432, 461–465. [Google Scholar] [CrossRef]
- Higham, T.; Douka, K.; Wood, R.; Ramsey, C.B.; Brock, F.; Basell, L.; Camps, M.; Arrizabalaga, A.; Baena, J.; Barroso-Ruíz, C.; et al. The Timing and Spatiotemporal Patterning of Neanderthal Disappearance. Nature 2014, 512, 306–309. [Google Scholar] [CrossRef] [PubMed]
- Mallick, S.; Li, H.; Lipson, M.; Mathieson, I.; Gymrek, M.; Racimo, F.; Zhao, M.; Chennagiri, N.; Nordenfelt, S.; Tandon, A.; et al. The Simons Genome Diversity Project: 300 Genomes from 142 Diverse Populations. Nature 2016, 538, 201–206. [Google Scholar] [CrossRef] [PubMed]
- Hershkovitz, I.; Weber, G.W.; Quam, R.; Duval, M.; Grün, R.; Kinsley, L.; Ayalon, A.; Bar-Matthews, M.; Valladas, H.; Mercier, N.; et al. The Earliest Modern Humans Outside Africa. Science 2018, 359, 456–459. [Google Scholar] [CrossRef] [Green Version]
- Liu, H.; Prugnolle, F.; Manica, A.; Balloux, F. A Geographically Explicit Genetic Model of Worldwide Human-Settlement History. Am. J. Hum. Genet. 2006, 79, 230–237. [Google Scholar] [CrossRef] [PubMed] [Green Version]
- Mellars, P.; Gori, K.C.; Carr, M.; Soares, P.A.; Richards, M.B. Genetic and Archaeological Perspectives on the Initial Modern Human Colonization of Southern Asia. Proc. Natl. Acad. Sci. USA 2013, 110, 10699–10704. [Google Scholar] [CrossRef] [PubMed] [Green Version]
- López, S.; Van Dorp, L.; Hellenthal, G. Human Dispersal out of Africa: A Lasting Debate. Evol. Bioinform. 2015. [Google Scholar] [CrossRef] [PubMed] [Green Version]
- Lahr, M.M.; Foley, R. Multiple Dispersals and Modern Human Origins. Evol. Anthropol. Issues News Rev. 1994, 3, 48–60. [Google Scholar] [CrossRef]
- Reyes-Centeno, H.; Ghirotto, S.; Detroit, F.; Grimaud-Herve, D.; Barbujani, G.; Harvati, K. Genomic and Cranial Phenotype Data Support Multiple Modern Human Dispersals from Africa and a Southern Route into Asia. Proc. Natl. Acad. Sci. USA 2014, 111, 7248–7253. [Google Scholar] [CrossRef] [Green Version]
- Tassi, F.; Ghirotto, S.; Mezzavilla, M.; Vilaça, S.T.; De Santi, L.; Barbujani, G. Early Modern Human Dispersal from Africa: Genomic Evidence for Multiple Waves of Migration. Investig. Genet. 2015, 6, 6–13. [Google Scholar] [CrossRef] [PubMed] [Green Version]
- Pagani, L.; Lawson, D.J.; Jagoda, E.; Mörseburg, A.; Eriksson, A.; Mitt, M.; Clemente, F.; Hudjashov, G.; DeGiorgio, M.; Saag, L.; et al. Genomic Analyses Inform on Migration Events during the Peopling of Eurasia. Nature 2016, 538, 238–242. [Google Scholar] [CrossRef] [PubMed] [Green Version]
- Malaspinas, A.S.; Westaway, M.C.; Muller, C.; Sousa, V.C.; Lao, O.; Alves, I.; Bergström, A.; Georgios, A.; Cheng, J.Y.; Crawford, G.E. A Genomic History of Aboriginal Australia. Nature 2016, 538, 207–214. [Google Scholar] [CrossRef] [PubMed]
- Varin, C. On Composite Marginal Likelihoods. Asta Adv. Stat. Anal. 2008, 92, 1–28. [Google Scholar] [CrossRef]
- Varin, C.; Reid, N.; Firth, D. An Overview of Composite Likelihood Methods. Stat. Sin. 2011, 21, 5–42. [Google Scholar]
- Ghirotto, S.; Vizzari, M.T.; Tassi, F.; Barbujani, G.; Benazzo, A. Distinguishing among Complex Evolutionary Models Using Unphased Whole-genome Data through Random-Forest Approximate Bayesian Computation. Mol. Ecol. Resour. 2020, 1–15. [Google Scholar] [CrossRef]
- Beaumont, M.A.; Zhang, W.; Balding, D.J. Approximate Bayesian Computation in Population Genetics. Genetics 2002, 162, 2025–2035. [Google Scholar]
- Beaumont, M.A. Joint Determination of Topology, Divergence Time, and Immigration in Population Trees. In Simulations, Genetics and Human Prehistory; McDonald Institute for Archaeological Research: Cambridge, UK, 2008; pp. 135–154. [Google Scholar]
- Pudlo, P.; Marin, J.M.; Estoup, A.; Cornuet, J.M.; Gautier, M.; Robert, C.P. Reliable ABC Model Choice via Random Forests. Bioinformatics 2015, 32, 859–866. [Google Scholar] [CrossRef] [PubMed] [Green Version]
- Raynal, L.; Marin, J.M.; Pudlo, P.; Ribatet, M.; Robert, C.P.; Estoup, A. ABC Random Forests for Bayesian Parameter Inference. Bioinformatics 2019, 35, 1720–1728. [Google Scholar] [CrossRef]
- Wakeley, J.; Hey, J. Estimating Ancestral Population Parameters. Genetics 1997, 145, 847–855. [Google Scholar]
- Mondal, M.; Casals, F.; Xu, T.; Dall’Olio, G.M.; Pybus, M.; Netea, M.G.; Comas, D.; Laayouni, H.; Li, Q.; Majumder, P.P.; et al. Genomic Analysis of Andamanese Provides Insights into Ancient Human Migration into Asia and Adaptation. Nat. Genet. 2016, 48, 1066–1070. [Google Scholar] [CrossRef] [PubMed]
- Browning, S.R.; Browning, B.L.; Zhou, Y.; Tucci, S.; Akey, J.M. Analysis of Human Sequence Data Reveals Two Pulses of Archaic Denisovan Admixture. Cell 2018, 173, 53–61.e9. [Google Scholar] [CrossRef] [Green Version]
- Jacobs, G.S.; Hudjashov, G.; Saag, L.; Kusuma, P.; Darusallam, C.C.; Lawson, D.J.; Mondal, M.; Pagani, L.; Ricaut, F.-X.; Stoneking, M.; et al. Multiple Deeply Divergent Denisovan Ancestries in Papuans. Cell 2019, 177, 1010–1021. [Google Scholar] [CrossRef] [PubMed] [Green Version]
- Wall, J.D.; Yang, M.A.; Jay, F.; Kim, S.K.; Durand, E.Y.; Stevison, L.S.; Gignoux, C.; Woerner, A.; Hammer, M.F.; Slatkin, M. Higher Levels of Neanderthal Ancestry in East Asians than in Europeans. Genetics 2013, 194, 199–209. [Google Scholar] [CrossRef] [PubMed]
- Prüfer, K.; Racimo, F.; Patterson, N.; Jay, F.; Sankararaman, S.; Sawyer, S.; Heinze, A.; Renaud, G.; Sudmant, P.H.; De Filippo, C.; et al. The Complete Genome Sequence of a Neanderthal from the Altai Mountains. Nature 2014, 505, 43–49. [Google Scholar] [CrossRef] [PubMed]
- Vernot, B.; Akey, J.M. Resurrecting Surviving Neandertal Lineages from Modern Human Genomes. Science 2014, 343, 1017–1021. [Google Scholar] [CrossRef] [PubMed]
- Lazaridis, I.; Patterson, N.; Mittnik, A.; Renaud, G.; Mallick, S.; Kirsanow, K.; Sudmant, P.H.; Schraiber, J.G.; Castellano, S.; Lipson, M.; et al. Ancient Human Genomes Suggest Three Ancestral Populations for Present-Day Europeans. Nature 2014, 513, 409–413. [Google Scholar] [CrossRef] [Green Version]
- Lazaridis, I.; Nadel, D.; Rollefson, G.; Merrett, D.C.; Rohland, N.; Mallick, S.; Fernandes, D.; Novak, M.; Gamarra, B.; Sirak, K.; et al. Genomic Insights into the Origin of Farming in the Ancient Near East. Nature 2016, 536, 419–424. [Google Scholar] [CrossRef] [Green Version]
- Villanea, F.A.; Schraiber, J.G. Multiple Episodes of Interbreeding between Neanderthal and Modern Humans. Nat. Ecol. Evol. 2019, 3, 39–44. [Google Scholar] [CrossRef]
- Scally, A.; Durbin, R. Revising the Human Mutation Rate: Implications for Understanding Human Evolution. Nat. Rev. Genet. 2012, 13, 745–753. [Google Scholar] [CrossRef]
- Hudson, R.R. Generating Samples under a Wright-Fisher Neutral Model of Genetic Variation. Bioinformatics 2002, 18, 337–338. [Google Scholar] [CrossRef]
- Meyer, M.; Kircher, M.; Gansauge, M.T.; Li, H.; Racimo, F.; Mallick, S.; Schraiber, J.G.; Jay, F.; Prüfer, K.; De Filippo, C.; et al. A High-Coverage Genome Sequence from an Archaic Denisovan Individual. Science 2012, 338, 222–226. [Google Scholar] [CrossRef] [Green Version]
- Hinrichs, A.S.; Raney, B.J.; Speir, M.L.; Rhead, B.; Casper, J.; Karolchik, D.; Kuhn, R.M.; Rosenbloom, K.R.; Zweig, A.S.; Haussler, D.; et al. UCSC Data Integrator and Variant Annotation Integrator. Bioinformatics 2016, 32, 1430–1432. [Google Scholar] [CrossRef] [Green Version]
- Li, H.; Handsaker, B.; Wysoker, A.; Fennell, T.; Ruan, J.; Homer, N.; Marth, G.; Abecasis, G.; Durbin, R. The Sequence Alignment/Map Format and SAMtools. Bioinformatics 2009, 25, 2078–2079. [Google Scholar] [CrossRef] [PubMed] [Green Version]
- Neuenschwander, S.; Largiadèr, C.R.; Ray, N.; Currat, M.; Vonlanthen, P.; Excoffier, L. Colonization History of the Swiss Rhine Basin by the Bullhead (Cottus Gobio): Inference under a Bayesian Spatially Explicit Framework. Mol. Ecol. 2008, 17, 757–772. [Google Scholar] [CrossRef] [PubMed]
- Fan, S.; Kelly, D.E.; Beltrame, M.H.; Hansen, M.E.B.; Mallick, S.; Ranciaro, A.; Hirbo, J.; Thompson, S.; Beggs, W.; Nyambo, T.; et al. African Evolutionary History Inferred from Whole Genome Sequence Data of 44 Indigenous African Populations. Genome Biol. 2019, 20, 1–14. [Google Scholar]
- McEvoy, B.P.; Powell, J.E.; Goddard, M.E.; Visscher, P.M. Human Population Dispersal “Out of Africa” Estimated from Linkage Disequilibrium and Allele Frequencies of SNPs. Genome Res. 2011, 21, 821–829. [Google Scholar] [CrossRef] [Green Version]
- Fagundes, N.J.R.; Ray, N.; Beaumont, M.; Neuenschwander, S.; Salzano, F.M.; Bonatto, S.L.; Excoffier, L. Statistical Evaluation of Alternative Models of Human Evolution. Proc. Natl. Acad. Sci. USA 2007, 104, 17614–17619. [Google Scholar] [CrossRef] [PubMed] [Green Version]
- Veeramah, K.R.; Wegmann, D.; Woerner, A.; Mendez, F.L.; Watkins, J.C.; Destro-Bisol, G.; Soodyall, H.; Louie, L.; Hammer, M.F. An Early Divergence of KhoeSan Ancestors from Those of Other Modern Humans Is Supported by an ABC-Based Analysis of Autosomal Resequencing Data. Mol. Biol. Evol. 2012, 29, 617–630. [Google Scholar] [CrossRef] [Green Version]
- Excoffier, L.; Dupanloup, I.; Huerta-Sánchez, E.; Sousa, V.C.; Foll, M. Robust Demographic Inference from Genomic and SNP Data. PLoS Genet. 2013, 9, e1003905. [Google Scholar] [CrossRef] [Green Version]
- Nater, A.; Mattle-Greminger, M.P.; Nurcahyo, A.; Nowak, M.G.; De Manuel, M.; Desai, T.; Groves, C.; Pybus, M.; Sonay, T.B.; Roos, C.; et al. Morphometric, Behavioral, and Genomic Evidence for a New Orangutan Species. Curr. Biol. 2017, 27, 3576–3577. [Google Scholar] [CrossRef] [PubMed]
- Schiffels, S.; Durbin, R. Inferring Human Population Size and Separation History from Multiple Genome Sequences. Nat. Genet. 2014, 46, 919–925. [Google Scholar] [CrossRef] [PubMed] [Green Version]
- Mirazón Lahr, M.; Foley, R.A. Towards a Theory of Modern Human Origins: Geography, Demography, and Diversity in Recent Human Evolution. Am. J. Phys. Anthropol. 1999, 107, 137–176. [Google Scholar] [CrossRef]
- Gravel, S.; Henn, B.M.; Gutenkunst, R.N.; Indap, A.R.; Marth, G.T.; Clark, A.G.; Yu, F.; Gibbs, R.A.; Bustamante, C.D.; The 1000 Genomes Project; et al. Demographic History and Rare Allele Sharing among Human Populations. Proc. Natl. Acad. Sci. USA 2011, 108, 11983–11988. [Google Scholar] [CrossRef] [PubMed] [Green Version]
- Mellars, P. Why Did Modern Human Populations Disperse from Africa ca. 60,000 Years Ago? A New Model. Proc. Natl. Acad. Sci. USA 2006, 103, 9381–9386. [Google Scholar] [CrossRef] [Green Version]
- Reyes-Centeno, H.; Hubbe, M.; Hanihara, T.; Stringer, C.; Harvati, K. Testing Modern Human Out-of-Africa Dispersal Models and Implications for Modern Human Origins. J. Hum. Evol. 2015, 87, 95–106. [Google Scholar] [CrossRef]
- Hublin, J.J.; Sirakov, N.; Aldeias, V.; Bailey, S.; Bard, E.; Delvigne, V.; Endarova, E.; Fagault, Y.; Fewlass, H.; Hajdinjak, M.; et al. Initial Upper Palaeolithic Homo Sapiens from Bacho Kiro Cave, Bulgaria. Nature 2020, 581, 299–302. [Google Scholar] [CrossRef]
- Haak, W.; Lazaridis, I.; Patterson, N.; Rohland, N.; Mallick, S.; Llamas, B.; Brandt, G.; Nordenfelt, S.; Harney, E.; Stewardson, K.; et al. Massive Migration from the Steppe Was a Source for Indo-European Languages in Europe. Nature 2015, 522, 207–211. [Google Scholar] [CrossRef] [Green Version]


| Prior Err. Rate | True Positive SD | True Positive MD | Post. Prob. SD | Post. Prob. MD |
|---|---|---|---|---|
| 0.26 | 0.73 | 0.75 | 0.75 | 0.73 |
| ID_Individual | Selected Model | Votes SD | Votes MD | Post. Prob. |
|---|---|---|---|---|
| EGAN00001279031 | MD | 94 | 406 | 0.822 |
| EGAN00001279039 | MD | 86 | 414 | 0.806 |
| EGAN00001279047 | MD | 111 | 389 | 0.798 |
| EGAN00001279054 | MD | 128 | 372 | 0.809 |
| EGAN00001279032 | MD | 90 | 410 | 0.825 |
| EGAN00001279040 | MD | 113 | 387 | 0.784 |
| EGAN00001279048 | MD | 99 | 401 | 0.805 |
| EGAN00001279033 | MD | 108 | 392 | 0.791 |
| EGAN00001279041 | MD | 111 | 389 | 0.797 |
| EGAN00001279049 | MD | 126 | 374 | 0.789 |
| EGAN00001279034 | MD | 150 | 350 | 0.797 |
| EGAN00001279042 | MD | 109 | 391 | 0.791 |
| EGAN00001279050 | MD | 111 | 389 | 0.797 |
| EGAN00001279035 | MD | 108 | 392 | 0.799 |
| EGAN00001279043 | MD | 97 | 403 | 0.802 |
| EGAN00001279051 | MD | 117 | 383 | 0.786 |
| EGAN00001279036 | MD | 136 | 364 | 0.778 |
| EGAN00001279044 | MD | 109 | 391 | 0.784 |
| EGAN00001279052 | MD | 100 | 400 | 0.815 |
| EGAN00001279037 | MD | 96 | 404 | 0.800 |
| EGAN00001279045 | MD | 148 | 352 | 0.787 |
| EGAN00001279053 | MD | 100 | 400 | 0.796 |
| EGAN00001279038 | MD | 91 | 409 | 0.811 |
| EGAN00001279046 | MD | 104 | 396 | 0.781 |
| EGAN00001279055 | MD | 138 | 362 | 0.787 |
| Koinb1 | MD | 165 | 335 | 0.810 |
| Koinb2 | MD | 129 | 371 | 0.811 |
| Koinb3 | MD | 175 | 325 | 0.820 |
| Kosip1 | MD | 152 | 348 | 0.818 |
| Kosip2 | MD | 136 | 364 | 0.788 |
| Kosip3 | MD | 123 | 377 | 0.830 |
| Parameter | Mean | Median | Variance | Q (0.05) | Q (0.95) | Q (0.25) | Q (0.75) |
|---|---|---|---|---|---|---|---|
| nAR | 2822 | 2793 | 5.77 × 10⁴ | 2540 | 3410 | 2666 | 2914 |
| nY | 19,077 | 14,347 | 1.72 × 10⁸ | 4204 | 44,993 | 7976 | 29117 |
| nG1 | 26,191 | 26,995 | 2.08 × 10⁸ | 3253 | 47,385 | 13,670 | 39,819 |
| nG2 | 23,473 | 22,275 | 1.96 × 10⁸ | 1903 | 46,649 | 11,151 | 34,663 |
| nBE | 25,612 | 26,269 | 2.08 × 10⁸ | 2731 | 47,604 | 13,394 | 38,160 |
| nE | 13,498 | 6616 | 2.07 × 10⁸ | 627 | 42,565 | 1616 | 23,761 |
| nA | 16,360 | 11,553 | 2.25 × 10⁸ | 773 | 44,620 | 2599 | 28,065 |
| nP | 24,268 | 24,839 | 2.34 × 10⁸ | 1535 | 47,534 | 10,756 | 37,349 |
| nYG | 23,317 | 22,292 | 3.19 × 10⁷ | 17,112 | 35,456 | 19,789 | 25,425 |
| nNNR | 2424 | 2343 | 1.22 × 10⁵ | 2057 | 3001 | 2219 | 2504 |
| nDDR | 21,360 | 19,680 | 2.00 × 10⁸ | 1570 | 46,512 | 9482 | 32,332 |
| nDN | 17,025 | 12,576 | 1.77 × 10⁸ | 2789 | 43,117 | 5312 | 27,001 |
| nADN | 19,733 | 16,531 | 2.28 × 10⁸ | 2108 | 47,465 | 5770 | 31,455 |
| nAM | 18,846 | 18,745 | 1.73 × 10⁶ | 16,780 | 21,023 | 17,911 | 19,745 |
| rP | 0.0214 | 0.0146 | 8.36 × 10⁻⁴ | 0.0105 | 0.0532 | 0.0119 | 0.0192 |
| rEA | 0.0313 | 0.0179 | 1.91 × 10⁻³ | 0.0109 | 0.0869 | 0.0142 | 0.0303 |
| tdYG1 | 101,162 | 103,842 | 7.61 × 10⁸ | 54,830 | 140,536 | 78,262 | 125,226 |
| tdYG2 | 99,000 | 98,925 | 7.13 × 10⁸ | 55,038 | 137,970 | 76,482 | 124,250 |
| tdOA1 | 77,106 | 73,566 | 5.86 × 10⁸ | 47,019 | 120,206 | 55,392 | 96,881 |
| tOAbot1 | 73,389 | 66,248 | 6.14 × 10⁸ | 44,341 | 118,942 | 52,082 | 93,165 |
| tdOA2 | 47,524 | 45,937 | 3.99 × 10⁷ | 40,394 | 59,245 | 42,597 | 51,019 |
| tOAbot2 | 45,223 | 43,282 | 5.30 × 10⁷ | 37,718 | 58,387 | 40,110 | 48,153 |
| tdG2BE | 68,415 | 61,497 | 3.78 × 10⁸ | 50,281 | 113,560 | 53,713 | 75,889 |
| tdEA | 38,187 | 37,017 | 4.33 × 10⁷ | 30,483 | 50,076 | 33,374 | 41,444 |
| taNG2 | 52,032 | 49,731 | 8.13 × 10⁷ | 42,680 | 69,758 | 45,402 | 55,444 |
| taNEA | 41,663 | 40,005 | 4.51 × 10⁷ | 33,965 | 55,743 | 36,653 | 45,055 |
| taARP | 61,567 | 55,048 | 4.53 × 10⁸ | 37,831 | 106,642 | 43,945 | 75,654 |
| taD1P | 51,047 | 44,460 | 3.89 × 10⁸ | 31,094 | 95,155 | 36,207 | 58,088 |
| taD2A | 28,645 | 27,059 | 4.24 × 10⁷ | 20,958 | 39,746 | 23,730 | 32,456 |
| taBEE | 25,269 | 24,844 | 1.00 × 10⁸ | 11,194 | 45,254 | 16,827 | 31,380 |
| paNG2 | 5.19 × 10⁻² | 4.99 × 10⁻² | 7.71 × 10⁻⁴ | 9.44 × 10⁻³ | 9.52 × 10⁻³ | 2.91 × 10⁻² | 7.73 × 10⁻² |
| paNEA | 4.73 × 10⁻² | 4.73 × 10⁻² | 7.95 × 10⁻⁴ | 5.36 × 10⁻³ | 9.57 × 10⁻² | 2.30 × 10⁻² | 7.01 × 10⁻² |
| paARP | 4.82 × 10⁻² | 4.83 × 10⁻² | 9.00 × 10⁻⁴ | 4.97 × 10⁻³ | 9.45 × 10⁻² | 2.09 × 10⁻² | 7.71 × 10⁻² |
| paD1P | 5.21 × 10⁻² | 5.27 × 10⁻² | 8.43 × 10⁻⁴ | 4.58 × 10⁻³ | 9.53 × 10⁻² | 2.84 × 10⁻² | 7.85 × 10⁻² |
| paD2A | 4.74 × 10⁻² | 4.72 × 10⁻² | 8.46 × 10⁻⁴ | 3.95 × 10⁻³ | 9.32 × 10⁻² | 2.17 × 10⁻² | 7.24 × 10⁻² |
| paBEE | 2.78 × 10⁻¹ | 2.85 × 10⁻¹ | 1.61 × 10⁻² | 6.83 × 10⁻² | 4.79 × 10⁻¹ | 1.71 × 10⁻¹ | 3.83 × 10⁻¹ |
| mYG1 | 4.75 × 10⁻⁴ | 4.62 × 10⁻⁴ | 9.64 × 10⁻⁸ | 2.61 × 10⁻⁵ | 9.48 × 10⁻⁴ | 1.92 × 10⁻⁴ | 7.54 × 10⁻⁴ |
| mG1Y | 4.74 × 10⁻⁴ | 4.64 × 10⁻⁴ | 7.95 × 10⁻⁸ | 4.65 × 10⁻⁵ | 9.30 × 10⁻⁴ | 2.25 × 10⁻⁴ | 6.98 × 10⁻⁴ |
| mG1G2 | 4.93 × 10⁻⁴ | 4.80 × 10⁻⁴ | 8.50 × 10⁻⁸ | 4.54 × 10⁻⁵ | 9.41 × 10⁻⁴ | 2.49 × 10⁻⁴ | 7.63 × 10⁻⁴ |
| mG2G1 | 5.34 × 10⁻⁴ | 5.61 × 10⁻⁴ | 8.83 × 10⁻⁸ | 4.77 × 10⁻⁵ | 9.68 × 10⁻⁴ | 2.69 × 10⁻⁴ | 7.94 × 10⁻⁴ |
| mG2E | 5.23 × 10⁻⁴ | 5.29 × 10⁻⁴ | 8.13 × 10⁻⁸ | 5.19 × 10⁻⁵ | 9.57 × 10⁻⁴ | 2.84 × 10⁻⁴ | 7.81 × 10⁻⁴ |
| mEG2 | 4.21 × 10⁻⁴ | 3.69 × 10⁻⁴ | 7.78 × 10⁻⁸ | 3.73 × 10⁻⁵ | 9.07 × 10⁻⁴ | 1.85 × 10⁻⁴ | 6.48 × 10⁻⁴ |
| mEA | 4.19 × 10⁻⁴ | 3.60 × 10⁻⁴ | 8.63 × 10⁻⁸ | 3.73 × 10⁻⁵ | 9.66 × 10⁻⁴ | 1.81 × 10⁻⁴ | 6.45 × 10⁻⁴ |
| mAE | 5.33 × 10⁻⁴ | 5.69 × 10⁻⁴ | 7.63 × 10⁻⁸ | 5.82 × 10⁻⁵ | 9.33 × 10⁻⁴ | 2.90 × 10⁻⁴ | 7.57 × 10⁻⁴ |
| mAP | 1.70 × 10⁻⁴ | 1.27 × 10⁻⁴ | 2.26 × 10⁻⁸ | 1.42 × 10⁻⁵ | 5.16 × 10⁻⁴ | 7.40 × 10⁻⁵ | 2.10 × 10⁻⁴ |
| mPA | 1.28 × 10⁻⁴ | 1.02 × 10⁻⁴ | 1.18 × 10⁻⁸ | 8.01 × 10⁻⁶ | 3.37 × 10⁻⁴ | 4.52 × 10⁻⁵ | 1.72 × 10⁻⁴ |
| m1G2EA | 4.96 × 10⁻⁴ | 5.01 × 10⁻⁴ | 8.24 × 10⁻⁸ | 5.60 × 10⁻⁶ | 9.47 × 10⁻⁴ | 2.45 × 10⁻⁴ | 7.53 × 10⁻⁴ |
| m1EAG2 | 4.46 × 10⁻⁴ | 4.00 × 10⁻⁴ | 8.23 × 10⁻⁸ | 5.18 × 10⁻⁵ | 9.49 × 10⁻⁴ | 1.99 × 10⁻⁴ | 6.95 × 10⁻⁴ |
| m1EAP | 4.25 × 10⁻⁴ | 3.97 × 10⁻⁴ | 7.57 × 10⁻⁸ | 2.77 × 10⁻⁵ | 9.07 × 10⁻⁴ | 1.95 × 10⁻⁴ | 6.39 × 10⁻⁴ |
| m1PEA | 4.40 × 10⁻⁴ | 4.02 × 10⁻⁴ | 8.39 × 10⁻⁸ | 4.04 × 10⁻⁵ | 9.31 × 10⁻⁴ | 1.77 × 10⁻⁴ | 6.93 × 10⁻⁴ |
| Parameter | Mean | Median | Variance | Q (0.05) | Q (0.95) | Q (0.25) | Q (0.75) |
|---|---|---|---|---|---|---|---|
| nAR | 2803 | 2783 | 4.57 × 10⁴ | 2532 | 3302 | 2668 | 2900 |
| nY | 19,182 | 14,771 | 1.62 × 10⁸ | 4379 | 44,930 | 8223 | 29,102 |
| nG1 | 26,722 | 28,003 | 2.18 × 10⁸ | 2702 | 47,514 | 14,075 | 40,579 |
| nG2 | 25,325 | 27,394 | 1.97 × 10⁸ | 2218 | 47,188 | 13,362 | 36,308 |
| nBE | 25,684 | 26,296 | 2.17 × 10⁸ | 2194 | 47,896 | 13,706 | 38,919 |
| nE | 12,485 | 5373 | 1.94 × 10⁸ | 699 | 42,194 | 1616 | 21,836 |
| nA | 14,543 | 8978 | 2.10 × 10⁸ | 916 | 43,930 | 2214 | 26,207 |
| nP | 19,089 | 16,639 | 2.16 × 10⁸ | 1048 | 46,319 | 4980 | 30,429 |
| nYG | 22,857 | 21,922 | 2.62 × 10⁷ | 17,112 | 31,789 | 19,579 | 25,130 |
| nNNR | 2422 | 2336 | 1.24 × 10⁵ | 2057 | 3023 | 2219 | 2531 |
| nDDR | 21,778 | 20,572 | 1.94 × 10⁸ | 1640 | 46291 | 9606 | 32,332 |
| nDN | 16,239 | 11,846 | 1.59 × 10⁸ | 2879 | 41321 | 5311 | 25,523 |
| nADN | 19,279 | 16,531 | 2.21 × 10⁸ | 2108 | 47070 | 4884 | 31,082 |
| nAM | 18,629 | 18,574 | 1.57 × 10⁶ | 16,671 | 20,691 | 17,779 | 19,476 |
| rP | 0.0215 | 0.0143 | 6.10 × 10⁻⁴ | 0.0104 | 0.0576 | 0.0118 | 0.0204 |
| rEA | 0.0314 | 0.0179 | 1.94 × 10⁻³ | 0.0109 | 0.0869 | 0.0144 | 0.0310 |
| tdYG1 | 98,829 | 99,987 | 7.31 × 10⁸ | 54,220 | 140,009 | 76,337 | 122,428 |
| tdYG2 | 97,430 | 96,686 | 6.87 × 10⁸ | 54,693 | 138,490 | 76,482 | 120,370 |
| tdOA1 | 74,244 | 68,987 | 5.32 × 10⁸ | 46,663 | 119,539 | 54,334 | 89,685 |
| tOAbot1 | 70,341 | 64,285 | 5.47 × 10⁸ | 43,471 | 116,608 | 50,992 | 85,938 |
| tdOA2 | 48,554 | 46,257 | 7.36 × 10⁷ | 40,559 | 64,865 | 42,739 | 51,453 |
| tOAbot2 | 46,366 | 43,475 | 8.49 × 10⁷ | 37,922 | 63,074 | 40,247 | 50,084 |
| tdG2BE | 68,122 | 62,035 | 3.36 × 10⁸ | 50,281 | 105,774 | 53,533 | 76,526 |
| tdEA | 37,747 | 35,936 | 5.05 × 10⁷ | 30,381 | 50,399 | 32,690 | 40,845 |
| taNG2 | 53,606 | 50,116 | 1.08 × 10⁸ | 43,274 | 73,012 | 46,917 | 57,484 |
| taNEA | 42,255 | 40,175 | 7.98 × 10⁷ | 33,449 | 56,376 | 37,030 | 45,231 |
| taARP | 61,203 | 54,697 | 4.60 × 10⁸ | 37,428 | 106,643 | 43,994 | 73,444 |
| taD1P | 48,493 | 43,651 | 2.90 × 10⁸ | 31,343 | 86,579 | 36,450 | 55,023 |
| taD2A | 29,298 | 27,601 | 5.05 × 10⁷ | 21,090 | 41,451 | 24,133 | 32,700 |
| taBEE | 23,871 | 23,356 | 9.64 × 10⁷ | 10,508 | 40,711 | 15,268 | 30,666 |
| paNG2 | 5.29 × 10⁻² | 5.35 × 10⁻² | 7.32 × 10⁻⁴ | 8.94 × 10⁻³ | 9.52 × 10⁻² | 3.18 × 10⁻² | 7.51 × 10⁻² |
| paNEA | 5.12 × 10⁻² | 5.22 × 10⁻² | 7.83 × 10⁻⁴ | 5.58 × 10⁻³ | 9.60 × 10⁻² | 2.69 × 10⁻² | 7.44 × 10⁻² |
| paARP | 5.02 × 10⁻² | 5.06 × 10⁻² | 8.74 × 10⁻⁴ | 5.45 × 10⁻³ | 9.49 × 10⁻² | 2.36 × 10⁻² | 7.81 × 10⁻² |
| paD1P | 5.23 × 10⁻² | 5.50 × 10⁻² | 8.00 × 10⁻⁴ | 6.13 × 10⁻³ | 9.41 × 10⁻² | 2.78 × 10⁻² | 7.66 × 10⁻² |
| paD2A | 4.82 × 10⁻² | 4.52 × 10⁻² | 8.87 × 10⁻⁴ | 4.93 × 10⁻³ | 9.58 × 10⁻² | 2.27 × 10⁻² | 7.39 × 10⁻² |
| paBEE | 2.79 × 10⁻¹ | 2.91 × 10⁻¹ | 1.65 × 10⁻² | 6.58 × 10⁻² | 4.78 × 10⁻¹ | 1.68 × 10⁻¹ | 3.88 × 10⁻¹ |
| mYG1 | 4.47 × 10⁻⁴ | 4.08 × 10⁻⁴ | 8.52 × 10⁻⁸ | 3.74 × 10⁻⁵ | 9.32 × 10⁻⁴ | 1.89 × 10⁻⁴ | 6.97 × 10⁻⁴ |
| mG1Y | 4.92 × 10⁻⁴ | 4.91 × 10⁻⁴ | 7.55 × 10⁻⁸ | 5.11 × 10⁻⁵ | 9.27 × 10⁻⁴ | 2.79 × 10⁻⁴ | 7.28 × 10⁻⁴ |
| mG1G2 | 4.74 × 10⁻⁴ | 4.59 × 10⁻⁴ | 8.40 × 10⁻⁸ | 4.41 × 10⁻⁵ | 9.35 × 10⁻⁴ | 2.31 × 10⁻⁴ | 7.32 × 10⁻⁴ |
| mG2G1 | 5.20 × 10⁻⁴ | 5.23 × 10⁻⁴ | 9.07 × 10⁻⁸ | 4.77 × 10⁻⁵ | 9.67 × 10⁻⁴ | 2.34 × 10⁻⁴ | 7.93 × 10⁻⁴ |
| mG2E | 5.16 × 10⁻⁴ | 5.29 × 10⁻⁴ | 7.87 × 10⁻⁸ | 5.67 × 10⁻⁵ | 9.55 × 10⁻⁴ | 2.85 × 10⁻⁴ | 7.60 × 10⁻⁴ |
| mEG2 | 3.77 × 10⁻⁴ | 3.04 × 10⁻⁴ | 8.13 × 10⁻⁸ | 2.70 × 10⁻⁵ | 9.11 × 10⁻⁴ | 1.30 × 10⁻⁴ | 5.80 × 10⁻⁴ |
| mEA | 5.07 × 10⁻⁴ | 5.15 × 10⁻⁴ | 8.78 × 10⁻⁸ | 4.74 × 10⁻⁵ | 9.57 × 10⁻⁴ | 2.52 × 10⁻⁴ | 7.68 × 10⁻⁴ |
| mAE | 4.67 × 10⁻⁴ | 4.68 × 10⁻⁴ | 7.94 × 10⁻⁸ | 4.78 × 10⁻⁵ | 9.17 × 10⁻⁴ | 2.29 × 10⁻⁴ | 7.07 × 10⁻⁴ |
| mAP | 5.17 × 10⁻⁴ | 5.12 × 10⁻⁴ | 7.28 × 10⁻⁸ | 1.04 × 10⁻⁴ | 9.35 × 10⁻⁴ | 2.78 × 10⁻⁴ | 7.50 × 10⁻⁴ |
| mPA | 4.05 × 10⁻⁴ | 3.79 × 10⁻⁴ | 5.71 × 10⁻⁸ | 5.15 × 10⁻⁵ | 8.70 × 10⁻⁴ | 2.27 × 10⁻⁴ | 5.41 × 10⁻⁴ |
| m1G2EA | 5.20 × 10⁻⁴ | 5.21 × 10⁻⁴ | 8.85 × 10⁻⁸ | 4.88 × 10⁻⁵ | 9.74 × 10⁻⁴ | 2.74 × 10⁻⁴ | 7.90 × 10⁻⁴ |
| m1EAG2 | 4.56 × 10⁻⁴ | 4.30 × 10⁻⁴ | 7.91 × 10⁻⁸ | 5.77 × 10⁻⁵ | 9.24 × 10⁻⁴ | 2.09 × 10⁻⁴ | 7.16 × 10⁻⁴ |
| m1EAP | 4.92 × 10⁻⁴ | 5.12 × 10⁻⁴ | 7.88 × 10⁻⁸ | 6.32 × 10⁻⁵ | 9.42 × 10⁻⁴ | 2.47 × 10⁻⁴ | 7.11 × 10⁻⁴ |
| m1PEA | 4.78 × 10⁻⁴ | 4.59 × 10⁻⁴ | 7.42 × 10⁻⁸ | 6.17 × 10⁻⁵ | 9.24 × 10⁻⁴ | 2.44 × 10⁻⁴ | 7.02 × 10⁻⁴ |
| Parameters | R2 | Bias | RMSE | Factor 2 | Coverage 90% | Coverage 50% |
|---|---|---|---|---|---|---|
| nAR | 0.84 | −0.0020 | 5.90 × 10³ | 0.990 | 0.935 | 0.553 |
| nY | 0.54 | 0.1900 | 1.04 × 10⁴ | 0.867 | 0.919 | 0.522 |
| nG1 | 0.08 | 2.0020 | 1.46 × 10⁴ | 0.702 | 0.880 | 0.466 |
| nG2 | 0.17 | 0.9175 | 1.36 × 10⁴ | 0.698 | 0.915 | 0.497 |
| nBE | 0.02 | 2.2194 | 1.47 × 10⁴ | 0.722 | 0.895 | 0.479 |
| nE | 0.33 | 0.4278 | 1.25 × 10⁴ | 0.767 | 0.908 | 0.523 |
| nA | 0.28 | 0.4159 | 1.20 × 10⁴ | 0.795 | 0.922 | 0.532 |
| nP | 0.39 | 0.3425 | 1.21 × 10⁴ | 0.791 | 0.908 | 0.501 |
| nYG | 0.91 | 0.0020 | 3.54 × 10³ | 0.998 | 0.957 | 0.650 |
| nNNR | 0.92 | 0.0086 | 3.64 × 10³ | 0.998 | 0.966 | 0.622 |
| nDDR | 0.36 | 0.3529 | 1.18 × 10⁴ | 0.800 | 0.923 | 0.522 |
| nDN | 0.54 | 0.1979 | 1.09 × 10⁴ | 0.842 | 0.941 | 0.534 |
| nADN | 0.33 | 0.7749 | 1.29 × 10⁴ | 0.705 | 0.930 | 0.476 |
| nAM | 0.99 | 0.0067 | 5.40 × 10² | 0.997 | 0.995 | 0.870 |
| rP | 0.10 | 0.1110 | 6.79 × 10⁻² | 0.721 | 0.879 | 0.521 |
| rEA | 0.10 | 0.0983 | 5.65 × 10⁻² | 0.748 | 0.915 | 0.547 |
| tdYG1 | 0.25 | 0.0629 | 2.23 × 10⁴ | 0.998 | 0.928 | 0.576 |
| tdYG2 | 0.25 | 0.0630 | 2.25 × 10⁴ | 0.996 | 0.934 | 0.573 |
| tdOA1 | 0.19 | 0.0025 | 1.99 × 10⁴ | 0.998 | 0.911 | 0.540 |
| tOAbot1 | 0.19 | 0.0052 | 1.99 × 10⁴ | 0.996 | 0.918 | 0.544 |
| tdOA2 | 0.13 | −0.0257 | 1.24 × 10⁴ | 0.998 | 0.883 | 0.511 |
| tOAbot2 | 0.13 | −0.0261 | 1.24 × 10⁴ | 0.995 | 0.881 | 0.512 |
| tdG2BE | 0.16 | −0.0016 | 1.98 × 10⁴ | 0.999 | 0.913 | 0.523 |
| tdEA | 0.08 | −0.0167 | 9.09 × 10³ | 0.989 | 0.898 | 0.495 |
| taD2A | 0.04 | 0.0116 | 7.35 × 10³ | 0.993 | 0.905 | 0.526 |
| paD2A | 0.02 | 0.0010 | 2.88 × 10⁻² | 1.000 | 0.900 | 0.500 |
| taBEE | 0.03 | 0.1286 | 1.04 × 10⁴ | 0.914 | 0.904 | 0.486 |
| paBEE | 0.02 | 0.0439 | 1.31 × 10⁻¹ | 1.000 | 0.893 | 0.497 |
| taD1P | 0.11 | −0.0070 | 1.72 × 10⁴ | 0.973 | 0.897 | 0.499 |
| paD1P | 0.02 | −0.0002 | 2.85 × 10⁻² | 1.000 | 0.897 | 0.508 |
| taARP | 0.15 | −0.0002 | 1.85 × 10⁴ | 0.988 | 0.916 | 0.517 |
| paARP | 0.03 | −0.0014 | 2.85 × 10⁻² | 1.000 | 0.906 | 0.509 |
| taNEA | 0.10 | −0.0204 | 1.06 × 10⁴ | 0.992 | 0.893 | 0.516 |
| paNEA | 0.02 | 0.0000 | 2.81 × 10⁻² | 1.000 | 0.924 | 0.516 |
| taNG2 | 0.15 | −0.0223 | 1.36 × 10⁴ | 0.998 | 0.909 | 0.528 |
| paNG2 | 0.02 | −0.0003 | 2.89 × 10⁻² | 1.000 | 0.909 | 0.477 |
| mYG1 | 0.15 | 1.2696 | 2.69 × 10⁻⁴ | 0.709 | 0.927 | 0.521 |
| mG1Y | 0.03 | 1.8171 | 2.86 × 10⁻⁴ | 0.742 | 0.907 | 0.516 |
| mG1G2 | 0.05 | 2.0667 | 2.85 × 10⁻⁴ | 0.737 | 0.895 | 0.519 |
| mG2G1 | 0.05 | 2.9954 | 2.89 × 10⁻⁴ | 0.745 | 0.885 | 0.509 |
| mG2E | 0.03 | 3.0547 | 3.01 × 10⁻⁴ | 0.692 | 0.886 | 0.460 |
| mEG2 | 0.19 | 1.5013 | 2.67 × 10⁻⁴ | 0.722 | 0.908 | 0.503 |
| mEA | 0.12 | 1.4834 | 2.68 × 10⁻⁴ | 0.744 | 0.902 | 0.543 |
| mAE | 0.11 | 1.9813 | 2.74 × 10⁻⁴ | 0.731 | 0.908 | 0.523 |
| mAP | 0.27 | 1.4789 | 2.40 × 10⁻⁴ | 0.766 | 0.910 | 0.548 |
| mPA | 0.37 | 2.2687 | 2.35 × 10⁻⁴ | 0.773 | 0.908 | 0.546 |
| m1G2EA | 0.02 | 2.1201 | 2.90 × 10⁻⁴ | 0.701 | 0.911 | 0.489 |
| m1EAG2 | 0.04 | 2.7879 | 2.92 × 10⁻⁴ | 0.708 | 0.888 | 0.496 |
| m1EAP | 0.06 | 2.5111 | 2.82 × 10⁻⁴ | 0.728 | 0.901 | 0.528 |
| m1PEA | 0.05 | 3.2113 | 2.91 × 10⁻⁴ | 0.694 | 0.911 | 0.477 |
Publisher’s Note: MDPI stays neutral with regard to jurisdictional claims in published maps and institutional affiliations. |
© 2020 by the authors. Licensee MDPI, Basel, Switzerland. This article is an open access article distributed under the terms and conditions of the Creative Commons Attribution (CC BY) license (http://creativecommons.org/licenses/by/4.0/).
Share and Cite
Vizzari, M.T.; Benazzo, A.; Barbujani, G.; Ghirotto, S. A Revised Model of Anatomically Modern Human Expansions Out of Africa through a Machine Learning Approximate Bayesian Computation Approach. Genes 2020, 11, 1510. https://0-doi-org.brum.beds.ac.uk/10.3390/genes11121510
Vizzari MT, Benazzo A, Barbujani G, Ghirotto S. A Revised Model of Anatomically Modern Human Expansions Out of Africa through a Machine Learning Approximate Bayesian Computation Approach. Genes. 2020; 11(12):1510. https://0-doi-org.brum.beds.ac.uk/10.3390/genes11121510
Chicago/Turabian StyleVizzari, Maria Teresa, Andrea Benazzo, Guido Barbujani, and Silvia Ghirotto. 2020. "A Revised Model of Anatomically Modern Human Expansions Out of Africa through a Machine Learning Approximate Bayesian Computation Approach" Genes 11, no. 12: 1510. https://0-doi-org.brum.beds.ac.uk/10.3390/genes11121510