
Upregulation of 15 Antisense Long Non-Coding RNAs in Osteosarcoma


1
School of Biomedical Sciences, The University of Western Australia, Perth, WA 6009, Australia
2
Perron Institute for Neurological and Translational Science, QEII Medical Centre, Nedlands, WA 6009, Australia
3
Department of Oncology, College of Medicine and Pharmacy, Hue University, Hue 53000, Vietnam
4
Department of Traumatology and Orthopaedics, University of Tartu, Tartu University Hospital, 50411 Tartu, Estonia
5
Centre for Molecular Medicine and Innovative Therapeutics, Murdoch University, Murdoch, WA 6150, Australia
*
Author to whom correspondence should be addressed.
Genes 2021, 12(8), 1132; https://0-doi-org.brum.beds.ac.uk/10.3390/genes12081132
Submission received: 6 July 2021
/
Revised: 20 July 2021
/
Accepted: 22 July 2021
/
Published: 26 July 2021
(This article belongs to the Special Issue Alternative Splicing in Human Physiology and Disease)
Abstract
:The human genome encodes thousands of natural antisense long noncoding RNAs (lncRNAs); they play the essential role in regulation of gene expression at multiple levels, including replication, transcription and translation. Dysregulation of antisense lncRNAs plays indispensable roles in numerous biological progress, such as tumour progression, metastasis and resistance to therapeutic agents. To date, there have been several studies analysing antisense lncRNAs expression profiles in cancer, but not enough to highlight the complexity of the disease. In this study, we investigated the expression patterns of antisense lncRNAs from osteosarcoma and healthy bone samples (24 tumour-16 bone samples) using RNA sequencing. We identified 15 antisense lncRNAs (RUSC1-AS1, TBX2-AS1, PTOV1-AS1, UBE2D3-AS1, ERCC8-AS1, ZMIZ1-AS1, RNF144A-AS1, RDH10-AS1, TRG-AS1, GSN-AS1, HMGA2-AS1, ZNF528-AS1, OTUD6B-AS1, COX10-AS1 and SLC16A1-AS1) that were upregulated in tumour samples compared to bone sample controls. Further, we performed real-time polymerase chain reaction (RT-qPCR) to validate the expressions of the antisense lncRNAs in 8 different osteosarcoma cell lines (SaOS-2, G-292, HOS, U2-OS, 143B, SJSA-1, MG-63, and MNNG/HOS) compared to hFOB (human osteoblast cell line). These differentially expressed IncRNAs can be considered biomarkers and potential therapeutic targets for osteosarcoma.
1. Introduction
Osteosarcoma (OS), also known as osteogenic sarcoma, is the most common primary malignant solid tumour of bone [1]. The peak incidence is in children and adolescents with a smaller second peak in incidence after the age of 65 years associated with Paget’s disease of bone [2]. OS commonly develops in the extremities of long bones such as the distal femur, proximal tibia, proximal humerus, and proximal femur [3]. It is an aggressive-invasion sarcoma type that frequently metastasizes to the lung and other bones in the body [4]. OS usually presents with pain, tenderness and swelling around the affected bone, and diagnosis is achieved by a combination of imaging and histology with the characteristic appearance of malignant cells forming osteoid [5]. Cytotoxic chemotherapy was introduced by Rosen in the 1970s and improved the prognosis from 20% to a 70% five-year survival rate with no further significant improvements in outcome since then [6]. Current treatments of OS include neo-adjuvant chemotherapy with drugs such as doxorubicin, methotrexate, and cisplatin with the aim of reducing tumour size as well as eradicating micro-metastases. Ablative surgery is then followed by further chemotherapy determined by the cell death rate observed in the surgical specimens [7,8]. Current OS therapeutic agents are limited to cytotoxic drugs interfering with transcription and DNA replication [6]. This is a reflection of our knowledge of the pathways involved in OS initiation and progression, which are insufficient to understand the underlying molecular mechanisms of the disease.
The sense strand of DNA provides the template for production of messenger RNA (mRNA) to be translated into proteins [9], but the Human Genome Project highlighted that only 1.5% of the human genome contains protein-coding genes. In addition, the Encyclopedia of DNA elements (ENCODE) and the Functional Annotation of the Mammalian Genome (FANTOM) have suggested that the majority of the genome is transcribed and produces a various amount of non-coding RNA species (ncRNAs) [10,11]. The ncRNAs, fittingly, are RNA molecules that do not encode proteins. They are generally classified based on their length, with an artificial cut off of 200 base pair (bp), small ncRNAs (sncRNAs) less than 200 bps, whereas long ncRNAs (lncRNAs) greater than 200 bps [12]. The lncRNAs frequently regulate epigenetic silencing through chromatin remodeling [13]. They also play critical role in regulating splicing, recruiting transcription factors, and controlling mRNA stability [14]. The natural antisense RNAs belong to the lncRNAs family and are transcribed from the opposite strand of a protein-coding gene [12]. They can stimulate, reduce or completely silence gene expression of the sense transcripts at multiple levels, play a functional role in physiological, and pathological processes, and may eventually lead to diseases [10,11,12,13,14,15].
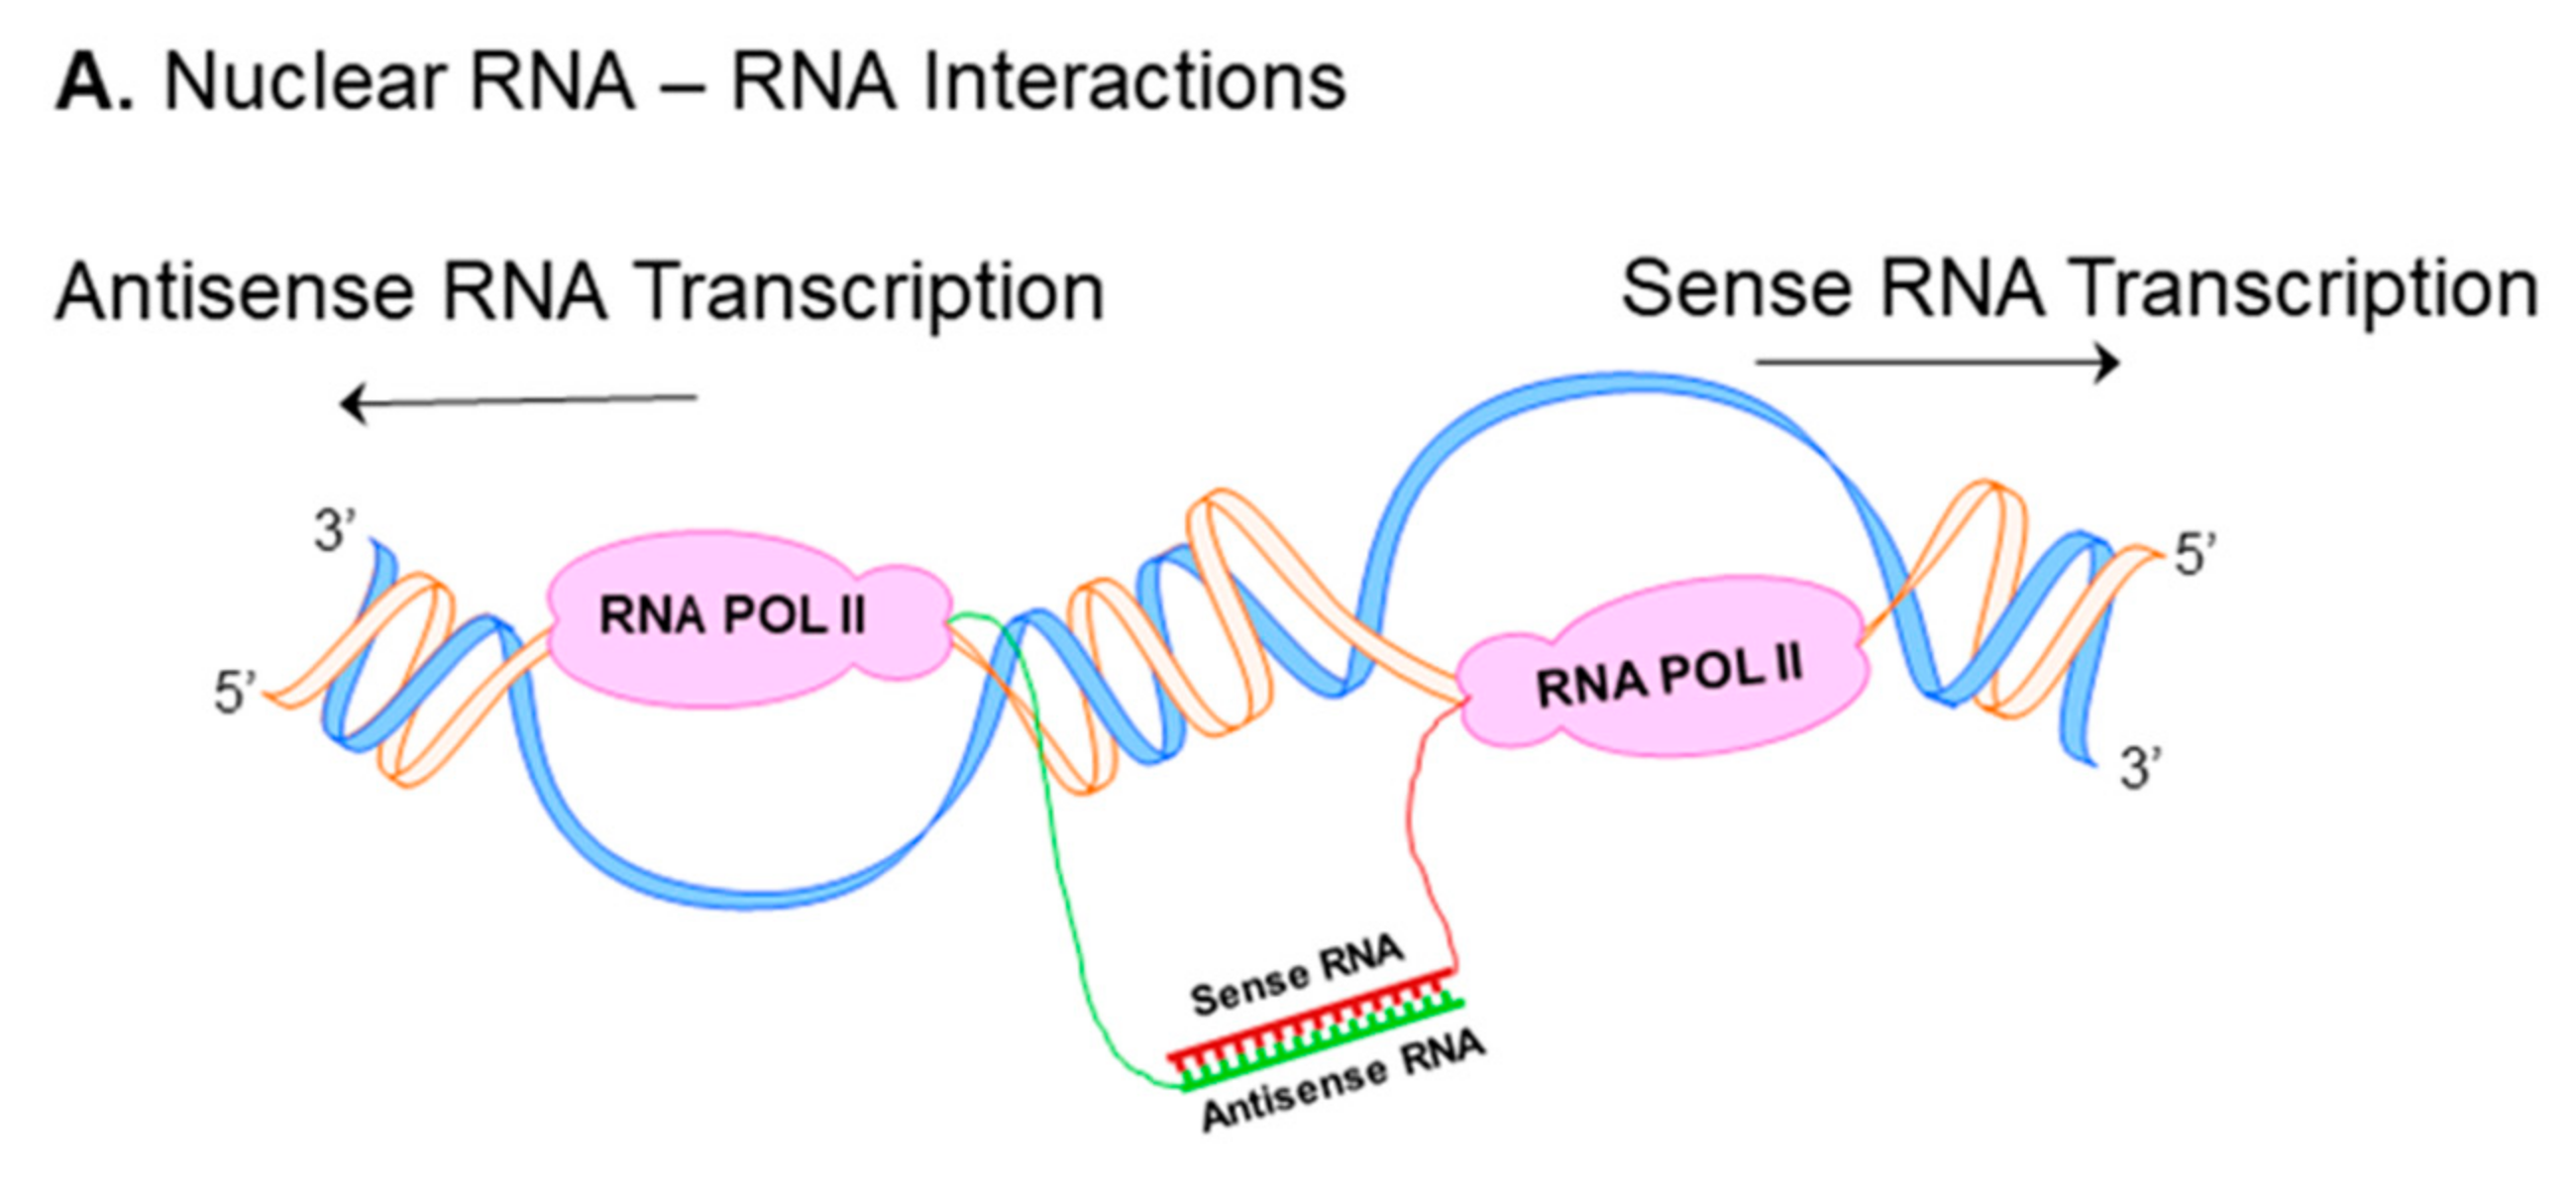
Nuclear RNA duplex formation may occur locally immediately upon transcription, consequently resulting in inhibition of sense RNA processing (Figure 1A) [16]. The processing of RNA includes capping, polyadenylation, nuclear localization and mRNA transport, all these events may be affected by nuclear sense–antisense RNA duplex formation. Natural antisense transcripts (NATs) can cover donor (5′) and acceptor (3′) splice sites in the sense precursor mRNA transcript to modify alternative splicing patterns and develop mature RNA in different isoforms (Figure 1B) [16,17]. Another possible consequence of nuclear RNA duplex formation is RNA editing through the adenosine deaminases that act on the RNA (ADAR) enzyme responsible for binding to double stranded RNA and converting adenosine (A) to inosine (I) by hydrolytic deamination (an adenosine loses an amine group) (Figure 1C) [18,19].
NATs can be subdivided into two categories: cis-NATs and trans-NATs. cis-NATs are antisense RNAs transcribed from the same genomic locus. Consequently, in the section of the overlap, sense and antisense transcripts share complete complementarities such as head-to-head overlap in cis (Figure 1Da), embedded overlap in cis (Figure 1Db), and tail-to-tail overlap in cis (Figure 1Dc) [20]. On the other hand, trans-NATs are antisense RNAs transcribed from a different genomic region of their paired sense transcript, displaying partially complementarities such as overlap in trans (Figure 1Dd) [20,21,22].
Considering the growing evidence of the antisense lncRNAs in cellular process and their involvement in various disease types including cancer we investigated their expression pattern in OS using RNA sequencing (RNA-seq).
2. Materials and Methods
2.1. Sample Description
The study has been approved by the Ethics Review Committee of the University of Western Australia and Sir Charles Gairdner Hospital (2019/RA/4/20/5211). The patient informed consent forms were signed and dated by the participants and patient representatives before the limb sparing or amputation surgery.
Twenty-one Australian patients underwent the surgery to remove malignant tissue and the diagnosis of OS was confirmed by a specialist sarcoma pathologist. Cancerous and normal bone formalin-fixed paraffin-embedded (FFPE) tissue samples were collected from PathWest (QEII Medical, Nedlands, WA, Australia).
2.2. Total RNA Extraction and Sequencing
Total RNA was extracted from recently cut 5 sections of ≤ 20 μm thick FFPE samples using the FFPE RNA purification kit (Norgen Biotek, Thorold, ON, Canada), following to the manufacturer’s protocol. Extracted RNA was completely dissolved in RNase-free water and stored at –80 °C. The quality of total RNA was measured using Agilent 2100 Bioanalyzer and the RNA 6000 Nano Kit (Agilent Technologies Inc., Santa Clara, CA, USA).
The RNA samples were processed using the Takara SMARTer V2 Total RNA Mammalian Pico Input protocol using 2 ng of Total RNA input as per manufacturer’s instructions (Takara Bio Inc., Mountain View, CA, USA). The sequencing was completed using an Illumina NovaSeq 6000 and an S4-300 cycle lane (150PE) with v1.5 sequencing chemistry [23]. The FastQC (version 0.11.9) was used to determine the quality score distribution of the sequencing reads. The low-quality reads, Phred score ≤ 20, were trimmed out using Trimmomatic (version 0.39) [24]. Trimmed reads were mapped to the human genome hg38 (GRCH38) reference using STAR (version 2.7.7a) [25].
2.3. Data and Statistical Analyses
Differential gene expression and statistical data analyses were performed through DESeq2 package for R [26]. DESeq2 is a Bioconductor package specifically designed to detect differential expressed genes between individual samples. Differential gene expression levels between tumour and normal samples were obtained by the package through investigating the logarithmic-2-fold changes of the genes (logFC, the cut-off value of 0.5). The DESeq2 package also provides the Benjamini–Hochberg method to adjust p-value (padj). The significant level was set at padj < 0.05.
2.4. FANTOM-CAT Analysis
FANTOM- CAGE-Associated Transcriptome (FANTOM-CAT) is an efficient software to analyze lncRNAs structure and function (http://fantom.gsc.riken.jp/cat/ (accessed on 7 April 2021)). Zenbu tool was used to determine the type of sense–antisense overlap of the genes through FANTOM-CAT [27].
2.5. Real Time-Quantitative Polymerase Chain Reaction (RT-qPCR)
Total RNA was isolated from hFOB, SaOS-2, G-292, SJSA-1, HOS, 143B, U2-OS, MNNG/HOS and MG-63 using TRIzol reagent (Invitrogen Corp, Carlsbad, CA, USA). cDNA samples were generated using the Omniscript Reverse Transcriptase kit (Qiagen, Hilden, Germany) and Oligo dT15 primers (Promega, Madison, WI, USA) following the manufacturer’s protocols. RT-qPCR was conducted with SYBR Green master mix (Waltham, MA, USA). Primer sequences used for RT-qPCR were stated in Table 1.
Quantitative PCR was conducted using a Viia 7 Real-Time PCR machine (Applied Biosystems, Foster City, CA, USA). The thermal cycler protocol used for the RT-qPCR as following; 50 °C for 2 min, 95 °C for 10 min, followed by 40 cycles of 95 °C for 15 s, and 60 °C for 60 s. GAPDH was used as a housekeeping gene to normalize gene expressions. Relative gene expressions were calculated using the 2−ΔΔCT method. Data analysis was performed using GraphPad Prism software, version 8 (GraphPad software, San Diego, CA, USA). The data are presented as the mean ± standard error (SE) of values from 3 independent experiments. Statistical significance was determined using one-way ANOVA, with p < 0.05 considered statistically significant.
3. Results
3.1. Participants’ Characteristics
The samples were collected after surgical removal of the affected bone from 21 Australian OS patients. Only 16 samples contained paired tumour and healthy bone biopsies. Total samples number were noted as 24 tumour and 16 healthy bone biopsies (Table 2).
3.2. Differential Gene Expression Analysis between Tumour and Normal Samples
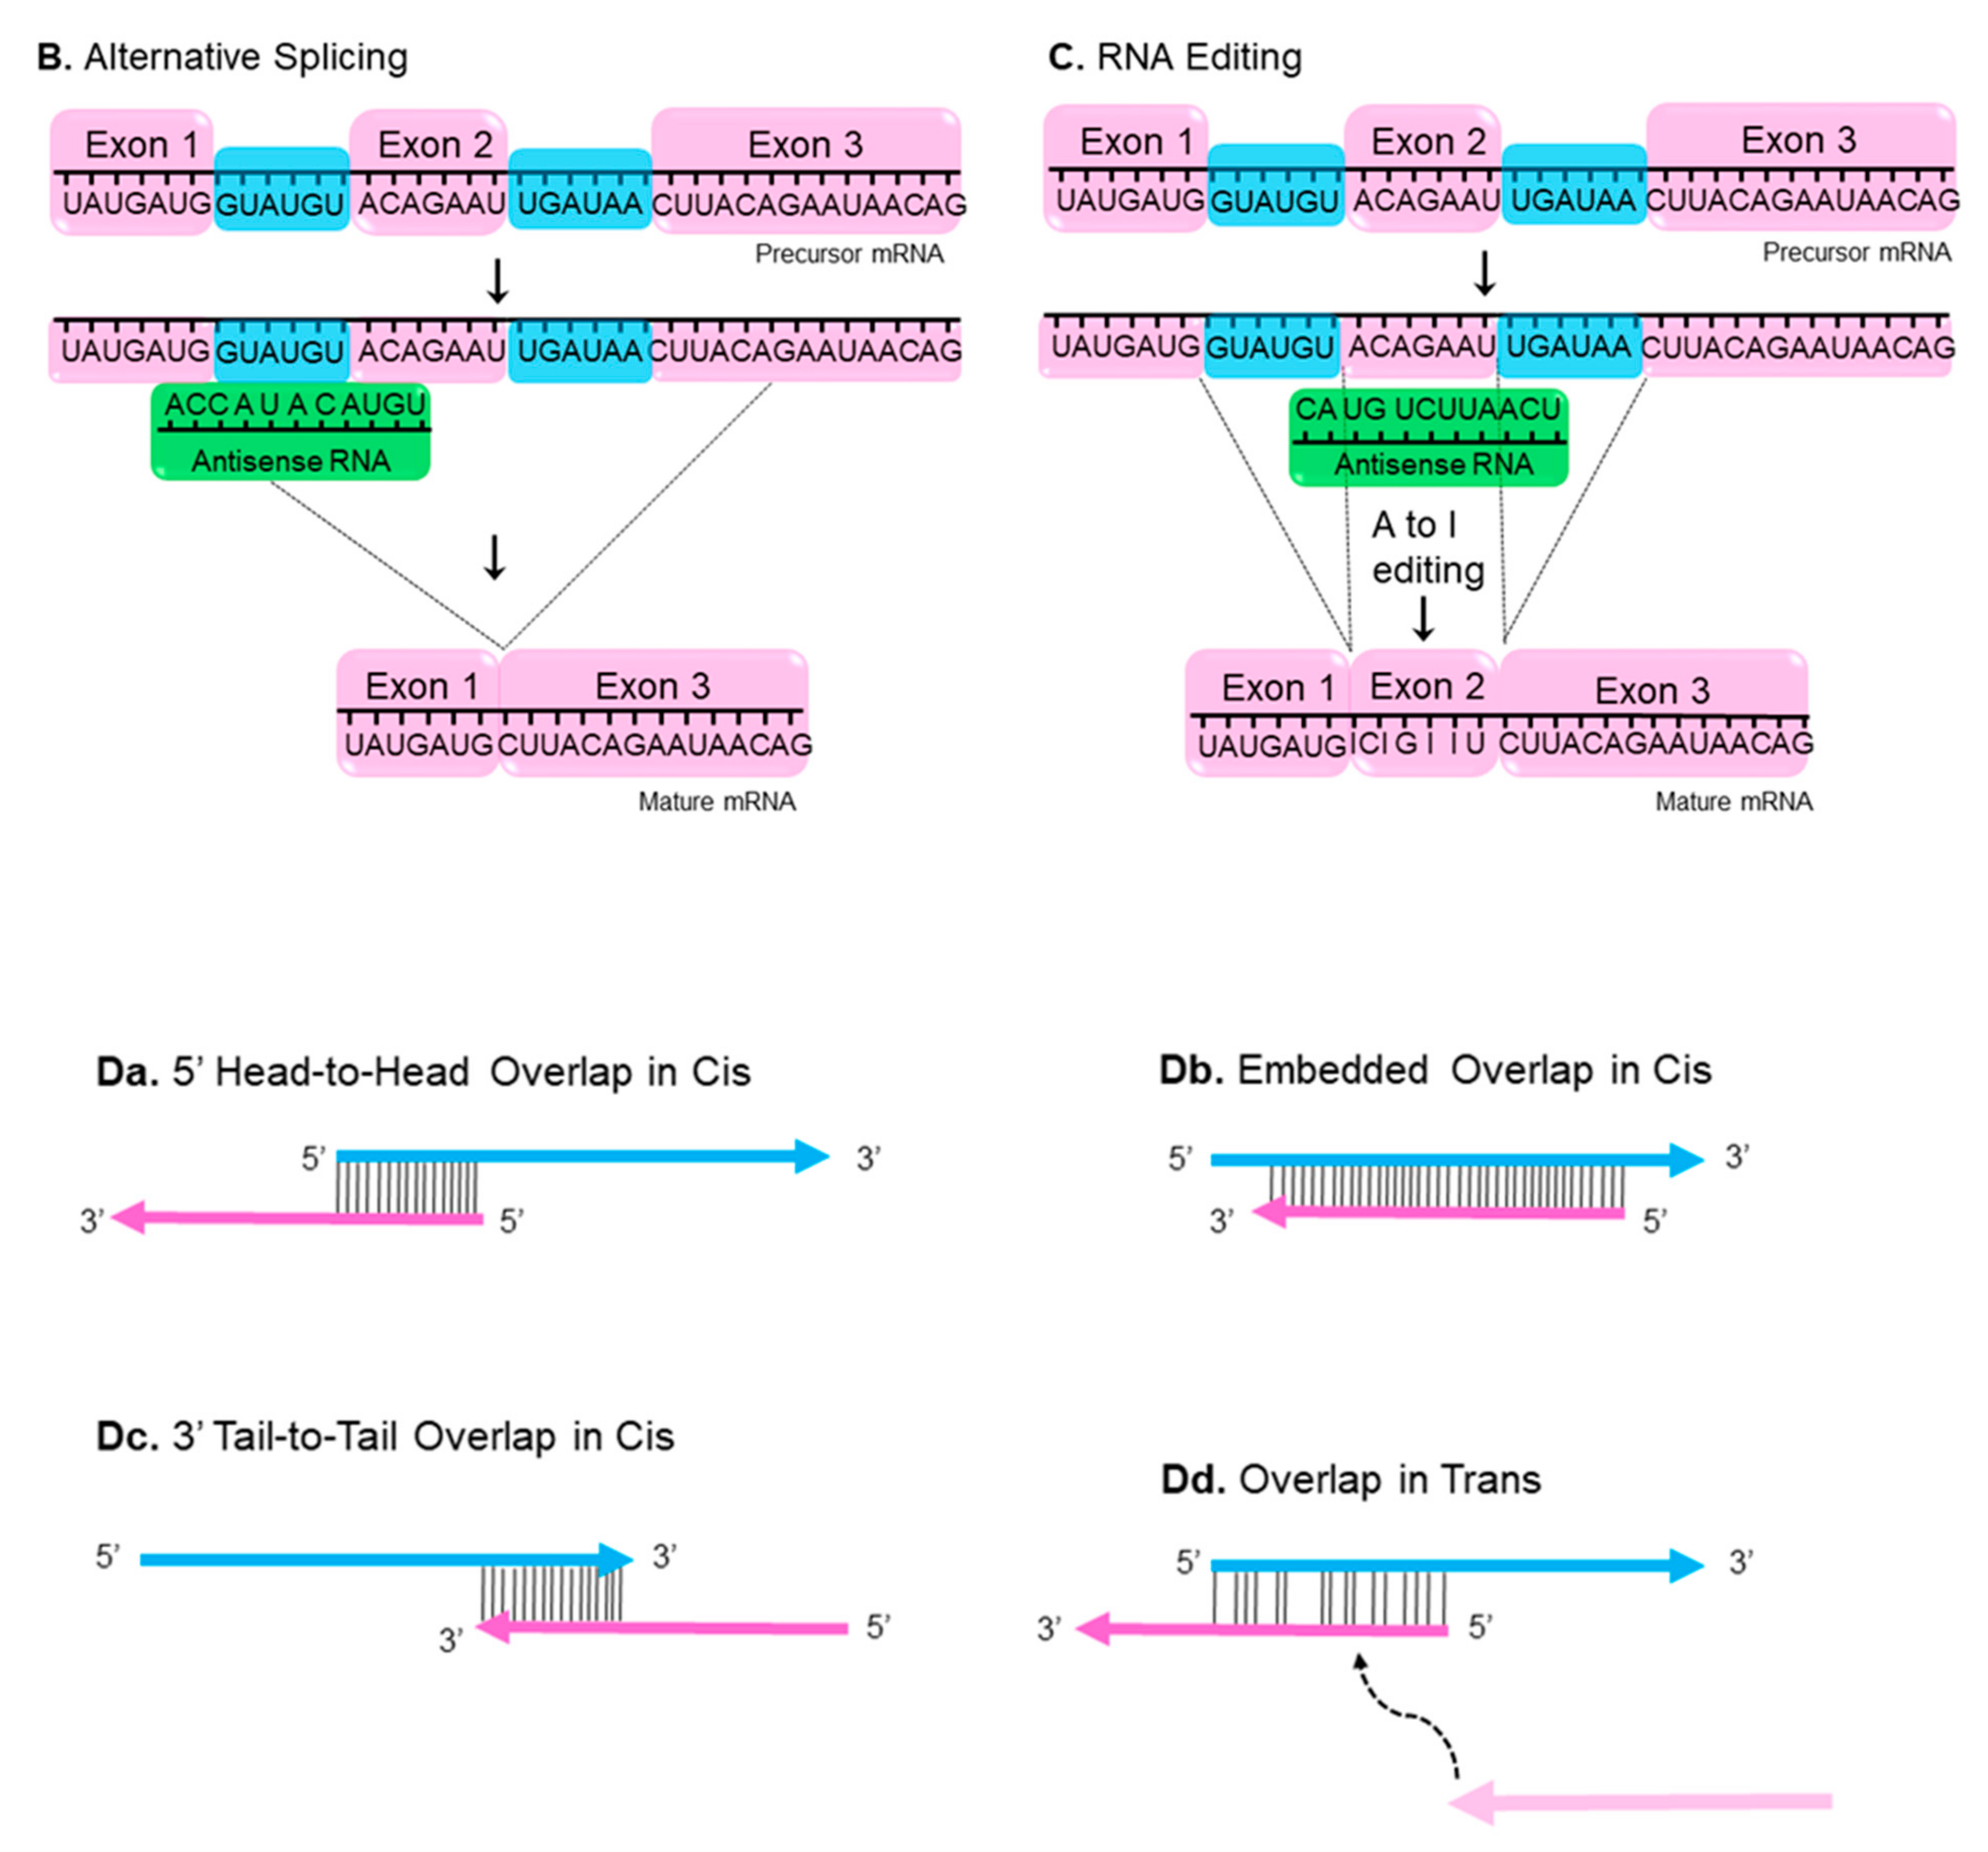
Total RNA was collected from 24 tumour and 16 normal FFPE samples. Statistical data and differential gene expression analyses were performed through DESeq2 package for R. The 3D principal component analysis (PCA) plot has been provided insights into the similarities between tumour and normal samples and indicated the quality of the gene expression data (Figure 2).
Differential transcript expression levels between tumour and normal samples were obtained by the package through investigating the padj and logFC values. The genes without padj values (NA) and scientific names (NA) were excluded from the data.
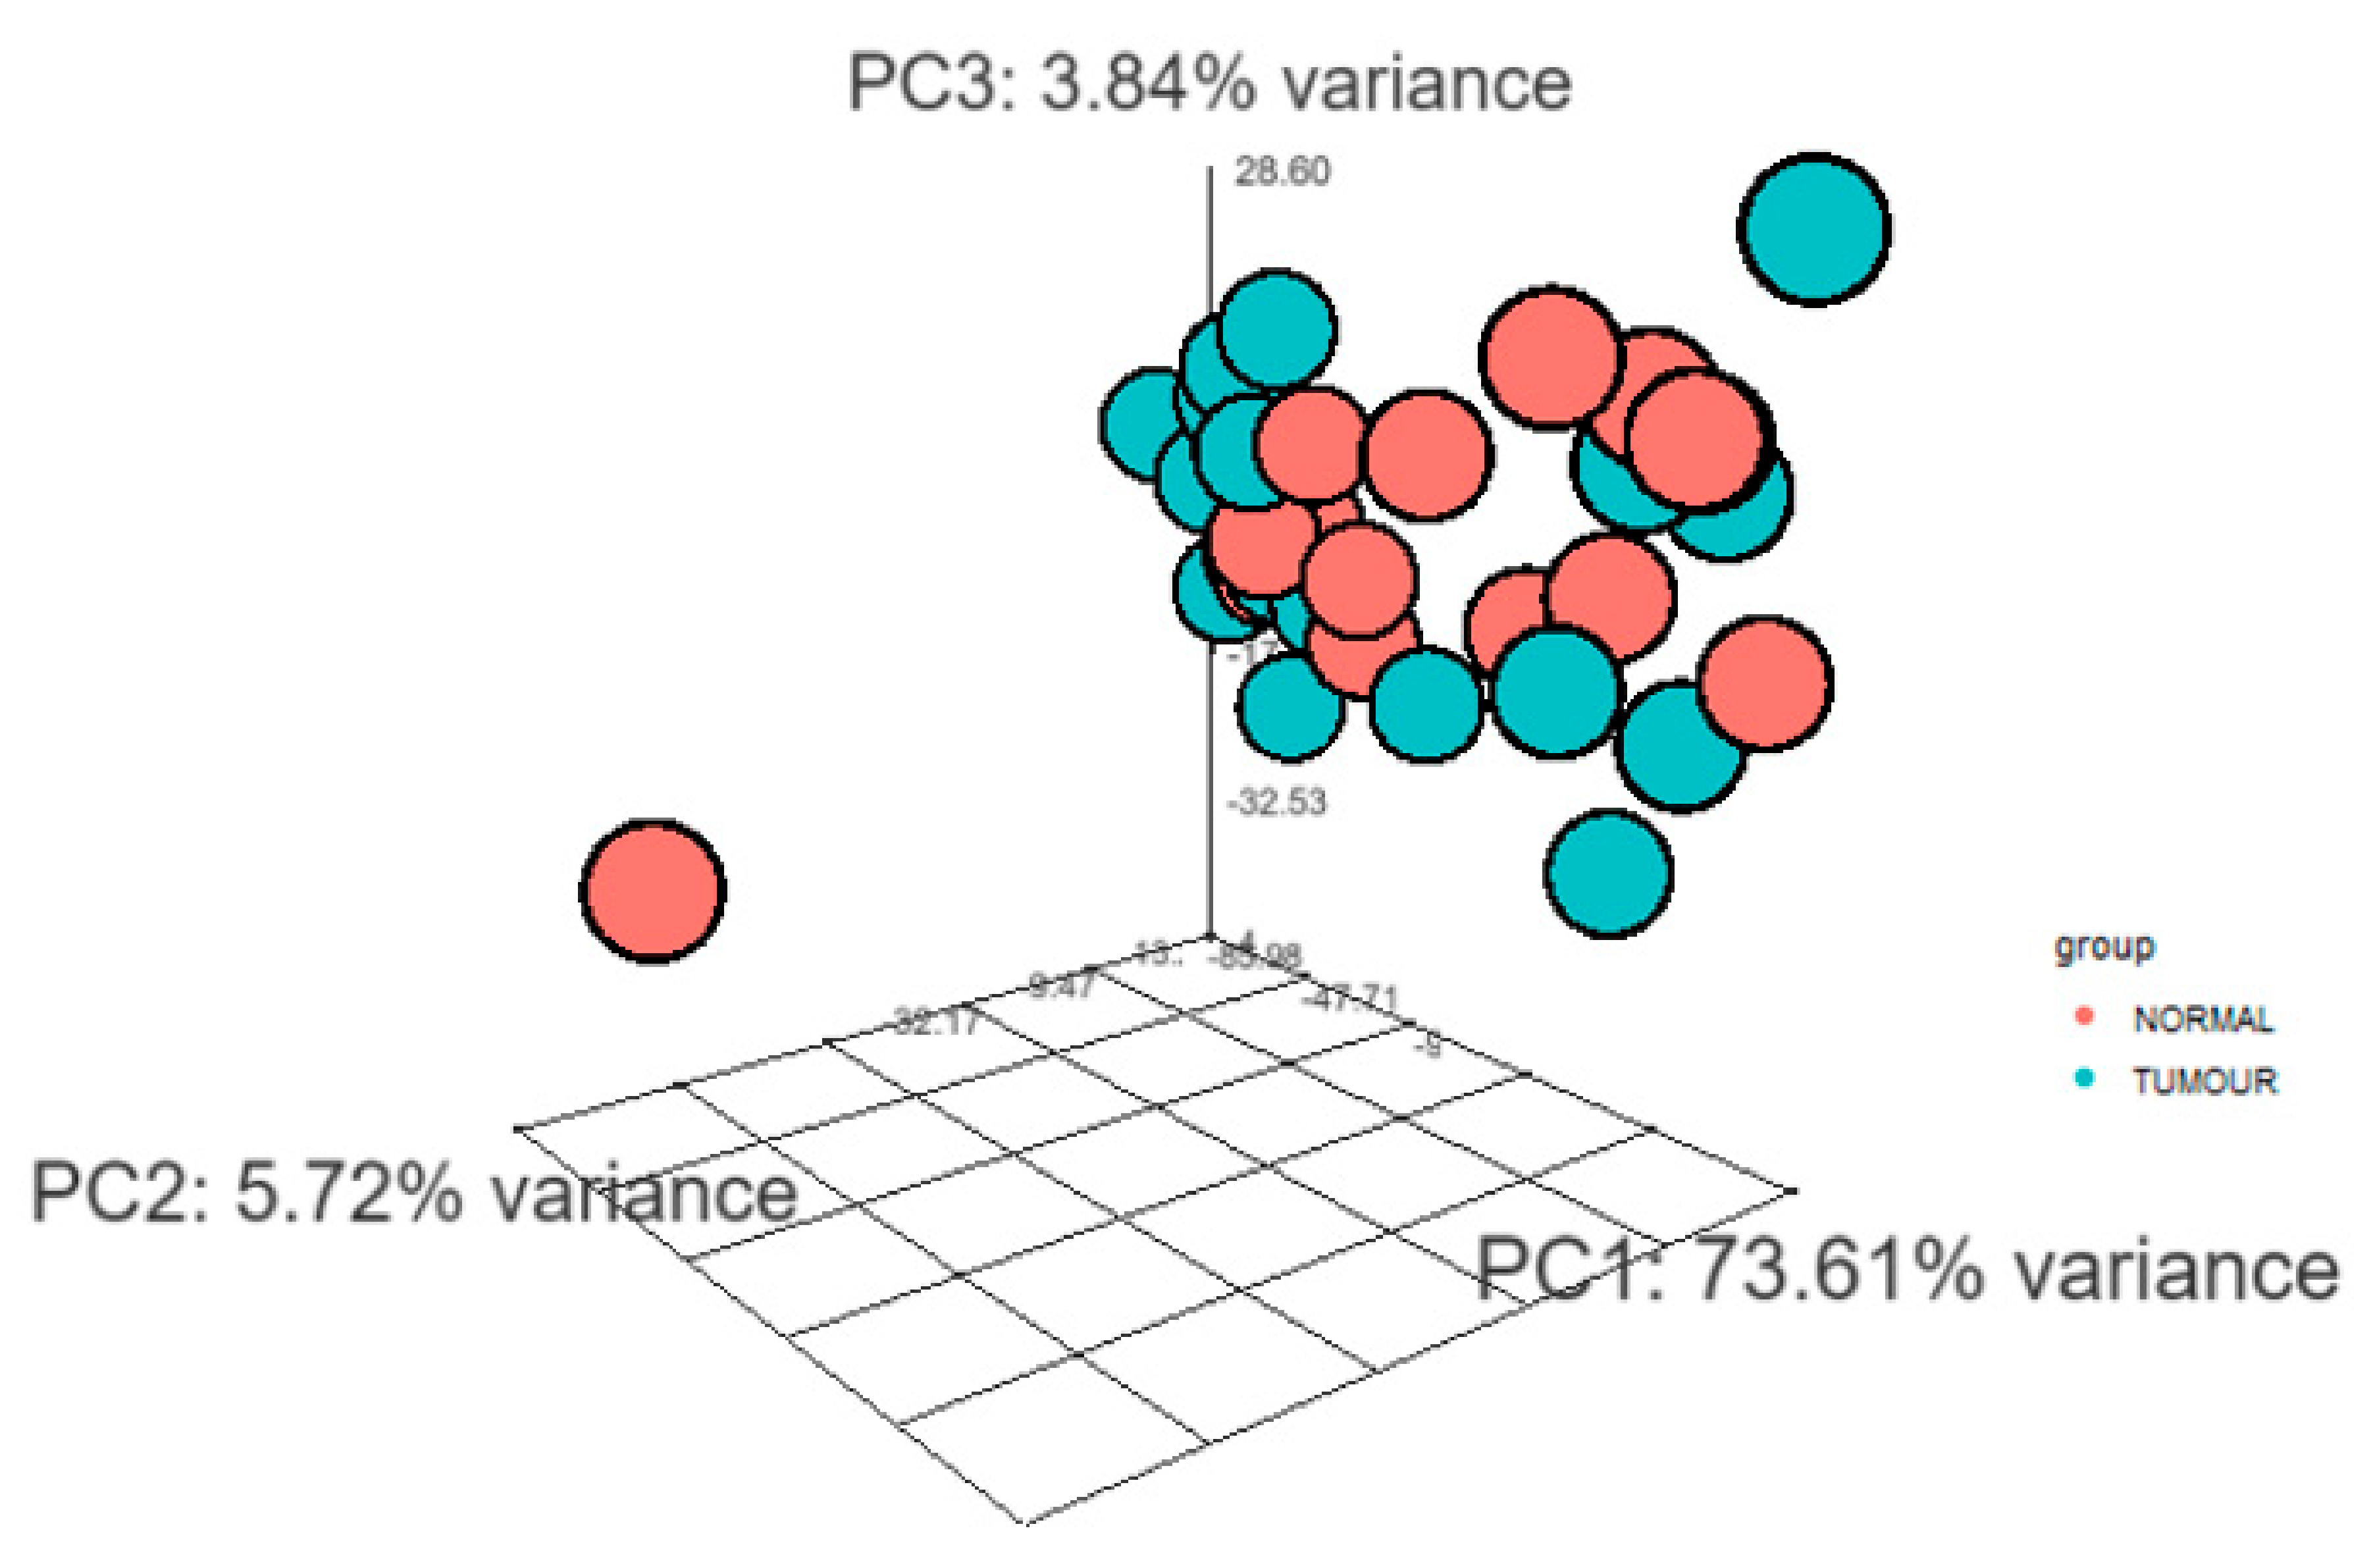
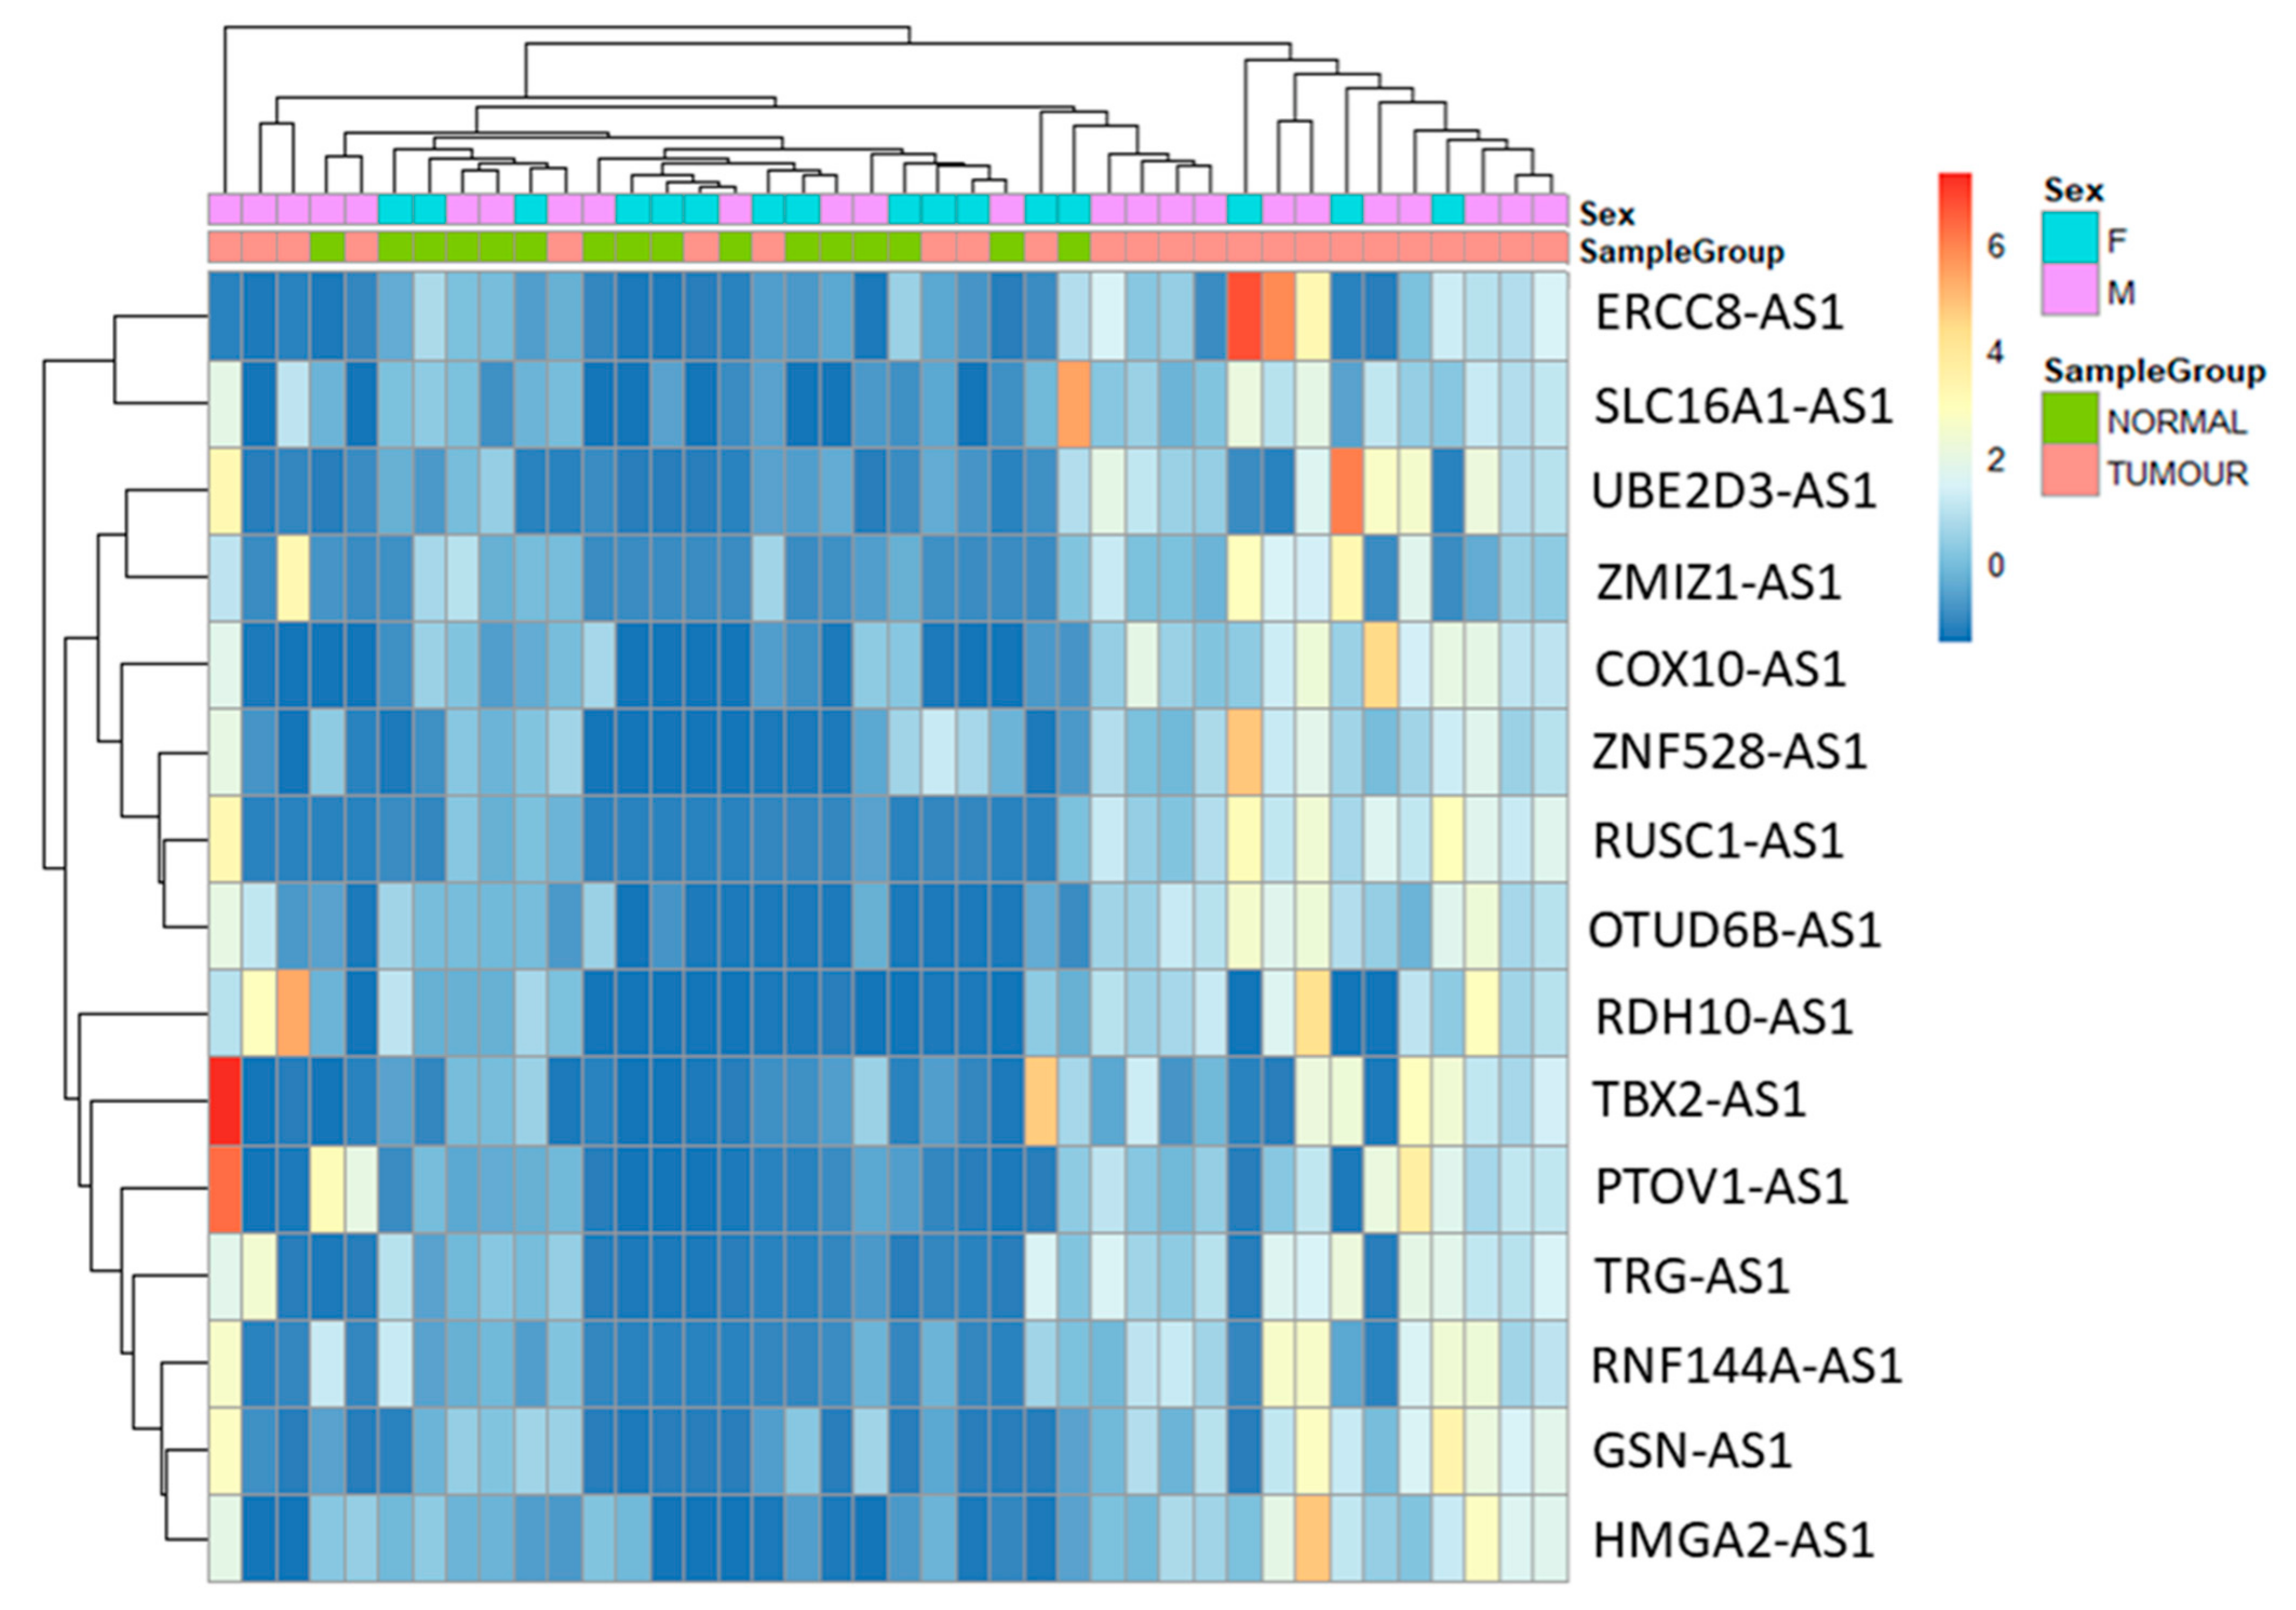
The purpose of the study is to analyse antisense lncRNAs expression pattern between tumour and normal samples. The results showed that 15 antisense lncRNAs (RUN And SH3 Domain Containing 1-Antisense RNA 1 (RUSC1-AS1), T-Box Transcription Factor 2-Antisense RNA 1 (TBX2-AS1), Prostate Tumor-Overexpressed Gene 1 Protein-Antisense RNA 1 (PTOV1-AS1), Ubiquitin Conjugating Enzyme E2 D3-Antisense RNA 1 (UBE2D3-AS1), ERCC excision repair 8-Antisense RNA 1 (ERCC8-AS1), Zinc Finger MIZ-Type Containing 1-Antisense RNA 1 (ZMIZ1-AS1), Ring Finger Protein 144A-Antisense RNA 1 (RNF144A-AS1), Retinol dehydrogenase 10-Antisense RNA 1 (RDH10-AS1), T Cell Receptor γ Locus-Antisense RNA 1 (TRG-AS1), Gelsolin-Antisense RNA 1 (GSN-AS1), High Mobility Group AT-Hook 2-Antisense RNA 1 (HMGA2-AS1), Zinc Finger Protein 528-Antisense RNA 1 (ZNF528-AS1), OTU Deubiquitinase 6B-Antisense RNA 1 (OTUD6B-AS1), Cytochrome C Oxidase-Antisense RNA 1 (COX10-AS1) and Solute Carrier Family 16 Member 1-Antisense RNA 1 (SLC16A1-AS1) were upregulated in tumour samples compared to normal samples (Table 3). The data were visualized using heatmap (Figure 3) and circos plot (Figure 4). Further, the type of overlap of the antisense lncRNA transcripts was determined using FANTOM-CAT analysis and listed in Table 4.
3.3. Validation of Seven Novel Candidate Transcripts Expression Profiles through RT-qPCR
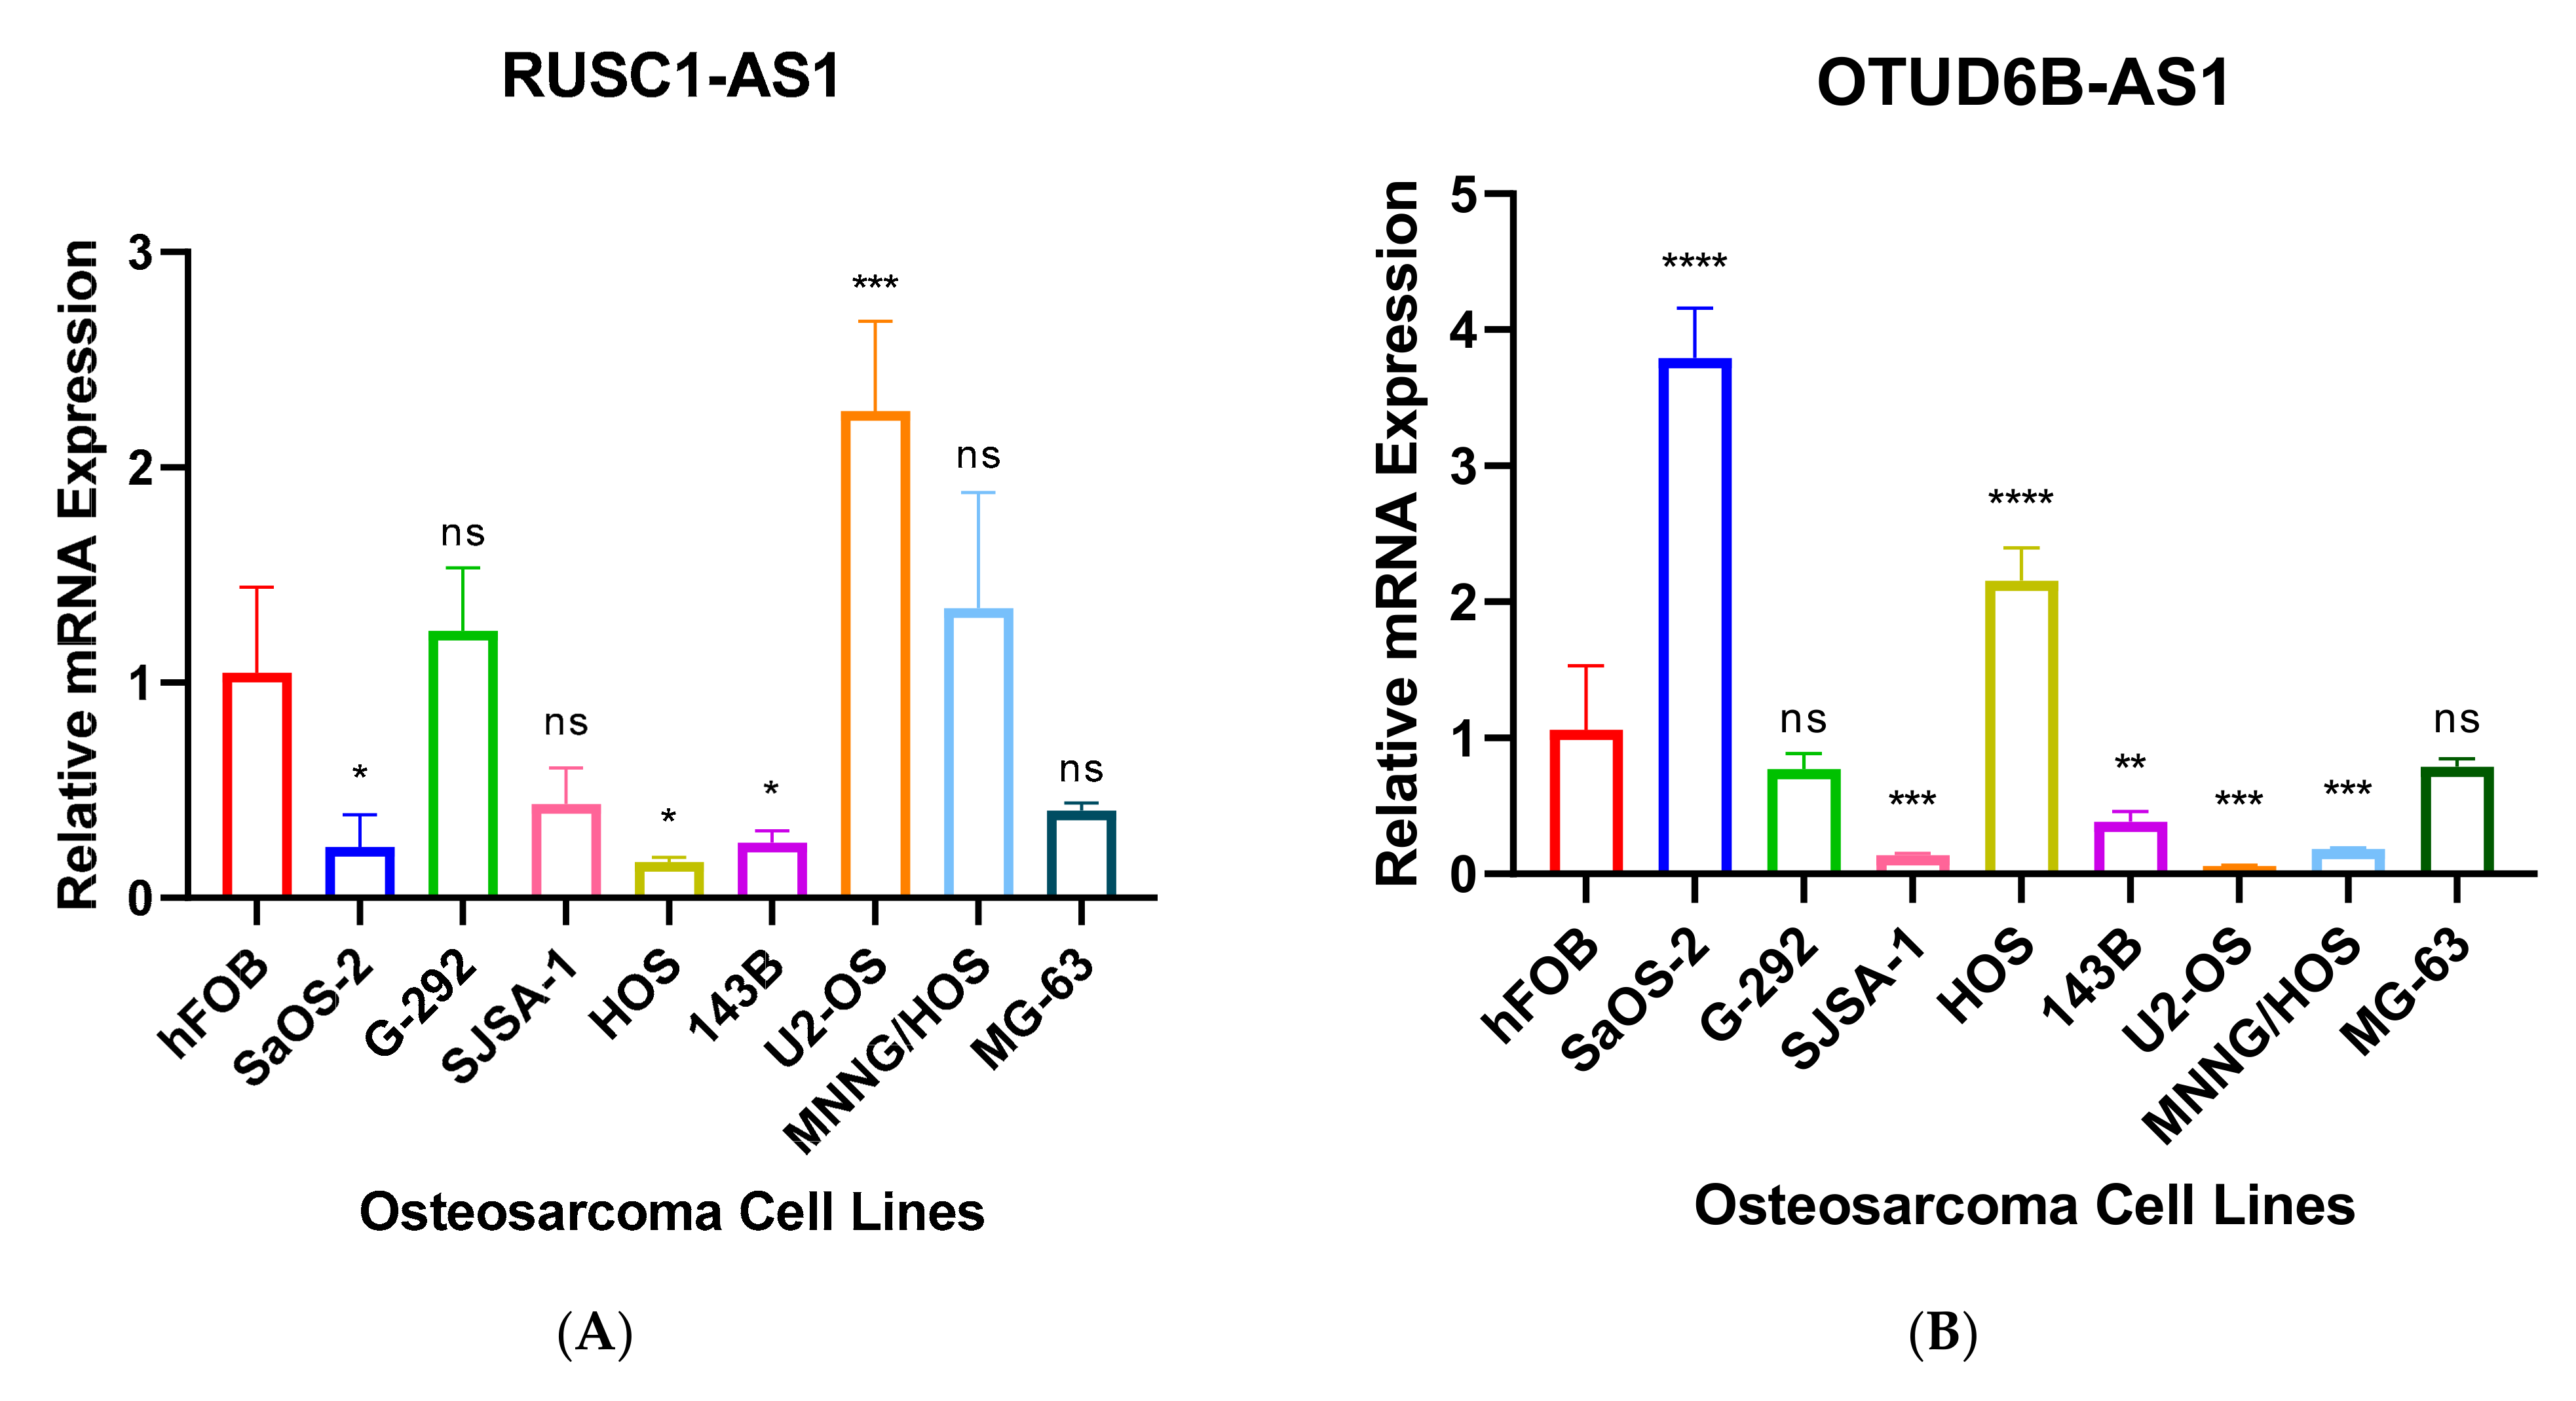
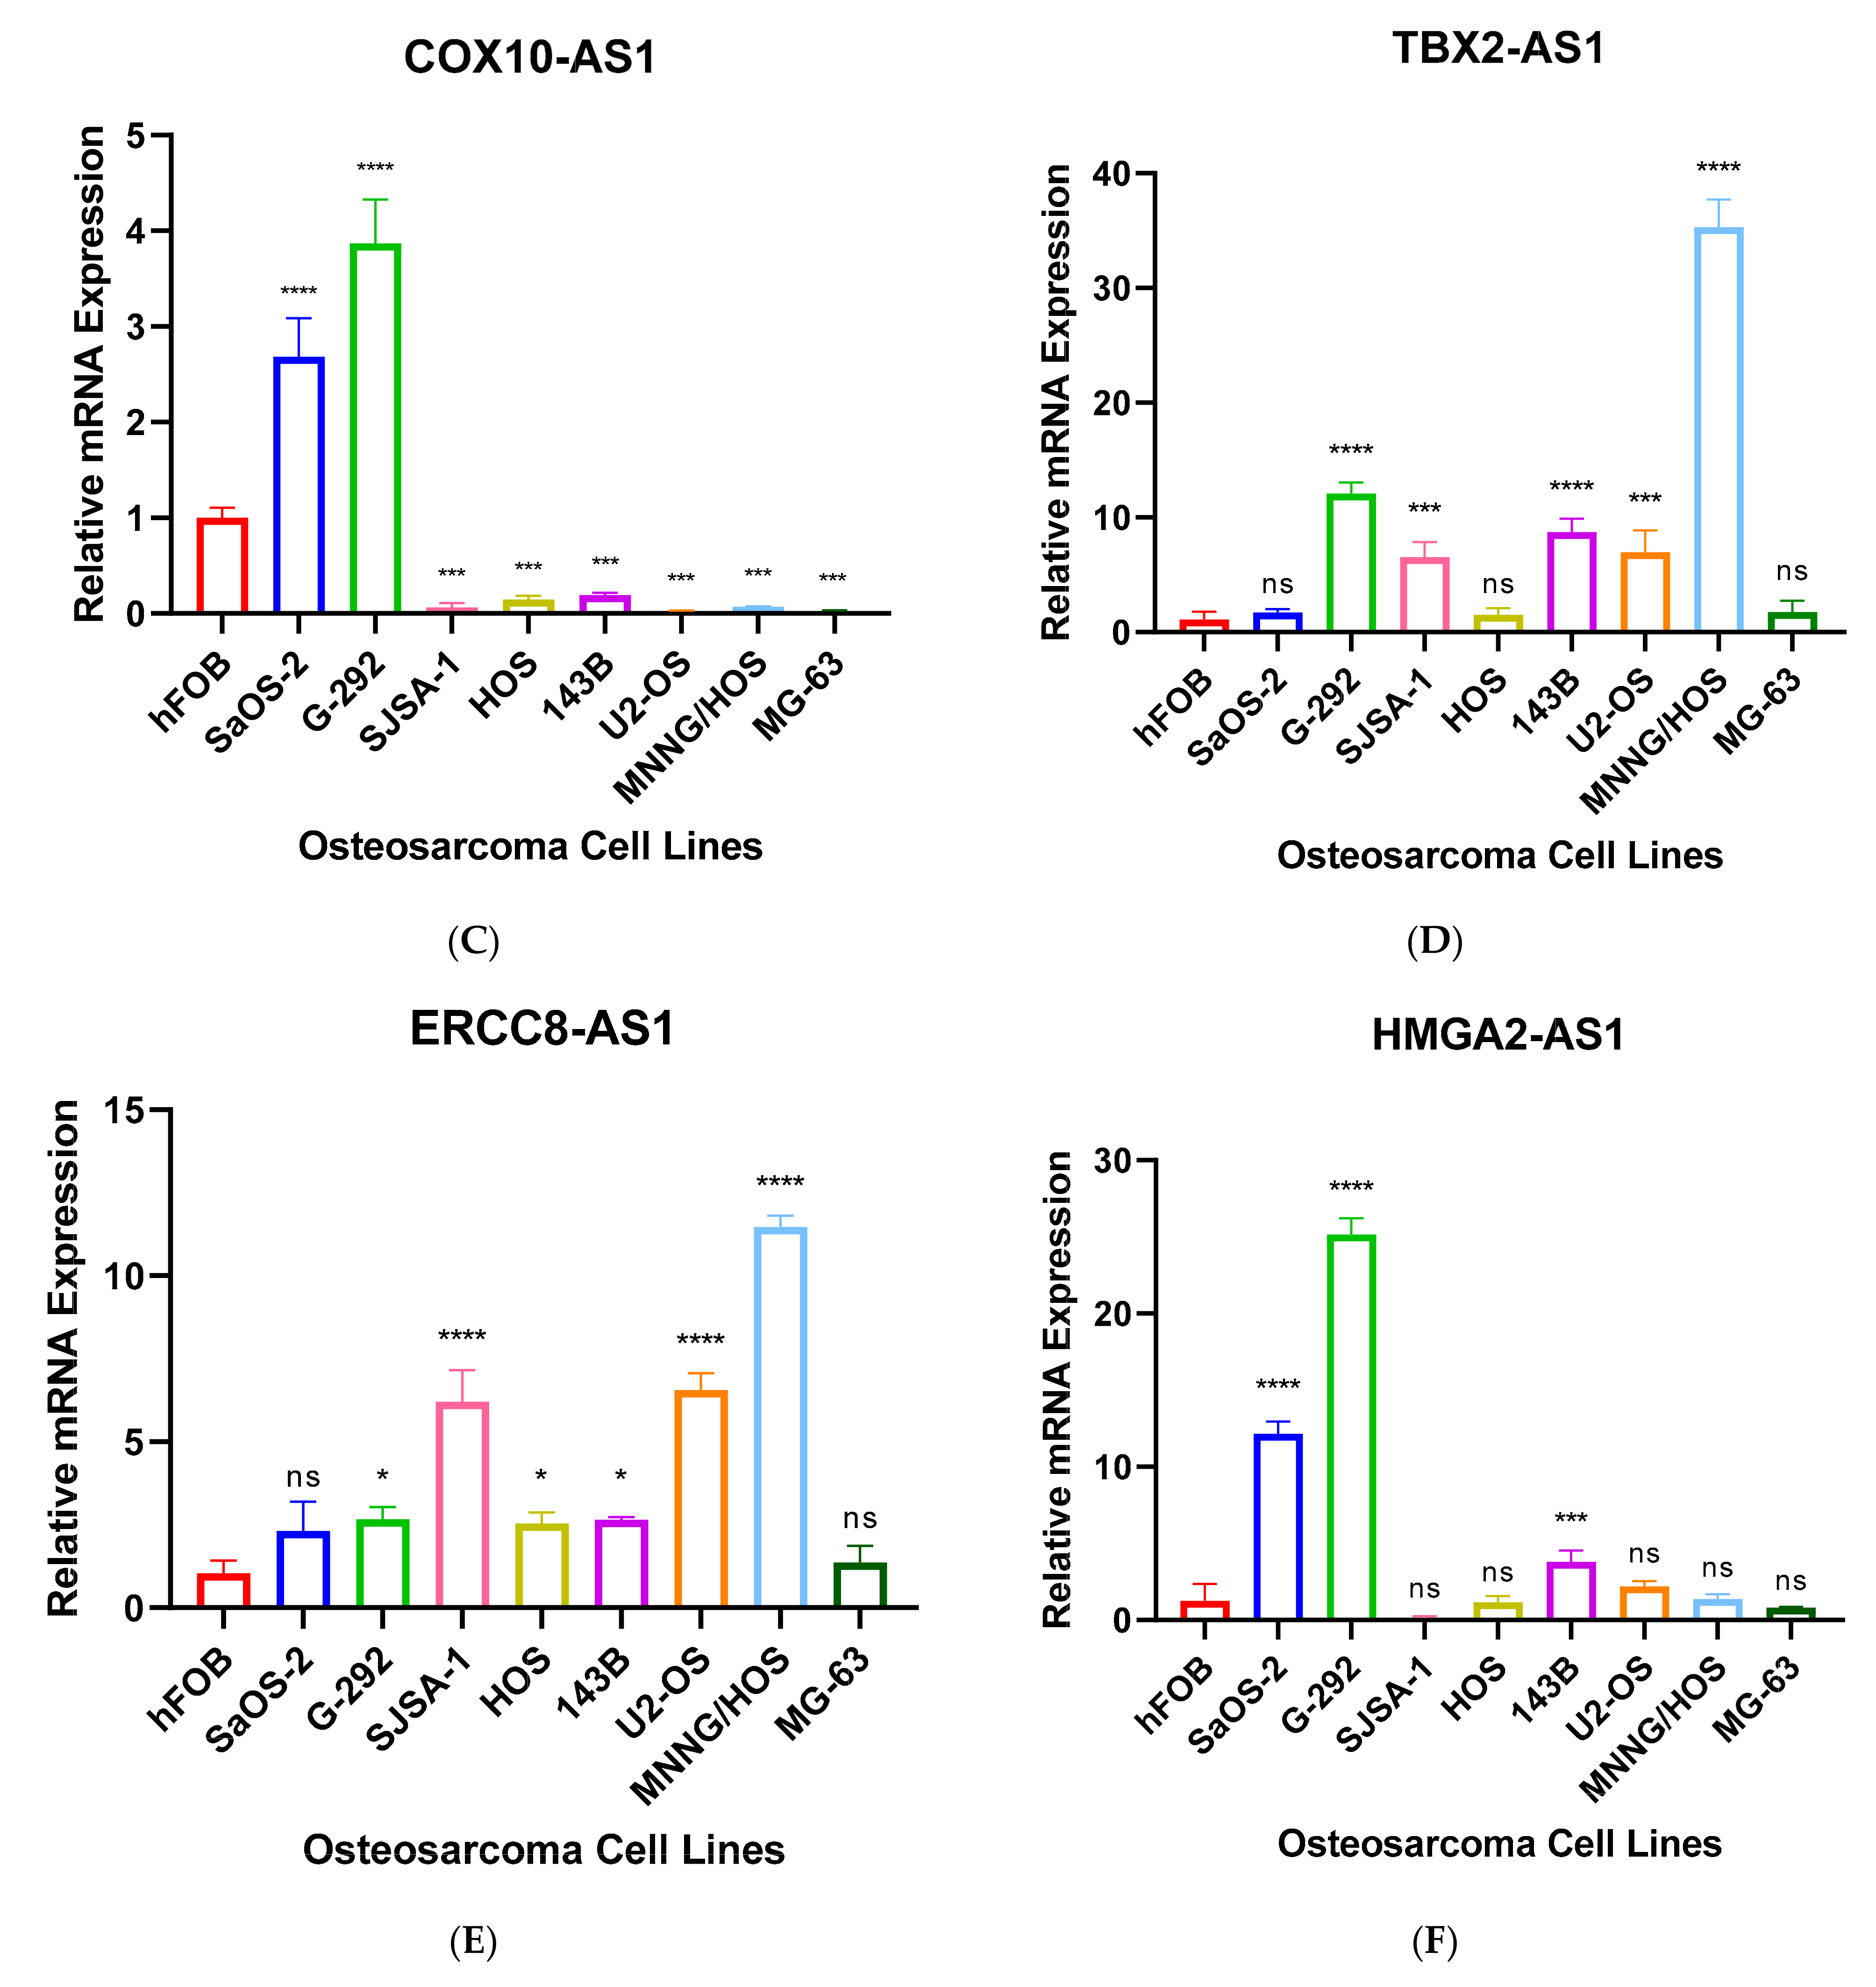
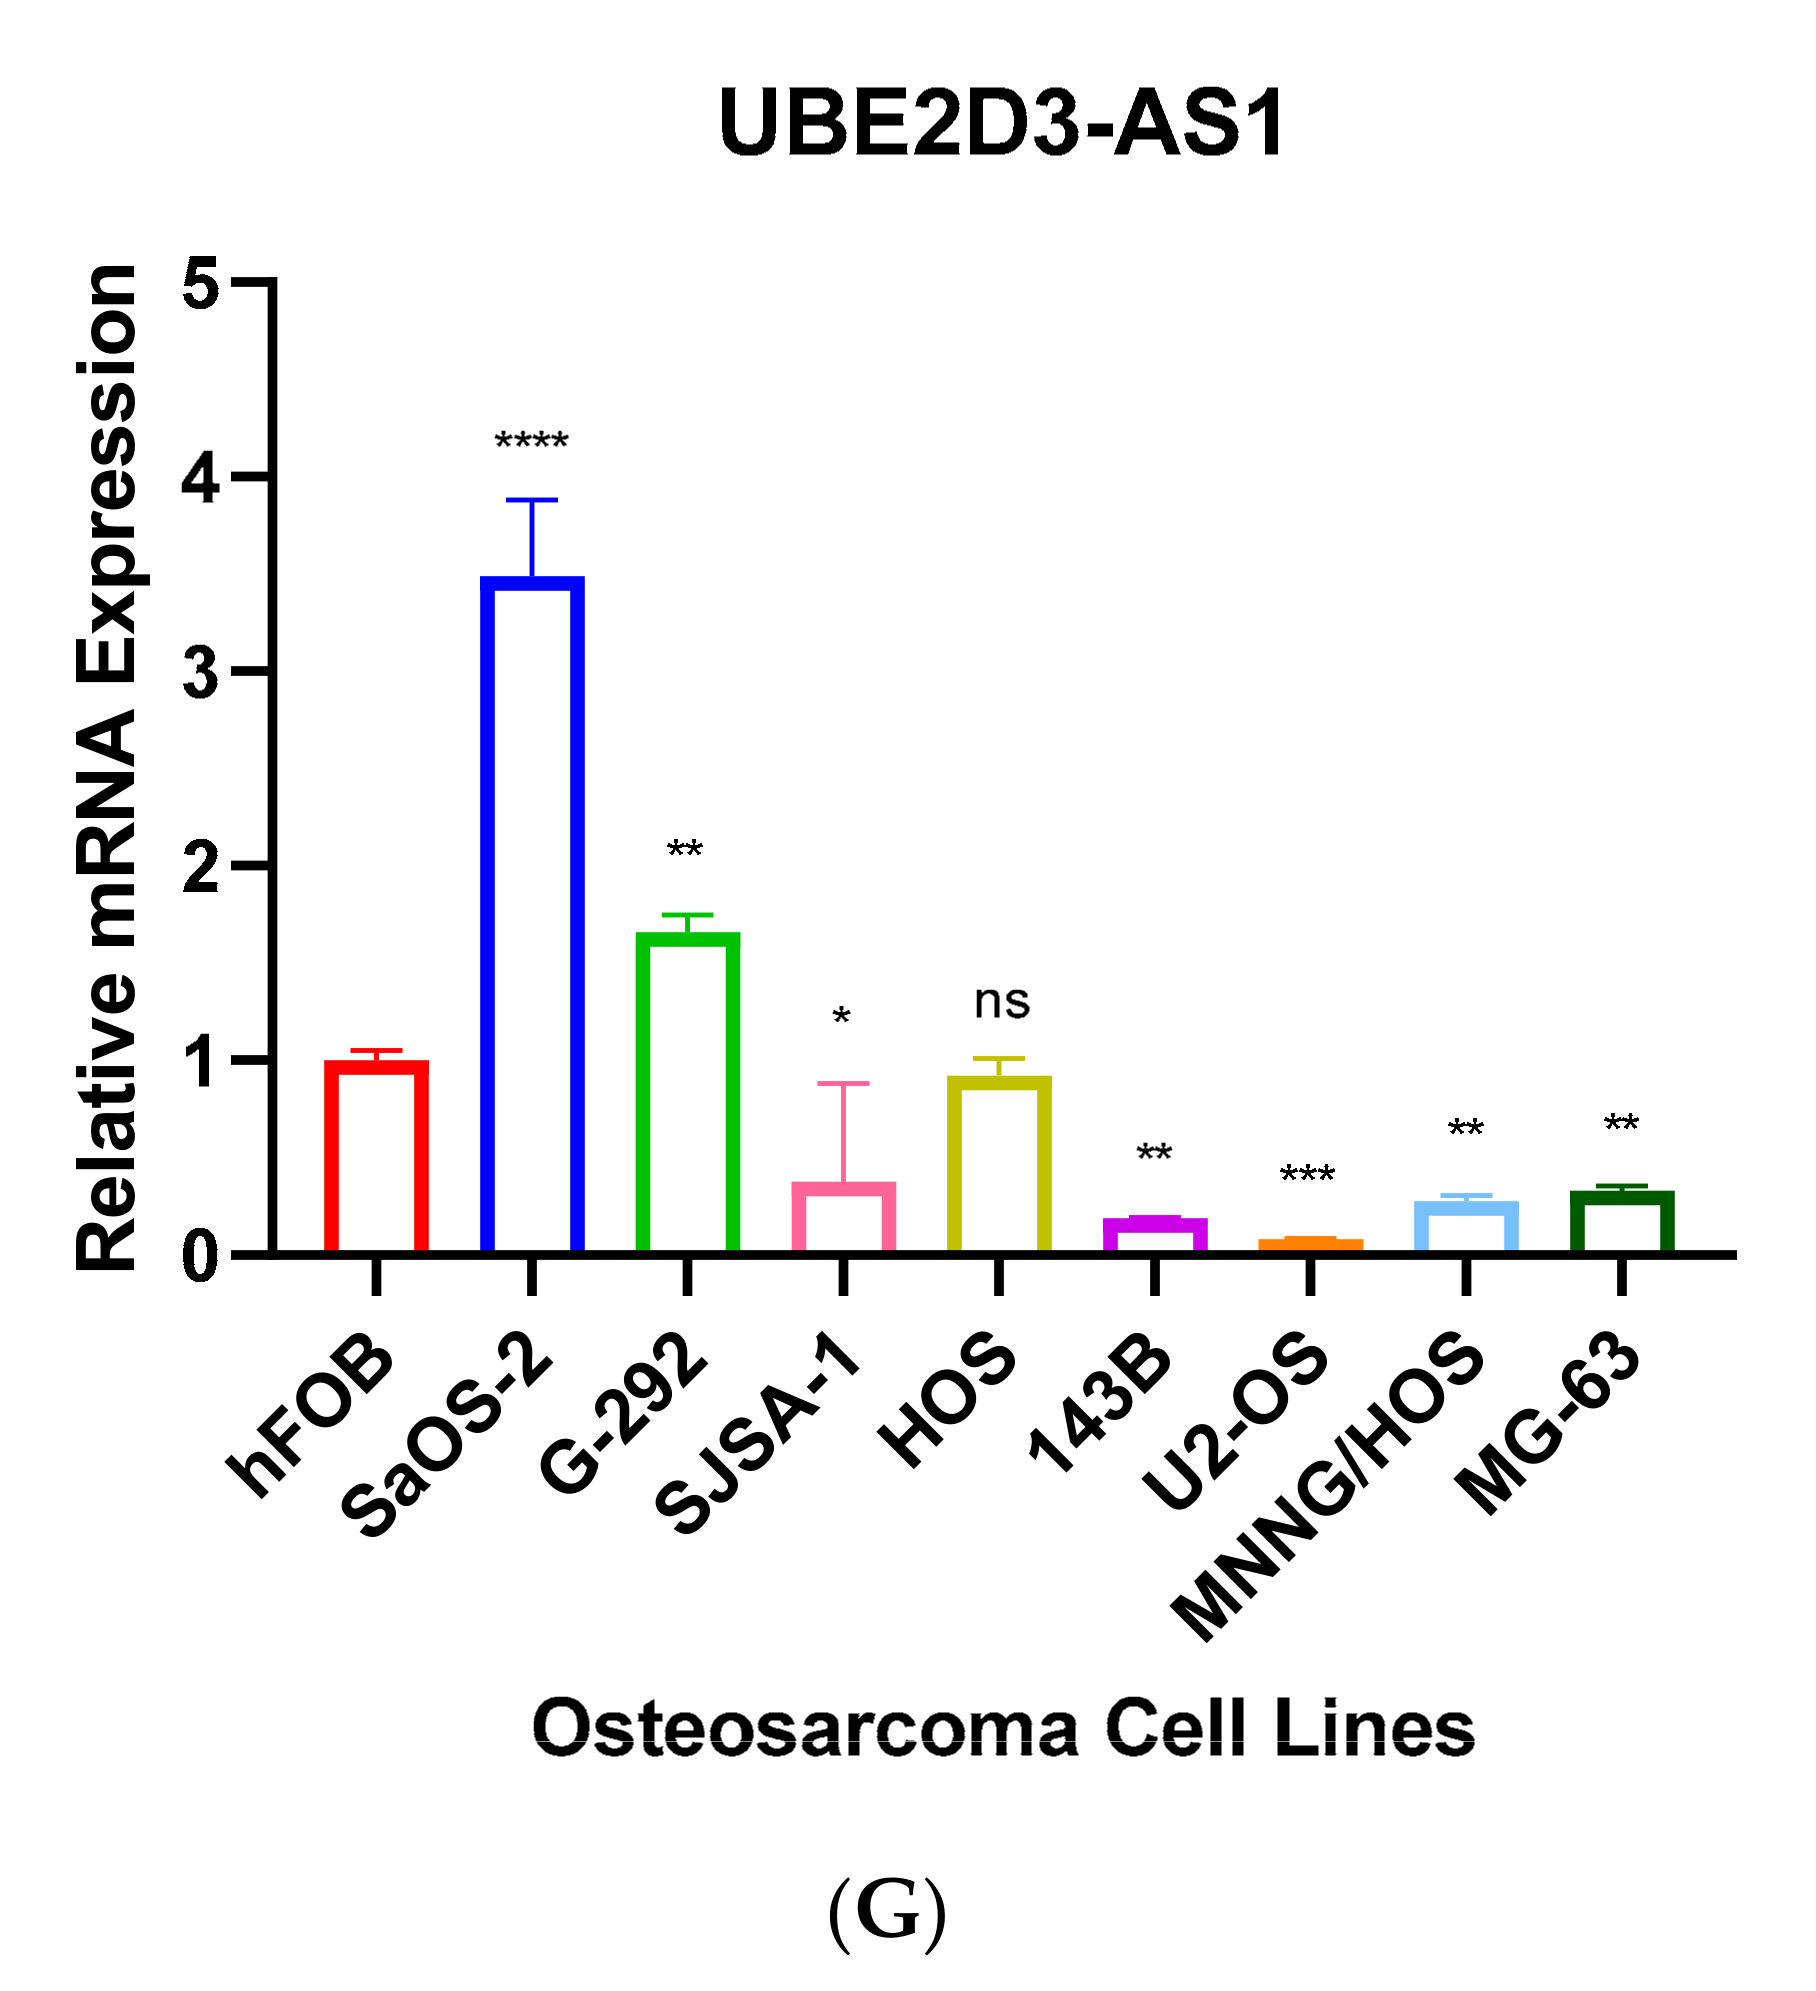
Further, we performed RT-qPCR to validate RNA-seq results through 8 different OS cell lines, including SaOS-2, G-292, SJSA-1, HOS, 143B, U2-OS, MNNG/HOS and MG-63 and the expression values were compared to hFOB using the 2−ΔΔCT method. The results have shown that only 7 antisense lncRNAs (RUSC1-AS1, TBX2-AS1, UBE2D3-AS1, ERCC8-AS1, HMGA2-AS1, OTUD6B-AS1, and COX10-AS1) have validation of transcript expression by RT-qPCR (Figure 5). Note that the RT-qPCR Ct values of remain 8 antisense lncRNAs were too high (>35 or not detectable) in hFOB cell line, suggesting the corresponding transcripts may not be expressed above the limit of detection of the RT-qPCR technique.
4. Discussion
NATs are a growing focus of cancer genomics studies. They have been dysregulated in various cancer types, are implicated in several malignant phenotypes [28,29,30], and are emerging as pre-dominant players in carcinogenesis through their involvement in gene expression regulation, epigenetic modification, evasion of growth suppressors and reprogramming energy metabolism [28].
In the present study, we analysed antisense lncRNAs expression patterns between tumour and normal samples. The RNA-seq result revealed that 15 antisense lncRNAs, RUSC1-AS1, TBX2-AS1, PTOV1-AS1, UBE2D3-AS1, ERCC8-AS1, ZMIZ1-AS1, RNF144A-AS1, RDH10-AS1, TRG-AS1, GSN-AS1, HMGA2-AS1, ZNF528-AS1, OTUD6B-AS1, COX10-AS1 and SLC16A1-AS1 were upregulated in tumour samples compared to controls. Further we performed RT-qPCR to validate the transcript expressions using OS cell lines and relative transcript expressions were obtained via osteoblast cell line-hFOB.
Dysregulation of RUSC1-AS1 (also known as C1orf104) has been associated with several cancer types. According to some studies RUSC1-AS1 is highly expressed in laryngeal squamous cell carcinoma, cervical cancer, and breast cancer cells [31,32,33]. Another study supports that the transcript promotes cell proliferation in hepatocellular carcinoma through modulating NOTCH signaling [34]. Our RNA-seq data also highlighted that the transcript was upregulated in OS samples compared to normal. According to our RT-qPCR result RUSC1-AS1 was significantly upregulated in U2-OS cell line by more than a 2-fold (Figure 5B). Whereas, the transcript was dramatically downregulated in SaOS-2, HOS and 143B cell lines. The cell lines have different characteristics, morphology, and metastatic properties, consequently the differences can affect transcript expression. Further, passage number affects a cell line’s characteristics over time such as cell lines with high passage numbers can experience alterations in morphology, response to stimuli, cell growth rates, gene and protein expression and transfection efficiency, compared to lower passage cells [35,36,37,38,39].
A study highlighted a potential regulatory connection of TBX2-AS1 and TBX2. The same study also suggested that TBX2-AS1 tightly co-expressed with TBX2 suggesting cis-regulation and their association with neuroblastoma [40]. Our RT-qPCR also has validated alongside with RNA-seq data that TBX2-AS1 was upregulated in G-292, SJSA-1, 143B, U2-OS, and MNNG/HOS by more than 15-fold compared to hFOB (Figure 5C).
The knockdown of heterogeneous nuclear ribonucleoprotein K (hnRNPK) eventually reduced PTOV1-AS1 expression in HeLa cervical carcinoma cells. The study also investigated reduced expression of hnRNPK or PTOV-AS-1 suppressed heme oxygenase-1 (HO-1) expression by increasing the enrichment of HO-1 mRNA in miR-1207-5p-mediated miRISC. The knockdown or decreased expression of either hnRNPK or PTOV-AS-1 resulted in inhibition of the proliferation and clonogenic ability of HeLa cells [41]. We also observed upregulation of PTOV-AS-1 in tumour samples compared to normal bone tissue. Interestingly, we also observed hnRNPK upregulation in tumour compared to normal samples (Figure S1).
The single-nucleotide polymorphisms (SNPs) of ZMIZ1-AS1, located at 10q22.3, has been associated with colorectal cancer and patients’ survival among Korean population [42,43]. The transcript also interferes with ZMIZ1 gene regulating several tumour suppressors such as SMAD4 and p53 [44,45].
According to some studies RNF144A-AS1, also known as GRASLND, is highly expressed in bladder cancer, and overexpression of the transcript is correlated with poor prognosis. The same study also observed that the knockdown of RNF144A-AS1 eventually inhibited cell proliferation, migration, and invasion in J82 and 5637 cell lines, in addition xenograft growth of cells was reduced compared to negative control in nude mice [46,47]. Another study highlighted RNF144A-AS1 as an important regulator of mesenchymal stem cell chondrogenesis [48].
Over expression of TRG-AS1 has been observed in several cancer types including squamous cell carcinoma of the tongue, hepatocellular carcinoma, and glioblastoma. Furthermore, TRG-AS1 has been associated with poor prognosis [49,50,51].
Interestingly, GSN-AS1 was downregulated in breast cancer patients [52]. The transcript was upregulated in OS tumour compared to normal samples in our study.
HMGA2-AS1 positively regulates HMGA2 expression and migration properties of PANC1 cells through HMGA2. HMGA2-AS1 is also correlated with poor prognosis in pancreatic cancer patients [15,53]. Not surprisingly, HMGA2 plays a key role in cell proliferation and has been associated with various cancer types including colorectal, lung, gastric, colon, leiomyoma, and oesophageal squamous cell carcinoma [53,54,55,56,57,58,59,60]. The over expression of both HMGA2-AS1 and HMGA2 has been observed in our RNA-seq data (Table 3 and Figure S2). The RT-qPCR data also validated that HMGA2-AS1 was significantly upregulated in SaOS-2, G-292 and 143B cell lines compared to hFOB (Figure 5F).
Interestingly, overexpression of OTUD6B-AS1 inhibits cell proliferation, migration, invasion, and promotes cell apoptosis in colorectal cancer by sponging miR-21-5p and regulating PNRC2 [61]. Another study has also suggested the similar findings, overexpression of the transcript inhibits cell proliferation, migration, and invasion by downregulation of microRNA-3171 [62]. Gang Wang et al. suggested that OTUD6B-AS1 expression was downregulated in renal cell carcinoma via the Wnt/β-catenin signaling pathway and low expression of the transcript has been correlated with shorter overall survival than patients with high OTUD6B-AS1 expression [63]. The overexpression of the transcript also reduced cell migration and invasion in thyroid carcinoma cells [64]. Whereas high expression of OTUD6B-AS1 indicates poor prognosis in ovarian cancer [65]. The transcript is also upregulated in OS samples compared to normal bone tissues. The RT-qPCR result has also validated that the transcript was upregulated in SaOS-2, and HOS cell lines compared with hFOB (Figure 5A).
Chaoyang Zhou et al. found that COX10-AS1 acts as a competing endogenous RNA to positively regulate ACTG1 expression by sponging miR-361-5p and promotes glioblastoma cell proliferation and inhibits apoptosis [66]. The transcript is also upregulated in SaOS-2, and G-292 cell lines compared to hFOB by more than 2-fold in our RT-qPCR result (Figure 5D).
The upregulation of SLC16A1-AS1 was observed in hepatocellular carcinoma, and glioblastoma [67,68]. Hong Yue Liu et al. suggested that the transcript was dramatically downregulated in non-small cell lung cancer and over expression of SLC16A1-AS1 inhibits the cell viability and proliferation of lung cancer cell [69].
This is the first time of ERCC8-AS1, UBE2D3-AS1, RDH10-AS1, and ZNF528-AS1 expressions in cancer have been reported. According to GeneCards (genecards.org (accessed on 10 April 2021)) ERCC8-AS1 has been associated with Cockayne Syndrome A and Cockayne Syndrome which one of main clinical features is cachectic dwarfism. It is a photosensitive, DNA repair disorder which has been associated with progeria that is caused by a defect in the transcription-coupled repair sub-pathway of nucleotide excision repair [70,71]. Another study has suggested that individuals with Cockayne Syndrome have mutations in ERCC8 and ERRC6, resulting in defective transcription-coupled nucleotide excision repair. In addition, ERCC1 or ERCC4 mutation also have been reported in Cockayne Syndrome [72]. ERCC family also widely involved with Fanconi anemia which leads to bone marrow failure, several moderate skeletal abnormalities and a predisposition to leukemia and solid tumours [73,74]. Interestingly, downregulation of ERCC4 has displayed worse survival outcome in OS patients [75]. Our RT-qPCR result also highlighted that ERCC8-AS1 was upregulated in G-292, SJSA-1, HOS, 143B, US-OS and MNNG/HOS cell lines compared to hFOB (Figure 5E). UBE2D3-AS1 is also upregulated in SaOS-2, and G-292 cell lines compared to hFOB (Figure 5G).
The limitation of this study is that some patients received chemotherapy may lead to gene expression alterations of the results. Another limitation of the study is the cell lines have had different passage numbers which may affect RT-qPCR results.
In conclusion, in this study, we performed RNA-seq analysis to identify differential expression of antisense lncRNAs between tumour and normal samples. The results highlighted that 15 antisense lncRNAs (RUSC1-AS1, TBX2-AS1, PTOV1-AS1, UBE2D3-AS1, ERCC8-AS1, ZMIZ1-AS1, RNF144A-AS1, RDH10-AS1, TRG-AS1, GSN-AS1, HMGA2-AS1, ZNF528-AS1, OTUD6B-AS1, COX10-AS1 and SLC16A1-AS1) that were upregulated in tumour samples compared to normal. We also validated the transcript expression of RUSC1-AS1, TBX2-AS1, UBE2D3-AS1, ERCC8-AS1, HMGA2-AS1, OTUD6B-AS1, and COX10-AS1 in OS cell lines compared to hFOB. The transcripts have not been sufficiently characterized and studied in cancer, especially in OS. A better understanding of the functions of antisense lncRNAs has the potential to elucidate the molecular pathogenesis of OS and other tumours, develop diagnostic and prognostic markers, and identify targets for novel precision therapies.
Supplementary Materials
The following are available online at https://0-www-mdpi-com.brum.beds.ac.uk/article/10.3390/genes12081132/s1, Figure S1. Table of upregulation of HNRNPK in tumour samples (A) and boxplot of expression level in tumour and normal samples (B); Figure S2. Table of upregulation of HNRNPK in tumour samples (A) and boxplot of expression level in tumour and normal samples (B).
Author Contributions
E.R. contributed in sample collection, laboratory works, data analysis and writing the manuscript. X.D.H., J.X., A.M. and D.W. provided valuable opinions related to the study and revised the manuscript. S.K. contributed in study design, supervising, data analysis and revised the manuscript. All authors have read and agreed to the published version of the manuscript.
Funding
This research was funded by the Abbie Basson Sarcoma Foundation (Sock it to Sarcoma!).
Institutional Review Board Statement
The study was conducted according to the guidelines of the Declaration of Helsinki, and approved by the by the Ethics Review Committee of the University of Western Australia and Sir Charles Gairdner Hospital (2019/RA/4/20/5211).
Informed Consent Statement
Informed consent was obtained from all subjects involved in the study.
Data Availability Statement
The data that support the findings of this study are available from the corresponding author upon reasonable request.
Acknowledgments
The authors thank all patients who participated in this study and PathWest Nedlands/Australia for their help and support. We also thank Evan Ingley for providing the osteosarcoma cell lines.
Conflicts of Interest
The authors declare no conflict of interest.
References
- Wu, C.C.; Beird, H.C.; Andrew Livingston, J.; Advani, S.; Mitra, A.; Cao, S.; Reuben, A.; Ingram, D.; Wang, W.L.; Ju, Z.; et al. Immuno-genomic landscape of osteosarcoma. Nat. Commun. 2020, 11, 1008. [Google Scholar] [CrossRef] [PubMed] [Green Version]
- Durfee, R.A.; Mohammed, M.; Luu, H.H. Review of Osteosarcoma and Current Management. Rheumatology 2016, 3, 221–243. [Google Scholar] [CrossRef] [PubMed] [Green Version]
- Goryn, T.; Pienkowski, A.; Szostakowski, B.; Zdzienicki, M.; Lugowska, I.; Rutkowski, P. Functional outcome of surgical treatment of adults with extremity osteosarcoma after megaprosthetic reconstruction-single-center experience. J. Orthop. Surg. Res. 2019, 14, 346. [Google Scholar] [CrossRef] [PubMed] [Green Version]
- Lindsey, B.A.; Markel, J.E.; Kleinerman, E.S. Osteosarcoma Overview. Rheumatology 2017, 4, 25–43. [Google Scholar] [CrossRef] [PubMed] [Green Version]
- Rothzerg, E.; Ingley, E.; Mullin, B.; Xue, W.; Wood, D.; Xu, J. The Hippo in the room: Targeting the Hippo signalling pathway for osteosarcoma therapies. J. Cell Physiol. 2021, 236, 1606–1615. [Google Scholar] [CrossRef] [PubMed]
- Lamplot, J.D.; Denduluri, S.; Qin, J.; Li, R.; Liu, X.; Zhang, H.; Chen, X.; Wang, N.; Pratt, A.; Shui, W.; et al. The Current and Future Therapies for Human Osteosarcoma. Curr. Cancer Rev. 2013, 9, 55–77. [Google Scholar] [CrossRef] [PubMed] [Green Version]
- Rothzerg, E.; Ho, X.D.; Xu, J.; Wood, D.; Martson, A.; Maasalu, K.; Koks, S. Alternative splicing of leptin receptor overlapping transcript in osteosarcoma. Exp. Biol. Med. 2020, 245, 1437–1443. [Google Scholar] [CrossRef] [PubMed]
- Igarashi, K.; Yamamoto, N.; Shirai, T.; Nishida, H.; Hayashi, K.; Tanzawa, Y.; Kimura, H.; Takeuchi, A.; Miwa, S.; Inatani, H.; et al. Late recurrence of osteosarcoma: A report of two cases. J. Orthop. Surg. 2014, 22, 415–419. [Google Scholar] [CrossRef] [PubMed]
- Ponting, C.P.; Oliver, P.L.; Reik, W. Evolution and functions of long noncoding RNAs. Cell 2009, 136, 629–641. [Google Scholar] [CrossRef] [Green Version]
- Lekka, E.; Hall, J. Noncoding RNAs in disease. FEBS Lett. 2018, 592, 2884–2900. [Google Scholar] [CrossRef]
- Hangauer, M.J.; Vaughn, I.W.; McManus, M.T. Pervasive transcription of the human genome produces thousands of previously unidentified long intergenic noncoding RNAs. PLoS Genet. 2013, 9, e1003569. [Google Scholar] [CrossRef]
- Prensner, R.J.; Chinnaiyan, A.M. The emergence of lncRNAs in cancer biology. Cancer Discov. 2011, 1, 391–407. [Google Scholar] [CrossRef] [PubMed] [Green Version]
- Dey, B.K.; Mueller, A.C.; Dutta, A. Long non-coding RNAs as emerging regulators of differentiation, development, and disease. Transcription 2014, 5, e944014. [Google Scholar] [CrossRef] [PubMed] [Green Version]
- Geisler, S.; Coller, J. RNA in unexpected places: Long non-coding RNA functions in diverse cellular contexts. Nat. Rev. Mol. Cell Biol. 2013, 14, 699–712. [Google Scholar] [CrossRef] [Green Version]
- Ros, G.; Pegoraro, S.; De Angelis, P.; Sgarra, R.; Zucchelli, S.; Gustincich, S.; Manfioletti, G. HMGA2 Antisense Long Non-coding RNAs as New Players in the Regulation of HMGA2 Expression and Pancreatic Cancer Promotion. Front. Oncol. 2019, 9, 1526. [Google Scholar] [CrossRef]
- Faghihi, A.M.; Wahlestedt, C. Regulatory roles of natural antisense transcripts. Nat. Rev. Mol. Cell Biol. 2009, 10, 637–643. [Google Scholar] [CrossRef]
- Liu, J.; Hu, J.; Corey, D.R. Expanding the action of duplex RNAs into the nucleus: Redirecting alternative splicing. Nucleic Acids Res. 2012, 40, 1240–1250. [Google Scholar] [CrossRef] [PubMed] [Green Version]
- Gallo, A.; Vukic, D.; Michalik, D.; O'Connell, M.A.; Keegan, L.P. ADAR RNA editing in human disease; more to it than meets the I. Hum. Genet. 2017, 136, 1265–1278. [Google Scholar]
- Slotkin, W.; Nishikura, K. Adenosine-to-inosine RNA editing and human disease. Genome Med. 2013, 5, 105. [Google Scholar] [CrossRef]
- Britto-Kido Sde, A.; Ferreira Neto, J.R.; Pandolfi, V.; Marcelino-Guimaraes, F.C.; Nepomuceno, A.L.; Vilela Abdelnoor, R.; Benko-Iseppon, A.M.; Kido, E.A. Natural antisense transcripts in plants: A review and identification in soybean infected with Phakopsora pachyrhizi SuperSAGE library. Sci. World J. 2013, 2013, 219798. [Google Scholar]
- Rosikiewicz, W.; Makalowska, I. Biological functions of natural antisense transcripts. Acta Biochim. Pol. 2016, 63, 665–673. [Google Scholar] [CrossRef] [Green Version]
- Li, R.; Sklutuis, R.; Groebner, J.L.; Romerio, F. HIV-1 Natural Antisense Transcription and Its Role in Viral Persistence. Viruses 2021, 13, 795. [Google Scholar] [CrossRef]
- Modi, A.; Vai, S.; Caramelli, D.; Lari, M. The Illumina Sequencing Protocol and the NovaSeq 6000 System. Methods Mol. Biol. 2021, 2242, 15–42. [Google Scholar]
- Bolger, A.M.; Lohse, M.; Usadel, B. Trimmomatic: A flexible trimmer for Illumina sequence data. Bioinformatics 2014, 30, 2114–2120. [Google Scholar] [CrossRef] [Green Version]
- Guo, Y.; Dai, Y.; Yu, H.; Zhao, S.; Samuels, D.C.; Shyr, Y. Improvements and impacts of GRCh38 human reference on high throughput sequencing data analysis. Genomics 2017, 109, 83–90. [Google Scholar] [CrossRef] [PubMed]
- Love, M.I.; Huber, W.; Anders, S. Moderated estimation of fold change and dispersion for RNA-seq data with DESeq2. Genome Biol. 2014, 15, 550. [Google Scholar] [CrossRef] [PubMed] [Green Version]
- Severin, J.; Lizio, M.; Harshbarger, J.; Kawaji, H.; Daub, C.O.; Hayashizaki, Y.; Consortium, F.; Bertin, N.; Forrest, A.R. Interactive visualization and analysis of large-scale sequencing datasets using ZENBU. Nat. Biotechnol. 2014, 32, 217–219. [Google Scholar] [CrossRef]
- Zhao, S.; Zhang, X.; Chen, S.; Zhang, S. Natural antisense transcripts in the biological hallmarks of cancer: Powerful regulators hidden in the dark. J. Exp. Clin. Cancer Res. 2020, 39, 187. [Google Scholar] [CrossRef]
- Pelechano, V.; Steinmetz, L.M. Gene regulation by antisense transcription. Nat. Rev. Genet. 2013, 14, 880–893. [Google Scholar] [CrossRef]
- Balbin, O.A.; Malik, R.; Dhanasekaran, S.M.; Prensner, J.R.; Cao, X.; Wu, Y.M.; Robinson, D.; Wang, R.; Chen, G.; Beer, D.G.; et al. The landscape of antisense gene expression in human cancers. Genome Res. 2015, 25, 1068–1079. [Google Scholar] [CrossRef] [PubMed] [Green Version]
- Hui, L.; Wang, J.; Zhang, J.; Long, J. lncRNA TMEM51-AS1 and RUSC1-AS1 function as ceRNAs for induction of laryngeal squamous cell carcinoma and prediction of prognosis. PeerJ 2019, 7, e7456. [Google Scholar] [CrossRef] [PubMed]
- Guo, Q.; Zhang, Q.; Lu, L.; Xu, Y. Long noncoding RNA RUSC1-AS1 promotes tumorigenesis in cervical cancer by acting as a competing endogenous RNA of microRNA-744 and consequently increasing Bcl-2 expression. Cell Cycle 2020, 19, 1222–1235. [Google Scholar] [CrossRef]
- Hu, C.C.; Liang, Y.W.; Hu, J.L.; Liu, L.F.; Liang, J.W.; Wang, R. LncRNA RUSC1-AS1 promotes the proliferation of breast cancer cells by epigenetic silence of KLF2 and CDKN1A. Eur. Rev. Med. Pharm. Sci. 2019, 23, 6602–6611. [Google Scholar]
- Chen, Y.A.; Cheng, L.; Zhang, Y.; Peng, L.; Yang, H.G. LncRNA RUSC1-AS1 promotes the proliferation of hepatocellular carcinoma cells through modulating NOTCH signaling. Neoplasma 2020, 67, 1204–1213. [Google Scholar] [CrossRef]
- Esquenet, M.; Swinnen, J.V.; Heyns, W.; Verhoeven, G. LNCaP prostatic adenocarcinoma cells derived from low and high passage numbers display divergent responses not only to androgens but also to retinoids. J. Steroid. Biochem. Mol. Biol. 1997, 62, 391–399. [Google Scholar] [CrossRef]
- Briske-Anderson, M.J.; Finley, J.W.; Newman, S.M. The influence of culture time and passage number on the morphological and physiological development of Caco-2 cells. Proc. Soc. Exp. Biol. Med. 1997, 214, 248–257. [Google Scholar] [CrossRef]
- Chang, L.; Woloschak, G.E. Effect of passage number on cellular response to DNA-damaging agents: Cell survival and gene expression. Cancer Lett. 1997, 113, 77–86. [Google Scholar] [CrossRef] [Green Version]
- Wenger, S.L.; Senft, J.R.; Sargent, L.M.; Bamezai, R.; Bairwa, N.; Grant, S.G. Comparison of established cell lines at different passages by karyotype and comparative genomic hybridization. Biosci. Rep. 2004, 24, 631–639. [Google Scholar] [CrossRef] [PubMed]
- Sambuy, Y.; De Angelis, I.; Ranaldi, G.; Scarino, M.L.; Stammati, A.; Zucco, F. The Caco-2 cell line as a model of the intestinal barrier: Influence of cell and culture-related factors on Caco-2 cell functional characteristics. Cell Biol. Toxicol. 2005, 21, 1–26. [Google Scholar] [CrossRef]
- Decaesteker, B. TBX2 is a neuroblastoma core regulatory circuitry component enhancing MYCN/FOXM1 reactivation of DREAM targets. Nat. Commun. 2018, 9, 4866. [Google Scholar] [CrossRef]
- Shin, C.H.; Ryu, S.; Kim, H.H. hnRNPK-regulated PTOV1-AS1 modulates heme oxygenase-1 expression via miR-1207-5p. BMB Rep. 2017, 50, 220–225. [Google Scholar] [CrossRef] [PubMed] [Green Version]
- Song, N.; Kim, K.; Shin, A.; Park, J.W.; Chang, H.J.; Shi, J.; Cai, Q.; Kim, D.Y.; Zheng, W.; Oh, J.H. Colorectal cancer susceptibility loci and influence on survival. Genes Chromosomes Cancer 2018, 57, 630–637. [Google Scholar] [CrossRef] [PubMed]
- Song, N.; Shin, A.; Park, J.W.; Kim, J.; Oh, J.H. Common risk variants for colorectal cancer: An evaluation of associations with age at cancer onset. Sci. Rep. 2017, 7, 40644. [Google Scholar] [CrossRef] [Green Version]
- Alazzouzi, H.; Alhopuro, P.; Salovaara, R.; Sammalkorpi, H.; Jarvinen, H.; Mecklin, J.P.; Hemminki, A.; Schwartz, S., Jr.; Aaltonen, L.A.; Arango, D. SMAD4 as a prognostic marker in colorectal cancer. Clin. Cancer Res. 2005, 11, 2606–2611. [Google Scholar] [CrossRef] [Green Version]
- Rivlin, N.; Brosh, R.; Oren, M.; Rotter, V. Mutations in the p53 Tumor Suppressor Gene: Important Milestones at the Various Steps of Tumorigenesis. Genes Cancer 2011, 2, 466–474. [Google Scholar] [CrossRef] [PubMed] [Green Version]
- Bi, H.; Shang, Z.; Jia, C.; Wu, J.; Cui, B.; Wang, Q.; Ou, T. LncRNA RNF144A-AS1 Promotes Bladder Cancer Progression via RNF144A-AS1/miR-455-5p/SOX11 Axis. Oncol. Targets 2020, 13, 11277–11288. [Google Scholar] [CrossRef]
- Wang, Y.; Du, L.; Yang, X.; Li, J.; Li, P.; Zhao, Y.; Duan, W.; Chen, Y.; Wang, Y.; Mao, H.; et al. A nomogram combining long non-coding RNA expression profiles and clinical factors predicts survival in patients with bladder cancer. Aging 2020, 12, 2857–2879. [Google Scholar] [CrossRef] [PubMed]
- Huynh, N.P.; Gloss, C.C.; Lorentz, J.; Tang, R.; Brunger, J.M.; McAlinden, A.; Zhang, B.; Guilak, F. Long non-coding RNA GRASLND enhances chondrogenesis via suppression of the interferon type II signaling pathway. eLife 2020, 9, e49558. [Google Scholar] [CrossRef] [Green Version]
- He, S.; Wang, X.; Zhang, J.; Zhou, F.; Li, L.; Han, X. TRG-AS1 is a potent driver of oncogenicity of tongue squamous cell carcinoma through microRNA-543/Yes-associated protein 1 axis regulation. Cell Cycle 2020, 19, 1969–1982. [Google Scholar] [CrossRef]
- Sun, X.; Qian, Y.; Wang, X.; Cao, R.; Zhang, J.; Chen, W.; Fang, M. LncRNA TRG-AS1 stimulates hepatocellular carcinoma progression by sponging miR-4500 to modulate BACH1. Cancer Cell Int. 2020, 20, 367. [Google Scholar] [CrossRef]
- Xie, H.; Shi, S.; Chen, Q.; Chen, Z. LncRNA TRG-AS1 promotes glioblastoma cell proliferation by competitively binding with miR-877-5p to regulate SUZ12 expression. Pathol. Res. Pr. 2019, 215, 152476. [Google Scholar] [CrossRef] [PubMed]
- Yang, F.; Lv, S.X.; Lv, L.; Liu, Y.H.; Dong, S.Y.; Yao, Z.H.; Dai, X.X.; Zhang, X.H.; Wang, O.C. Identification of lncRNA FAM83H-AS1 as a novel prognostic marker in luminal subtype breast cancer. Onco. Targets Ther. 2016, 9, 7039–7045. [Google Scholar] [CrossRef] [Green Version]
- Jing, Z.; Guo, S.; Zhang, P.; Liang, Z. LncRNA-Associated ceRNA Network Reveals Novel Potential Biomarkers of Laryngeal Squamous Cell Carcinoma. Technol. Cancer Res. Treat. 2020, 19, 1533033820985787. [Google Scholar] [CrossRef] [PubMed]
- Wu, Y.; Wang, X.; Xu, F.; Zhang, L.; Wang, T.; Fu, X.; Jin, T.; Zhang, W.; Ye, L. The regulation of acetylation and stability of HMGA2 via the HBXIP-activated Akt-PCAF pathway in promotion of esophageal squamous cell carcinoma growth. Nucleic Acids Res. 2020, 48, 4858–4876. [Google Scholar] [CrossRef] [PubMed] [Green Version]
- Zhang, S.; Mo, Q.; Wang, X. Oncological role of HMGA2 (Review). Int. J. Oncol. 2019, 55, 775–788. [Google Scholar] [CrossRef]
- Xi, X.; Teng, M.; Zhang, L.; Xia, L.; Chen, J.; Cui, Z. MicroRNA-204-3p represses colon cancer cells proliferation, migration, and invasion by targeting HMGA2. J. Cell Physiol. 2020, 235, 1330–1338. [Google Scholar] [CrossRef]
- Li, Y.; Qiang, W.; Griffin, B.B.; Gao, T.; Chakravarti, D.; Bulun, S.; Kim, J.J.; Wei, J.J. HMGA2-mediated tumorigenesis through angiogenesis in leiomyoma. Fertil. Steril. 2020, 114, 1085–1096. [Google Scholar] [CrossRef]
- Dong, J.; Wang, R.; Ren, G.; Li, X.; Wang, J.; Sun, Y.; Liang, J.; Nie, Y.; Wu, K.; Feng, B.; et al. HMGA2-FOXL2 Axis Regulates Metastases and Epithelial-to-Mesenchymal Transition of Chemoresistant Gastric Cancer. Clin. Cancer Res. 2017, 23, 3461–3473. [Google Scholar] [CrossRef] [Green Version]
- Gao, X.; Dai, M.; Li, Q.; Wang, Z.; Lu, Y.; Song, Z. HMGA2 regulates lung cancer proliferation and metastasis. Thorac. Cancer 2017, 8, 501–510. [Google Scholar] [CrossRef]
- Wang, X.; Wang, J.; Wu, J. Emerging roles for HMGA2 in colorectal cancer. Transl. Oncol. 2021, 14, 100894. [Google Scholar] [CrossRef] [PubMed]
- Cai, Y.; Li, Y.; Shi, C.; Zhang, Z.; Xu, J.; Sun, B. LncRNA OTUD6B-AS1 inhibits many cellular processes in colorectal cancer by sponging miR-21-5p and regulating PNRC2. Hum. Exp. Toxicol. 2021. [Google Scholar] [CrossRef]
- Wang, W.; Cheng, X.; Zhu, J. Long non-coding RNA OTUD6B-AS1 overexpression inhibits the proliferation, invasion and migration of colorectal cancer cells via downregulation of microRNA-3171. Oncol. Lett. 2021, 21, 193. [Google Scholar] [CrossRef] [PubMed]
- Wang, G.; Zhang, Z.J.; Jian, W.G.; Liu, P.H.; Xue, W.; Wang, T.D.; Meng, Y.Y.; Yuan, C.; Li, H.M.; Yu, Y.P.; et al. Novel long noncoding RNA OTUD6B-AS1 indicates poor prognosis and inhibits clear cell renal cell carcinoma proliferation via the Wnt/beta-catenin signaling pathway. Mol. Cancer 2019, 18, 15. [Google Scholar] [CrossRef] [PubMed] [Green Version]
- Wang, Z.; Xia, F.; Feng, T.; Jiang, B.; Wang, W.; Li, X. OTUD6B-AS1 Inhibits Viability, Migration, and Invasion of Thyroid Carcinoma by Targeting miR-183-5p and miR-21. Front. Endocrinol. 2020, 11, 136. [Google Scholar] [CrossRef] [PubMed] [Green Version]
- Li, N.; Zhan, X. Identification of clinical trait-related lncRNA and mRNA biomarkers with weighted gene co-expression network analysis as useful tool for personalized medicine in ovarian cancer. EPMA J. 2019, 10, 273–290. [Google Scholar] [CrossRef] [PubMed] [Green Version]
- Zhou, C.; Jiang, X.; Liang, A.; Zhu, R.; Yang, Y.; Zhong, L.; Wan, D. COX10-AS1 Facilitates Cell Proliferation and Inhibits Cell Apoptosis in Glioblastoma Cells at Post-Transcription Level. Neurochem. Res. 2020, 45, 2196–2203. [Google Scholar] [CrossRef]
- Tian, J.; Hu, D. LncRNA SLC16A1-AS1 is upregulated in hepatocellular carcinoma and predicts poor survival. Clin. Res. Hepatol. Gastroenterol. 2021, 45, 101490. [Google Scholar] [CrossRef]
- Long, Y.; Li, H.; Jin, Z.; Zhang, X. LncRNA SLC16A1-AS1 is Upregulated in Glioblastoma and Promotes Cancer Cell Proliferation by Regulating miR-149 Methylation. Cancer Manag. Res. 2021, 13, 1215–1223. [Google Scholar] [CrossRef]
- Liu, H.Y.; Lu, S.R.; Guo, Z.H.; Zhang, Z.S.; Ye, X.; Du, Q.; Li, H.; Wu, Q.; Yu, B.; Zhai, Q.; et al. lncRNA SLC16A1-AS1 as a novel prognostic biomarker in non-small cell lung cancer. J. Investig. Med. 2020, 68, 52–59. [Google Scholar] [CrossRef] [Green Version]
- Van der Pluijm, I.; Garinis, G.A.; Brandt, R.M.; Gorgels, T.G.; Wijnhoven, S.W.; Diderich, K.E.; de Wit, J.; Mitchell, J.R.; van Oostrom, C.; Beems, R.; et al. Impaired genome maintenance suppresses the growth hormone--insulin-like growth factor 1 axis in mice with Cockayne syndrome. PLoS Biol. 2007, 5, e2. [Google Scholar]
- Karikkineth, A.C.; Scheibye-Knudsen, M.; Fivenson, E.; Croteau, D.L.; Bohr, V.A. Cockayne syndrome: Clinical features, model systems and pathways. Ageing Res. Rev. 2017, 33, 3–17. [Google Scholar] [CrossRef] [PubMed] [Green Version]
- Manandhar, M.; Boulware, K.S.; Wood, R.D. The ERCC1 and ERCC4 (XPF) genes and gene products. Gene 2015, 569, 153–161. [Google Scholar] [CrossRef] [PubMed] [Green Version]
- Kashiyama, K. Malfunction of nuclease ERCC1-XPF results in diverse clinical manifestations and causes Cockayne syndrome, xeroderma pigmentosum, and Fanconi anemia. Am. J. Hum. Genet. 2013, 92, 807–819. [Google Scholar] [CrossRef] [PubMed] [Green Version]
- Rosenberg, P.S.; Greene, M.H.; Alter, B.P. Cancer incidence in persons with Fanconi anemia. Blood 2003, 101, 822–826. [Google Scholar] [CrossRef] [PubMed]
- Rothzerg, E.; Xu, J.; Wood, D.; Koks, S. 12 Survival-related differentially expressed genes based on the TARGET-osteosarcoma database. Exp. Biol. Med. 2021. [Google Scholar] [CrossRef]
Figure 1.
Nuclear and cytoplasmic sense–antisense RNA pairing. Diagram of nuclear RNA duplex formation (A) that further results in alternative splicing (B) or RNA editing (C). Classification of sense/antisense pairs (D). Sense genes represent in blue, whereas antisense transcripts are pink. The black lines between the genes indicates regions of overlap. There are different types of natural antisense transcripts overlapping: head-to-head overlap in cis (Da), embedded overlap in cis (Db), tail-to-tail overlap in cis (Dc), and overlap in trans (Dd).


Figure 2.
3D Principal component analysis (PCA) clustered transcript expression profiling of tumour and normal samples. 3D-PCA plot highlights the 3 principal components (PC1, PC2 and PC3). The groups have been marked by different colour; blue: tumour, orange: normal. The figure highlights that the tumour and normal samples were clustered separately.

Figure 3.
Heatmap of antisense lncRNAs expression comparison between the tumour (orange) and normal (green) samples.
Figure 3.
Heatmap of antisense lncRNAs expression comparison between the tumour (orange) and normal (green) samples.

Figure 4.
Circos plot visualizes the antisense lncRNAs expression in individual samples. 1, 3, 5, 7, 9, 11, 13, 15, 17, 19, 21, 23, 25, 27, 29, 31, 33, 34, 35, 36, 37, 38, 39, 40 are tumour samples, whereas 2, 4, 6, 8, 10, 12, 14, 16, 18, 20, 22, 24, 26, 28, 30, 32 are normal samples. Each colour represents a transcript.

Figure 5.
(A–G). RT-qPCR analysis of antisense lncRNAs. The transcripts expressions were determined using 8 different osteosarcoma cell line; SaOS-2, G-292, SJSA-1, HOS, 143B, U2-OS, MNNG/HOS, MG-63 and relative lncRNA expression obtained by hFOB expression. * p < 0.05, ** p < 0.01, *** p < 0.001, **** p < 0.0001.


Table 1.
Human primer sequences used in RT-qPCR.
| Transcript | Forward Primer | Reverse Primer |
|---|---|---|
| UBE2D3-AS1 | TGAATGCTTATGCCGGTGGT | CGGCCCGAGCTA-GACTAAAG |
| OTUD6B-AS1 | GACATATCCGGGTGACGTTTTT | TTGTTCCACTGTCTTCTGGCATT |
| COX10-AS1 | TACCTCTGGGAAGTAC-GGGG | CACTTGCCACTGAAAGCACC |
| RUSC1-AS1 | GAAAAGGATGGAGCAGCCGTCA | GGCTGAACGATGGAGACGAATG |
| HMGA2-AS1 | GCAGCTTGTTTTCTGGGTGG | ACTTTGGGGGCAAAGTGTCA |
| ERCC8-AS1 | GCCAAACCGAGATCACATGC | CACACAGTGGGAGCCTGAAT |
| TBX2-AS1 | AACATCCAGGGCAATCTGGG | GTGCCGAGAGAATCGGTAGG |
| PTOV1-AS1 | AGGCGATCCTCAGGAATGTG | AATAAGCAAGCCCCGGTTCA |
| RNF144A-AS1 | CACACAGCAAGCTAGGA | ACTTTCCTTGCGAGGGTTGG |
| RDH10-AS1 | TGACTACAGCGAGCAACAGC | TCCACTGAGACGGAAACTGC |
| TRG-AS1 | CTCCTTCATTCCCTATTC | TTATGATGGCTACGATGT |
| ZMIZ1-AS1 | TCTCAAGGCTCCGCTAGTCT | TCACCTGCATCCCCCAATTC |
| GSN-AS1 | CCCATCAGCGGCTATCCAAA | TGGACATCGAGGAGGTCACT |
| ZNF528-AS1 | ACACTGGCCTTAG-TCCTCCA | CTGCGCTTGTTTTCAGGGTT |
| SLC16A1-AS1 | CCCTGGGAGGTAGGCCTTAT | TCTACCACCCTATGGGGCTC |
| GAPDH | GAAGGTGAAGGTCGGAGTC | GAAGATGGTGATGGGATTTC |
Table 2.
Characteristics of osteosarcoma patients who participated in this study.
| Patient ID | Tumour | Normal | Gender | Age of Diagnosis | Site of Tumour | Chemotherapy | Vital Status |
|---|---|---|---|---|---|---|---|
| Q17B029593M | A7 | A23 | Female | 26 | Femur | Yes | Died from disease at the age of 26 |
| Q17B045995J | A5 | A29 | Female | 78 | Femur | No | Died from disease at the age of 80 |
| Q18B006524D | A28 | A8 | Female | 74 | Illium | No | Died from disease at the age of 74 |
| Q18B009680H ’ | A1 | - | Male | 17 | Humerus | Yes | Died from disease at the age of 18 |
| Q18B009680H ’ | A12 | - | Male | 17 | Humerus | Yes | - |
| Q18B014955A | A15 | A23 | Female | 17 | Femur | Yes | Died from disease at the age of 18 |
| Q18B015603E * | A5 | - | Male | 26 | Femur | Yes | Alive no evidence of disease |
| Q18B015603E * | A52 | - | Male | 26 | Femur | Yes | - |
| Q18B018266Y | A1 | E1 | Male | 58 | T9-10 vertebra | Yes | Died from disease at the age of 58 |
| Q18B028621H | A4 | A1 | Male | 26 | Femur | Yes | Alive no evidence of disease |
| Q18B034715Y | A6 | A11 | Female | 19 | Femur | Yes | Alive with metastatic disease |
| Q18B051017F | A1 | A16 | Male | 69 | Femur | Yes | Died from disease at the age of 71 |
| Q19B001229R | A30 | A22 | Female | 13 | Femur | Yes | Alive no evidence of disease |
| Q19B005830Y | A2 | - | Male | 17 | Tibia | Yes | Alive no evidence of disease |
| Q19B007088F | B10 | B22 | Female | 17 | Tibia | Yes | Alive no evidence of disease |
| Q19B013567K ^ | A1 | - | Male | 63 | Femur | No | Died from disease at the age of 64 |
| Q19B013567K ^ | A12 | - | Male | 63 | Femur | No | - |
| Q19B021879L | A19 | A21 | Male | 17 | Tibia | Yes | Alive no evidence of disease |
| Q19B035672T | A1 | - | Male | 33 | Femur | Yes | Alive no evidence of disease |
| Q19B051495P | B19 | A2 | Female | 14 | Humerus | Yes | Alive no evidence of disease |
| Q19B052024A | B2 | B6 | Male | 36 | Femur | No | Alive no evidence of disease |
| Q17B018941H | A12 | B1 | Male | 36 | Tibia | Yes | Died from disease at the age of 37 |
| Q16B040208X | A33 | A25 | Male | 17 | Femur | Yes | Died from disease at the age of 18 |
| Q15B001034Y | A15 | B1 | Male | 19 | Femur | Yes | Died from disease at the age of 20 |
’, *, ^ were from the same patients that the tumours were removed at different times. In the Tumour and Normal section of the table, A and B with the numbers represent participants’ sample code.
Table 3.
The list of differentially expressed antisense lncRNAs transcripts with their corresponding log change values (log2FoldChange), p-value and padj (adjusted-p-value).
Table 3.
The list of differentially expressed antisense lncRNAs transcripts with their corresponding log change values (log2FoldChange), p-value and padj (adjusted-p-value).
| ENSEMBL | Symbol | Log2FC | p-Value | padj | Transcripts Name |
|---|---|---|---|---|---|
| ENSG00000225855.7 | RUSC1-AS1 | 4.556139 | 3.83E-05 | 0.008835 | RUSC1 antisense RNA 1 |
| ENSG00000267280.5 | TBX2-AS1 | 3.98406 | 0.001648 | 0.035197 | TBX2 antisense RNA 1 |
| ENSG00000268006.1 | PTOV1-AS1 | 3.833228 | 0.000187 | 0.017564 | PTOV1 antisense RNA 1 |
| ENSG00000246560.2 | UBE2D3-AS1 | 3.770542 | 0.003651 | 0.045301 | UBE2D3 antisense RNA 1 |
| ENSG00000233847.1 | ERCC8-AS1 | 3.385903 | 0.004691 | 0.048827 | ERCC8 antisense RNA 1 |
| ENSG00000224596.8 | ZMIZ1-AS1 | 3.366849 | 0.001591 | 0.035104 | ZMIZ1 antisense RNA 1 |
| ENSG00000228203.7 | RNF144A-AS1 | 3.300567 | 0.002698 | 0.041347 | RNF144A antisense RNA 1 |
| ENSG00000250295.6 | RDH10-AS1 | 3.227144 | 0.003145 | 0.043071 | RDH10 antisense RNA 1 |
| ENSG00000281103.2 | TRG-AS1 | 3.160751 | 0.001404 | 0.033432 | T cell receptor γ locus antisense RNA 1 |
| ENSG00000235865.2 | GSN-AS1 | 3.103048 | 0.002449 | 0.040134 | GSN antisense RNA 1 |
| ENSG00000197301.7 | HMGA2-AS1 | 2.912661 | 0.000946 | 0.030737 | HMGA2 antisense RNA 1 |
| ENSG00000269834.6 | ZNF528-AS1 | 2.774884 | 0.001737 | 0.03563 | ZNF528 antisense RNA 1 |
| ENSG00000253738.2 | OTUD6B-AS1 | 2.764901 | 0.001943 | 0.03686 | OTUD6B antisense RNA 1 |
| ENSG00000236088.10 | COX10-AS1 | 2.722786 | 0.004343 | 0.04782 | COX10 antisense RNA 1 |
| ENSG00000226419.8 | SLC16A1-AS1 | 2.427554 | 0.001752 | 0.03577 | SLC16A1 antisense RNA 1 |
Table 4.
Antisense lncRNAs and their type of overlap with sense RNA.
| Transcripts | Type of Overlap |
|---|---|
| RUSC1-AS1 | Head-to-head |
| TBX2-AS1 | Head-to-head |
| PTOV1-AS1 | Head-to-head |
| UBE2D3-AS1 | Embedded |
| ERCC8-AS1 | Embedded |
| ZMIZ1-AS1 | Head-to-head |
| RNF144A-AS1 | Head-to-head |
| RDH10-AS1 | Tail-to-tail |
| TRG-AS1 | Head-to-head |
| GSN-AS1 | Embedded |
| HMGA2-AS1 | Embedded |
| ZNF528-AS1 | Head-to-head |
| OTUD6B-AS1 | Head-to-head |
| COX10-AS1 | Head-to-head |
| SLC16A1-AS1 | Head-to-head |
Publisher’s Note: MDPI stays neutral with regard to jurisdictional claims in published maps and institutional affiliations. |
© 2021 by the authors. Licensee MDPI, Basel, Switzerland. This article is an open access article distributed under the terms and conditions of the Creative Commons Attribution (CC BY) license (https://creativecommons.org/licenses/by/4.0/).
Share and Cite
MDPI and ACS Style
Rothzerg, E.; Ho, X.D.; Xu, J.; Wood, D.; Märtson, A.; Kõks, S. Upregulation of 15 Antisense Long Non-Coding RNAs in Osteosarcoma. Genes 2021, 12, 1132. https://0-doi-org.brum.beds.ac.uk/10.3390/genes12081132
AMA Style
Rothzerg E, Ho XD, Xu J, Wood D, Märtson A, Kõks S. Upregulation of 15 Antisense Long Non-Coding RNAs in Osteosarcoma. Genes. 2021; 12(8):1132. https://0-doi-org.brum.beds.ac.uk/10.3390/genes12081132
Chicago/Turabian StyleRothzerg, Emel, Xuan Dung Ho, Jiake Xu, David Wood, Aare Märtson, and Sulev Kõks. 2021. "Upregulation of 15 Antisense Long Non-Coding RNAs in Osteosarcoma" Genes 12, no. 8: 1132. https://0-doi-org.brum.beds.ac.uk/10.3390/genes12081132
Note that from the first issue of 2016, this journal uses article numbers instead of page numbers. See further details here.