Prediction of Genetic Resistance for Scrapie in Ungenotyped Sheep Using a Linear Animal Model


1
Centre for Genetic Improvement of Livestock, Department of Animal Biosciences, University of Guelph, 50 Stone Road East, Guelph, ON N1G 2W1, Canada
2
Ontario Ministry of Agriculture, Food and Rural Affairs, 6484 Wellington Road 7, Elora, ON N0B 1S0, Canada
*
Author to whom correspondence should be addressed.
Genes 2021, 12(9), 1432; https://0-doi-org.brum.beds.ac.uk/10.3390/genes12091432
Submission received: 27 July 2021
/
Revised: 19 August 2021
/
Accepted: 14 September 2021
/
Published: 17 September 2021
(This article belongs to the Special Issue Animal Domestication and Breeding)
Abstract
:Selection based on scrapie genotypes could improve the genetic resistance for scrapie in sheep. However, in practice, few animals are genotyped. The objectives were to define numerical values of scrapie resistance genotypes and adjust for their non-additive genetic effect; evaluate prediction accuracy of ungenotyped animals using linear animal model; and predict and assess selection response based on estimated breeding values (EBV) of ungenotyped animals. The scrapie resistance (SR) was defined by ranking scrapie genotypes from low (0) to high (4) resistance based on genotype risk groups and was also adjusted for non-additive genetic effect of the haplotypes. Genotypes were simulated for 1,671,890 animals from pedigree. The simulated alleles were assigned to scrapie haplotypes in two scenarios of high (SRh) and low (SRl) resistance populations. A sample of 20,000 genotyped animals were used to predict ungenotyped using animal model. Prediction accuracies for ungenotyped animals for SRh and SRl were 0.60 and 0.54, and for allele content were from 0.41 to 0.71, respectively. Response to selection on SRh and SRl increased SR by 0.52 and 0.28, and on allele content from 0.13 to 0.50, respectively. In addition, the selected animals had large proportion of homozygous for the favorable haplotypes. Thus, pre-selection prior to genotyping could reduce genotyping costs for breeding programs. Using a linear animal model to predict SR makes better use of available information for the breeding programs.
1. Introduction
In the typical form of scrapie, the risk of infection is determined by variation in amino acid sequence encoded in the PrP gene [1,2,3,4]. There are five common haplotypes (ARR, AHQ, ARH, ARQ, and VRQ) associated with the scrapie risk of infection; in which the haplotype ARR is associated with lowest risk, and the haplotype VRQ is associated with highest risk of scrapie infection [2,5,6,7]. Other additional haplotypes have been observed in sheep, but due to their extreme rarity were not considered important for breeding programs [2,8]. A total of 15 common possible genotype combinations are associated with five risk groups (R1, R2, R3, R4, and R5), in which R1 genotypes are associated with low risk for scrapie infection (i.e., the most favorable genotypes) and R5 are associated with highest risk of infection [3,8,9]. Due to the association of genotypes with the risk of scrapie, the use of genotyping for breeding programs is appealing for scrapie eradication programs [5,8,10,11]. However, in practice, not all animals are being genotyped with breeding rams, which are more likely to be genotyped than ewes. Thus, genotypic information is limited, as only a small fraction of the total sheep population is genotyped. Gengler et al. [12] proposed the use of a practical method to predict the allele content of bi-allelic locus in ungenotyped animals by using the Best Linear Unbiased Predictor (BLUP), in which the number of observed alleles in the genotype (0, 1, or 2) are used as a response variable, assuming complete heritability.
Selection based on risk group of the genotypes could be practiced [3,5,8,9]. However, the genotypes corresponding to the risk groups do not act additively. For animal breeding purposes, the additive genetic effect is important since offspring inherit the alleles, rather than the genotype. There is no study that accounts for the non-additivity of risk groups corresponding to the genotypes. Therefore, adjusting for the non-additive effect is needed to account for the differences in contribution of the five different haplotypes alleles to scrapie resistance in sheep.
The objectives of this research were to: (1) define numeric values of scrapie resistance genotypes and adjust them for their non-additive genetic effect; (2) evaluate the accuracy of using BLUP for prediction of scrapie resistance and allele content of ungenotyped animals; and (3) predict selection response and assess the change of genetic merit of selected ungenotyped animals based on estimated breeding value. The hypothesis of this research was that it is possible use a linear animal model for genetic evaluation and selection of ungenotyped sheep for scrapie resistance based on a small proportion of genotyped animals.
2. Materials and Methods
2.1. Adjusting the Genetic Resistance to Scrapie for Non-Additive Genetic Effect
The numeric value of scrapie resistance genotypes was defined by ranking the scrapie genotypes from 0 (most susceptible) to 4 (most resistant), which were based on risk levels previously presented in literature [3,8,9] (see Table 1). The additive genetic effect of a haplotype was calculated as half of the homozygous resistance value relative to the most susceptible haplotype (VRQ), which was set to 0. The assumed additive genetic effect for scrapie resistance (SR) for each haplotype is shown in Table 1, along with the adjusted scrapie resistance (SR) genotypes for the non-additive genetic effects for all possible 15 genotypes, which were created by summing the additive genetic effects of the haplotypes. This step is important, as non-additive genetic effects were present. For example, the most susceptible haplotype VRQ is completely dominant over the haplotypes ARH and ARQ. Thus, genotypes VRQ/VRQ, ARH/VRQ, and ARQ/VRQ, have the same scrapie resistance level equal to 0 and are in the same risk group of R5, which is different from the risk group for the homozygous haplotypes ARH and ARQ. For animal breeding and genetic improvement purposes, additive genetic effects are more important than the non-additive genetic effects, as are transmitted to the next generation. Therefore, SR needs to be adjusted for non-additive genetic effects.
2.2. Simulated Data
A pedigree containing 1,671,890 sheep from the GenOvis database (www.genovis.ca; Guelph, ON, Canada accessed on 9 June 2017) was used to simulate genotypes at a single locus with five alleles resulting in 15 possible common genotypes. The genotype frequencies resulting from the simulation are shown in Table 2. The simulated alleles were assigned to scrapie haplotypes to create two population, high-SR, or low-SR, assuming high and low frequencies for the most resistant haplotype (ARR), respectively (Table 3). A total of 20,000 animals were randomly chosen (out of 1,671,890 individuals) to have genotype records in the study with all other animals assumed to be ungenotyped. Basic descriptive statistics of SR (0–4) in the two populations of high and low SR (SRh and SRl, respectively) and the allele content (0, 1, or 2) for the haplotypes (Hc1, Hc2, Hc3, Hc4, and Hc5) are presented in Table 4 and Table 5, for whole population (n = 1,671,890) and the randomly chosen animals (n = 20,000) that had their genotypic information available (tested animals), respectively.
2.3. Prediction of Scrapie Resistance and Haplotype Gene Content Using the Animal Model
The scrapie resistance phenotypes (SRh and SRl) and haplotype allele contents (Hc1, Hc2, Hc3, Hc4, and Hc5) where predicted for the ungenotyped animals using the observed records of the 20,000 genotyped animal using ASREML [13] and the following univariate linear animal model:
where, : record of the ith animal for the trait being analyzed (SRh, SRl, Hc1, Hc2, Hc3, Hc4, or Hc5); : Overall mean trait : additive genetic effect of the ith animal; and : residual error.
The variance and covariance matrix for the univariate analysis was:
where, : is the additive genetic variance for the analyzed trait; : is the residual variance; is the additive relationship matrix; and is an identity matrix.
The heritability was assumed to be almost complete (h2 = 0.99), thus assuming a negligible residual. In order to estimate breeding values (EBV) for all animals (including the ungenotyped with no genotyped relatives) in the pedigree, unknown parents were assigned to genetic group based on sex and breed.
Accuracy of prediction for the ungenotyped individuals was evaluated using Pearson’s correlation between the EBV for SR or haplotype allele content and the true genetic value for all ungenotyped animals.
2.4. Selection Response
The responses to selection were predicted for ungenotyped animals by assuming that animals with breeding values ≥ mean would be selected, which makes the selection intensity equal to 0.798 [14], as follows:
where, is the predicted selection response for trait T (i.e., SRh, SRl or haplotype allele contents (Hc1, Hc2, Hc3, Hc4, and Hc5); is thecorrelation between the predicted breeding value for the ungenotyped animals for trait T and the true genetic values for trait T; and is the additive genetic standard deviation for trait T, which is essentially equal to standard deviation of trait T, assuming a trait h2 = 0.99 (see Table 4).
The difference in genetic merit between the original population and selected animals that had EBV ≥ mean EBV was calculated for the ungenotyped animals as:
where, is the difference in true genetic merit for trait T (i.e., SRh, SRl or haplotype allele contents (Hc1, Hc2, Hc3, Hc4, and Hc5)) between selected () and unselected () animals.
In addition, selection based on EBV was performed at different selection truncation points (−1.282, −0.842, −0.525, −0.253, 0.000, +0.253, +0.525, +0.842, and +1.282) to assess: (1) the proportion of animals selected at different truncation point; (2) the proportion of recovered homozygous from ungenotyped animals among the selected animals (i.e., number of homozygous among the selected animals/number of homozygous among unselected animals) at different truncation point; (3) allele frequencies at different selection truncation points; and (4) homozygous genotype frequencies at different selection truncation points.
3. Results
3.1. Accuracies for Prediction of Scrapie Resistance and Haplotype Gene Content Using the Animal Model
The Pearson’s correlation coefficients between EBV and the trait true genetic value are shown in Table 6 for ungenotyped animals. The correlation between the EBV and the trait true genetic values (on diagonal) represents the accuracies of direct selection. Accuracies of prediction ranged from 0.41 to 0.71. Accuracy of predicting SRh for ungenotyped individuals was high 0.60. In addition, the predicted SRh was positively correlated (r = 0.58) with the most favorable haplotype in this analysis ARR (H1), and negatively correlated with the other haplotypes (H2, H3, H4, and H5 corresponding to AHQ, ARH, ARQ, and VRQ, respectively). The correlation between predicted allele content for ARR (Hc1) with its true content and SRh was 0.71 and 0.47, respectively. This means that selection based on SRh is expected to increase SR and ARR allele content, while decreasing the allele content for other haplotypes (i.e., AHQ, ARH, ARQ, and VRQ). On the other hand, prediction of SRl was less accurate when predicting the true SRl (r = 0.54) compared to SRh, and was negatively associated with the least favorable allele in this scenario, i.e., H1 (VRQ), while positively correlated with the other haplotypes (i.e., ARQ, ARH, AHQ, and ARR). This means that selection for SRl will increase SR by replacing ARR by the other haplotypes in the population.
3.2. Selection Response
3.2.1. Predicted Selection Response
Table 7 presents the predicted selection response per generation for scrapie resistance based on selecting animals with EBV ≥ mean EBV for SRh, SRl and the haplotype allele contents (Hc1, Hc2, Hc3, Hc4, and Hc5) for ungenotyped animals (i.e., a selection intensity = 0.798). Selection of SRh EBV was predicted to increase scrapie resistance by 0.46 and ARR (Hc1) allele content by 0.36, and decrease the other haplotype allele contents (i.e., for AHQ, ARH, ARQ, VRQ). Selection for Hc1 EBV was predicted to increase the SRh by 0.36 and ARR (Hc1) allele content by 0.44, and decrease the other haplotypes allele contents. On the other hand, in the low resistance population (low-SR), direct selection for SRl EBV was predicted to increase SR by 0.33 and increase the allele content of haplotypes ARQ, ARH, AHQ, and ARR, while decreasing the allele content of the most unfavorable haplotype VRQ. Compared to VRQ, selection for the other haplotypes was predicted to be slower, reflecting their lower accuracies of prediction (Table 6) and lower standard deviations (Table 5), which are dependent on the allele frequencies.
3.2.2. Difference in Genetic Merit between Selected and Unselected Animals
Table 8 presents the difference in true genetic merit when animals were selected if their EBV was ≥ mean (selection intensity = 0.798). The true response was slightly different from the predicted response (Table 7). This shows that genetic improvement for SR is possible for ungenotyped animals using predictions from a linear animal model and the achieved improvement is similar to the predicted selection response. The difference in genetic merit when all animals were genotyped and selected based on true values (SR or allele contents) ≥ mean are presented on Table 9. In high-SRh population, selection increased SRh by 0.64 and increased the allele content of ARR (Hc1) and AHQ (Hc2) by 0.29 and 0.16, respectively. On the other hand, in a low-SR population, selection increased SRl by 0.71 accompanied of a decrease in allele content of VRQ (Hc1) by 0.74, while increasing haplotype allele contents for ARQ (Hc2), ARH (Hc3), AHQ (Hc4), and ARR (Hc5) by 0.33, 0.13, 0.15, and 0.13, respectively. As expected, when all animals were genotyped, there is a higher gain than when only a fraction of the animals was genotyped for scrapie (Table 8). Table 10 presents the relative gain from having a fraction of genotyped animals compared to having all animals genotyped. The relative gain ranged between 13.2% and 95.0%, which is higher for higher allele frequency haplotypes than for low allele frequency haplotypes and higher for high-SR population compared low-SR population. Likewise, in the case of haplotype allele content, the relative gain was higher for high allele frequencies than for low allele frequencies. In practice, not all animals are being genotyped. Therefore, using an animal model can be practical and beneficial by adding extra information in an eradication program for scrapie in sheep. In addition, even considering the lowest relative gain of 13.2% (Table 10), it still would be beneficial, as the number of animals genotyped were a fraction of the whole population (i.e., 20,000 out of 1,671,890 animals).
3.2.3. Effect of Selection at Different Selection Truncation Points
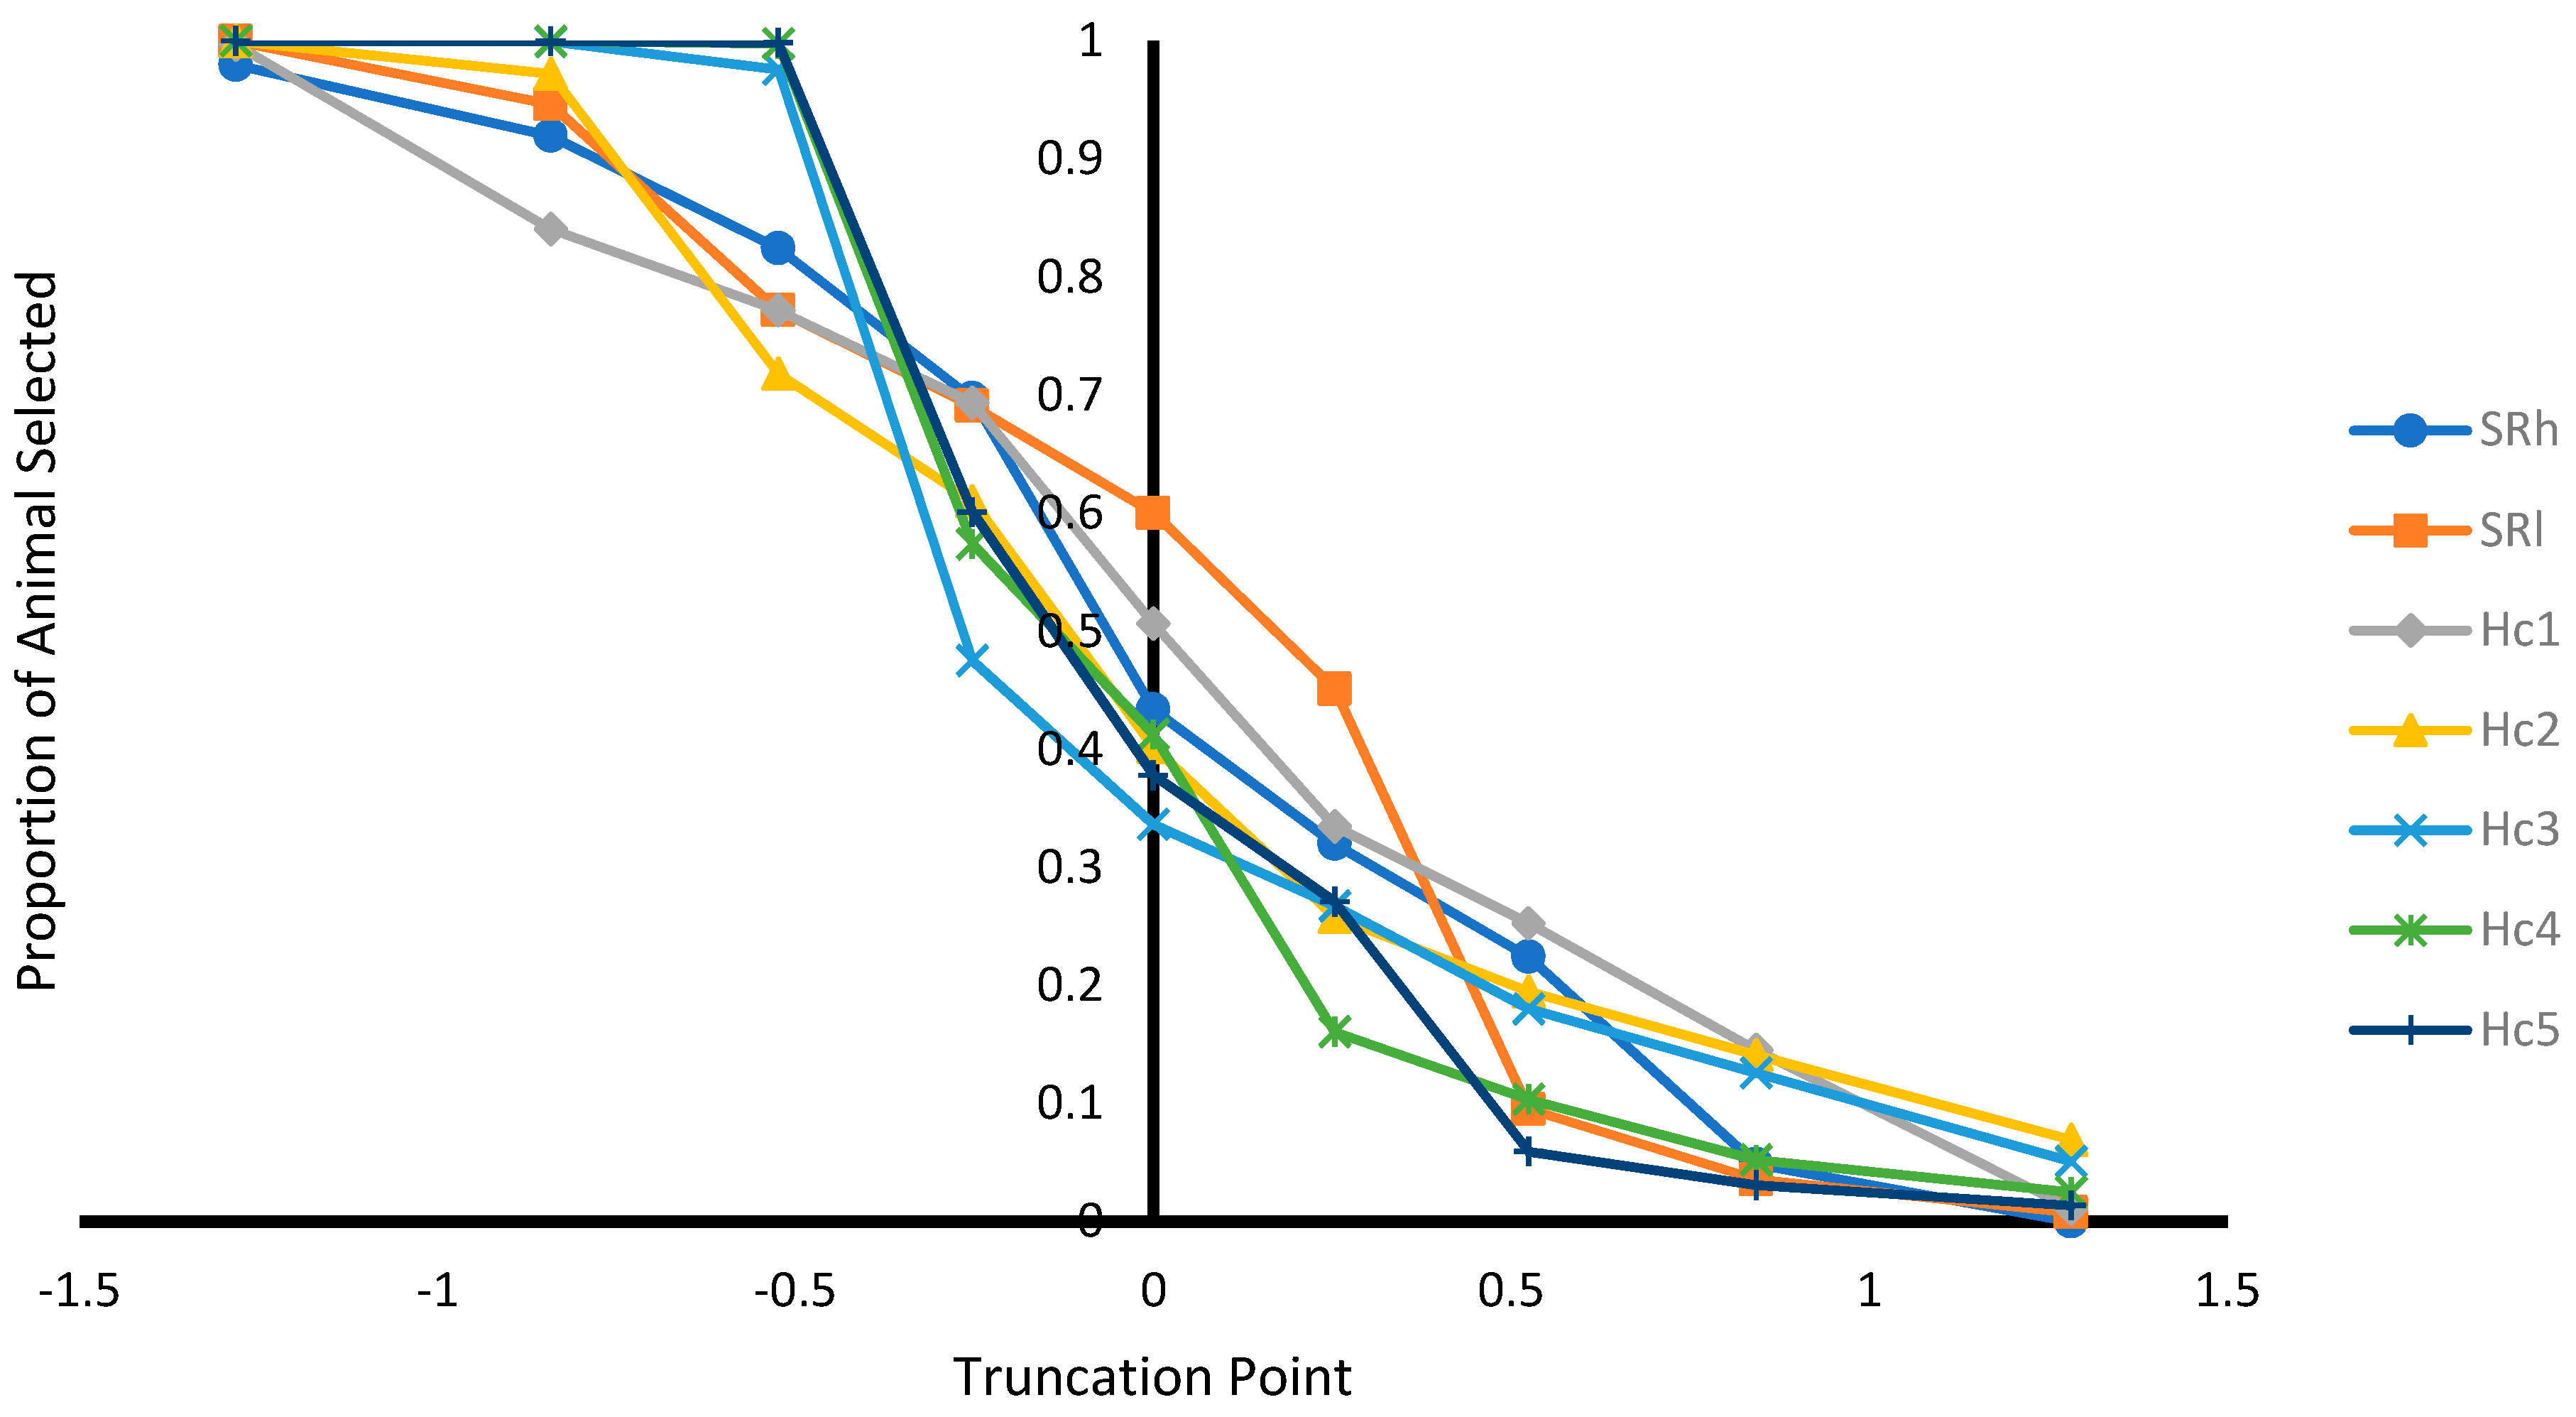
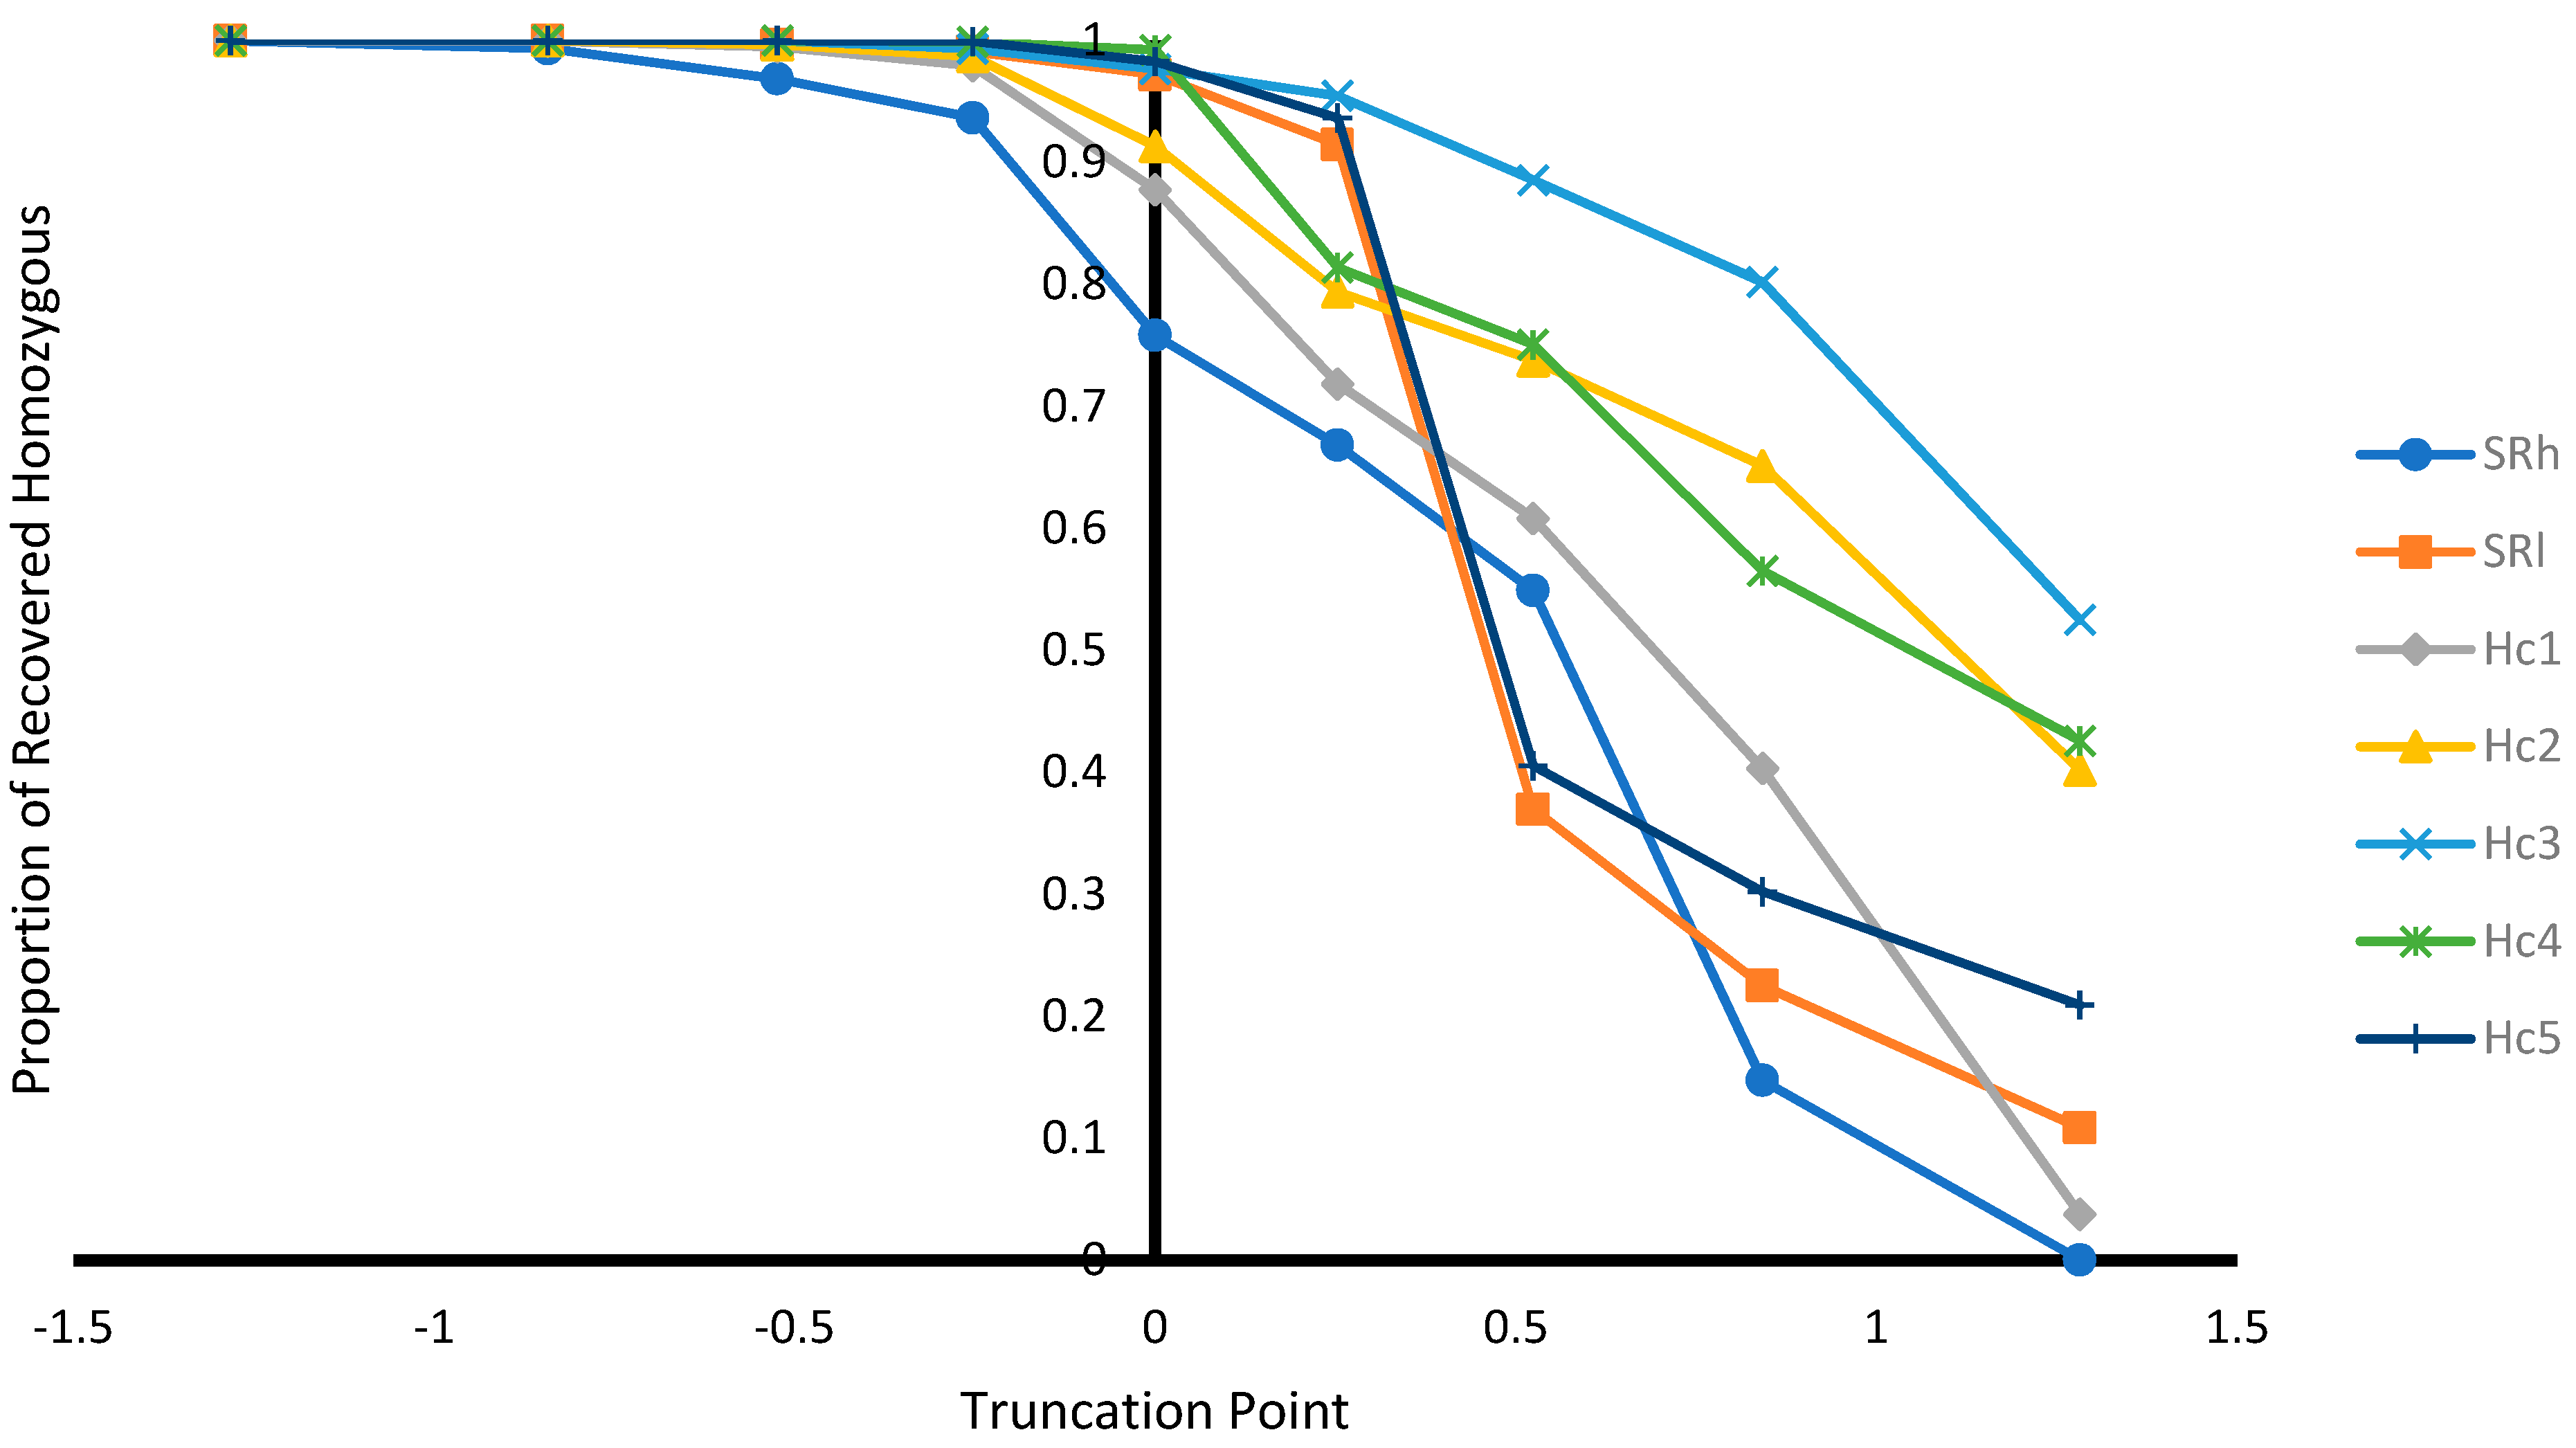
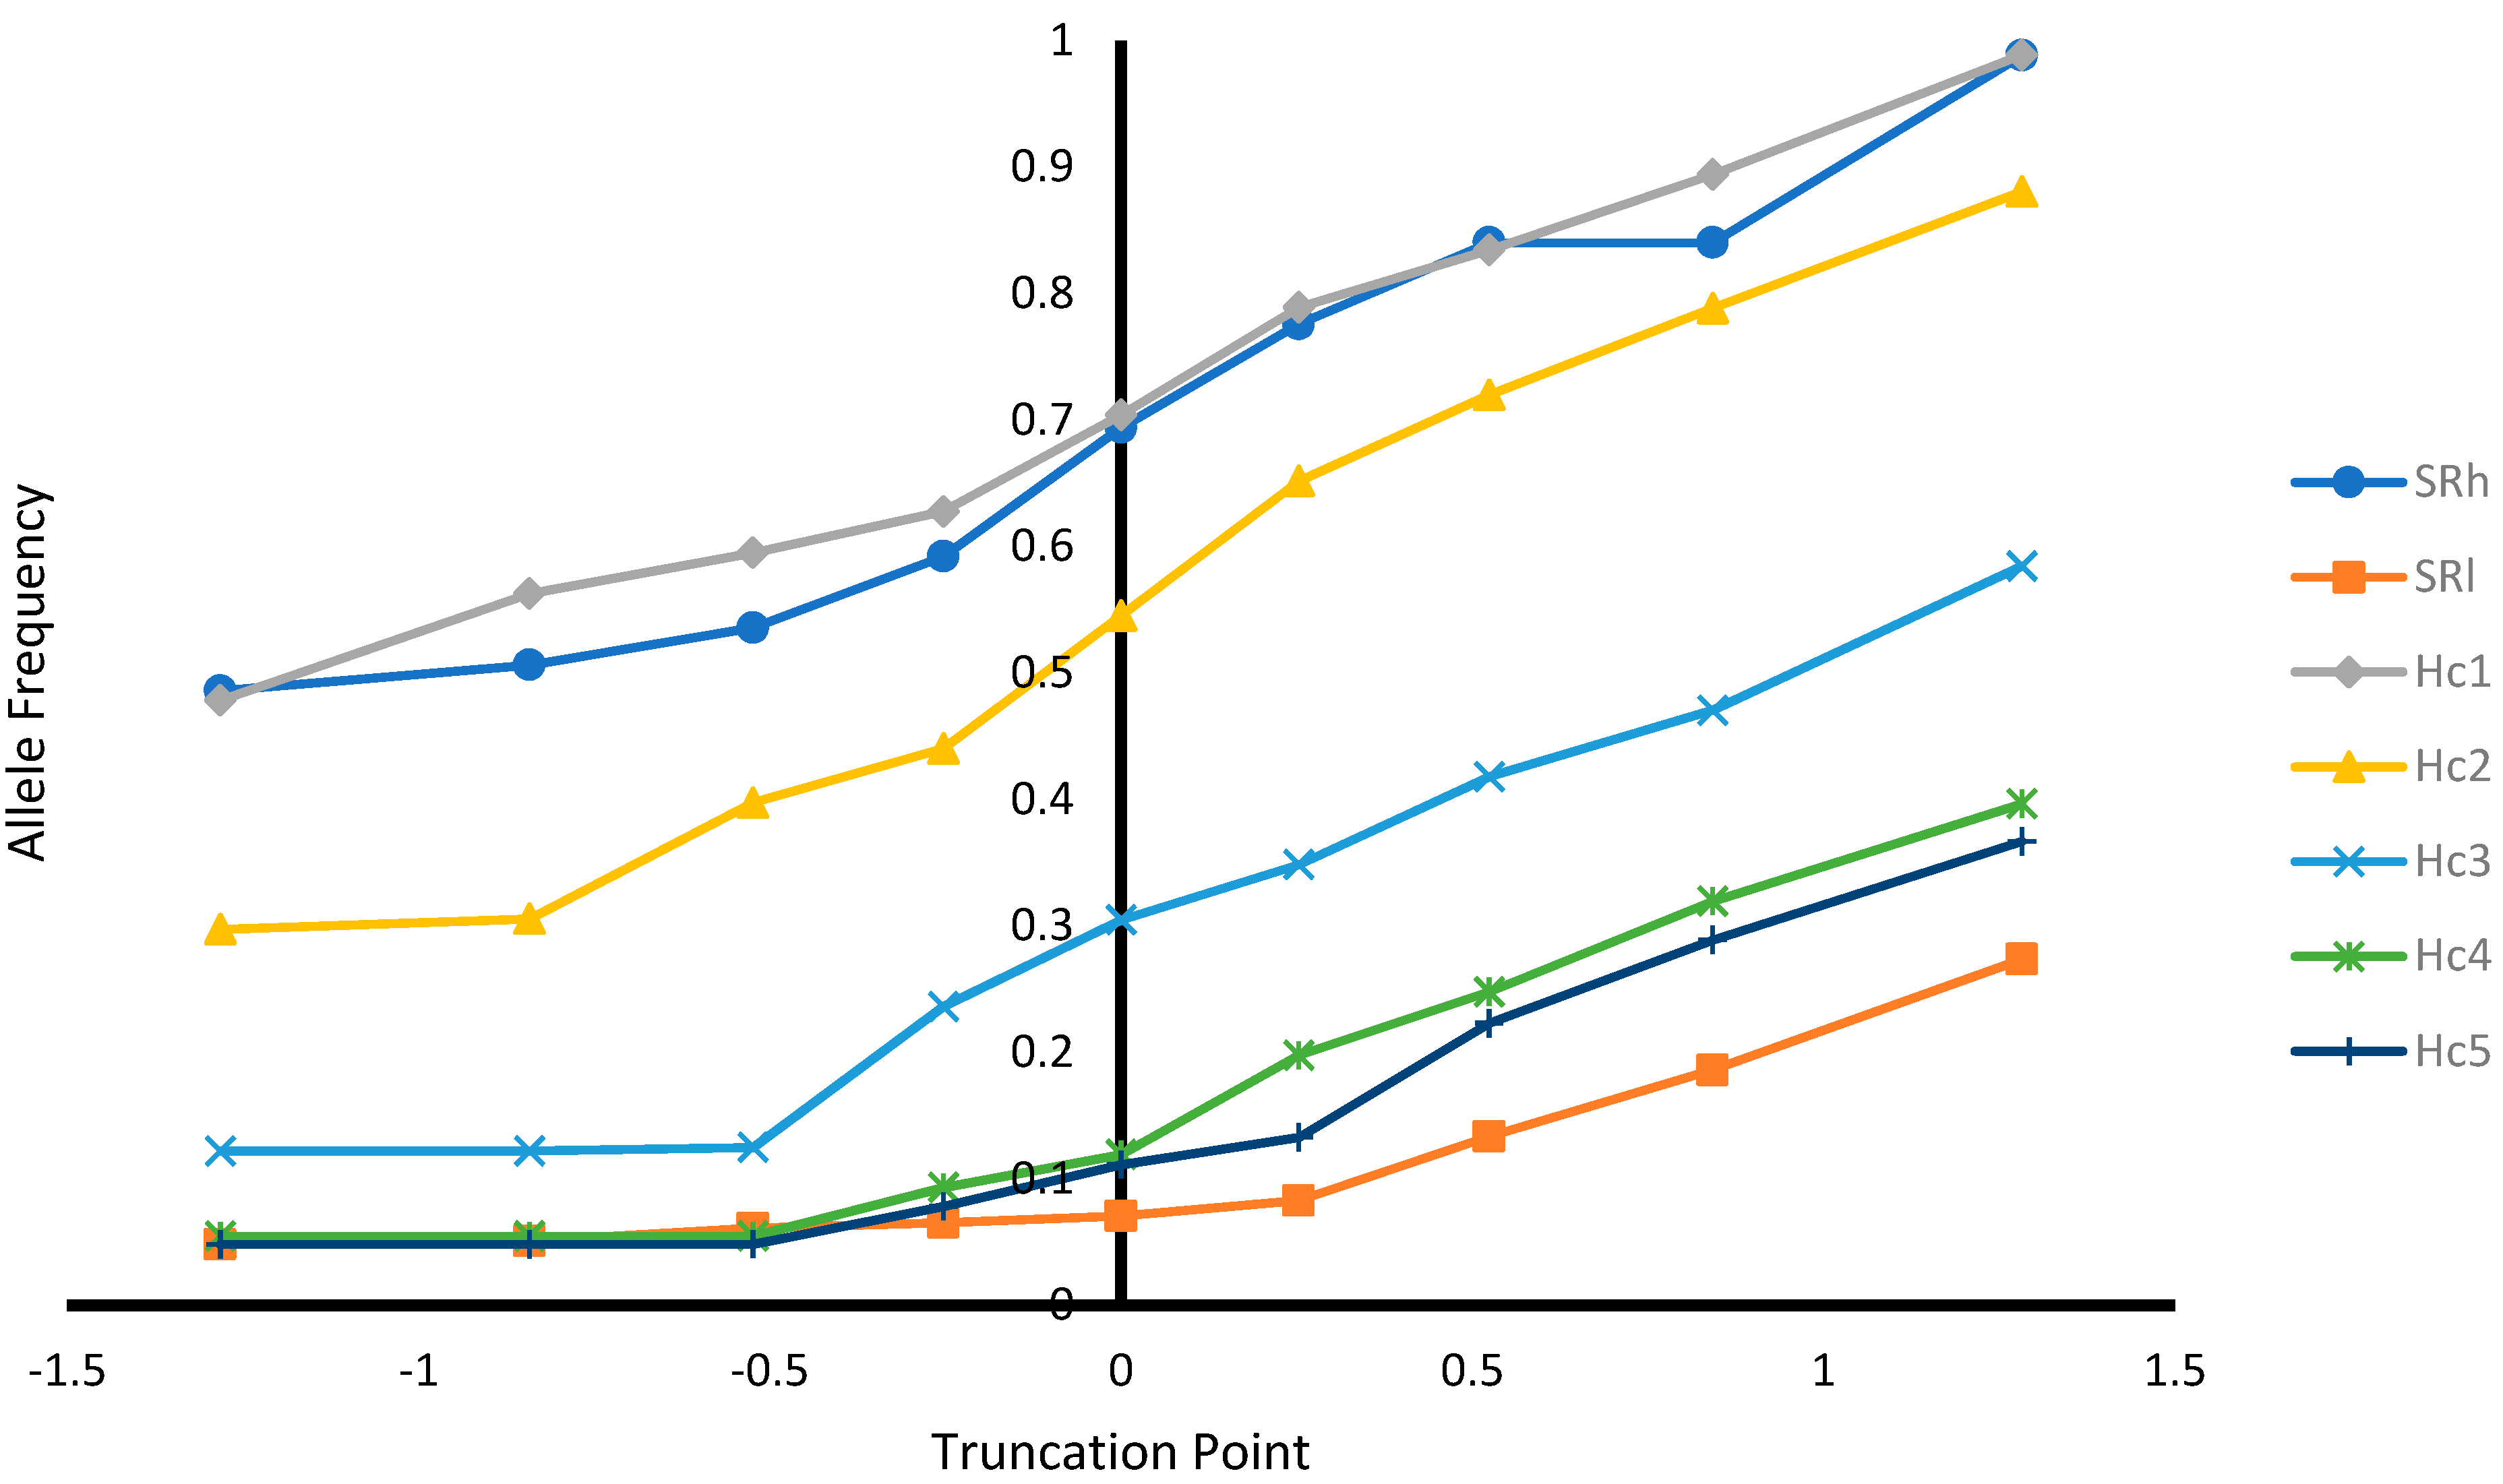
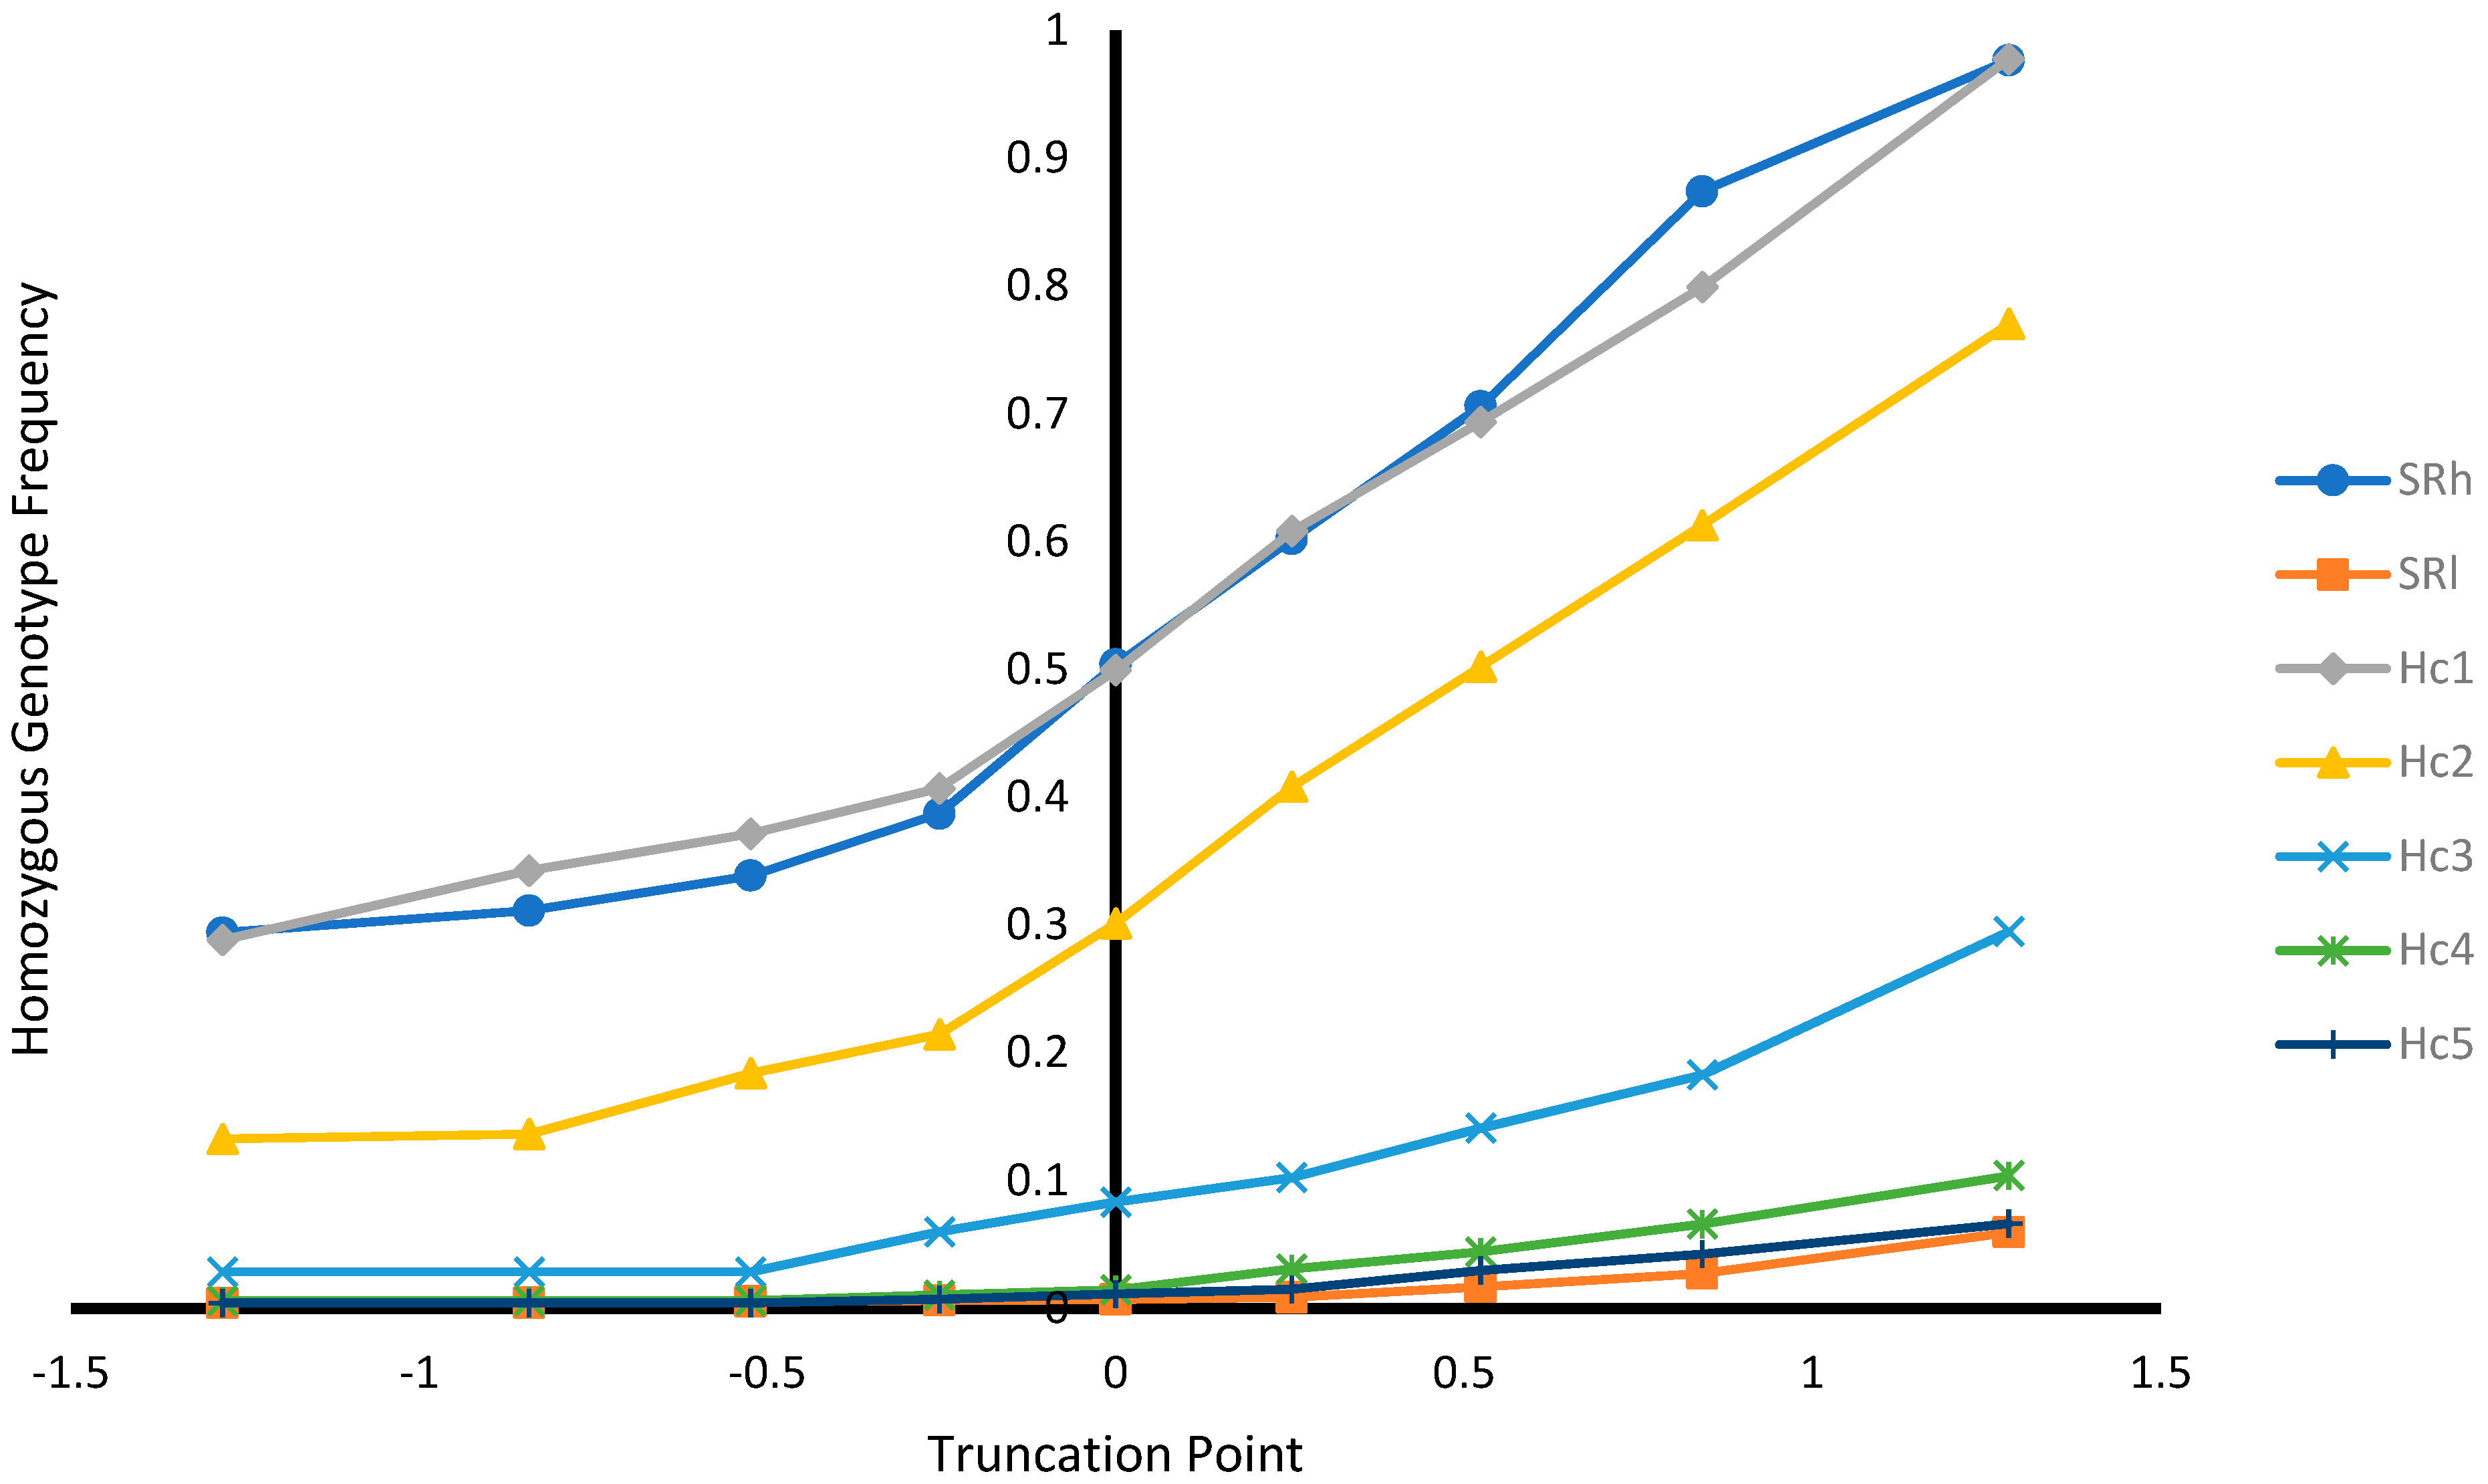
As expected, as the selection truncation point increased, the proportion of selected (Figure 1) and the recovered homozygous from the ungenotyped population (Figure 2) for the targeted haplotype allele decreased. On the contrary, as the selection truncation point increased, the allele frequency (Figure 3) and the homozygous frequency (Figure 4) for the targeted haplotype allele increased. Selecting animals based on their EBV being ≥ mean EBV resulted in selecting between 33.6% and 60.0% individuals (Figure 1) and recovering between 75.8 to 99.2% of homozygous genotypes (Figure 2). Assuming H1 as the favorable haplotype allele (i.e., ARR), selection based on Hc1 EBV ≥ mean EBV resulted in selecting 50.7% from the population and recovering a total of 87.7% of the target homozygous genotype (ARR/ARR). This means that by pre-selecting 50.7% of individuals based on EBV for allele content for genotyping, 87.7% of homozygous genotypes could be captured from the original population. Thus, this would reduce the number of animals required for genotyping. In the case of low ARR allele frequency (i.e., H5), when pre-selecting based on EBV for allele content ≥ mean EBV, the number of individuals required for genotype validation was reduced to 37.8% (Figure 1), while recovering 98.3% (Figure 2) of homozygous genotype (ARR/ARR) from the original population. Thus, the genotyping cost could be reduced even more.
4. Discussion
The accuracy for prediction of haplotype allele contents ranged between 0.41 and 0.71 (Table 6). Gengler et al. [12], who first proposed the allele content model, used it for the myostatin gene in Belgium blue cattle, with prediction accuracies between 0.47 and 0.50. In another study in Canadian Holstein cattle, the prediction accuracy for allele content was as high as 0.93 [15]. Legarra and Vitezica [16] reported accuracies between 0.52 and 0.56 using the allele content model. The allele content model can be applicable for prediction in bi-allelic major genes, such as for maedi-visna [17] and for litter size [18]. Applying allele content model to scrapie as first proposed by Gengler et al. [12] is possible when only considering the number ARR haplotypes and disregarding the importance of the other haplotypes. However, the PrP gene underlying scrapie phenotypes is multi-allelic with different contributions from the different haplotypes to the level of scrapie resistance in sheep [3,8,9]. In this study, the different contributions of haplotypes in the SR genotypes were considered by defining numeric values for SR and adjusting them to non-additive genetic effects prior to their use in the linear animal model. The accuracy for prediction of SR in high and low SR populations were 0.60 and 0.54, respectively. There were no previous studies that considered the same approach to construct the SR values to compare to.
Selection response on SR and allele content was predicted for ungenotyped sheep (Table 7). The selection response depends on selection intensity, accuracy, and the additive genetic standard deviation [14]. The differences between the trait prediction accuracies (Table 6) and the additive genetic standard deviations (Table 4) explain the differences in predicted responses. Selecting ungenotyped animals with EBV ≥ mean resulted in increase in genetic merit for SR and allele content (Table 8) and increased favorable haplotype allele frequency (Figure 3). Breeding programs for genetic improvement for SR involve selection based on scrapie genotypes. Such breeding programs were successful in increasing ARR frequency and SR in Czech Republic [8], Netherland [19,20], Belguim [21], and Hungary [5]. However, in all previous studies, the genetic change was limited to the animals being genotyped. In this research, the genetic improvement for SR was possible for the ungenotyped animals when using predictions from a linear animal model.
Selecting ungenotyped animals with EBV ≥ mean resulted in reduction of number of animals compare to unselected population (Figure 1), while capturing large proportion of homozygous genotypes from the unselected population (Figure 2). The increase of selection truncation point resulted in increased frequency for homozygous genotypes (Figure 4), while decreasing the proportion of animals selected from the population (Figure 1). In the breeding program in Netherlands, genotyping for selection of ARR/ARR rams was compulsory between the year 2004 and 2007 [20]. Genotyping to identify homozygous (ARR/ARR) rams is important for breeding purposes, as they are 100% guaranteed to transmit the ARR allele to their progeny. The use of linear animal model provides another tool to reduce the number of genotyped animals by pre-selecting based on EBV prior to genotyping. The pre-selected animals with EBV ≥ mean include a large proportion of ARR/ARR genotypes from the unselected population (Figure 2). Without pre-selection, 100% of the animals in the population must be genotyped in order to identify all the ARR/ARR animals in the population. When animals with EBV ≥ mean were pre-selected, smaller proportion (34–60%) would need to be genotyped in order to identify a large proportion (76–99%) of ARR/ARR animals (Figure 1 and Figure 2). Thus, genotyping cost for identifying most of the ARR/ARR animals in the population could be reduced. As pre-selection truncation point increases, the proportion of animal selected decreases (Figure 1), but the frequency of ARR/ARR animals among the selected animals increases (Figure 4). Thus, pre-selecting at higher truncation point would identify large proportion of ARR/ARR among the selected animals, thus saving genotyping cost to confirm the homozygous ARR/ARR status of the animals.
Breeding programs can contribute to the reduction of prevalence of the typical form of scrapie in sheep. Arnold and Rajamyagam [22] estimated an annual reduction of 28% in scrapie prevalence cases between 2005 and 2019 in Great Britain. Hagenaars et al. [20] reported a trend for reduction of scrapie prevalence in active scrapie surveillance in Netherland between the years 2002 and 2008. They reported 0% typical scrapie cases in genotypes with risk levels R1 and R2. The current study showed that selecting ungenotyped sheep based on EBV could increase SR (Table 7 and Table 8) and ARR allele frequency and its homozygous genotype frequency (Figure 3 and Figure 4), what could reduce typical scrapie prevalence in sheep. However, the atypical form of scrapie (Nor98) could occur in sheep that are resistant to typical scrapie [23]. However, Nor98 scrapie type is believed to be a spontaneous disease and it is unlike to be naturally contagious among sheep and, thus, its prevalence is low [24,25]. Therefore, a well-established breeding program for the typical scrapie can contribute to the reduction of scrapie prevalence.
This research proposed the use of a linear animal model as a practical method for genetic evaluation and selection for SR of ungenotyped sheep. Different scrapie eradication strategies used in breeding programs were described in previous studies. For instance, Arnold et al. [26] proposed genotyping purebred rams in the nucleus flocks used for cross-breeding and selecting the homozygous ARR/ARR and the carriers (ARR/ARQ, ARR/ARH, and ARR/AHQ) rams at the pure breeding level. Molina et al. [3] compared different strategies in Spanish Merinos. They concluded that the optimum strategy was to genotype rams and eliminate ARQ/ARQ and VRQ carriers. According to Gáspárdy et al. [5], in the Hungarian national breeding program, rams are genotyped and only rams at risk groups (R1, R2, and R3) are allowed to breed. In all previous studies, the genetic selection for SR was limited to the animals genotyped. This study has shown that a linear animal model can be used to provide additional information for ungenotyped animals, which will be particularly useful wherever genotyping for scrapie is not intensively practiced. Therefore, the use of an animal model could make better use of the available information to enhance breeding programs for the genetic improvement for SR in sheep.
5. Conclusions
Moderate to highly accurate estimated breeding values for scrapie resistance and haplotype allele content for ungenotyped animals can be obtained from a linear animal model using genotype data from only a fraction of the total sheep population. Thus, selecting ungenotyped animals based on EBV could result in effective genetic gains for scrapie resistance and allele content. Individuals with EBV ≥ mean were shown to carry a large proportion of homozygous genotypes. Thus, pre-selection prior to genotyping could reduce the number of animals needed to be genotyped to identify individuals with the favorable homozygous genotypes in the population and, consequently, reduce the genotyping cost. Therefore, a linear animal model could make better use of the available information for genetic improvement of scrapie resistance in sheep.
Author Contributions
M.B. was responsible for the conceptualization, experimental design, data analysis, and manuscript writing. A.C. and F.S., were involved in experimental design and theoretical discussions. F.S., D.K. and A.C. were involved in manuscript writing. A.C. was responsible for supervision and funding acquisition. All authors have read and agreed to the published version of the manuscript.
Funding
This study was funded by the Ontario Agri-Food Innovation Alliance [Ontario Ministry of Agriculture, Food and Rural Affairs (OMAFRA)], grant number UG-T1-2020-100261 and UofG2016-2657 (Guelph, ON, Canada), Ontario Sheep Farmers, grant number 053552 (Guelph, ON, Canada), and Natural Sciences and Engineering Research Council of Canada (Ottawa, ON, Canada). This study is also a contribution to the Food from Thought research program supported by the Canada First Research Excellence Fund. Mohammed N. Boareki’s PhD program was funded by the Kuwait Institute for Scientific Research (KISR).
Institutional Review Board Statement
Not applicable.
Informed Consent Statement
Not applicable.
Data Availability Statement
Not applicable.
Acknowledgments
Not applicable.
Conflicts of Interest
The authors declare no conflict of interest.
References
- Lacroux, C.; Simon, S.; Benestad, S.L.; Maillet, S.; Mathey, J.; Lugan, S.; Corbière, F.; Cassard, H.; Costes, P.; Bergonier, D.; et al. Prions in milk from ewes incubating natural scrapie. PLoS Pathog. 2008, 4, e1000238. [Google Scholar] [CrossRef] [Green Version]
- Goldmann, W. Classic and atypical scrapie a genetic perspective. In Handbook of Clinical Neurology; Elsevier B.V.: Amsterdam, The Netherlands, 2018; Volume 153, pp. 111–120. ISBN 9780444639455. [Google Scholar]
- Molina, A.; Juárez, M.; Rodero, A. Merino sheep breed’s genetic resistance to Scrapie: Genetic structure and comparison of five eradication strategies. Prev. Vet. Med. 2006, 75, 239–250. [Google Scholar] [CrossRef]
- Monleón, E.; Monzón, M.; Hortells, P.; Bolea, R.; Acín, C.; Vargas, F.; Badiola, J.J. Approaches to scrapie diagnosis by applying immunohistochemistry and rapid tests on central nervous and lymphoreticular systems. J. Virol. Methods 2005, 125, 165–171. [Google Scholar] [CrossRef] [PubMed]
- Gáspárdy, A.; Holly, V.; Zenke, P.; Maróti-Agóts, Á.; Sáfár, L.; Papp, Á.B.; Kovács, E. The response of prion genic variation to selection for scrapie resistance in Hungarian indigenous sheep breeds. Acta Vet. Hung. 2018, 66, 562–572. [Google Scholar] [CrossRef] [PubMed]
- Hagenaars, T.J.; Melchior, M.B.; Windig, J.J.; Bossers, A.; Davidse, A.; van Zijderveld, F.G. Modelling of strategies for genetic control of scrapie in sheep: The importance of population structure. PLoS ONE 2018, 13, e0195009. [Google Scholar] [CrossRef] [PubMed]
- Ptacek, M.; Ducháček, J. Genetic resistance against scrapie disease related to lamb growth performance traits. Sci. Agric. Bohem. 2019, 50, 8–14. [Google Scholar] [CrossRef] [Green Version]
- Stepanek, O.; Horin, P. Genetic diversity of the prion protein gene (PRNP) coding sequence in Czech sheep and evaluation of the national breeding programme for resistance to scrapie in the Czech Republic. J. Appl. Genet. 2017, 111–121. [Google Scholar] [CrossRef] [PubMed]
- Álvarez, I.; Royo, L.J.; Gutiérrez, J.P.; Fernández, I.; Arranz, J.J.; Goyache, F. Genetic diversity loss due to selection for scrapie resistance in the rare Spanish Xalda sheep breed. Livest. Sci. 2007, 111, 204–212. [Google Scholar] [CrossRef] [Green Version]
- Ortiz-Pelaez, A.; Bianchini, J. The impact of the genotype on the prevalence of classical scrapie at population level. BMC Vet. Res. 2011, 42, 31. [Google Scholar] [CrossRef] [Green Version]
- Kao, R.R.; Gravenor, M.B.; McLean, A.R. Modelling the national scrapie eradication programme in the UK. Math. Biosci. 2001, 174, 61–76. [Google Scholar] [CrossRef]
- Gengler, N.; Mayeres, P.; Szydlowski, M. A simple method to approximate gene content in large pedigree populations: Application to the myostatin gene in dual-purpose Belgian Blue cattle. Animal 2007, 1, 21–28. [Google Scholar] [CrossRef] [Green Version]
- Gilmour, A.R.; Gogel, B.J.; Cullis, B.R.; Welham, S.J.; Thompson, R. ASReml User Guide Release 4.1; VSN International Ltd: Hemel Hempstead, UK, 2015; ISBN 1904375235. [Google Scholar]
- Falconer, D.; Mackay, T. Introduction to Quantitative Genetics, 4th ed.; Longmans Green: Harlow, Essex, UK, 1996; pp. 354–464. [Google Scholar]
- Gengler, N.; Abras, S.; Verkenne, C.; Vanderick, S.; Szydlowski, M.; Renaville, R. Accuracy of prediction of gene content in large animal populations and its use for candidate gene detection and genetic evaluation. J. Dairy Sci. 2008, 91, 1652–1659. [Google Scholar] [CrossRef] [Green Version]
- Legarra, A.; Vitezica, Z.G. Genetic evaluation with major genes and polygenic inheritance when some animals are not genotyped using gene content multiple-trait BLUP. Genet. Sel. Evol. 2015, 47, 89. [Google Scholar] [CrossRef] [Green Version]
- Leymaster, K.A.; Chitko-McKown, C.G.; Clawson, M.L.; Harhay, G.P.; Heaton, M.P. Effects of TMEM154 haplotypes 1 and 3 on susceptibility to ovine progressive pneumonia virus following natural exposure in sheep1,2,3. J. Anim. Sci. 2013, 91, 5114–5121. [Google Scholar] [CrossRef] [PubMed]
- Davis, G. Major genes affecting ovulation rate in sheep. Genet. Sel. Evol. 2005, 37, S11. [Google Scholar] [CrossRef] [PubMed] [Green Version]
- Melchior, M.B.; Windig, J.J.; Hagenaars, T.J.; Bossers, A.; Davidse, A.; van Zijderveld, F.G. Eradication of scrapie with selective breeding: Are we nearly there? BMC Vet. Res. 2010, 6, 1–9. [Google Scholar] [CrossRef] [Green Version]
- Hagenaars, T.J.; Melchior, M.B.; Bossers, A.; Davidse, A.; Engel, B.; van Zijderveld, F.G. Scrapie prevalence in sheep of susceptible genotype is declining in a population subject to breeding for resistance. BMC Vet. Res. 2010, 6, 1–11. [Google Scholar] [CrossRef] [PubMed] [Green Version]
- Dobly, A.; Heyden, S.; Van der Roels, S. Trends in genotype frequency resulting from breeding for resistance to classical scrapie in Belgium (2006~2011). J. Vet. Sci. 2013, 14, 45–51. [Google Scholar] [CrossRef] [Green Version]
- Arnold, M.E.; Rajanayagam, B. Will there be any more classical scrapie cases in sheep in Great Britain? A modelling study to predict future cases. Epidemiol. Infect. 2020, 148, e190. [Google Scholar] [CrossRef]
- Cassmann, E.D.; Mammadova, N.; Moore, S.J.; Benestad, S.; Greenlee, J.J. Transmission of the atypical/Nor98 scrapie agent to Suffolk sheep with VRQ/ARQ, ARQ/ARQ, and ARQ/ARR genotypes. PLoS ONE 2021, 16, e0246503. [Google Scholar] [CrossRef]
- Cassmann, E.D.; Greenlee, J.J. Pathogenesis, detection, and control of scrapie in sheep. Am. J. Vet. Res. 2020, 81, 600–614. [Google Scholar] [CrossRef] [PubMed]
- Acín, C.; Bolea, R.; Monzón, M.; Monleón, E.; Moreno, B.; Filali, H.; Marín, B.; Sola, D.; Betancor, M.; Guijarro, I.M.; et al. Classical and atypical scrapie in sheep and goats. Review on the etiology, genetic factors, pathogenesis, diagnosis, and control measures of both diseases. Animals 2021, 11, 691. [Google Scholar] [CrossRef] [PubMed]
- Arnold, M.; Meek, C.; Webb, C.R.; Hoinville, L.J. Assessing the efficacy of a ram-genotyping programme to reduce susceptibility to scrapie in Great Britain. Prev. Vet. Med. 2002, 56, 227–249. [Google Scholar] [CrossRef]
Figure 1.
Proportion of animals selected from population at different selection truncation points in unit of standard deviations.
Figure 1.
Proportion of animals selected from population at different selection truncation points in unit of standard deviations.

Figure 2.
Proportion of recovered homozygous genotypes from the unselected population at different selection truncation points in unit of standard deviations.
Figure 2.
Proportion of recovered homozygous genotypes from the unselected population at different selection truncation points in unit of standard deviations.

Figure 3.
Allele frequency at different selection truncation points in unit of standard deviations.

Figure 4.
Homozygous genotype frequency at different selection truncation points in unit of standard deviations.
Figure 4.
Homozygous genotype frequency at different selection truncation points in unit of standard deviations.


Table 1.
Risk groups, unadjusted and adjusted scrapie resistance genotypes, and additive genetic values for scrapie resistance for each haplotype.
Table 1.
Risk groups, unadjusted and adjusted scrapie resistance genotypes, and additive genetic values for scrapie resistance for each haplotype.
| Genotypes | Risk Goup 1 | Unadjusted SR 2 | Adjusted SR 3 |
|---|---|---|---|
| ARR/ARR | R1 | 4 | 4 |
| ARR/AHQ | R2 | 3 | 3.5 |
| AHQ/AHQ | R2 | 3 | 3 |
| ARQ/AHQ | R3 | 2 | 2 |
| AHQ/ARH | R3 | 2 | 2 |
| ARR/ARH | R3 | 2 | 2.5 |
| ARR/ARQ | R3 | 2 | 2.5 |
| AHQ/VRQ | R4 | 1 | 1.5 |
| ARR/VRQ | R4 | 1 | 2 |
| ARQ/ARQ | R4 | 1 | 1 |
| ARQ/ARH | R4 | 1 | 1 |
| ARH/ARH | R4 | 1 | 1 |
| ARH/VRQ | R5 | 0 | 0.5 |
| ARQ/VRQ | R5 | 0 | 0.5 |
| VRQ/VRQ | R5 | 0 | 0 |
| Haplotype | Additive genetic value 4 | ||
| ARR | 2 | ||
| AHQ | 1.5 | ||
| ARH | 0.5 | ||
| ARQ | 0.5 | ||
| VRQ | 0 | ||
1 Risk group: genotype risk group to scrapie from low (R1) to high (R5) risk; 2 Unadjusted SR: unadjusted numeric values for scrapie resistance genotypes from low (0) to high (4) scrapie resistance; 3 Udjusted SR: adjusted scrapie resistance genotypic value for a non-additive genetic effects, by adding the additive genetic effects of the haplotypes; 4 additive genetic value for haplotypes.
Table 2.
Genotype count and frequencies in the simulation.
| Genotype 1 | Count | Frequency |
|---|---|---|
| H1/H1 | 482,112 | 0.2884 |
| H1/H2 | 334,271 | 0.1999 |
| H1/H3 | 144,469 | 0.0864 |
| H1/H4 | 79,958 | 0.0478 |
| H1/H5 | 75,690 | 0.0453 |
| H2/H2 | 221,928 | 0.1327 |
| H2/H3 | 126,363 | 0.0758 |
| H2/H4 | 41,457 | 0.0248 |
| H2/H5 | 48,086 | 0.0288 |
| H3/H3 | 48,011 | 0.0287 |
| H3/H4 | 29,460 | 0.0176 |
| H3/H5 | 11,376 | 0.0068 |
| H4/H4 | 10,224 | 0.0061 |
| H4/H5 | 11,188 | 0.0067 |
| H5/H5 | 7297 | 0.0044 |
1 Genotypes at single locus resulting from simulation of multi-allelic locus with five different haplotypes (H1–H5).
Table 3.
Genotypes assigned to haplotypes for the scrapie resistance analyses 1.
| Haplotype 2 | SRh | SRl |
|---|---|---|
| H1 | ARR | VRQ |
| H2 | AHQ | ARQ |
| H3 | ARH | ARH |
| H4 | ARQ | AHQ |
| H5 | VRQ | ARR |
Table 4.
Descriptive statistics for all the individuals in the population.
| Trait 1 | Range | Mean ± SD | CV% |
|---|---|---|---|
| SRh | 0–4 | 2.98 ± 0.96 | 32.10 |
| SRl | 0–4 | 0.78 ± 0.77 | 99.45 |
| Hc1 | 0–2 | 0.96 ± 0.79 | 82.26 |
| Hc2 | 0–2 | 0.59 ± 0.71 | 119.71 |
| Hc3 | 0–2 | 0.24 ± 0.49 | 201.66 |
| Hc4 | 0–2 | 0.11 ± 0.33 | 303.10 |
| Hc5 | 0–2 | 0.10 ± 0.31 | 321.41 |
1 SRh and SRl are the scrapie resistance traits (SR) in a high SR population and a low SR population (see Table 3); and Hc1–Hc5 are the haplotype allele contents, i.e., the number of a given scrapie haplotypes observed in the genotype (0, 1, or 2).
Table 5.
Descriptive statistics for the 20,000 individuals sampled with genotypic records used for analysis.
Table 5.
Descriptive statistics for the 20,000 individuals sampled with genotypic records used for analysis.
| Trait 1 | Range | Mean ± SD | CV% |
|---|---|---|---|
| SRh | 0–4 | 2.98 ± 0.95 | 32.01 |
| SRl | 0–4 | 0.78 ± 0.77 | 99.04 |
| Hc1 | 0–2 | 0.95 ± 0.79 | 82.54 |
| Hc2 | 0–2 | 0.60 ± 0.71 | 119.04 |
| Hc3 | 0–2 | 0.24 ± 0.49 | 203.65 |
| Hc4 | 0–2 | 0.11 ± 0.33 | 299.49 |
| H5 | 0–2 | 0.10 ± 0.31 | 318.71 |
1 SRh and SRl are the scrapie resistance traits (SR) in a high SR population and a low SR population (see Table 3); and Hc1–Hc5 are the haplotype allele contents, i.e., the number of a given scrapie haplotypes observed in the genotype (0, 1, or 2).
Table 6.
Correlation coefficients 1 (accuracies) between predicted breeding values for SR or for haplotype allele content and their corresponding true values in ungenotyped individuals.
Table 6.
Correlation coefficients 1 (accuracies) between predicted breeding values for SR or for haplotype allele content and their corresponding true values in ungenotyped individuals.
| True | |||||||
|---|---|---|---|---|---|---|---|
| Predicted | SRh | SRl | Hc1 | Hc2 | Hc3 | Hc4 | Hc5 |
| SRh | 0.602 | − | 0.576 | −0.167 | −0.454 | −0.240 | −0.102 |
| SRl | − | 0.537 | −0.552 | 0.290 | 0.136 | 0.264 | 0.237 |
| Hc1 | 0.478 | −0.416 | 0.707 | −0.537 | −0.278 | −0.079 | −0.036 |
| Hc2 | −0.139 | 0.217 | −0.536 | 0.702 | −0.070 | −0.128 | −0.003 |
| Hc3 | −0.430 | 0.121 | −0.317 | −0.081 | 0.646 | 0.087 | −0.129 |
| Hc4 | −0.300 | 0.307 | −0.123 | −0.187 | 0.103 | 0.484 | 0.060 |
| Hc5 | −0.140 | 0.300 | −0.052 | −0.012 | −0.198 | 0.059 | 0.412 |
1 The correlation between the prediction on the same trait (SRh, SRl, Hc1, Hc2, Hc3, Hc4, or Hc5; on diagonal and bold) and between the prediction on the different traits (off diagonal). SRh and SRl are the scrapie resistance traits (SR) in a high SR population and a low SR population (see Table 3), and Hc1–Hc5 are the haplotype allele contents, i.e., the number of a given scrapie haplotypes observed in the genotype (0, 1, or 2).
Table 7.
Predicted selection response 1 from the same trait (on diagonal and bold) and from different traits 2 (off diagonal) in ungenotyped individuals.
Table 7.
Predicted selection response 1 from the same trait (on diagonal and bold) and from different traits 2 (off diagonal) in ungenotyped individuals.
| Response on | |||||||
|---|---|---|---|---|---|---|---|
| Selection on | SRh | SRl | Hc1 | Hc2 | Hc3 | Hc4 | Hc5 |
| SRh | 0.459 | − | 0.362 | −0.095 | −0.177 | −0.063 | −0.025 |
| SRl | − | 0.331 | −0.347 | 0.165 | 0.053 | 0.070 | 0.059 |
| Hc1 | 0.364 | −0.256 | 0.444 | −0.305 | −0.108 | −0.021 | −0.009 |
| Hc2 | −0.106 | 0.133 | −0.337 | 0.399 | −0.027 | −0.034 | −0.001 |
| Hc3 | −0.327 | 0.075 | −0.199 | −0.046 | 0.252 | 0.023 | −0.032 |
| Hc4 | −0.229 | 0.189 | −0.077 | −0.106 | 0.040 | 0.128 | 0.015 |
| Hc5 | −0.106 | 0.185 | −0.032 | −0.007 | −0.077 | 0.016 | 0.102 |
1 Response to selection based on predicted breeding values and assuming intensity = 0.798. 2 Traits are SRh, SRl, Hc1, Hc2, Hc3, Hc4, and Hc5, where SRh and SRl are the scrapie resistance traits (SR) in a high SR population and a low SR population (see Table 3), and Hc1–Hc5 are the haplotype allele contents, i.e., the number of a given scrapie haplotypes observed in the genotype (0, 1, or 2).
Table 8.
True selection response 1 from the same trait (on diagonal and bold) and from different traits 2 (off diagonal) in ungenotyped individuals.
Table 8.
True selection response 1 from the same trait (on diagonal and bold) and from different traits 2 (off diagonal) in ungenotyped individuals.
| Response On | |||||||
|---|---|---|---|---|---|---|---|
| Selection on | SRh | SRl | Hc1 | Hc2 | Hc3 | Hc4 | Hc5 |
| SRh | 0.515 | − | 0.432 | −0.159 | −0.145 | −0.075 | −0.052 |
| SRl | − | 0.284 | −0.332 | 0.185 | 0.048 | 0.052 | 0.045 |
| Hc1 | 0.397 | −0.271 | 0.452 | −0.284 | −0.126 | −0.036 | −0.001 |
| Hc2 | −0.180 | 0.193 | −0.450 | 0.496 | −0.013 | −0.037 | 0.003 |
| Hc3 | −0.509 | 0.143 | −0.356 | −0.001 | 0.366 | 0.044 | −0.052 |
| Hc4 | −0.261 | 0.246 | −0.077 | −0.119 | 0.014 | 0.129 | 0.053 |
| Hc5 | −0.094 | 0.232 | −0.024 | 0.005 | −0.139 | 0.031 | 0.126 |
1 Response to selection calculated based on estimated breeding values (EBV). 2 Traits are SRh, SRl, Hc1, Hc2, Hc3, Hc4, and Hc5, where SRh and SRl are the scrapie resistance traits (SR) in a high SR population and a low SR population (see Table 3), and Hc1–Hc5 are the haplotype allele contents, i.e., the number of a given scrapie haplotypes observed in the genotype (0, 1, or 2).
Table 9.
True selection response 1 from the same trait (on diagonal and bold) and from different traits 2 (off diagonal) when all animals in the populations are genotyped (n = 1,671,890).
Table 9.
True selection response 1 from the same trait (on diagonal and bold) and from different traits 2 (off diagonal) when all animals in the populations are genotyped (n = 1,671,890).
| Response On | |||||||
|---|---|---|---|---|---|---|---|
| Selection on | SRh | SRl | Hc1 | Hc2 | Hc3 | Hc4 | Hc5 |
| SRh | 0.645 | − | 0.294 | 0.155 | −0.244 | −0.109 | −0.096 |
| SRl | − | 0.711 | −0.737 | 0.333 | 0.126 | 0.148 | 0.130 |
| Hc1 | 0.433 | −0.318 | 0.476 | −0.295 | −0.114 | −0.038 | −0.028 |
| Hc2 | −0.075 | 0.155 | −0.523 | 0.693 | −0.08 | −0.055 | −0.034 |
| Hc3 | −1.043 | 0.153 | −0.555 | −0.243 | 0.890 | −0.027 | −0.065 |
| Hc4 | −1.076 | 1.149 | −0.492 | −0.354 | −0.073 | 0.950 | −0.031 |
| Hc5 | −1.453 | 1.622 | −0.464 | −0.282 | −0.170 | −0.036 | 0.951 |
1 Response to selection calculated based on estimated breeding values (EBV). 2 Traits are SRh, SRl, Hc1, Hc2, Hc3, Hc4, and Hc5, where SRh and SRl are the scrapie resistance traits (SR) in a high SR population and a low SR population (see Table 3), and Hc1–Hc5 are the haplotype allele contents, i.e., the number of a given scrapie haplotypes observed in the genotype (0, 1, or 2).
Table 10.
Relative gain in the true selection response when a fraction of the population was genotyped for scrapie (n = 20,000) relative to the response when the whole population (n = 1,671,890) was genotyped.
Table 10.
Relative gain in the true selection response when a fraction of the population was genotyped for scrapie (n = 20,000) relative to the response when the whole population (n = 1,671,890) was genotyped.
| Trait 1 | Relative Gain% |
|---|---|
| SRh | 80.00 |
| SRl | 39.94 |
| Hc1 | 94.96 |
| Hc2 | 71.57 |
| Hc3 | 41.12 |
| Hc4 | 13.58 |
| Hc5 | 13.25 |
1 Traits are SRh, SRl, Hc1, Hc2, Hc3, Hc4, and Hc5, where SRh and SRl are the scrapie resistance traits (SR) in a high SR population and a low SR population (see Table 3), and Hc1–Hc5 are the haplotype allele contents, i.e., the number of a given scrapie haplotypes observed in the genotype (0, 1, or 2).
Publisher’s Note: MDPI stays neutral with regard to jurisdictional claims in published maps and institutional affiliations. |
© 2021 by the authors. Licensee MDPI, Basel, Switzerland. This article is an open access article distributed under the terms and conditions of the Creative Commons Attribution (CC BY) license (https://creativecommons.org/licenses/by/4.0/).
Share and Cite
MDPI and ACS Style
Boareki, M.; Schenkel, F.; Kennedy, D.; Cánovas, A. Prediction of Genetic Resistance for Scrapie in Ungenotyped Sheep Using a Linear Animal Model. Genes 2021, 12, 1432. https://0-doi-org.brum.beds.ac.uk/10.3390/genes12091432
AMA Style
Boareki M, Schenkel F, Kennedy D, Cánovas A. Prediction of Genetic Resistance for Scrapie in Ungenotyped Sheep Using a Linear Animal Model. Genes. 2021; 12(9):1432. https://0-doi-org.brum.beds.ac.uk/10.3390/genes12091432
Chicago/Turabian StyleBoareki, Mohammed, Flavio Schenkel, Delma Kennedy, and Angela Cánovas. 2021. "Prediction of Genetic Resistance for Scrapie in Ungenotyped Sheep Using a Linear Animal Model" Genes 12, no. 9: 1432. https://0-doi-org.brum.beds.ac.uk/10.3390/genes12091432
Note that from the first issue of 2016, this journal uses article numbers instead of page numbers. See further details here.