
Evaluating the Impact of Sex-Biased Genetic Admixture in the Americas through the Analysis of Haplotype Data

 , , , , , and
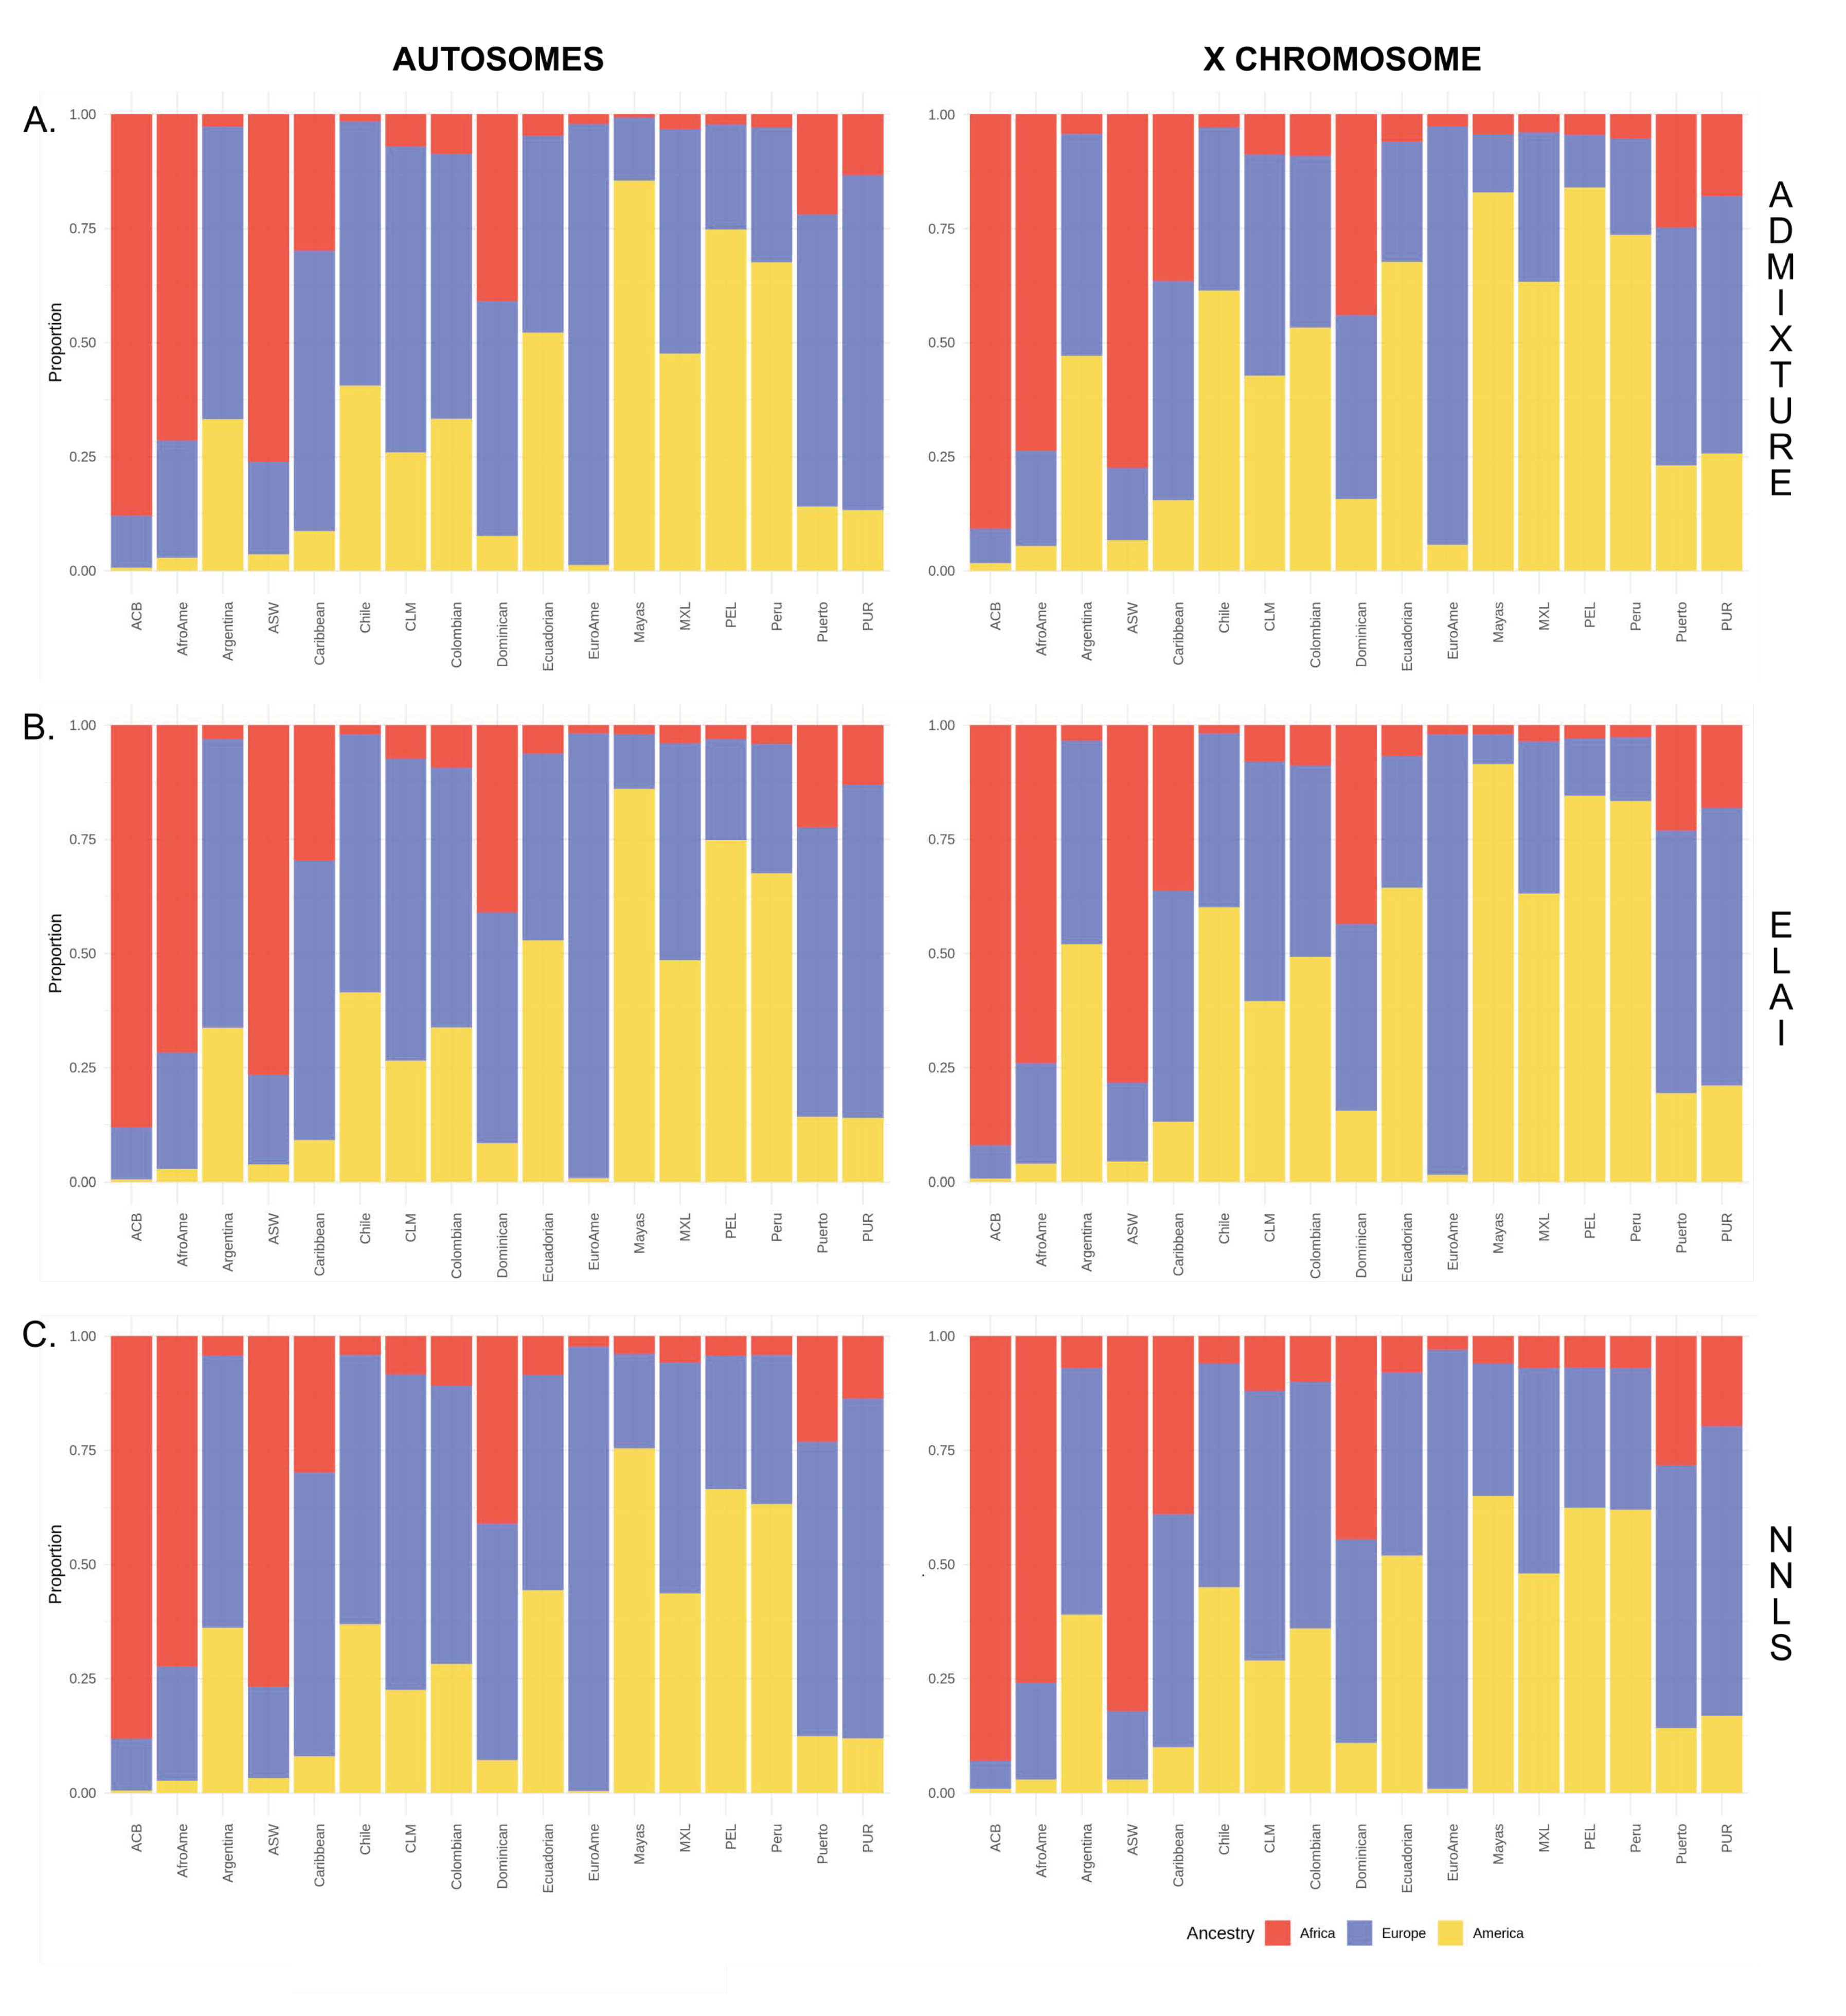
Abstract
:1. Introduction
2. Materials and Methods
2.1. Autosomal and X Chromosome Datasets
2.2. Admixture (ADM)
2.3. Phasing
2.4. Local Ancestry Inference with ELAI
2.5. Non-Negative Least Square Haplotype-Based Ancestry Estimation
2.6. Bayesian Haplotype-Based Ancestry Estimation (SOURCEFIND)
2.7. Comparison between Different Methods
- cor.test, using the Pearson method, obtaining the rho coefficient.
- lm, to fit the linear model, obtaining the adjusted r squared.
2.8. Sex-Biased Imbalance with All Methods
2.9. Ratios
3. Results
3.1. Comparison between Haplotype-Based and ADMIXTURE Estimates
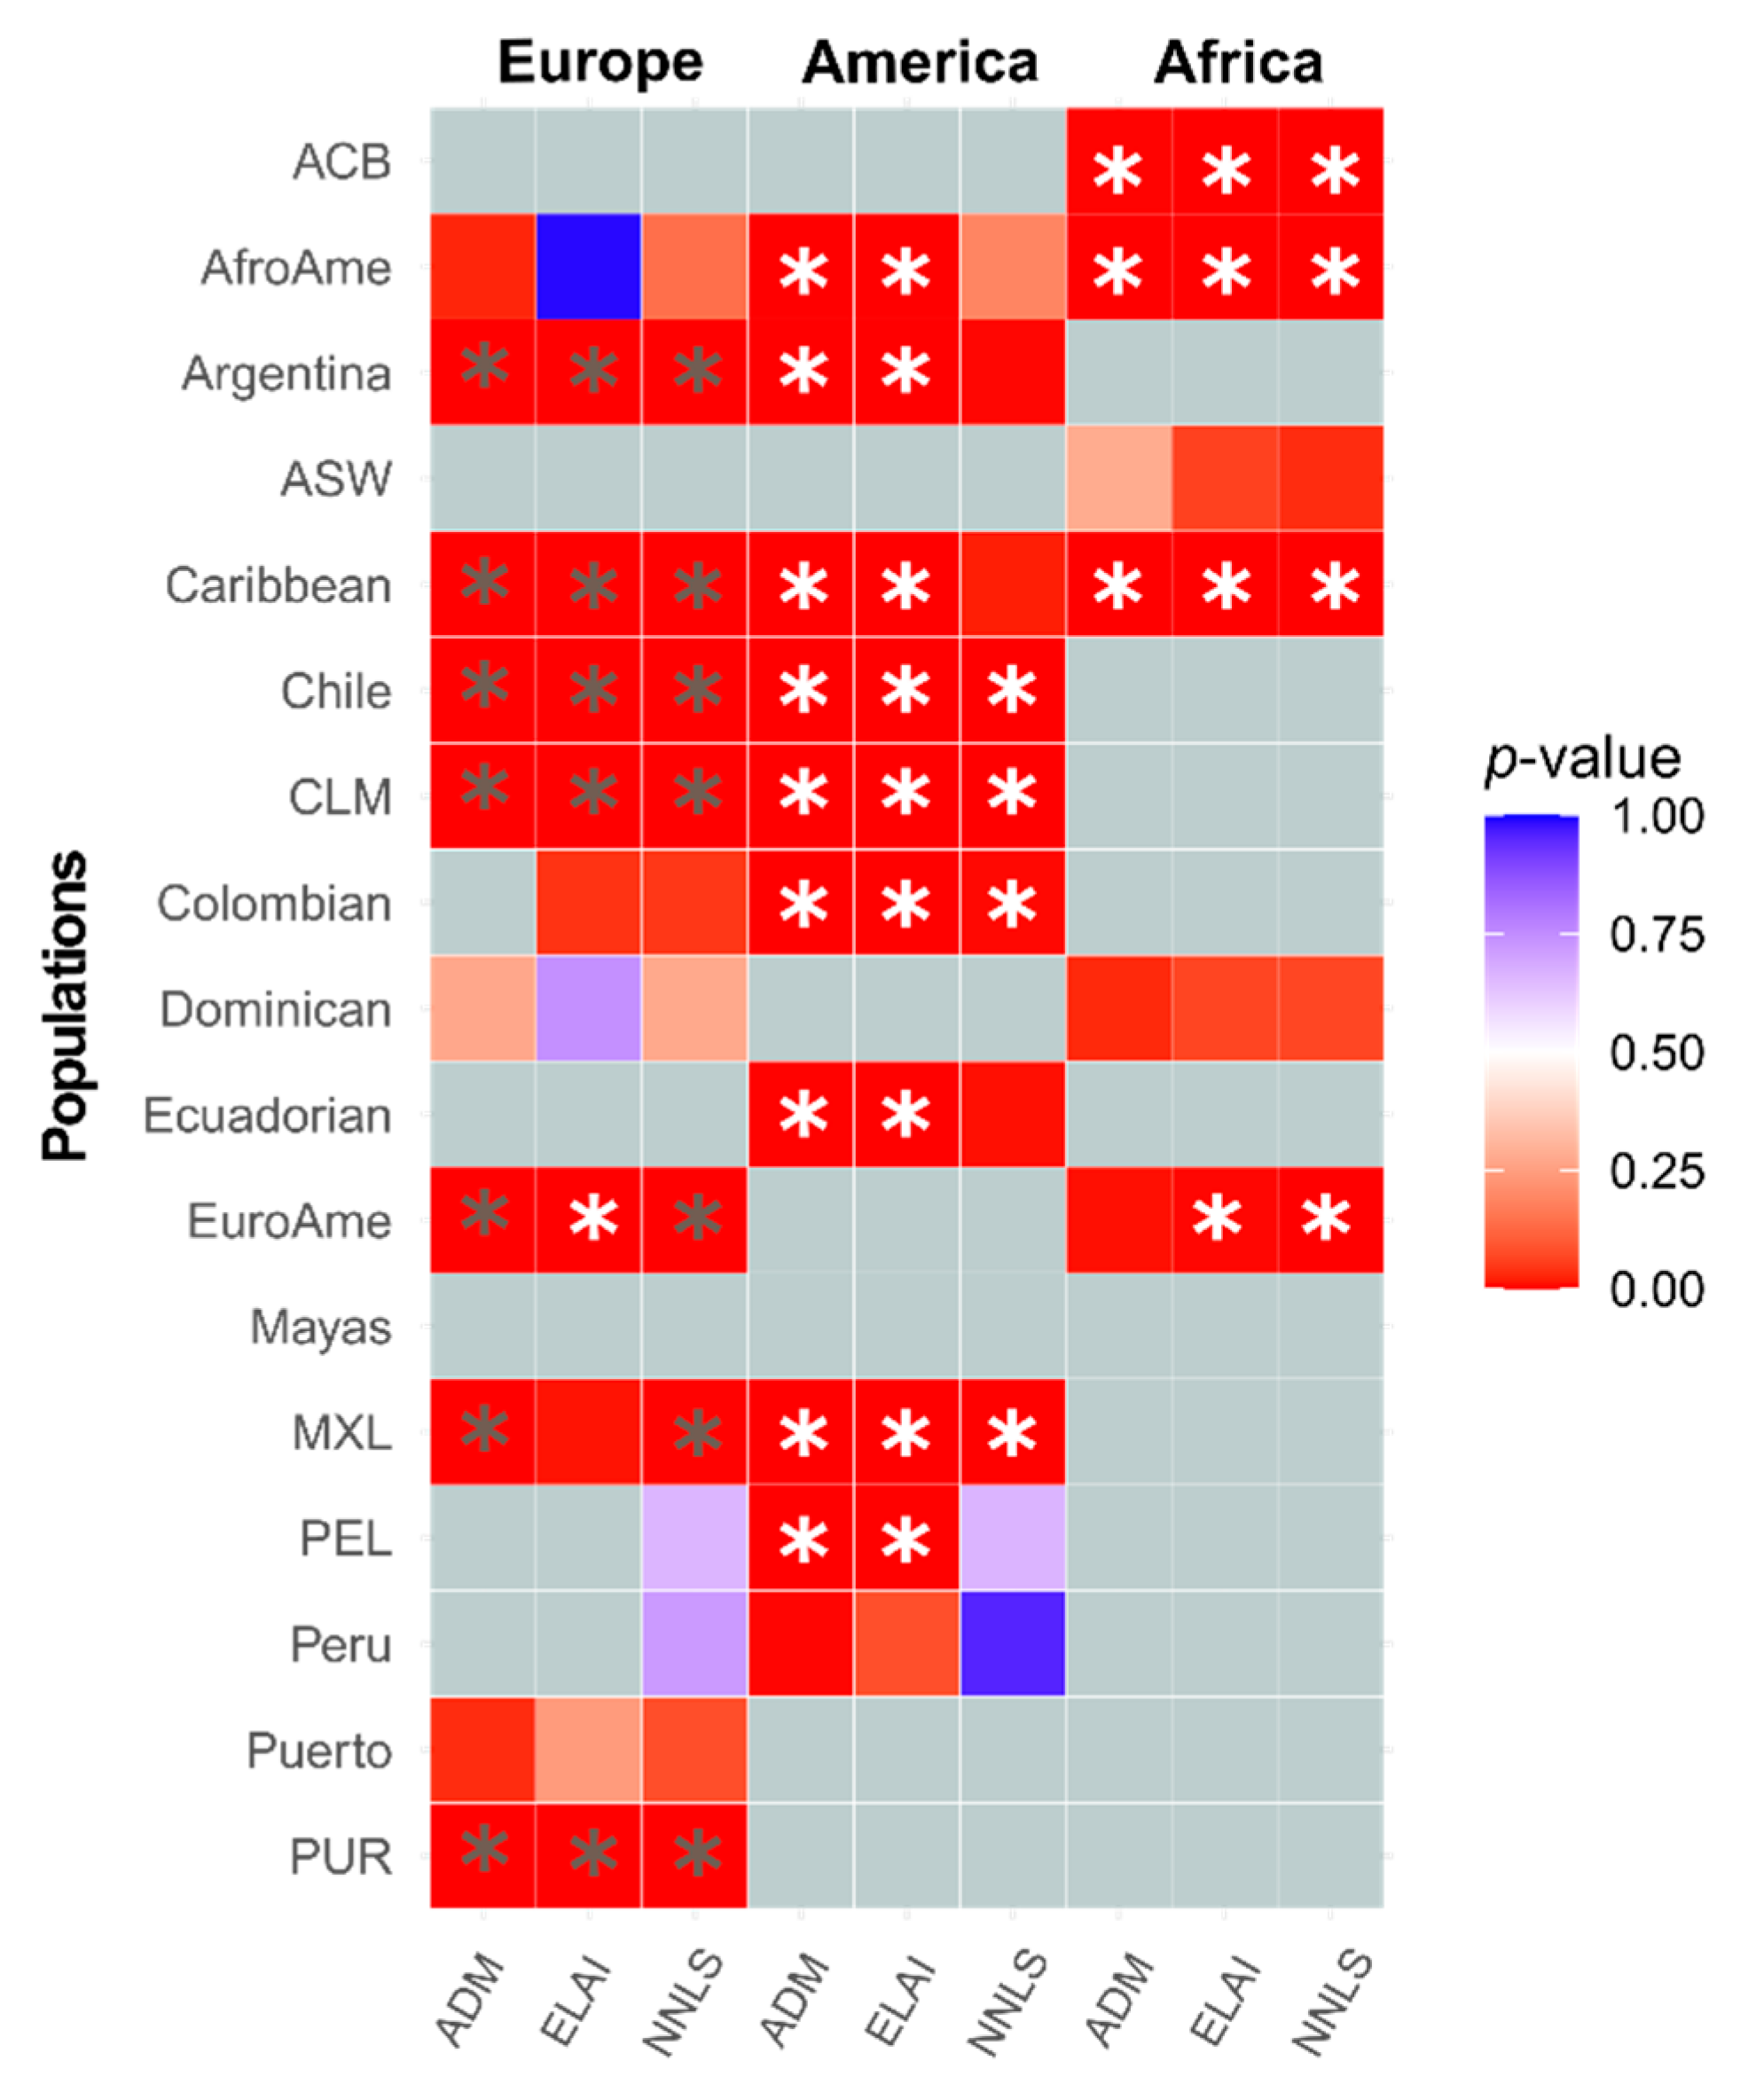
3.2. Inference of the Sex-Biased Imbalance through Different Methodologies
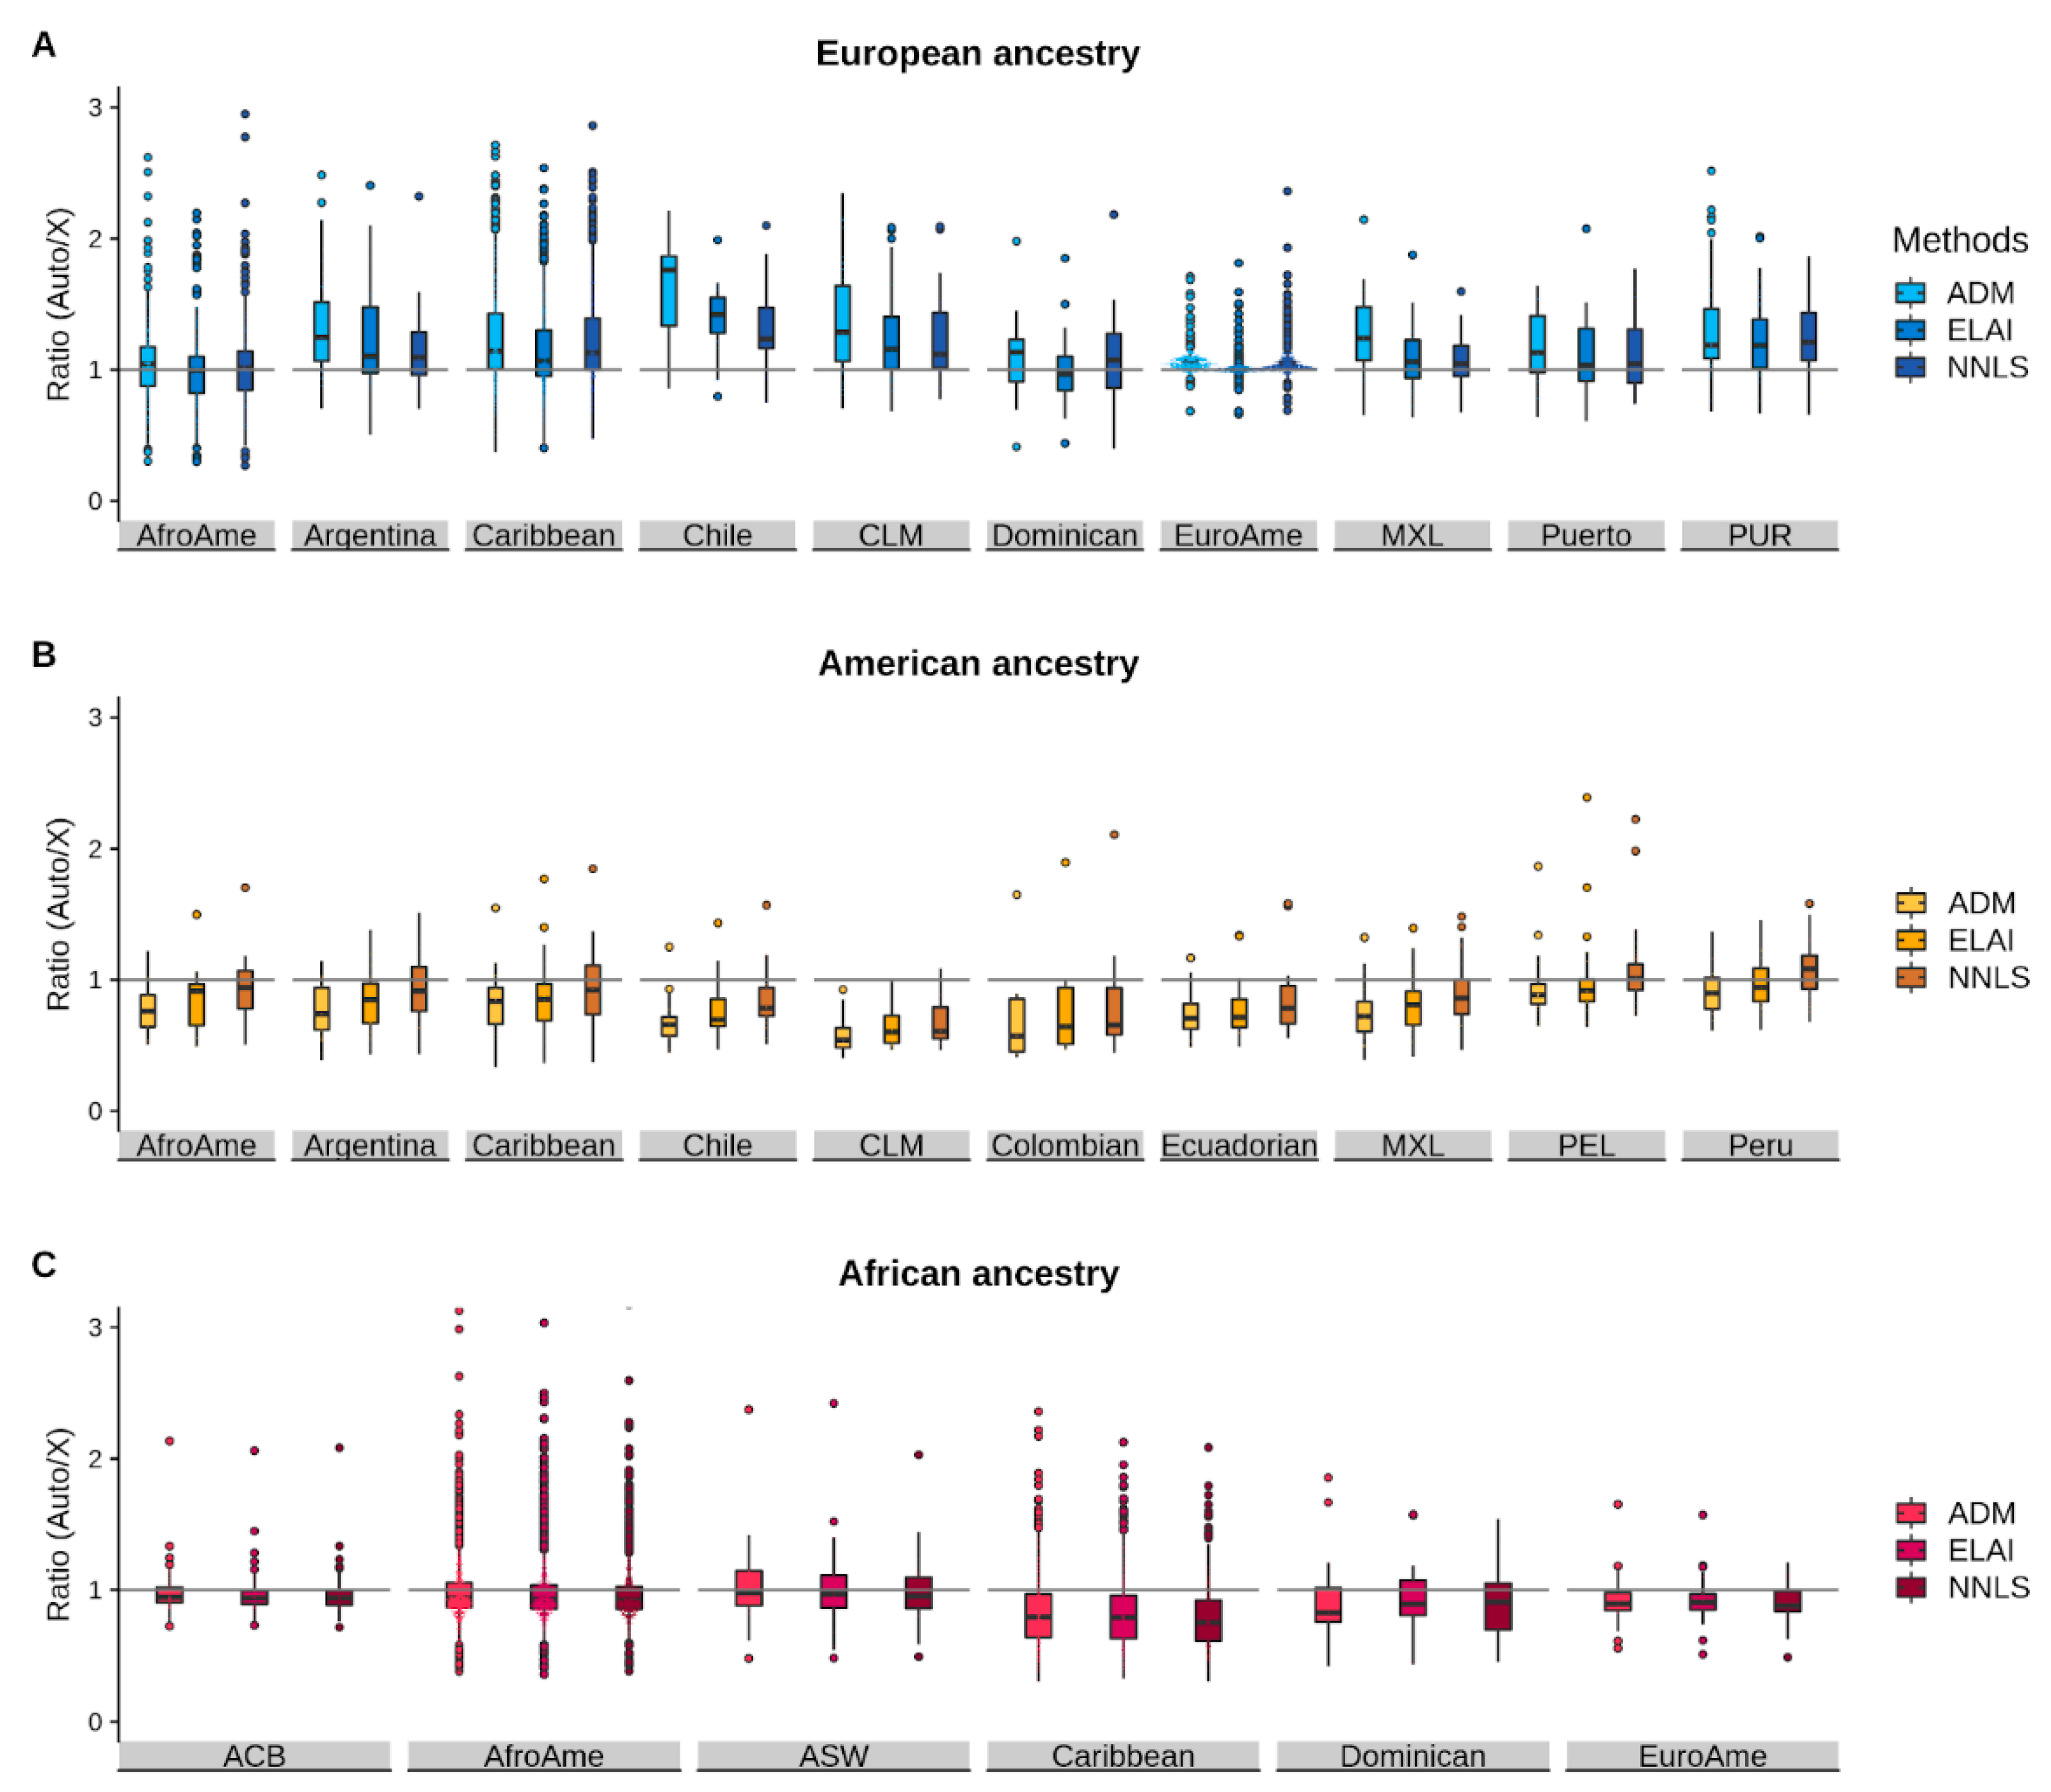
3.3. Comparison of the Autosomal/chrX Ratios between Methods
4. Discussion
Supplementary Materials
Author Contributions
Funding
Acknowledgments
Conflicts of Interest
References
- Fortes-Lima, C.; Verdu, P. Anthropological Genetics Perspectives on the Transatlantic Slave Trade. Hum. Mol. Genet. 2021, 30, R79–R87. [Google Scholar] [CrossRef]
- Montinaro, F.; Busby, G.B.J.; Pascali, V.L.; Myers, S.; Hellenthal, G.; Capelli, C. Unravelling the Hidden Ancestry of American Admixed Populations. Nat. Commun. 2015, 6, 6596. [Google Scholar] [CrossRef] [Green Version]
- Adhikari, K.; Mendoza-Revilla, J.; Chacón-Duque, J.C.; Fuentes-Guajardo, M.; Ruiz-Linares, A. Admixture in Latin America. Curr. Opin. Genet. Dev. 2016, 41, 106–114. [Google Scholar] [CrossRef] [PubMed]
- Fortes-Lima, C.; Gessain, A.; Ruiz-Linares, A.; Bortolini, M.-C.; Migot-Nabias, F.; Bellis, G.; Moreno-Mayar, J.V.; Restrepo, B.N.; Rojas, W.; Avendaño-Tamayo, E.; et al. Genome-Wide Ancestry and Demographic History of African-Descendant Maroon Communities from French Guiana and Suriname. Am. J. Hum. Genet. 2017, 101, 725–736. [Google Scholar] [CrossRef] [PubMed] [Green Version]
- Chacón-Duque, J.-C.; Adhikari, K.; Fuentes-Guajardo, M.; Mendoza-Revilla, J.; Acuña-Alonzo, V.; Barquera, R.; Quinto-Sánchez, M.; Gómez-Valdés, J.; Everardo Martínez, P.; Villamil-Ramírez, H.; et al. Latin Americans Show Wide-Spread Converso Ancestry and Imprint of Local Native Ancestry on Physical Appearance. Nat. Commun. 2018, 9, 5388. [Google Scholar] [CrossRef] [PubMed] [Green Version]
- Ongaro, L.; Scliar, M.O.; Flores, R.; Raveane, A.; Marnetto, D.; Sarno, S.; Gnecchi-Ruscone, G.A.; Alarcón-Riquelme, M.E.; Patin, E.; Wangkumhang, P.; et al. The Genomic Impact of European Colonization of the Americas. Curr. Biol. 2019, 29, 3974.e4–3986.e4. [Google Scholar] [CrossRef] [PubMed]
- Gouveia, M.H.; Borda, V.; Leal, T.P.; Moreira, R.G.; Bergen, A.W.; Aquino, M.M.; Araujo, G.S.; Araujo, N.M.; Kehdy, F.S.G.; Liboredo, R.; et al. Origins, Admixture Dynamics and Homogenization of the African Gene Pool in the Americas. Mol. Biol. Evol. 2020, 37, 1647–1656. [Google Scholar] [CrossRef]
- Boyd-Bowman, P. Patterns of Spanish Emigration to the Indies until 1600. Hisp. Am. Hist. Rev. 1976, 56, 580. [Google Scholar] [CrossRef]
- Bethell, L. The Cambridge History of Latin America; Cambridge University Press: Cambridge, UK, 1984; ISBN 9780521232234. [Google Scholar]
- Adhikari, K.; Chacón-Duque, J.C.; Mendoza-Revilla, J.; Fuentes-Guajardo, M.; Ruiz-Linares, A. The Genetic Diversity of the Americas. Annu. Rev. Genom. Hum. Genet. 2017, 18, 277–296. [Google Scholar] [CrossRef] [Green Version]
- Alves-Silva, J.; da Silva Santos, M.; Guimarães, P.E.; Ferreira, A.C.; Bandelt, H.J.; Pena, S.D.; Prado, V.F. The Ancestry of Brazilian mtDNA Lineages. Am. J. Hum. Genet. 2000, 67, 444–461. [Google Scholar] [CrossRef] [PubMed] [Green Version]
- Carvajal-Carmona, L.G.; Ophoff, R.; Service, S.; Hartiala, J.; Molina, J.; Leon, P.; Ospina, J.; Bedoya, G.; Freimer, N.; Ruiz-Linares, A. Genetic Demography of Antioquia (Colombia) and the Central Valley of Costa Rica. Hum. Genet. 2003, 112, 534–541. [Google Scholar] [CrossRef]
- Ruiz-Linares, A.; Adhikari, K.; Acuña-Alonzo, V.; Quinto-Sanchez, M.; Jaramillo, C.; Arias, W.; Fuentes, M.; Pizarro, M.; Everardo, P.; de Avila, F.; et al. Admixture in Latin America: Geographic Structure, Phenotypic Diversity and Self-Perception of Ancestry Based on 7342 Individuals. PLoS Genet. 2014, 10, e1004572. [Google Scholar] [CrossRef] [Green Version]
- Grugni, V.; Battaglia, V.; Perego, U.A.; Raveane, A.; Lancioni, H.; Olivieri, A.; Ferretti, L.; Woodward, S.R.; Pascale, J.M.; Cooke, R.; et al. Exploring the Y Chromosomal Ancestry of Modern Panamanians. PLoS ONE 2015, 10, e0144223. [Google Scholar] [CrossRef] [PubMed] [Green Version]
- Perego, U.A.; Lancioni, H.; Tribaldos, M.; Angerhofer, N.; Ekins, J.E.; Olivieri, A.; Woodward, S.R.; Pascale, J.M.; Cooke, R.; Motta, J.; et al. Decrypting the Mitochondrial Gene Pool of Modern Panamanians. PLoS ONE 2012, 7, e38337. [Google Scholar] [CrossRef] [PubMed] [Green Version]
- Moreno-Estrada, A.; Gravel, S.; Zakharia, F.; McCauley, J.L.; Byrnes, J.K.; Gignoux, C.R.; Ortiz-Tello, P.A.; Martínez, R.J.; Hedges, D.J.; Morris, R.W.; et al. Reconstructing the Population Genetic History of the Caribbean. PLoS Genet. 2013, 9, e1003925. [Google Scholar] [CrossRef] [PubMed] [Green Version]
- Bryc, K.; Durand, E.Y.; Macpherson, J.M.; Reich, D.; Mountain, J.L. The Genetic Ancestry of African Americans, Latinos, and European Americans across the United States. Am. J. Hum. Genet. 2015, 96, 37–53. [Google Scholar] [CrossRef] [Green Version]
- Homburger, J.R.; Moreno-Estrada, A.; Gignoux, C.R.; Nelson, D.; Sanchez, E.; Ortiz-Tello, P.; Pons-Estel, B.A.; Acevedo-Vasquez, E.; Miranda, P.; Langefeld, C.D.; et al. Genomic Insights into the Ancestry and Demographic History of South America. PLoS Genet. 2015, 11, e1005602. [Google Scholar] [CrossRef] [Green Version]
- Kehdy, F.S.G.; Gouveia, M.H.; Machado, M.; Magalhães, W.C.S.; Horimoto, A.R.; Horta, B.L.; Moreira, R.G.; Leal, T.P.; Scliar, M.O.; Soares-Souza, G.B.; et al. Origin and Dynamics of Admixture in Brazilians and Its Effect on the Pattern of Deleterious Mutations. Proc. Natl. Acad. Sci. USA 2015, 112, 8696–8701. [Google Scholar] [CrossRef] [Green Version]
- Skoglund, P.; Posth, C.; Sirak, K.; Spriggs, M.; Valentin, F.; Bedford, S.; Clark, G.R.; Reepmeyer, C.; Petchey, F.; Fernandes, D.; et al. Genomic Insights into the Peopling of the Southwest Pacific. Nature 2016, 538, 510–513. [Google Scholar] [CrossRef]
- Micheletti, S.J.; Bryc, K.; Esselmann, S.G.A.; Freyman, W.A.; Moreno, M.E.; Poznik, G.D.; Shastri, A.J.; Agee, M.; Aslibekyan, S.; Auton, A.; et al. Genetic Consequences of the Transatlantic Slave Trade in the Americas. Am. J. Hum. Genet. 2020, 107, 265–277. [Google Scholar] [CrossRef] [PubMed]
- Alexander, D.H.; Novembre, J.; Lange, K. Fast Model-Based Estimation of Ancestry in Unrelated Individuals. Genome Res. 2009, 19, 1655–1664. [Google Scholar] [CrossRef] [PubMed] [Green Version]
- Klein, H.S. The Atlantic Slave Trade; Cambridge University Press: Cambridge, UK, 1999; ISBN 9780521465885. [Google Scholar]
- Goldberg, A.; Rosenberg, N.A. Beyond 2/3 and 1/3: The Complex Signatures of Sex-Biased Admixture on the X Chromosome. Genetics 2015, 201, 263–279. [Google Scholar] [CrossRef]
- Browning, S.R.; Browning, B.L.; Daviglus, M.L.; Durazo-Arvizu, R.A.; Schneiderman, N.; Kaplan, R.C.; Laurie, C.C. Ancestry-Specific Recent Effective Population Size in the Americas. PLoS Genet. 2018, 14, e1007385. [Google Scholar] [CrossRef] [PubMed] [Green Version]
- Speidel, L.; Forest, M.; Shi, S.; Myers, S.R. A Method for Genome-Wide Genealogy Estimation for Thousands of Samples. Nat. Genet. 2019, 51, 1321–1329. [Google Scholar] [CrossRef]
- Hellenthal, G.; Busby, G.B.J.; Band, G.; Wilson, J.F.; Capelli, C.; Falush, D.; Myers, S. A Genetic Atlas of Human Admixture History. Science 2014, 343, 747–751. [Google Scholar] [CrossRef] [Green Version]
- Chang, C.C.; Chow, C.C.; Tellier, L.C.; Vattikuti, S.; Purcell, S.M.; Lee, J.J. Second-Generation PLINK: Rising to the Challenge of Larger and Richer Datasets. Gigascience 2015, 4, 7. [Google Scholar] [CrossRef] [PubMed]
- Auton, A.; Brooks, L.D.; Durbin, R.M.; Garrison, E.P.; Kang, H.M.; Korbel, J.O.; Marchini, J.L.; McCarthy, S.; McVean, G.A. A Global Reference for Human Genetic Variation. Nature 2015, 526, 68–74. [Google Scholar]
- Delaneau, O.; Marchini, J.; Zagury, J.-F. A Linear Complexity Phasing Method for Thousands of Genomes. Nat. Methods 2011, 9, 179–181. [Google Scholar] [CrossRef]
- Guan, Y. Detecting Structure of Haplotypes and Local Ancestry. Genetics 2014, 196, 625–642. [Google Scholar] [CrossRef] [Green Version]
- Lawson, D.J.; Hellenthal, G.; Myers, S.; Falush, D. Inference of Population Structure Using Dense Haplotype Data. PLoS Genet. 2012, 8, e1002453. [Google Scholar] [CrossRef] [PubMed] [Green Version]
- Lawson, C.; Hanson, R. Solving Least Squares Problems. In Classics in Applied Mathematics; Society for Industrial and Applied Mathematics: Philadelphia, PA, USA, 1995; ISBN 9780898713565. [Google Scholar]
- Leslie, S.; Winney, B.; Hellenthal, G.; Davison, D.; Boumertit, A.; Day, T.; Hutnik, K.; Royrvik, E.C.; Cunliffe, B.; Wellcome Trust Case Control Consortium 2; et al. The Fine-Scale Genetic Structure of the British Population. Nature 2015, 519, 309–314. [Google Scholar] [CrossRef] [PubMed] [Green Version]
- Carvajal-Carmona, L.G.; Soto, I.D.; Pineda, N.; Ortíz-Barrientos, D.; Duque, C.; Ospina-Duque, J.; McCarthy, M.; Montoya, P.; Alvarez, V.M.; Bedoya, G.; et al. Strong Amerind/white Sex Bias and a Possible Sephardic Contribution among the Founders of a Population in Northwest Colombia. Am. J. Hum. Genet. 2000, 67, 1287–1295. [Google Scholar] [CrossRef] [Green Version]
- Arenas, M. Simulation of Molecular Data under Diverse Evolutionary Scenarios. PLoS Comput. Biol. 2012, 8, e1002495. [Google Scholar] [CrossRef] [PubMed] [Green Version]
- Currat, M.; Arenas, M.; Quilodràn, C.S.; Excoffier, L.; Ray, N. SPLATCHE3: Simulation of Serial Genetic Data under Spatially Explicit Evolutionary Scenarios Including Long-Distance Dispersal. Bioinformatics 2019, 35, 4480–4483. [Google Scholar] [CrossRef]
- Branco, C.; Ray, N.; Currat, M.; Arenas, M. Influence of Paleolithic Range Contraction, Admixture and Long-Distance Dispersal on Genetic Gradients of Modern Humans in Asia. Mol. Ecol. 2020, 29, 2150–2159. [Google Scholar] [CrossRef]
- Ferreiro, D.; Núñez-Estévez, B.; Canedo, M.; Branco, C.; Arenas, M. Evaluating Causes of Current Genetic Gradients of Modern Humans of the Iberian Peninsula. Genome Biol. Evol. 2021, 13, evab071. [Google Scholar] [CrossRef]


Publisher’s Note: MDPI stays neutral with regard to jurisdictional claims in published maps and institutional affiliations. |
© 2021 by the authors. Licensee MDPI, Basel, Switzerland. This article is an open access article distributed under the terms and conditions of the Creative Commons Attribution (CC BY) license (https://creativecommons.org/licenses/by/4.0/).
Share and Cite
Ongaro, L.; Molinaro, L.; Flores, R.; Marnetto, D.; Capodiferro, M.R.; Alarcón-Riquelme, M.E.; Moreno-Estrada, A.; Mabunda, N.; Ventura, M.; Tambets, K.; et al. Evaluating the Impact of Sex-Biased Genetic Admixture in the Americas through the Analysis of Haplotype Data. Genes 2021, 12, 1580. https://0-doi-org.brum.beds.ac.uk/10.3390/genes12101580
Ongaro L, Molinaro L, Flores R, Marnetto D, Capodiferro MR, Alarcón-Riquelme ME, Moreno-Estrada A, Mabunda N, Ventura M, Tambets K, et al. Evaluating the Impact of Sex-Biased Genetic Admixture in the Americas through the Analysis of Haplotype Data. Genes. 2021; 12(10):1580. https://0-doi-org.brum.beds.ac.uk/10.3390/genes12101580
Chicago/Turabian StyleOngaro, Linda, Ludovica Molinaro, Rodrigo Flores, Davide Marnetto, Marco R. Capodiferro, Marta E. Alarcón-Riquelme, Andrés Moreno-Estrada, Nedio Mabunda, Mario Ventura, Kristiina Tambets, and et al. 2021. "Evaluating the Impact of Sex-Biased Genetic Admixture in the Americas through the Analysis of Haplotype Data" Genes 12, no. 10: 1580. https://0-doi-org.brum.beds.ac.uk/10.3390/genes12101580