Article

Genome-Wide Identification of NRT Gene Family and Expression Analysis of Nitrate Transporters in Response to Salt Stress in Poncirus trifoliata

1
Key Laboratory of Horticultural Plant Biology (MOE), College of Horticulture and Forestry Science, Huazhong Agricultural University, Wuhan 430070, China
2
Hubei Hongshan Laboratory, Wuhan 430070, China
*
Author to whom correspondence should be addressed.
Submission received: 1 May 2022 / Revised: 6 June 2022 / Accepted: 20 June 2022 / Published: 22 June 2022
(This article belongs to the Special Issue Frontiers in Horticultural Genetics and Breeding)

Abstract

:
The uptake and transportation of nitrate play a crucial role in plant growth and development. These processes mostly depend on nitrate transporters (NRT), which guarantee the supplement of nutrition in the plant. In this study, genes encoding NRT with Major Facilitator Superfamily (MFS) domain were identified in trifoliate orange (Poncirus trifoliata (L.) Raf.). Totally, 56 NRT1s, 6 NRT2s, and 2 NAR2s were explored. The bioinformation analysis, including protein characteristics, conserved domain, motif, phylogenetic relationship, cis-acting element, and synteny correlation, indicated the evolutionary conservation and functional diversity of NRT genes. Additionally, expression profiles of PtrNRTs in different tissues demonstrated that NRT genes possessed spatio-temporal expression specificity. Further, the salt condition was certified to induce the expression of some NRT members, like PtrNPF2.1, PtrNPF7.4, and PtrNAR2.1, proposing the potential role of these NRTs in salt stress response. The identification of NRT genes and the expression pattern analysis in various tissues and salt stress lay a foundation for future research between nitrogen transport and salt resistance in P. trifoliata.

1. Introduction

Nitrogen (N) is a macro element for plant growth and development [1]. On the one hand, it is an important basic component for bio-macromolecules, like polypeptide, nucleic acid, and chlorophyll, which are essential for physiological activities in plants such as photosynthesis and protein synthesis. On the other hand, nitrogen metabolites are crucial substances that influence an organism’s development and differentiation. The sufficient supplement of nitrogen is directly related to the leaf color and shape and increases the capacity of light utilization, thus resulting in the high biological activity of plants [2,3]. In addition, nitrogen absorption and assimilation affect protein synthesis. Nitrate ion (NO3) and ammonium ion (NH4+) are two primary inorganic forms of nitrogen in soil [4]. During the nitrogen assimilation process, NO3 is transformed to NH4+ through the primary nitrate assimilation pathway, which is performed by the core enzymes, nitrate reductase (NR), and nitrite reductase (NiR). In plants, nitrogen is synthesized into amino acids through the glutamine synthetase/glutamate synthase (GS/GOGAT) pathway for protein synthesis [2,5]. Given the vital role of N, the level of nitrogen use efficiency (NUE) is considered a key character for crops. NUE is dependent on the process of nitrogen absorption and transportation. For that, nitrogen has to be absorbed efficiently and transported rationally, which are mainly processed by the membrane-localized transporters.
NRTs are a group of NO3 ion transporters and function in nitrate absorption and transportation in plants. There are three main sub-families of NRT members, including nitrate transporter 1/peptide transporter (NRT1/PTR, also named NPF), nitrate transporter 2 (NRT2), and nitrate transporter 3 (NRT3/NAR2). According to the functional difference, the NRTs are defined as low-affinity transport system (LATS, including NPFs) and high-affinity transport system (HATS, including NRT2s and NAR2s) [6]. Homologous genes of NRT can be found in almost all higher plants. A total of 125 and 39 NRT genes were respectively identified in soybean (Glycine soja) [7] and potato (Solanum tuberosum) [8]. Due to the high degree of convergence, the peptide transporters (PTRs) are considered to be the same family as NRT1. Therefore, the NRT1/PTR family is also recognized as NPF, which is the largest sub-family of nitrate transporters [9]. In the Arabidopsis thaliana, 53 NPF members were identified and divided into eight sub-clades, including NPF1-NPF8 [10]. Besides, 57, 68, and 73 NPFs were respectively identified in spinach, poplar, and apple [11,12,13]. Moreover, the NRT2 family is the high-affinity transport system (HATS), which is mainly induced by the lower concentration of nitrate conditions in the soil. Previous research revealed that there are seven NRT2 members in A. thaliana, named AtNRT2.1 to AtNRT2.7 [14]. For NRT3, it was reported to interact with the NRT2 in protein level and finally enhance the activity of HATS [15]. So, NRT3 was also recognized as nitrate assimilation-related gene 2 (NAR2). Based on the previous reports, NRT family members play diverse roles in the absorption and transportation of nitrogenous substances according to their specific tissue expression patterns. For instance, AtNRT1.5 is mainly expressed at the root pericycle cells for xylem nitrate ions loading to complete the long-distance transport of nitrogen [16]. AtNRT1.9 promotes the entrance of nitrate into root phloem and facilitates nitrate down-transport in roots [17]. AtNRT1.11 and AtNRT1.12 were reported to regulate the redistribution of nitrate content in xylem and phloem [18]. Moreover, much evidence indicates that NPFs possessed the potential activity of low-affinity nitrate transportation in many species, such as Brassica campestris, chrysanthemum, and rice [19,20,21]. As for NRT2s, AtNRT2.1 and AtNRT2.2 were mainly expressed in the epidermis of roots for nitrate absorption [22,23]. AtNRT2.4 was located on the plasma membrane of root epidermal cells and acted as a supplementary protein for AtNRT2.1 and AtNRT2.2. Consistently, the nitrate absorption was dramatically inhibited in atnrt2.1/2.2/2.4 triple mutation plants [24]. AtNRT2.5 is mainly expressed in the epidermis and the cortex of the root hair zone and takes part in nitrate loading into the phloem during nitrate remobilization [25]. AtNRT2.6 is highly expressed in vegetative organs and responds to biotic and abiotic stresses [25]. In addition, the AtNRT2.7 protein is located on the seed vacuolar membrane and plays a potential role in the nitrate accumulation at the later development stage of seeds [26]. The homologous genes of NRT2 in other plants like cassava, Brassica rapa, cucumber, and chrysanthemum are also identified as high-affinity nitrate transporters with the function of nitrate transportation [27,28,29,30]. The NAR2s (NRT3s) are proven to play a significant role in nitrate transport by regulating the activity of high-affinity transport system proteins. It was reported that the AtNAR2 interacted with all of the AtNRT2 proteins except for AtNRT2.7 in A. thaliana [31]. The interaction of NRT2 and NAR2 was demonstrated to enhance the nitrate transport activity of a high-affinity transport system [11,15].
As an important nutrient element, nitrogen has been reported in many in-depth studies of plant salt stress response. A gradually gaining acceptance is that the processes of nitrogen assimilation, metabolism, and transportation are in profound connection with plant salt stress response. Salt stress is the principal abiotic stress for a plant. It has been reported that one-fifth of cultivated land is suffering soil salinization over the world. Increasing soil stress affects plant growth and threatens food security [32]. Under the salt condition, the enhancement of osmotic stress will lead to the decrease in available water in plants. Moreover, the accumulation of special ions will cause cellular toxicity and impair the balance of element absorption, especially for those of microelements [33]. Several scientific studies supposed that nitrogen could affect ion absorption under salt stress. Studies on sorghum and tomato found that the provision of exogenous nitrogen could effectively alleviate the absorption of Na+ and increase the content of K+ in plants [34,35]. The research on mustard showed that exogenous nitrogen could reduce the absorption of Na+ and Cl under salt stress [36]. Nitrate, as the substitution of negative ion of Cl, was proposed to be collected to alleviate the excess chloride toxicity in plants [37]. Accordingly, nitrate was reported to be more suitable for plant growth under salt conditions than ammonium nitrogen [38]. Further, the expression of NR and NiR genes were reported to be significantly increased in Zostera marina under salt stress [39]. The up-regulated NR gene was involved in maintaining cell ion homeostasis [40]. All of these researches supported that nitrogen played a potential role in assisting plants in overcoming salt stress. However, the function of NRTs in plant salt stress response is still unclear so far.
Citrus is a widely planted fruit tree over the world. Due to the vegetative propagation, the nutrition absorption and stress tolerance of citrus are largely dependent on the grafting rootstock. Trifoliate orange is a universal rootstock for citrus culture. However, some studies figured out that trifoliate orange is more sensitive to salt stress [41,42], which limited citrus production. Nevertheless, excessive fertilizer use and the subsequent deepening soil salinization make increasingly harsh cultivation conditions for citrus and threaten fruit yield. Given the fact that NRT genes in P. trifoliata have not been identified yet, the potential relationship between nitrate uptake and salt stress response remains to be revealed in citrus. In the present work, we identified 64 NRTs in P. trifoliata through the Hidden Markov Model (HMM). The analysis of protein characteristics, conserved domains, motifs, phylogenetic relationship, cis-acting elements, and synteny correlation were performed to show the conservation and relationship between the orthologous and paralogous genes. In consideration of the connection between nitrogen and salt stress, we also detected the expression of NRT genes in different tissues and in response to salt conditions (200 mM NaCl) via RNA-seq and qRT-PCR assay. This work could be the first step for further exploring the function of NRTs both in nitrogen uptake and salt stress response in P. trifoliata.

2. Materials and Methods

2.1. Plant Material and Treatment

Trifoliata orange seeds were harvested from the Centre of Citrus Plant at Huazhong Agriculture University. The seeds were washed clean with water and stored at 4 °C refrigerators. All the seeds were stepwise stirred 7 min with the 1 M NaOH and another 7 min with 5% NaClO to remove pectin and inhibit bacteria. The seed germination process was carried out at a constant temperature growth chamber in dark conditions at 25 °C. The seedlings were grown in hydroponic conditions at 23 °C with the nutrition medium. The medium formula was presented in Table S1A. The salt treatment was performed on two-month-old seedlings with 200 mM NaCl at the indicated time (6 days). Low nitrogen treatment was designed to reduce the nitrogen content (NO3) from 5 mM to 0.1 mM (Table S1B).

2.2. Identification of NRTs in P. trifoliata and Amino Acid Characteristic Prediction

To identify nitrate transporter genes in P. trifoliata, Citrus Pan-genome to Breeding Database (CPBD, http://citrus.hzau.edu.cn/index.php, accessed on 1 March 2022) was used to obtain the gene sequences and gene annotations. The Hidden Markov Model (HMM) profiles of PTR2 (PF00854), MSF_1 (PF07690), and NAR2 (PF16974) were downloaded from Pfam database (http://pfam.xfam.org/, accessed on 1 March 2022), which represented NRT1/PTR, NRT2, and NAR2 respectively. HMM search tool was applied to identify possible NRT members from the protein sequence database of P. trifoliata by TBtools (Toolbox for Biologists v1.09857) with an E-value cutoff of 1.0 × 10⁻⁵ [43]. Then, all the hypothetical protein sequences were submitted to the National Center for Biotechnology Information (NCBI, https://0-www-ncbi-nlm-nih-gov.brum.beds.ac.uk/Structure/bwrpsb/bwrpsb.cgi, accessed on 1 March 2022) to verify the constitute of conserved domains by the batch CD-search tool. To reveal the character of the NRT protein sequences, the physiochemical data was calculated by the ProtParam tool of the EXPASY program (https://web.expasy.org/protparam/, accessed on 1 March 2022). The online tool was employed to detect the number of amino acids, molecular weight, theoretical isoelectric point, and grand average of hydropathicity (GRAVY) [44].

2.3. Phylogenetic Tree Construction and Synteny Correlation Analysis

To identify the homology of NRT genes between intraspecific and interspecific, a phylogenetic tree was constructed with the A. thaliana and P. trifoliata NRT protein sequences. The members of nitrate transporter in A. thaliana were downloaded from The Arabidopsis Information Resource (TAIR, https://www.arabidopsis.org/, accessed on 2 March 2022). Peptide sequences of NRT genes from A. thaliana and P. trifoliata were put into MEGAX64 software [45]. Sequences were aligned by ClustalW with the default parameters; then the phylogenetic tree was constructed by the Maximum Likelihood (ML) method. Finally, the high-quality figure of the phylogenetic tree was made through the ITOL (https://itol.embl.de, accessed on 2 March 2022). According to the structure of the tree and the real position with A. thaliana, 64 PtrNRT genes were initially named. To observe the tandem and segmental duplication of P. trifoliata NRT genes, the collinear correlation analysis was carried through the MCScanX by offering the gene annotation and the whole genome sequence of P. trifoliata and A. thaliana. The circos plot was constructed by Tbtools software. The synteny of interspecific and intraspecific were merged together.

2.4. Gene Structure and cis-Acting Elements Analysis

To further identify the gene structure, MEME (https://meme-suite.org/meme/, accessed on 2 March 2022) was used to find out conserved nucleotide motifs (the maximum numbers of motifs were set up to 10) with default parameters. The data was obtained as the result of a batch CD-search of NCBI. The conserved domains were rechecked by SMART (http://smart.embl-heidelberg.de/smart/batch.pl, accessed on 9 May 2022) and visualized. A gene structure annotation file was downloaded to extract NRT gene information by accession number, which was called in visualizing the length of UTR and CDS. Furthermore, the upstream 2000 nucleotide promoter sequences of PtrNRT were extracted from the genome file. The PlantCare (http://bioinformatics.psb.ugent.be/webtools/plantcare/html/, accessed on 2 March 2022) was used to detect the promoter’s cis-acting elements [46,47].

2.5. RNA Extract, cDNA Reverse Transcription, and Gene Expression Analysis via qRT-PCR

The collected P. trifoliata seedlings and tissues were ground into a fine powder with liquid nitrogen for RNA extraction, which was performed according to the instruction manual using the OminiPlant RNA Kit (Cowin BIO. Wuhan, China). The Easy Script ®One-Step gDNA Removal and cDNA Synthesis Super Mix (Trans Gen Biotech Co., Ltd., Beijing, China) were applied to reverse-transcribe RNA into cDNA. Then, the qRT-PCR experiment was carried out with the Applied biosystem®QuantStudioTM 7 Flex Real-Time PCR System (ABI, Los Angeles, CA, USA). The gene-specific primers were designed from NCBI, and all primers were listed in Table S2. The actin gene was selected as the reference. The relative expression profile was calculated by the 2−∆∆CT method. The control group and the root tissue were set as 1 against the NaCl, low nitrogen groups, and different tissues, respectively. Gene expression analyses were repeated at least three times. The significant difference was analyzed by using Student’s t-test. The error bar indicated the standard deviation (SD).

2.6. RNA-seq Data Analysis

RNA-seq was performed by the Illumina platform (carried by Novogene Technology Co., Ltd., Nanjing, China). The raw data was processed using Hisat2 and Stringtie plugins from TBtools. The differential expression analysis of PtrNRT genes was performed using the DESeq2 R package (1.20.0). DESeq2 provides statistical routines to determine differential expression in digital gene expression data via using a model based on the negative binomial distribution. The resulting p-values were adjusted using Benjamini and Hochberg’s method to control the false discovery rate.

2.7. Sequence Annotation, GO, and KEGG Enrichment Analysis

Protein sequences were uploaded on the eggNOG-Mapper (http://eggnog-mapper.embl.de/, accessed on 10 April 2022) to get the GO and KEGG background annotation files. The genes that log2 Fold Change absolute values greater than 1 were employed to perform GO and KEGG enrichment by TBtools. The cut-off of the p-value was set at 0.05 and then dealt with Benjamini and Hochberg’s approach for bubble plot.

3. Result

3.1. Genome-Wide Identification of NRT Genes in P. trifoliata

According to the previous reports, NRT genes were divided into three sub-families, NPF, NRT2, and NAR2. To identify the NRT members in P. trifoliata, protein sequences of NPF, NRT2, and NAR2 in A. thaliana were employed to perform Hidden Markov Model (HMM) scan. Core domains containing PTR2 (PF00854), MFS_1 (PF07690), and NAR2 (PF16974) were identified, respectively, through HMM scan. Then, HMM search in the P. trifoliata genome was carried out with the e-value cutoff in 1.0 × 10⁻⁵ by TBtools. Only the peptide sequences that shared the same conserved domains with A. thaliana were identified as a member of PtrNRTs. Finally, 64 NRT genes were selected, including 56 NPFs, 6 NRT2s, and 2 NAR2s in P. trifoliata (Table 1), which was similar to the number of other species in previous studies [10,11,12,13]. For further analysis, the peptide sequences, annotation files, and CDS sequences of PtrNRT genes were acquired from the CPBD. The protein sequence characteristics, including the number of amino acids (AA), start and end site, molecular weight, theoretical isoelectric point, and grand average of hydropathicity, were presented in Table 1. Basically, the AA length of NPFs and NRT2s was in a rational range from 450 to 600. The longest AA sequence was 895 (PtrNPF4.1), while the shortest one was 419 (PtrNRT2.5). Accordingly, the molecular weight of PtrNRTs ranged from 45.27 (PtrNRT2.5) to 98.89 (PtrNPF4.1) kDa. However, NAR2 was a special group with a short sequence length and small molecular weight. With respect to the theoretical isoelectric point, most of the NRT proteins preferred alkaline, but still, a few proteins were supposed to be acidic, including PtrNPF5.12, PtrNAR2.2, PtrNPF8.2, PtrNPF3.1, PtrNPF7.3, PtrNPF8.3, PtrNPF6.5, and PtrNPF5.7. Besides, only the PtrNAR2.1 possesses the negative GRAVY value, implying it might be exposed to the hydrophilic zone to perform a special function.

3.2. Phylogenetic Relationship and Synteny Correlation Analysis

To reveal the homologous relationship between the NRT members, MEGAX64 was applied for the alignment assay with the peptide sequences of P. trifoliata and A. thaliana by the ClustalW under the default parameters. The phylogenetic tree was constructed for re-naming reference through the maximum likelihood (ML) method. It was shown that NRT members were grouped into three sub-families, including NPF, NRT2, and NAR2 (Figure 1). Accordingly, NPF sub-family contained most of the NRT members, while the NAR2 sub-family had only 2 and 1 members in P. trifoliata and A. thaliana, respectively. Besides, NPF sub-family could be classified into seven groups in P. trifoliata. Among them, PtrNPF5 had the most of 19 members, from PtrNPF5.1 to PtrNPF5.19. To further study the synteny and collinearity relationship of NRT genes, the circos plot was constructed by TBtools according to the gene structure annotation file (Figure 2). This plot showed the location and the evolutionary relationship of PtrNRT members on the chromosome level. For the NPF sub-family members, they were unevenly distributed on all nine chromosomes of P. trifoliata. Based on the statistical data, chromosome 7 contained only one family member of PtrNPF1.2. In addition, chromosome 3 possessed 10 NRT genes, which was the most among all chromosomes. NRT2 sub-family genes were located at chromosomes 2, 4, 6, and 8. Interestingly, chromosome 8 showed a relative gathering trend, containing half of the NRT2 genes. Besides, two NAR2 genes were located at chromosomes 3 and 4, respectively. The distribution of NRT members suggested the diversity of PtrNRT genes in the process of evolution. The lines on the circos plot presented the gene pairs with collinearity. Despite a distant evolutionary relationship, 39 out of 51 gene pairs were still referred to as the orthologous genes (red lines) between A. thaliana and P. trifoliata, indicating that the frequency of NRT family amplification events is low and the members possess a relative conservative property in the process of evolutionary history.

3.3. Motifs, Gene Structure, and cis-Acting Elements Analysis

Conserved domains and motifs were supposed to reflect the conservative of NRT members. As shown in Figure 3A, the motifs were arranged in a stable order (motif 6, motif 5, motif 1, motif 9, motif 10, motif 2, motif 3, motif 8, motif 4, motif 7) on the NRT protein sequences. Interestingly, some of members, including PtrNPF5.5, PtrNPF5.7, PtrNPF5.8, PtrNPF5.13, PtrNPF5.14, PtrNPF5.15, PtrNPF5.16, and PtrNPF5.19 were not exactly followed with the order. It is probably because the NPF5 sub-family were experienced several times expansion events. In addition, motif 7 and motif 10 were presented in both NPF and some NRT2 members, implying that these two motifs are potentially connected with the basic function of nitrate or other substrates’ transportation. In addition, NPF sub-family had varied superfamily domain regions, including MFS-NPF1-2, MFS-NPF3, MFS-NPF4, MFS-NPF5, MFS-NPF, MFS-NPF7, and MFS-NPF8 (Figure 3B). There was a good correspondence between superfamily domains and NPF sub-families, which further confirmed the reliability of the phylogenetic tree. Besides, the PLN00028 and NAR2 conserved domains were specific for NRT2 and NAR2, respectively. The conserved domains were basically consistent with the re-confirmation results from the SMART database assay (Figure S5). However, the NRT2.5 showed a different pattern with more transmembrane domains. More than that, PtrNPF5.8 and PtrNPF5.19 had a unique conserved domain region UPF0114. For gene structure analysis, some of the genes contained the long fragment of introns, like PtrNPF1.5, PtrNPF2.2, PtrNPF5.2, and PtrNPF5.3 (Figure 3C). Those long non-coding fragments might have potential roles in the regulation of gene expression. Furthermore, approximately two-thirds of genes had both up and downstream UTRs, indicating that NRTs probably had diversified regulation mechanisms. To further detect the regulation factors and predict the cis-acting elements of PtrNRTs, 2000 bp promoter sequences upstream of the gene start codon were extracted from the genome file according to the gene annotations (Figure S4A). The heat map was constructed to show the frequency of occurrence of different cis-acting elements (Figure S4B). According to the result, ABA regulatory cis-acting elements and MeJA regulatory cis-acting elements were largely distributed in the promoter regions of PtrNRTs. Not only that, but there are other hormone-related elements have also been identified, like auxin, salicylic acid, and jasmonic acid. Thus, it is suspected that hormones play potential roles in the regulation of PtrNRT genes’ expression. Overall, the cis-acting element analysis will provide a good reference for further transcriptional regulation research on PtrNRT members.

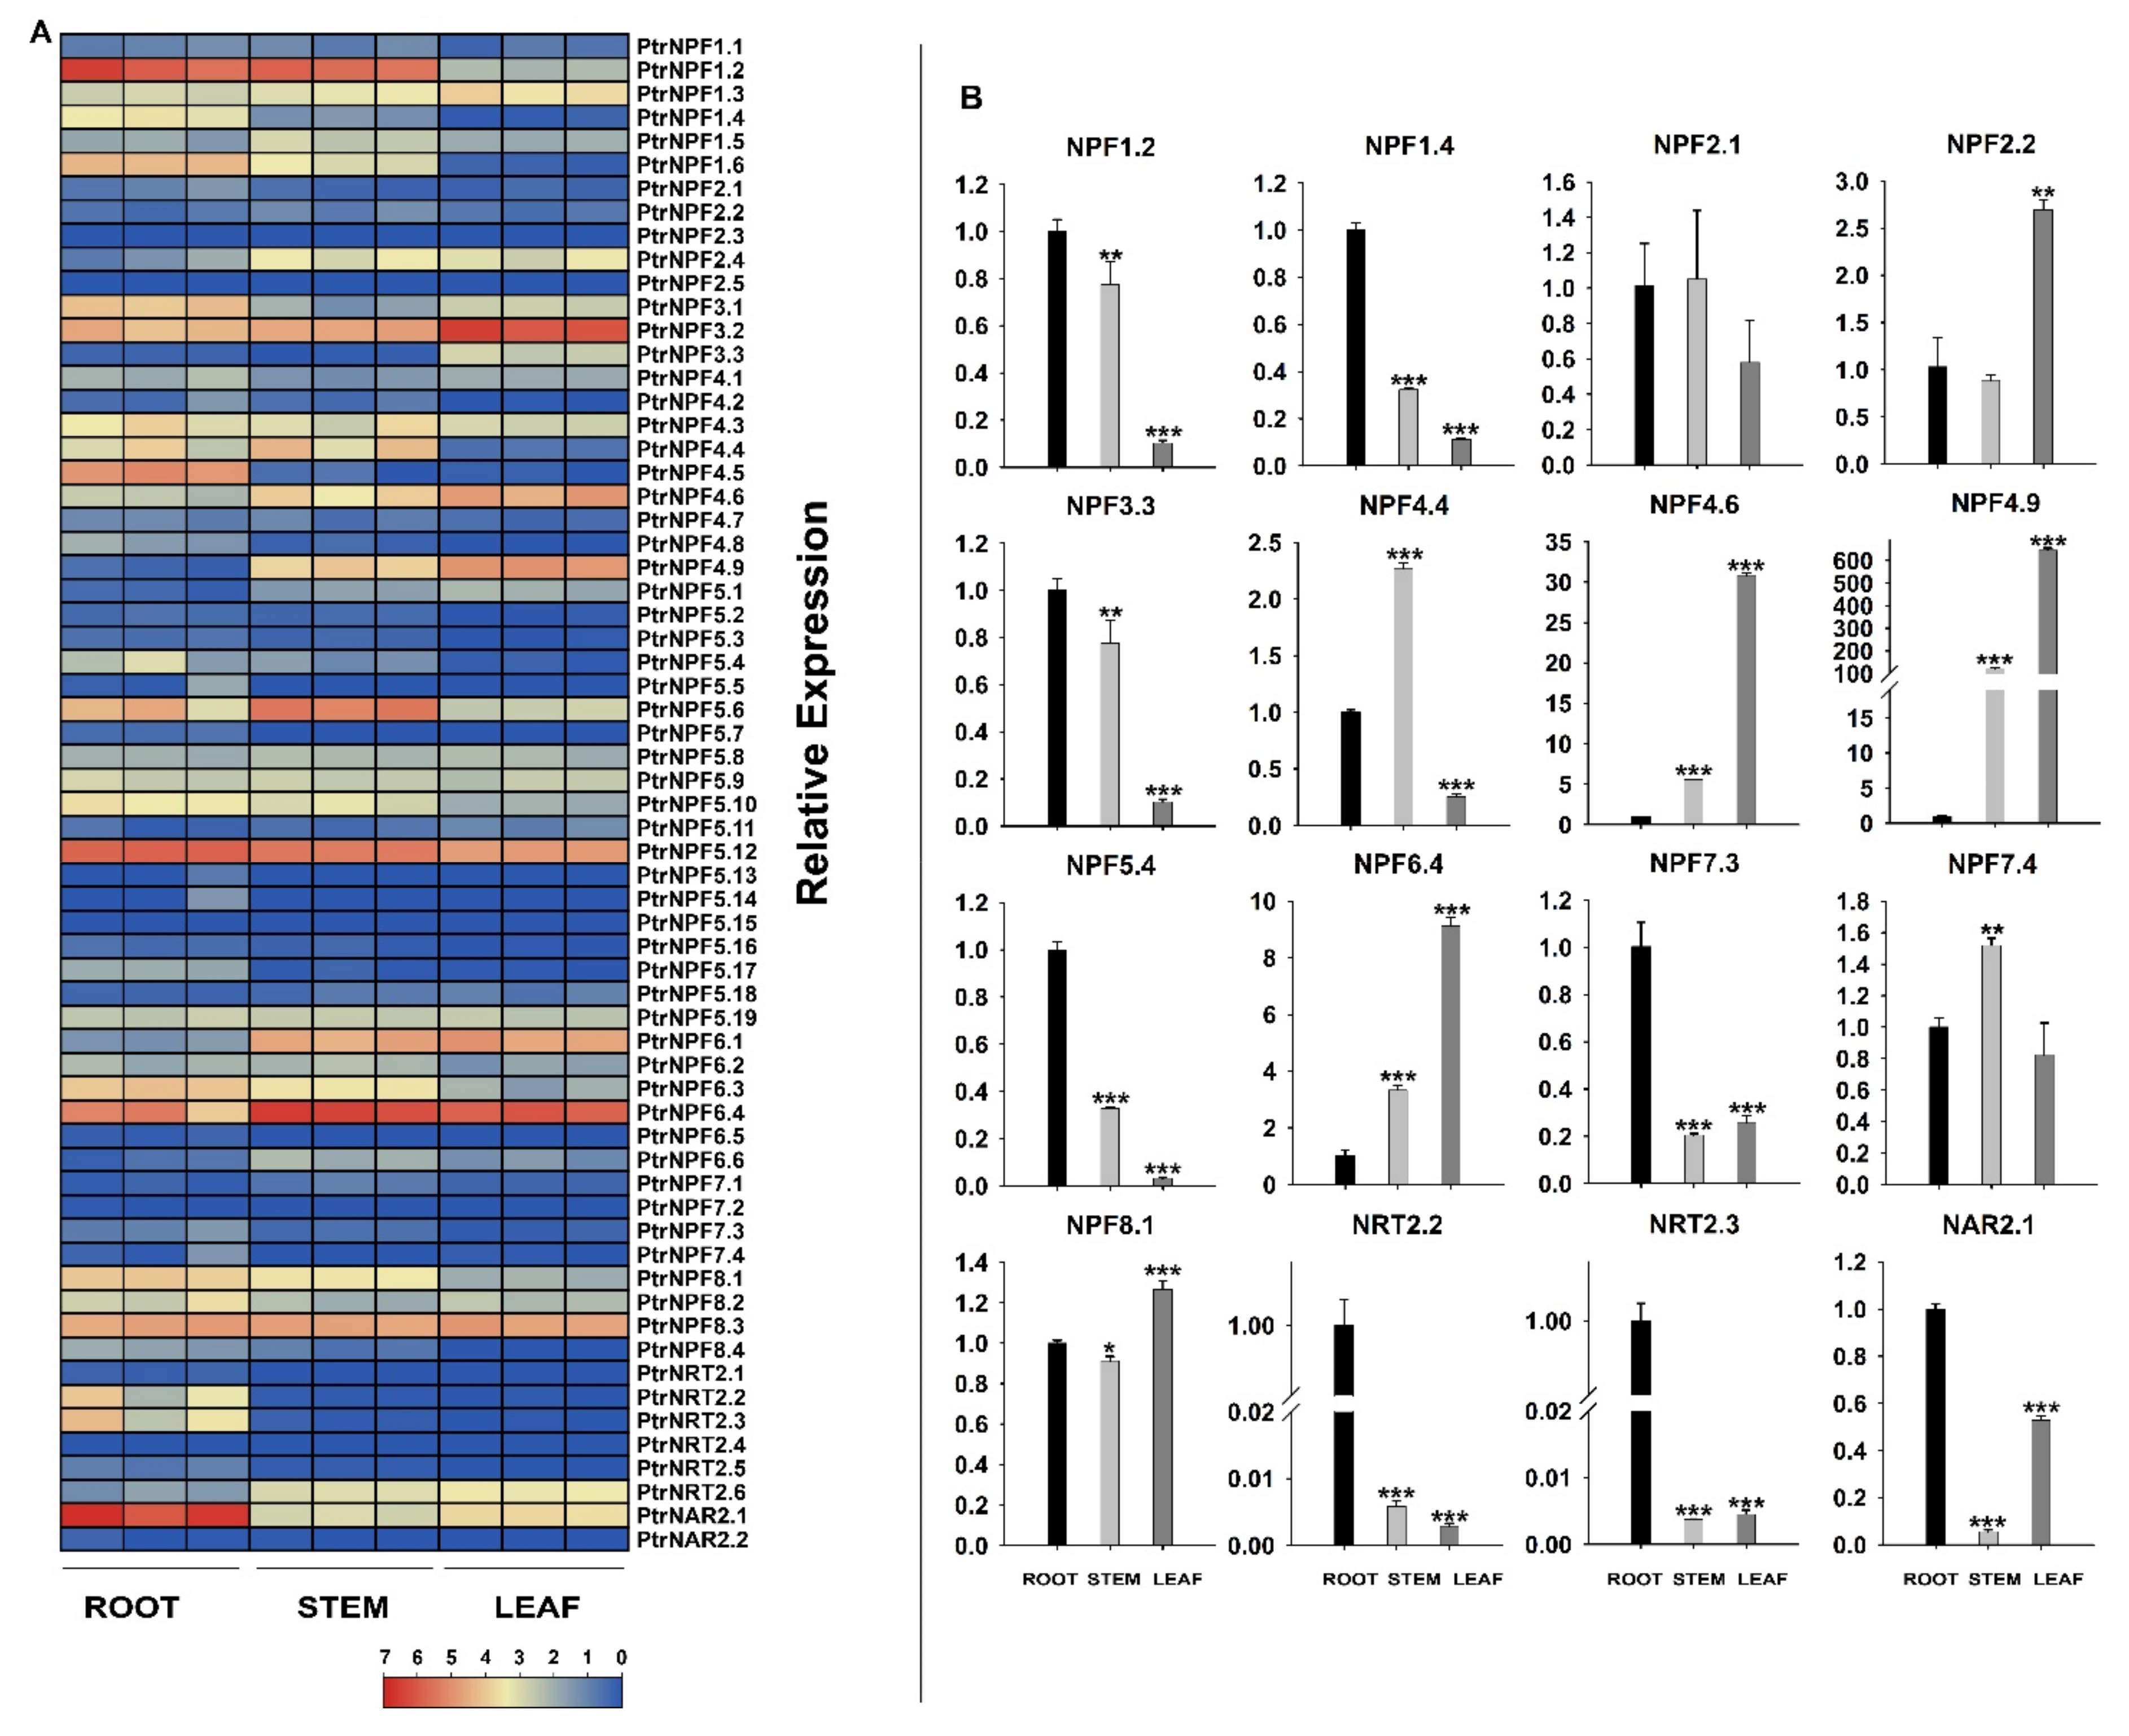
3.4. Expression Analysis of the PtrNRT Genes in Different Tissues

The spatio-temporal expression is a key aspect that determines gene function. The expression pattern of NRT genes in differential tissues was detected via transcriptome data and a qRT-PCR experiment (Figure 4, Table S2). The RNA-seq result suggested that NRT genes were widely expressed in leaf, stem, and root tissues (Figure 4A, Figure S2). Several genes, like PtrNPF1.2, PtrNPF3.3, PtrNPF4.9, and PtrNPF6.4, were expressed actively in two or three different tissues. Those genes probably performed basic N element transport functions in the organism. Meanwhile, some of the genes were specifically expressed at one certain tissue, speculating that those genes likely had the given function of loading and discharging nitrate or other substrates. However, some members were not detected, such as PtrNPF2.1, PtrNPF2.2, PtrNPF5.4, and PtrNPF7.4. It implied that those genes might be expressed at a specific developmental stage or respond to certain stimulations. To further verify the tissue expression results, some NRTs were selected for qRT-PCR assay (Figure 4B). The expression of most selected genes was consistent with the transcriptome results. For PtrNPF6.4, it was highly expressed in leaf and stem tissues, suggesting that PtrNPF6.4 should participate in the long-distance transportation of nitrate from root to over-ground part. Meanwhile, PtrNPF5.4 and PtrNPF7.3 were highly expressed in root, implying their potential roles in nitrate uptake from soil. The expression pattern in different tissues demonstrated various functions of PtrNRTs in the whole plant.

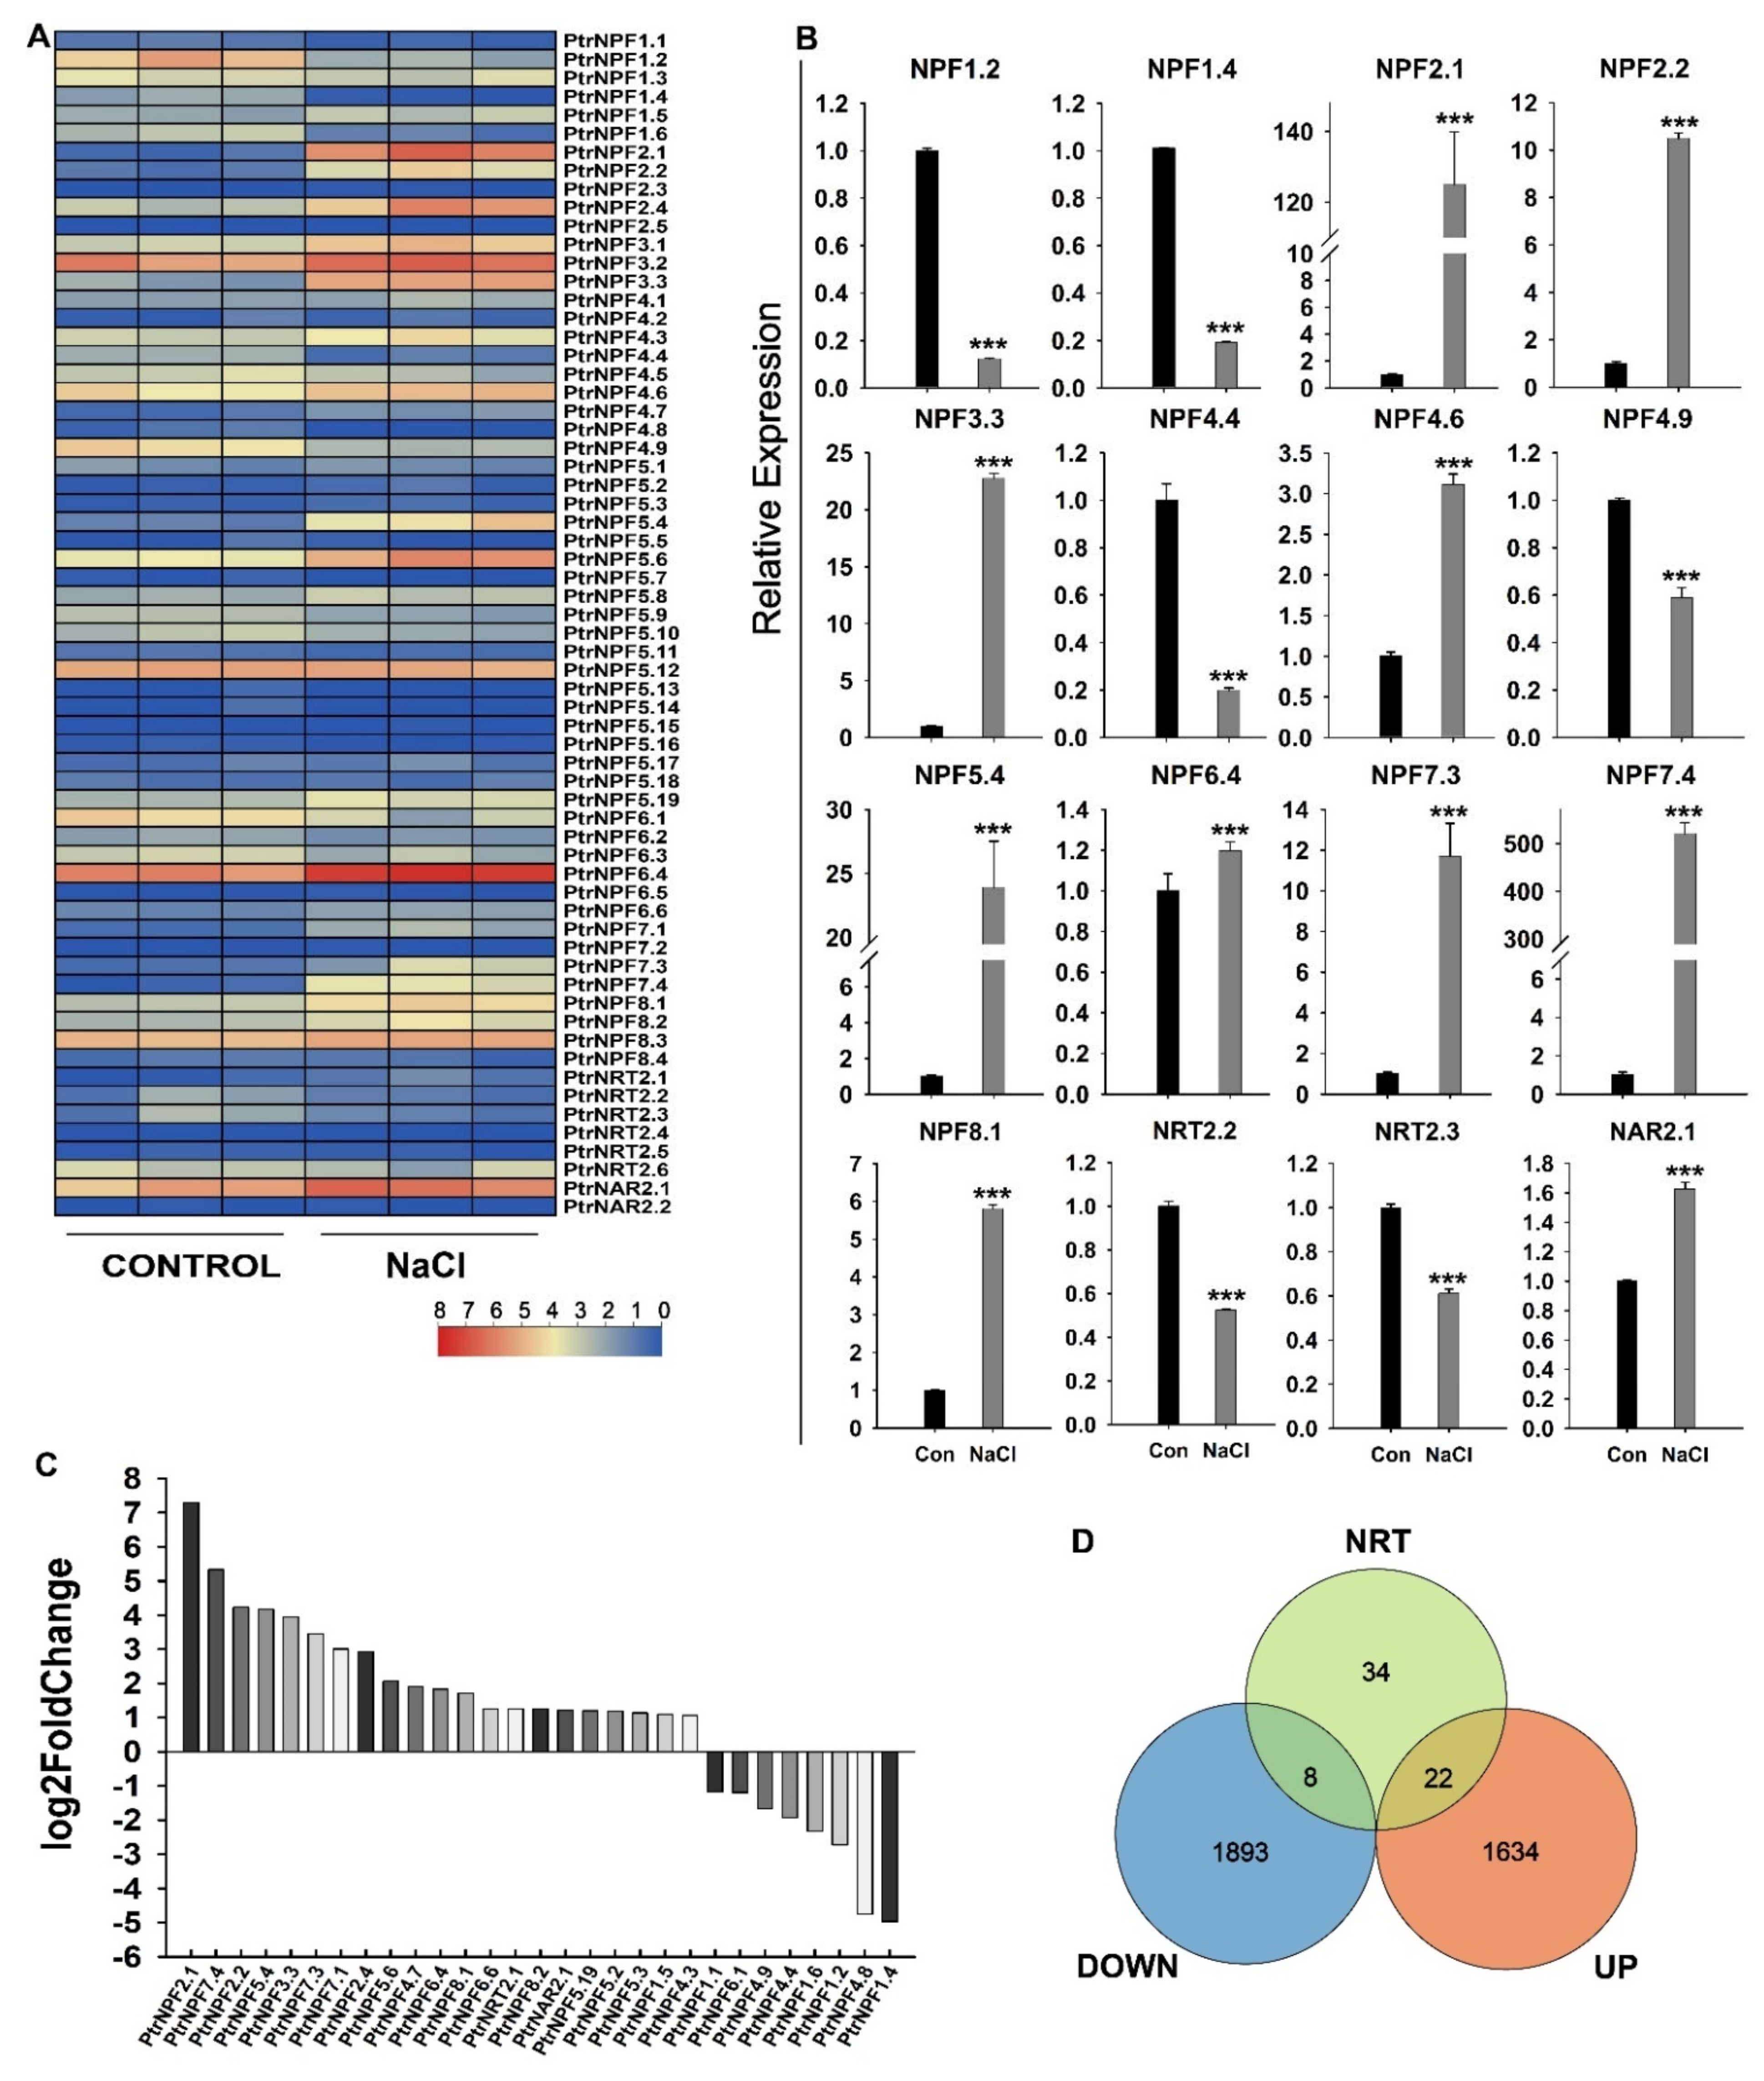
3.5. GO and KEGG Pathway Enrichment Analysis under Salt Treatment in P. trifoliata

To get insight into the response of NRTs under salt stress, differential expression genes (DEGs) were analyzed from transcriptome data. The GO and KEGG annotation were performed by the eggNOG-mapper. The visualization of enrichment results was carried out containing the bar plots (Figure 5A, B) and the bubble plots (Figure 5C, D). Based on the previous report, transporters play an important role in salt tolerance [48]. Accordingly, we found that some transporter gene clusters were enriched from the molecular function part in GO enrichment results (Figure 5A). The KEGG enrichment result revealed that some amino acid metabolism pathways were enriched, like cysteine, methionine, glycine, serine, threonine, valine, leucine, and isoleucine (Figure 5B). The accumulation of amino acids should work as an osmotic adjustment substance to release salt stress. It is well known that NRT is the transporter of nitrogen compounds and some anions. These results suggested that, at least from the perspective of nitrogen metabolites, NRT is extremely like to be involved in the regulation of salt stress response. In addition, salt stress can also be perceived by plants as abiotic stress signals, resulting in subsequent transcriptional regulation. It inspired us to identify further the expression changes of PtrNRT members under salt conditions.

3.6. Expression Analysis of the PtrNRT Genes in Response to Salt Stress

In general, the specific function of a gene is closely related to its expression level. The salt-treated transcriptome data were applied to analyze the response of PtrNRTs under salt stress. As shown in Figure 6A,C, the expression of PtrNRTs had a huge changing tendency in response to salt conditions. The transcriptome results suggested that approximately half of the NRT members were induced or inhibited after salt treatment. A total of 22 NRT genes were dramatically up-regulated and 8 NRTs were down-regulated according to the log2 Fold Change values (Figure 6D). Among them, PtrNPF6.4, PtrNPF2.1, PtrNPF3.3, PtrNPF7.3, and PtrNPF7.4 were obviously induced by the salt treatment. To further confirm the transcriptome result, representative genes were selected for qRT-PCR assay, including the down-regulated genes PtrNPF1.2, PtrNPF1.4, PtrNPF1.6, PtrNPF4.8 and the up-regulated genes PtrNAR2.1, PtrNPF6.4, PtrNPF7.3, PtrNPF7.4, PtrNPF2.1, PtrNPF2.2, PtrNPF3.3, and PtrNPF5.4 (Figure 6B). Consistently, PtrNPF2.1, PtrNPF5.4, and PtrNPF7.4 were up-regulated to a huge degree. In addition, the supposed down-regulate genes like PtrNPF1.2, PtrNPF1.4, and PtrNPF4.8 were inhibited according to the qRT-PCR assay (Figure 6B). Taken together, the dramatic changes in NRT members’ expression under salt stress implied the potential relationship between nitrogen transportation and salt stress response.

4. Discussion

Nitrogen metabolism is one of the basic biological processes in plants, which involves a variety of enzymes and transporters. Among transmembrane carriers, NRTs are mainly involved in nitrate absorption and transportation in plants. In general, NRT members are divided into three families, NPF, NRT2, and NAR2. A total of 61 NRT genes (53 NPFs, 7 NRT2s, and 1 NAR2) had been identified in A. thaliana, 67 NRT genes (57 NPFs, 9 NRT2s, and 1 NAR2) were identified in spinach [11], 79 NRT genes (68 NPFs, 6 NRT2s, and 5 NAR2s) were identified in poplar [12], 84 NRT genes (73 NPFs, 5 NRT2s, and 2 NAR2s) were identified in apple [13]. Here, 64 NRTs were explored in the whole genome of P. trifoliata (Table 1), including 56 NPFs, 6 NRT2s, and 2 NAR2s. The number of NRTs in P. trifoliata was similar to other species, implying the relative stability of NRT family members throughout the evolutionary process. Moreover, the conserved domain and motif analysis were carried out to reveal further the relationship between the various members and the potential functions (Figure 3). One interesting point is that PtrNRT2.2 and PtrNRT2.3 share almost the same protein sequence. For the coding region, there are only a few nucleotide variations between two members. Moreover, both NRT2.2 and NRT2.3 are located at chromosome 3 (Figure 2) and possess almost the same expression pattern (Figure 4 and Figure 6), suggesting that they probably underwent the gene duplication event. The various motifs between NPF and NRT2 genes indicate the variety of molecular functions between high-affinity and low-affinity transport systems. In particular, motif 7 and motif 10 are presented in almost all NPF and NRT2 members, suggesting the essential role of these two domains in nitrate transportation. Motif 7 and motif 10 are respectively located at the C-terminus and the middle of NPF members, while both motif 7 and motif 10 have existed at the end of all NRT2 family members. In addition, the upstream 2000 nucleotides promoter sequences of PtrNRTs were extracted to perform cis-acting element analysis (Figure S4). The predicted results suggested that NRTs might be induced by plant hormones, like methyl jasmonate and abscisic acid. Some NRT promoters (including NPF7.3, NPF7.4, NPF8.2, and NPF8.3) were also found to possess the MYBHv1 binding sites, suggesting that those genes possibly share the same transcript regulation mechanism.
The function and regulation mechanism of NRTs in nitrate transportation were extensively reported. For example, 16 out of the 53 NPF genes have been performed functional verification in A. thaliana, which are classified into nitrate transporters and dipeptide metabolite transporters [16,17,49,50,51,52,53,54,55,56,57,58,59]. The NPFs belong to a low-affinity transport system except for AtNRT1.1, which possesses dual affinity [60]. NRT2s, the high-affinity transporters, have been reported to combine with membrane-targeted NAR2 proteins to enhance transport activity [15,61,62,63,64]. According to the expression pattern of PtrNRTs in different tissues (Figure 4), it could be found that PtrNRTs are widely expressed in whole plants, including root, stem, and leaf tissues. Whereas some genes are preferentially expressed in a specific tissue, indicating that they might be responsible for special transport functions. In addition, we performed the qRT-PCR assay for all NRT2 and NAR genes under the low nitrogen condition. The result suggested that the high-affinity transport system members were significantly induced by low nitrogen conditions in the root (Figure S3). In general, it could be concluded that PtrNRTs have potential functions in nitrogen uptake and transportation in P. trifoliata but need more verification in further work.
A growing body of reports suggested that the absorption, transportation, and assimilation of nitrogen were involved in plants’ salt resistance [34,35,38,40]. Accordingly, the expression of PtrNRTs were detected under salt condition. The results demonstrated that 30 out of 64 PtrNRT genes’ expression had significant alteration under salt treatment based on the RNA-seq and qRT-PCR assays (Figure 6). Some NRT members, like PtrNPF2.1, PtrNPF2.2, PtrNPF7.3, and PtrNPF7.4 were expressed at a low level in the control group, but their transcript levels were significantly increased after salt treatment. In addition, some of the repressed PtrNRT genes were also detected in response to salt stress, including PtrNPF1.2, PtrNPF1.4, PtrNPF4.4, PtrNPF4.9, PtrNRT2.2, and PtrNRT2.3. The fluctuations of PtrNRTs’ expression suspected that they were regulated by specific signals in response to salt stress. Besides, the expression profiles also provided some new sights for the functional research of NRTs. For example, the salt-induced expression of PtrNAR2.1 suggested that the activity of the high-affinity transport system should be increased under salt stress. However, the NRT2, the interaction partner of NAR2, was not up-regulated, implying that PtrNAR2s may have unidentified potential functions in salt response. Given that the specific functions of genes are often related to the expression level [65], we hypothesized that there are two possible ways in which NRT is in response to salt tolerance in plants. One is to increase the outflow of salt ions or reduce their absorption. Previous studies suggested that chloride (Cl) and nitrate had substitution transportation mechanisms, and NRTs also had been reported to have chloride ion transport activity [37]. Accordingly, we speculated that the plant might harbor a Cl/NO3 cooperative transport mechanism via the regulation of NRTs, which is important for salt resistance, especially for the Cl sensitive plant. The other pathway is to improve nitrogen metabolism, which finally accumulates more osmotic regulatory substances like amino acids to alleviate salt stress. Consistently, many amino acid metabolism pathways were clustered under salt conditions (Figure 5), which were potentially related to the up-regulated expression of NRTs for higher efficient nitrogen metabolism under salt stress. In conclusion, this study identified the NRT genes in P. trifoliata and detected their expression patterns under salt stress and in different tissues, which provided a significant reference for further functional research of PtrNRTs to improve the plant nitrogen use efficiency under salt stress.

Supplementary Materials

The following supporting information can be downloaded at: https://0-www-mdpi-com.brum.beds.ac.uk/article/10.3390/genes13071115/s1. Supplementary Materials contained Table S1A about the dosage of various ingredients of hydroponic culture solution, Table S1B is the low nitrogen treatment formula. Table S2 was about the primer pairs for the qRT-PCR experiment. Tables S3 and S4 contained the FPKM value of NRT genes from transcriptome data. Figure S1 shows detailed information about the motifs of the NRT gene. Figure S2 was the FPKM value-stack figure, which suggested the tissue differential expression. Figure S3 presented the expression of NRT2 and NAR genes under the low nitrogen condition. Figure S4 is the cis-acting elements of PtrNRT genes. Figure S5: Smart domain visualization. Text S1 was the protein sequence of 64 PtrNRT members. Text S2 was the upstream promoter sequence of 64 PtrNRT genes.

Author Contributions

C.L. conceived and designed the research. Z.Z. conducted the experiments, with assistance from M.L. and W.X., Z.Z. and C.L. analyzed the data. Z.Z., C.L. and J.-H.L. wrote the manuscript draft, C.L. and J.-H.L. finalized the writing and revision of the manuscript. All authors have read and agreed to the published version of the manuscript.

Funding

This work was supported by Hubei Hongshan Laboratory (2021hszd016) and the Huazhong Agricultural University (start-up funding to C.L.).

Institutional Review Board Statement

Not applicable.

Informed Consent Statement

Not applicable.

Data Availability Statement

The A. thaliana and P. trifoliata protein sequences were downloaded from the A. thaliana information source (TAIR) database (https://www.arabidopsis.org/, accessed on 2 March 2022) and Citrus Pan-genome to Breeding Database (CPBD, http://citrus.hzau.edu.cn/index.php, accessed on 1 March 2022).

Conflicts of Interest

Authors have no conflict of interest to declare.

References

  1. Wang, Y.Y.; Hsu, P.K.; Tsay, Y.F. Uptake, allocation and signaling of nitrate. Trends Plant Sci. 2012, 17, 458–467. [Google Scholar] [CrossRef] [PubMed]
  2. Nawaz, M.A.; Wang, L.M.; Jiao, Y.Y.; Chen, C.; Zhao, L.; Mei, M.J.; Yu, Y.L.; Bie, Z.L.; Huang, Y. Pumpkin rootstock improves nitrogen use efficiency of watermelon scion by enhancing nutrient uptake, cytokinin content, and expression of nitrate reductase genes. Plant Growth Regul. 2017, 82, 233–246. [Google Scholar] [CrossRef]
  3. Luo, J.; Li, H.; Liu, T.X.; Polle, A.; Peng, C.H.; Luo, Z.B. Nitrogen metabolism of two contrasting poplar species during acclimation to limiting nitrogen availability. J. Exp. Bot. 2013, 64, 4207–4224. [Google Scholar] [CrossRef] [PubMed] [Green Version]
  4. Konishi, M.; Yanagisawa, S. Emergence of a new step towards understanding the molecular mechanisms underlying nitrate-regulated gene expression. J. Exp. Bot. 2014, 65, 5589–5600. [Google Scholar] [CrossRef] [PubMed] [Green Version]
  5. Chow, F. Nitrate Assimilation: The role of in vitro nitrate reductase assay as nutritional predictor. In Applied Photosynthesis; Najapour, M., Ed.; InTech: Rijeka, Croatia, 2012; pp. 105–120. [Google Scholar]
  6. Crawford, N.M.; Glass, A.D.M. Molecular and physiological aspects of nitrate uptake in plants. Trends Plant Sci. 1998, 3, 389–395. [Google Scholar] [CrossRef]
  7. You, H.; Liu, Y.; Minh, T.N.; Lu, H.; Zhang, P.; Li, W.; Xiao, J.; Ding, X.; Li, Q. Genome-wide identification and expression analyses of nitrate transporter family genes in wild soybean (Glycine soja). J. Appl. Genet. 2020, 61, 489–501. [Google Scholar] [CrossRef]
  8. Zhang, J.; Han, Z.; Lu, Y.; Zhao, Y.; Wang, Y.; Zhang, J.; Ma, H.; Han, Y.Z. Genome-wide identification, structural and gene expression analysis of the nitrate transporters (NRTs) family in potato (Solanum tuberosum L.). PLoS ONE 2021, 16, e0257383. [Google Scholar] [CrossRef]
  9. O’Brien, J.A.; Vega, A.; Bouguyon, E.; Krouk, G.; Gojon, A.; Coruzzi, G.; Gutierrez, R.A. Nitrate Transport, Sensing, and Responses in Plants. Mol. Plant 2016, 9, 837–856. [Google Scholar] [CrossRef] [Green Version]
  10. Leran, S.; Varala, K.; Boyer, J.C.; Chiurazzi, M.; Crawford, N.; Daniel-Vedele, F.; David, L.; Dickstein, R.; Fernandez, E.; Forde, B.; et al. A unified nomenclature of NITRATE TRANSPORTER 1/PEPTIDE TRANSPORTER family members in plants. Trends Plant Sci. 2014, 19, 5–9. [Google Scholar] [CrossRef]
  11. Wang, X.; Cai, X.; Xu, C.; Wang, Q. Identification and characterization of the NPF, NRT2 and NRT3 in spinach. Plant Physiol. Biochem. 2021, 158, 297–307. [Google Scholar] [CrossRef]
  12. Bai, H.; Euring, D.; Volmer, K.; Janz, D.; Polle, A. The nitrate transporter (NRT) gene family in poplar. PLoS ONE 2013, 8, e72126. [Google Scholar] [CrossRef] [PubMed]
  13. Tahir, M.M.; Wang, H.; Ahmad, B.; Liu, Y.; Fan, S.; Li, K.; Lei, C.; Shah, K.; Li, S.H.; Zhang, D. Identification and characterization of NRT gene family reveals their critical response to nitrate regulation during adventitious root formation and development in apple rootstock. Sci. Hortic-Amst. 2021, 275, 109642. [Google Scholar] [CrossRef]
  14. Orsel, M.; Krapp, A.; Daniel-Vedele, F. Analysis of the NRT2 nitrate transporter family in Arabidopsis. Structure and gene expression. Plant Physiol. 2002, 129, 886–896. [Google Scholar] [CrossRef] [PubMed] [Green Version]
  15. Yong, Z.; Kotur, Z.; Glass, A.D. Characterization of an intact two-component high-affinity nitrate transporter from Arabidopsis roots. Plant J. 2010, 63, 739–748. [Google Scholar] [CrossRef] [PubMed]
  16. Lin, S.H.; Kuo, H.F.; Canivenc, G.; Lin, C.S.; Lepetit, M.; Hsu, P.K.; Tillard, P.; Lin, H.L.; Wang, Y.Y.; Tsai, C.B.; et al. Mutation of the Arabidopsis NRT1.5 nitrate transporter causes defective root-to-shoot nitrate transport. Plant Cell 2008, 20, 2514–2528. [Google Scholar] [CrossRef] [Green Version]
  17. Wang, Y.Y.; Tsay, Y.F. Arabidopsis Nitrate Transporter NRT1.9 Is Important in Phloem Nitrate Transport. Plant Cell 2011, 23, 1945–1957. [Google Scholar] [CrossRef] [Green Version]
  18. Hsu, P.K.; Tsay, Y.F. Two phloem nitrate transporters, NRT1.11 and NRT1.12, are important for redistributing xylem-borne nitrate to enhance plant growth. Plant Physiol. 2013, 163, 844–856. [Google Scholar] [CrossRef] [Green Version]
  19. Fang, Z.M.; Bai, G.X.; Huang, W.T.; Wang, Z.X.; Wang, X.L.; Zhang, M.Y. The Rice Peptide Transporter OsNPF7.3 Is Induced by Organic Nitrogen, and Contributes to Nitrogen Allocation and Grain Yield. Front. Plant Sci. 2017, 8, 1338. [Google Scholar] [CrossRef] [Green Version]
  20. Gu, C.S.; Zhang, X.X.; Chen, S.M.; Li, T.; Chen, Y.; Jiang, J.F.; Chen, F.D. Isolation and characterization of the Chrysanthemum nitrate transporter CmNRT1. Genet. Mol. Res. 2016, 15, gmr.15017148. [Google Scholar] [CrossRef]
  21. Hu, R.; Qiu, D.; Chen, Y.; Miller, A.J.; Fan, X.; Pan, X.; Zhang, M. Knock-Down of a Tonoplast Localized Low-Affinity Nitrate Transporter OsNPF7.2 Affects Rice Growth under High Nitrate Supply. Front. Plant Sci. 2016, 7, 1529. [Google Scholar] [CrossRef] [Green Version]
  22. Li, W.; Wang, Y.; Okamoto, M.; Crawford, N.M.; Siddiqi, M.Y.; Glass, A.D. Dissection of the AtNRT2.1: AtNRT2.2 inducible high-affinity nitrate transporter gene cluster. Plant Physiol. 2007, 143, 425–433. [Google Scholar] [CrossRef] [Green Version]
  23. Cerezo, M.; Tillard, P.; Filleur, S.; Munos, S.; Daniel-Vedele, F.; Gojon, A. Major alterations of the regulation of root NO3-uptake are associated with the mutation of Nrt2.1 and Nrt2.2 genes in arabidopsis. Plant Physiol. 2001, 127, 262–271. [Google Scholar] [CrossRef] [PubMed] [Green Version]
  24. Kiba, T.; Feria-Bourrellier, A.B.; Lafouge, F.; Lezhneva, L.; Boutet-Mercey, S.; Orsel, M.; Brehaut, V.; Miller, A.; Daniel-Vedele, F.; Sakakibara, H.; et al. The Arabidopsis nitrate transporter NRT2.4 plays a double role in roots and shoots of nitrogen-starved plants. Plant Cell 2012, 24, 245–258. [Google Scholar] [CrossRef] [PubMed] [Green Version]
  25. Lezhneva, L.; Kiba, T.; Feria-Bourrellier, A.B.; Lafouge, F.; Boutet-Mercey, S.; Zoufan, P.; Sakakibara, H.; Daniel-Vedele, F.; Krapp, A. The Arabidopsis nitrate transporter NRT2.5 plays a role in nitrate acquisition and remobilization in nitrogen-starved plants. Plant J. 2014, 80, 230–241. [Google Scholar] [CrossRef] [PubMed]
  26. Chopin, F.; Orsel, M.; Dorbe, M.F.; Chardon, F.; Truong, H.N.; Miller, A.J.; Krapp, A.; Daniel-Vedele, F. The Arabidopsis ATNRT2.7 nitrate transporter controls nitrate content in seeds. Plant Cell 2007, 19, 1590–1602. [Google Scholar] [CrossRef] [PubMed] [Green Version]
  27. Gu, C.; Song, A.; Zhang, X.; Wang, H.; Li, T.; Chen, Y.; Jiang, J.; Chen, F.; Chen, S. Cloning of chrysanthemum high-affinity nitrate transporter family (CmNRT2) and characterization of CmNRT2.1. Sci. Rep. 2016, 6, 23462. [Google Scholar] [CrossRef] [Green Version]
  28. Li, Y.; Li, J.Q.; Yan, Y.; Liu, W.Q.; Zhang, W.N.; Gao, L.H.; Tian, Y.Q. Knock-Down of CsNRT2.1, a Cucumber Nitrate Transporter, Reduces Nitrate Uptake, Root length, and Lateral Root Number at Low External Nitrate Concentration. Front. Plant Sci. 2018, 9, 722. [Google Scholar] [CrossRef] [Green Version]
  29. Zou, L.; Qi, D.; Sun, J.; Zheng, X.; Peng, M. Expression of the cassava nitrate transporter NRT2.1 enables Arabidopsis low nitrate tolerance. J. Genet. 2019, 98, 74. [Google Scholar] [CrossRef]
  30. Liu, T.K.; Dai, W.; Sun, F.F.; Yang, X.D.; Xiong, A.S.; Hou, X.L. Cloning and characterization of the nitrate transporter gene BraNRT2.1 in non-heading Chinese cabbage. Acta Physiol. Plant 2014, 36, 815–823. [Google Scholar] [CrossRef]
  31. Kotur, Z.; Mackenzie, N.; Ramesh, S.; Tyerman, S.D.; Kaiser, B.N.; Glass, A.D.M. Nitrate transport capacity of the Arabidopsis thaliana NRT2 family members and their interactions with AtNAR2.1. New Phytol. 2012, 194, 724–731. [Google Scholar] [CrossRef]
  32. Morton, M.J.L.; Awlia, M.; Al-Tamimi, N.; Saade, S.; Pailles, Y.; Negrao, S.; Tester, M. Salt stress under the scalpel—dissecting the genetics of salt tolerance. Plant J. 2019, 97, 148–163. [Google Scholar] [CrossRef] [PubMed] [Green Version]
  33. Al-Yassin, A. Influence of salinity on citrus A review paper. J. Cent. Eur. Agric. 2004, 5, 263–272. [Google Scholar]
  34. Miranda, R.D.; Gomes, E.; Prisco, J.T.; Alvarez-Pizarro, J.C. Ammonium improves tolerance to salinity stress in Sorghum bicolor plants. Plant Growth Regul. 2016, 78, 121–131. [Google Scholar] [CrossRef]
  35. Singh, M.; Singh, V.P.; Prasad, S.M. Responses of photosynthesis, nitrogen and proline metabolism to salinity stress in Solanum lycopersicum under different levels of nitrogen supplementation. Plant Physiol. Bioch. 2016, 109, 72–83. [Google Scholar] [CrossRef]
  36. Jahan, B.; AlAjmi, M.F.; Rehman, M.T.; Khan, N.A. Treatment of nitric oxide supplemented with nitrogen and sulfur regulates photosynthetic performance and stomatal behavior in mustard under salt stress. Physiol. Plant. 2020, 168, 490–510. [Google Scholar]
  37. Xiao, Q.Y.; Chen, Y.; Liu, C.W.; Robson, F.; Roy, S.; Cheng, X.F.; Wen, J.Q.; Mysore, K.; Miller, A.J.; Murray, J.D. MtNPF6.5 mediates chloride uptake and nitrate preference in Medicago roots. EMBO J. 2021, 40, e106847. [Google Scholar] [CrossRef] [PubMed]
  38. Ehlting, B.; Dluzniewska, P.; Dietrich, H.; Selle, A.; Teuber, M.; Hansch, R.; Nehls, U.; Polle, A.; Schnitzler, J.P.; Rennenberg, H.; et al. Interaction of nitrogen nutrition and salinity in Grey poplar (Populus tremula × alba). Plant Cell Environ. 2007, 30, 796–811. [Google Scholar] [CrossRef]
  39. Lv, X.F.; Yu, P.; Deng, W.H.; Li, Y.C. Transcriptomic analysis reveals the molecular adaptation to NaCl stress in Zostera marina L. Plant Physiol. Bioch. 2018, 130, 61–68. [Google Scholar] [CrossRef] [PubMed]
  40. Del Castello, F.; Nejamkin, A.; Cassia, R.; Correa-Aragunde, N.; Fernandez, B.; Foresi, N.; Lombardo, C.; Ramirez, L.; Lamattina, L. The era of nitric oxide in plant biology: Twenty years tying up loose ends. Nitric Oxide-Biol. Ch. 2019, 85, 17–27. [Google Scholar] [CrossRef]
  41. Sykes, S.R. Chloride and sodium excluding capacities of citrus rootstock germplasm introduced to Australia from the People’s Republic of China. Sci. Hortic-Amst. 2011, 128, 443–449. [Google Scholar] [CrossRef]
  42. Kaleem, F.; Shabir, G.; Aslam, K.; Rasul, S.; Manzoor, H.; Shah, S.M.; Khan, A.R. An Overview of the Genetics of Plant Response to Salt Stress: Present Status and the Way Forward. Appl. Biochem. Biotechnol. 2018, 186, 306–334. [Google Scholar] [CrossRef] [PubMed]
  43. Chen, C.J.; Chen, H.; Zhang, Y.; Thomas, H.R.; Frank, M.H.; He, Y.H.; Xia, R. TBtools: An Integrative Toolkit Developed for Interactive Analyses of Big Biological Data. Mol. Plant 2020, 13, 1194–1202. [Google Scholar] [CrossRef] [PubMed]
  44. Wilkins, M.R.; Gasteiger, E.; Bairoch, A.; Sanchez, J.C.; Williams, K.L.; Appel, R.D.; Hochstrasser, D.F. Protein identification and analysis tools in the ExPASy server. Methods Mol. Biol. 1999, 112, 531–552. [Google Scholar] [PubMed]
  45. Hall, B.G. Building phylogenetic trees from molecular data with MEGA. Mol. Biol. Evol. 2013, 30, 1229–1235. [Google Scholar] [CrossRef] [Green Version]
  46. Ren, Z.J.; Bai, F.L.; Xu, J.W.; Wang, L.; Wang, X.H.; Zhang, Q.; Feng, C.X.; Niu, Q.; Zhang, L.Y.; Song, J.L.; et al. A chloride efflux transporter, BIG RICE GRAIN 1, is involved in mediating grain size and salt tolerance in rice. J. Integr. Plant Biol. 2021, 63, 2150–2163. [Google Scholar] [CrossRef]
  47. Rombauts, S.; Dehais, P.; Van Montagu, M.; Rouze, P. PlantCARE, a plant cis-acting regulatory element database. Nucleic Acids Res. 1999, 27, 295–296. [Google Scholar] [CrossRef] [Green Version]
  48. Lescot, M.; Dehais, P.; Thijs, G.; Marchal, K.; Moreau, Y.; Van de Peer, Y.; Rouze, P.; Rombauts, S. PlantCARE, a database of plant cis-acting regulatory elements and a portal to tools for in silico analysis of promoter sequences. Nucleic Acids Res. 2002, 30, 325–327. [Google Scholar] [CrossRef]
  49. Li, J.Y.; Fu, Y.L.; Pike, S.M.; Bao, J.; Tian, W.; Zhang, Y.; Chen, C.Z.; Zhang, Y.; Li, H.M.; Huang, J.; et al. The Arabidopsis nitrate transporter NRT1.8 functions in nitrate removal from the xylem sap and mediates cadmium tolerance. Plant Cell 2010, 22, 1633–1646. [Google Scholar] [CrossRef] [Green Version]
  50. Komarova, N.Y.; Thor, K.; Gubler, A.; Meier, S.; Dietrich, D.; Weichert, A.; Suter Grotemeyer, M.; Tegeder, M.; Rentsch, D. AtPTR1 and AtPTR5 transport dipeptides in planta. Plant Physiol. 2008, 148, 856–869. [Google Scholar] [CrossRef]
  51. Almagro, A.; Lin, S.H.; Tsay, Y.F. Characterization of the Arabidopsis nitrate transporter NRT1.6 reveals a role of nitrate in early embryo development. Plant Cell 2008, 20, 3289–3299. [Google Scholar] [CrossRef] [Green Version]
  52. Dietrich, D.; Hammes, U.; Thor, K.; Suter-Grotemeyer, M.; Fluckiger, R.; Slusarenko, A.J.; Ward, J.M.; Rentsch, D. AtPTR1, a plasma membrane peptide transporter expressed during seed germination and in vascular tissue of Arabidopsis. Plant J. 2004, 40, 488–499. [Google Scholar] [CrossRef] [PubMed]
  53. Chiu, C.C.; Lin, C.S.; Hsia, A.P.; Su, R.C.; Lin, H.L.; Tsay, Y.F. Mutation of a nitrate transporter, AtNRT1:4, results in a reduced petiole nitrate content and altered leaf development. Plant Cell Physiol. 2004, 45, 1139–1148. [Google Scholar] [CrossRef] [PubMed]
  54. Chiang, C.S.; Stacey, G.; Tsay, Y.F. Mechanisms and functional properties of two peptide transporters, AtPTR2 and fPTR2. J. Biol. Chem. 2004, 279, 30150–30157. [Google Scholar] [CrossRef] [PubMed] [Green Version]
  55. Huang, N.C.; Liu, K.H.; Lo, H.J.; Tsay, Y.F. Cloning and functional characterization of an Arabidopsis nitrate transporter gene that encodes a constitutive component of low-affinity uptake. Plant Cell 1999, 11, 1381–1392. [Google Scholar] [CrossRef] [Green Version]
  56. Rentsch, D.; Laloi, M.; Rouhara, I.; Schmelzer, E.; Delrot, S.; Frommer, W.B. Ntr1 Encodes a High-Affinity Oligopeptide Transporter in Arabidopsis. FEBS Lett. 1995, 370, 264–268. [Google Scholar] [CrossRef] [Green Version]
  57. Karim, S.; Lundh, D.; Holmstrom, K.O.; Mandal, A.; Pirhonen, M. Structural and functional characterization of AtPTR3, a stress-induced peptide transporter of Arabidopsis. J. Mol. Model. 2005, 11, 226–236. [Google Scholar] [CrossRef]
  58. Song, W.; Steiner, H.Y.; Zhang, L.; Naider, F.; Stacey, G.; Becker, J.M. Cloning of a second arabidopsis peptide transport gene. Plant Physiol. 1996, 110, 171–178. [Google Scholar] [CrossRef] [Green Version]
  59. Fan, S.C.; Lin, C.S.; Hsu, P.K.; Lin, S.H.; Tsay, Y.F. The Arabidopsis Nitrate Transporter NRT1.7, Expressed in Phloem, Is Responsible for Source-to-Sink Remobilization of Nitrate. Plant Cell 2009, 21, 2750–2761. [Google Scholar] [CrossRef] [Green Version]
  60. Liu, K.H.; Huang, C.Y.; Tsay, Y.F. CHL1 is a dual-affinity nitrate transporter of arabidopsis involved in multiple phases of nitrate uptake. Plant Cell 1999, 11, 865–874. [Google Scholar] [CrossRef]
  61. Okamoto, M.; Kumar, A.; Li, W.B.; Wang, Y.; Siddiqi, M.Y.; Crawford, N.M.; Glass, A.D.M. High-affinity nitrate transport in roots of Arabidopsis depends on expression of the NAR2-like gene AtNRT3.1. Plant Physiol. 2006, 140, 1036–1046. [Google Scholar] [CrossRef] [Green Version]
  62. Orsel, M.; Chopin, F.; Leleu, O.; Smith, S.J.; Krapp, A.; Daniel-Vedele, F.; Miller, A.J. Characterization of a two-component high-affinity nitrate uptake system in Arabidopsis. Physiology and protein-protein interaction. Plant Physiol. 2006, 142, 1304–1317. [Google Scholar] [CrossRef] [PubMed] [Green Version]
  63. Feng, H.; Fan, X.; Fan, X.; Liu, X.; Miller, A.J.; Xu, G. Multiple roles of nitrate transport accessory protein NAR2 in plants. Plant Signal. Behav. 2011, 6, 1286–1289. [Google Scholar] [CrossRef] [PubMed]
  64. Laugier, E.; Bouguyon, E.; Mauries, A.; Tillard, P.; Gojon, A.; Lejay, L. Regulation of high-affinity nitrate uptake in roots of Arabidopsis depends predominantly on posttranscriptional control of the NRT2.1/NAR2.1 transport system. Plant Physiol. 2012, 158, 1067–1078. [Google Scholar] [CrossRef] [PubMed] [Green Version]
  65. Anil, V.S.; Harmon, A.C.; Rao, K.S. Spatio-temporal accumulation and activity of calcium-dependent protein kinases during embryogenesis, seed development, and germination in sandalwood. Plant Physiol. 2000, 122, 1035–1043. [Google Scholar] [CrossRef] [Green Version]
Figure 1. Phylogenetic analysis of NRT members from P. trifoliata and A. thaliana. A total of 64 NRT protein sequences from P. trifoliata (56 NPFs, 6 NRT2s, and 2 NAR2s) and 61 from A. thaliana (53 NPFs, 7 NRT2s, and 1 NAR2) were aligned by ClustalW method. The MEGAX program was applied to construct the phylogenetic tree by the ML method in the default parameters. The whole tree was divided into three parts, NRT1/PTR, NRT2, and NAR2. The modification of the tree was carried out on the iTOL (https://itol.embl.de/, accessed on 1 March 2022).
Genes 13 01115 g001
Figure 2. Analysis of evolutionary relationship and gene location of NRT family members in P. trifoliata. The red lines were the syntenic gene pairs among A. thaliana and P. trifoliata genomes. The blue lines were the syntenic gene pairs of P. trifoliata. Chr referred to chromosome. The location of NRT genes on chromosomes were labeled.
Genes 13 01115 g002
Figure 3. Motif, conserved domain, and gene structure analysis of PtrNRT genes. (A) The motif analysis was performed on the MEME (https://meme-suite.org/meme/doc/meme.html, accessed on 1 March 2022). Ten motifs were identified. The detail of motif sequence information was presented in supplemental Figure S1. (B) The conserved domain analysis was performed through the NCBI Batch CD-search tool. (C) The gene structure analysis. The yellow color was the untranslated region, while the green was the coding sequence. The line without color referred to introns.
Genes 13 01115 g003
Figure 4. Differential gene expression of PtrNRTs in a variety of tissue. (A) The FPKM value of 64 PtrNRT genes in a heatmap. (B) The relative expression of selected PtrNRT members by qRT-PCR assay. The root tissue was defined to be the reference. * Represented significant differences in comparison with root group using Student’s t-test at 0.01 < p < 0.05. ** Represented significant differences at 0.001 < p < 0.01. *** Represented significant differences at p < 0.001.
Genes 13 01115 g004
Figure 5. GO and KEGG pathway enrichment plot. The GO (A) and KEGG (B) enrichment plots were constructed by TBtools. Both GO and KEGG enrichment p-value of pathways were verified by the BH method. In addition, the bubble plots used the bubble shiny plugin (C,D). The circle color represented the enrichment degree, and the size of the circle represented the differential genes participating in a certain pathway.
Genes 13 01115 g005
Figure 6. Differential gene expression of PtrNRTs under salt conditions. (A) The FPKM value from the control and NaCl treatment group. Each group had three biological repetitions. Heat map data was selected from RNA-seq (Table S3,Table S4). (B) The selected genes’ expression by qRT-PCR assay. The relative expression was calculated by 2−∆∆CT method. *** Represented significant difference in comparison with control group using Student’s t-test at p < 0.001. (C) The representative differential expression genes under salt stress. (D) The Venn plot includes the up and down-regulated genes. The green circle represented all the 64 NRT genes. The red circle and the blue circle respectively represented the genes that up and down-regulated under salt stress (log2 Fold Change absolute value > 1).
Genes 13 01115 g006
Table 1. Characteristics of PtrNRT members.
Accession Number 1Gene IDNo. of AA 2Start Site 3End Site 3MW (kDa) 4pI 5GRAVY 6
Pt1g007360PtrNPF1.15856701392670681364.94 9.24 0.316
Pt7g010530PtrNPF1.2625129328061293642168.80 8.47 0.293
Pt1g005100PtrNPF1.35723120786312824062.63 8.73 0.282
Pt1g007370PtrNPF1.45946707620670990665.68 8.73 0.200
Pt8g002750PtrNPF1.55761842390185891063.44 8.50 0.311
Pt1g005080PtrNPF1.65813134219313746663.91 7.44 0.265
Pt3g001010PtrNPF2.15881262243126491865.37 9.36 0.224
Pt3g001000PtrNPF2.26211247077125879068.69 9.03 0.188
Pt3g001020PtrNPF2.35991271264127323766.08 9.05 0.249
Pt4g003350PtrNPF2.46152043405204730668.49 9.18 0.224
Pt6g014330PtrNPF2.5589101271321012920665.21 9.09 0.225
Pt6g013450PtrNPF3.18749410246941504896.73 6.48 0.199
Pt4g008540PtrNPF3.25816165780616949364.65 8.98 0.250
Pt4g008550PtrNPF3.35816155010615855564.31 8.90 0.285
Pt2g029890PtrNPF4.1895286948542870398298.89 7.25 0.204
Pt4g012130PtrNPF4.25249062853906592058.15 9.05 0.328
PtUn015880PtrNPF4.3605318897343189323767.43 9.15 0.140
Pt3g020700PtrNPF4.4614255839422558771168.26 8.94 0.283
Pt5g003870PtrNPF4.55882587369259041265.06 8.70 0.329
Pt4g003240PtrNPF4.65791982178198720463.48 8.17 0.428
Pt3g001060PtrNPF4.75771312638131596963.72 9.13 0.383
PtUn010670PtrNPF4.8616210863182108932767.70 7.03 0.256
PtUn010660PtrNPF4.9597210378302104857065.82 8.14 0.263
Pt4g020770PtrNPF5.1584203567722036090665.32 9.16 0.200
Pt9g008600PtrNPF5.26336405423641525370.97 9.13 0.262
PtUn035060PtrNPF5.3595676664836768328166.58 9.18 0.237
PtUn007180PtrNPF5.4610111169911112054267.74 9.00 0.326
Pt6g013470PtrNPF5.54889424535942652455.00 8.26 0.433
Pt6g014250PtrNPF5.6592100601191006446665.62 8.88 0.332
Pt6g013460PtrNPF5.75709416116942329263.61 5.56 0.430
Pt5g016390PtrNPF5.8777128243261283104086.71 9.18 0.295
Pt2g008110PtrNPF5.95354826115483006659.83 8.75 0.354
Pt5g005040PtrNPF5.105583350358335269661.58 8.01 0.412
PtUn026920PtrNPF5.11498547858365478935555.57 9.61 0.225
Pt5g005050PtrNPF5.125693357900336171962.83 6.95 0.369
Pt9g009730PtrNPF5.134317757020775858348.69 8.30 0.132
Pt9g009670PtrNPF5.144487703996770673550.57 8.80 0.186
PtUn005790PtrNPF5.155677939272794211464.07 9.13 0.451
Pt9g009790PtrNPF5.167887812307781544587.66 8.56 0.231
Pt9g008580PtrNPF5.175956395222639832866.54 9.11 0.208
Pt3g030260PtrNPF5.18606359412393594475967.20 9.20 0.243
PtUn028140PtrNPF5.19628564548245646116870.25 9.42 0.370
PtUn008620PtrNPF6.1634141601941416288470.31 8.83 0.238
Pt1g006350PtrNPF6.25812152543215588263.49 9.08 0.339
Pt3g008120PtrNPF6.35536492850649678560.95 9.10 0.263
Pt2g013780PtrNPF6.4588174494661745195265.33 9.13 0.226
Pt5g002490PtrNPF6.55151693500169353256.93 5.60 0.239
Pt1g003070PtrNPF6.65794853921485790063.509.200.409
Pt2g001610PtrNPF7.15041224993122802155.40 9.00 0.339
Pt3g039860PtrNPF7.2602425713484257408866.47 7.90 0.199
Pt4g015230PtrNPF7.3596134173841342188966.00 6.39 0.265
Pt3g041260PtrNPF7.4613435748974357950668.08 8.40 0.213
Pt6g013550PtrNPF8.15689499282950358763.40 8.82 0.214
Pt8g011520PtrNPF8.25749266295927018064.15 6.76 0.182
Pt2g017400PtrNPF8.3584206315522063651264.40 5.96 0.303
Pt6g013540PtrNPF8.45019494530949653855.98 8.58 0.246
Pt8g007700PtrNRT2.15355808930581137957.99 9.140.343
Pt8g007710PtrNRT2.25303120817312274757.43 9.350.374
Pt8g007720PtrNRT2.35306554577655616957.39 9.350.382
Pt6g017660PtrNRT2.45306537447653936657.48 9.220.392
Pt4g006700PtrNRT2.54196559711656154745.27 9.180.392
Pt2g007200PtrNRT2.6471156346251563690450.91 8.960.456
Pt3g004750PtrNAR2.11734426662442740319.23 9.37−0.479
Pt4g006240PtrNAR2.21703424356342507719.14 6.830.002
1 Accession number consisted of the CPBD. 2 Number of AA represented the number of the amino acids in each protein sequence. 3 Start site and end site were found in the gene structure file download in CPBD. 4 MW (kDa) was the molecular weight. 5 The pI was the theoretical isoelectric point. 6 GRAVY was the Grand average of hydropathicity. The number of amino acids, molecular weight, theoretical isoelectric point, and the grand average of hydropathicity were calculated and predicted on the Expasy website (https://web.expasy.org/protparam/, accessed on 1 March 2022).
Publisher’s Note: MDPI stays neutral with regard to jurisdictional claims in published maps and institutional affiliations.

