
Genotype-Phenotype Correlation and Functional Insights for Two Monoallelic TREX1 Missense Variants Affecting the Catalytic Core

 , , , , , , , and
Abstract
:1. Introduction
2. Results
2.1. Clinical and Neuroradiological Features of Patients
2.1.1. Patient A
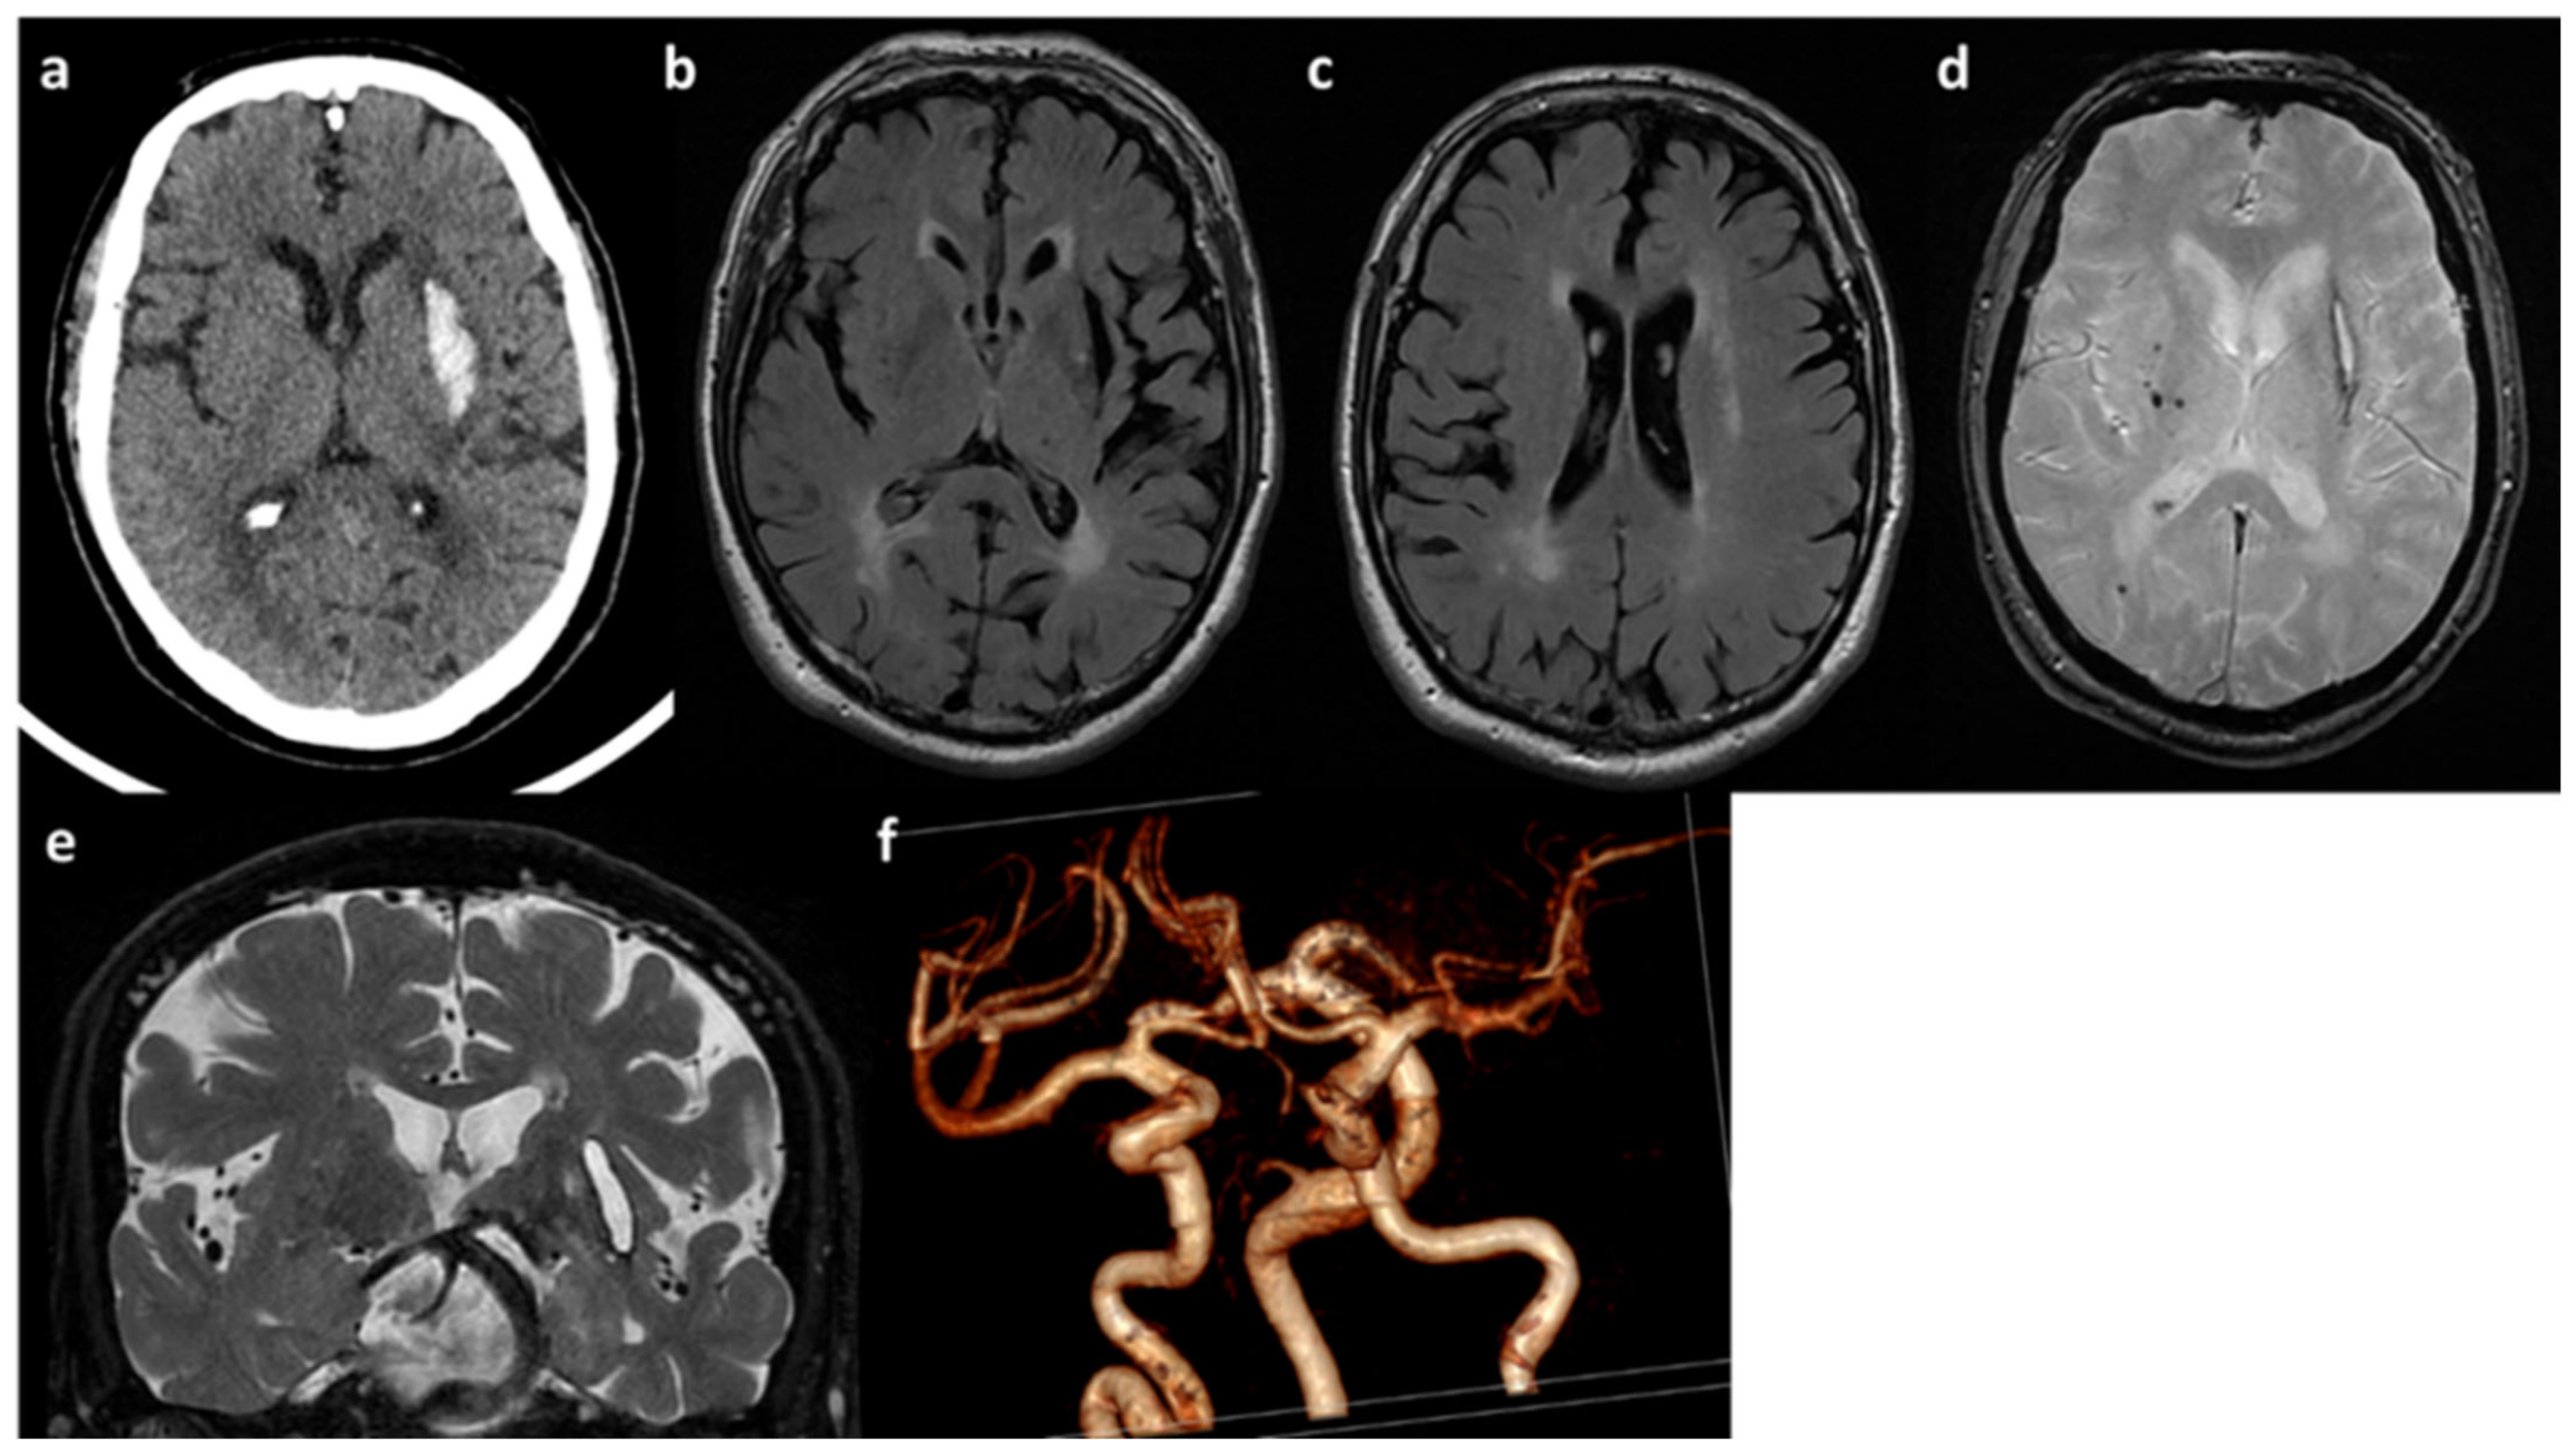
2.1.2. Patient B
2.2. Genetic Analysis Findings
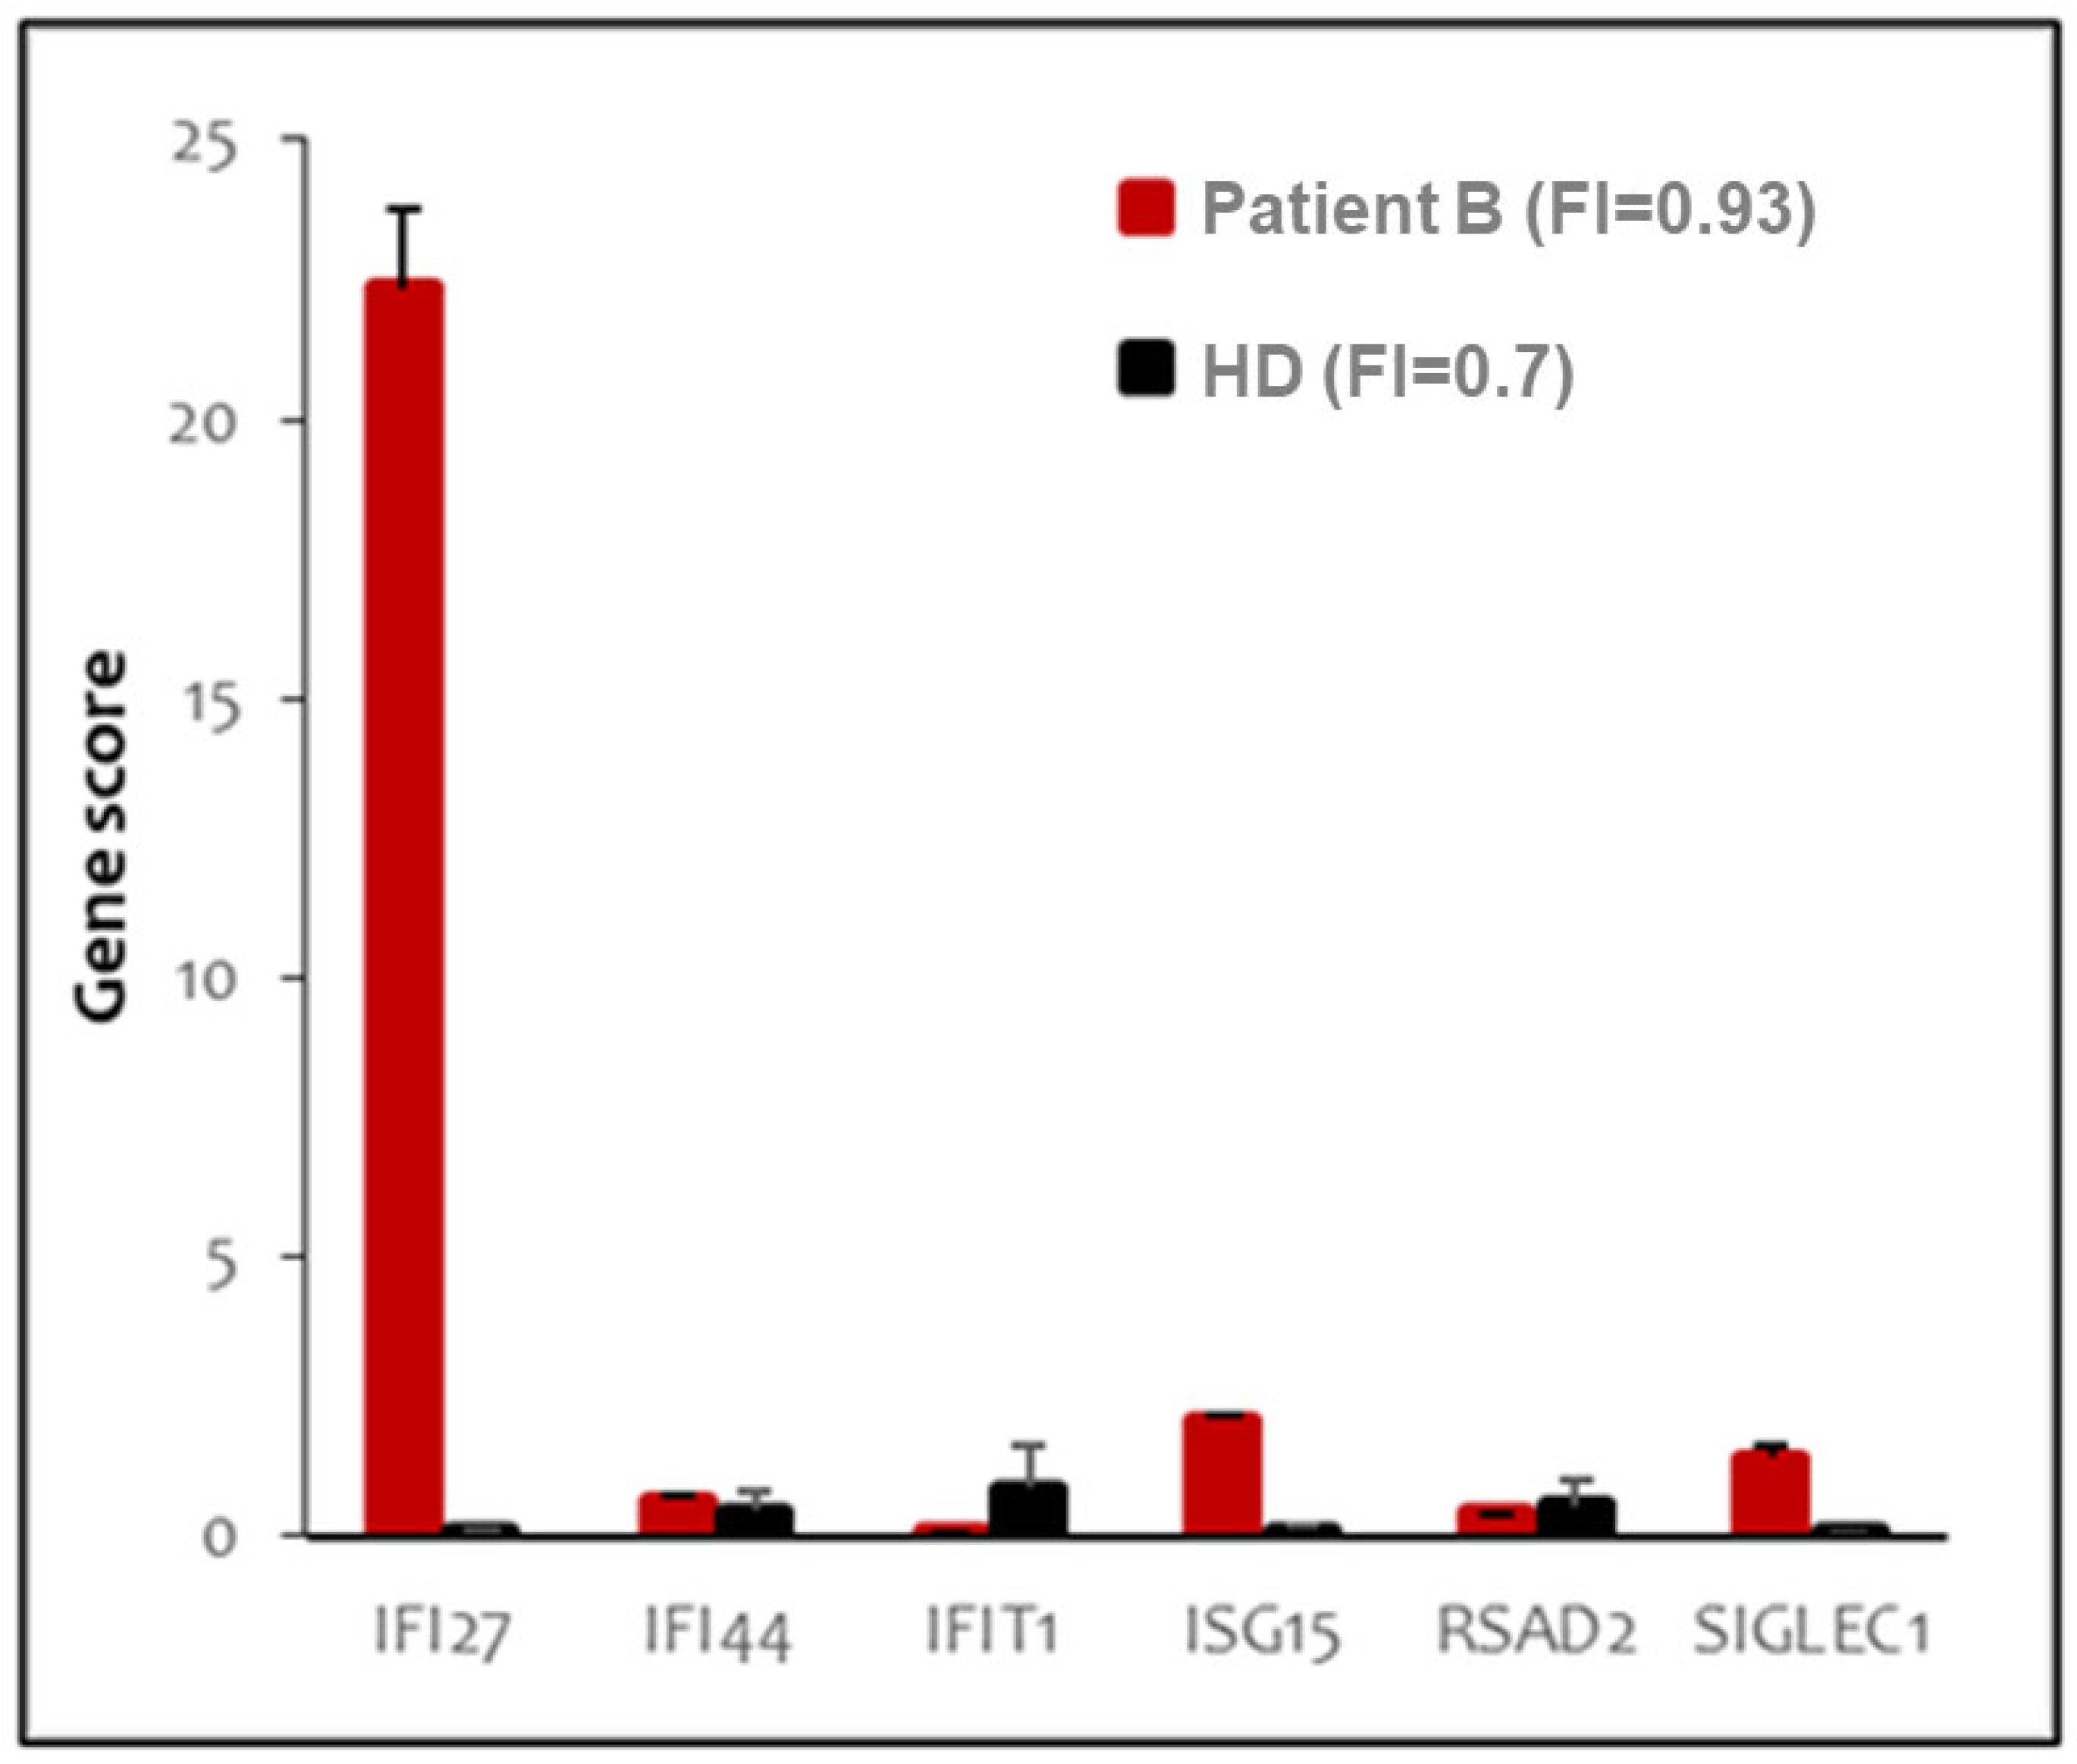
2.3. Peripheral Blood Type I Interferon Activity
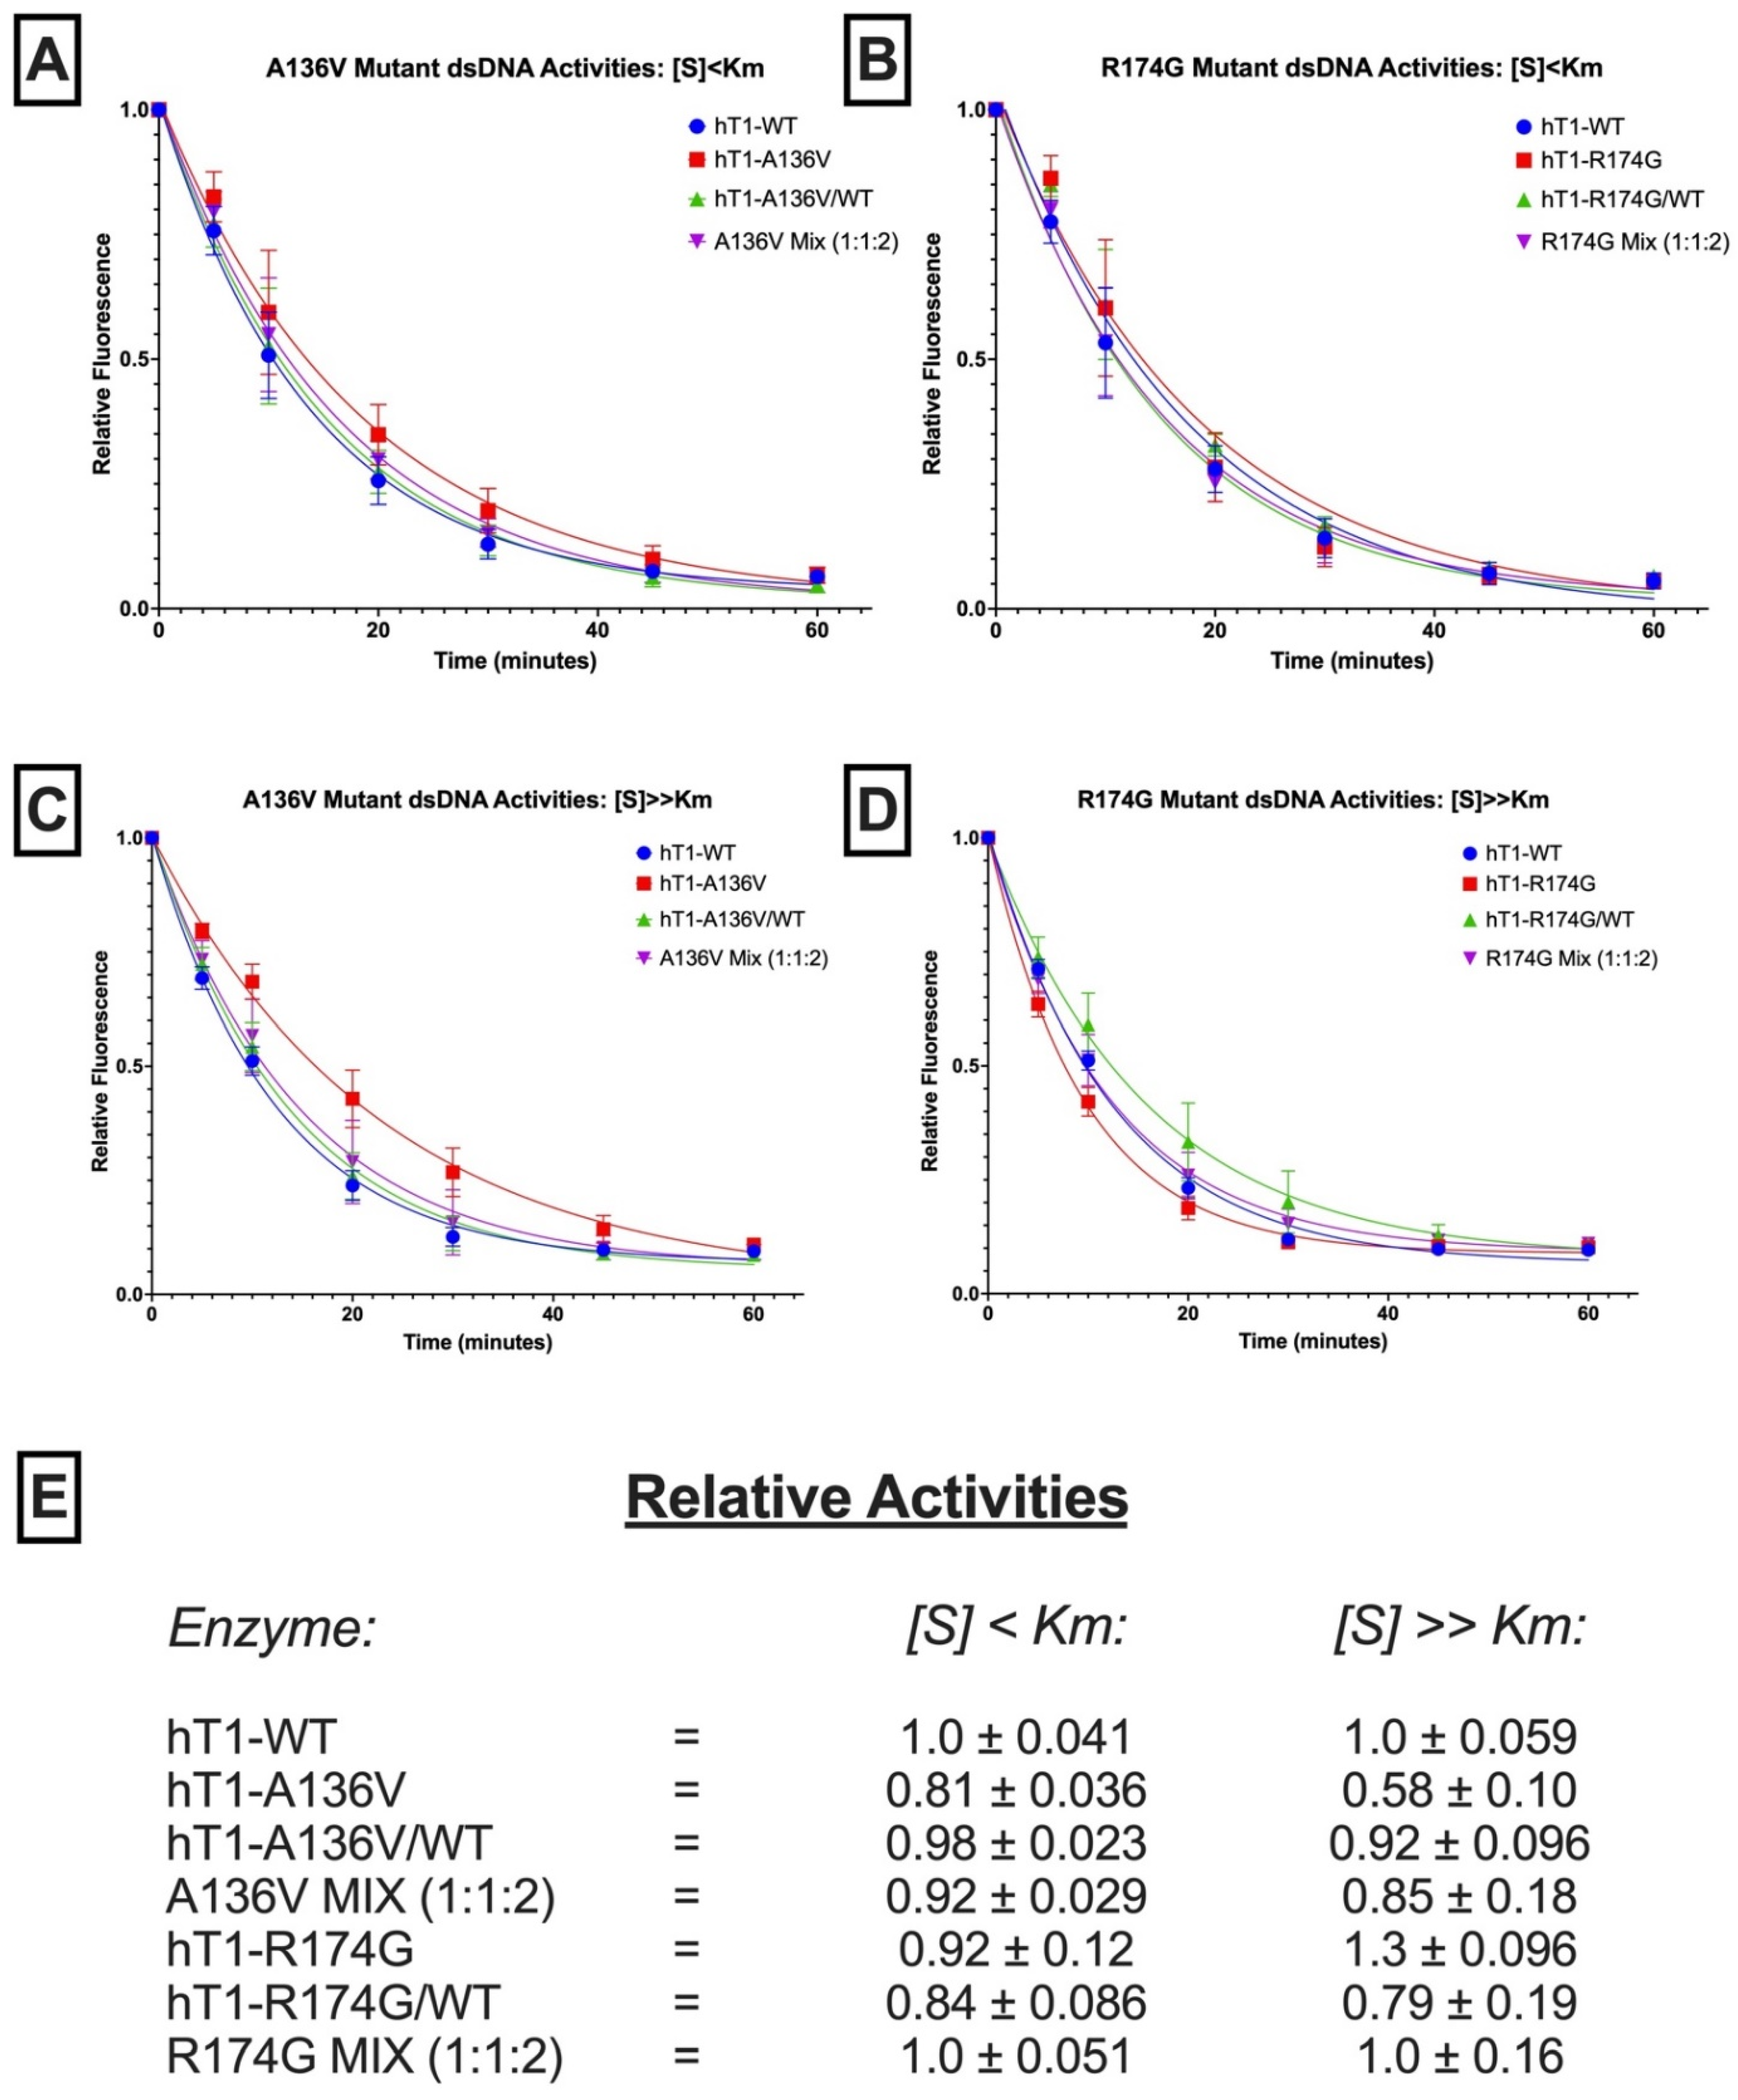
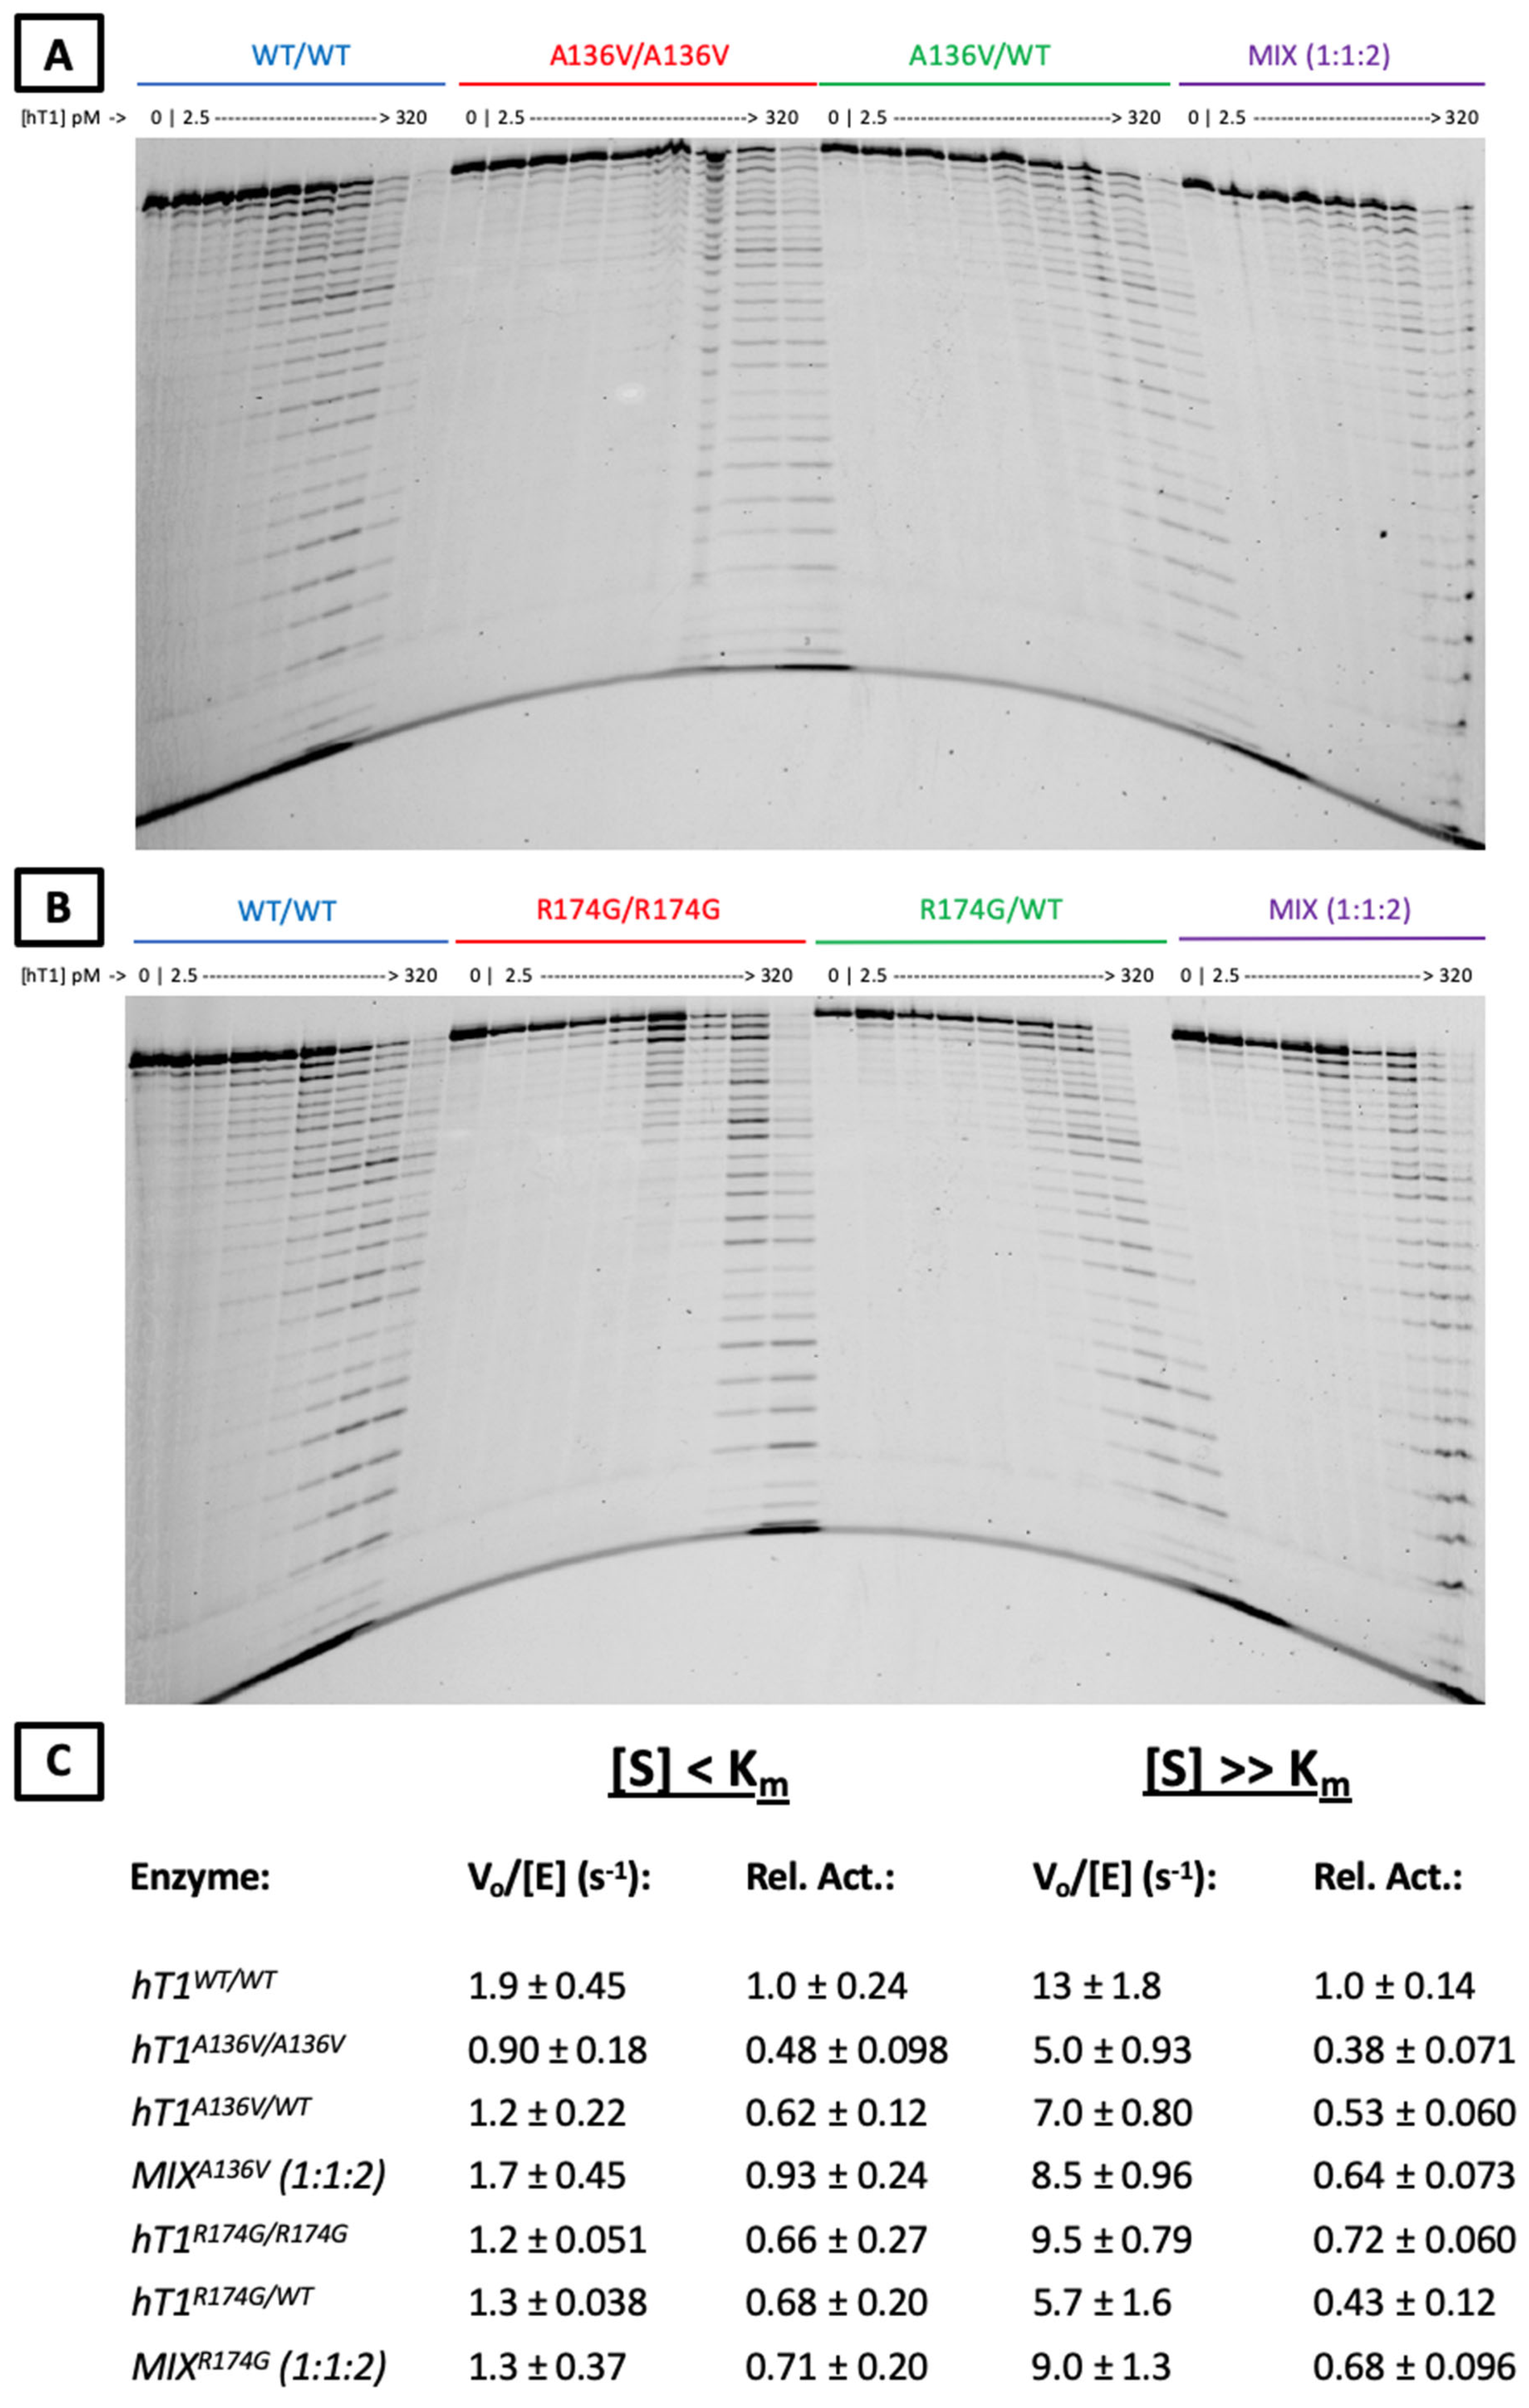
2.4. Exonuclease Activities of Mutant Enzymes
3. Discussion
4. Material & Methods
4.1. Genetic Analysis
4.2. Bioinformatic Analysis of NGS-Panels Genetic Data
4.3. Peripheral Blood Type I Interferon Signature
4.4. Generation of Wild-Type and Mutant TREX1 Plasmids
4.5. Overexpression and Purification of Recombinant TREX1 Enzymes
4.6. Fluorescence-Based dsDNA Exonuclease Assay
4.7. Fluorescence-Based ssDNA Exonuclease Assay
4.8. Quantification of Fluorescence-Based Data
4.9. Agarose Gel dsDNA Assay
4.10. Quantification of Agarose Gels
4.11. Polyacrylamide Gel ssDNA Assay
4.12. Quantification of Polyacrylamide Gels
4.13. Observation-Theory Comparisons for Exonuclease Activities
4.14. Modeling of Human TREX1 Enzyme Structure
Supplementary Materials
Author Contributions
Funding
Institutional Review Board Statement
Informed Consent Statement
Data Availability Statement
Acknowledgments
Conflicts of Interest
References
- Perrino, F.W.; Miller, H.; Ealey, K.A. Identification of a 3′→5′-exonuclease that removes cytosine arabinoside monophosphate from 3′ termini of DNA. J. Biol. Chem. 1994, 269, 16357–16363. [Google Scholar] [CrossRef]
- Mazur, D.J.; Perrino, F.W. Excision of 3′ Termini by the Trex1 and TREX2 3′→5′ Exonucleases CHARACTERIZATION OF THE RECOMBINANT PROTEINS. J. Biol. Chem. 2001, 276, 17022–17029. [Google Scholar] [CrossRef] [Green Version]
- Belyakova, N.V.; Kleiner, N.E.; Kravetskaya, T.P.; Legina, O.K.; Naryzhny, S.N.; Perribo, F.W.; Shevelev, I.V.; Krutyakov, V.M. Proof-reading 3′→5′ exonucleases isolated from rat liver nuclei. Eur. J. Biochem. 1993, 217, 493–500. [Google Scholar] [CrossRef]
- Mazur, D.J.; Perrino, F.W. Identification and Expression of the TREX1 and TREX2 cDNA Sequences Encoding Mammalian 3′→5′ Exonucleases. J. Biol. Chem. 1999, 274, 19655–19660. [Google Scholar] [CrossRef] [Green Version]
- De Silva, U.; Choudhury, S.; Bailey, S.L.; Harvey, S.; Perrino, F.W.; Hollis, T. The Crystal Structure of TREX1 Explains the 3′ Nucleotide Specificity and Reveals a Polyproline II Helix for Protein Partnering. J. Biol. Chem. 2007, 282, 10537–10543. [Google Scholar] [CrossRef] [PubMed] [Green Version]
- Orebaugh, C.D.; Fye, J.M.; Harvey, S.; Hollis, T.; Wilkinson, J.C.; Perrino, F.W. The TREX1 C-terminal Region Controls Cellular Localization through Ubiquitination. J. Biol. Chem. 2013, 288, 28881–28892. [Google Scholar] [CrossRef] [Green Version]
- Hasan, M.; Fermaintt, C.S.; Gao, N.; Sakai, T.; Miyazaki, T.; Jiang, S.; Li, Q.Z.; Atkinson, J.P.; Morse, H.C., III; Lehrman, M.A.; et al. Cytosolic nuclease TREX1 regulates oligosaccharyltransferase activity independent of nuclease activity to suppress immune activation. Immunity 2015, 43, 463–474. [Google Scholar] [CrossRef] [Green Version]
- Kucej, M.; Fermaintt, C.S.; Yang, K.; Irizarry-Caro, R.A.; Yan, N. Mitotic Phosphorylation of TREX1 C Terminus Disrupts TREX1 Regulation of the Oligosaccharyltransferase Complex. Cell Rep. 2017, 18, 2600–2607. [Google Scholar]
- Chowdhury, D.; Beresford, P.J.; Zhu, P.; Zhang, D.; Sung, J.S.; Demple, B.; Perrino, F.W.; Lieberman, J. The Exonuclease TREX1 Is in the SET Complex and Acts in Concert with NM23-H1 to Degrade DNA during Granzyme A-Mediated Cell Death. Mol. Cell 2006, 23, 133–142. [Google Scholar]
- Morita, M.; Stamp, G.; Robins, P.; Dulic, A.; Rosewell, I.; Hrivnak, G.; Daly, G.; Lindahl, T.; Barnes, D.E. Gene-Targeted Mice Lacking the Trex1 (DNase III) 3′→5′ DNA Exonuclease Develop Inflammatory Myocarditis. Mol. Cell. Biol. 2004, 24, 6719–6727. [Google Scholar] [CrossRef] [Green Version]
- Simpson, S.R.; Hemphill, W.O.; Hudson, T.; Perrino, F.W. TREX1–Apex predator of cytosolic DNA metabolism. DNA Repair 2020, 94, 102894. [Google Scholar] [CrossRef] [PubMed]
- Ablasser, A.; Hemmerling, I.; Schmid-Burgk, J.L.; Behrendt, R.; Roers, A.; Hornung, V. TREX1 Deficiency Triggers Cell-Autonomous Immunity in a cGAS-Dependent Manner. J. Immunol. 2014, 192, 5993–5997. [Google Scholar] [CrossRef] [PubMed] [Green Version]
- Simpson, S.R.; Rego, S.L.; Harvey, S.E.; Liu, M.; Hemphill, W.O.; Venkatadri, R.; Sharma, R.; Grayson, J.M.; Perrino, F.W. T Cells Produce IFN-α in the TREX1 D18N Model of Lupus-like Autoimmunity. J. Immunol. 2020, 204, 348–359. [Google Scholar] [CrossRef]
- Peschke, K.; Achleitner, M.; Frenzel, K.; Gerbaulet, A.; Ada, S.R.; Zeller, N.; Lienenklaus, S.; Lesche, M.; Poulet, C.; Naumann, R.; et al. Loss of Trex1 in Dendritic Cells Is Sufficient To Trigger Systemic Autoimmunity. J. Immunol. 2016, 197, 2157–2166. [Google Scholar] [CrossRef]
- Sun, L.; Wu, J.; Du, F.; Chen, X.; Chen, Z.J. Cyclic GMP-AMP Synthase Is a Cytosolic DNA Sensor That Activates the Type I Interferon Pathway. Science 2013, 339, 786–791. [Google Scholar] [CrossRef] [Green Version]
- Kranzusch, P.J.; Lee, A.S.-Y.; Berger, J.M.; Doudna, J.A. Structure of human cGAS reveals a conserved family of second-messenger enzymes in innate immunity. Cell Rep. 2013, 3, 1362–1368. [Google Scholar] [CrossRef] [Green Version]
- Civril, F.; Deimling, T.; de Oliveira Mann, C.C.; Ablasser, A.; Moldt, M.; Witte, G.; Hornung, V.; Hopfner, K.P. Structural mechanism of cytosolic DNA sensing by cGAS. Nature 2013, 498, 332–337. [Google Scholar] [CrossRef] [Green Version]
- Gao, P.; Ascano, M.; Zillinger, T.; Wang, W.; Dai, P.; Serganov, A.A.; Gaffney, B.L.; Shuman, S.; Jones, R.A.; Deng, L.; et al. Structure-Function Analysis of STING Activation by c[G(2′,5′)pA(3′,5′)p] and Targeting by Antiviral DMXAA. Cell 2013, 154, 748–762. [Google Scholar] [CrossRef] [Green Version]
- Zhou, W.; Whiteley, A.T.; de Oliveira Mann, C.C.; Morehouse, B.R.; Nowak, R.P.; Fischer, E.S.; Gray, N.S.; Mekalanos, J.J.; Kranzusch, P.J. Structure of the human cGAS–DNA complex reveals enhanced control of immune surveillance. Cell 2018, 174, 300–311.e11. [Google Scholar] [CrossRef] [Green Version]
- Yang, Y.-G.; Lindahl, T.; Barnes, D.E. Trex1 Exonuclease Degrades ssDNA to Prevent Chronic Checkpoint Activation and Autoimmune Disease. Cell 2007, 131, 873–886. [Google Scholar] [CrossRef] [Green Version]
- Stetson, D.B.; Ko, J.S.; Heidmann, T.; Medzhitov, R. Trex1 prevents cell-intrinsic initiation of autoimmunity. Cell 2008, 134, 587–598. [Google Scholar] [CrossRef] [PubMed] [Green Version]
- Rego, S.L.; Harvey, S.; Simpson, S.R.; Hemphill, W.O.; McIver, Z.A.; Grayson, J.M.; Perrino, F.W. TREX1 D18N mice fail to process erythroblast DNA resulting in inflammation and dysfunctional erythropoiesis. Autoimmunity 2018, 51, 333–344. [Google Scholar] [CrossRef] [PubMed]
- Mohr, L.; Toufektchan, E.; von Morgen, P.; Chu, K.; Kapoor, A.; Maciejowski, J. ER-directed TREX1 limits cGAS activation at micronuclei. Mol. Cell 2021, 81, 724–738. [Google Scholar] [CrossRef] [PubMed]
- Crow, Y.J. Type I interferonopathies: A novel set of inborn errors of immunity. Ann. N. Y. Acad. Sci. 2011, 1238, 91–98. [Google Scholar] [CrossRef]
- Rice, G.I.; Forte, G.M.; Szynkiewicz, M.; Chase, D.S.; Aeby, A.; Abdel-Hamid, M.S.; Ackroyd, S.; Allcock, R.; Bailey, K.M.; Balottin, U.; et al. Assessment of interferon-related biomarkers in Aicardi-Goutières Syndrome associated with mutations in TREX1, RNASEH2A, RNASEH2B, RNASEH2C, SAMHD1, and ADAR: A case-control study. Lancet Neurol. 2013, 12, 1159–1169. [Google Scholar] [CrossRef] [Green Version]
- Rice, G.I.; Rodero, M.P.; Crow, Y.J. Human Disease Phenotypes Associated With Mutations in TREX1. J. Clin. Immunol. 2015, 35, 235–243. [Google Scholar] [CrossRef]
- Orebaugh, C.D.; Fye, J.M.; Harvey, S.; Hollis, T.; Perrino, F.W. The TREX1 Exonuclease R114H Mutation in Aicardi-Goutières Syndrome and Lupus Reveals Dimeric Structure Requirements for DNA Degradation Activity. J. Biol. Chem. 2011, 286, 40246–40254. [Google Scholar] [CrossRef] [Green Version]
- Rice, G.; Newman, W.G.; Dean, J.; Patrick, T.; Parmar, R.; Flintoff, K.; Robins, P.; Harvey, S.; Hollis, T.; O’Hara, A.; et al. Heterozygous Mutations in TREX1 Cause Familial Chilblain Lupus and Dominant Aicardi-Goutières Syndrome. Am. J. Hum. Genet. 2007, 80, 811–815. [Google Scholar] [CrossRef]
- Lehtinen, D.A.; Harvey, S.; Mulcahy, M.J.; Hollis, T.; Perrino, F.W. The TREX1 Double-stranded DNA Degradation Activity Is Defective in Dominant Mutations Associated with Autoimmune Disease. J. Biol. Chem. 2008, 283, 31649–31656. [Google Scholar] [CrossRef] [Green Version]
- Fye, J.M.; Orebaugh, C.D.; Coffin, S.R.; Hollis, T.; Perrino, F.W. Dominant Mutations of the TREX1 Exonuclease Gene in Lupus and Aicardi-Goutières Syndrome. J. Biol. Chem. 2011, 286, 32373–32382. [Google Scholar] [CrossRef] [Green Version]
- Richards, A.; Van Den Maagdenberg, A.M.; Jen, J.C.; Kavanagh, D.; Bertram, P.; Spitzer, D.; Liszewski, M.K.; Barilla-LaBarca, M.L.; Terwindt, G.M.; Kasai, Y.; et al. C-terminal truncations in human 3′-5′ DNA exonuclease TREX1 cause autosomal dominant retinal vasculopathy with cerebral leukodystrophy. Nat. Genet. 2007, 39, 1068–1070. [Google Scholar] [CrossRef] [PubMed]
- Pelzer, N.; De Vries, B.; Boon, E.M.J.; Kruit, M.C.; Haan, J.; Ferrari, M.D.; Van Den Maagdenberg, A.M.J.M.; Terwindt, G.M. Heterozygous TREX1 mutations in early-onset cerebrovascular disease. J. Neurol. 2013, 260, 2188–2190. [Google Scholar] [CrossRef] [PubMed]
- Tan, R.Y.; Traylor, M.; Megy, K.; Duarte, D.; Deevi, S.V.; Shamardina, O.; Mapeta, R.P.; BioResource, N.I.H.R.; Ouwehand, W.H.; Gräf, S.; et al. How common are single gene mutations as a cause for lacunar stroke? Neurology 2019, 93, e2007–e2020. [Google Scholar] [CrossRef] [PubMed] [Green Version]
- McGlasson, S.; Rannikmäe, K.; Bevan, S.; Logan, C.; Bicknell, L.S.; Jury, A.; Study, U.Y.L.S.; Jackson, A.P.; Markus, H.S.; Sudlow, C.; et al. Rare variants of the 3’-5’ DNA exonuclease TREX1 in early onset small vessel stroke. Wellcome Open Res. 2017, 2, 106. [Google Scholar] [CrossRef] [Green Version]
- Hemphill, W.O.; Perrino, F.W. Measuring TREX1 and TREX2 exonuclease activities. Methods Enzymol. 2019, 625, 109–133. [Google Scholar]
- Benjamin, P.; Sudhakar, S.; D’Arco, F.; Löbel, U.; Carney, O.; Roux, C.J.; Boddaert, N.; Hemingway, C.; Eleftheriou, D.; Mankad, K. Spectrum of Neuroradiologic Findings Associated with Monogenic Interferonopathies. Am. J. Neuroradiol. 2022, 43, 2–10. [Google Scholar] [CrossRef]
- Lazea, C.; Sur, L.; Florea, M. ROHHAD (Rapid-onset Obesity with Hypoventilation, Hypothalamic Dysfunction, Autonomic Dysregulation) Syndrome—What Every Pediatrician Should Know About the Etiopathogenesis, Diagnosis and Treatment: A Review. Int. J. Gen. Med. 2021, 14, 319–326. [Google Scholar] [CrossRef]
- Wardlaw, J.M.; Smith, E.E.; Biessels, G.J.; Cordonnier, C.; Fazekas, F.; Frayne, R.; Lindley, R.I.; T O’Brien, J.; Barkhof, F.; Benavente, O.R.; et al. Neuroimaging standards for research into small vessel disease and its contribution to ageing and neurodegeneration. Lancet Neurol. 2013, 12, 822–838. [Google Scholar] [CrossRef] [Green Version]
- Perrino, F.W.; Harvey, S.; McMillin, S.; Hollis, T. The Human TREX2 3′ → 5′-Exonuclease Structure Suggests a Mechanism for Efficient Nonprocessive DNA Catalysis. J. Biol. Chem. 2005, 280, 15212–15218. [Google Scholar] [CrossRef] [Green Version]
- Perrino, F.W.; de Silva, U.; Harvey, S.; Pryor, E.E.; Cole, D.W.; Hollis, T. Cooperative DNA Binding and Communication across the Dimer Interface in the TREX2 3′ → 5′-Exonuclease. J. Biol. Chem. 2008, 283, 21441–21452. [Google Scholar] [CrossRef] [Green Version]
- Raraigh, K.S.; Han, S.T.; Davis, E.; Evans, T.A.; Pellicore, M.J.; McCague, A.F.; Joynt, A.T.; Lu, Z.; Atalar, M.; Sharma, N.; et al. Functional Assays Are Essential for Interpretation of Missense Variants Associated with Variable Expressivity. Am. J. Hum. Genet. 2018, 102, 1062–1077. [Google Scholar] [CrossRef] [Green Version]
- Grieves, J.L.; Fye, J.M.; Harvey, S.; Grayson, J.M.; Hollis, T.; Perrino, F.W. Exonuclease TREX1 degrades double-stranded DNA to prevent spontaneous lupus-like inflammatory disease. Proc. Natl. Acad. Sci. USA 2015, 112, 5117–5122. [Google Scholar] [CrossRef] [Green Version]
- Matthijs, G.; Souche, E.; Alders, M.; Corveleyn, A.; Eck, S.; Feenstra, I.; Race, V.; Sistermans, E.; Sturm, M.; Weiss, M.; et al. Guidelines for diagnostic next-generation sequencing. Eur. J. Hum. Genet. 2016, 24, 1515. [Google Scholar] [CrossRef]
- Hamosh, A.; Scott, A.F.; Amberger, J.S.; Bocchini, C.A.; McKusick, V.A. Online Mendelian Inheritance in Man (OMIM), a knowledgebase of human genes and genetic disorders. Nucleic Acids Res. 2005, 33, D514–D517. [Google Scholar] [CrossRef]
- Rentzsch, P.; Witten, D.; Cooper, G.M.; Shendure, J.; Kircher, M. CADD: Predicting the deleteriousness of variants throughout the human genome. Nucleic Acids Res. 2019, 47, D886–D894. [Google Scholar] [CrossRef]
- Adzhubei, I.; Jordan, D.M.; Sunyaev, S.R. Predicting Functional Effect of Human Missense Mutations Using PolyPhen-2. Curr. Protoc. Hum. Genet. 2013, 76, 7–20. [Google Scholar] [CrossRef] [Green Version]
- Ng, P.C.; Henikoff, S. SIFT: Predicting amino acid changes that affect protein function. Nucleic Acids Res. 2003, 31, 3812–3814. [Google Scholar] [CrossRef] [Green Version]
- Kopanos, C.; Tsiolkas, V.; Kouris, A.; Chapple, C.E.; Aguilera, M.A.; Meyer, R.; Massouras, A. VarSome: The human genomic variant search engine. Bioinformatics 2019, 35, 1978–1980. [Google Scholar] [CrossRef]
- Landrum, M.J.; Lee, J.M.; Benson, M.; Brown, G.; Chao, C.; Chitipiralla, S.; Gu, B.; Hart, J.; Hoffman, D.; Hoover, J.; et al. ClinVar: Public archive of interpretations of clinically relevant variants. Nucleic Acids Res. 2016, 44, D862–D868. [Google Scholar] [CrossRef] [Green Version]
- Richards, S.; Aziz, N.; Bale, S.; Bick, D.; Das, S.; Gastier-Foster, J.; Grody, W.W.; Hegde, M.; Lyon, E.; Spector, E.; et al. Standards and Guidelines for the Interpretation of Sequence Variants: A Joint Consensus Recommendation of the American College of Medical Genetics and Genomics and the Association for Molecular Pathology. Genet. Med. Off. J. Am. Coll. Med. Genet. 2015, 17, 405–424. [Google Scholar] [CrossRef] [Green Version]
- Rehder, C.; Bean, L.J.; Bick, D.; Chao, E.; Chung, W.; Das, S.; O’Daniel, J.; Rehm, H.; Shashi, V.; Vincent, L.M.; et al. Next-generation sequencing for constitutional variants in the clinical laboratory, 2021 revision: A technical standard of the American College of Medical Genetics and Genomics (ACMG). Genet. Med. Off. J. Am. Coll. Med. Genet. 2021, 23, 1399–1415. [Google Scholar] [CrossRef]
- Volpi, S.; Insalaco, A.; Caorsi, R.; Santori, E.; Messia, V.; Sacco, O.; Terheggen-Lagro, S.; Cardinale, F.; Scarselli, A.; Pastorino, C.; et al. Efficacy and Adverse Events During Janus Kinase Inhibitor Treatment of SAVI Syndrome. J. Clin. Immunol. 2019, 39, 476–485. [Google Scholar] [CrossRef] [Green Version]
- The PyMOL Molecular Graphics System, Version 2.0 Schrödinger, LLC.
- Eswar, N.; Webb, B.; Marti-Renom, M.A.; Madhusudhan, M.S.; Eramian, D.; Shen, M.Y.; Pieper, U.; Sali, A. Comparative Protein Structure Modeling Using MODELLER. Curr. Protoc. Bioinform. 2006, 15, 5–6. [Google Scholar] [CrossRef] [Green Version]


| pt | Variants Description | ||||||||||||
|---|---|---|---|---|---|---|---|---|---|---|---|---|---|
| GENE | cDNA Change | Protein Change | dbSNP | zig | seg | Varsome | Clinvar | CADD | MAF * | Hom # | Polyphen | SIFT | |
| A | TREX1 | c.407C>T | p.A136V | rs1560112354 | het | pat | LP | - | 28 | 0.8 × 10⁻⁵ | 0 | 0.448 | 0.01 |
| B | TREX1 | c.520A>G | p.R174G | rs759481016 | het | NA | LP | - | 27 | 0.17 × 10⁻⁴ | 0 | 0.623 | 0.02 |
| B | RANBP2 | c.8591G>T | p.G2864V | rs765893725 | het | NA | VUS | - | 28 | 0.289 × 10⁻⁴ | 0 | 0.999 | 0 |
| B | TBXAS1 | c.319A>G | p.N107D | rs771726219 | het | NA | VUS | - | 26 | 0.176 × 10⁻⁴ | 0 | 0.986 | 0.08 |
Publisher’s Note: MDPI stays neutral with regard to jurisdictional claims in published maps and institutional affiliations. |
© 2022 by the authors. Licensee MDPI, Basel, Switzerland. This article is an open access article distributed under the terms and conditions of the Creative Commons Attribution (CC BY) license (https://creativecommons.org/licenses/by/4.0/).
Share and Cite
Amico, G.; Hemphill, W.O.; Severino, M.; Moratti, C.; Pascarella, R.; Bertamino, M.; Napoli, F.; Volpi, S.; Rosamilia, F.; Signa, S.; et al. Genotype-Phenotype Correlation and Functional Insights for Two Monoallelic TREX1 Missense Variants Affecting the Catalytic Core. Genes 2022, 13, 1179. https://0-doi-org.brum.beds.ac.uk/10.3390/genes13071179
Amico G, Hemphill WO, Severino M, Moratti C, Pascarella R, Bertamino M, Napoli F, Volpi S, Rosamilia F, Signa S, et al. Genotype-Phenotype Correlation and Functional Insights for Two Monoallelic TREX1 Missense Variants Affecting the Catalytic Core. Genes. 2022; 13(7):1179. https://0-doi-org.brum.beds.ac.uk/10.3390/genes13071179
Chicago/Turabian StyleAmico, Giulia, Wayne O. Hemphill, Mariasavina Severino, Claudio Moratti, Rosario Pascarella, Marta Bertamino, Flavia Napoli, Stefano Volpi, Francesca Rosamilia, Sara Signa, and et al. 2022. "Genotype-Phenotype Correlation and Functional Insights for Two Monoallelic TREX1 Missense Variants Affecting the Catalytic Core" Genes 13, no. 7: 1179. https://0-doi-org.brum.beds.ac.uk/10.3390/genes13071179