Article

The Complete Mitochondrial Genome of Glyptothorax macromaculatus Provides a Well-Resolved Molecular Phylogeny of the Chinese Sisorid Catfishes

1
BGI Education Center, University of Chinese Academy of Sciences, Shenzhen 518083, China
2
Shenzhen Key Lab of Marine Genomics, Guangdong Provincial Key Lab of Molecular Breeding in Marine Economic Animals, BGI Academy of Marine Sciences, BGI Marine, BGI, Shenzhen 518083, China
3
State Key Laboratory of Genetic Resources and Evolution, Kunming Institute of Zoology, Chinese Academy of Sciences, Kunming 650223, China
4
Laboratory of Aquatic Genomics, College of Life Sciences and Oceanography, Shenzhen University, Shenzhen 518060, China
*
Author to whom correspondence should be addressed.
Submission received: 16 March 2018 / Revised: 26 May 2018 / Accepted: 31 May 2018 / Published: 4 June 2018
(This article belongs to the Section Animal Genetics and Genomics)

Abstract

:
Previous phylogenetic analyses of the Chinese sisorid catfishes have either been poorly resolved or have not included all the 12 sisorid genera. Here, we successfully assembled the first complete mitochondrial genome of the sisorid fish Glyptothorax macromaculatus. Based on this novel mitochondrial genome and previously published mitochondrial genomes in the Sisoridae, we generated maximum likelihood and Bayesian phylogenies. We dated our preferred topology using fossil calibration points. We also tested the protein-coding genes in the mitochondrial genomes of the glyptosternoid fishes for signals of natural selection by comparing the nucleotide substitution rate along the branch ancestral to the glyptosternoid fishes to other branches in our topology. The mitochondrial sequence structure of G. macromaculatus was similar to those known from other vertebrates, with some slight differences. Our sisorid phylogenies were well-resolved and well-supported, with exact congruence between the different phylogenetic methods. This robust phylogeny clarified the relationships among the Chinese sisorid genera and strongly supported the division of the family into three main clades. Interestingly, the glyptosternoid divergence time predicted by our molecular dating analysis coincided with the uplift of the Tibetan Plateau, suggesting that geology may have influenced speciation in the Sisoridae. Among the mitochondrial protein-coding genes, atp8 may have most rapidly evolved, and atp6 may have been subjected to positive selection pressure to adapt to high elevations. In summary, this study provided novel insights into the phylogeny, evolution and high-altitude adaptions of the Chinese sisorid fishes.

1. Introduction

The sisorid catfishes (family Sisoridae) are widely distributed in the Southwest of China. The Sisoridae are classified into 12 genera, including Bagarius, Creteuchiloglanis, Euchiloglanis, Exostoma, Gagata, Glaridoglanis, Glyptosternon, Glyptothorax, Oreoglanis, Pareuchiloglanis, Pseudecheneis, and Pseudexostoma [1]. With the exception of four genera (Bagarius, Gagata, Glyptothorax, and Pseudecheneis), the sisorids are glyptosternoid fishes that are unevenly distributed across the Tibetan Plateau [2]. The glyptosternoid fishes are thus obligate inhabitants of high altitudes.
Morphology-based classifications of the sisorid fishes may be inaccurate as these species are morphologically similar [3], although previous molecular phylogenies have recovered well-supported species-level relationships in this family, as well as the monophyly of Sisoridae [3] and glyptosternoid fishes [4]. The monophyly of Sisoridae was supported by an analysis of 16S rRNA [3], and the glyptosternoid fishes were supported as a monophyletic group based on cytochrome b (cytb) and 16S rRNA [4]. The genera Glyptosternon and Exostoma were recovered as basal to the other glyptosternoid genera based on an analysis of cytb [5]. These molecular studies have contributed greatly to a better understanding of the phylogenetic relationships among the sisorid fishes.
Unfortunately, aspects of several of these previously published phylogenies were incongruent. For example, the genus Pseudecheneis clustered with the glyptosternoids within Guo et al., (2004, 2007) [3,6], but fell sister to the glyptosternoids in Guo et al., (2005) [4]. Pseudecheneis was recovered basal to all other sisorid genera by both Peng et al., (2004, 2006) and Yu & He (2012) [5,7,8]. Pareuchiloglanis was paraphyletic in Peng et al., (2006) [8], but not in Yu & He (2012) [7]. These conflicting phylogenies were weakly supported, possibly resulting from the use of inadequate genetic information. Recently, a well-supported molecular phylogeny of the Sisoridae, based on the complete mitochondrial genomes of a few sisorid species, has become available [9,10]. However, a robust phylogeny including all 12 genera of the Chinese sisorid catfishes remains unavailable. This knowledge gap prevents a deeper understanding of phylogenetic relationships among the sisorid fishes.
In addition to the determination of phylogenetic relationships, it is also interesting to study the evolution of protein-coding mitochondrial genes in the obligate high-elevation glyptosternoid fishes. Based on the rates of synonymous (Ks) and nonsynonymous (Ka) substitutions in mitochondrial protein-coding genes, it was shown that mitochondrial encoded cytochrome c oxidase 1 (cox1) has been subjected to positive selection in the glyptosternoid fishes; this enzyme encoded by this gene is part of the electron transport chain for mitochondrial oxidative phosphorylation [10]. Therefore, it is possible that, in these high-altitude fishes, some mitochondrial protein-coding genes may be under selection pressure to increase energy consumption. However, other factors may also significantly increase the Ka/Ks ratio, such as effective population size [11] and life history [12,13].
In this study, we focused on the sisorid fish Glyptothorax macromaculatus. We aimed to assemble and delineate a complete mitochondrial genome for this species and to investigate the arrangement of genes within this genome. We then aimed to integrate this genome with previously published mitochondrial genomes representing the 12 genera of Chinese sisorid catfishes and to use this relatively large dataset to investigate the phylogenetic relationships and species divergence times in the Sisoridae. Finally, we aimed to determine the substitution rates of protein-coding genes based on the complete mitochondrial genome and to identify signals of positive selection.

2. Materials and Methods

2.1. Sampling and Complete Mitochondrial Genome Assembly of G. macromaculatus

We collected an adult specimen of G. macromaculatus in Yunnan Province, China. This voucher specimen was deposited in the Marine Bank of the China National GeneBank (Voucher no. YN170702001_FI), Shenzhen, China. We extracted total DNA from the fin muscle using a Puregene Tissue Core Kit A (Qiagen, Germantown, MD, USA). With traditional whole-genome shotgun sequencing, we constructed a series of short-insert libraries (270, 500, and 800 bp) and long-insert libraries (2, 5, 10, and 20 kb) using standard protocols (Illumina, San Diego, CA, USA). Paired-end sequencing was performed on an Illumina Hiseq2500 platform (San Diego, CA, USA) at BGI (Shenzhen, China). To construct the sequence library, we assembled a roughly complete mitochondrial genome of G. macromaculatus. In brief, we used the mitochondrial genome of a congeneric, Glyptothorax trilineatus (downloaded from National Center for Biotechnology Information (NCBI) with GenBank accession no. NC_021608.1; Table S1). We then identified reads highly similar to the reference mitochondrial genome with SOAP2 (version 2.21, [14]). All highly similar reads were assembled with SPAdes (version 3.10.0, [15]). Finally, the assembled result was compared to the reference genome with Blast (version 2.6.1, [16,17]), and incomplete regions were filled with sequences generated by subsequent molecular amplification as described below.
We amplified incomplete regions using polymerase chain reactions (PCRs). We designed 12 related primer pairs (Table S2) with Primer Premier 5 (Premier Biosoft, Palo Alto, CA, USA) PCRs were performed in 50 μL volumes, each containing 5 μL of 10× buffer (with Mg2+), 4 μL of 2.5 mM dNTPs, 1 U of Taq DNA polymerase (rTaq; TaKaRa, Dalian, China), 1 μL of each primer (10 μM), and 1 μL of genomic DNA (100 ng/μL), made up to 50 μL with double-distilled water. We used the following PCR cycling conditions: pre-denaturation at 94 °C for 5 min; 35 cycles of denaturation at 94 °C for 30 s, annealing at 55 °C for 30 s, and elongation at 72 °C for 2 min, and a final elongation at 72 °C for 10 min. All PCRs were conducted in a Veriti Thermal Cycler (Applied Biosystems, Carlsbad, CA, USA). PCR products were checked via electrophoresis on 1% agarose gels and were subsequently purified using Qiagen Gel Extraction Kits (Qiagen China, Shanghai, China). Both strands of each product were sequenced using the previously designed PCR primer pairs (Table S2).
After all incomplete regions had been successfully amplified, we combined these sequences with the previously assembled incomplete mitochondrial genome to generate the complete mitochondrial genome of G. macromaculatus. We subsequently annotated coding genes, RNA, and D-loop regions based on BLAST comparisons with the reference genome.

2.2. Phylogenetic Analyses and Divergence Time Estimation

The complete mitochondrial genomes of 23 sisorid fishes were downloaded from NCBI GenBank (Table S1). Including the novel G. macromaculatus genome, our analysis included all 12 currently described genera of Chinese sisorid catfishes. We used three species of the Amblycipitidae (in the same superfamily as the Sisoridae) as outgroups [5,8,9,10]. Therefore, the complete dataset used for phylogenetic analysis included 27 complete mitochondrial genomes (Table S1).
All sequences were aligned with MAFFT (version 5) [18]. As some sites were difficult to align with confidence, we eliminated those poorly aligned positions with Gblocks (version 0.91b), using default parameters [19]. We estimated the best nucleotide substitution model for our alignment with jModelTest (version 2.1.5, [20]), using the AIC (Akaike Information Criterion). We used the best nucleotide substitution model (GTR + G + I) for maximum likelihood (ML) analysis in PhyML (version 3.1) [21] and RAxML (version 8.0.17) [22], with 1000 replicates to estimate node support. To confirm the topology generated by ML, we also analyzed our alignment using Bayesian inference (BI) in MrBayes (version 3.2.2, [23]), with the same nucleotide substitution model (GTR + G + I). We performed two parallel runs for 2 M generations (four chains per run), sampling every 500 generations. The initial 25% of the runs were discarded as burn-in. We identified the maximum clade credibility tree from the remaining topologies using TreeAnnotator (version 1.7.5) [24].
After phylogenetic tree construction, we estimated the molecular timing of species divergences with the Bayesian method MCMCTree in the PAML package (version 4.9e) [25]. Three nodes (C1, C2, and C3) were considered time-calibrated points with normal distributions and soft constraint bands (allowing a small probability (0.025) of violation). Following a previous analysis [8], the C1 calibration point was estimated based on a fossil of Bagarius yarrelli dating from the Pliocene (~5.3–1.8 million years ago (Ma)). The C2 calibration point was estimated to be the most recent common ancestor (MRCA) of the Sisoridae (~12.9–8 Ma), while the C3 calibration point was estimated to be the MRCA of the glyptosternoids (~9.8–6.1 Ma). We used 100,000 samples for the Markov chain Monte Carlo (MCMC) analysis, discarding the first 20% of all samples as burn-in. An independent rates model (clock = 2), which follows a lognormal distribution, was used for the MCMC search.

2.3. Substitution Rate Estimation and Comparison

Ka/Ks ratios may differ over evolutionary time among mitochondrial coding genes. To understand the average changes in nucleotide substitution rates in the glyptosternoids, we calculated the average Ka and Ka/Ks values across all 13 mitochondrial protein-coding genes (atp6, atp8, cox1, cox2, cox3, cytb, nd1, nd2, nd3, nd4, nd4l, nd5 and nd6). Based on the annotations of the 24 sisorid mitochondrial genomes, we extracted each of the 13 genes, and aligned each gene separately using the codon-based model in the Muscle module of MEGA (version 7) [26]. We calculated pairwise Ka and Ka/Ks values between each pair of single-gene datasets in DnaSP (version 5.0) [27]. The average values of Ka and Ka/Ks were calculated in R [28], and were used to represent changes of each coding gene’s substitution rates.
As glyptosternoid fishes are mainly distributed in the Hengduan Mountains [5,7,8,9,10], we focused on changes of the nucleotide substitution rate in the MRCA of this group. To test if positive selection may have occurred in the MRCA of this obligate high-altitude group, we compared the Ka/Ks values along the ancestral glyptosternoid branch to other branches. The topology of evolutionary tree used in this analysis was derived from the species-level phylogeny constructed above. We first ran a one-ratio model (model = 0; assuming a unique ω0 (Ka/Ks) ratio along all branches of the phylogenetic tree) for each of the 13 protein-coding mitochondrial genes with the CODEML modules of PAML. We next ran a two-ratio model for each of the 13 protein-coding genes (model = 2; setting the glyptosternoids branch as the independently-changing target, ω2; setting all other branches as the constant ω1). Likelihood ratio (LR) and Chi-square (χ2) tests comparing the probabilities of the one-ratio and two-ratio models were performed for all 13 genes. If the two-ratio model had a significantly higher probability than the one-ratio model for a given gene, we applied a branch-site model to that gene (assuming each sequence position might have an independent ω) to test which sites had been subject to positive selection. Based on these results, we identified signals of positive selection on the ancestral glyptosternoid branch.

3. Results

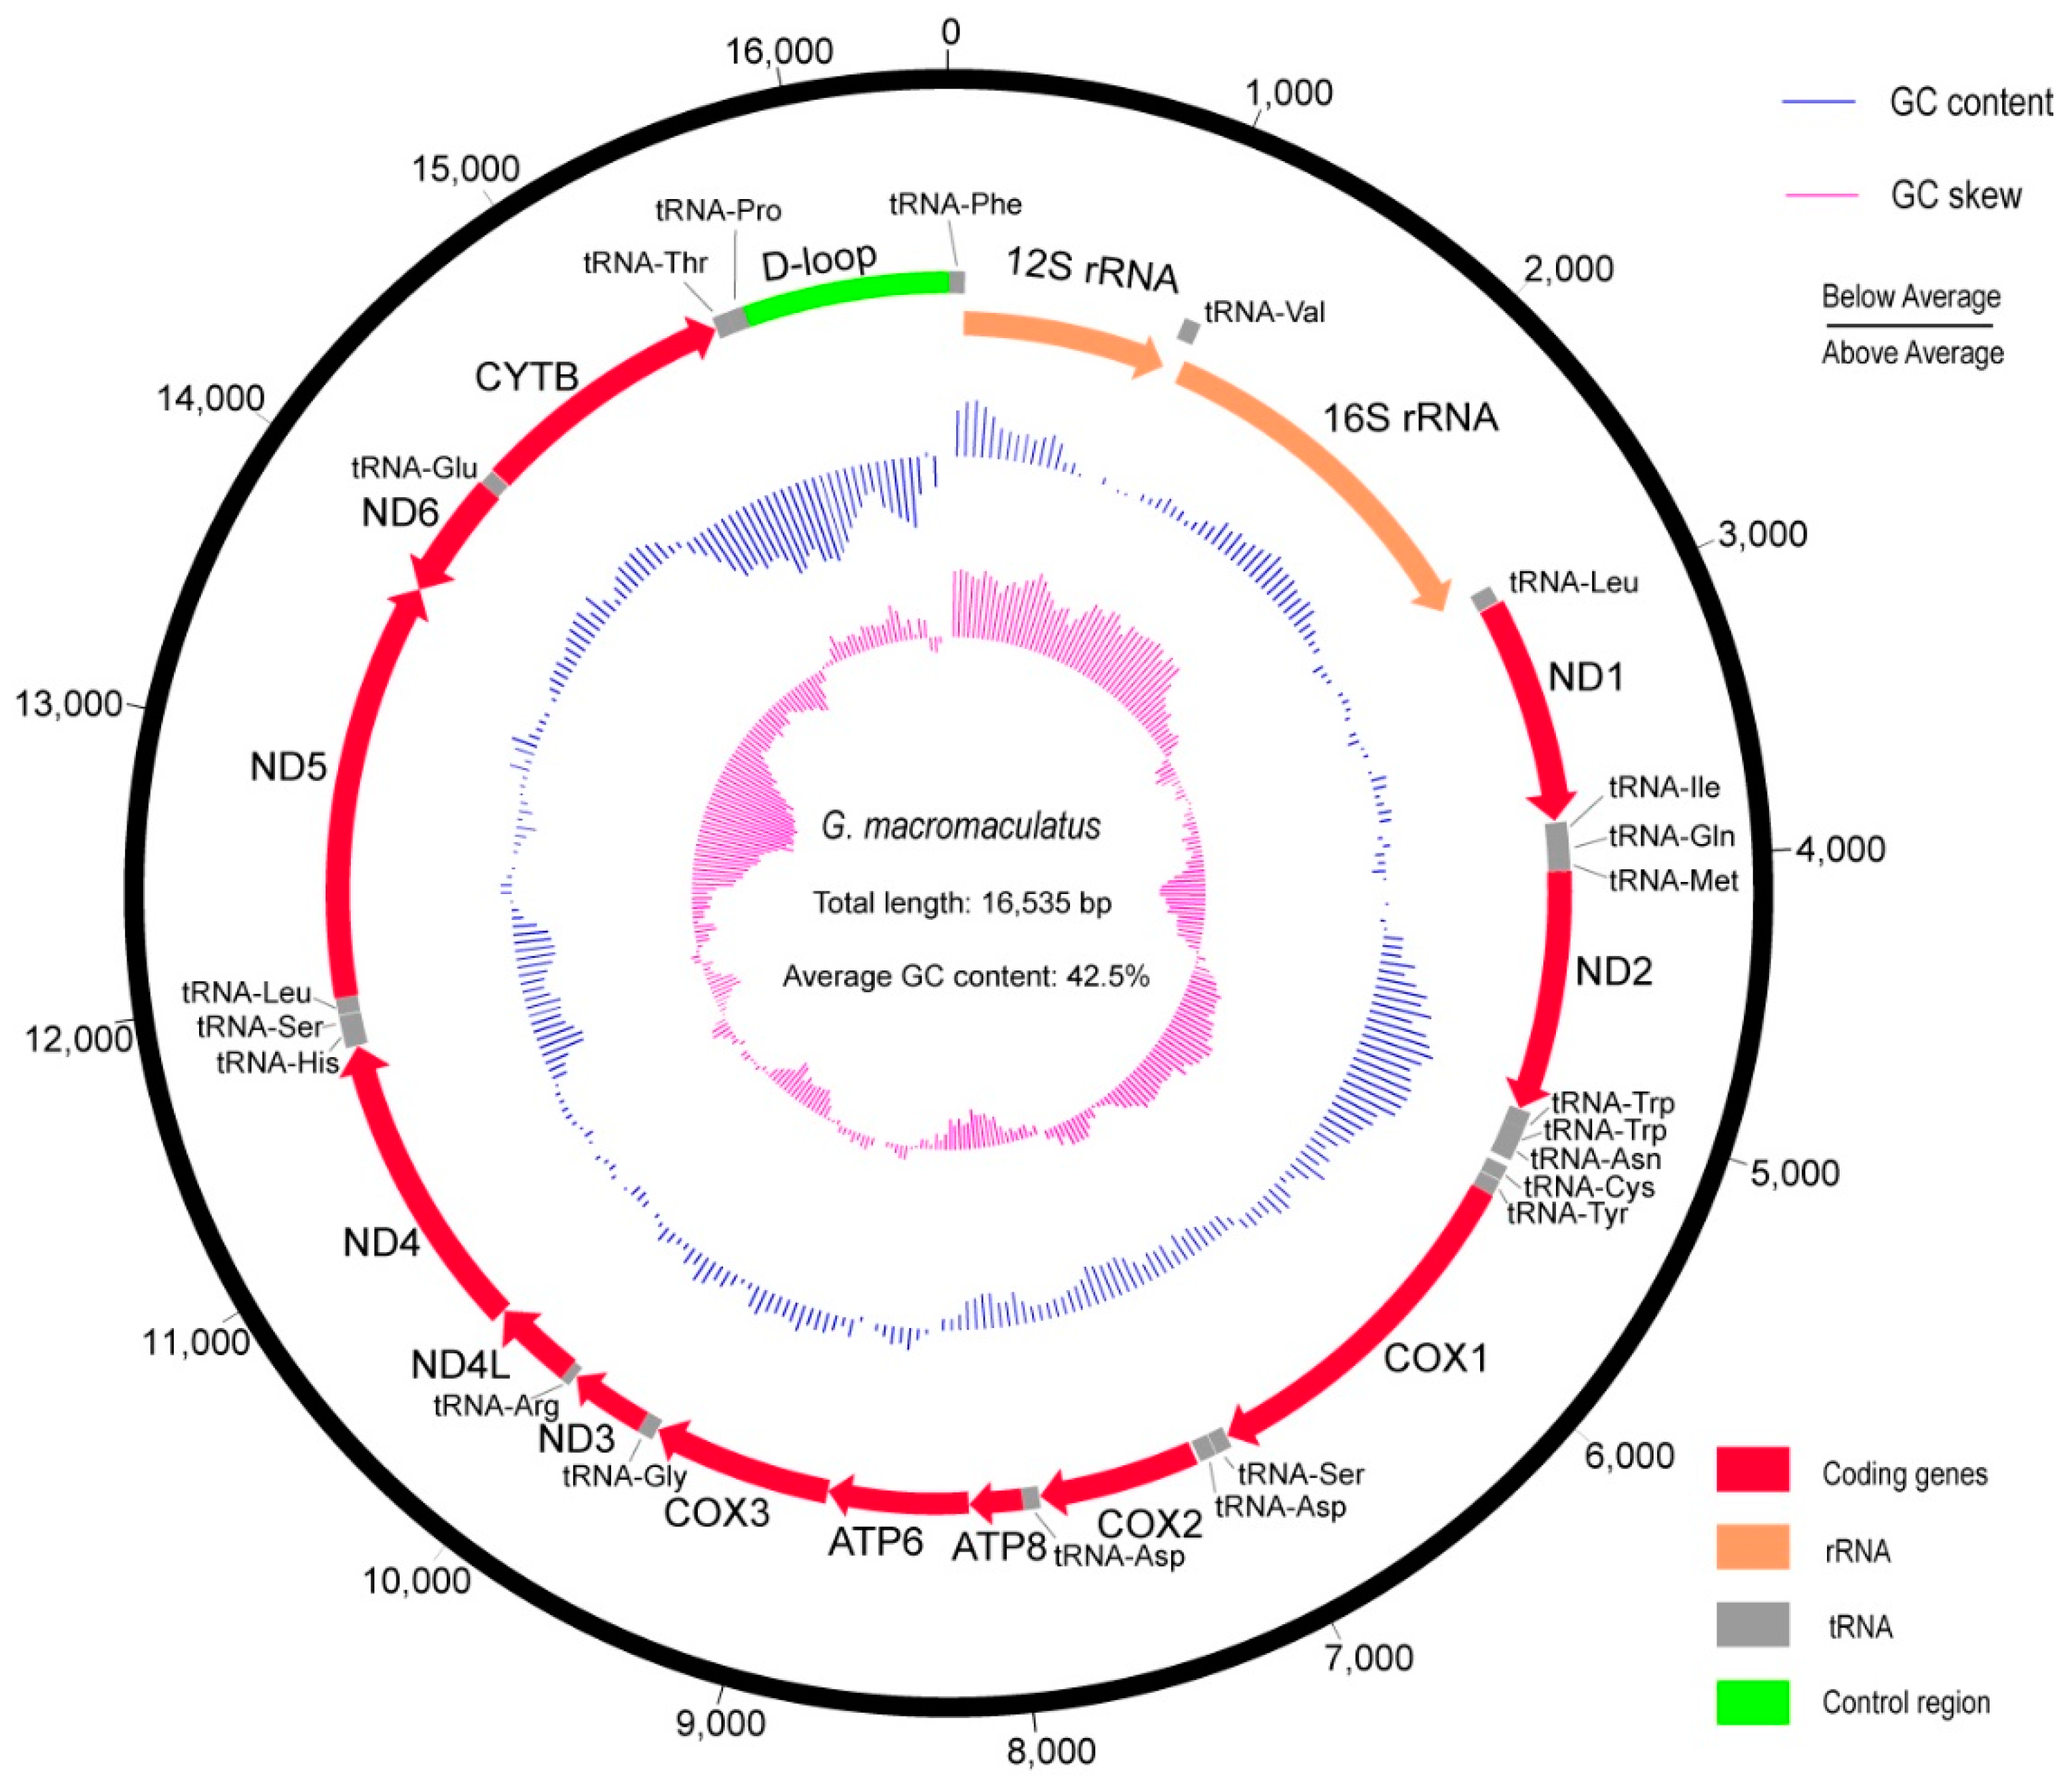
3.1. The Complete Mitochondrial Genome of G. macromaculatus

Our incomplete mitochondrial genome assembly was ~10,000 bp, with several gaps totaling ~6000 bp. To amplify these incomplete regions, we designed 12 PCR primer pairs (Table S2). Using these primers, we obtained the complete mitochondrial genome of G. macromaculatus (Figure 1; GenBank accession no. MH213458).
The complete mitochondrial genome of G. macromaculatus was 16,535 bp, with an overall GC content of 42.5%. Our annotation identified one control region (D-loop), two ribosomal RNA (rRNA) encoding regions (12S and 16S rRNA), 22 transfer RNAs (tRNAs), and 13 protein-coding genes (nd1, nd2, cox1, cox2, atp8, atp6, cox3, nd3, nd4l, nd4, nd5, nd6, and cytb; Figure 1, Table 1). The structural map of the mitochondrial genome of G. macromaculatus indicated that most of the genes were encoded on the heavy strand (H-strand), while only a few genes were encoded on the light strand (L-strand; Figure 1, Table 1).
The start codon of each open reading frame (ORF) encoding mitochondrial protein-coding genes in G. macromaculatus was typically ATG, with the exception of cox1, where the start codon was GTG. The stop codons of these ORFs were either TAA or Txx.

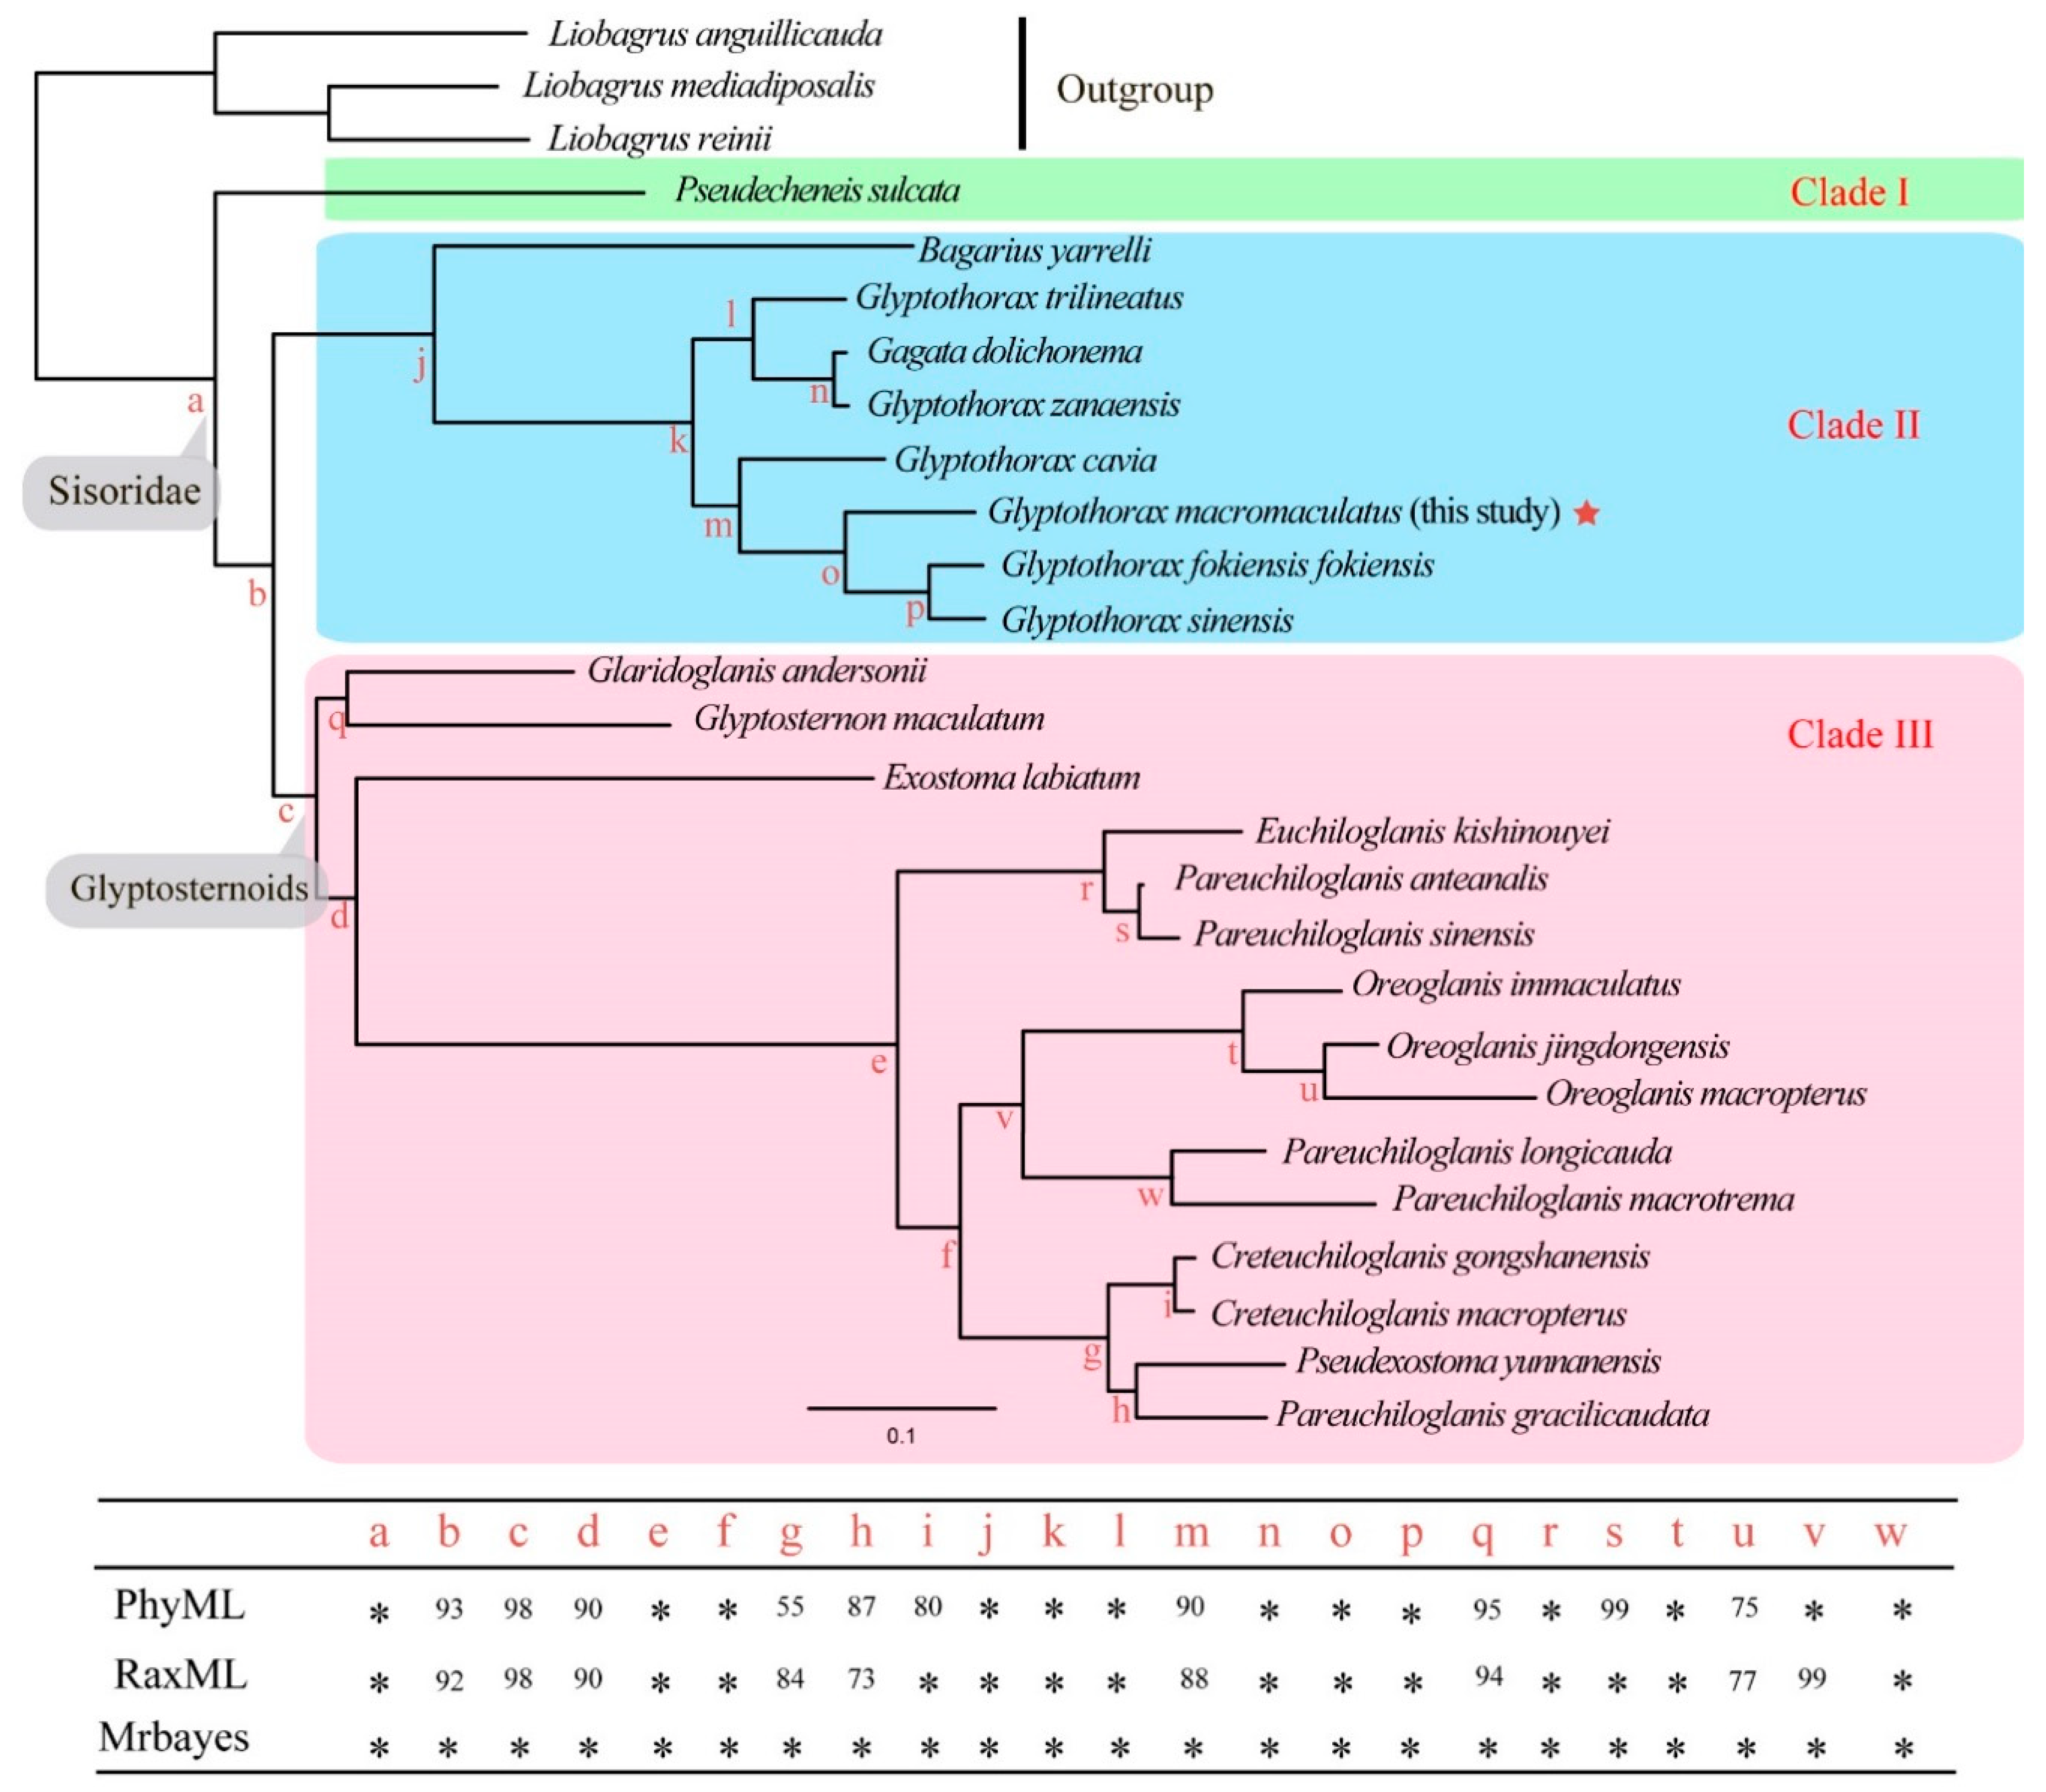
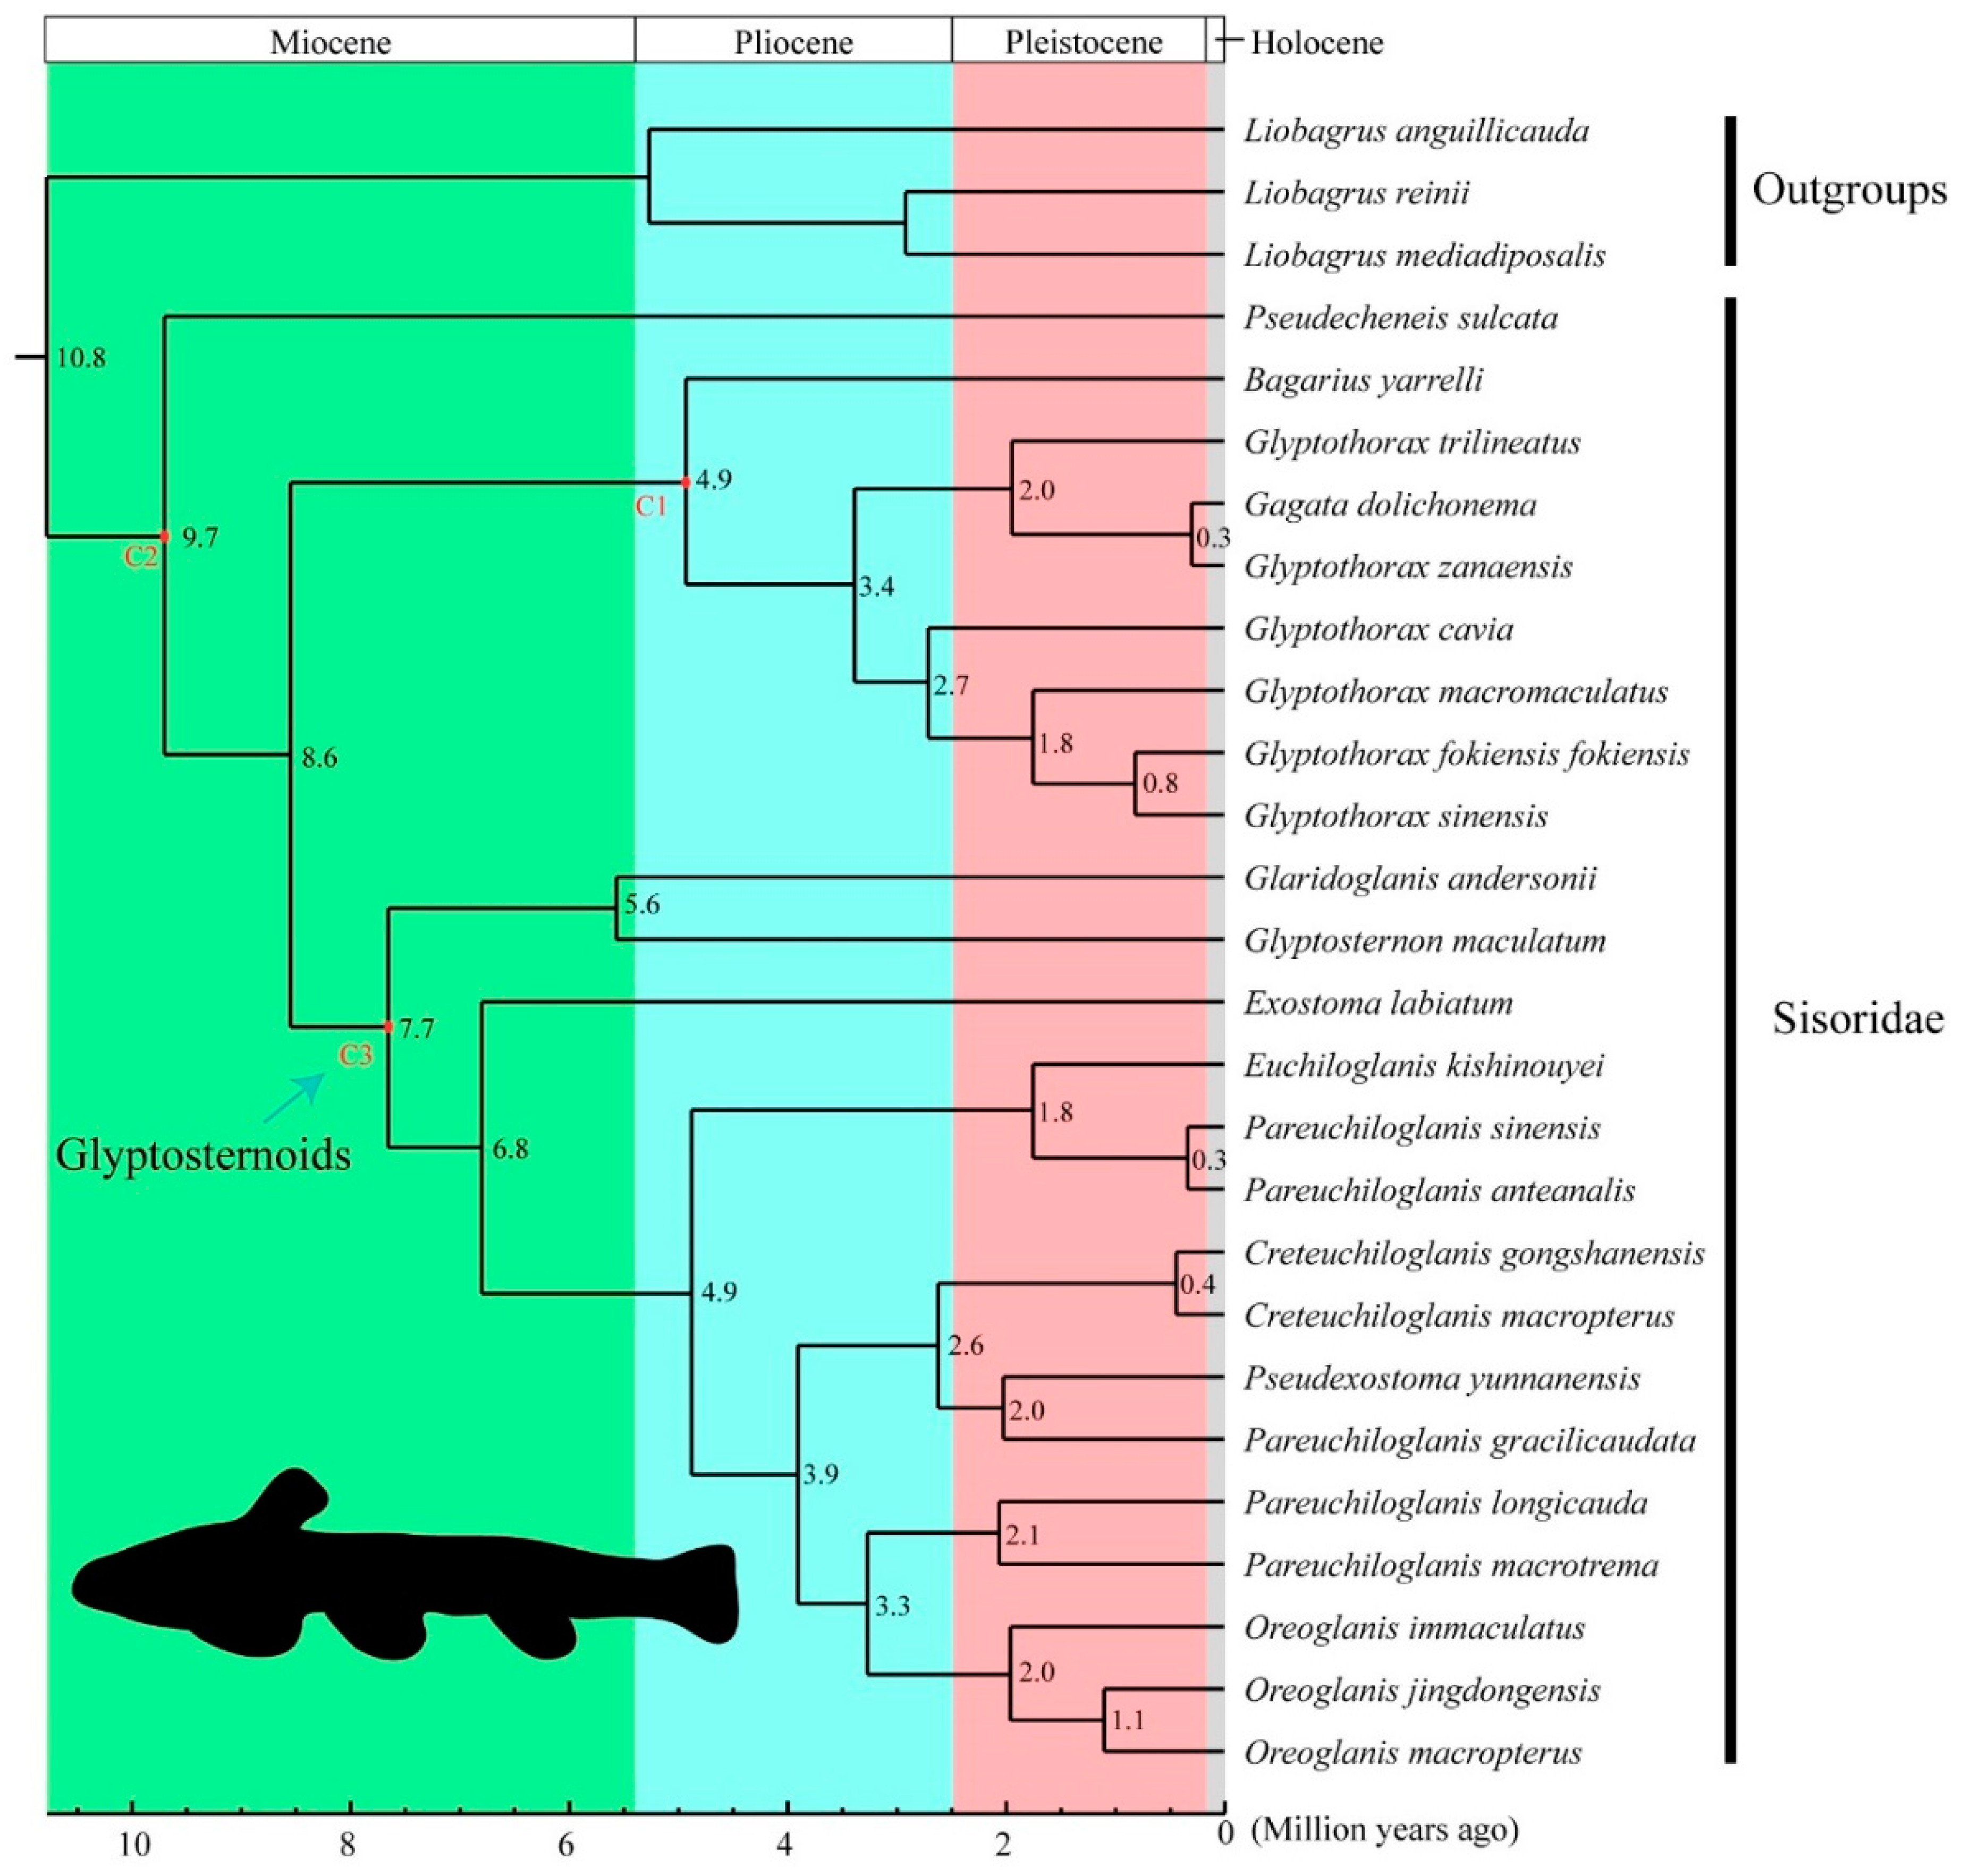
3.2. Phylogenetic Relationships and Divergence Times in the Sisoridae

Our multiple sequence alignment of 27 complete mitochondrial genomes, including three Liobagrus outgroups and 24 sisorids, comprised 17,092 aligned sites. After eliminating highly divergent regions, 15,655 sites remained and were used for phylogenetic analysis.
In all phylogenies, G. macromaculatus was recovered in a well-supported monophyletic Sisoridae (Figure 2), a clade sister to the glyptosternoids. The genus Glyptothorax was well-supported but paraphyletic (Figure 2). Based on our fossil-calibrated phylogeny, most sisorid species appeared around 1~10 Ma, a period spanning the Miocene and Holocene. The divergence of G. macromaculatus from its MRCA was estimated to have occurred around 1.8 Ma in the Pleistocene (Figure 3).

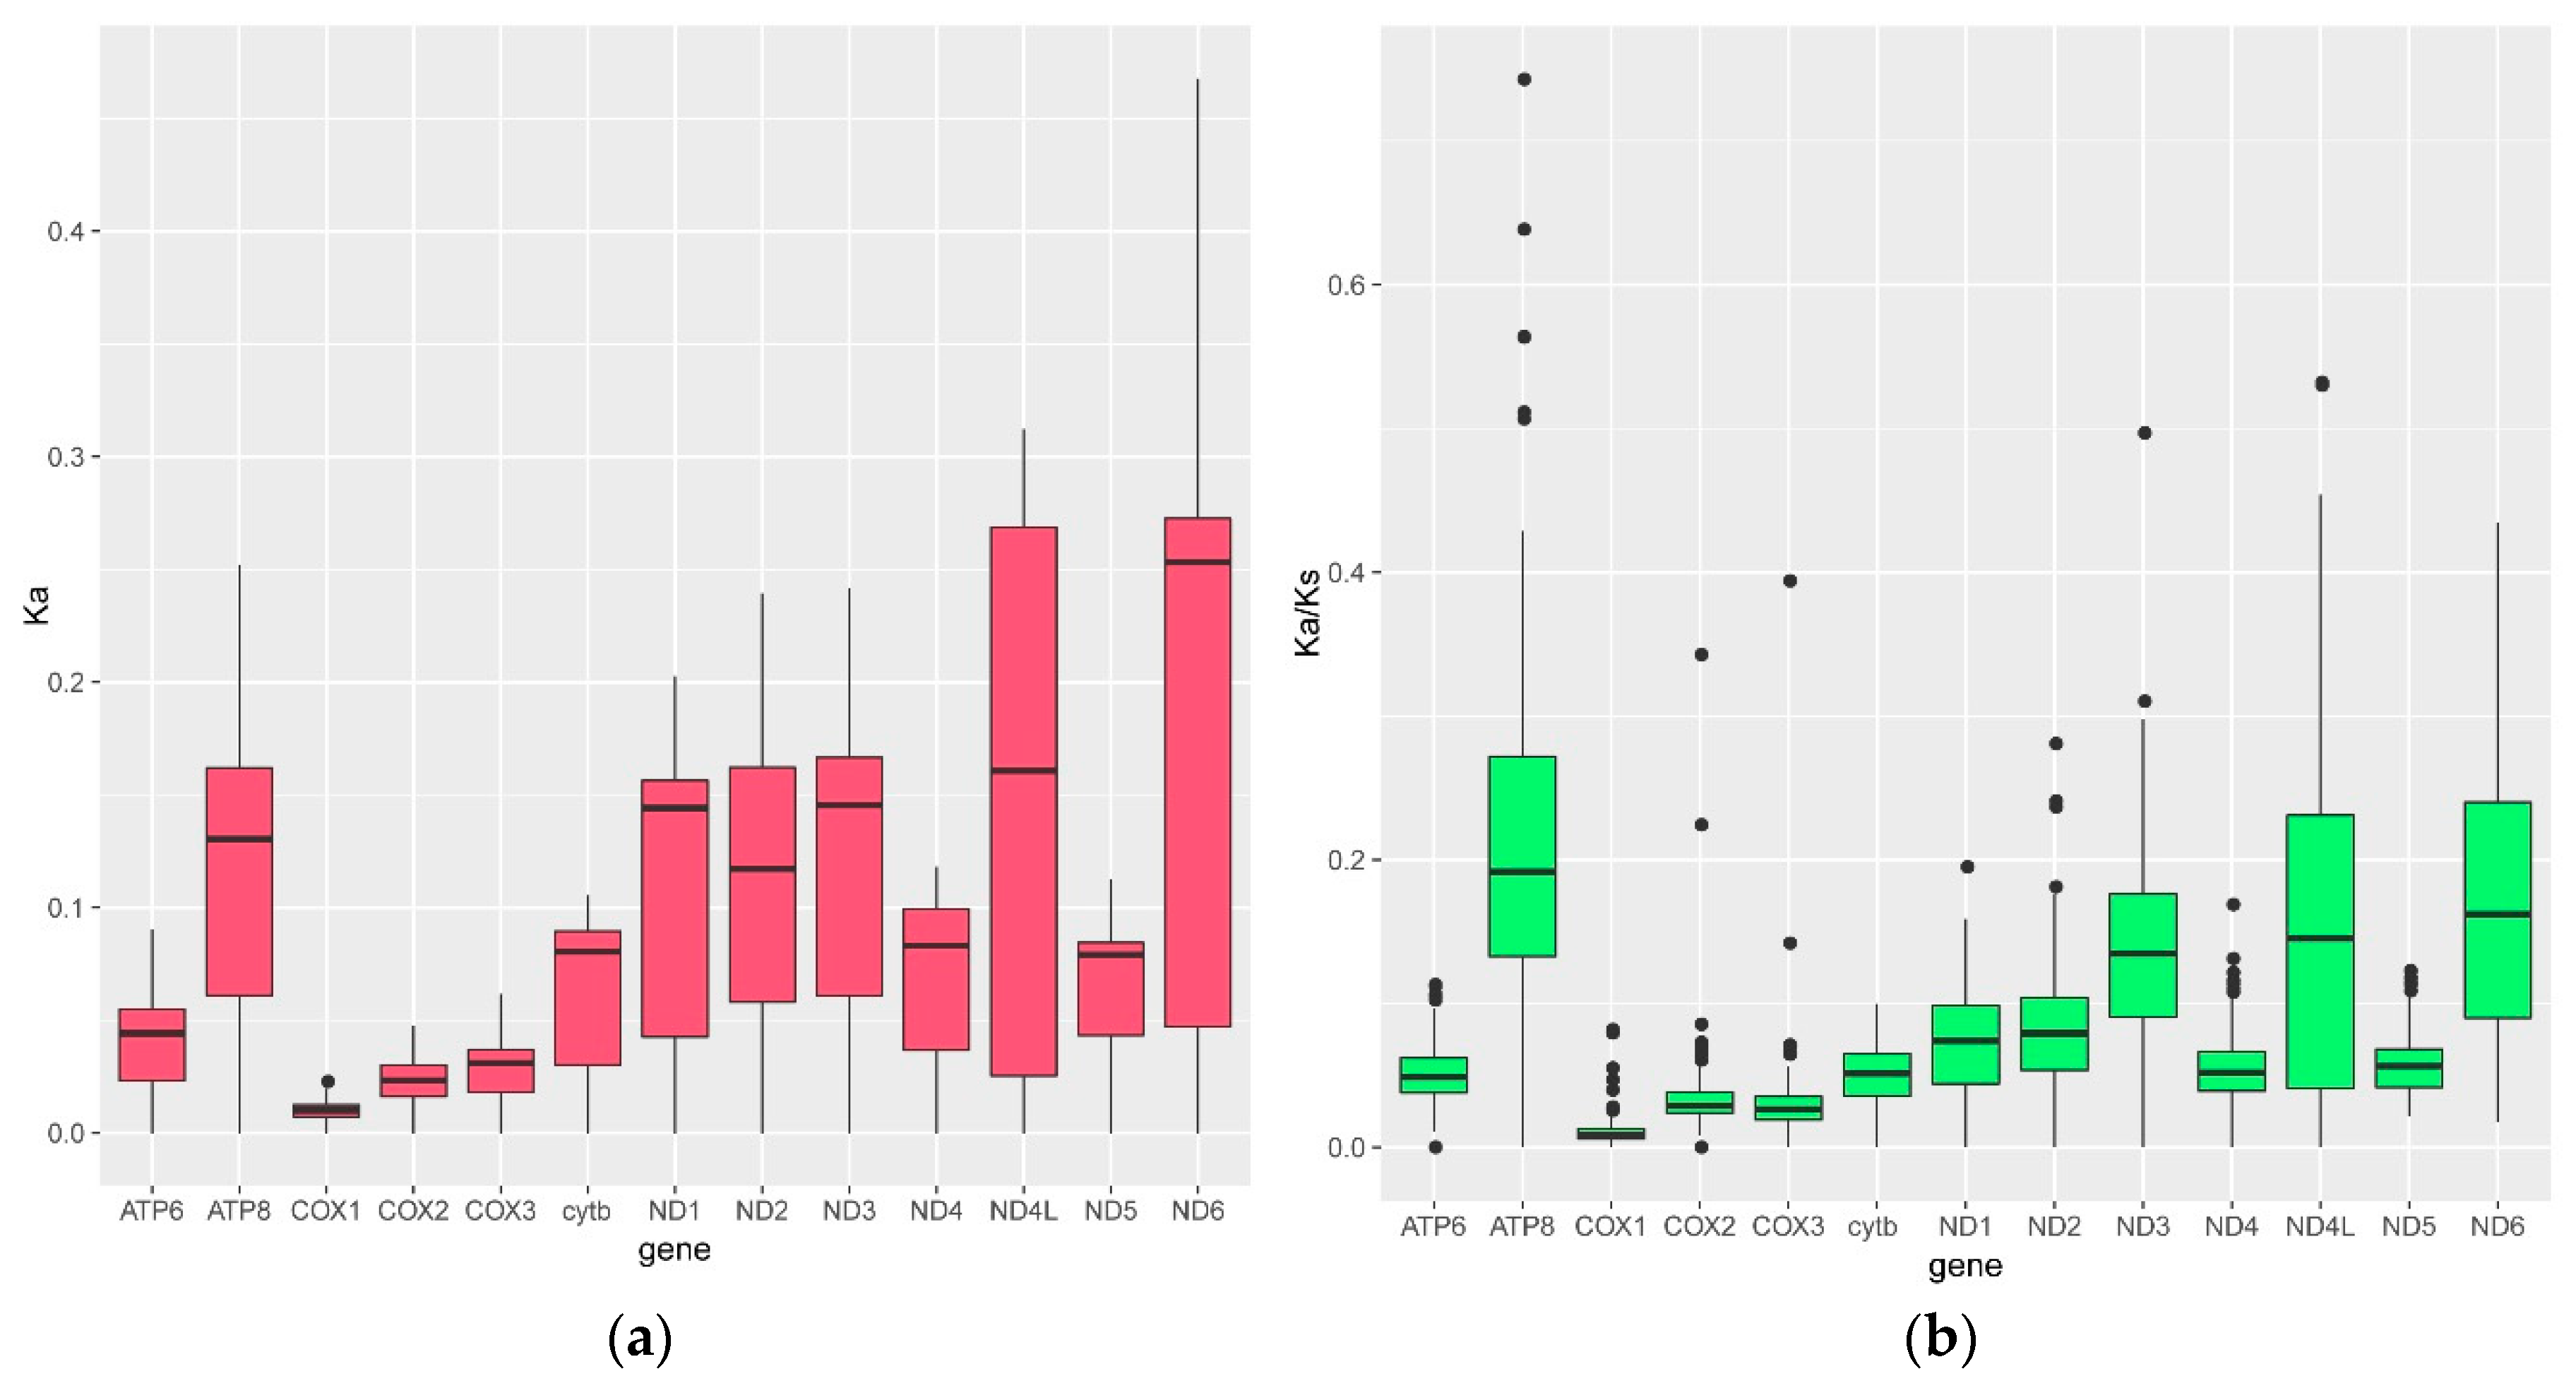
3.3. The Nucleotide Substitution Rate Increased in the Glyptosternoid Fishes

Of all average values of Ka and Ka/Ks across the 13 mitochondrial protein-coding genes, nd6 had the largest average Ka, and atp8 had the largest average Ka/Ks (Figure 4), implying that atp8 might evolve more quickly than the other mitochondrial protein-coding genes.
We identified no significant differences between the one- and two-ratio models of ω for most mitochondrial genes (Table 2). This suggested that ω did not change more quickly than expected along the glyptosternoid branch. However, most ω values under both the models were much less than 1, suggesting that strong purifying selection drove the evolution of the mitochondrial genome in these fishes.
Interestingly, the average Ka/Ks for atp6 was substantially higher along the glyptosternoid branch than along any other branch (ω2 = 2.42; Table 2), implying that atp6 may have been subjected to positive selection during the initial speciation of the glyptosternoid fishes. Both the LR and the χ2 tests indicated that the branch-site model of atp6 (i.e., allowing Ka/Ks to vary at each site) fit the data better than the alternative hypothesis (i.e., assuming a uniform Ka/Ks across all sites). Our results suggested that the third codon of atp6 had been subjected to significant positive selection along the glyptosternoid branch (p < 0.05).

4. Discussion

4.1. Comparison between the Complete Mitochondrial Genomes of G. macromaculatus and Other Vertebrates

The structure of the mitochondrial genome of G. macromaculatus was similar to those of other vertebrates, such as humans, mice, and other fishes [29,30,31,32,33,34,35]: 13 protein-coding genes, two rRNA genes, 22 tRNA genes, and one control region. The length and arrangement of the mitochondrial protein-coding genes in G. macromaculatus (Figure 1) was similar to those of other vertebrates, particularly other fishes [36,37], suggesting that the structure of the mitochondrial genome might be conserved across vertebrates.
In many bony fishes, ATG is the start codon of all mitochondrial protein-coding genes except cox1 (start codon: GTG) [31,32,35,36,37]. This pattern was also observed in G. macromaculatus. The uniform change to GTG in cox1 across many fish species may indicate the early origin of this gene.
Although similar sequence patterns were identified in G. macromaculatus and other fishes [29,30,31,32,33,34,35], slight differences were also observed. For example, the stop codon Txx has only been observed in Liobagrus obesus [37]. However, only the stop codons TAA and Txx were identified in G. macromaculatus; the stop codon TAx was absent.

4.2. Molecular Phylogeny of the Sisorid Catfishes

Some previous phylogenetic studies included only a few Chinese sisorid catfishes, and thus generated only limited phylogenies of these fishes [2,3,4,5,8]. Other studies included more species, but their analyses were based on few mitochondrial genes, resulting in poorly resolved estimates of the phylogenetic relationships within the Sisoridae [2,3,4,5,6,7,8]. Our study, based on the whole mitochondrial genomes of the 12 Chinese genera in the Sisoridae, recovered a robust and well-supported phylogenetic topology.
In our phylogeny, the monophyly of the Sisoridae was strongly supported, which is consistent with previous studies [2,3,4,5,6,7,8]. The Sisoridae clustered into two major lineages in Guo et al., (2004, 2005) [3,4]: one lineage included the genera Gagata, Bagarius, and Glyptothorax, while the other included the genus Pseudecheneis and the glyptosternoids. However, this arrangement was rejected by our results. Our analysis recovered Pseudecheneis basal to the remainder of the Sisoridae (Clade I in Figure 2), consistent with some previous studies [5,8,9,10]. The remaining fishes fell into two major clades, one clade including the genera Gagata, Bagarius, and Glyptothorax (Clade II in Figure 2), and the other including the glyptosternoids (genera Glaridoglanis, Glyptosternon, Exostoma, Euchiloglanis, Pareuchiloglanis, Oreoglanis, Creteuchiloglanis, and Pseudexostoma; Clade III in Figure 2). Interestingly, Glyptothorax was paraphyletic, with Gagata dolichonema well-supported in a cluster with the Glyptothorax species, sister to Glyptothorax zanaensis. This suggested that Gagata dolichonema may require reassignment to Glyptothorax. The genus Pareuchiloglanis, considered paraphyletic in previous studies [5,9,10], was polyphyletic here (Clade III in Figure 2), and therefore requires taxonomic revision.
Based on the novel genome obtained in this study, G. macromaculatus falls in the Glyptothorax with good support (Clade III in Figure 2). This is the first report of the phylogenetic position of this species within the Sisoridae.

4.3. Molecular Dating

The divergence time of the glyptosternoids, based on molecular evidence, has been subjected to debate [4,8,9,10]. For example, Guo et al., (2005) estimated the origin of the glyptosternoids at the Oligocene-Miocene boundary (~19–24 Ma), based on cytb sequences [4], but Ma et al., (2015) predicted a much later appearance (~5.5 Ma) [10]. Additional estimates of this divergence time include 24 Ma [4], 5.5 Ma [8], 7.0 Ma and ~9.8 Ma [9]. Our estimate, ~7.7 Ma (Figure 3), is consistent with the most recent of these reports.
The Chinese sisorid fishes are endemic to high-altitude rivers of the Tibetan Plateau [2,8,9,10]. The uplift of the Tibetan Plateau in the Miocene generated complex geographic isolations and connections, and has been hypothesized to have had a crucial impact on sisorid speciation [8]. Our estimated date of sisorid divergence supports this hypothesis, as this date coincided with the uplift of the Tibetan Plateau. Beginning about 20 Ma, a rapid uplift began in southern Tibet, and the plateau had almost reached its present elevation by 8 Ma [38]. The uplifting of northern edge has been estimated to have occurred later, between 13.7 and 9 Ma [39]. These important tectonic events substantially changed local landmasses and river distributions [40], which in turn could have accelerated the speciation of river-dwelling sisorid catfishes.

4.4. Adaptations to the High Elevation

The most outstanding feature of the Tibetan Plateau is its high elevation, an average altitude of more than 4000 m. As well as high elevation, the Tibetan Plateau has a low average temperature and is typically hypoxic. Mitochondrial protein-coding genes play a crucial role in ATP generation, supporting many energy-consuming processes, such as muscle contraction and ion pumping [41,42]. It is therefore possible that exposure to hypoxia and low temperatures over evolutionary time may have affected the rates of nucleotide substitution in the mitochondrial protein-coding genes of the glyptosternoid fishes. Indeed, signals of positive selection have been observed in the mitochondrial genomes of goats [43], Tibetan antelope [44], Tibetan asses [45], Tibetan horses [46], pikas [47], Chinese snub-nosed monkeys [48], and schizothoracine fishes (Cyprinidae) [49].
Here, the average Ka/Ks varied across the mitochondrial genes, with the Ka/Ks of atp8 being the most variable. This was consistent with the previously identified Ka/Ks ratios of two cyprinine species (Sinocyclocheilus grahami and S. altishoulderus), also restricted to the Tibetan Plateau [36]. Our results indicated that atp6 may have been subjected to positive selection along the branch ancestral to the glyptosternoids. However, our results were incongruent with a previous study, which showed that cox1 had been subjected to positive selection in the glyptosternoid fishes [10] (Table 2).
In summary, although our results suggested that most mitochondrial protein-coding genes had not been subjected to positive selection, atp6 might have changed rapidly to adapt to the high elevation of the Tibetan plateau. However, as effective population size [10] and life history [11,12] may also affect Ka/Ks values, more data, including population genetics and life history, are required to substantiate our present results.

5. Conclusions

Here, we assembled the first complete mitochondrial genome of G. macromaculatus and used this novel genome to determine the phylogenetic position of this species within the sisorid catfishes. Our phylogeny, which included representatives of all the 12 genera of Chinese sisorid catfishes, was robust and well-supported. Based on our preferred topology, we resolved some controversial issues and clarified some genus-level relationships within the Sisoridae. Interestingly, our molecular dating analysis indicated that the uplift of the Tibetan Plateau may have accelerated the speciation of the Chinese sisorid catfishes. Specifically, this uplift may have increased the nucleotide substitution rate of certain mitochondrial protein-coding genes (e.g., atp6), promoting the adaption of the sisorid fishes to the high elevations and low temperatures of the Tibetan Plateau.

Supplementary Materials

The following materials are available online at https://0-www-mdpi-com.brum.beds.ac.uk/2073-4425/9/6/282/s1. Table S1: The downloaded complete mitochondrial genomes from NCBI; Table S2: Sequences of the designed 12 primer pairs for amplification of the G. macromaculatus mitochondrial genome.

Author Contributions

Q.S. and Y.L. (Yunyun Lv) conceived and designed the project. Y.L. (Yanping Li), C.B., X.Y., J.Y., and W.J. participated in data analysis and figure preparation. Z.R. provided assistance to laboratory work. Y.L. (Yunyun Lv) prepared the manuscript. Q.S. revised the manuscript.

Acknowledgments

The work was supported by Yunnan Innovation and Enhancement Program of Provincial Science and Technology Department (No. 2016AB024), Shenzhen Special Program for Development of Emerging Strategic Industries (No. JSGG20170412153411369), and Shenzhen Science & Technology Program for International Cooperation (No. GJHZ20160229173052805).

Conflicts of Interest

The authors declare no conflict of interest.

Abbreviations

atp6Adenosine triphosphate synthase subunit 6
atp8Adenosine triphosphate synthase subunit 8
bpBase pair
cox1Mitochondrial encoded cytochrome c oxidase 1
cox2Mitochondrial encoded cytochrome c oxidase 2
cox3Mitochondrial encoded cytochrome c oxidase 3
cytbCytochrme b
KaNonsynonymous substitutions
kbkilobase
KsSynonymous substitutions
nd1NADH-Ubiquinone Oxidoreductase Chain 1
nd2NADH-Ubiquinone Oxidoreductase Chain 2
nd3NADH-Ubiquinone Oxidoreductase Chain 3
nd4NADH-Ubiquinone Oxidoreductase Chain 4
nd4lNADH-Ubiquinone Oxidoreductase Chain 4L
nd5NADH-Ubiquinone Oxidoreductase Chain 5
ORFOpen reading frame
PCRPolymerase chain reaction

References

  1. Hora, S.L.; Silas, E.G. Evolution and distribution of Glyptosternoid fishes of the family Sisoridae (Order: Siluroidea). Proc. Indian Natl. Sci. Acad. B Biol. Sci. 1952, 18, 309–322. [Google Scholar]
  2. He, S. The phylogeny of the Glyptosternoid fishes (Teleostei: Siluriformes, Sisoridae). Cybium 1996, 20, 115–159. [Google Scholar]
  3. Guo, X.; Zhang, Y.; He, S.; Chen, Y. Mitochondrial 16s rRNA sequence variations and phylogeny of the Chinese sisorid Catfishes. Chin. Sci. Bull. 2004, 49, 1586–1595. [Google Scholar] [CrossRef]
  4. Guo, X.; He, S.; Zhang, Y. Phylogeny and biogeography of Chinese sisorid catfishes re-examined using mitochondrial cytochrome b and 16S rRNA gene sequences. Mol. Phylogenet. Evol. 2005, 35, 344–362. [Google Scholar] [CrossRef] [PubMed] [Green Version]
  5. Peng, Z.; He, S.; Zhang, Y. Phylogenetic relationships of Glyptosternoid Fishes (Siluriformes: Sisoridae) inferred from mitochondrial cytochrome b gene sequences. Mol. Phylogenet. Evol. 2004, 31, 979–987. [Google Scholar] [CrossRef] [PubMed]
  6. Guo, X.; He, S.; Zhang, Y. Phylogenetic relationships of the Chinese sisorid catfishes: A nuclear intron versus mitochondrial gene approach. Hydrobiologia 2007, 579, 55–68. [Google Scholar] [CrossRef]
  7. Yu, M.; He, S. Phylogenetic relationships and estimation of divergence times among Sisoridae catfishes. Sci. China C Life Sci. 2012, 55, 312–320. [Google Scholar] [CrossRef] [PubMed] [Green Version]
  8. Peng, Z.; Ho, S.Y.; Zhang, Y.; He, S. Uplift of the Tibetan Plateau: Evidence from divergence times of Glyptosternoid catfishes. Mol. Phylogenet. Evol. 2006, 39, 568–572. [Google Scholar] [CrossRef] [PubMed]
  9. Zhou, C.; Wang, X.; Gang, X.; Zhang, Y.; Irwin, D.M.; Mayden, R.L. Diversification of sisorid catfishes (Teleostei: Siluriformes) in relation to the orogeny of the Himalayan Plateau. Sci. Bull. 2016, 61, 991–1002. [Google Scholar] [CrossRef]
  10. Ma, X.; Kang, J.; Chen, W.; Zhou, C.; He, S. Biogeographic history and high-elevation adaptations inferred from the mitochondrial genome of Glyptosternoid Fishes (Sisoridae, Siluriformes) from the southeastern Tibetan Plateau. BMC Evol. Biol. 2015, 15, 233. [Google Scholar] [CrossRef] [PubMed]
  11. Woolfit, M. Effective population size and the rate and pattern of nucleotide substitutions. Biol. Lett. 2009, 5, 417–420. [Google Scholar] [CrossRef] [PubMed] [Green Version]
  12. Strohm, J.H.T.; Gwiazdowski, R.A.; Hanner, R. Fast fish face fewer mitochondrial mutations: Patterns of dN/dS across fish mitogenomes. Gene 2015, 572, 27–34. [Google Scholar] [CrossRef] [PubMed]
  13. Mitterboeck, T.F.; Liu, S.; Adamowicz, S.J.; Fu, J.; Zhang, R.; Song, W.; Meusemann, K.; Zhou, X. Positive and relaxed selection associated with flight evolution and loss in insect transcriptomes. Gigascience 2017, 6, 1–14. [Google Scholar] [CrossRef] [PubMed] [Green Version]
  14. Li, R.; Yu, C.; Li, Y.; Lam, T.W.; Yiu, S.M.; Kristiansen, K.; Wang, J. Soap2: An improved ultrafast tool for short read alignment. Bioinformatics 2009, 25, 1966–1967. [Google Scholar] [CrossRef] [PubMed]
  15. Bankevich, A.; Nurk, S.; Antipov, D.; Gurevich, A.A.; Dvorkin, M.; Kulikov, A.S.; Lesin, V.M.; Nikolenko, S.I.; Pham, S.; Prjibelski, A.D. Spades: A new genome assembly algorithm and its applications to single-cell sequencing. J. Comput. Biol. 2012, 19, 455–477. [Google Scholar] [CrossRef] [PubMed]
  16. Lobo, I. Basic local alignment search tool (Blast). J. Mol. Biol. 2012, 215, 403–410. [Google Scholar]
  17. Mount, D.W. Using the basic local alignment search tool (Blast). Cold Spring Harb. Protoc. 2007, 2007. [Google Scholar] [CrossRef] [PubMed]
  18. Katoh, K.; Kuma, K.; Toh, H.; Miyata, T. Mafft version 5: Improvement in accuracy of multiple sequence alignment. Nucleic Acids Res. 2005, 33, 511–518. [Google Scholar] [CrossRef] [PubMed]
  19. Castresana, J. Selection of conserved blocks from multiple alignments for their use in phylogenetic analysis. Mol. Phylogenet. Evol. 2000, 17, 540–552. [Google Scholar] [CrossRef] [PubMed]
  20. Darriba, D.; Taboada, G.L.; Doallo, R.; Posada, D. Jmodeltest 2: More models, new heuristics and parallel computing. Nat. Methods 2012, 9, 772. [Google Scholar] [CrossRef] [PubMed]
  21. Guindon, S.; Gascuel, O.; Rannala, B. A simple, fast, and accurate algorithm to estimate large phylogenies by maximum likelihood. Syst. Biol. 2003, 52, 696–704. [Google Scholar] [CrossRef] [PubMed]
  22. Stamatakis, A. Raxml version 8: A tool for phylogenetic analysis and post-analysis of large phylogenies. Bioinformatics 2014, 30, 1312–1313. [Google Scholar] [CrossRef] [PubMed]
  23. Ronquist, F.; Teslenko, M.; Van Der Mark, P.; Ayres, D.L.; Darling, A.; Höhna, S.; Larget, B.; Liu, L.; Suchard, M.A.; Huelsenbeck, J.P. Mrbayes 3.2: Efficient Bayesian phylogenetic inference and model choice across a large model space. Syst. Biol. 2012, 61, 539–542. [Google Scholar] [CrossRef] [PubMed]
  24. Drummond, A.J.; Rambaut, A. Beast: Bayesian evolutionary analysis by sampling trees. BMC Evol. Biol. 2007, 7, 214. [Google Scholar] [CrossRef] [PubMed] [Green Version]
  25. Yang, Z. Paml 4: Phylogenetic analysis by maximum likelihood. Mol. Biol. Evol. 2007, 24, 1586–1591. [Google Scholar] [CrossRef] [PubMed]
  26. Kumar, S.; Stecher, G.; Tamura, K. Mega7: Molecular evolutionary genetics analysis version 7.0 for bigger datasets. Mol. Biol. Evol. 2016, 33, 1870–1874. [Google Scholar] [CrossRef] [PubMed]
  27. Librado, P.; Rozas, J. DnaSP v5: A software for comprehensive analysis of DNA polymorphism data. Bioinformatics 2009, 25, 1451–1452. [Google Scholar] [CrossRef] [PubMed]
  28. R Development Core Team. R: A Language and Environment for Statistical Computing; The R Foundation for Statistical Computing: Vienna, Austria, 2013. [Google Scholar]
  29. Kim, I.C.; Jung, S.O.; Lee, Y.M.; Lee, C.J.; Park, J.K.; Lee, J.S. The complete mitochondrial genome of the rayfish Raja porosa (Chondrichthyes, Rajidae). DNA Seq. 2005, 16, 187–194. [Google Scholar] [CrossRef] [PubMed]
  30. Kim, I.C.; Kweon, H.S.; Kim, Y.J.; Kim, C.B.; Gye, M.C.; Lee, W.O.; Lee, Y.S.; Lee, J.S. The complete mitochondrial genome of the javeline goby Acanthogobius hasta (Perciformes, Gobiidae) and phylogenetic considerations. Gene 2004, 336, 147–153. [Google Scholar] [CrossRef] [PubMed]
  31. Kim, I.C.; Lee, J.S. The complete mitochondrial genome of the rockfish Sebastes schlegeli (Scorpaeniformes, Scorpaenidae). Mol. Cells 2004, 17, 322–328. [Google Scholar] [PubMed]
  32. Xu, T.J.; Cheng, Y.Z.; Liu, X.Z.; Shi, G.; Wang, R.X. The Complete Mitochondrial genome of the marbled rockfish Sebastiscus marmoratus (Scorpaeniformes, Scorpaenidae): Genome characterization and phylogenetic considerations. Mol. Biol. 2011, 45, 434–445. [Google Scholar] [CrossRef]
  33. Anderson, S.; de Bruijn, M.H.; Coulson, A.R.; Eperon, I.C.; Sanger, F.; Young, I.G. Complete sequence of bovine mitochondrial DNA conserved features of the mammalian mitochondrial genome. J. Mol. Biol. 1982, 156, 683–717. [Google Scholar] [CrossRef]
  34. Anderson, S.; Bankier, A.T.; Barrell, B.G.; Bruijn, M.H.L.D.; Coulson, A.R.; Drouin, J.; Eperon, I.C.; Nierlich, D.P.; Roe, B.A.; Sanger, F. Sequence and organization of the human mitochondrial genome. Nature 1981, 290, 457–465. [Google Scholar] [CrossRef] [PubMed]
  35. Inoue, J.G.; Masaki, M.; Katsumi, T.; Mutsumi, N. Complete mitochondrial DNA sequence of the Japanese sardine. Fish. Sci. 2001, 67, 828–835. [Google Scholar] [CrossRef]
  36. Wu, X.; Wang, L.; Chen, S.; Zan, R.; Xiao, H.; Zhang, Y. The complete mitochondrial genomes of two species from Sinocyclocheilus (Cypriniformes: Cyprinidae) and a phylogenetic analysis within Cyprininae. Mol. Biol. Rep. 2010, 37, 2163–2171. [Google Scholar] [CrossRef] [PubMed]
  37. Kartavtsev, Y.P.; Jung, S.O.; Lee, Y.M.; Byeon, H.K.; Lee, J.S. Complete mitochondrial genome of the bullhead torrent catfish, Liobagrus Obesus (Siluriformes, Amblycipididae): Genome description and phylogenetic considerations inferred from the Cyt b and 16s rRNA genes. Gene 2007, 396, 13–27. [Google Scholar] [CrossRef] [PubMed]
  38. Harrison, T.M.; Copeland, P.; Kidd, W.S.; Yin, A. Raising Tibet. Science 1992, 255, 1663–1670. [Google Scholar] [CrossRef] [PubMed]
  39. Sun, J.; Zhu, R.; An, Z. Tectonic uplift in the northern Tibetan Plateau since 13.7 Ma ago inferred from molasse deposits along the altyn tagh fault. Earth Planet. Sci. Lett. 2005, 235, 641–653. [Google Scholar] [CrossRef]
  40. Clark, M.K.; House, M.A.; Royden, L.H.; Whipple, K.X.; Burchfiel, B.C.; Zhang, X.; Tang, W. Late Genozoic uplift of southeastern Tibet. Geology 2005, 33, 525–528. [Google Scholar] [CrossRef]
  41. Sun, Y.B.; Shen, Y.Y.; Irwin, D.M.; Zhang, Y. Evaluating the roles of energetic functional constraints on teleost mitochondrial-encoded protein evolution. Mol. Biol. Evol. 2011, 28, 39–44. [Google Scholar] [CrossRef] [PubMed]
  42. Sun, S.E.; Li, Q.; Kong, L.; Yu, H. Limited locomotive ability relaxed selective constraints on molluscs mitochondrial genomes. Sci. Rep. 2017, 7, 10628. [Google Scholar] [CrossRef] [PubMed] [Green Version]
  43. Yang, C.; Xiang, C.; Qi, W.; Xia, S.; Tu, F.; Zhang, X.; Moermond, T.; Yue, B. Phylogenetic analyses and improved resolution of the family Bovidae based on complete mitochondrial genomes. Biochem. Syst. Ecol. 2013, 48, 136–143. [Google Scholar] [CrossRef]
  44. Xu, S.Q.; Yang, Y.Z.; Zhou, J.; Jing, G.E.; Chen, Y.T.; Wang, J.; Yang, H.M.; Wang, J.; Yu, J.; Zheng, X.G. A mitochondrial genome sequence of the Tibetan antelope (Pantholops hodgsonii). Genom. Proteom. Bioinform. 2005, 3, 5–17. [Google Scholar] [CrossRef]
  45. Luo, Y.; Chen, Y.; Liu, F.; Gao, Y. Mitochondrial genome of Tibetan wild ass (Equus kiang) reveals substitutions in Nadh which may reflect evolutionary adaption to cold and hypoxic conditions. Asia Life Sci. 2011, 21, 1–11. [Google Scholar]
  46. Xu, S.; Luosang, J.; Hua, S.; He, J.; Ciren, A.; Wang, W.; Tong, X.; Liang, Y.; Wang, J.; Zheng, X. High altitude adaptation and phylogenetic analysis of Tibetan horse based on the mitochondrial genome. J. Genet. Genom. 2007, 34, 720–729. [Google Scholar] [CrossRef]
  47. Luo, Y.; Gao, W.; Gao, Y.; Tang, S.; Huang, Q.; Tan, X.; Chen, J.; Huang, T. Mitochondrial genome analysis of ochotona curzoniae and implication of Cytochrome C oxidase in hypoxic adaptation. Mitochondrion 2008, 8, 352–357. [Google Scholar] [CrossRef] [PubMed]
  48. Yu, L.; Wang, X.; Ting, N.; Zhang, Y. Mitogenomic analysis of Chinese snub-nosed monkeys: Evidence of positive selection in NADH dehydrogenase genes in high-altitude adaptation. Mitochondrion 2011, 11, 497–503. [Google Scholar] [CrossRef] [PubMed]
  49. Li, Y.; Ren, Z.; Shedlock, A.M.; Wu, J.; Sang, L.; Tersing, T.; Hasegawa, M.; Yonezawa, T.; Zhong, Y. High altitude adaptation of the schizothoracine fishes (Cyprinidae) revealed by the mitochondrial genome analyses. Gene 2013, 517, 169–178. [Google Scholar] [CrossRef] [PubMed]
Figure 1. The complete mitochondrial genome of Glyptothorax macromaculatus. The inner blue and purple bars indicate deviations in the GC content and GC skew, respectively, in each 500-bp window across the entire mitochondrial genome.
Genes 09 00282 g001
Figure 2. A representative molecular phylogeny of the sisorid fishes generated by maximum likelihood. Glyptothorax macromaculatus is indicated with a red star. The red letters (“a” to “w”) represent the support values for each node as detailed in the table; * in the table indicates 100% bootstrap support or Bayesian posterior probability. Scale bar represent nucleotide substitutions per site.
Genes 09 00282 g002
Figure 3. The molecular timing of species divergences within the Sisoridae, based on an analysis of complete mitochondrial genomes. C1, C2, and C3 are the three fossil-calibrated time points (see details in the text under Section 2.2).
Genes 09 00282 g003
Figure 4. (a) Ka and (b) Ka/Ks for the 13 mitochondrial protein-coding genes. The average value of Ka is greatest for nd6, and the average value of Ka/Ks is greatest for atp8, suggesting that atp8 has evolved more quickly than the other mitochondrial genes.
Genes 09 00282 g004
Table 1. Characteristics of the mitochondrial genome of Glyptothorax macromaculatus.
Codon
Gene/ElementfromtoLength (bp)StartStopIntergenic NucleotidesStrand
tRNA-Phe16969 H
12S rRNA701021952 5H
tRNA-Val1027109872 H
16S rRNA109927741677 H
tRNA-Leu (UUR)2775284976 H
nd128503824975ATGTAA5H
tRNA-Ile3830390172 −1H
tRNA-Gln3901397171 −2L
tRNA-Met3970403869 2H
nd2404150851045ATGT-- H
tRNA-Trp5086515671 2H
tRNA-Ala5159522769 1L
tRNA-Asn5229530173
tRNA-Cys5334539663 6L
tRNA-Tyr5403547169 1L
cox1547370231551GTGTAA1H
tRNA-Ser (UCN)7025709369 5L
tRNA-Asp7099717072 15H
cox271867876691ATGT-- H
tRNA-Lys7877795074 1H
atp879528119168ATGTAA−8H
atp681108793684ATGTAA−1H
cox387939576784ATGT-- H
tRNA-Gly9577964872 H
nd396499997349ATGT-- H
tRNA-Arg999810,06770 H
nd4l10,06810,359292ATGT--−2H
nd410,35811,7381381ATGT-- H
tRNA-His11,73911,80870 H
tRNA-Ser (AGY)11,80911,87668 5H
tRNA-Leu (CUN)11,88211,95473 H
nd511,95513,7771823ATGTAA H
nd613,77814,296519ATGTAA L
tRNA-Glu14,29714,36569 5L
cytb14,37115,5081138ATGT-- H
tRNA-Thr15,50915,57668 2H
tRNA-Pro15,57915,64870 L
D-loop15,64916,535887 -
Table 2. Models of selection pressure on the mitochondrial protein-coding genes of the glyptosternoid fishes.
Geneω0ω1ω2p Value
atp60.037930.036872.42190.009 *
atp80.138190.138140.139390.13
cox10.011620.011820.00010.15
cox20.022300.022300.00010.14
cox30.027920.028250.00010.18
cytb0.032010.032300.015630.44
nd10.051520.052500.009270.08
nd20.69420.070100.035190.36
nd30.69690.6920+∞0.27
nd40.41790.041980.031870.73
nd4l0.075510.078240.00010.11
nd50.053330.53860.13080.20
nd60.074240.073900.082470.88
Note: The ratio of non-synonymous to synonymous substitutions (Ka/Ks) was calculated using codon alignments of the glyptosternoid fishes with other sisorid species. ω0 is the average Ka/Ks ratio across all branches (one-ratio model); ω1 is the average Ka/Ks ratio along the non-glyptosternoid branches and ω2 is the Ka/Ks ratio along the glyptosternoid branches (two-ratio model). * indicates a significant difference between the two-ratio and one-ratio models (p < 0.05).

