The Role of Place of Delivery in Preventing Neonatal and Infant Mortality Rate in India


1
Department of Public Health and Mortality, International Institution for Population Sciences (IIPS), Mumbai 400088, India
2
Department of Geography, M. J. K. College, Bettiah, BRA Bihar University, Muzaffarpur 845438, India
3
Department of Civil & Environmental Engineering, University of the West Indies, St. Augustine, Trinidad and Tobago
*
Author to whom correspondence should be addressed.
Geographies 2021, 1(1), 47-62; https://0-doi-org.brum.beds.ac.uk/10.3390/geographies1010004
Submission received: 24 February 2021
/
Revised: 28 March 2021
/
Accepted: 8 April 2021
/
Published: 20 April 2021
Abstract
:Skilled birth attendance and institutional delivery have been advocated for reducing maternal, neonatal mortality and infant mortality (NMR and IMR). This paper examines the role of place of delivery with respect to neo-natal and infant mortality in India using four rounds of the Indian National Family Health Survey conducted in 2015–2016. The place of birth has been categorized as “at home” or “public and private institution.” The role of place of delivery on neo-natal and infant mortality was examined by using multivariate hazard regression models adjusted for clus-tering and relevant maternal, socio-economic, pregnancy and new-born characteristics. There were 141,028 deliveries recorded in public institutions and 54,338 in private institutions. The esti-mated neonatal mortality rate in public and private institutions during this period was 27 and 26 per 1000 live births respectively. The study shows that when the mother delivers child at home, the chances of neonatal mortality risks are higher than the mortality among children born at the health facility centers. Regression analysis also indicates that a professionally qualified provider′s antenatal treatment and assistance greatly decreases the risks of neonatal mortality. The results of the study illustrate the importance of the provision of institutional facilities and proper pregnancy in the prevention of neonatal and infant deaths. To improve the quality of care during and imme-diately after delivery in health facilities, particularly in public hospitals and in rural areas, accel-erated strengthening is required.
1. Introduction
Neonatal deaths account for a major proportion of the world’s pediatric deaths. Globally four million deaths occur every year in the first month of life [1]. Almost all (99%) neonatal deaths found in low-income and middle-income countries [1,2]. Glob-ally, the neonatal mortality declined from 37 deaths in 1990 to 18 deaths per 1000 live births in 2017, but that decline was slower than the decline in mortality among children aged 1–59 months [3]. In 2018, 2.5 million children died in the first month of life-approximately 7000 neonatal deaths every day, with one third dying on the first day of life [4]. Consequently, the proportion of deaths in the neonatal period rose from 38% (4 million) of total deaths in 2000 to about 41% (3.3 million) in 2009 [1,2]. There also exist marked disparities in neonatal mortality across regions and countries. Re-gionally, neonatal mortality was highest in sub-Saharan Africa and South Asia, with each estimated at 28 and 26 deaths per 1000 live births in 2018, respectively [4].
One of the major public health problems in India is neonatal mortality. Each Year about one million babies dying before they complete their first month of life and it ac-counting one-fourth of the global burden of death [5]. The neonatal mortality rate in India was 32 per 1000 live births in the year 2010, a high rate that has not declined much in the last decade [4,6]. India’s neonatal mortality rate dropped significantly, that is, by 25%, from 69 per 1000 live births in 1980 to 53 per 1000 live births in 1990 followed by a 15%, decline from 51 to 44 per 1000 live births between 1991 and 2000 [7]. Another estimate from India’s nationally representative National Family Health Survey (NFHS) datasets show that neonatal deaths have increased as a proportion of under-five deaths from 45% in NFHS-1 (1992) to 52% in NFHS-3 (2005–2006). In re-cent year NFHS-4 declined from 40 per 1000 live births in 2005 to 34 per 1000 live births in 2016. Urban-rural differences in neonatal mortality exist with the mortality rates higher by 50% in rural (38/1000 live births) compared to urban (22/1000 live births) areas, as per the National Family Health Survey-4 [8,9]. The causes of these deaths in India include infectious diseases, birth asphyxia, and prematurity which contribute to 32.8%, 22.3%, and 16.8% of the total neonatal deaths, respectively [10,11].
The numerous studies have shown that Delivery in a health facility with a skilled provider should reduce early neo-natal mortality and infant mortality [12,13,14]. Skilled birth attendance and an institutional environment capable of providing effective ob-stetric and neonatal care are needed to significantly reduce maternal deaths, stillbirths, neonatal and infant deaths [15]. Recently, in India implement Janani Suraksha Yojana (JSY) has taken successful steps towards a conditional cash transfer scheme used by the Government of India to encourage deliveries in government health facilities [15,16,17]. However, research indicates that neonatal mortality has not decreased [18]. Ma-ternal and perinatal deaths may be linked to poor quality emergency obstetric referral services. [19]. Rammohan et al. (2013) found that weakest link in India’s Emergency Obstetric Care Services was mainly due to delays in deciding to seek care; delay in reaching a first referral level facility, and; delay in actually receiving care after arriv-ing at the facility. For result referral hospitals to provide emergency obstetric care ser-vices for complications that arise during late pregnancy and at birth. Furthermore, the rural-urban differential public health facility was one of the leading causes for high neo-natal mortality in India. Although the rate of neonatal mortality in rural India is relatively higher than in urban areas, this is primarily due to issues with un-der-resourced public health facilities and a shortage of specialized health workers [7]. The rural healthcare facility has been developed as a three-tier structure based on pre-determined population norms. The subcenters is the most peripheral institution and the first point of contact between the primary healthcare system and the community. Primary Health Centers (PHCs) comprise the second tier, which is considered to pro-vide integrated curative and preventive healthcare to the rural population. Finally, Community Health Centers (CHCs) are the uppermost tier and are primarily in charge of providing specialized obstetric and child care [7,17]. The studies in 2011 found that there was a 64% shortage of specialized health workers in rural health facilities na-tionally, including a 66% shortage of obstetricians and gynecologists, and 74% shortage of pediatricians relative to requirements for existing infrastructure [4,20,21]. The crit-ical shortage of neonatal specialists widened the mortality disparity between rural and urban areas.
Another key point is that most deliveries and neonatal deaths in rural India occur at home, with no support from skilled birth attendants [22]. Furthermore, a large number of endogenous factors, such as close birth intervals and maternal complica-tions during pregnancy, as well as lower maternal age at birth, are responsible for ne-onatal deaths [23]. Hatt and colleagues (2009) studies found that in Indonesia the chances of new-born death on the first day or within the first week of life were not sig-nificantly different between women who had home births supervised by a skilled worker and those who had given birth at home without a professional attendant [24]. Similarly, deliveries with and without qualified assistants have been studied in various locations, but no association between home-based deliveries and neonatal mortality has been found, regardless of the presence of qualified assistants. As a result, the study′s goal is to identify the determinants of neonatal and infant mortality in India, as well as their relationship with facility-based delivery.
2. Methodology
2.1. Data
The study is based on secondary data collected from the most recent round of the National Family Health Survey (NFHS-4) 2015–2016, which is a nationally representa-tive, multi-round, population-based survey conducted in all the states and union terri-tories of India under the direction of the Ministry of Health and Welfare, Government of India. The NFHS 4 is a nationwide cross-sectional household survey conducted with a representative sample of 601,509 households throughout the country during 2015–2016. The NFHS collects information on fertility, mortality, morbidity, and maternal and child health. The data were collected using face to face interview schedules and the household and eligible female informant response rates were consistently above 90% across the three rounds. The study used appropriate weights in the analysis to make the estimates representative and comparable across the four survey rounds, as well as to account for the multistage sampling design used in the four rounds of the NFHS. The unit of the analysis for this study is the children below 1 year of age; infor-mation was collected based on 259,627 observations from the kid file for the last five years with the women age group of 15–49. All the woman surveyed were asked to pro-vide complete birth histories including sex, date of birth, and survival status for each live birth; the analysis uses the birth history data.
2.2. Outcome Variables
Neo-natal and infant mortality are two dependent variables of the study. Where the neo-natal mortality defined as the death of life born baby within 28 days of life, while infant mortality defined as dead of life born baby before reaching age 12 months. The outcome variable for the study was recorded as a binary variable in the datasets, assigned a value of 1 if the baby died and 0 if the baby was survived.
2.3. Independent Variables
The primary independent variable of interest is the child’s reported place of de-livery. The NFHS survey question on place of delivery includes the following options: Home (respondent’s home or other home); Public Sector (government hospital, gov-ernment health centre, government health post or other public sector); or Private Medical Sector (private hospital or clinic, other private medical facility).
Covariates were included based on previous literature with the primary objective of adjusting for socio-demographic information about the mother, child and house-hold, such as maternal age below 19 and above 30, birth order as 1, 2 and above 3, birth interval as less or more than 24 months, mother BMI under, normal and obesity, ma-ternal education as no education, primary, secondary and higher secondary, sex of child as male/female, child birth weight as low/high, household wealth as poorest, middle and richest, place of residence as rural/urban, caste SCs, STs, OBCs and others, religion as Hindu, Muslim and Christian, mass media (newspaper, television and ra-dio), antenatal care received/not received, assistant by doctor and nurse and delivered by casearation or not.
2.4. Statistical Methods
Descriptive analysis was used to determine the distribution of the variables and bivariate analysis to measure the relationship between each of the independent varia-bles and the main exposure variable at the place of delivery (home vs. facility). Neo-natal and infant mortality rates were estimated based on the simple life table ap-proach using STATA 14.0. This approach builds up a 12–59 month matrix of exposure and deaths for each month that the child was alive between the first and 11 month of life.
The Cox Proportional Hazard Regression Model was used to measure hazard ra-tios (HRs) and 95% confidence intervals (CIs) to assess the odds of neonatal death and infant death by maternal, pregnancy level delivery care and socio-demographic status.
Multivariable analyses were assessed between place of delivery and the other variables in the model. Model 1 describes the adjusted hazard ratios between neonatal deaths, maternal, child, and childbirth characteristics at home, while Model 2 includes place of delivery and pregnancy delivery characteristics, and Model 3 calculates the adjusted hazard ratio by incorporating maternal, sociodemographic, and mater-nal-pregnancy delivery care factors. All analysis was performed using statistical soft-ware package STATA® (Version 14.0).
2.5. Results and Discussion
Table 1 present the state-wise neonatal and infant mortality by place of delivery 2015–2016. It was found that Overall, 141,028 (54.5%) and 54,338 (20.9%) deliveries occurred in a public and private hospital, and 63,742 deliveries (24.5%) occurred in a home setting. State wise highest percentage of births delivered by public hospital are found in Sikkim (85%), Jammu and Kashmir (77%), Odisha (76%), Madhya Pradesh (69%) and Tripura (68%). Looking at private health facilities, highest percentage of births delivered in southern states, e.g., in Kerala 61% of birth delivered in public hos-pital followed by Telangana 58%, Andhra Pradesh 53% and Tamil Nadu 32%. Gujarat is only state of northern India where 51% births have been delivered in the Public hos-pitals. Similarly, highest percentage of births without health facility for home are found in north-eastern states, such as Nagaland (68%) followed by Arunachal Pradesh (49%), Meghalaya (47%) and Manipur (36%). In complete contract in neo-natal and infant mortality due to health facility highest mortality in public and private hospital both are found in the states of Uttar Pradesh followed by Chhattisgarh and Madhya Pradesh and Bihar respectively. Neonatal and infant mortality rate was significantly higher for home deliveries (39) than for deliveries at health facilities, but the difference is negligible for public and private hospitals, where 27 per thousand live births died in public hospital and 26 per thousand live births died in private hospitals, respectively.
Table 2 describes the Bio-demographic and Socio-economic factor affecting the neo-natal and infant mortality rate in the five years preceding the survey by place of delivery status. Almost half of the neonatal deaths were of children with mothers between the ages of 15–19 years. Both neonatal and infant mortality rates were higher in both public and private hospitals for mothers with birth intervals of less than 24 months. At both places of delivery, the male child was at greater risk of neonatal death than the female child. There was a higher risk of mortality among mothers living in the rural areas than the mothers living in urban areas due to lower health facilities, low awareness and low maternal education in rural areas as compare to urban areas. With regard to wealth, the quintile risk of mortality relatively higher when the poorest mother given birth at home then in institutional health facilities. Coming into pregnancy and delivery related characteristics higher number of neonatal died for both public and private hospital, those mothers had received less than four antenatal care during the pregnancy. The risk of survival of a new born baby was lower if delivered assistant by doctor as compare to the nurse. Similarly, higher chance of a new born baby died if the birth was delivered by casearation section as compared to normal births for both public and private hospital. Table 2 shows that the risk of neo-natal and infant mortality is the same in both public and private institutions, but the risk of death at home without a health facility is relatively higher than in an institutional health facility.
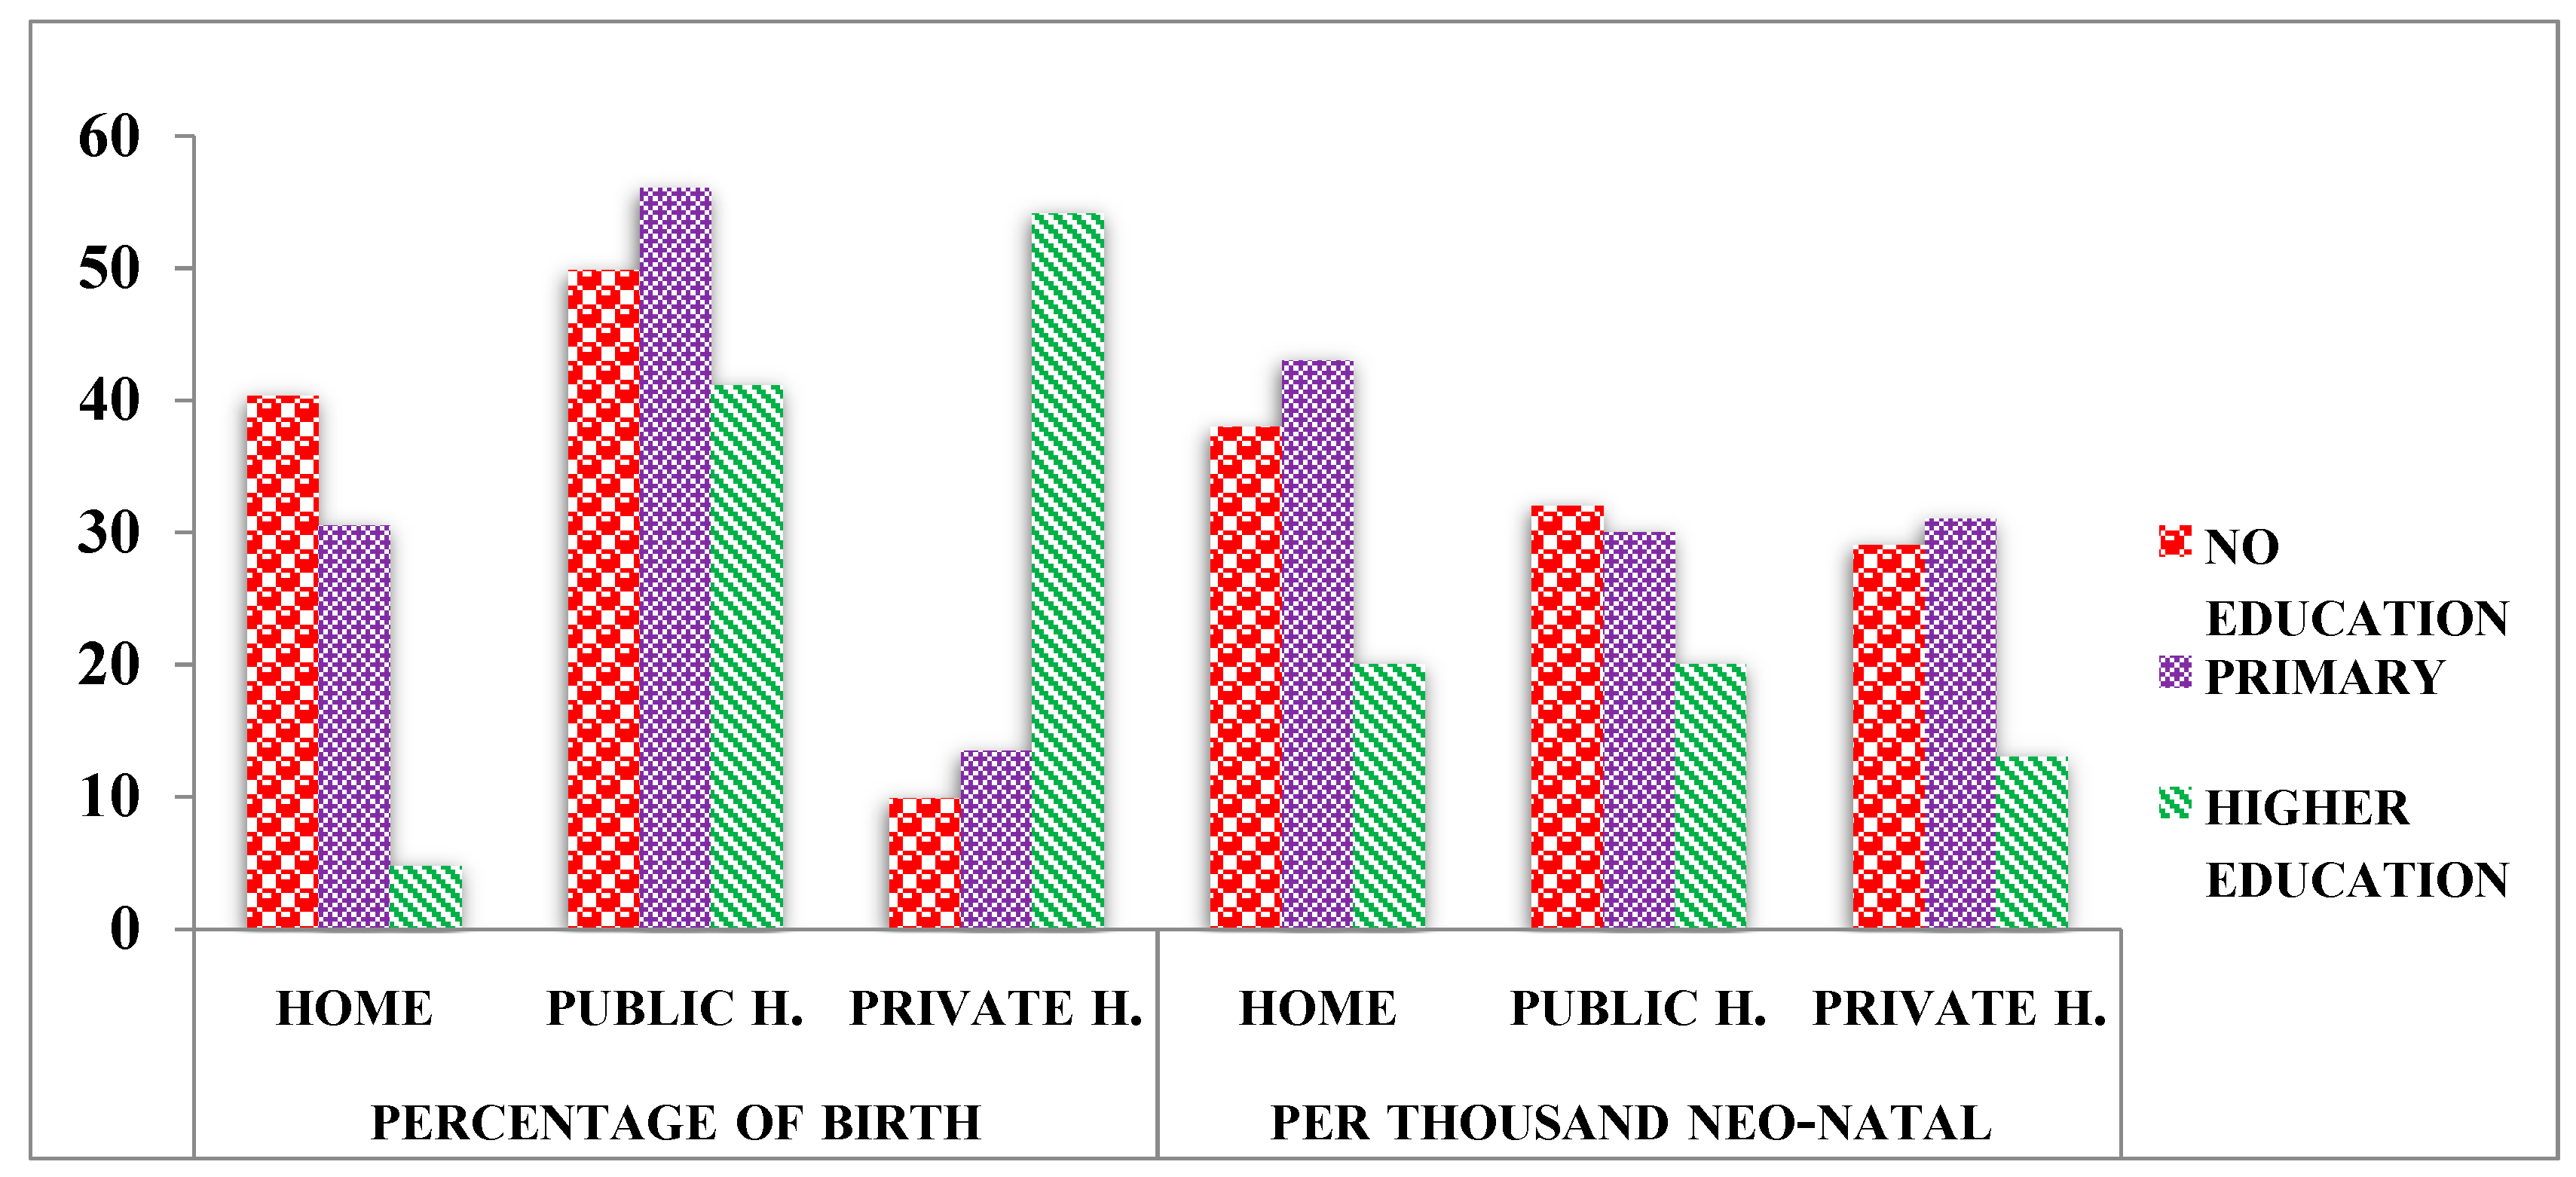
Figure 1 presents the percentage distribution of live births and per thousand neo-natal mortality rates by place of delivery due to mother’s education across the India. Around 40% of the deliveries in India were carried out at home with mother without education, while 56% in public institutions with primary education and 54% of the deliveries took place on the way to private hospital to mother of higher education. On the contrary home-based delivery mother without education neo-natal mortality rate was higher than those mothers delivered in births in public and private institution respectively. The declined in neo-natal mortality rate for each unit with increased mother education and in the institutional delivery.
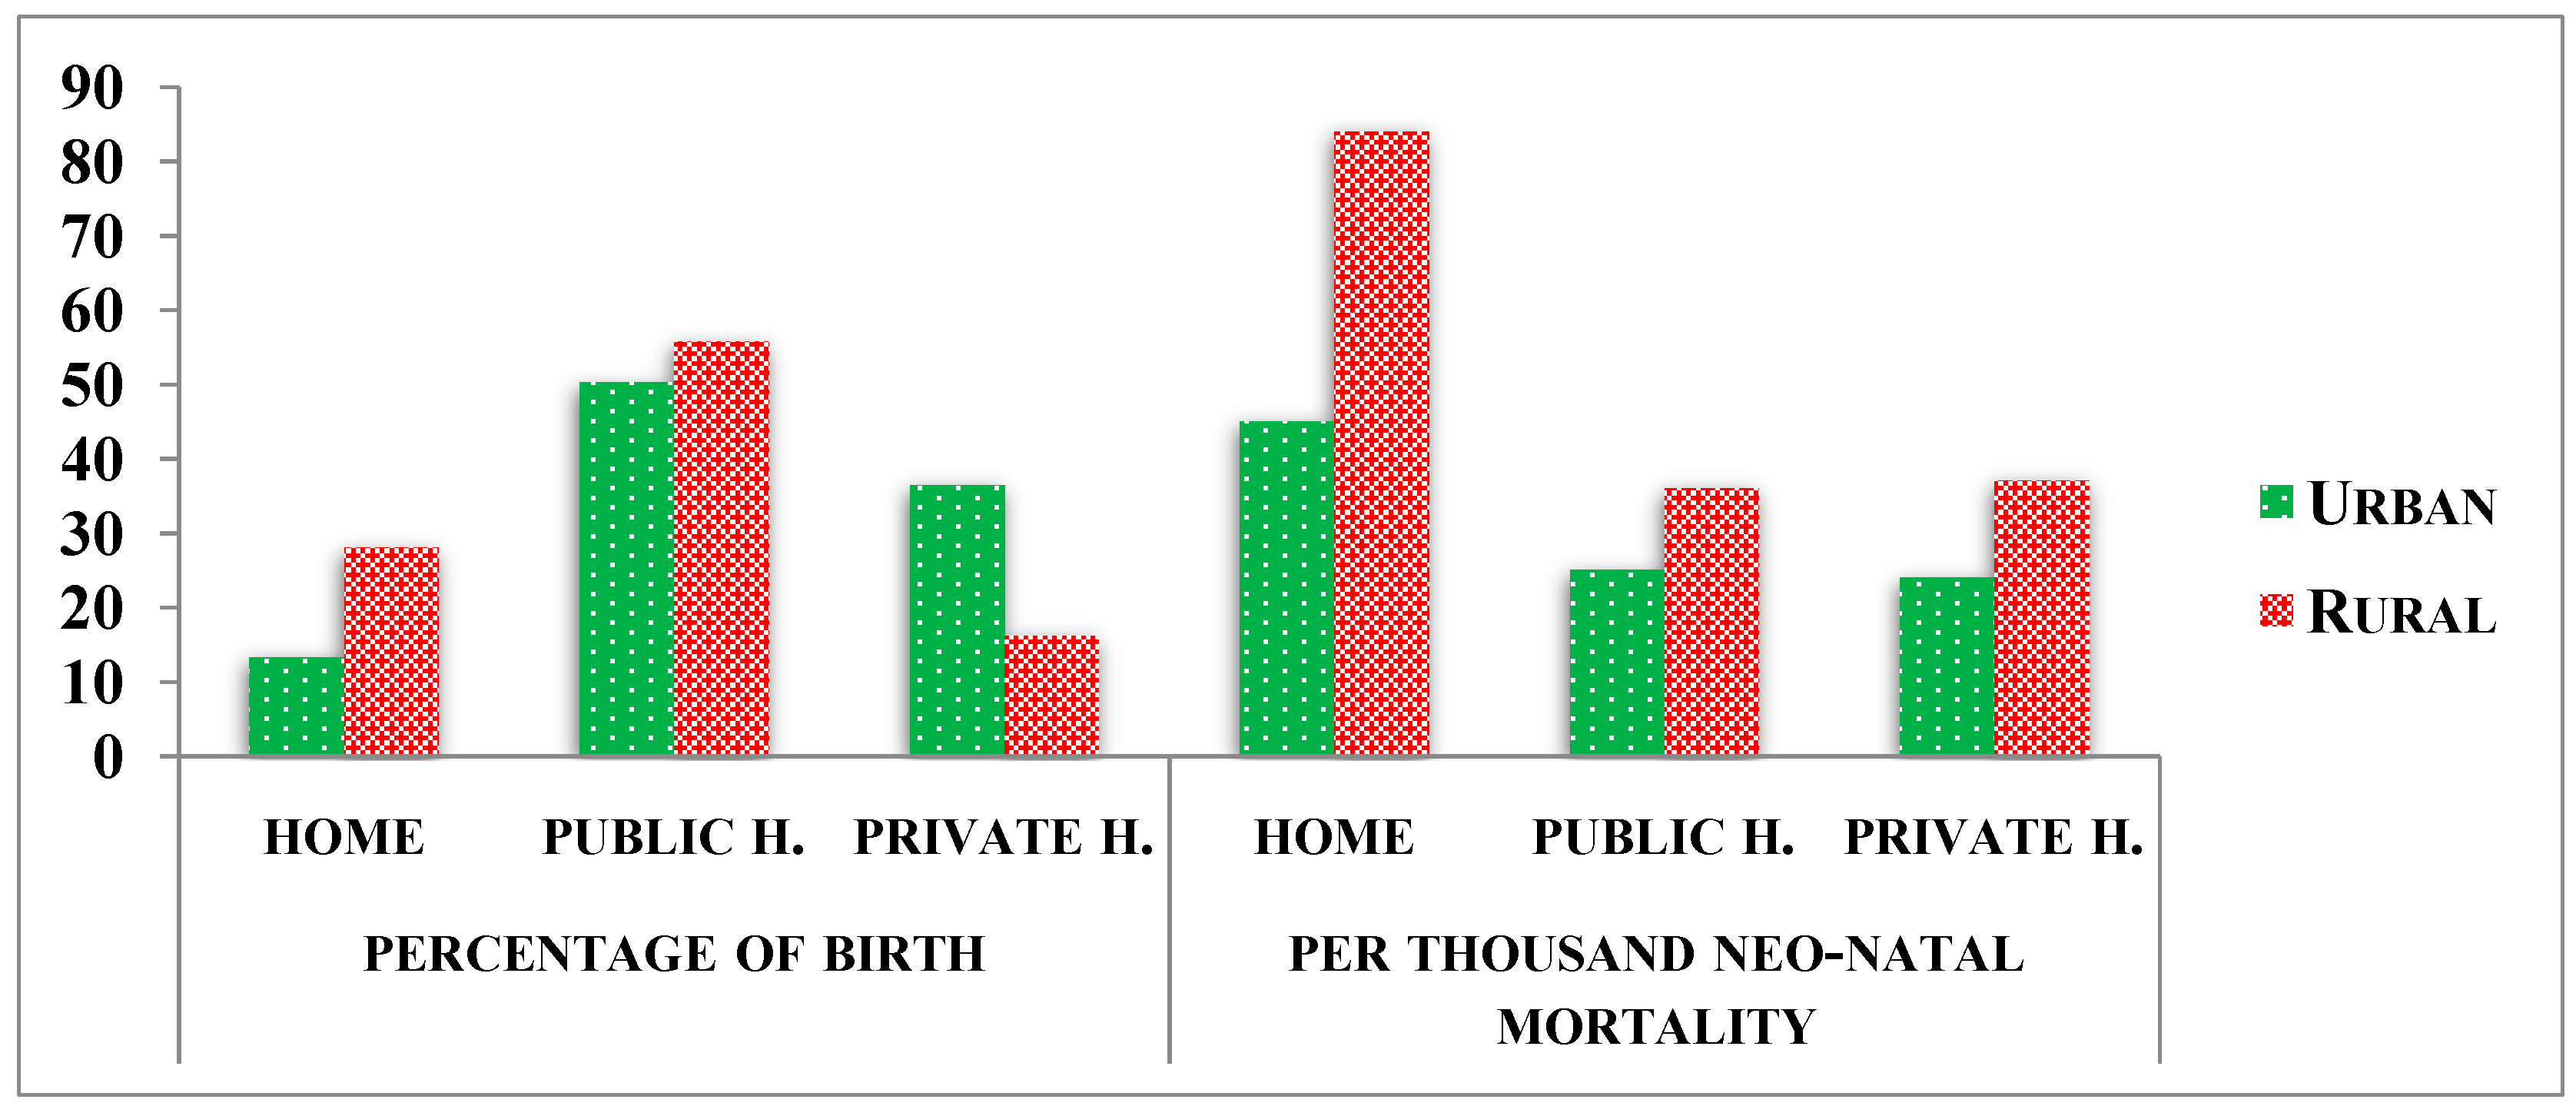
Figure 2 depicts the percentage distribution of live births and per thousand neo-natal mortality rates by place of delivery due to place of residence in India. It was identified that only 13% of births in urban areas were delivered at home, while 28% were delivered in rural areas. There was no discernible difference between urban and rural public hospital births, but private institution-based delivery was higher in cities than in rural areas. In the context of a complete neonatal mortality contract based on place of residence, increased mortality rates were found in rural areas compared to urban areas for both place of delivery due to a lack of well-trained personnel, a lack of adequate health care facilities, a lack of medical coverage, and poor transportation facilities.
Finally, results of the hazard regression models 1, 2 and 3 for neonatal and infant mortality were presented in Table 3 and Table 4, where Model 1 shows maternal level characteristics at home delivery, and Models 2 is pregnancy and delivery-based characteristics and Model 3 was adjusted with maternal socio-demographic, pregnancy and delivery characteristics. Model 1 revealed that the risk of neonatal mortality among children born to mothers who gave birth at home is 1.26 times higher than the risk of neonatal mortality among children born to women who have access to health care (HR: 1.26; 95 percent CI: 1.19, 1.34). The results also showed that mother age at births, birth interval more than 24 months, mothers’ highest level of education, wealth quintile, place of birth (urban-rural), caste and religion emerged as statistically significant predictors of early-neonatal deaths in India in multivariate analysis.
Hazard result Model 2 showed that the risk of neonatal death in a private hospital was 0.12 times higher than in a public hospital, with no statistically significant 95 percent confidence interval. Those mothers had received at least 4 ANC components during antenatal visits had 22 percent lower risks as compared to babies born to mothers who had not received any components of ANC during their visits (HR 0.78; 95 percent CI: 0.73, 0.83). The risk of new born baby dying 1.01 times higher when delivered by nurse as compare to assistant by doctor without statistically significant. At the same time risk of new born babies delivered by casearation section as compared to normal birth delivery (HR 1.01; 95 percent CI: 0.919–1.102) respectively.
After adjustment maternal socio-demographic, pregnancy and delivery characteristics in Model 3, depicts those mother who had given birth in a private or public facility had significantly lower value of neonatal death than those who had given birth at home (HR 0.86 95 percent CI 0.76–0.97 and HR 1.24, 95 percent CI 1.08–1.43 respectively).The risks of neo-natal death has increased, while at the same time increasing the maternal age of birth, birth order and mother BMI in 0.59, 0.88 and 1.44 time with statistical significance respectively. On the contrary higher maternal age with education decreased by 22 percent in the early neo-natal death with 95 percent statistically significant. The hazard risks of dying in the early-neonatal period is 43 percent lower for a child born in the richest wealth quintile compared to a child born in the poorest wealth quintile group. It depicts from the results that babies born to women who had received more than 4 ANC components during antenatal visits had 32 percent lower risks of neo-natal mortality compared to babies born to mothers who had not received any components of ANC during their visits (HR 0.68; 95 percent CI: 0.61, 0.76).The odds of neonatal mortality among women who gave birth with assistant of doctor at health institutions was 1.03 lower than among those who gave birth attendants by nurses at institution, and this difference was not statistically significant.
The results of hazard models for infant mortality are presented in Table 4. Like neo-natal mortality, for model 1 we found mother age at birth, birth interval, mothers’ highest level of education, wealth quintile, place of birth (urban-rural), religion, are statistically significant predictors of infant deaths in India in multivariate models.
For model 2, adjusted with pregnancy and delivery-based characteristics showed that the differential risk of infant death between public and private hospital was narrowed. The mothers who had received more than 4 antenatal care 46 percent have lower risk then who had not received any antenatal care.
For model 3 presented adjusted maternal, socio-demographic and delivery level characteristics. A significant association was found between mother’s age and infant mortality; birth order and interval were also significantly associated with infant mortality. Irrespective of the birth order, new-borns with a birth interval less than 24 months had a higher risk of mortality during infancy than new-borns with a birth interval of 24 months or more. Another variable that was significantly associated with infant mortality was the region of residence.
Table 5 presents the AHRs (with 95% confidence interval) of neo-natal and infant mortality by place of delivery controlling for all other socio demographic correlations between the states of India. These results are robust with the pattern obtained at the national level. The results clearly indicate that there is a higher risk of neo-natal and infant death at home as compared to those who gave birth in public and private health facilities. The higher risk neonatal died at home found in the state of Delhi, Meghalaya, Tamil Nadu and Jammu and Kashmir. When comparing public and private hospital health facilities, it was found that a private health institution had a higher risk of new-born babies than a public health institution due to untrained health workers and a lack of hospital facilities. These hospitals belonged to backward states such as, Mizoram, Bihar, Tripura, Arunachal Pradesh and Odisha. On contrary Delhi is one of the state, where risk of neo-natal mortality is lower than that of other states in private institution. While considering public health institution, higher risk of neo-natal death found in north-eastern states like Tripura, Mizoram, and Nagaland etc. similarly, results were found in infant mortality, the hazard risks of infant death higher at home as compared to health institution. The difference in infant mortality risk between public and private health institutions varied by state.
3. Discussion
The present study provides evidence of disparity in neo-natal and infant mortality by place institutional delivery across India. The findings revealed that health facilities during delivery have statistically significant effect on neonatal and infant mortality. The new born baby at home had an increased risk of death during the neonatal period compared to those who gave birth in health facilities. Women who gave birth at home had a 1.3-fold increase in the risk of neonatal death compared to their counterparts. Previous research Ethiopia reported that most women had a strong aspiration to give birth at home considering it a natural space for delivery and allowing for traditional births related events to take place and thus making it more enjoyable. Even those who gave birth in health institutions appreciated events in connection to home delivery [25]. There are several factors affected the neo-natal and infant mortality. Maternal complications during delivery have been reported as a key factor in neonatal mortality in India [26]. Low mother age and lower female education ware one of leading cause of neo-natal and infant mortality in India. Similarly, baby with low birth weight were higher risk of death than those with a normal birth weight in the first month of life. When stratified by residence, institutional delivery appears to be consistently correlated with a decreased odd of neonatal mortality in both urban and rural areas, although the extent and substantial correlation have only been found in urban environments. In this study, rural dwellers experienced higher neonatal mortality than their urban counterparts. The possible reason may be related to a low level of maternal health service utilization amongst rural women compared with their urban counterpart [27]. Previous research has found that rural women are more readily influenced by traditional practices that are contrary to modern health care [25]. Among the various constituents of health care variables, ANC checks during delivery were found to have a significant impact on neonatal mortality and infant mortality in the states. Neonatal mortality was lowered by 32% among children whose mothers received ANC checks during pregnancy. Similarly, mortality risk of neo-born babies was higher when the birth delivered by casearation as compare to normal birth delivery.
The state wise difference of neonatal and infant mortality was remarkable. The neonatal mortality rate for central states was quite high compared to neonatal mortality rate in other states. On the other hand, the comparison of neonatal mortality rate for public and private hospital did not reveal much difference. This disparity might reflect differences in the quality of the public and private obstetric care available between states. Sikkim experienced the maximum in public institutional delivery coverage (85%), and minimum by Nagaland having 25% coverage. Similarly, minimum coverage in private institution were found Nagaland, Jammu and Kashmir and Odisha respectively. The growing number of studies found low coverage in birth in private institution mainly for high-cost delivery and unavailability services [15,28,29,30]. It was also main barrier among poor people in economic backward states. Kerala is the only state with almost 61% deliveries being conducted in private institutions. Due to this institutional coverage delivery, mainly for high immunizations and universal health care services, the state of Kerala is becoming an ideal model for the developing countries [8]. Similarly considering in mortality Kerala tops the rank due to its lowest neonatal mortality rate in the country because of its rigorous training programmes of healthcare workers and inherent superior healthcare infrastructure. Compare to other state like Madhya Pradesh and Uttar Pradesh 69% and 48% of the institutional deliveries were highest neonatal mortality and infant mortality. This indicates poor quality of care received by a new born after childbirth even at health centres. Home-delivered children in Chhattisgarh and Jharkhand were found to have high neonatal mortality rate due to lack of medical attention at home.
Another significant finding of the study was the identification of neo-natal and infant mortality in both public and private hospitals. Public hospitals have a higher mortality rate than private hospitals, but the risk of death in private hospitals is relatively higher. It is mainly due to the pregnancies resulting in complications from prolonged labour and prematurity are often referred to medical institutions. However, lack of well-equipped infrastructure to respond to crisis, non-availability of obstetric emergency care, lack of transportation facilities to deal with emergency cases add to the loss of lives in health private institutions [22]. On the contrary higher mortality in public hospitals due to high coverage birth in public institutions compared to private institution and another hand delay in decision to seek care, delay in reaching care and delay in receiving adequate health care for new babies by doctor. Sometime they do not properly visit in hospital; they are engaged with various private institutions for pecuniary benefits and hand over the duty to new untrained doctors and nurses. For these delays might result in reporting of institutional neonatal death. Previous studies found that delivering a public facility was not a protective factor against early neonatal mortality [31,32] and also found that delivering in a public hospital increased the odds of having a neonatal death [32]. However, the findings of present research suggest that delivering in public facility was protective against neonatal mortality even though it has been argued that limited access to emergency obstetric/neonatal care may be reasons for the lack of association between public facility delivery and higher neonatal survival in other settings [32].
The analysis presented in this paper has several limitations. First, the present study′s analysis did not assess the quality of emergency obstetric care, new-born care in facilities, or community-based new-born care training, all of which are important distal factors influencing neonatal outcome [17,33,34]. Furthermore, the study did not evaluate staffing and quality of facilities, which are of central importance for realizing the potential health benefits associated with institutional deliveries and understanding the often remarkably low utilization rates. Finally, neonatal deaths were slightly underrepresented in the study, because multiple births and new-born whose mothers have died were not included in the study.
4. Conclusions
The study emphasized that safe delivery is associated with lower risks of neonatal deaths, but increases in institution-based deliveries were not consistently associated with decreased neonatal mortality rates. Despite increase in delivery facilities, neonatal and infant mortality rates remain high in these settings. The findings of the study have significant implications for new policies aimed at health facilities in order to reduce mortality. Improving the quality and safety of institutional deliveries has the potential to increase the utilisation and health impact of perinatal health services, as well as improve the health status of newly born Indian babies.
Author Contributions
Conceptualization, U.D. and H.M.A.; Data curation, B.C.; Formal analysis, U.D., H.M.A. and B.C.; Funding acquisition, U.D.; Investigation, B.C.; Methodology, U.D. and B.C. All authors have read and agreed to the published version of the manuscript.
Funding
The authors received no specific funding for this work.
Data Availability Statement
Data used in this study for analysis is publicly available and can be obtained from: http://rchiips.org/NFHS/index.shtml.
Conflicts of Interest
The authors declare that they have no conflict of interest.
References
- Lawn, J.E.; Cousens, S.; Zupan, J. 4 Million neonatal deaths: When? Where? Why? Lancet 2005, 365, 891–900. [Google Scholar] [CrossRef]
- Lawn, J.E.; Cousens, S.; Bhutta, Z.A.; Darmstadt, G.L.; Martines, J.; Paul, V.; Knippenberg, R.; Fogstadt, H.; Shetty, P.; Horton, R. Why are 4 million newborn babies dying each year? Lancet 2004, 364, 399–401. [Google Scholar] [CrossRef]
- United Nations Population Division. Level and Trends in Child Mortality Report 2018. Department of Economic and Social Affairs. Available online: https://www.un.org/en/development/desa/population/publications/mortality/childmortality-report-2018.asp (accessed on 14 April 2020).
- UNICEF, World Health Organization. Immunzation Summary: A Statistical Reference Containing Data through 2009 (The 2011 Edition). Available online: http://www.childinfo.org/files/32775_UNICEF.pdf (accessed on 4 July 2014).
- National Health Profile Report, Central Bureau of Health Intelligence, Ministry of Health and Family Welfare. 2010, pp. 9–16. Available online: http://cbhidghs.nic.in/writereaddata/mainlinkfile/file1131.pdf (accessed on 15 May 2011).
- Registrar General of India. Compendium of the Vital Statistics, in India (1970–2007: Sample Registration System); RGI, Ministry of Home Affairs: New Delhi, India, 2009; pp. 1–212. [Google Scholar]
- Upadhyay, R.P.; Chinnakali, P.; Odukoya, O.; Yadav, K.; Sinha, S.; Rizwan, S.A.; Daral, S.; Chellaiyan, V.G.; Silan, V. High neonatal mortality rates in rural India: What options to explore? Int. Sch. Res. Not. 2012, 2012, 968921. [Google Scholar] [CrossRef] [PubMed] [Green Version]
- International Institute for Population Sciences (IIPS); ORCMacro International. India National Family Health Survey (NFHS 3), 2005–2006: India; IIPS: Mumbai, India, 2007; Volume 1, Available online: https://dhsprogram.com/pubs/pdf/frind3/frind3-vol1andvol2.pdf (accessed on 9 November 2018).
- International Institute for Population Sciences (IIPS); ICF. National Family Health Survey (NFHS-4), 2015–2016: India; IIPS: Mumbai, India, 2017; Available online: http://rchiips.org/NFHS/NFHS4Reports/India.pdf (accessed on 12 February 2018).
- ICMR Young Infant Study Group. Age profile of neonatal deaths. Indian Pediatr. 2008, 45, 991–994. [Google Scholar]
- Bang, A.T.; Paul, V.K.; Reddy, H.M.; Baitule, S.B. Why do neonates die in rural Gadchiroli, India? (Part I): Primary causes of death assigned by neonatologist based on prospectively observed records. J. Perinatol. 2005, 25, S29–S34. [Google Scholar] [CrossRef] [Green Version]
- Moyer, C.A.; Dako-Gyeke, P.; Adanu, R.M. Facility-based delivery and maternal and early neonatal mortality in sub-Saharan Africa: A regional review of the literature. Afr. J. Reprod. Health 2013, 17, 30–43. [Google Scholar]
- Pattinson, R.; Kerber, K.; Buchmann, E.; Friberg, I.K.; Belizan, M.; Lansky, S.; Weissman, E.; Mathai, M.; Rudan, I.; Walker, N.; et al. Stillbirths: How can health systems deliver for mothers and babies? Lancet 2011, 377, 1610–1623. [Google Scholar] [CrossRef] [Green Version]
- Kumar, V.; Mohanty, S.; Kumar, A.; Misra, R.P.; Santosham, M.; Awasthi, S.; Baqui, A.H.; Singh, P.; Singh, V.; Ahuja, R.C.; et al. Impact of community-based behavior change management on neonatal mortality: A cluster-randomized controlled trial in Shivgarh, Uttar Pradesh, India. Lancet 2008, 372, 1151–1162. [Google Scholar] [CrossRef]
- Goudar, S.S.; Goco, N.; Somannavar, M.S.; Vernekar, S.S.; Mallapur, A.A.; Moore, J.L.; Wallace, D.D.; Sloan, N.L.; Patel, A.; Hibberd, P.L.; et al. Goldenberg Institutional deliveries and perinatal and neonatal mortality in Southern and Central India. Reprod. Health 2015, 12, S13. [Google Scholar] [CrossRef] [Green Version]
- Fadel, S.A.; Ram, U.; Morris, S.K.; Begum, R.; Shet, A.; Jotkar, R.; Jha, P. Facility delivery, postnatal care and neonatal deaths in India: Nationally-representative case-control studies. PLoS ONE 2015, 10, e0140448. [Google Scholar] [CrossRef]
- Rammohan, A.; Iqbal, K.; Awofeso, N. Reducing neonatal mortality in India: Critical role of access to emergency obstetric care. PLoS ONE 2013, 8, e57244. [Google Scholar] [CrossRef]
- Lim, S.S.; Dandona, L.; Hoisington, J.A.; James, S.L.; Hogan, M.C.; Gakidou, E. India’s Janani Suraksha Yojana, a conditional cash transfer programme to increase births in health facilities: An impact evaluation. Lancet 2010, 375, 2009–2023. [Google Scholar] [CrossRef]
- Chaturvedi, S.; Randive, B.; Diwan, V.; De Costa, A. Quality of obstetric referral services in India’s JSY cash transfer programme for institutional births: A study from Madhya Pradesh province. PLoS ONE 2014, 9, e96773. [Google Scholar] [CrossRef] [PubMed]
- Rao, M.; Rao, D.K.; Kumar, A.K.S.; Chatterjee, M.; Sundararaman, T. Human resources for health in India. Lancet 2011, 377, 587–598. [Google Scholar] [CrossRef]
- Ministry of Health and Family Welfare. Bull Rural Health Statistics in India, RHS 2011. 2011. Available online: http://nrhm-mis.nic.in/UI/RHS/RHS%202011/RHS%202011%20Webpage.htm (accessed on 31 October 2012).
- Arokiasamy, P.; Gautam, A. Neonatal mortality in the empowered action group states of India: Trends and determinants. J. Biosoc. Sci. 2008, 40, 183. [Google Scholar] [CrossRef]
- Trianggono, W. Relationships between Institutional Delivery and Neonatal Mortality in Indonesia: A Secondary Data Analysis of the 2012 Indonesia Demographic and Health Survey. Master’s Thesis, University of North Carolina at Chapel Hill, Chapel Hill, NC, USA, 2019. [Google Scholar]
- Hatt, L.; Stanton, C.; Ronsmans, C.; Makowiecka, K.; Adisasmita, A. Did professional attendance at home births improve early neonatal survival in Indonesia? Health Policy Plan. 2009, 24, 270–278. [Google Scholar] [CrossRef] [Green Version]
- World Health Organization. The Global Action Report on Preterm. Available online: http://www.who.int/maternal_child_adolescent/documents/born_too_soon/en/ (accessed on 31 October 2012).
- Kumar, G.; Dandona, R.; Chaman, P.; Singh, P.; Dandona, L. A population-based study of neonatal mortality and maternal care utilization in the Indian state of Bihar. BMC Pregnancy Childb. 2014, 14. [Google Scholar] [CrossRef] [Green Version]
- Roro, E.M.; Sisay, M.M.; Sibley Lynn, M. Determinants of perinatal mortality among cohorts of pregnant women in three districts of North Showa zone, Oromia Region, Ethiopia: Community based nested case control study. BMC Public Health 2018, 18, 888. [Google Scholar] [CrossRef]
- Mori, R.; Fujimura, M.; Shiraishi, J.; Evans, B.; Corkett, M.; Negishi, H.; Doyle, P. Duration of inter-facility neonatal transport and neonatal mortality: Systematic review and cohort study. Pediatr. Int. 2007, 49, 452–458. [Google Scholar] [CrossRef]
- Tura, G.; Fantahun, M.; Worku, A. The effect of health facility delivery on neonatal mortality: Systematic review and meta-analysis. BMC Pregnancy Childb. 2013, 13, 18. [Google Scholar] [CrossRef] [Green Version]
- Altman, R.; Sidney, K.; De Costa, A.; Vora, K.; Salazar, M. Is institutional delivery protective against neonatal mortality among poor or tribal women? A cohort study from Gujarat, India. Matern. Child Health J. 2017, 21, 1065–1072. [Google Scholar]
- Fink, G.; Ross, R.; Hill, K. Institutional deliveries weakly associated with improved neonatal survival in developing countries: Evidence from 192 demographic and health surveys. Int. J. Epidemiol. 2015, 44, 1879–1888. [Google Scholar] [CrossRef] [PubMed]
- Titaley, C.R.; Dibley, M.J.; Roberts, C.L. Type of delivery attendant, place of delivery and risk of early neonatal mortality: Analyses of the 1994–2007 Indonesia demographic and health surveys. Health Policy Plan. 2012, 27, 405–416. [Google Scholar] [CrossRef] [PubMed] [Green Version]
- Bhandari, N.; Mazumder, S.; Taneja, S.; Sommerfelt, H.; Strand, T.A. Effect of implementation of Integrated Management of Neonatal and Childhood Illness (IMNCI) programme on neonatal and infant mortality: Cluster randomised controlled trial. BMJ 2012, 344, e1634. [Google Scholar] [CrossRef] [PubMed] [Green Version]
- Bhutta, Z.A.; Das, J.K.; Bahl, R.; Lawn, J.E.; Salam, R.A.; Paul, V.K.; Sankar, M.J.; Blencowe, H.; Rizvi, A.; Chou, V.B.; et al. Can available interventions end preventable deaths in mothers, newborn babies, and stillbirths, and at what cost? Lancet 2014, 384, 347–370. [Google Scholar] [CrossRef]
Figure 1.
Place of Birth and Neo-natal Mortality by Mother′s Education. Source: National Family Health Survey-IV (2015–2016).
Figure 1.
Place of Birth and Neo-natal Mortality by Mother′s Education. Source: National Family Health Survey-IV (2015–2016).

Figure 2.
Place of Birth and Neo-natal Mortality by Place of Residence. Source: National Family Health Survey-IV (2015–2016).
Figure 2.
Place of Birth and Neo-natal Mortality by Place of Residence. Source: National Family Health Survey-IV (2015–2016).


Table 1.
Number of live births (%) and neo-natal and infant mortality rate (per 1000 live births) in India and states by place of delivery, 2015–2016.
Table 1.
Number of live births (%) and neo-natal and infant mortality rate (per 1000 live births) in India and states by place of delivery, 2015–2016.
| States | Live Births | Neo-Natal Mortality Rate | Infant Mortality Rate | ||||||
|---|---|---|---|---|---|---|---|---|---|
| At Home | Public Hospital | Private Hospital | At Home | Public Hospital | Private Hospital | Home | Public Hospital | Private Hospital | |
| India | 63742 (24.52) | 141028 (54.5) | 54338 (20.9) | 39 | 27 | 26 | 54 | 38 | 33 |
| Andhra Pradesh | 274 (8.78) | 1178 (37.73) | 1670 (53.49) | 45 | 21 | 19 | 54 | 38 | 25 |
| Arunachal Pradesh | 2447 (49.5) | 2121(42.91) | 375 (7.59) | 9 | 10 | 16 | 24 | 18 | 21 |
| Assam | 3056 (29.7) | 6253 (60.78) | 979 (9.52) | 41 | 31 | 14 | 63 | 42 | 26 |
| Bihar | 8560 (33.74) | 12612 (49.7) | 4200 (16.55) | 39 | 30 | 48 | 53 | 41 | 56 |
| Chhattisgarh | 2786 (30.05) | 5212 (56.22) | 1272 (13.72) | 52 | 35 | 45 | 71 | 45 | 50 |
| Goa | 11 (2.64) | 248 (59.62) | 157 (37.74) | 0 | 13 | 15 | 0 | 13 | 15 |
| Gujarat | 1040 (13.51) | 2695 (35.02) | 3961 (51.47) | 21 | 25 | 26 | 28 | 29 | 33 |
| Haryana | 1553 (19.73) | 4128 (52.44) | 2191 (27.83) | 26 | 21 | 20 | 44 | 30 | 29 |
| Himachal Pradesh | 712 (24.43) | 1773 (60.82) | 430 (14.75) | 25 | 22 | 30 | 39 | 30 | 38 |
| Jammu and Kashmir | 1399 (17.04) | 6320 (76.98) | 491 (5.98) | 25 | 23 | 15 | 32 | 34 | 18 |
| Jharkhand | 4584 (37.68) | 5263 (43.26) | 2319 (19.06) | 41 | 27 | 29 | 55 | 36 | 39 |
| Karnataka | 462 (5.96) | 4946 (63.81) | 2343 (30.23) | 15 | 19 | 15 | 23 | 28 | 21 |
| Kerala | 3 (0.12) | 960 (39.02) | 1497 (60.85) | 0 | 5 | 3 | 0 | 7 | 3 |
| Madhya Pradesh | 4998 (20.37) | 16929 (68.99) | 2612 (10.64) | 47 | 33 | 35 | 65 | 46 | 43 |
| Maharashtra | 1012 (10.78) | 4752 (50.6) | 3627 (38.62) | 10 | 18 | 15 | 27 | 26 | 19 |
| Manipur | 2000 (35.59) | 2450 (43.6) | 1169 (20.8) | 17 | 15 | 15 | 25 | 21 | 18 |
| Meghalaya | 2064 (47.02) | 1827 (41.62) | 499 (11.37) | 23 | 16 | 10 | 36 | 26 | 17 |
| Mizoram | 1179 (24.13) | 3283 (67.19) | 424 (8.68) | 13 | 8 | 18 | 49 | 33 | 40 |
| Nagaland | 3139 (68.28) | 1174 (25.54) | 284 (6.18) | 15 | 18 | 13 | 32 | 28 | 13 |
| Delhi | 207 (13.13) | 929 (58.95) | 440 (27.92) | 32 | 16 | 8 | 69 | 27 | 9 |
| Odisha | 1669 (15.11) | 8389 (75.96) | 986 (8.93) | 40 | 26 | 18 | 57 | 37 | 21 |
| Punjab | 441 (8.46) | 2845 (54.55) | 1929 (36.99) | 29 | 20 | 22 | 38 | 30 | 28 |
| Rajasthan | 2666 (15.87) | 10843 (64.55) | 3289 (19.58) | 27 | 30 | 32 | 42 | 41 | 41 |
| Sikkim | 52 (5.17) | 853 (84.88) | 100 (9.95) | 17 | 20 | 18 | 56 | 28 | 19 |
| Tamil Nadu | 80 (1.01) | 5318 (67.21) | 2515 (31.78) | 33 | 16 | 9 | 53 | 23 | 11 |
| Tripura | 293 (22.05) | 900 (67.72) | 136 (10.23) | 13 | 14 | 6 | 37 | 26 | 17 |
| Uttar Pradesh | 13269 (31.9) | 18215 (43.79) | 10113 (24.31) | 47 | 40 | 52 | 67 | 58 | 67 |
| Uttarakhand | 1860 (32.05) | 2714 (46.77) | 1229 (21.18) | 40 | 23 | 17 | 51 | 37 | 28 |
| West Bengal | 1295 (24.45) | 3109 (58.7) | 892 (16.84) | 35 | 20 | 8 | 39 | 27 | 12 |
| Telangana | 224 (9.31) | 794 (33.01) | 1387 (57.67) | 32 | 21 | 13 | 32 | 34 | 20 |
Number given in parenthesis indicates the percentage of births. Number of births and infant deaths are based on unweighted sample, Source: Authors’ calculation from NFHS data.
Table 2.
Bio-demographic and Socio-economic factor affected neo-natal and infant mortality rate in place of delivery in India, 2015–2016.
Table 2.
Bio-demographic and Socio-economic factor affected neo-natal and infant mortality rate in place of delivery in India, 2015–2016.
| Variables | Neo-Natal Mortality Rate | Infant Mortality Rate | ||||
|---|---|---|---|---|---|---|
| Mother Age at Birth | At Home | Public Hospital | Private Hospital | At Home | Public Hospital | Private Hospital |
| 15–19 | 71 | 35 | 48 | 91 | 54 | 57 |
| 20–24 | 47 | 28 | 29 | 62 | 40 | 37 |
| 25–29 | 32 | 25 | 22 | 47 | 34 | 29 |
| 30+ | 36 | 25 | 23 | 53 | 37 | 32 |
| Birth interval | ||||||
| Less than 24 months | 51 | 34 | 42 | 74 | 51 | 53 |
| More than 24 months | 34 | 25 | 23 | 58 | 35 | 30 |
| Birth order | ||||||
| 1 | 54 | 31 | 24 | 71 | 41 | 30 |
| 2 | 30 | 21 | 20 | 40 | 31 | 26 |
| 3+ | 36 | 27 | 40 | 55 | 41 | 53 |
| Sex of the child | ||||||
| Male | 44 | 30 | 28 | 58 | 41 | 35 |
| Female | 33 | 23 | 22 | 49 | 34 | 31 |
| Mother education | ||||||
| No education | 38 | 32 | 29 | 56 | 46 | 66 |
| Primary | 43 | 30 | 31 | 56 | 43 | 49 |
| Secondary | 37 | 24 | 22 | 51 | 33 | 29 |
| Higher education | 20 | 20 | 13 | 32 | 26 | 17 |
| Place of residence | ||||||
| Urban | 45 | 25 | 24 | 58 | 39 | 37 |
| Rural | 84 | 36 | 37 | 68 | 29 | 25 |
| Wealth Status | ||||||
| Poorest | 40 | 33 | 51 | 56 | 46 | 64 |
| Middle | 42 | 24 | 29 | 54 | 35 | 38 |
| Richest | 28 | 18 | 16 | 44 | 25 | 21 |
| Caste | ||||||
| SC | 42 | 28 | 37 | 57 | 40 | 45 |
| ST | 35 | 28 | 27 | 52 | 39 | 35 |
| OBC | 39 | 27 | 27 | 56 | 38 | 35 |
| others | 34 | 24 | 19 | 46 | 34 | 24 |
| Religions | ||||||
| Hindu | 41 | 27 | 27 | 56 | 38 | 34 |
| Muslim | 33 | 26 | 22 | 50 | 39 | 28 |
| Christian | 23 | 18 | 6 | 37 | 30 | 10 |
| Mass media | ||||||
| No | 40 | 34 | 50 | 57 | 47 | 63 |
| At least one | 35 | 23 | 20 | 50 | 33 | 27 |
| Mothers received antenatal care | ||||||
| No | 29 | 27 | 35 | 42 | 39 | 46 |
| At least four | 25 | 17 | 23 | 37 | 26 | 30 |
| Assistant by Nurse | 26 | 28 | 37 | 36 | ||
| Assistant by Doctor | 25 | 23 | 35 | 29 | ||
| Casearation birth | ||||||
| No | 26 | 29 | 37 | 37 | ||
| Yes | 31 | 21 | 41 | 27 | ||
Source: Authors calculation from NFHS-IV (2015–2016) data.
Table 3.
Hazard ratios (95% confidence intervals) for neo-natal mortality by socio-economic, demographic and residence related characteristics, India, 2015–2016.
Table 3.
Hazard ratios (95% confidence intervals) for neo-natal mortality by socio-economic, demographic and residence related characteristics, India, 2015–2016.
| Model 1 | Model 2 | Model 3 | |
|---|---|---|---|
| Place of Delivery | |||
| At Home | 1.26 *** (1.192–1.339) | ||
| Public Hospital | 0.84 *** (0.762–0.917) | 0.86 ** (0.767–0.967) | |
| Private Hospital | 0.96 (0.858–1.072) | 1.24 *** (1.082–1.430) | |
| Mother Age At Birth | |||
| 15–19® | |||
| 20–24 | 0.75 *** (0.660–0.849) | 0.62 *** (0.528–0.726) | |
| 25–29 | 0.64 *** (0.558–0.723) | 0.49 *** (0.419–0.586) | |
| 30+ | 0.68 *** (0.596–0.785) | 0.59 *** (0.494–0.704) | |
| Birth Interval | |||
| Less than 24 months® | |||
| More than 24 months | 0.55 *** (0.516–0.586) | 0.68 *** (0.620–0.743) | |
| Birth Order | |||
| 1® | |||
| 2 | 0.58 *** (0.543–0.623) | 0.64 *** (0.578–0.707) | |
| 3+ | 0.70 *** (0.649–0.755) | 0.88 ** (0.781- 0.976) | |
| Child birth weight | |||
| Low < 2.5 kg ® | |||
| High > 2.5 kg | 1.88 (2.082–4.006) | 1.81 (1.951–4.053) | |
| Mother BMI | |||
| Underweight® | |||
| Normal | 1.09 *** (1.035–1.159) | 1.23 *** (1.130–1.337) | |
| Obesity | 1.26 *** (1.160–1.379) | 1.44 *** (1.277–1.636) | |
| Sex of the Child | |||
| Male® | |||
| Female | 1.02 ** (0.90–1.262) | 1.23 * (1.102–1.962) | |
| Mother Education | |||
| No education® | |||
| Primary | 1.02 (0.953–1.097) | 1.02 (0.928–1.139) | |
| Secondary | 0.83 *** (0.784–0.888) | 0.82 *** (0.744–0.896) | |
| Higher education | 0.65 *** (0.577–0.734) | 0.68 *** (0.573–0.806) | |
| Place of Residence | |||
| Urban® | |||
| Rural | 0.85 ** (0.720–1.01) | 0.82 ** (0.560–1.24) | |
| Wealth Status | |||
| Poorest® | |||
| Middle | 0.78 *** (0.735–0.839) | 0.81 *** (0.732–0.893) | |
| Richest | 0.59 *** (0.550–0.638) | 0.57 *** (0.508–0.638) | |
| Caste | |||
| SC® | |||
| ST | 0.83 *** (0.768–0.901) | 0.76 *** (0.678–0.854) | |
| OBC | 0.92 *** (0.857–0.971) | 0.82 *** (0.753–0.899) | |
| Others | 0.84 *** (0.772–0.908) | 0.80 *** (0.716–0.901) | |
| Religions | |||
| Hindu® | |||
| Muslim | 0.99 (0.931–1.073) | 1.05 (0.948–1.164) | |
| Christian | 0.49 *** (0.432–0.561) | 0.54 *** (0.454–0.654) | |
| Mass Media | |||
| No® | |||
| At least one | 0.94 (0.870–1.029) | ||
| Mothers Received Antenatal care | |||
| No® | |||
| At least four | 0.78 *** (0.733–0.844) | 0.85 *** (0.781–0.931) | |
| More than 4 | 0.53 *** (0.485–0.576) | 0.68 *** (0.607–0.756) | |
| Assistant by Nurse | 1.01 (0.943–1.087) | 1.05 (0.965–1.147) | |
| Assistant by Doctor | 0.91 *** (0.846–0.976) | 1.03 (0.949–1.127) | |
| Casearation Birth | |||
| No® | |||
| Yes | 1.01 (0.919–1.102) | 1.11* (0.994–1.242) |
® Reference category. Adjusted hazard ratios is obtained from cox proportional hazard regression analysis. *** p < 0.01, ** p < 0.05, * p < 0.10. Source: Authors’ calculation from NFHS-IV (2015–2016) data.
Table 4.
Hazard ratios (95% confidence intervals) for infant mortality by socio-economic, demographic and residence related characteristics, India, 2015–2016.
Table 4.
Hazard ratios (95% confidence intervals) for infant mortality by socio-economic, demographic and residence related characteristics, India, 2015–2016.
| Model 1 | Model 2 | Model 3 | |
|---|---|---|---|
| Place of Delivery | |||
| At Home | 1.17 *** (1.073–1.281) | ||
| Public Hospital | 0.85 * (0.717–1.002) | 0.98 (0.827–1.181) | |
| Private Hospital | 0.80 ** (0.652–0.992) | 1.09 (0.872–1.374) | |
| Mother Age At Birth | |||
| 15–19® | |||
| 20–24 | 0.61 *** (0.488–0.757) | 0.48 *** (0.361- 0.624) | |
| 25–29 | 0.52 *** (0.414–0.649) | 0.38 *** (0.282–0.498) | |
| 30+ | 0.56 *** (0.439–0.701) | 0.42 *** (0.309–0.559) | |
| Birth Interval | |||
| Less than 24 months® | |||
| More than 24 months | 0.57 *** (0.516–0.622) | 0.69 *** (0.606–0.788) | |
| Birth Order | |||
| 1® | |||
| 2 | 0.82 *** (0.731–0.917) | 0.95 (0.799–1.121) | |
| 3+ | 1.16 ** (1.032–1.314) | 1.57 * (1.309−1.879) | |
| Child birth weight | |||
| Low < 2.5 kg. ® | |||
| High > 2.5 kg. | 1.26 ** (1.32–2.10) | 1.16 * (1.10–1.569) | |
| Mother BMI | |||
| Underweight® | |||
| Normal | 1.02 (.936–1.119) | 0.98 (0.862–1.109) | |
| Obesity | 1.11 * (0.966–1.277) | 1.07 (0.884–1.300) | |
| Sex of the Child | |||
| Male® | |||
| Female | 1.04 (0.965–1.122) | 1.17 *** (1.055–1.302) | |
| Mother Education | |||
| No education® | |||
| Primary | 0.92 (0.819–1.021) | 0.77 *** (0.657–0.912) | |
| Secondary | 0.73 *** (0.663–0.810) | 0.72 *** (0.619–0.826) | |
| Higher education | 0.49 *** (0.390–0.604) | 0.50 *** (0.370–0.671) | |
| Place of Residence | |||
| Urban® | |||
| Rural | 0.95 ** (0.89–1.02) | 0.86 ** (0.59–2.250) | |
| Wealth Status | |||
| Poorest® | |||
| Middle | 0.96 (0.868–1.068) | 1.01 (0.866–1.176) | |
| Richest | 0.79 *** (0.702–0.888) | 0.83 ** (0.696–0.989) | |
| Caste | |||
| SC® | |||
| ST | 0.98 (0.866–1.117) | 1.02 (0.857–1.230) | |
| OBC | 0.96 (0.866–1.067) | 0.97 (0.843–1.135) | |
| Others | 0.94 (0.824,1.080) | 1.05 (0.878–1.276) | |
| Religions | |||
| Hindu® | |||
| Muslim | 0.98 (0.874–1.103) | 0.97 (0.826–1.149) | |
| Christian | 1.34 *** (1.156–1.554) | 1.40 *** (1.147–1.732) | |
| Mass Media | |||
| No® | |||
| At least one | 1.04 (0.915–1.190) | ||
| Mothers Received Antenatal care | |||
| No® | |||
| At least four | 0.81 *** (0.715–0.906) | 0.91 * (0.793–1.035) | |
| More than 4 | 0.54 *** (0.458–0.628) | 0.66 *** (0.553–0.782) | |
| Assistant by Nurse | 0.92 (0.806–1.054) | 0.92 (0.795–1.054) | |
| Assistant by Doctor | 0.75 *** (0.656–0.858) | 0.81 *** (0.701–0.925) | |
| Casearation Birth | |||
| No® | |||
| Yes | 1.01 (0.837–1.197) | 1.17 * (0.966–1.416) |
® Reference category. Adjusted hazard ratios is obtained from cox proportional hazard regression analysis. *** p < 0.01, ** p < 0.05, * p < 0.10. Source: Authors’ calculation from NFHS-IV (2015–2016) data.
Table 5.
Hazard ratios and 95% confidence interval of place of delivery on neonatal and infant mortality in states of India, 2015–2016.
Table 5.
Hazard ratios and 95% confidence interval of place of delivery on neonatal and infant mortality in states of India, 2015–2016.
| States | Neo-natal Mortality Rate | Infant Mortality Rate | ||||
|---|---|---|---|---|---|---|
| At Home | Public Hospital | Private Hospital | At Home | Public Hospital | Private Hospital | |
| Andhra Pradesh | 1.40 (0.40, 4.88) | 0.59 (0.16, 0.84) | 0.84 (0.21, 3.31) | 1.37 (0.43, 3.55) | 0.73 (0.22, 2.34) | 0.73 (0.21, 2.50) |
| Arunachal Pradesh | 1.55 (0.31, 7.59) | 1.07 (0.20, 5.73) | 2.54 (0.25, 25.71) | 1.08 (0.33, 3.55) | 0.94 (0.28, 3.12) | 1.38 (0.25, 7.49) |
| Assam | 1.48 * (0.81, 2.71) | 0.64 (0.31, 1.30) | 0.52 (0.18, 1.43) | 1.71 ** (1.01, 2.88) | 0.57 ** (0.33, 0.96) | 0.46 * (0.20, 1.05) |
| Bihar | 0.85 ** (0.62, 1.17) | 0.98 * (0.70, 1.36) | 2.05 *** (1.40, 3.02) | 0.96 * (0.73, 1.27) | 0.87 ** (0.65, 1.16) | 1.69 *** (1.20, 2.37) |
| Chhattisgarh | 1.25 (0.76, 2.05) | 0.71 * (0.43, 1.17) | 1.42 (0.72, 2.78) | 1.36 * (0.87, 2.11) | 0.69 * (0.43, 1.07) | 1.00 (0.53, 1.86) |
| Gujarat | 1.34 (0.62, 2.85) | 0.70 (0.31, 1.54) | 0.58 (0.25, 1.33) | 0.81 (0.41, 1.60) | 1.01 (0.50, 2.06) | 1.09 (0.52, 2.25) |
| Haryana | 0.99 (0.46, 2.13) | 1.02 (0.46, 2.25) | 1.06 (0.43, 2.61) | 1.05 (0.55, 1.98) | 0.91 (0.47, 1.74) | 1.09 (0.52, 2.27) |
| Himachal Pradesh | 0.71 (0.21, 2.32) | 1.07 (0.30, 3.84) | 0.31 (0.04, 2.19) | 0.67 (0.23, 1.89) | 1.35 (0.46, 3.97) | 0.34 (0.05, 2.11) |
| Jammu and Kashmir | 1.83 * (0.81, 4.12) | 0.43 ** (0.16, 1.12) | 1.11 (0.28, 4.33) | 1.27 (0.64, 2.51) | 0.79 (0.39, 1.56) | 0.77 (0.27, 2.19) |
| Jharkhand | 1.29 (0.72, 2.31) | 0.89 (0.48, 1.66) | 0.86 (0.39, 1.88) | 1.24 (0.75, 2.02) | 0.71 * (0.42, 1.17) | 1.14 (0.62, 2.10) |
| Karnataka | 0.63 (0.18, 2.15) | 2.17 (0.49, 9.45) | 2.28 (0.48, 10.81) | 0.83 (0.33, 2.03) | 1.18 (0.47, 2.91) | 1.51 (0.56, 4.01) |
| Madhya Pradesh | 1.58 *** (1.12, 2.23) | 0.61 *** (0.42, 0.87) | 0.78 (0.46, 1.32) | 1.49 *** (1.11, 1.99) | 0.65 *** (0.48, 0.87) | 0.83 (0.53, 1.27) |
| Maharashtra | 0.91 (0.39, 2.08) | 1.09 (0.46, 2.54) | 1.18 (0.46, 2.98) | 0.89 (0.44, 1.77) | 1.09 (0.54, 2.19) | 1.23 (0.57, 2.65) |
| Manipur | 1.09 *** (0.24, 4.89) | 1.14 ** (0.19, 6.72) | 1.35 * (0.21, 8.24) | 1.04 ** (0.26, 4.15) | 0.98 (0.23, 3.99) | 0.99 ** (0.22, 4.44) |
| Meghalaya | 2.13 (0.47, 9.65) | 0.34 (0.05, 0.67) | 0.68 (0.08, 5.57) | 1.15 (0.40, 3.26) | 0.93 (0.31, 2.74) | 1.00 (0.25, 3.98) |
| Mizoram | 0.38 (0.06, 2.09) | 2.84 (0.47, 17.02) | 3.35 (0.35, 31.65) | 0.89 (0.40, 1.98) | 1.13 (0.50, 2.55) | 1.16 (0.39, 3.46) |
| Nagaland | 0.74 * (0.21, 2.53) | 1.28 (0.36, 4.58) | 0.83 * (0.11, 6.14) | 1.39 * (0.55, 3.48) | 0.74 * (0.29, 1.87) | 0.49 * (0.10, 2.31) |
| Delhi | 14.42 ** (1.64, 126.45) | 0.062 ** (0.006, 0.60) | 0.08 ** (0.006, 0.99) | 19.69 *** (3.75, 103.28) | 0.05 *** (0.009, 0.27) | 0.04 *** (0.005, 0.31) |
| Odisha | 1.10 (0.62, 1.96) | 0.93 (0.51, 1.70) | 1.61 (0.66, 3.92) | 1.13 (0.69, 1.84) | 0.87 (0.52, 1.41) | 1.14 (0.53, 2.45) |
| Punjab | 0.46 * (0.14, 1.48) | 2.01 (0.61, 6.55) | 2.49 * (0.71, 8.66) | 0.57 ** (0.22, 1.51) | 1.64 ** (0.62, 4.33) | 2.04 *** (0.73, 5.72) |
| Rajasthan | 1.26 (0.74, 2.12) | 0.81 (0.47, 1.39) | 0.82 (0.44, 1.51) | 1.11 (0.72, 1.72) | 0.90 (0.58, 1.39) | 0.96 (0.57, 1.60) |
| Sikkim | 0.78 (0.10, 5.68) | 1.32 (0.18, 9.52) | 2.57 (0.40, 16.50) | 0.38 (0.05, 2.49) | 0.53 (0.04, 6.76) | |
| Tamil Nadu | 1.81 (0.21, 15.03) | 0.52 ** (0.05, 4.55) | 0.31 *** (0.03, 2.97) | 3.08 (0.65, 14.40) | 0.34 ** (0.07, 1.62) | 0.21 * (0.04, 1.04) |
| Tripura | 0.03 ** (0.001, 0.72) | 54.06 * (0.49, 592.0) | 136.05 ** (0.61, 3046.3) | 0.17 (0.01, 1.58) | 5.23 * (0.56, 48.94) | 10.95 * (0.74, 161.7) |
| Uttar Pradesh | 0.91 (0.71, 1.14) | 0.93 *** (0.72, 1.18) | 1.63 *** (1.24, 2.16) | 0.92 (0.74, 1.12) | 0.97 (0.78, 1.20) | 1.5 *** (1.18, 1.89) |
| Uttarakhand | 1.26 (0.61, 2.61) | 0.75 (0.34, 1.61) | 0.90 (0.36, 2.22) | 1.18 (0.63, 2.20) | 0.87 (0.46, 1.65) | 0.83 (0.37, 1.85) |
| West Bengal | 0.91 (0.35, 2.34) | 0.92 *** (0.31, 2.72) | 0.63 (0.11, 3.40) | 0.94 (0.40, 2.20) | 0.93 *** (0.39, 2.20) | 0.59 (0.15, 2.24) |
| Telangana | 1.56 (0.34, 7.10) | 0.77 (0.16, 3.66) | 0.47 (0.08, 2.59) | 0.77 (0.22, 2.67) | 1.52 (0.42, 5.42) | 1.00 (0.25, 3.99) |
* Adjusted hazard ratios estimates are controlled for mother age, birth order, birth interval, size at birth of the child, mother’s education, BMI of the mother, place of residence, caste, religion, wealth quintile, assistant by doctor and nurse. *** p < 0.01, ** p < 0.05, * p< 0.10. Source: Authors’ calculation from NFHS-IV (2015–2016) data.
Publisher’s Note: MDPI stays neutral with regard to jurisdictional claims in published maps and institutional affiliations. |
© 2021 by the authors. Licensee MDPI, Basel, Switzerland. This article is an open access article distributed under the terms and conditions of the Creative Commons Attribution (CC BY) license (https://creativecommons.org/licenses/by/4.0/).
Share and Cite
MDPI and ACS Style
Das, U.; Chaplot, B.; Azamathulla, H.M. The Role of Place of Delivery in Preventing Neonatal and Infant Mortality Rate in India. Geographies 2021, 1, 47-62. https://0-doi-org.brum.beds.ac.uk/10.3390/geographies1010004
AMA Style
Das U, Chaplot B, Azamathulla HM. The Role of Place of Delivery in Preventing Neonatal and Infant Mortality Rate in India. Geographies. 2021; 1(1):47-62. https://0-doi-org.brum.beds.ac.uk/10.3390/geographies1010004
Chicago/Turabian StyleDas, Ujjwal, Barkha Chaplot, and Hazi Mohammad Azamathulla. 2021. "The Role of Place of Delivery in Preventing Neonatal and Infant Mortality Rate in India" Geographies 1, no. 1: 47-62. https://0-doi-org.brum.beds.ac.uk/10.3390/geographies1010004