1. Introduction
Landslide inventory is the first and essential stage for understanding landslides [
1,
2] and their effect on the evolution of landforms [
3,
4,
5,
6,
7], as well as the valuable form of landslide study representation [
8,
9].
A landslide inventory map is an important source of information, including landslides typology [
10], a geographic location of every landslide, its morphological forms, scarps, zones of erosion, and accumulation [
1,
11,
12,
13], information on the landslide mobility, geological age, the velocity of mass motion, depth and materials involved in sliding can be used for various purposes [
7,
14,
15].
Landslide inventories can be used in the following ways: (I) to denote historical landslides [
16,
17,
18,
19], which is essential for landslide hazard and risk assessment studies [
20,
21,
22], (II) To predict the spatial and temporal distribution of future landslides in regions with different morphological and geological characteristics, varying from local to national scales for adequate mitigation measures [
23,
24,
25,
26].
Moreover, there are numerous approaches to compile a landslide inventory map grouped into two broad categories, including (I) traditional and (II) innovative methods [
22,
27,
28]. The traditional methods contain geomorphological field investigations and interpretations of aerial stereoscopic images as desk research. The rapid evolution of remote sensing technologies, the accuracy of satellite images, GIS applications have significantly expanded the capacity of landslide investigations remotely and enhanced the precision of landslide mapping; these approaches are considered as innovative methods [
7,
27,
28,
29].
According to Curden and Varnes [
30], landslides are the movements of large amounts of rock, debris, or earth materials, which can move down a slope under the effect of gravity; this occurs in the following ways: rockfalls, debris flows, flash floods, rock avalanches and so on [
6,
31]. Landslides move down a slope following different failure mechanisms such as flows, lateral spreads, slides, topples, falls, slope deformations, or have a complex combination of multiple types of movement [
30,
32].
Landslides are a widespread phenomenon in the Hissar–Allay region, central Tajikistan. Landslides cause significant damage to the economy and the area’s infrastructure; moreover, based on the Committee on Emergency Situations data, landslides led to 1000 fatalities from 1996 to 2018. In the Hissar–Allay region, the first research on slope stability and landslide identification was implemented to further explore and sustain development in 1964. The study has summarised outcomes of a 3-year field survey on debris flow and deep-seated landslide investigations initiated by the Department of Geology under the Council of Ministers of the Tajik SSR [
33]. Since then, from 1964 to 1988, in the Hissar–Allay region, numerous comprehensive investigations were ordered by the Department of Geology related to landslides and their inventory. The main limitations of all those studies are in an inability to use their outcomes for regional land use management and mitigation planning. Because previous studies were performed at local scales, and described individual watersheds and river basins by using different techniques and approaches, it is difficult to compare even among themself. Kayumov and Novikov [
34] concluded that landslides registered last decades, showing a general trend to increase in the Hissar–Allay. Yet, there is no regional-scale landslide inventory map, which is a necessary element of landslide zoning and land-use planning [
9].
We perceived of filling the gap in the study area by compiling a regional-scale landslide inventory map useful for regional planning and setting priorities for future landslide hazard and risk assessmen ts. In this study, we inventoried landslides along the national highway corridor in the Hissar–Allay region of central Tajikistan. For this purpose, we had a reconnaissance survey conducted during November 2019 and a data collection of previous studies on landslides from the Main Department of Geology of Tajikistan. Moreover, we utilised remote sensing approaches, such as a digital elevation model (DEM) analysis, derived from ALOS-PALSAR images (12.5 m grid cell size), the medium-resolution (10 m grid cell size) optical Sentinel-2 images, and high-resolution images from the Google Earth, essential to delineate those landslides skipped during field survey. The conducted research, herein presented, focuses on the following purposes: (Ι) defining the location, type, spatial distribution, and geometry properties of landslides along the highway corridor in the Hissar–Allay mountain ranges, (II) showing landslides spreading respect to the morphological and geological settings of the study region, (III) defining frequency-area statistics of slope failures and statistical index of denoted landslides.
2. Study Area
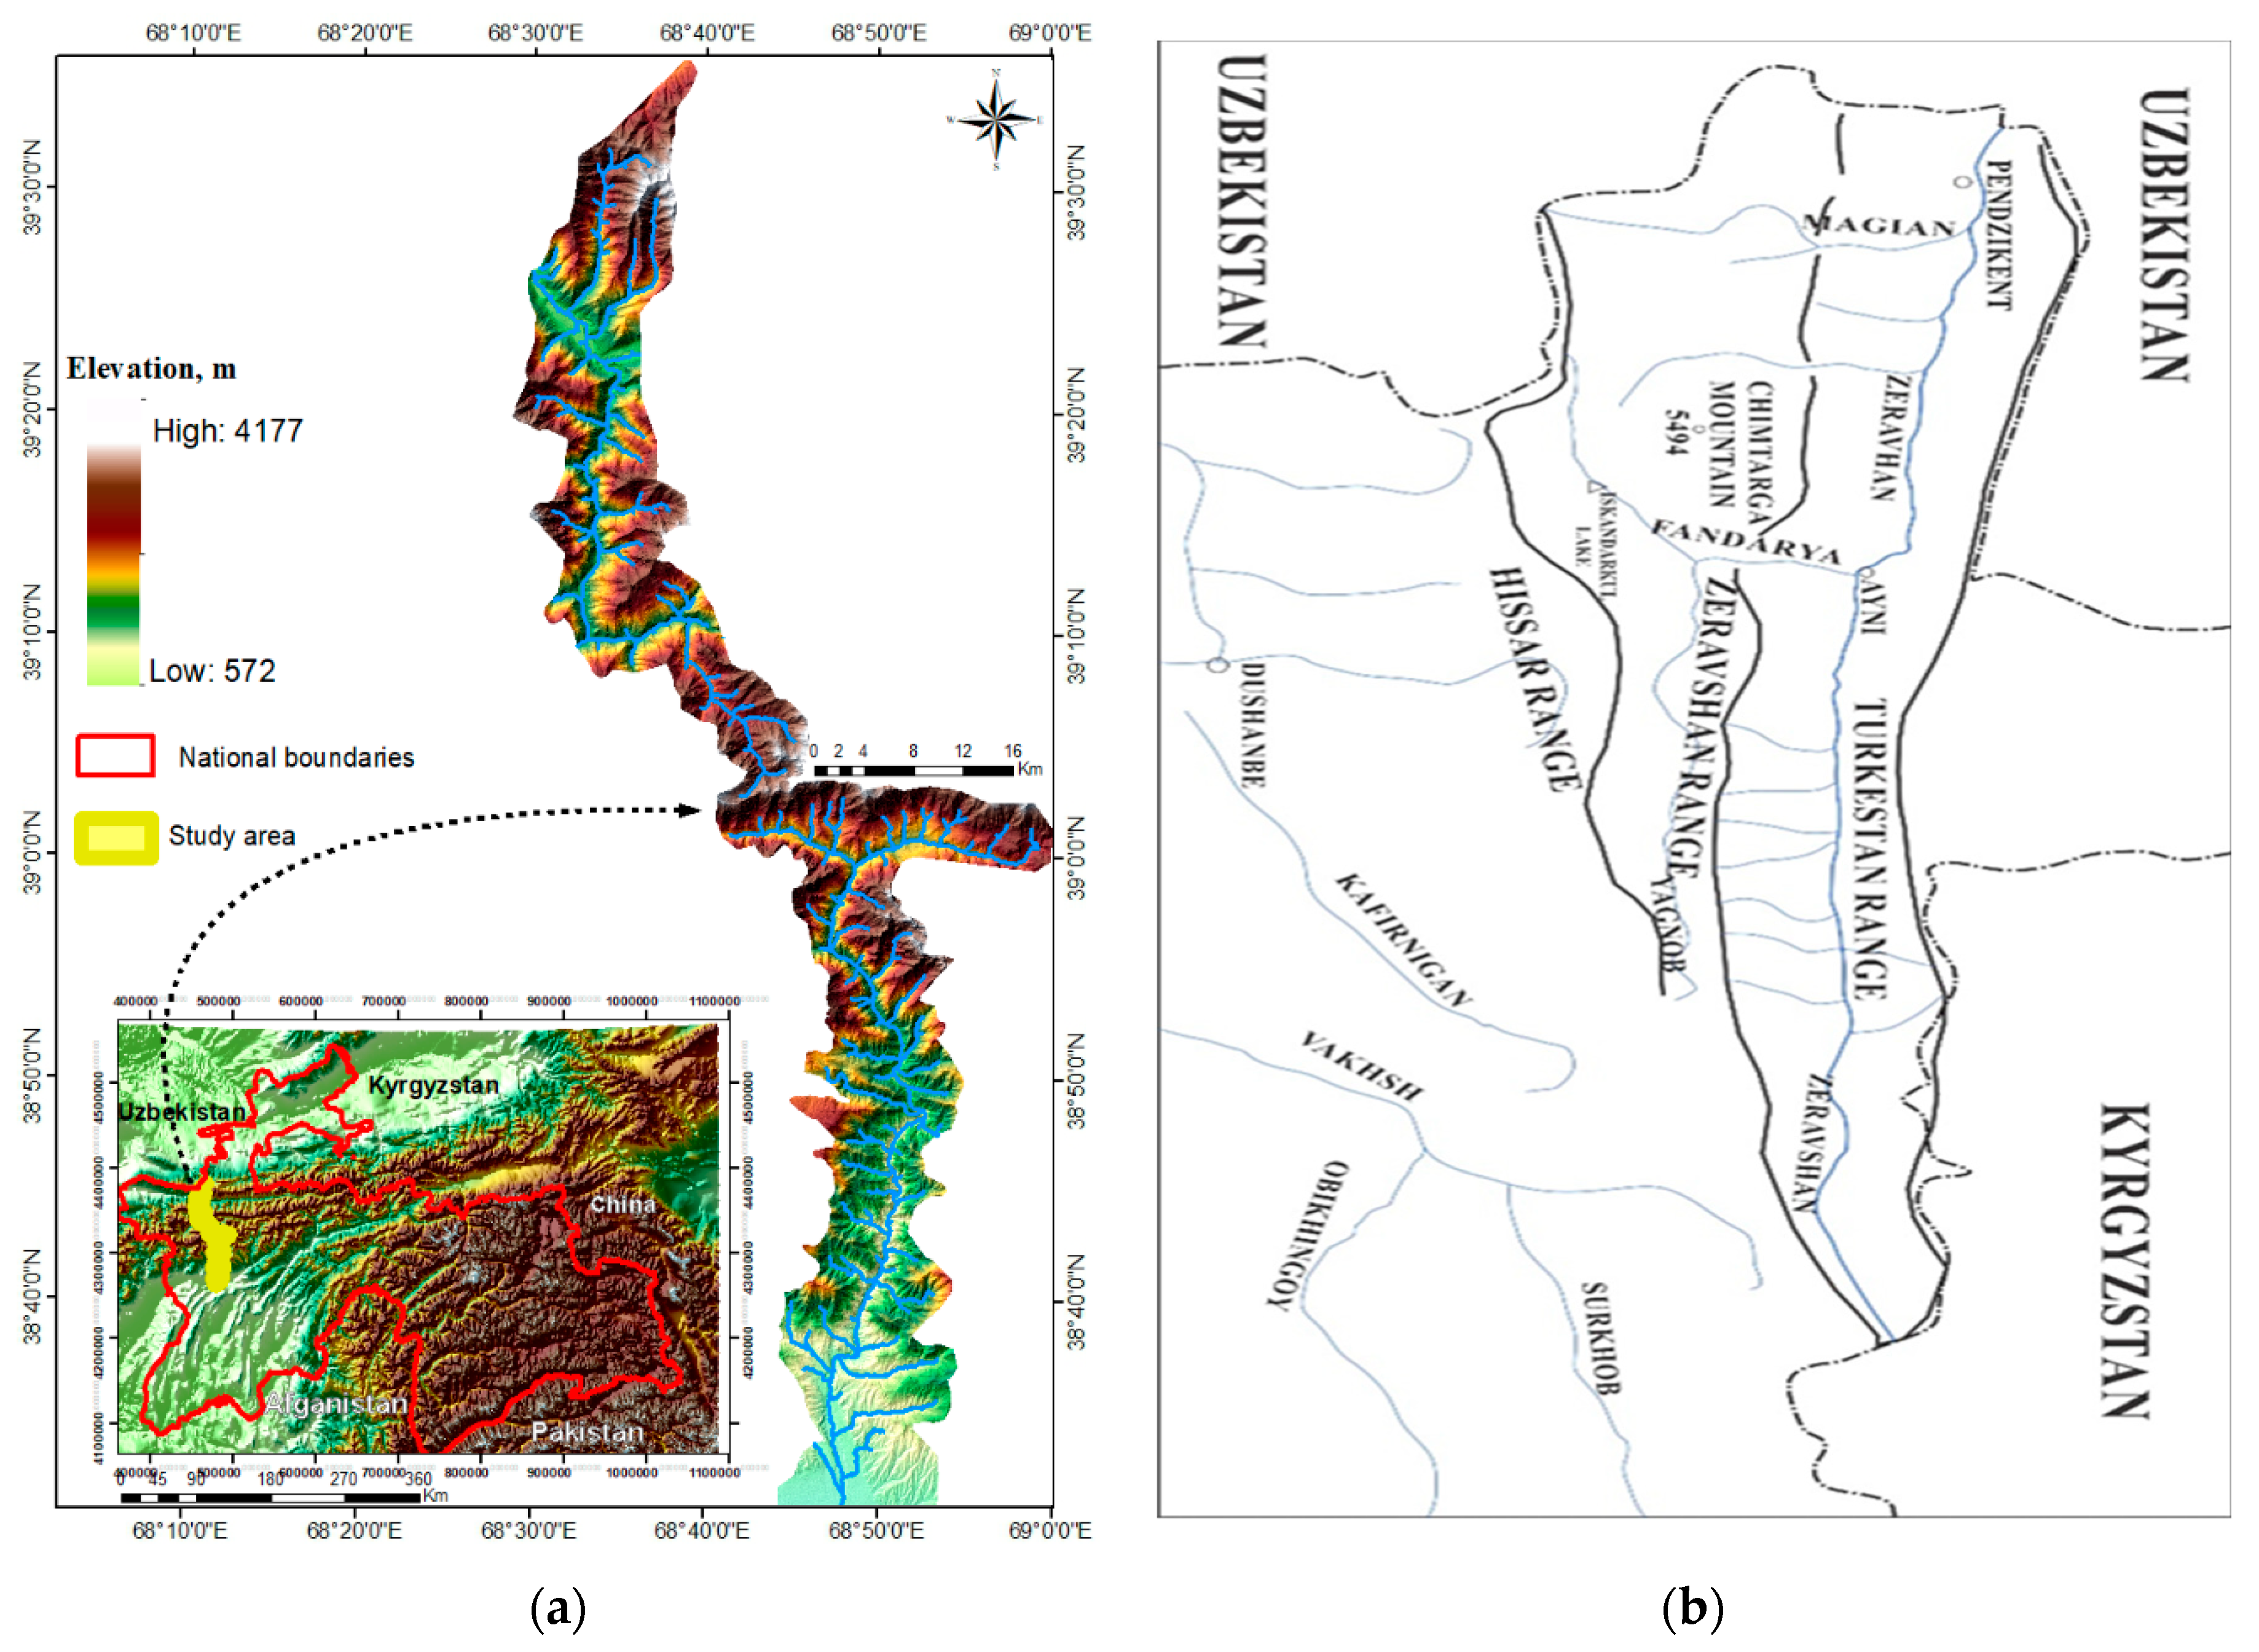
The study zone lies in central Tajikistan and occupies an area of about 1270 km
2 (
Figure 1a), known as the Hissar–Allay mountains region, bounded by the latitudes 38°55′ and 39°58′ N and longitudes 68°15′ and 74°10′ E. The Hissar–Allay region is a sublatitudinal-spreading ridge, consist of Hissar, Zeravshan, and Turkistan mountain systems (
Figure 1b) divided by broad valleys of tectonic origins.
Some peaks rise to 4000 m, but average topographical elevation ranges between 700 and 3000 m.a.s.l. (
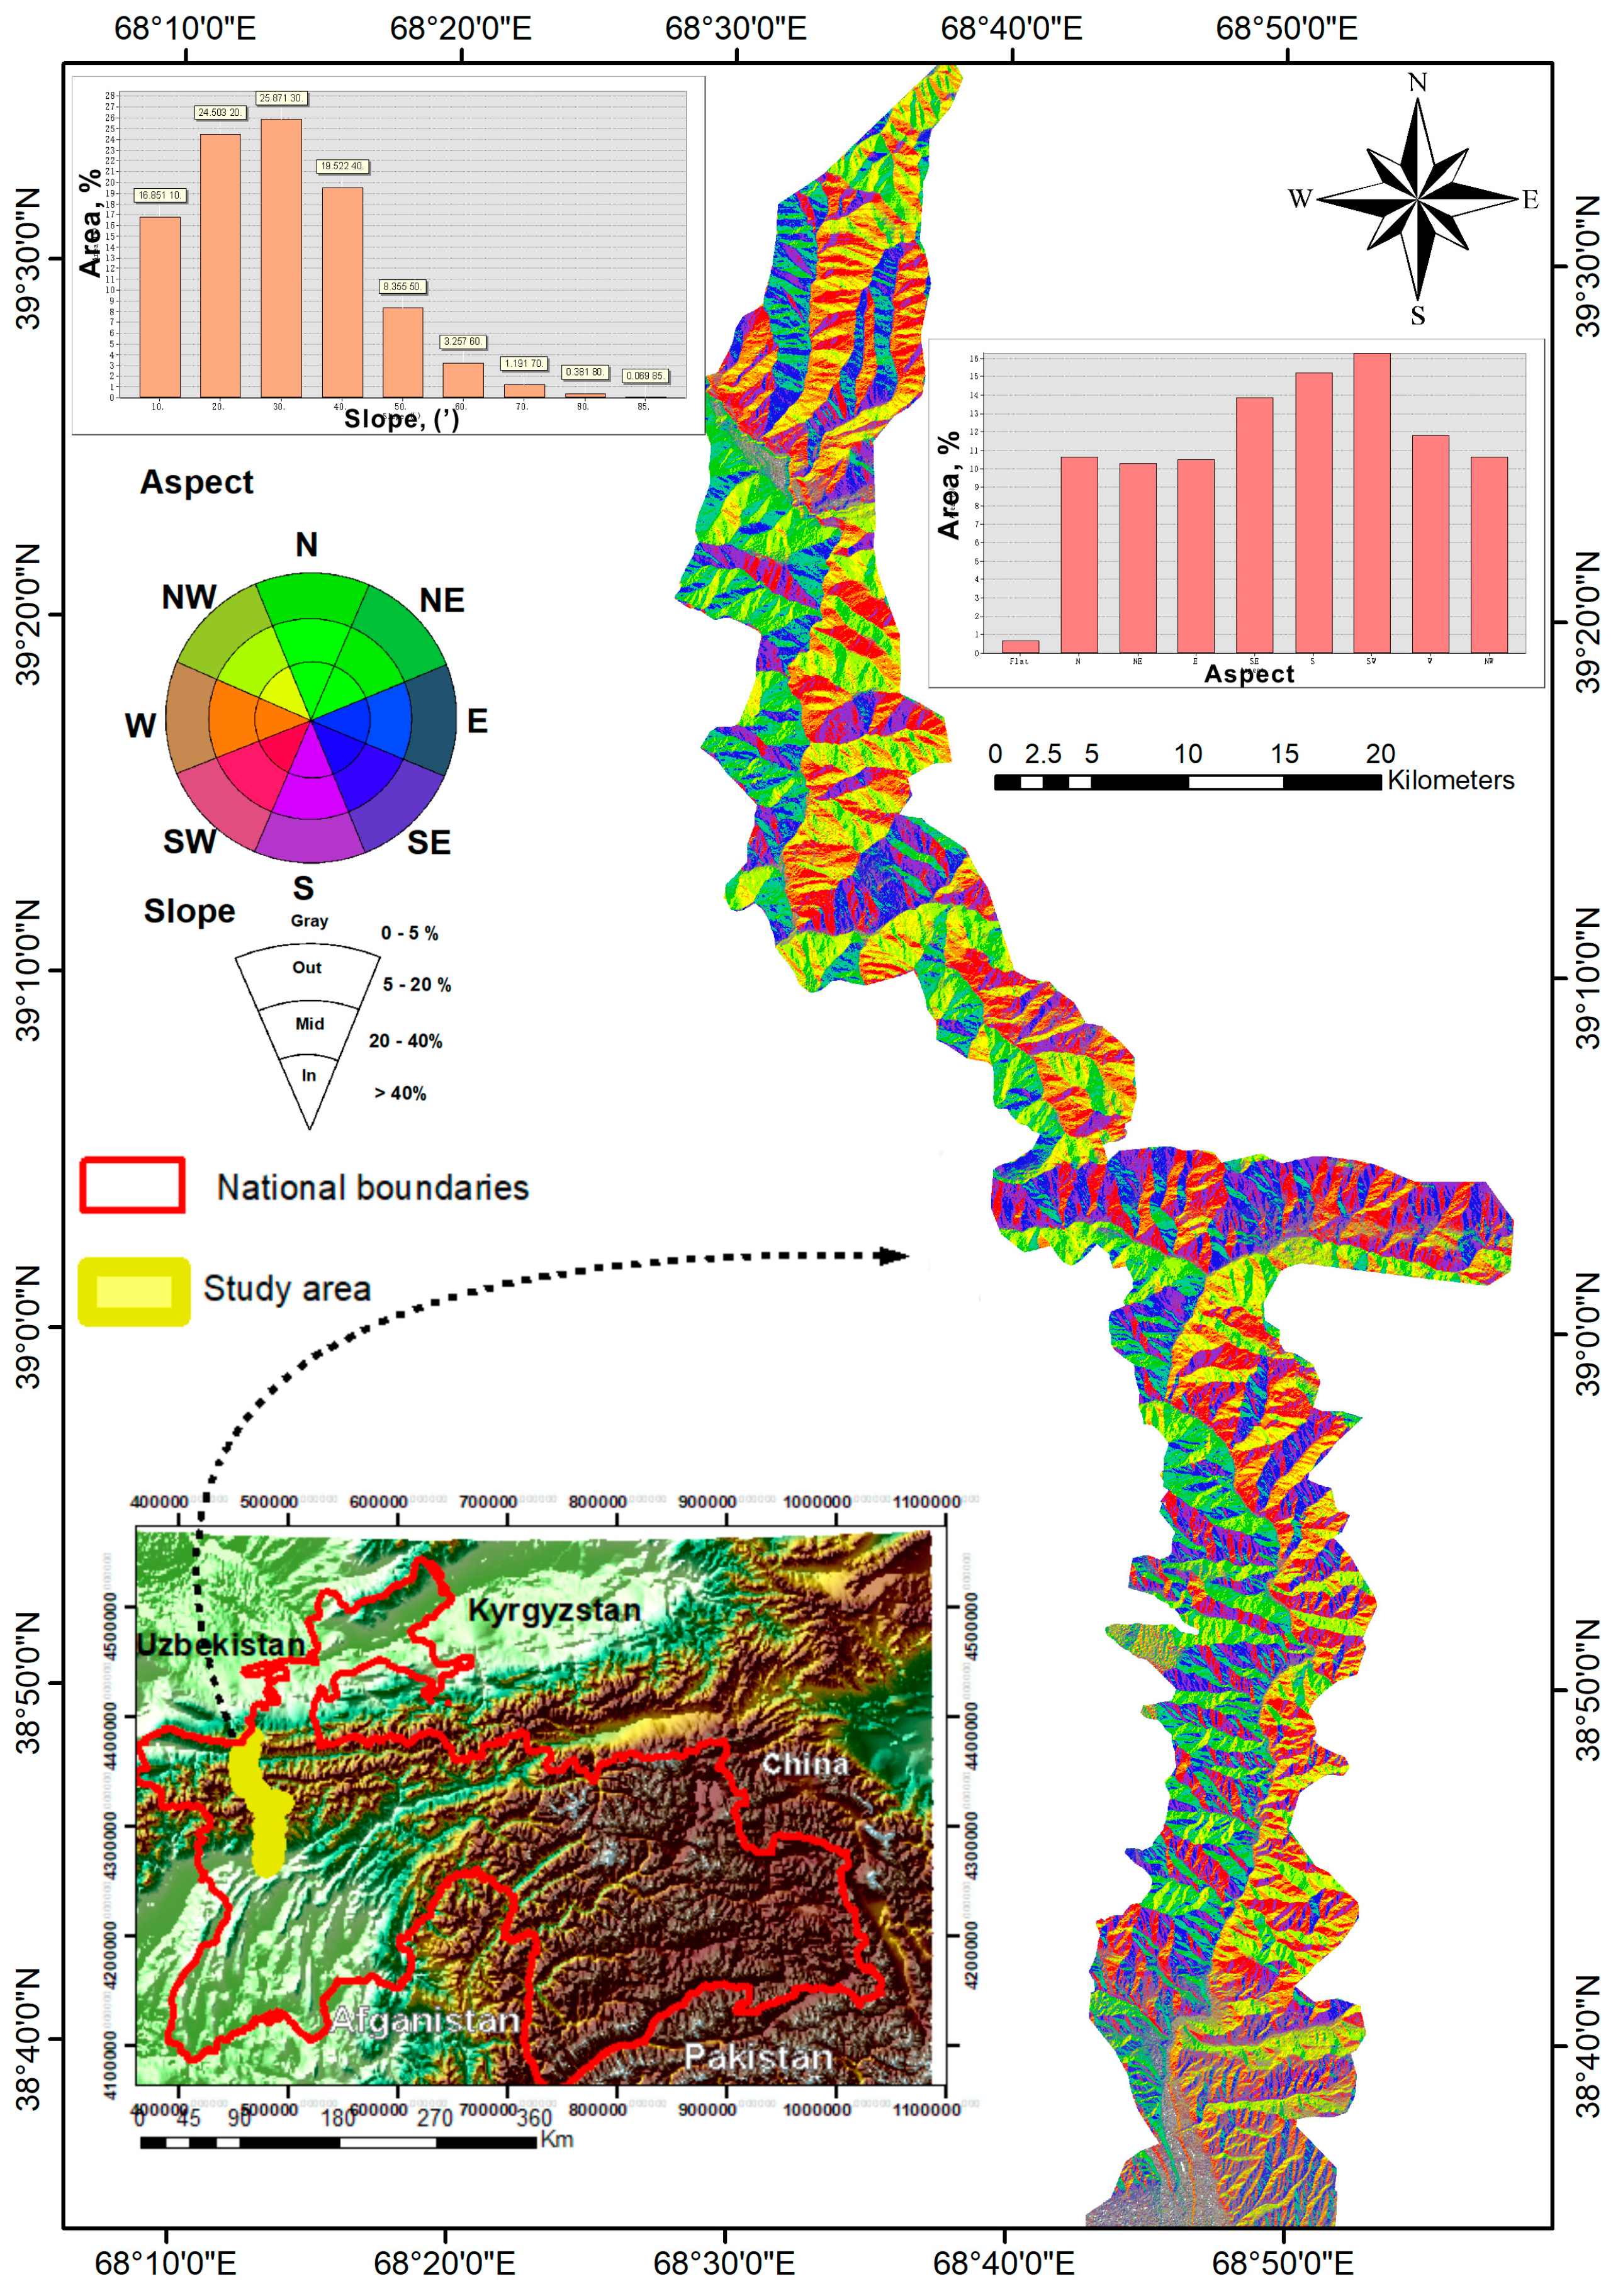
Figure 1a). The landscape includes mountains, uplands, and narrow valleys, consisting of steep rocky slopes shaped by geomorphological processes and human activities. The terrain elevation, aspects, and slope gradients derived from DEM range from 10 to 85 degrees, with a dominant slope gradient of 30 degrees, and slopes mostly face S-SW (
Figure 2).
The study area has a developed hydrographic network, characterised by a rainfed and snowmelt-fed flow regime, providing water to settlements. Zeravshan, Fandarya, Yagnob, Maykhura, Ziddi, and Varzob are the main rivers having a prevailing transport and erosion capacity of debris materials because of their flow regime, dominated by seasonal changes.
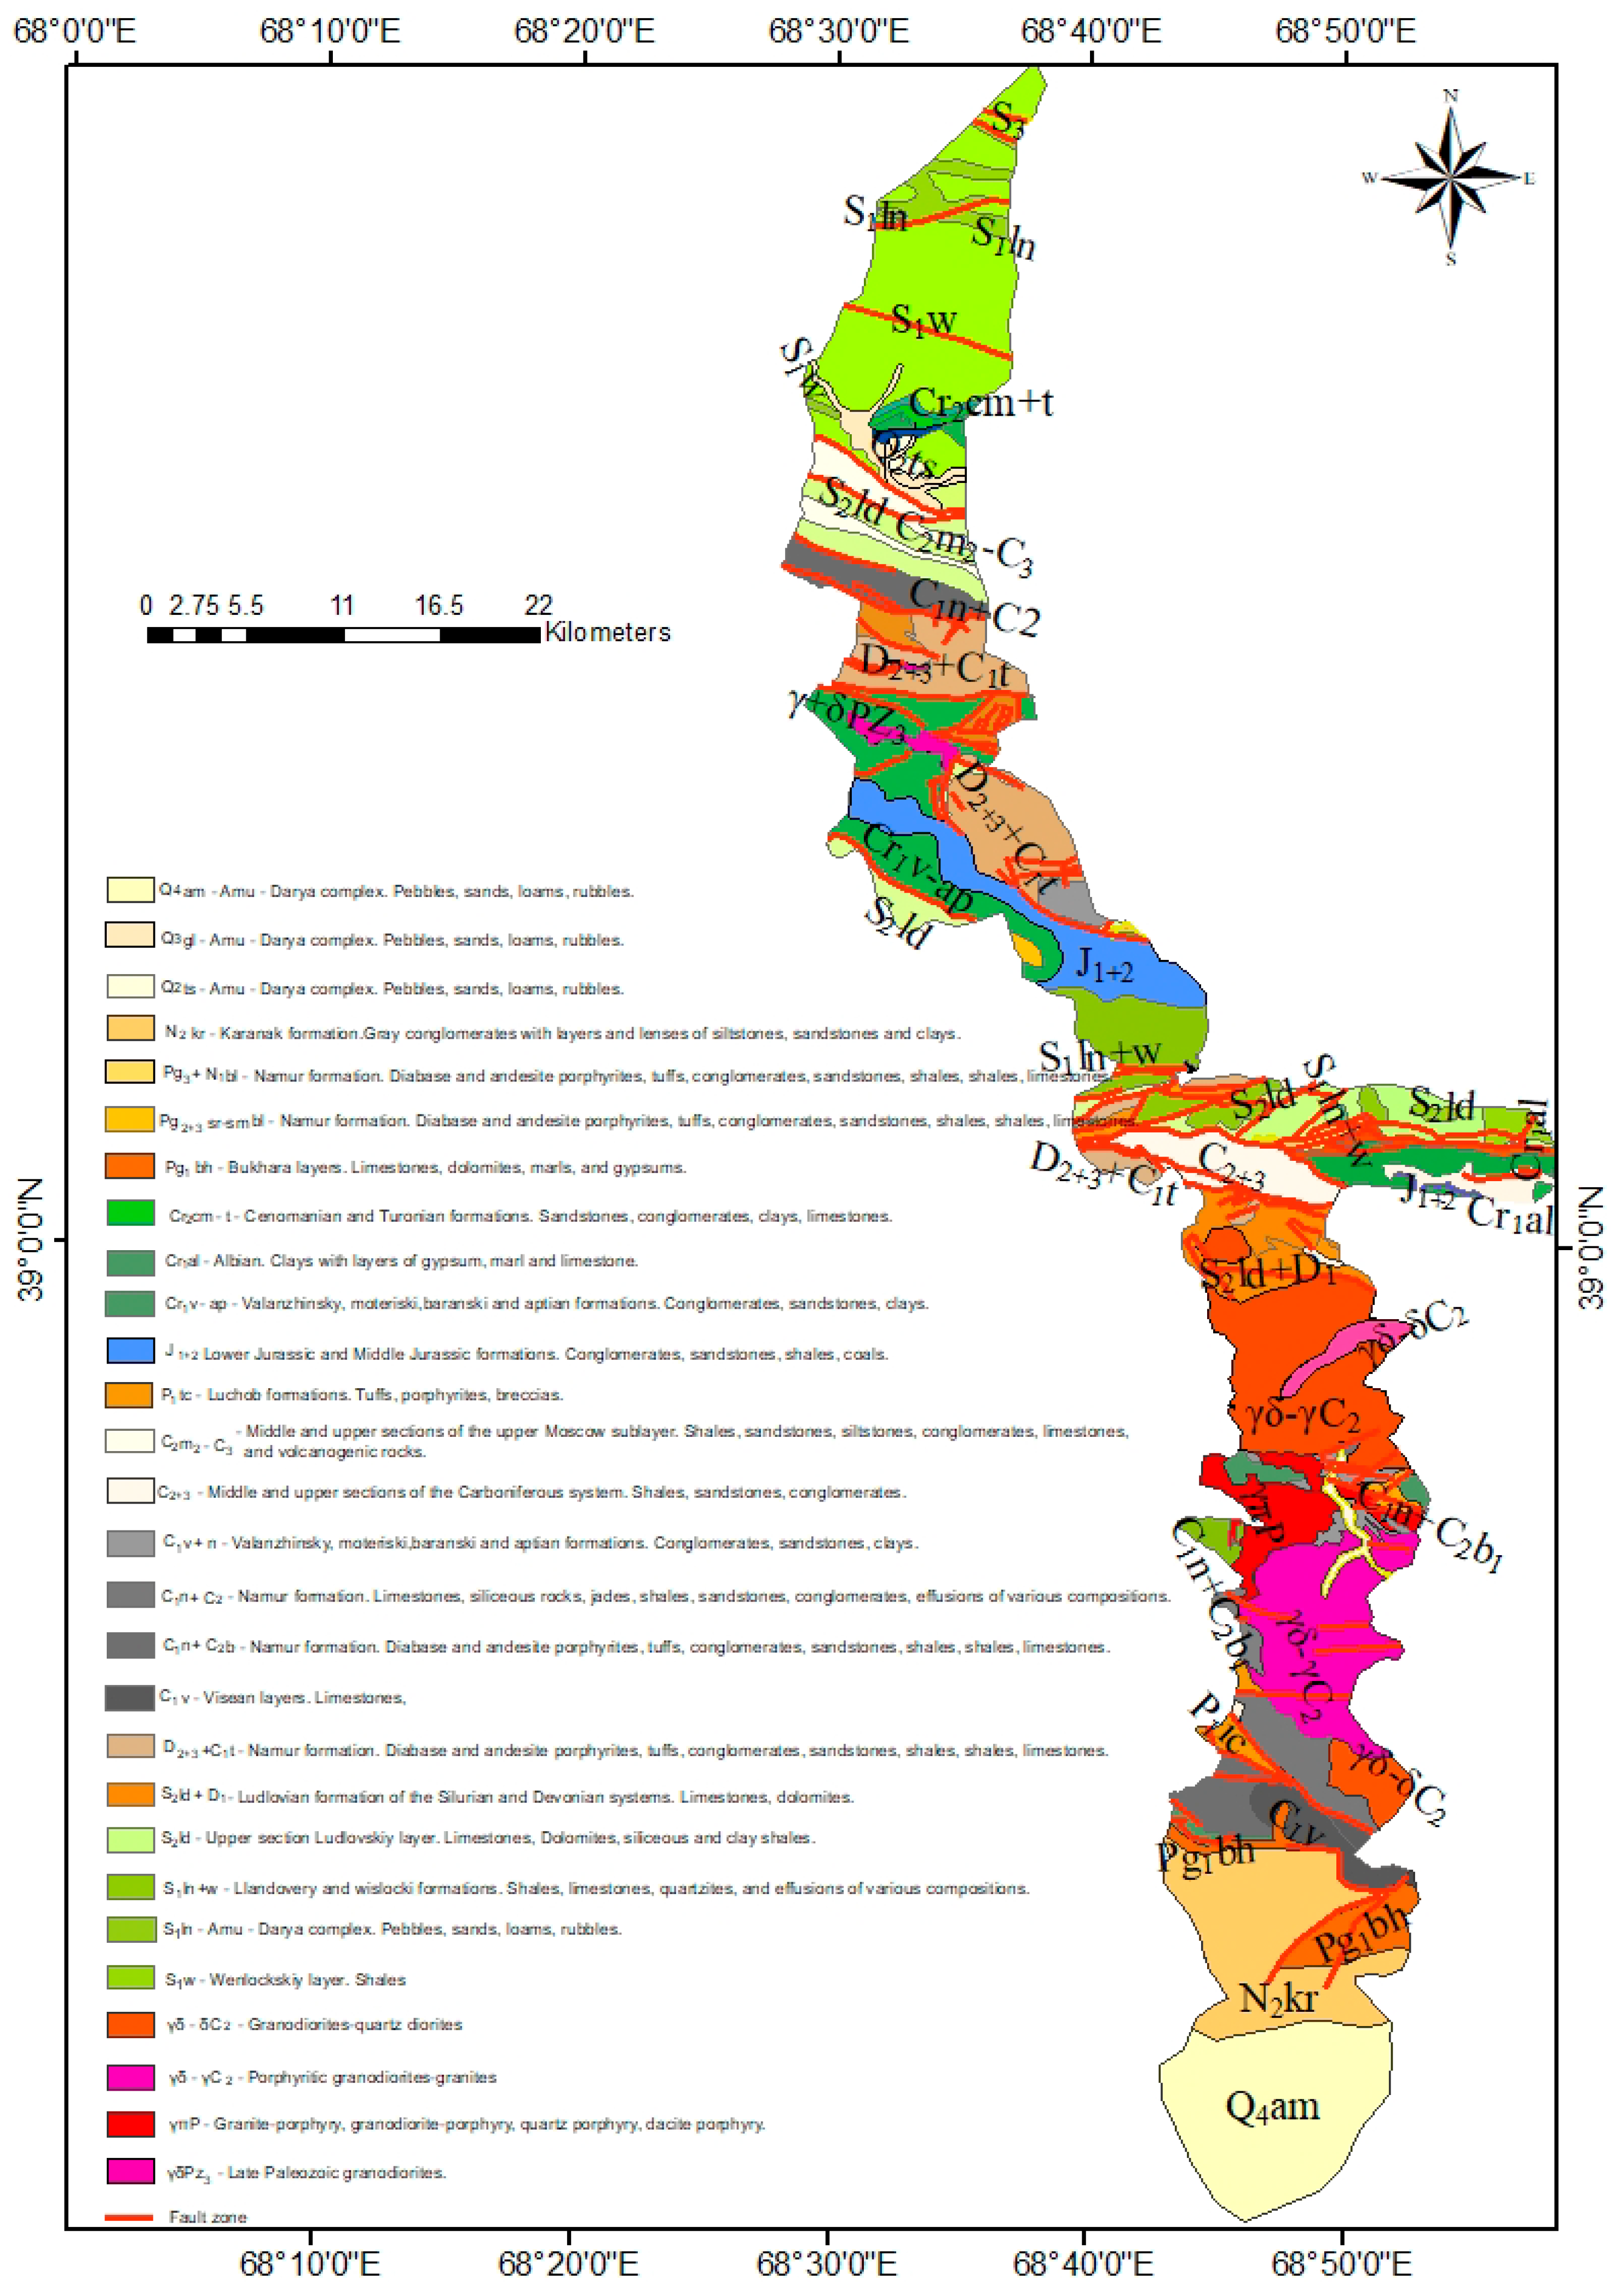
The study area is an asymmetrical folded structure, located in the active seismic zone, composed of three mountains range divided by valleys of tectonic origin. The geological map of the study area (
Figure 3) shows that the oldest formations are the Palaeozoic age, magmatic and volcanic units are represented by granodiorite, porphyry, and granite. Lower Silurian age formations comprise shales, pebbles, sands, loams, and limestones. Middle Silurian deposits are composed of limestones, dolomites, and metamorphic clays. Silurian formations are the most susceptible to landslides because of the layers structure and their broad spatial distribution in the study area. Devonian units have sporadic spreading and are presented by diabase and andesite porphyry, tuff, conglomerate, sandstone, and limestone. Carboniferous formations generally consist of marine sediments such as limestone, conglomerate, sandstone, but Namur formation comprises volcanogenic rocks, tuff, shale and diabase, and andesite porphyry. Mesozoic units composed of sedimentary rocks such as limestone, dolomite, gypsum, and coal from the Jurassic and Cretaceous age erratically cover some study areas.
Alluvial and proluvium sediments of Quaternary age cover river and tributary floodplains. The series starts from the bottom of rivers present with alluvial deposits of the Quaternary period to the top with Paleozoic formations comprising volcanogenic and metamorphic rocks. Cenozoic units are presented by conglomerates, limestones, sandstones, and the Palaeogene- and Neogene-age clays. The age of the geologic units increases from south to north; also, there are numerous strike-slip faults widespread in the study area (
Figure 3).
The region’s climate is continental, semi-arid type, leading to sizeable seasonal variation of temperatures [
35]. Distance from the ocean moisture and diverse topographical settings set the local climate features in the region. Based on the Hydrometeorology Agency’s data, about 70–80% of the annual precipitation falls during the winter and the spring seasons (
Table 1). The rainiest months are March and April; the rainfall falls around 7–10 h with 1.2–3.6 mm/h intensity during these months. The lowest average monthly precipitation falls from July to September. For altitudes, more than 3000 m.a.s.l., precipitation falls mainly in the solid form.
The annual temperature variation in the study area is repetitive; from January to July, the temperature reaches its maximum degree and then decreases from August until it reaches its minimum degree in January (
Table 2). There is vertical zonation of temperatures from the very warm in valleys, where people live, to the mountains (permafrost) zone with snow and ice. The daily and average annual temperature reduces with height until it reaches a minimum at the top of mountains.
From the “Gushary” meteorological station to “Maykhura”, the temperature decreases with height by 1 degree Celsius every 100 m. From “Maykhura” station to “Haromkul” and “Haromkul” to “Anzob pass” stations, the air temperature decreases with height by 0.31 and 0.83 degrees Celsius every 100 m, respectively. The estimated topography elevation, where the average annual temperature does not exceed zero degree Celsius, is around 2800–3130 m, depending on slopes exposition and moisture circulation.
Various topographic, tectonic, geological, and climatic features control the spatial and temporary distribution of landslides. Landslides of different types and activities cover 8.3% of the study area. Deep-seated landslides caused by seismic activity developed in the Paleozoic layers and characterise by preserving the structural unity of the displaced massif. For example, the southern slopes of the Kharangon Valley, composed of clay, metamorphic limestone and other carbonate complexes of the Paleozoic era, are prone to landslides. Moreover, many shallow landslides formed on deep-seated landslide bodies pose no less potential hazard to settlements located on the valley bottom. Rockfalls are the erosion and fragmentation of the rock mass, confined to the lower and middle parts of the slopes. Zones of intense erosion, where the weathering crust was formed slightly, led to the debris cones consisting of talus deposits.
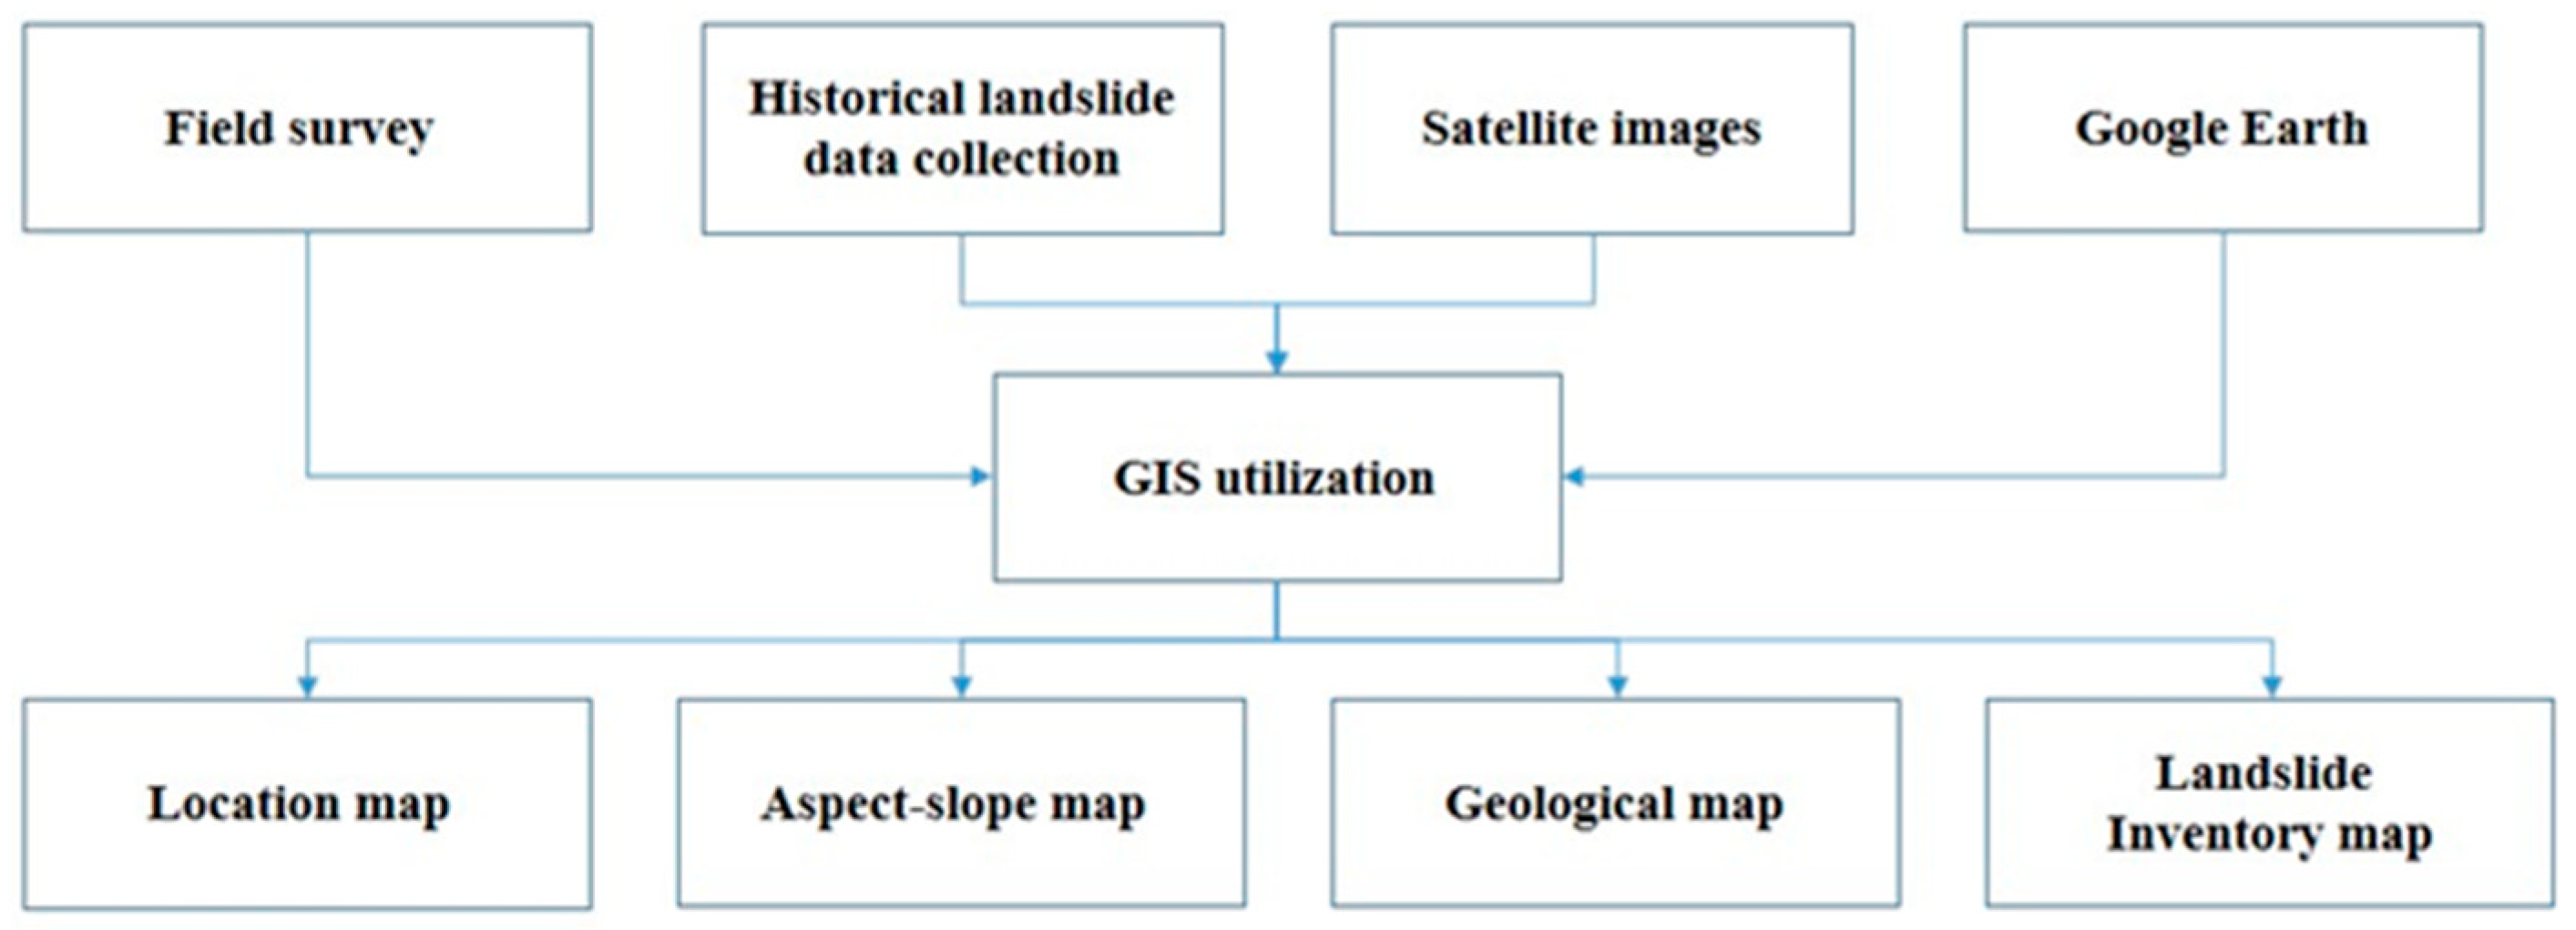
3. Methodology
In this study, the methodology (
Figure 4) applied to compile the landslide inventory map is based on the field survey, historical landslide data collection, satellite image interpretation, GIS and Google Earth utilisation.
3.1. Field Survey
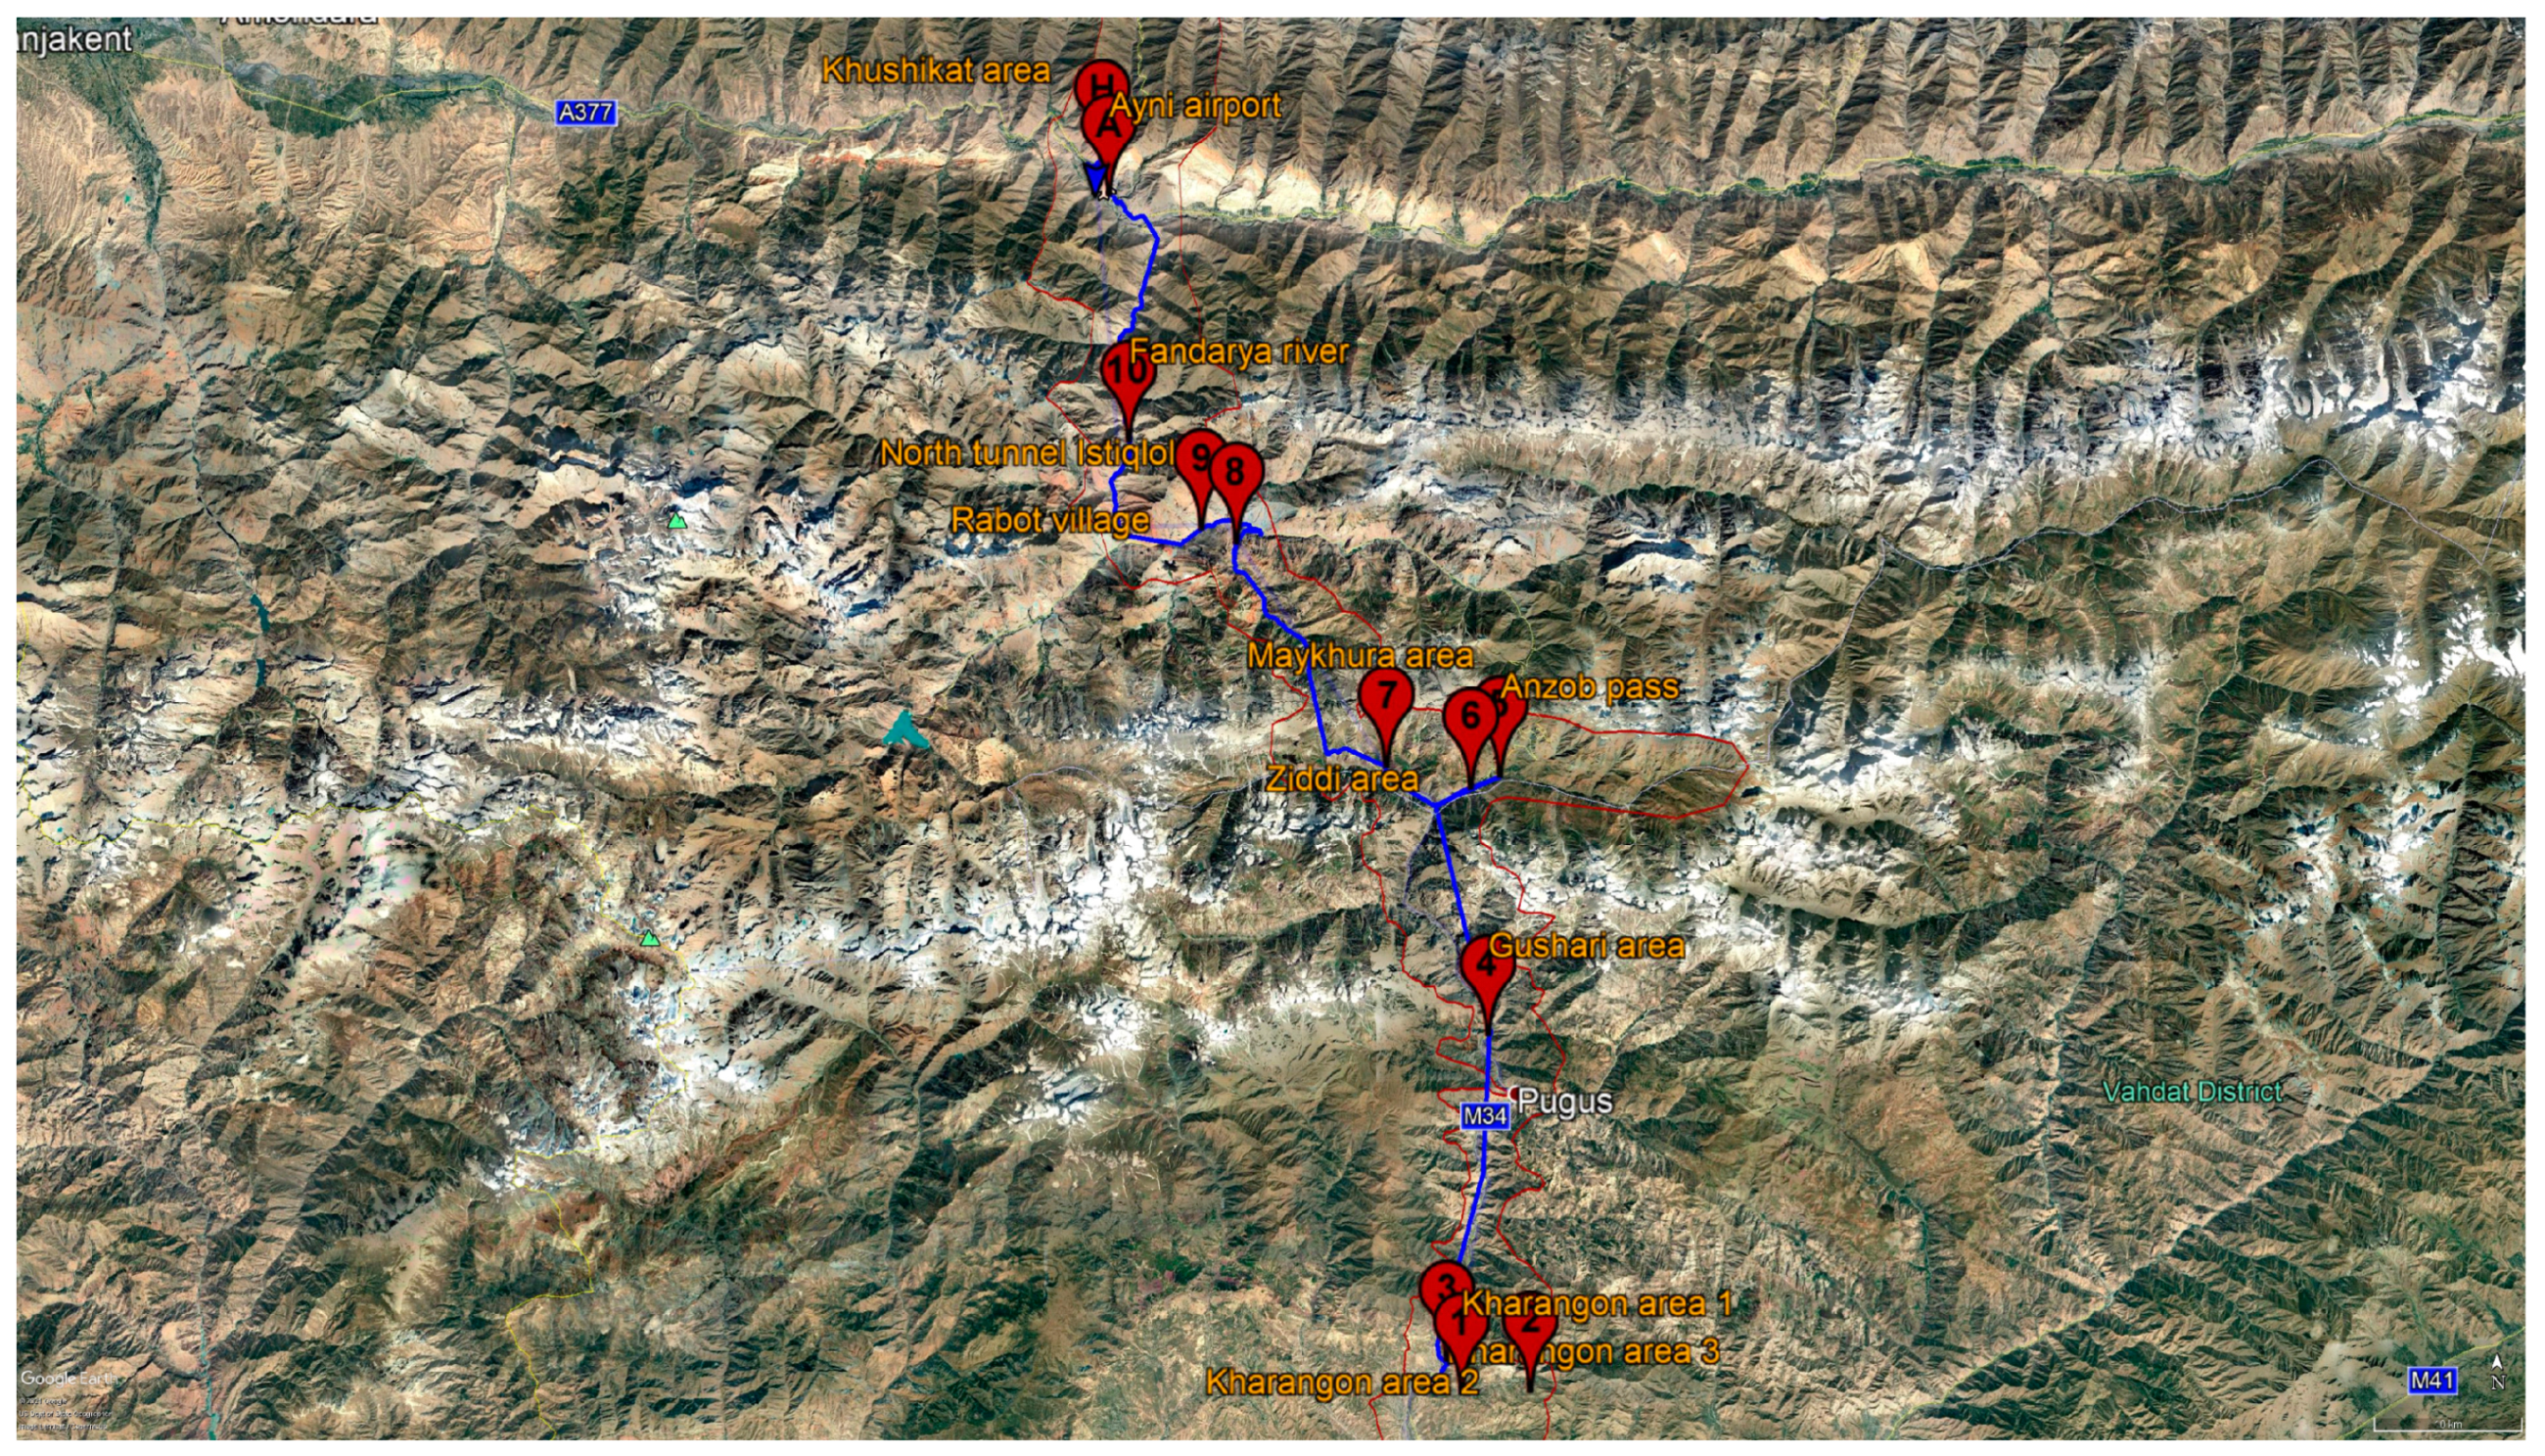
The fieldwork was performed during November 2019 with the aim to do a reconnaissance itinerary on a section of the road that passes through the Hissar–Allay mountain ridges along the Dusanbe–Ainy route “M-34”. “M-34” road is strategically crucial for the Tajikistan highway (
Figure 5). This road is the primary source of commercial imports from the Central Asian countries, China and Russia; moreover, experiencing rapid development of soil removal for housing and apartments leads to erosion and landslides. As a result, this road sector is often exposed to landslides such as rockfall, rock avalanche, debris flow, shallow landslides, and flash floods. Consequently, it causes loss of life, possible cessation of imports, increases prices and risks of goods, and food shortage in large country settlements.
This survey was conducted to identify, characterise, and describe different types of landslides and general relevant information about the relationship between geological formations and landslide distribution (
Figure 5). Overall, 12 potential hazardous areas were observed along the M-34 highway (
Figure 6). Seven selected zones, 1–7, are located on the Hissar ridge. Study sites 7–10 are located in Zeravshan mountain. The rest of the two study zones, 11 and 12, are situated in the Turkistan range. The data relating to identified landslides were collected, georeferenced according to GPS coordinates of each landslide, and digitised as polygons using the Arcmap 10.2 software.
Moreover, displacement area, type of movement, and geological units involved in mass movements were also recorded into a geodatabase related to the landslide inventory. The spatial distribution of landslides is characterised by considering many factors, such as topography, slope degree and aspect, landslide materials, slope deformations, dislocation zones and so on (
Figure 6). Finally, all the information obtained from field surveys was compared with that derived from the satellite images.
3.2. Historical Landslide Data Collection
Historical landslides data, utilised for landslide inventory in the study region, was extracted from technical reports covering 1964 through 2015—the Department of Geology initiated these explorations under the Council of Ministers of the Tajik SSR. Obtained data includes information about the geological, geomorphological, climatic and tectonic conditions of the Hissar–Allay region; moreover, results of comprehensive local-scale studies of gravitational processes presented as maps, catalogues, and notes in that reports. Landslides data collected were scanned, georeferenced, digitised, and incorporated into the ArcMap 10.2 software.
3.3. Satellite Images
Application of medium-resolution (10 m grid cell size) optical Sentinel-2 images obtained from the European Space Agency (ESA) database allowed us to delineate and analyse deep-seated landslides and vast debris flows catchment. To extract an elevation, slope-aspect, for a river and its tributary distribution a 12.5 × 12.5 m
2. grid cell size digital elevation model (DEM) was derived from the ALOS-PALSAR mission dataset, which is a project between the Japan Aerospace Exploration Agency (JAXA) and the Japan Resources Observation System Organization (JAROS). Moreover, the DEM was used to derive landslide parameters such as a landslide area, landslide volume, landslide parts, and its distribution used for landslide mapping. However, DEM analysis cannot be used for small-size landslides, so we have used Google Earth’s helpful software [
36,
37] to denote rockfalls and shallow landslides.
3.4. Google Earth and GIS
Google Earth (G.E.), with multitemporal images in high spatial resolution, provides medium and small regional landslide mapping capacity. G.E., as a versatile tool, has been used for many studies on landslide inventory [
36,
37,
38,
39,
40]. In our study area, rockfalls and shallow landslides were identified by zooming and scrolling around in those areas, where a sign of land surface deformation was observed. Having identified and digitised landslide locations, we have converted received data into KML files and then overlayed them on ArcMap 10.2. In ArcMap 10.2, a hillshade map was obtained from the DEM to design a landslide inventory map by the retrieval and on-off switching of the geodatabase information. Furthermore, an aspect-slope map was created. This combined map shows both slope directions are illustrated by hues and inclination presented with the brilliance of colour, which was necessary for landslide distribution analysis and the creation of landslide inventory.
3.5. Statistical Analysis of Landslides
The frequency-area distribution was calculated to understand the relationship between geological, geomorphological settings and landslide distribution in the Hissar–Allay region. According to Malamud [
41], the probability density function can be found by an inverse gamma function. The frequency-area distribution was calculated for shallow landslides, debris flows, rockfalls, and deep-seated landslides in our work.
In this study, a variation of landslide index (ratio between landslide area and total area × 100, considering slope degree) for 922 landslides also was calculated. Low landslide index values indicate sites where t40he number of landslides is underestimated or data has low accuracy and requires updating in the future.
4. Results
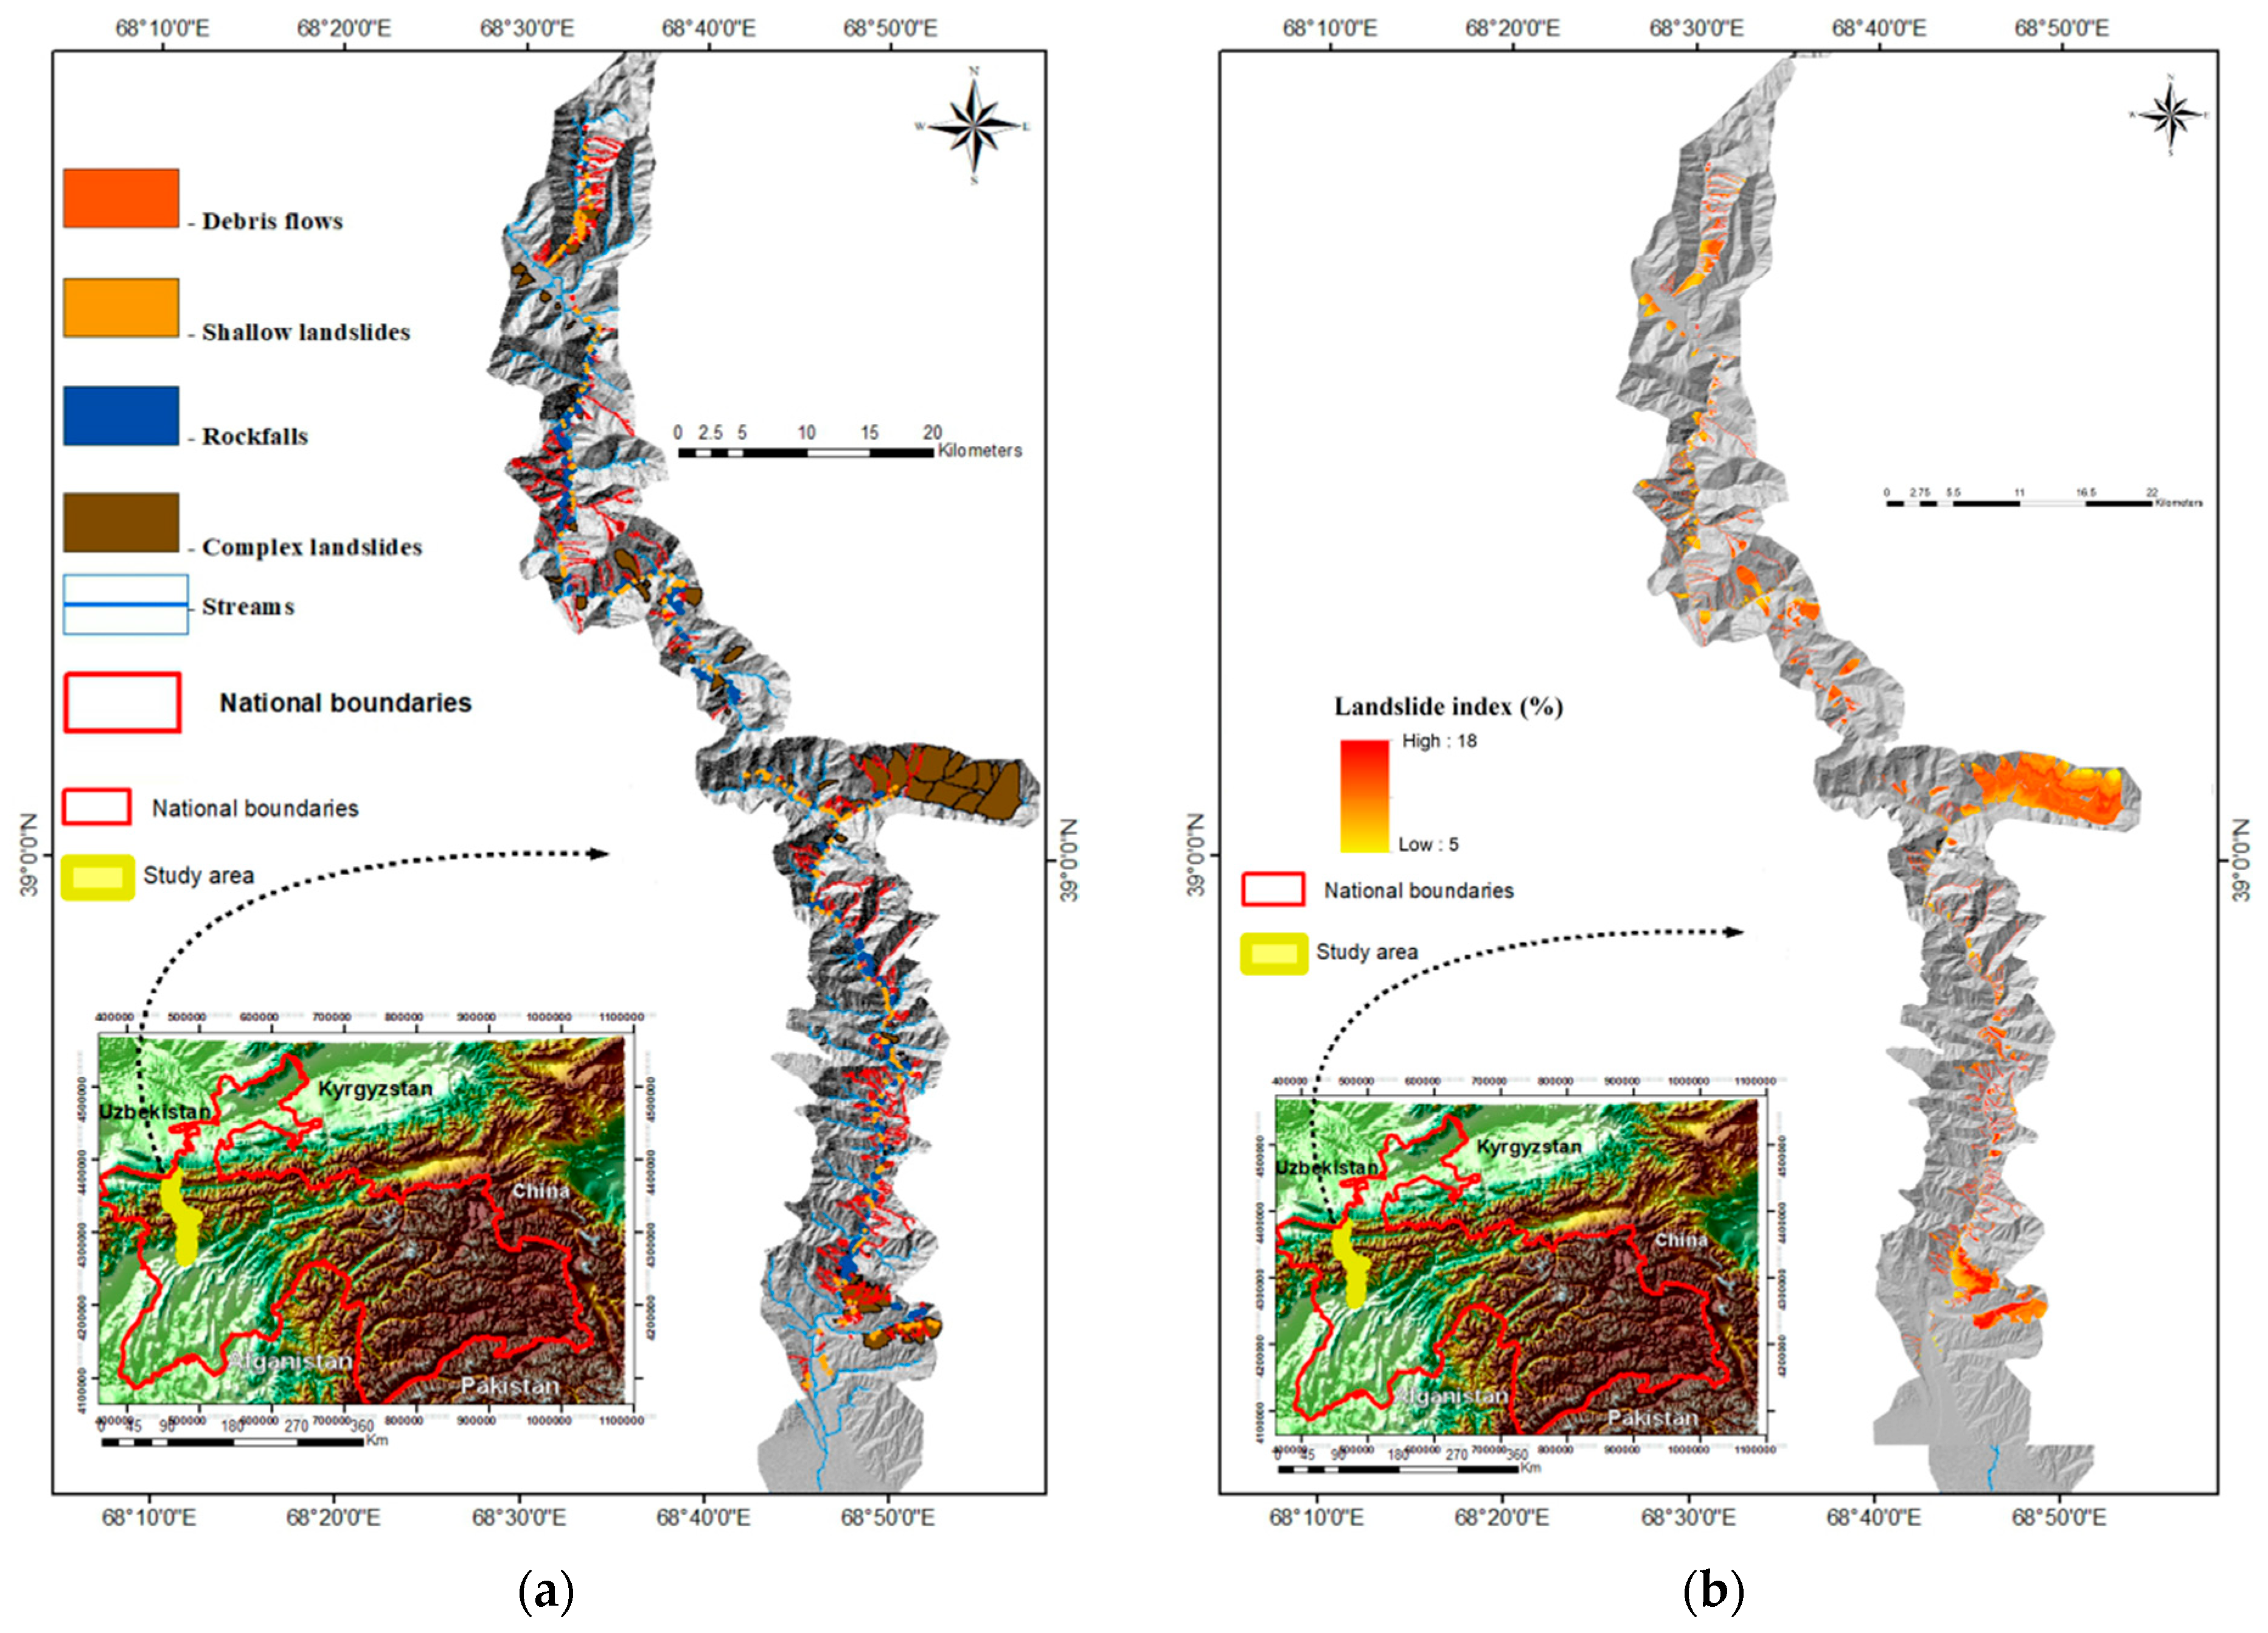
The regional-scale landslide inventory map was produced through the field survey, historical landslide data analysis, and remote sensing techniques (
Figure 7a), as well as a map of the landslide Index (
Figure 7b) (landslide area/total area × 100). Combining these methods allowed us to define that mass movement is widespread in the study area and represents the main gravitational processes controlling morphological features of slopes, and poses hazards for people living there. In addition, many landslides involve settlements and human-made infrastructures, such as roads and houses (
Figure 6). The database is composed of 922 landslides. Based on Cruden & Varnes [
30] classification, the inventoried landslides (including both rupture and accumulation zones) were classified as 409 (66%) slides, 297 (32%) flows, and 216 (24%) falls; moreover, slides were distinguished according to their relative depths, as 313 (34%) shallows (depth < 5 m), and 96 (10%) deep-seated (depth > 5 m).
A percent distribution analysis of the different landslide types detected in the study area was performed (
Figure 8). A large number of debris flows (29.7–32%) are widely distributed along tributaries flowing into rivers. Often debris flows occur during spring and autumn periods and are characterised by rapid raging flows of saturated debris materials, entrained from channel path and delivering downstream and landslide materials entering the channels from the slopes. Rockfalls (21.6–24%) are widespread and mainly concentrated in the terrains where steep slopes and more resistant rocks consist of sandstones, limestones, dolomites, and quartzites. Rockfall zones and their deposits often develop in faults, scarps, joints, or multiple cavernosal and eroded dislocations. Rockfalls can release as a single boulder falls or as a motion of large volumes of rock. The 313 shallow slides recorded were delineated, representing 34% of the inventoried landslides and covering about 2.1 km
2 affecting 0.17% of the total surface area of the study zone. They are mainly shallow slides with a sliding surface <10 m; in general, shallow landslides developed in clay-rich deposits and rocks such as foredeep loams deposits and argillite sediments.
The 96 deep-seated landslides were recorded, covering 10% of the total inventory, affecting 6.46% of the prone area. These deep-seated landslides, confined between fault systems, increase their activation potential with a sliding surface >10 m. and occur in different materials with variable strengths. The interplay between landslides and geological formations indicates that all types of landslides in the study area dominantly developed on slopes consisting of Silurian age deposits comprised of shales, pebbles, sands loams, and limestones (
Figure 8).
Silurian formations are the most prone to landslides because of the layers structure and the broad spatial distribution of this formation in the study area. Moreover, deep-seated landslides are directly related to tectonic settings. The fault’s activity has caused an intense disintegration and deformation of slopes composed of rocks and soil materials. The deep-seated landslide dislocations are aligned with significant fault cracks. About derived relationships between landslides parameters and geological and topography features, statistical analysis was performed.
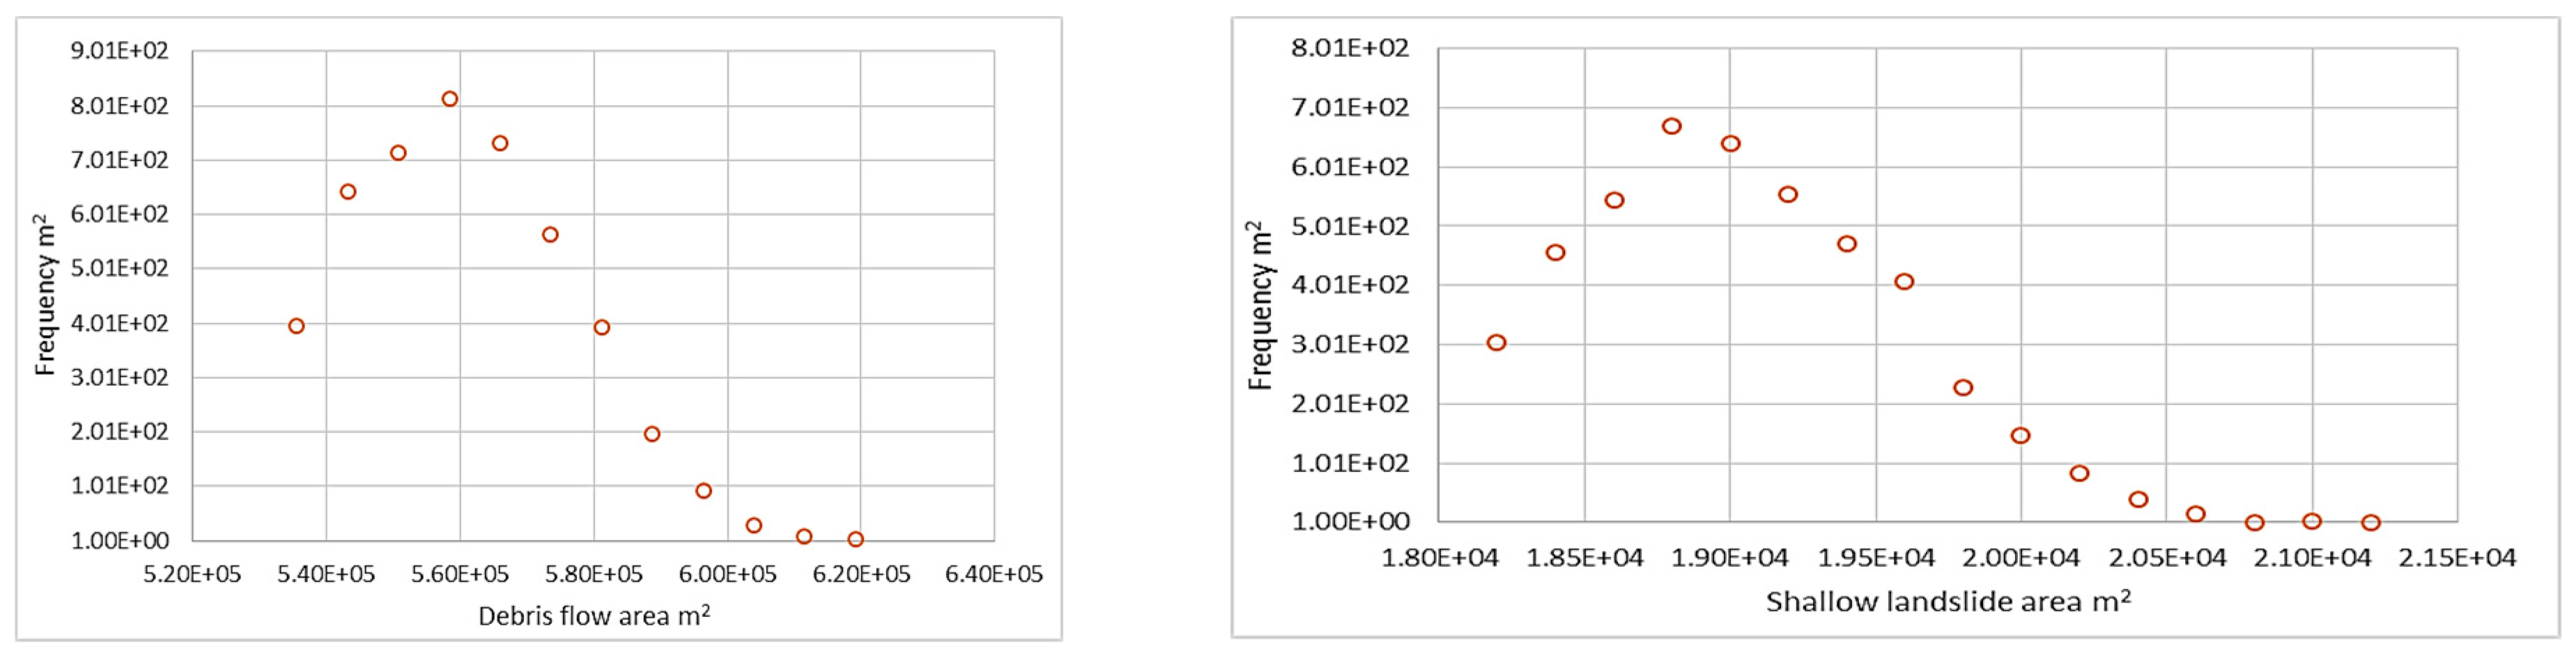
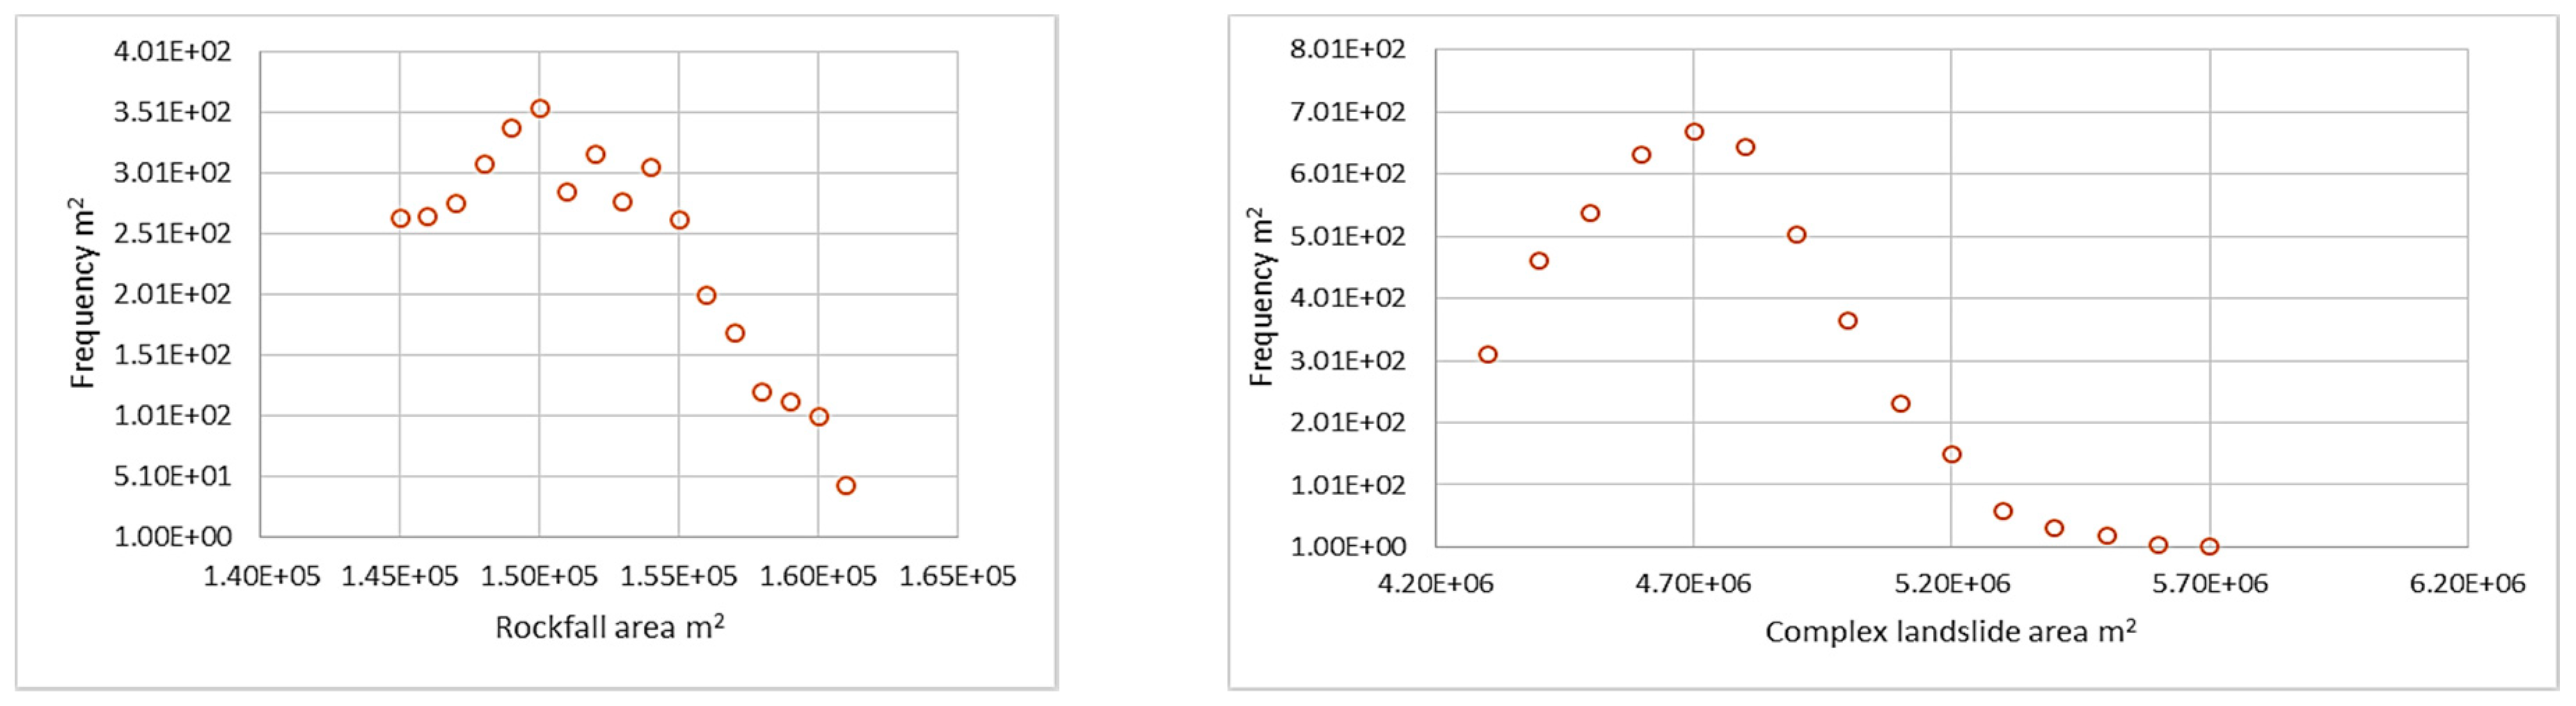
Figure 9 provides information about frequency-area distribution for four types of landslides. Frequency-area plots were fitted to the mean statistical distribution using a bootstrap sampling procedure with 5000 replicates.
Overall, all graphs experienced an increasing trend until their threshold area’s value, then showed a downward trend. The occurrence of debris flows ranges between 5.36E+5 and 6.19E+5 m2, reaching a maximum of 5.58E+5 m2; it showed a gradual decrease to 6.19E+5 m2 at the end of the segment. Rockfalls having diverse areas from 1.45E+05 m2 to 1.61E+05 m2 are widespread in the study area. Its maximum value of occurrence increased up to 1.50E+05 m2; then steadily diminished to the minimum value of 1.61E+05 m2. Shallow landslides have a place of between 1.82E+04 m2 to 2.12E+04 m2. At 1.88E+04 m2 shallow landslides are more frequent in the study area. Complex landslides are the first-largest type of landslides in size, above the other three described landslides. Complex landslide areas rate between 4.30E+06 and 5.70E+06 m2 have peaks of 4.70E+06 m2, and its landslide frequency has declined to 5.70E+06 m2 by the end of the section.
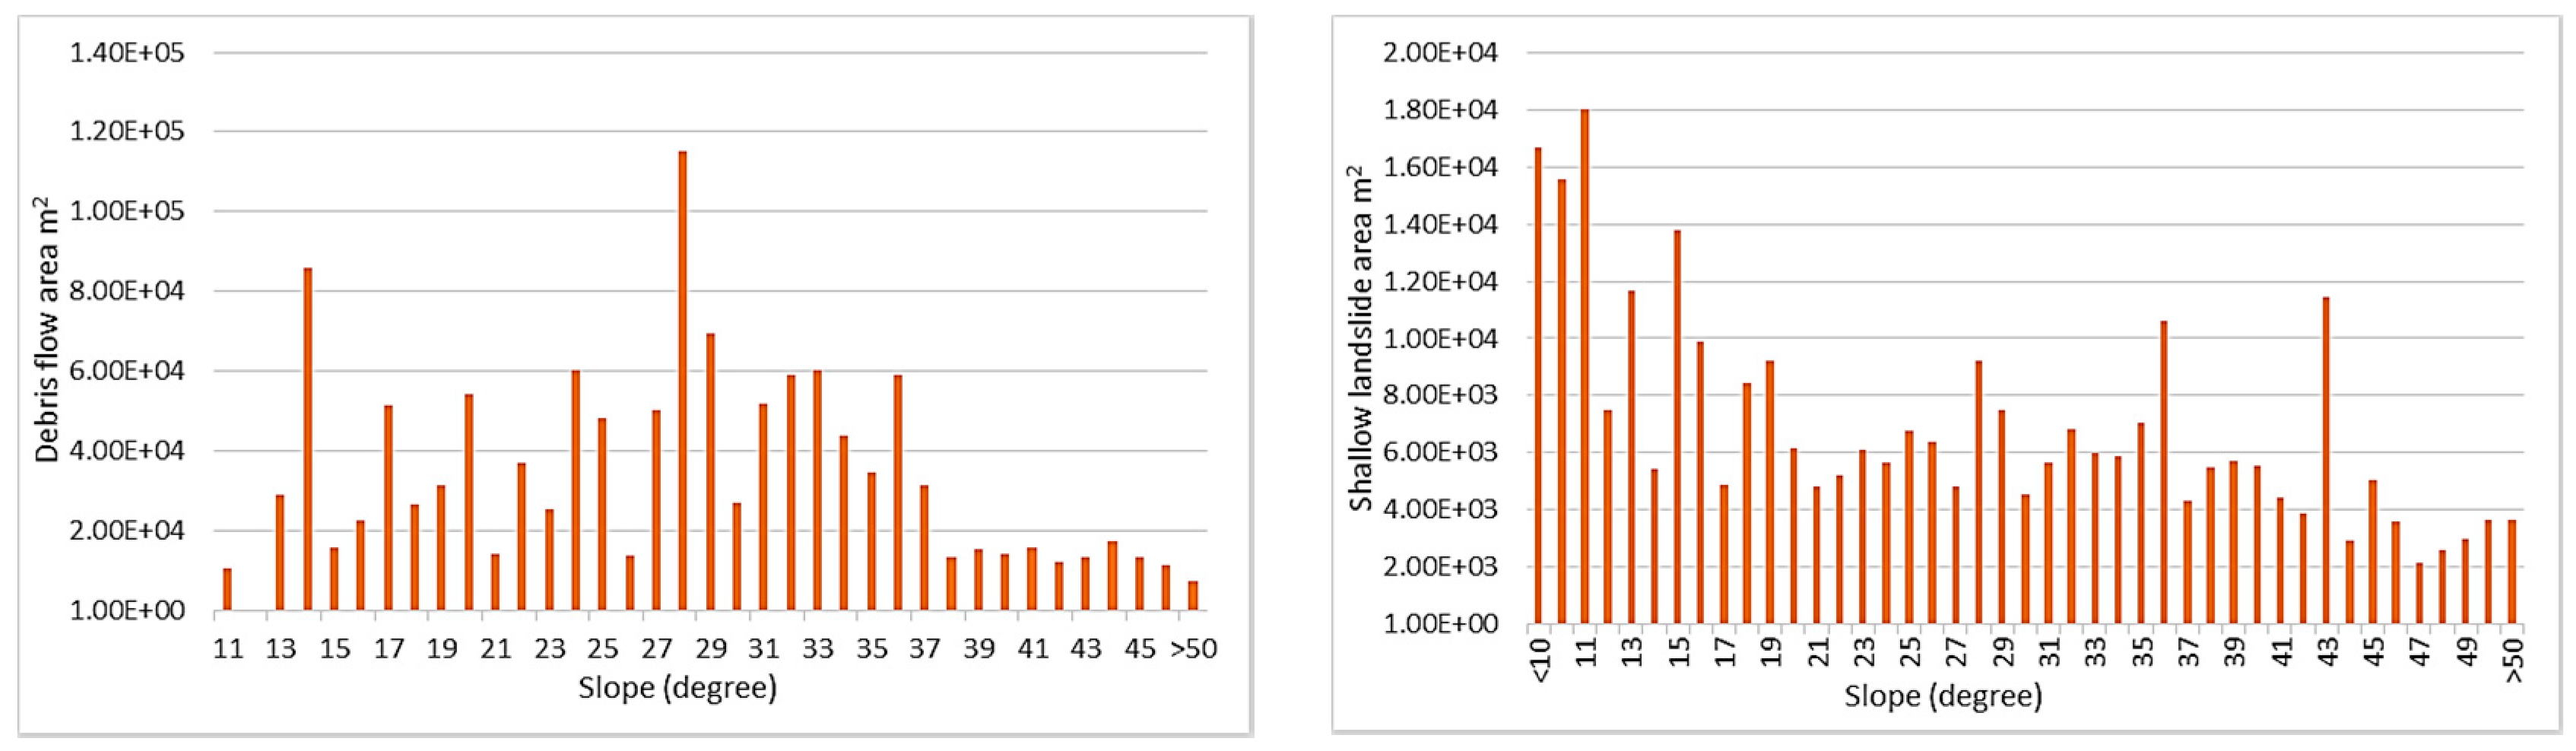
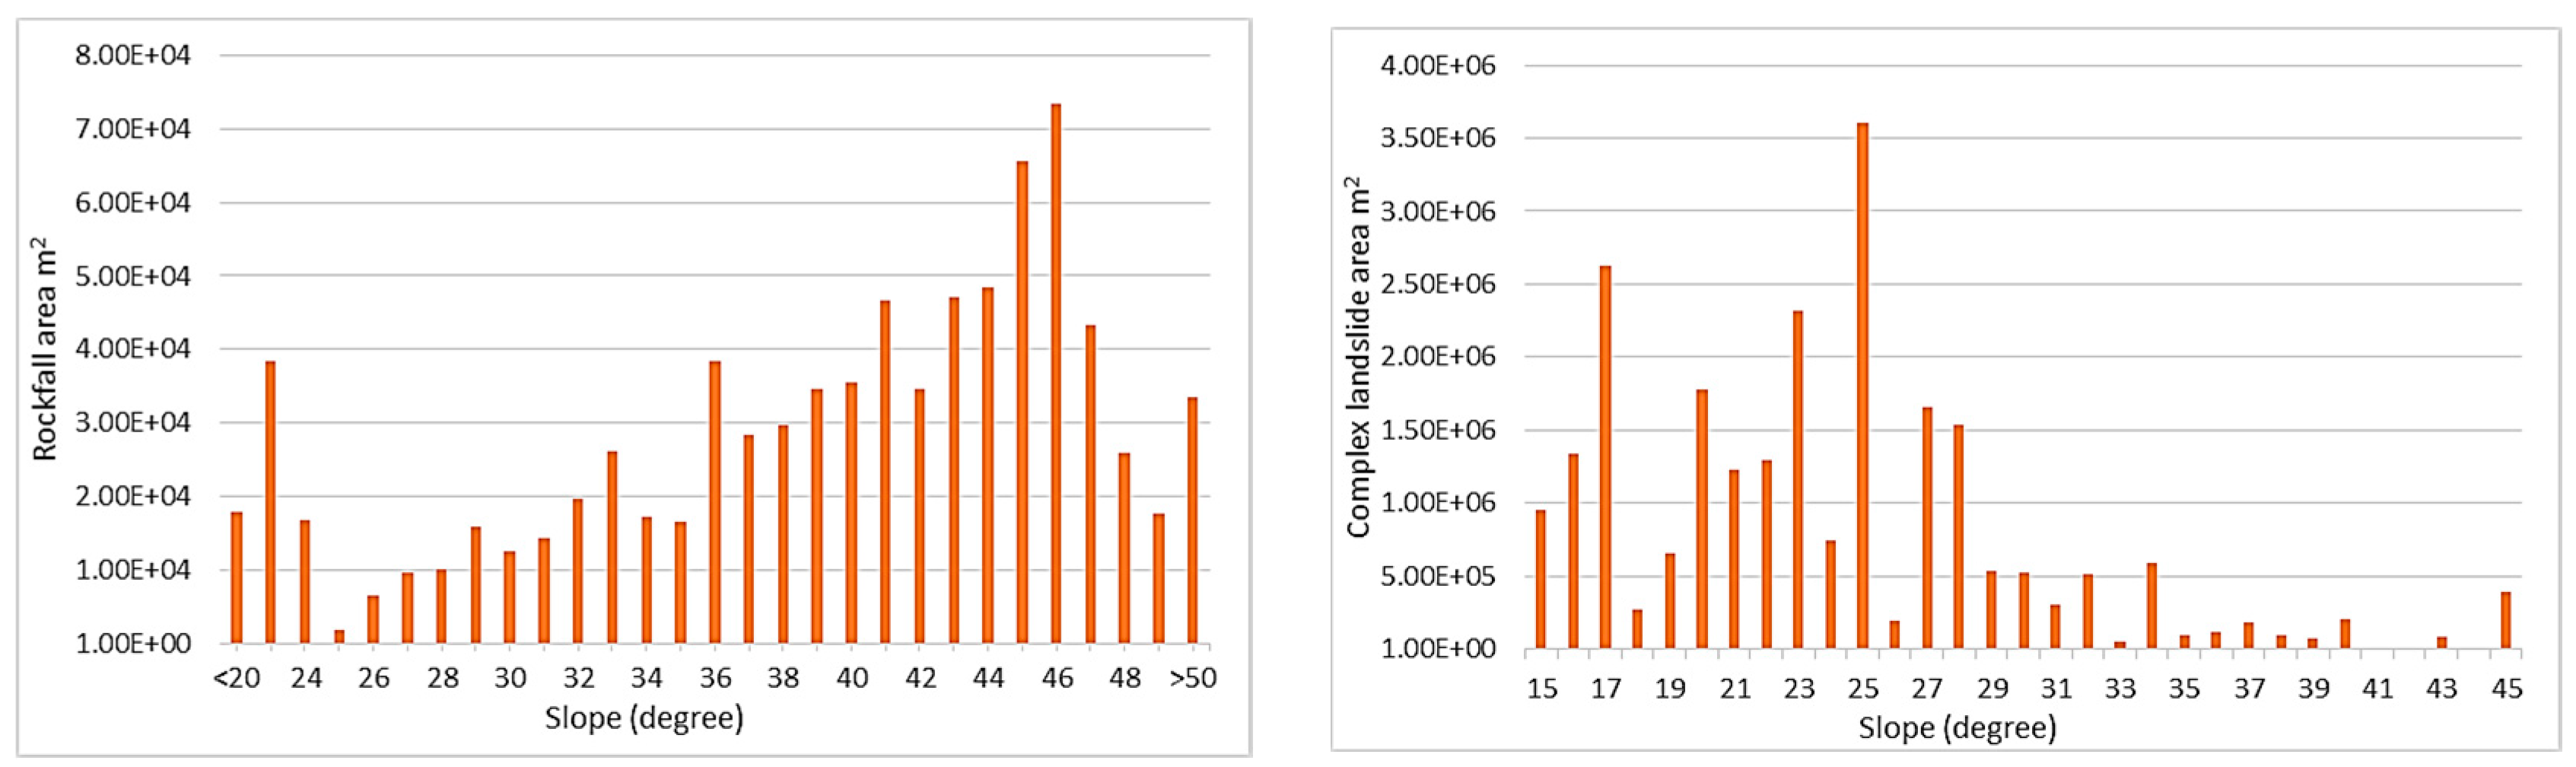
Moreover, the interaction between debris flow, rockfall, shallow landslides, and complex landslide’s prevalence and slope classes (
Figure 10) was found. The given bar charts in
Figure 10 depict different trend patterns. A debris flow’s bar chart shows a belly curve fluctuation with dominant (average) values and some outliers. The rockfall’s bar chart shows an upward trend, then declined at the end of the period, while shallow landslide and complex landslide’s bar charts experienced a decreasing trend. For example, debris flows with an area of 1.05E+04 m
2 occurs on slopes of 11°, then it increased to 1.15E+05 m
2 with a slope gradient of 28°. However, the figure showed a gradual decrease to 6.95E+05 m
2 with slopes of 29°, and continued decline steadily to the end of the graph, reaching 1.32E+04 m
2 at 45° and dropping a minimum point 7.50E+03 m
2 at 50° and above. A dominant part of rockfalls, distributed between 36° and 47°, areas and occurrence of rockfalls arise with increasing slope degree, but, after 47°, the figure shows an abrupt decrease until the end of the graph. The prevalence of shallow landslides develops on slopes from 10° to 20°, generally declining with increasing slope gradient. The slope values for complex landslides are between 15° and 45°, and most of these landslides are developed on slopes of 25°.
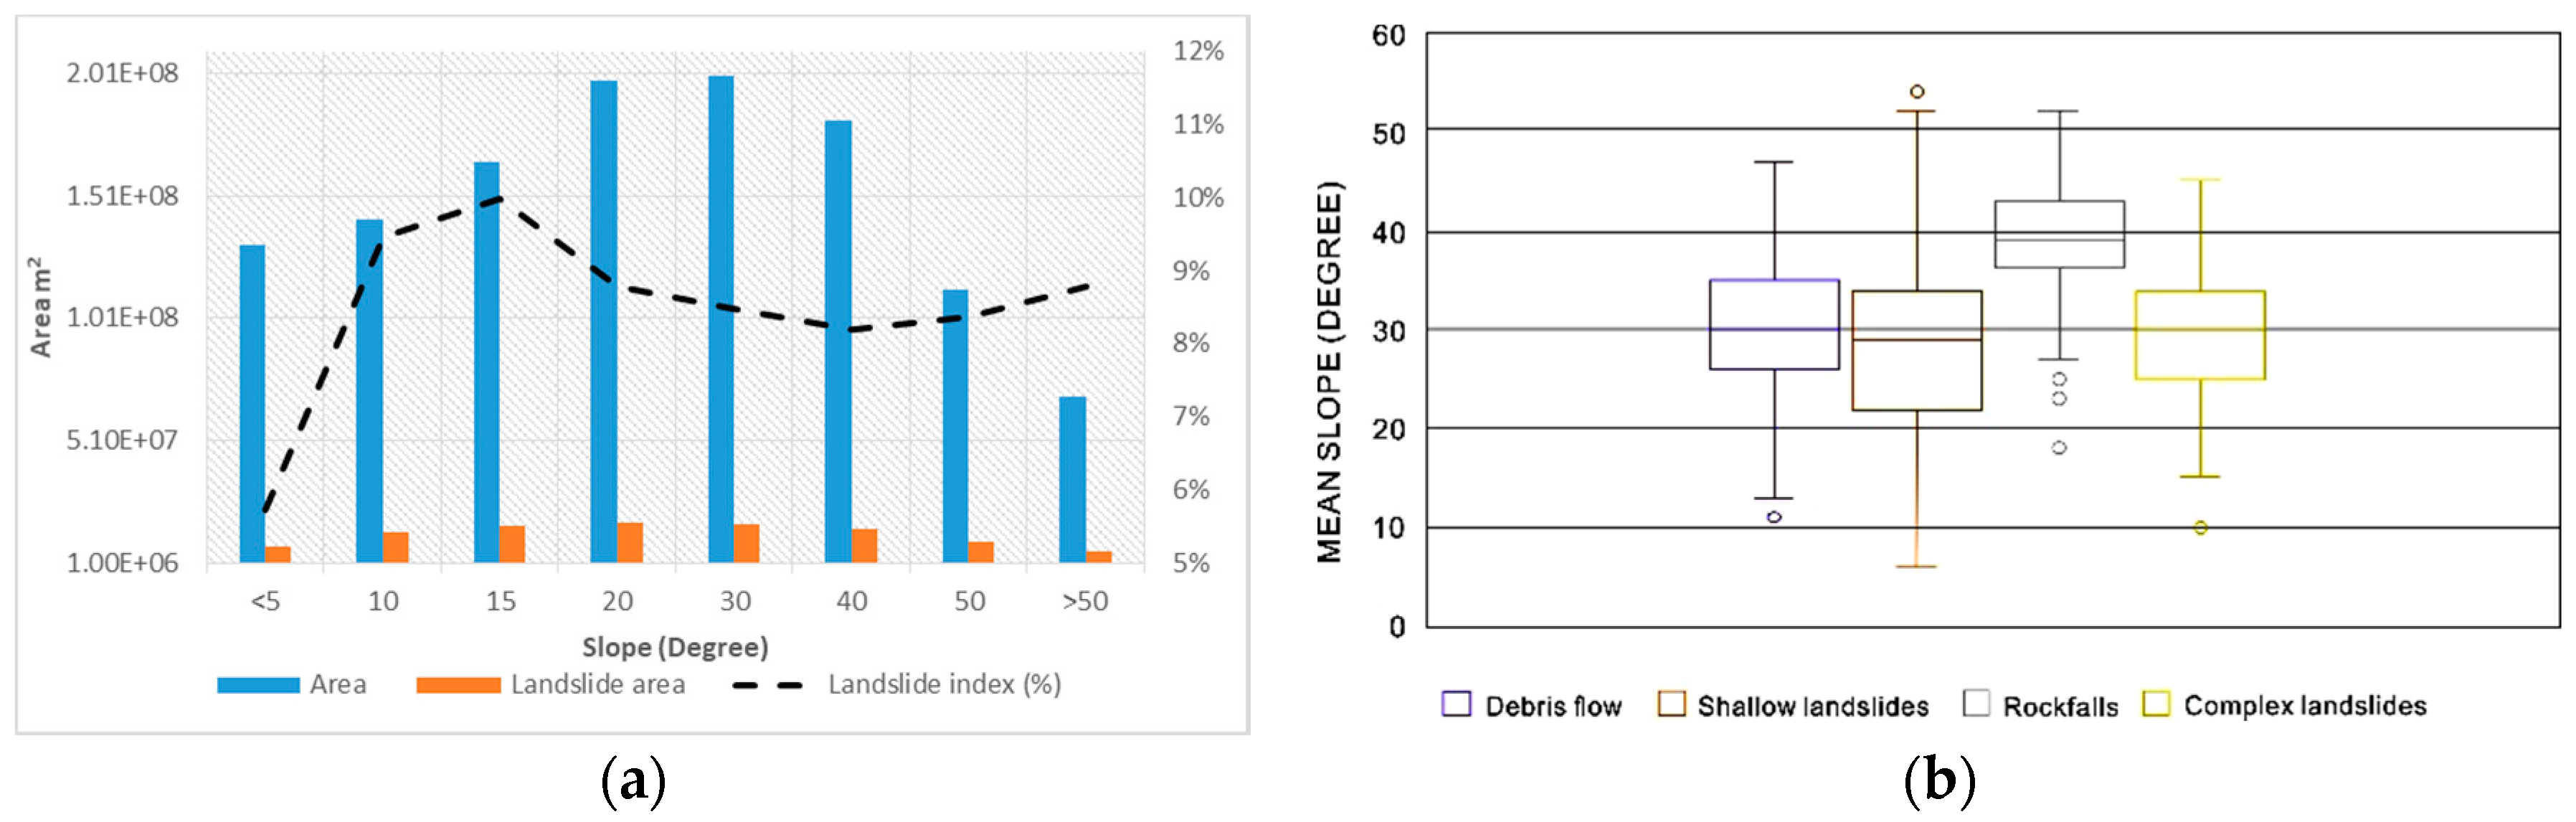
Furthermore, we have found the relationship between total area, landslide area, and landslide index (
Figure 11a,b). In
Figure 11a, the whole and landslide area’s bar chart shows the standard distribution patterns, while the landslide index trend is time-varying. Around 1.31E+08 m
2 of the study area are the relative flat zones with slopes less than 5°, and this area is barely exposed to landslides. Then the landslide area reaches its peak of 1.70E+07 m
2, at 30° slopes, with a total surface of 2.00E+08 m
2 before steadily declining, hitting a low point of landslide area at 6.05E+06 m
2, with a total area oft 6.88E+07 m
2 and slope gradient more than 50°.
That said, the average landslide index value was about 6% in areas with slopes less than 5°. The landslide index’s rate increased to 10% for 15° of slope gradient, then decreased to 8% from 15° to 40° classes of slope gradient; nevertheless, there was a growth of 9% in the areas with a slope higher than 50°. Besides, the box plot of the average inclination of each landslide in the study area (
Figure 11b) shows that the mean slope values of landslides are between 30° and 40°. Thus, slope angle is an essential factor influencing slope stability, and the frequency of its occurrence is maximum between 30° and 40°, then landslide occurrence decreases with increasing steepness.
5. Discussion
Our landslide inventory was carried out by utilising ESRI ArcGIS 10.2, with data obtained from field survey, historical landslide catalogues, and satellite images, and G.E. used to digitise and perform spatial analysis. In addition, DEM was derived from the ALOS-PALSAR dataset of the Hissar–Allay region. The inventory map is helpful in susceptibility, hazard, and risk evaluation of landslides in the study area. The combination of remote sensing tools, historical data analysis and field investigation allowed us to identify and characterise four types of landslides, including shallow landslides with an area of less than 5.58E+05 m2.
Moreover, this study focused not only on landslide identification and documentation but also on landslide distribution analysis, considering slopes’ inclinations and geological formations. Thus our findings can be used as a primary source in the regional scale land use management. Previous studies of landslides in the Hissar–Allay region were conducted on a local scale considering individual basins or slopes, making it unsuitable to use their outcomes in regional-scale landslide hazard and risk assessment and land use management.
We acknowledge that our landslide inventory map has technical limitations. For example, we could not indicate all existing landslides of the study area, and the map should be updated with each new study. The incompleteness of the data lies in the historical source data, which depend on the skills and experience of the researchers, the goals and scope of the project, the completeness of a study and the reliability of the available information; often these data were impossible to use due to poor-quality documentation of landslides during inventory. To alleviate these disadvantages, we have used a combination of remote sensing techniques with a field survey, which represents the optimal solution for landslide detection and mapping in different geological, geomorphological and climatic terms.
Thus we created the first regional-scale landslide inventory map, which includes information about the distribution of 922 landslides along the highway corridor in the Hissar–Allay region.
6. Conclusions
The section of the Hissar–Allay mountains are located in the central part of Tajikistan covers 1270 km
2 has been chosen as a study area to develop a landslide inventory. The site has a vital role in Tajikistan’s economy. Many recreations, settlements, and major roads are located in the area, so the study zone has been experiencing rapid development, leading to dislocations and landslides. Performed landslide inventory mapping shows that 8.24% of the total study area are affected by landslides. Landslides were classified according to Varnes classification [
30].
Our findings show that along the highway corridor in the Hissar–Allay region distributed 96 bodies of deep-seated landslides, 216 rockfall catchments, 273 debris flow catchments, and 313 shallow landslides. Thus, shallow landslides are the most frequent type of movement. Also, a predominant number of shallow landslides developed on slopes with degree 10–20° (
Figure 8 and
Figure 10); on the other hand, we denoted a small number of deep-seated landslides, yet, these gravitational processes occupy a significant percentage of the surface, relative to the rest of the detected landslides.
Landslide frequency-area distribution was calculated for four types of landslides. Shallow landslides are frequent, with an area of 1.88E+04 m2; most frequent debris flow channels have a place of 5.58E+05 m2; rockfalls, for its part, are rife with an area of 1.50E+05 m2, and frequent complex landslides have an area of 4.70E+06 m2.
Also, slopes consisting of Silurian formations, comprised of shales, pebbles, sands, loams, limestones, and metamorphic clays, are exposed to landslides more than other geological formations because of their layered structure and their broad spatial distribution in the study area. Furthermore, high landslide indexes were received for complex landslides, and low values of landslide index we obtained for shallow landslides. Thus, comparison indices considering slope degree allowed to find landslide types in which the data collected have been underestimated or inaccurate. Therefore, it will be essential to update data in the inventory map in the future.
Activation of debris flow and shallow landslide events are often linked to rainfall seasons during spring and autumn, while rockfalls and deep-seated landslides release because of seismic activity.
Also, all data were digitised and stored in the ArcGIS database. Thus all information about landslides distribution, location, volume, area, geological complexes, slopes direction, inclination, etc., will be helpful for future studies on landslide susceptibility and hazard mapping, as well as support for local land use planning, civil protection and landslide hazards mitigation strategy from many points of view.
Author Contributions
Conceptualisation, A.U. and H.K.; methodology, A.U.; software, A.U. and M.K.; validation, A.U., H.K. and M.K.; investigation, A.U. and M.K.; resources, M.R.; data curation, M.R.; writing—original draft preparation, A.U.; supervision, H.K.; project administration, H.K.; funding acquisition, H.K. All authors have read and agreed to the published version of the manuscript.
Funding
This research received no external funding.
Institutional Review Board Statement
Not applicable.
Informed Consent Statement
Informed consent was obtained from all subjects involved in the study.
Data Availability Statement
All data and material are available in the main text or incited resources mentioned in the text.
Acknowledgments
An article on the landslide inventory map of the Hissar–Allay mountains, central Tajikistan, was carried out as a part of the first author’s PhD studies at Engineering Geology section, Institute of Mountain Hazards and Environment, Chinese Academy of Sciences, China. The authors would like to thank the anonymous reviewers for their detailed and valuable comments and suggestions to revise the manuscript.
Conflicts of Interest
The authors declare no conflict of interest.
References
- Jiménez-Perálvarez, J.D.; Irigaray, C.; El Hamdouni, R.; Chacón, J. Landslide-susceptibility mapping in a semi-arid mountain environment: An example from the southern slopes of Sierra Nevada (Granada., Spain). Bull. Eng. Geol. Environ. 2010, 70, 265–277. [Google Scholar] [CrossRef]
- Strom, A.; Abdrakhmatov, K. Large-Scale Rockslide Inventories: From the Kokomeren River Basin to the Entire Central Asia Region (WCoE 2014–2017, IPL-106-2). In Workshop on World Landslide Forum; Springer: Berlin/Heidelberg, Germany, 2017; pp. 339–346. [Google Scholar]
- Harmon, R.S.; Doe, W.W., III. Landscape Erosion and Evolution Modeling; Springer: Berlin/Heidelberg, Germany, 2001; p. 533. [Google Scholar]
- Galli, M.; Ardizzone, F.; Cardinali, M.; Guzzetti, F.; Reichenbach, P. Comparing landslide inventory maps. Geomorphology 2008, 94, 268–289. [Google Scholar] [CrossRef]
- Korup, O.; Densmore, A.L.; Schlunegger, F. The role of landslides in mountain range evolution. Geomorphology 2010, 120, 77–90. [Google Scholar] [CrossRef]
- Alkevli, T.; Ercanoglu, M. Assessment of ASTER satellite images in landslide inventory mapping: Yenice-Gökçebey (Western Black Sea Region, Turkey). Bull. Eng. Geol. Environ. 2011, 70, 607–617. [Google Scholar] [CrossRef]
- Guzzetti, F.; Mondini, A.C.; Cardinali, M.; Fiorucci, F.; Santangelo, M.; Chang, K.T. Landslide inventory maps: New tools for an old problem. Earth Sci. Rev. 2012, 112, 42–66. [Google Scholar] [CrossRef] [Green Version]
- Ardizzone, F.; Basile, G.; Cardinali, M.; Casagli, N.; Del Conte, S.; Del Ventisette, C.; Terranova, O. Landslide inventory map for the Briga and the Giampilieri catchments, NE Sicily, Italy. J. Maps 2012, 8, 176–180. [Google Scholar] [CrossRef] [Green Version]
- Raso, E.; Mandarino, A.; Pepe, G.; Di Martire, D.; Cevasco, A.; Calcaterra, D.; Firpo, M. Landslide Inventory of the Cinque Terre National Park, Italy. IAEG/AEG Annu. Meet. Proc. 2019, 1, 201–205. [Google Scholar]
- Soeters, R.S.; Van Westen, C.J. Slope instability recognition, analysis and zonation. In Landslides: Investigation and Mitigation; Turner, A.K., Schuster, R.L., Eds.; Transportation Research Board, National Academy of Sciences: Washington, DC, USA, 1996; Volume 247, pp. 129–177. [Google Scholar]
- Guzzetti, F.; Cardinali, M.; Reichenbach, P. The influence of the structural setting and lithology on landslide type and pattern. Environ. Eng. Geosci. 1996, 2, 531–555. [Google Scholar] [CrossRef]
- Pradhan, B.; Sezer, E.A.; Gokceoglu, C.; Buchroithner, M.F. Landslide susceptibility mapping by a neuro-fuzzy approach in a landslide-prone area (Cameron Highlands, Malaysia). IEEE Trans. Geosci. Remote Sens. 2010, 48, 4164–4177. [Google Scholar] [CrossRef]
- Ardizzone, F.; Fiorucci, F.; Santangelo, M.; Cardinali, M.; Mondini, A.C.; Rossi, M.; Reichenbach, P.; Guzzetti, F. Very-High Resolution Stereoscopic Satellite Images for Landslide Mapping. In Landslide Science and Practice; Margottini, C., Canuti, P., Sassa, K., Eds.; Springer: Berlin/Heidelberg, Germany, 2013; pp. 95–101. [Google Scholar]
- Wieczorek, G. Preparing a detailed landslide inventory map for hazard evaluation and reduction. Bull. Assoc. Eng. Geol. 1984, 21, 337–342. [Google Scholar] [CrossRef]
- Guzzetti, F.; Cardinali, M.; Reichenbach, P.; Carrara, A. Comparing landslide maps: A case study in the Upper Tiber River Basin, central Italy. Environ. Manag. 2000, 25, 247–263. [Google Scholar] [CrossRef]
- Wieczorek, G.F.; Morrissey, M.M.; Iovine, G.; Godt, J. Rockfall Hazards in the Yosemite Valley. US Geol. Surv. Open File Rep. 1998, 98, 1–13. [Google Scholar]
- Cevasco, A. The phenomena of instability in the evolution of the high coast of the Cinque Terre (eastern Liguria). Studi Costieri 2007, 28, 93–109. [Google Scholar]
- Lazzari, M.; Gioia, D. UAV images and historical aerial photos for geomorphological analysis and hillslope evolution of the Uggiano medieval archaeological site (Basilicata, Southern Italy). Geomat. Nat. Hazards Risk 2017, 8, 104–119. [Google Scholar] [CrossRef] [Green Version]
- Lupiano, V.; Rago, V.; Terranova, O.G.; Lovine, G. Landslide inventory and main geomorphological features affect slope stability in the Picentino river basin (Campania, southern Italy). J. Maps 2019, 15, 131–141. [Google Scholar] [CrossRef] [Green Version]
- Savage, W.Z. Guidelines for landslide susceptibility, hazard and risk zoning for land-use planning. Eng. Geol. 2008, 102, 99–111. [Google Scholar]
- Godt, J.W.; Baum, R.L.; Savage, W.Z.; Salciarini, D.; Schulz, W.H.; Harp, E.L. Transient deterministic shallow landslide modelling: Requirements for susceptibility and hazard assessments in a GIS framework. Eng. Geol. 2008, 102, 214–226. [Google Scholar] [CrossRef]
- Di Martire, D.; Novellino, A.; Ramondini, M.; Calcaterra, D. A-differential synthetic aperture radar interferometry analysis of a deep-seated gravitational slope deformation occurring at Bisaccia (Italy). Sci. Total Environ. 2016, 550, 556–573. [Google Scholar] [CrossRef] [PubMed]
- Van Westen, C.J.; Castellanos, E.; Kuriakose, S.L. Spatial data for landslide susceptibility, hazard, and vulnerability assessment: An overview. Eng. Geol. 2008, 102, 112–131. [Google Scholar] [CrossRef]
- Sönmez, İ.; Erdi, E.; Tekeli, A.E.; Demir, F.; Arslan, M. Foogle: The fire monitoring tool for EUMETSAT’s active fire product over Turkey using Google Earth. Geomat. Nat. Hazards Risk 2011, 2, 1–13. [Google Scholar] [CrossRef]
- Paulín, G.L.; Bursik, M.; Hubp, J.L.; Mejía, L.M.P.; Quesada, F.A. A GIS method for landslide inventory and susceptibility mapping in the Río El Estado watershed, Pico de Orizaba volcano, México. Nat. Hazards 2014, 71, 229–241. [Google Scholar] [CrossRef]
- Conforti, M.; Muto, F.; Rago, V.; Critelli, S. Landslide inventory map of north-eastern Calabria (South Italy). J. Maps 2014, 10, 90–102. [Google Scholar] [CrossRef]
- Colombo, A.; Lanteri, L.; Ramasco, M.; Troisi, C. Systematic GIS-based landslide inventory as the first step for effective landslide-hazard management. Landslides 2005, 2, 291–301. [Google Scholar] [CrossRef]
- Fiorucci, F.; Cardinali, M.; Carlà, R.; Rossi, M.; Mondini, A.C.; Santurri, L.; Guzzetti, F. Seasonal landslide mapping and estimation of landslide mobilisation rates using aerial and satellite images. Geomorphology 2011, 129, 59–70. [Google Scholar] [CrossRef]
- Carrara, A.; Pike, R. GIS technology and models for assessing landslide hazard and risk. Geomorphology 2008, 94, 253. [Google Scholar] [CrossRef]
- Cruden, D.M.; Varnes, D.J. Landslides: Investigation and Mitigation. Chapter 3-Landslide Types and Processes; Transportation Research Board: Washington, DC, USA, 1996. [Google Scholar]
- Gariano, S.L.; Guzzetti, F. Landslides in a changing climate. Earth Sci. Rev. 2016, 162, 227–252. [Google Scholar] [CrossRef] [Green Version]
- Hungr, O.; Leroueil, S.; Picarelli, L. The Varnes classification of landslide types, an update. Landslides 2014, 11, 167–194. [Google Scholar] [CrossRef]
- Lipilin, V.A. Questions of the Methodology of the Engineering-Geological Study of Landslides in Tajikistan. Report on the Topic: “Geological Patterns of the Development of Landslides, Landslides and Mudslides in the Mountainous Regions of Tajikistan and Kyrgyzstan”; Dushanbe, Tajikistan, 1974; p. 250. [Google Scholar]
- Kayumov, A.; Novikov, V. The Third National Communication of the Republic of Tajikistan under the U.N. Framework Convention on Climate Change; The Government of the Republic of Tajikistan, State Administration for Hydrometeorology, Committee on Environmental Protection under the Government of the Republic of Tajikistan: Dushanbe, Tajikistan, 2014.
- Narzikulov, I.K.; Staniukovich, K.V. Atlas Tadzhikskoi Sovetskoi Sotsialisticheskoi Respubliki; Akademia Nauk Tajikskoi SSR, Dushanbe-Moskva: Dushanbe, Tajikistan, 1968. [Google Scholar]
- Mohammadi, A.; Shahabi, H.; Bin Ahmad, B. Integration of InSAR technique, google earth images and extensive field survey for landslide inventory in a part of Cameron Highlands, Pahang, Malaysia. Appl. Ecol. Environ. Res. 2018, 16, 8075–8091. [Google Scholar] [CrossRef]
- Murillo-García, F.G.; Alcántara-Ayala, I. Landslide inventory, teziutlán municipality, puebla, méxico (1942–2015). J. Maps 2017, 13, 767–776. [Google Scholar] [CrossRef] [Green Version]
- Chigira, M.; Wu, X.; Inokuchi, T.; Wang, G. Landslides induced by the 2008 Wenchuan earthquake. Sichuan, China. Geomorphology 2010, 118, 225–238. [Google Scholar] [CrossRef]
- Martha, T.R.; Kerle, N.; Jetten, V.; van Westen, C.J.; Kumar, K.V. Characterising spectral, spatial and morphometric properties of landslides for semi-automatic detection using object-oriented methods. Geomorphology 2010, 116, 24–36. [Google Scholar] [CrossRef]
- Fisher, G.B.; Amos, C.B.; Bookhagen, B.; Burbank, D.W.; Godard, V. Channel widths, landslides, faults, and beyond: The new world order of high-spatial-resolution Google Earth imagery in the study of earth surface processes. Geol. Soc. Am. Spec. Pap. 2012, 492, 1–22. [Google Scholar]
- Malamud, B.D.; Turcotte, D.L.; Guzzetti, F.; Reichenbach, P. Landslide inventories and their statistical properties. Earth Surf. Process. Landf. 2004, 29, 687–711. [Google Scholar] [CrossRef]
Figure 1.
Location map of the study area (a), scheme map of the Hissar–Allay region (b).
Figure 1.
Location map of the study area (a), scheme map of the Hissar–Allay region (b).
Figure 2.
Aspect-slope map of the study area. The left histogram shows the area (y)-slope (x) distribution, and the right histogram shows the area (y)-aspect (x) distribution.
Figure 2.
Aspect-slope map of the study area. The left histogram shows the area (y)-slope (x) distribution, and the right histogram shows the area (y)-aspect (x) distribution.
Figure 3.
A geological map of the study area.
Figure 3.
A geological map of the study area.
Figure 4.
The methodology of the study area.
Figure 4.
The methodology of the study area.
Figure 5.
Itinerary of the field survey. The blue line shows a passed route on the M-34 highway; the red points show essential sites chosen for investigation.
Figure 5.
Itinerary of the field survey. The blue line shows a passed route on the M-34 highway; the red points show essential sites chosen for investigation.
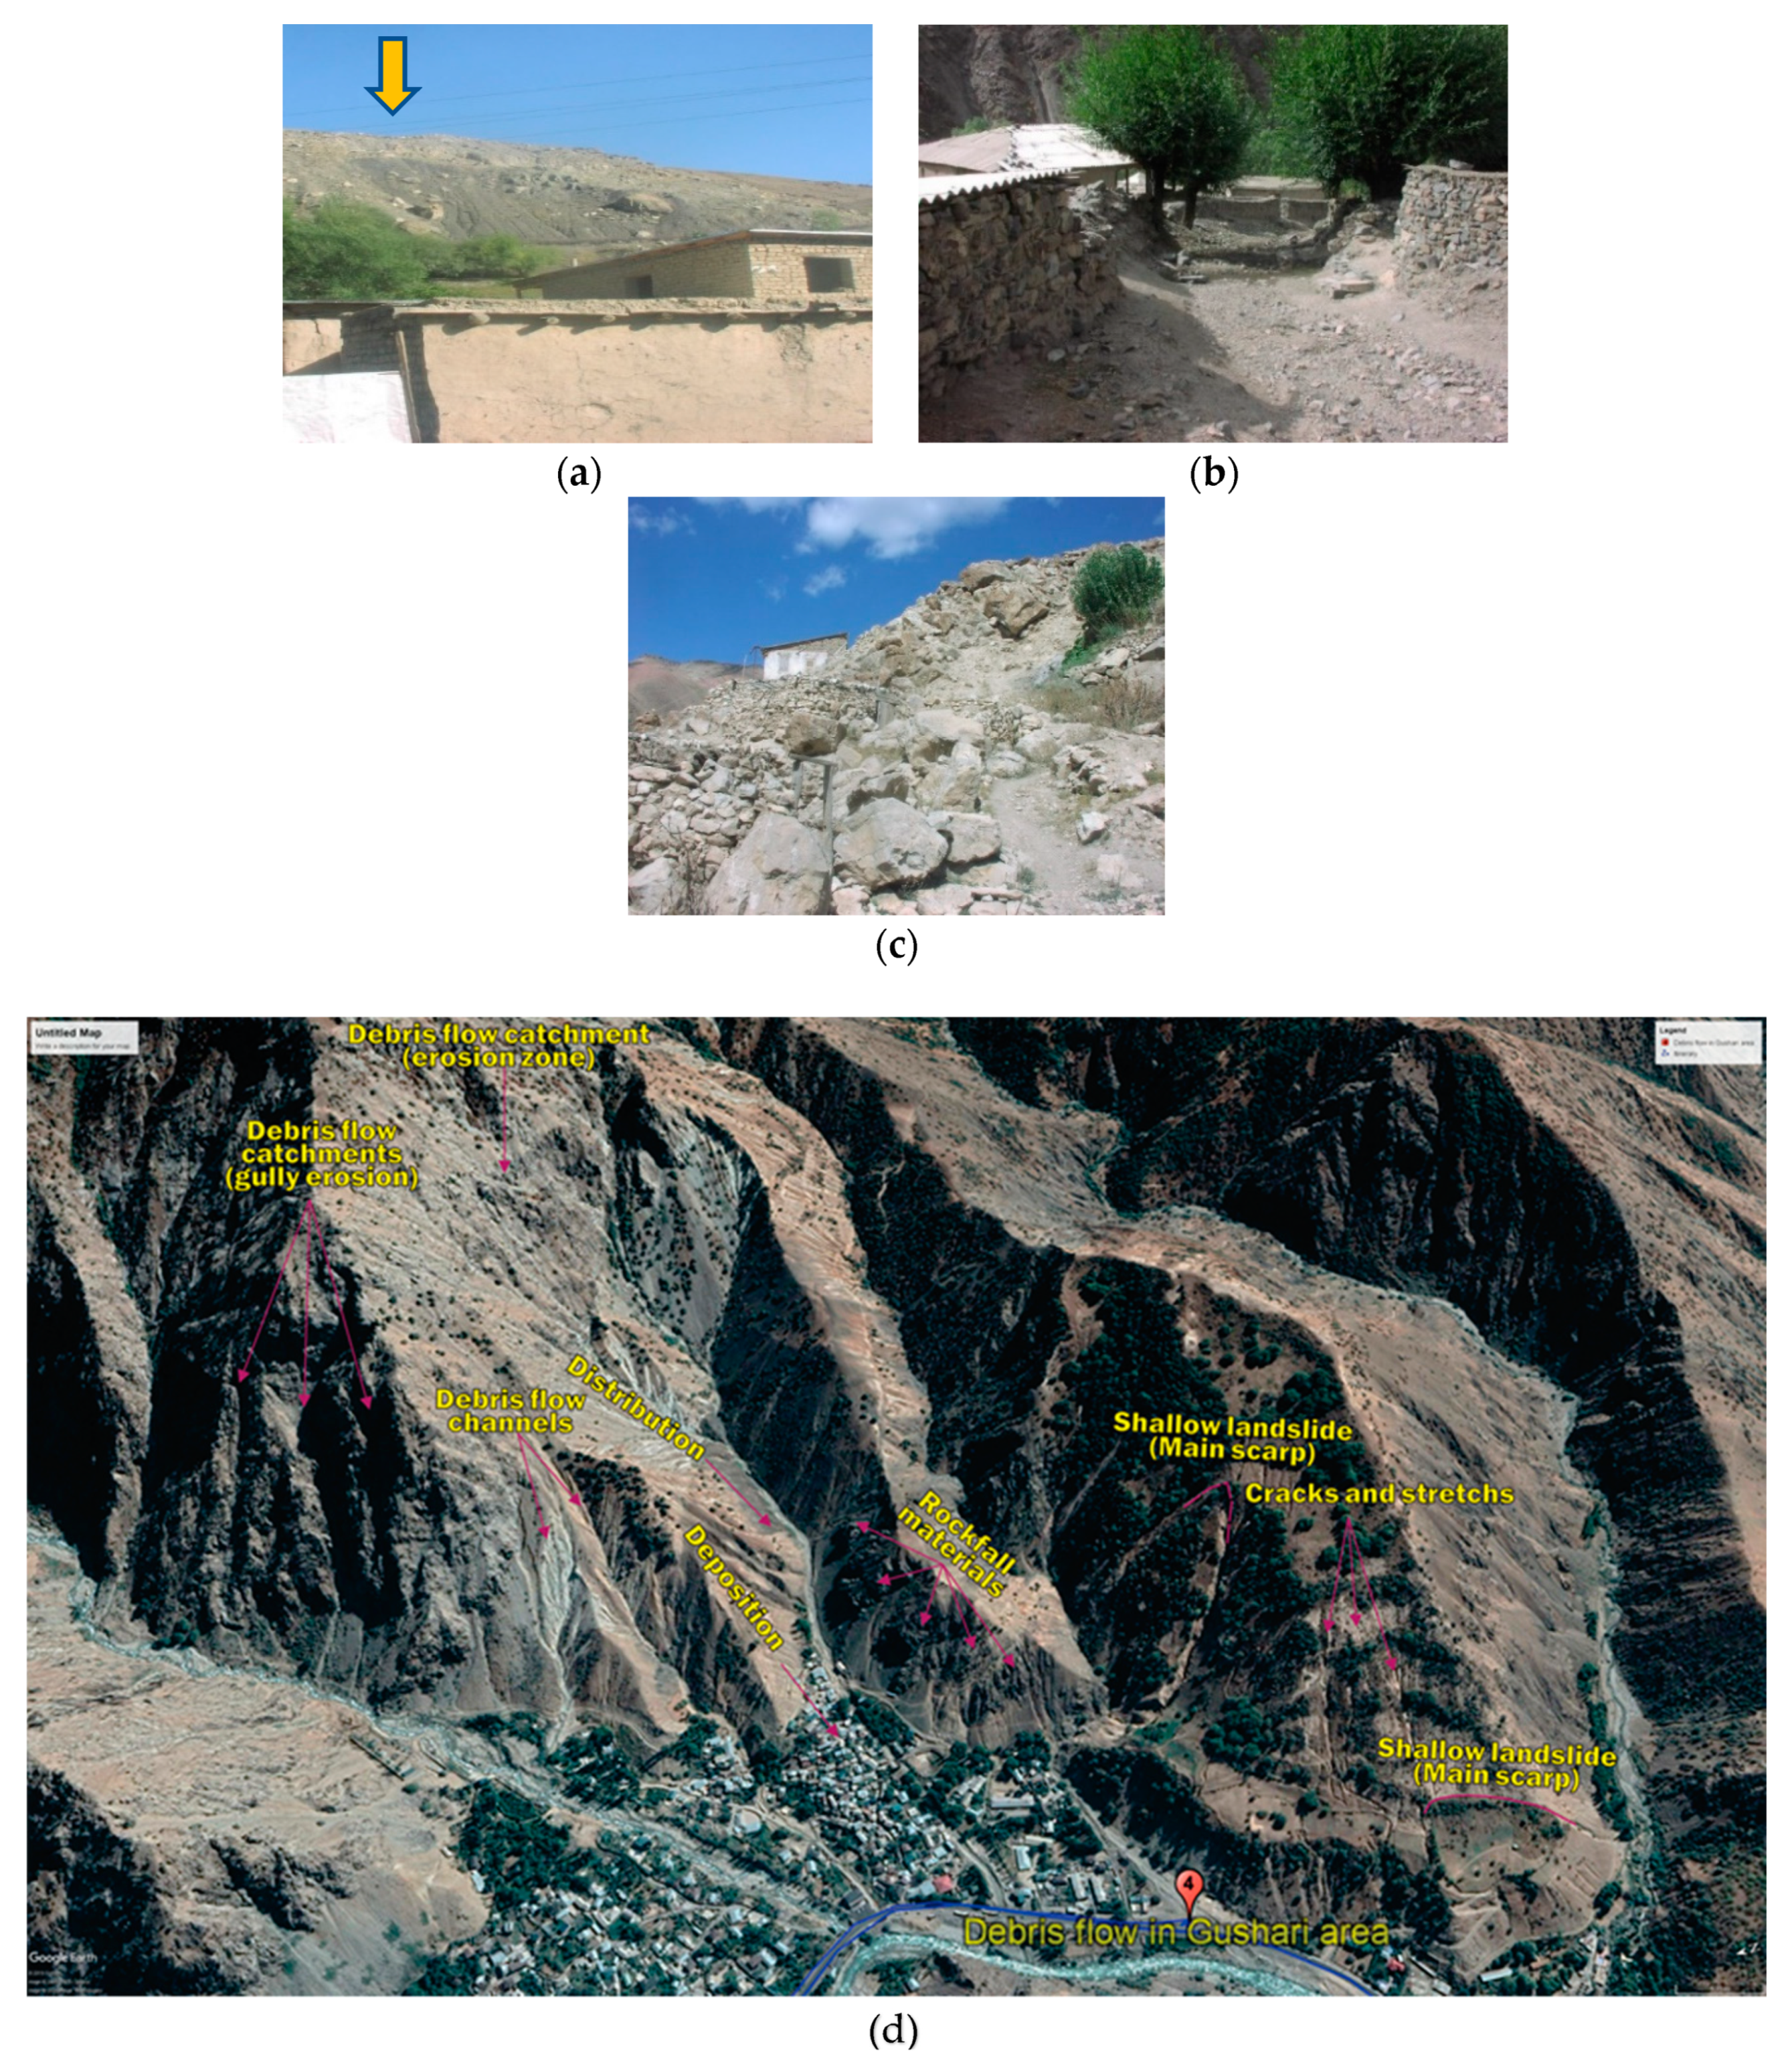
Figure 6.
Illustration of landslides revealed by field survey and using Google Earth: shallow landslide laid up above houses (a), debris flow channel passes through people houses (b), rockfall near settlements (c), debris flow channels, shallow landslides, rockfalls were defined by Google Earth in Gushari area, study zone 4 (d).
Figure 7.
Landslide inventory map of the study area (a), landslide index (%), landslide area/total area × 100 (b).
Figure 7.
Landslide inventory map of the study area (a), landslide index (%), landslide area/total area × 100 (b).
Figure 8.
Landslide distribution in the study area: distribution of the surface area of landslides (a), distribution of the number of landslides (b), percent of surface area affected by landslides concerning the total surface area (c), landslides distribution (%) by geological formations (d).
Figure 8.
Landslide distribution in the study area: distribution of the surface area of landslides (a), distribution of the number of landslides (b), percent of surface area affected by landslides concerning the total surface area (c), landslides distribution (%) by geological formations (d).
Figure 9.
Frequency-area distribution of landslides in the study area.
Figure 9.
Frequency-area distribution of landslides in the study area.
Figure 10.
Histograms of the relationship between landslide area slope degrees.
Figure 10.
Histograms of the relationship between landslide area slope degrees.
Figure 11.
Average values of the total surface, landslide area, landslide index (ratio in percentage between landslide area and total area in each slope class) for the slope gradient (a), box plot of the mean slope of each landslide for the inventory and different landslide types (b).
Figure 11.
Average values of the total surface, landslide area, landslide index (ratio in percentage between landslide area and total area in each slope class) for the slope gradient (a), box plot of the mean slope of each landslide for the inventory and different landslide types (b).
Table 1.
Distribution of the mean monthly precipitations in the study area.
Table 1.
Distribution of the mean monthly precipitations in the study area.
Meteorological
Stations
(m, above the Sea Level) | Mean Monthly Rainfall, mm | Mean Annual Rainfall, mm |
|---|
| Jan | Feb | Mar | Apr | May | June | July | Aug | Sept | Oct | Nov | Dec |
|---|
Maikhura
(1921) | 149 | 145 | 210 | 208 | 102 | 28 | 28 | 14 | 21 | 92 | 73 | 136 | 1206 |
Kharamkul
(2826) | 170 | 169 | 234 | 210 | 91 | 27 | 26 | 10 | 25 | 105 | 100 | 171 | 1338 |
Anzob pass
(3372) | 43 | 41 | 60 | 79 | 62 | 27 | 33 | 11 | 13 | 35 | 29 | 39 | 472 |
Table 2.
Distribution of the mean monthly temperature in the study area.
Table 2.
Distribution of the mean monthly temperature in the study area.
Meteorological
Stations
(m, above the Sea Level) | Mean Monthly Temperature, °C | Mean Annual Temp., °C |
|---|
| Jan | Feb | Mar | Apr | May | June | July | Aug | Sept | Oct | Nov | Dec |
|---|
Maikhura
(1921) | −9.1 | −7.2 | −1.4 | 4.5 | 10.8 | 16.0 | 18.6 | 18.2 | 13.3 | 7.1 | −0.6 | −5.9 | 5.4 |
Kharamkul
(2826) | −8,9 | −8,4 | −3,5 | 1,4 | 5,7 | 11,5 | 14,1 | 14,6 | 9,8 | 3,0 | −2,0 | −6,4 | 2.6 |
Anzob pass
(3372) | −13.2 | −12.4 | −7.7 | −2.9 | 1.0 | 6.4 | 9.1 | 9.2 | 4.4 | −1.4 | −6.2 | −10.4 | −2.0 |
| Publisher’s Note: MDPI stays neutral with regard to jurisdictional claims in published maps and institutional affiliations. |
© 2021 by the authors. Licensee MDPI, Basel, Switzerland. This article is an open access article distributed under the terms and conditions of the Creative Commons Attribution (CC BY) license (https://creativecommons.org/licenses/by/4.0/).


