Improved Concept Map-Based Teaching to Promote a Holistic Earth System View


Department of Geosciences, Environment and Spatial Landing/Unit of Science Teaching, Earth Science Institute, Faculty of Sciences of Porto University, 4150-179 Porto, Portugal
*
Author to whom correspondence should be addressed.
Geosciences 2020, 10(1), 8; https://0-doi-org.brum.beds.ac.uk/10.3390/geosciences10010008
Submission received: 30 September 2019
/
Revised: 11 November 2019
/
Accepted: 25 November 2019
/
Published: 24 December 2019
(This article belongs to the Special Issue Educating for Geoscience)
Abstract
:Like some other countries, seldom being sometimes addressed in classes, the Earth system approach is not emphasized enough in Portugal, nor is the interconnection between the geosphere, hydrosphere, atmosphere, and biosphere. To evaluate the Earth system holistic view of a group of 8th grade (13–15 years old) Portuguese students from a public school of the north of Portugal, an improved conceptual map-based to approach Earth system was investigated. After learning about concept mapping, students were asked to collaborate in the production of four conceptual maps regarding each one of the geochemical and biogeochemical cycles, further combining these maps in a common one. Through teamwork-based task, each group was asked to establish relations between the cycles, integrated into each one of the four Earth subsystems. The final combined maps demonstrated that, in the first phase, students had some difficulties in completing the pre-designed improved maps, being more evident in the rock cycle. Contrarily, the food chain cycle revealed fewer mistakes and more appropriate terms were added. In the second phase, the students exhibited difficulties in relating the cycles to the four subsystems and the remaining cycles, drawing many arrows without any kind of connecting words. Nevertheless, in general, students have realized how to build an improved concept map but do not possess a holistic view of the Earth system.
1. Introduction
Like in other countries and although centralized and top-down in nature, the curricular policies implemented in Portugal in recent years broadcast potentially innovative speeches, in line with inter-national recommendations that have arisen from research in the areas of education in science and science education [1,2,3,4]. But despite the growing importance, research for promoting attitudinal changes in teaching practice is scattered and inconsistent [5]. The implementation of new teaching strategies implies substantive changes in practices and the routines of daily school life, especially if they are not in line with expectations of parents, teachers or school principals, and with their beliefs about teaching [6]. However, despite the growing importance, research for promoting attitudinal changes in teaching practice is scattered and inconsistent [5]. On the other hand, any professional change is a challenging process to which teachers resist [7]. In accordance, the Portuguese teachers are generally reluctant to change their practices, and rather present the difficulties related to the extensiveness of the curriculum contents and the students’ negative attitudes toward science, as an excuse for not to change their classroom instructional methodologies [8]. Nevertheless, teachers’ difficulty in developing profound attitudinal change is well documented, as is the reference to the factors that promote these changes [9,10].
The scientific community is gradually recognizing the Anthropocene and Earth’s unique conditions for human survival can soon disappear. Consequently, a wiser and sustainable way to endure life on Earth is required. However, we are far from achieving the UN Agenda 2030 targets. As Lovelock explains on his Gaia Theory, the Earth’s four subsystems are the starting point for a holistic view of our planet, comprising any process that occurs as an environmental phenom [11]. The lack of a correct integration of this topic on curriculum impairs the development of an informed society, aware of the consequences of the passive and unruly manner on how humans explore the planet. Similarly, to some other countries, seldom being addressed in classes, the Earth system approach is not emphasized satisfactorily in Portugal, nor is the interconnection between the geosphere, hydrosphere, atmosphere, and biosphere. In this sense, Orion and Fortner created a practical model to develop an Earth system approach in science education, whose success depends on the students’ holistic ability to think, based on four geochemical and biogeochemical cycles: water, rock, and carbon cycles and food chain, considering their interrelationships and mass and energy fluxes [12]. Conceptual mapping was produced by Novak’s research program, at Cornell University in the 1970s, following Ausubel’s meaningful learning theory, as a powerful tool for knowledge representation. It consists of concepts inside boxes connected by other words—”linkers”, forming a statement. Conceptual mapping has been evolving since then, adopting a loosened structure, towards a closer representation of each student’s inner thoughts and its construction. This new view has been coined as an improved method of concept mapping [13,14,15]. Supported in Orion and Fortner practical model [12] and in a concept map-based teaching, a study was carried in a Portuguese public middle school to promote a holistic Earth system view on students and expecting attitudinal change in teachers’ methodologies.
2. The Anthropocene
Humanity has always affected the Earth’s planet. However, nowadays, the impacts of anthropogenic activities such as pollution, deforestation and fossil fuels’ consumption, associated with the exponential population growth, create a huge concern. The atmosphere composition is changing, by the increase of greenhouse gases concentration, leading to changes in climate conditions and in many other ways outcompeting natural processes. Nonetheless, climate changes are only the tip of the iceberg [16]. Due to the large impacts of humans in the global environment, a new human-dominated geological epoch was introduced: the Anthropocene—proposed (not yet fully accepted by the geological scientific community) by Paul Crutzen and Eugene Stoermer in 2000. The Anthropocene may have begun about two centuries ago, upon the invention of the steam engine by James Watt [17,18]. These authors defend that the human’s impacts on the planet were significant enough to justify the end of Holocene and the recognition of Anthropocene as a new geological epoch [17,19].
In 2015, to pursue sustainable development in all nations, the General Assembly of the United Nations developed the 2030 Agenda for Sustainable Development [20]. The seventeenth sustainable development goals attempt to promote the prosperity of the countries while protecting the planet, recognizing that ending poverty must go together with strategies that improve economic growth. They focus on a range of social needs including education, social protection, health, and job opportunities while undertaking climate change and environmental protection. The target of achieving global sustainability is to meet society’s present requirements by using Earth’s natural resources without jeopardizing the needs of future generations [21]. Nevertheless, to identify appropriated paths towards sustainability, scientific knowledge is essential. It must come from an extensive scope of both disciplinary and interdisciplinary research, across the economic, natural, social, engineering, and science fields [22].
During the last decades, scientific understanding of Earth changed drastically, and scientists are now studying Earth’s aspects as an integrated planetary system, realizing that human activity has an influence in that system in essential ways [23]. Acknowledging Earth as an integrated system of multiple components and processes is the main paradigm in Earth and space science research nowadays [24].
The Earth System was defined by Frank Oldfield and Will Steffen (2004) as a materially closed system that has a primary external energy source, the sun. Its major dynamic components are a set of interlaced physical, chemical, and biological processes that transport and transform materials and energy within the system. The biological and ecological processes within this system are an integral part of its functioning, not simply passive respondents, therefore, human beings, their activities, and societies are an integral part of the Earth system, not an outside force that perturbs a natural system [25].
According to Mayer (1997), our world has changed. Hence, science and the science curriculum must change as well. Mayer (1997), understands that the improvement of the knowledge in the climate system and ways to enhance its disruption. The understanding of how to use natural resources more effectively and the improvement of the knowledge base, regarding the impact of technology on society and practices that lessen its negative influences, are the new priorities in science [26]. Thus, science educators must develop science curricula that correspond to these changes in national priorities for science.
2.1. Earth System Approach
The efforts to draw attention to the need for changing began with the Earth systems education program at The Ohio State University of Northern Colorado [27]. Earth system science comprehends the spectrum of subjects that are concerned with understanding how the Earth’s systems operate and interrelate with each other [28]. In a time where catastrophes disrupt the quotidian of people around the globe, it becomes vital to have a curriculum where it is possible to understand that changes in one subsystem do not only influence that subsystem but the Earth as a whole. Thus, in the past decades, science education has changed its purpose—”from preparing future scientists towards the education of the future citizens” (p. 99) [29].
Despite all the educational reforms, Earth science has a low scale in school science curricula around the globe, because science is yet seen to strengthen a nation’s economy and military (Orion, 2007). Therefore, to change this way of seeing science, it is important to shift this view “from a narrow perception of science education towards a more holistic perception in terms of social purpose of science education, scientific contents and educational approach” (p. 100) [29]. This approach to the subject and design of science curricula is based on efforts between the science and the science education communities [26]. The science education community emphasized the need to improve and integrate the science curriculum and the approaches used to teach science. On the other hand, the science community provided a conceptual structure of the Earth as a system composed by interacting subsystems, in a report developed by the Earth Systems Science Committee (1988) [26,30].
One of the main aims of education is preparing students to be informed citizens that can participate consciously in the society, leading to an environmental concern with the consequences of human actions [31]. This is possible through a holistic view of the Earth’s planet approach making it understandable that one action in one subsystem affects all others. A way to achieve this view is through an inquiry-based teaching approach that, as stated in the literature and defended by the National Science Education Standards, is claimed to be a powerful way to teach science with the application of many different strategies [32]. The Earth system approach has been developed worldwide, but in Portuguese Natural Sciences’ classes, it continues to be taught in a very theoretical way, namely, to prepare students for exams. As such, there is a gap in the practical application of the contents, as well as in the perception of the relation between concepts. An ideal way to a holistic framework for science curricula is the Earth systems approach [29]. The study of cycles—the rock cycle, the water cycle, the food chain, and the carbon cycle—organizes Earth systems education, highlighting the relationships among subsystems, through the transfer of matter and energy based on the laws of conservation. In the Earth system approach, the teaching process is organized in terms of systems and cycles as experienced in peoples’ lives, developing environmental insight in students [29], which is an important trait in citizens, who are expected to decide about policy and lives tangled with a changing planet [28].
In science history, there are several examples of the need to develop new tools to understand how concepts are understood and represented [33,34]. Concept maps are currently a powerful tool of knowledge representation and are used not only in education but also in various areas of human activity. Although not elaborated to develop scientific rationale or to mirror the activity of the scientists, improved concept maps are referenced in the literature, as important instruments of knowledge representation. These maps allow students to understand the relations between concepts by creating a virtual map of relationships, and can be used to promote a holist view of the Earth system.
2.2. Elaborated Concept Maps
Ever since the human being started to pursue the understanding of its environment, it became necessary to exchange knowledge, while integrating a society, as reliably as possible, a process also known as knowledge formalization. Immediately, a need for making knowledge explicit, less ambiguous, facilitating its communication and management, emerged as well [34,35]. This characterizes what is now termed as knowledge management, including knowledge representation and visualization, which have been evolving over the years to reach the requirements imposed by different purposes and types of knowledge, resulting in many conceptual approaches [33,34].
Even though the most rudimental evidence for the usage of knowledge representation as a way of communicating and learning dates back to the 13th century, modern technology fostered the growth of the knowledge representation field [36]. However, knowledge representation, born as support to complex information systems, is very formal in nature, often implying expert computing and artificial intelligence [33,34]. Knowledge visualization emerged mostly related to social sciences and covers rather easier and more practical methods to support human interpretation, communication, and collaboration, facilitating knowledge progress. These are generally referred to as graphics-based methods, i.e., all graphic means or conceptual tools which use real or conceptual entities to construct and convey different complex insights, facilitating the understanding of an (undefined) idea. The visualization formats often include visual metaphors, knowledge maps, and concept diagrams [33,34,37].
Two tools have been standing out among educators and integrating research works on science education, for the last fifty years: mind mapping and concept mapping. Both of them materialize not only a visualization format but also knowledge integration. Such an approach echoes our inner thoughts and its construction. Therefore, these tools are in close association with the grand theory of constructivism—learners are not “blank slates” but hold a wide repertoire of alternative conceptions and thoughts [15]. In line with this, Ausubel proposed his learning theory, endorsing the importance of knowledge already acquired to understand and integrate new knowledge (concepts and propositions), in a meaningful learning process [13,14]. Following his work with Ausubel, Joseph Novak embraced this ideology to come out with his idea of concept mapping [15,38].
While working on a project dedicated to follow and understand children’s knowledge development in science at Cornell University in the 1970s, Novak applied for the first time such graphical tools for organizing and representing systematically, which already comprised concepts and connecting lines between them, but missed a linking word [15,39]. The “Novakian standard concept mapping format” appeared later, after the remarkable work conducted by Novak and Gowin [38], which spread worldwide and included concepts, typically enclosed in circles or boxes, and linked through one solid line, which in turn was associated with linking word(s), mainly very short verbal labels. This typifies a relationship between both concepts and constitutes a meaningful statement created out of concepts, named proposition.
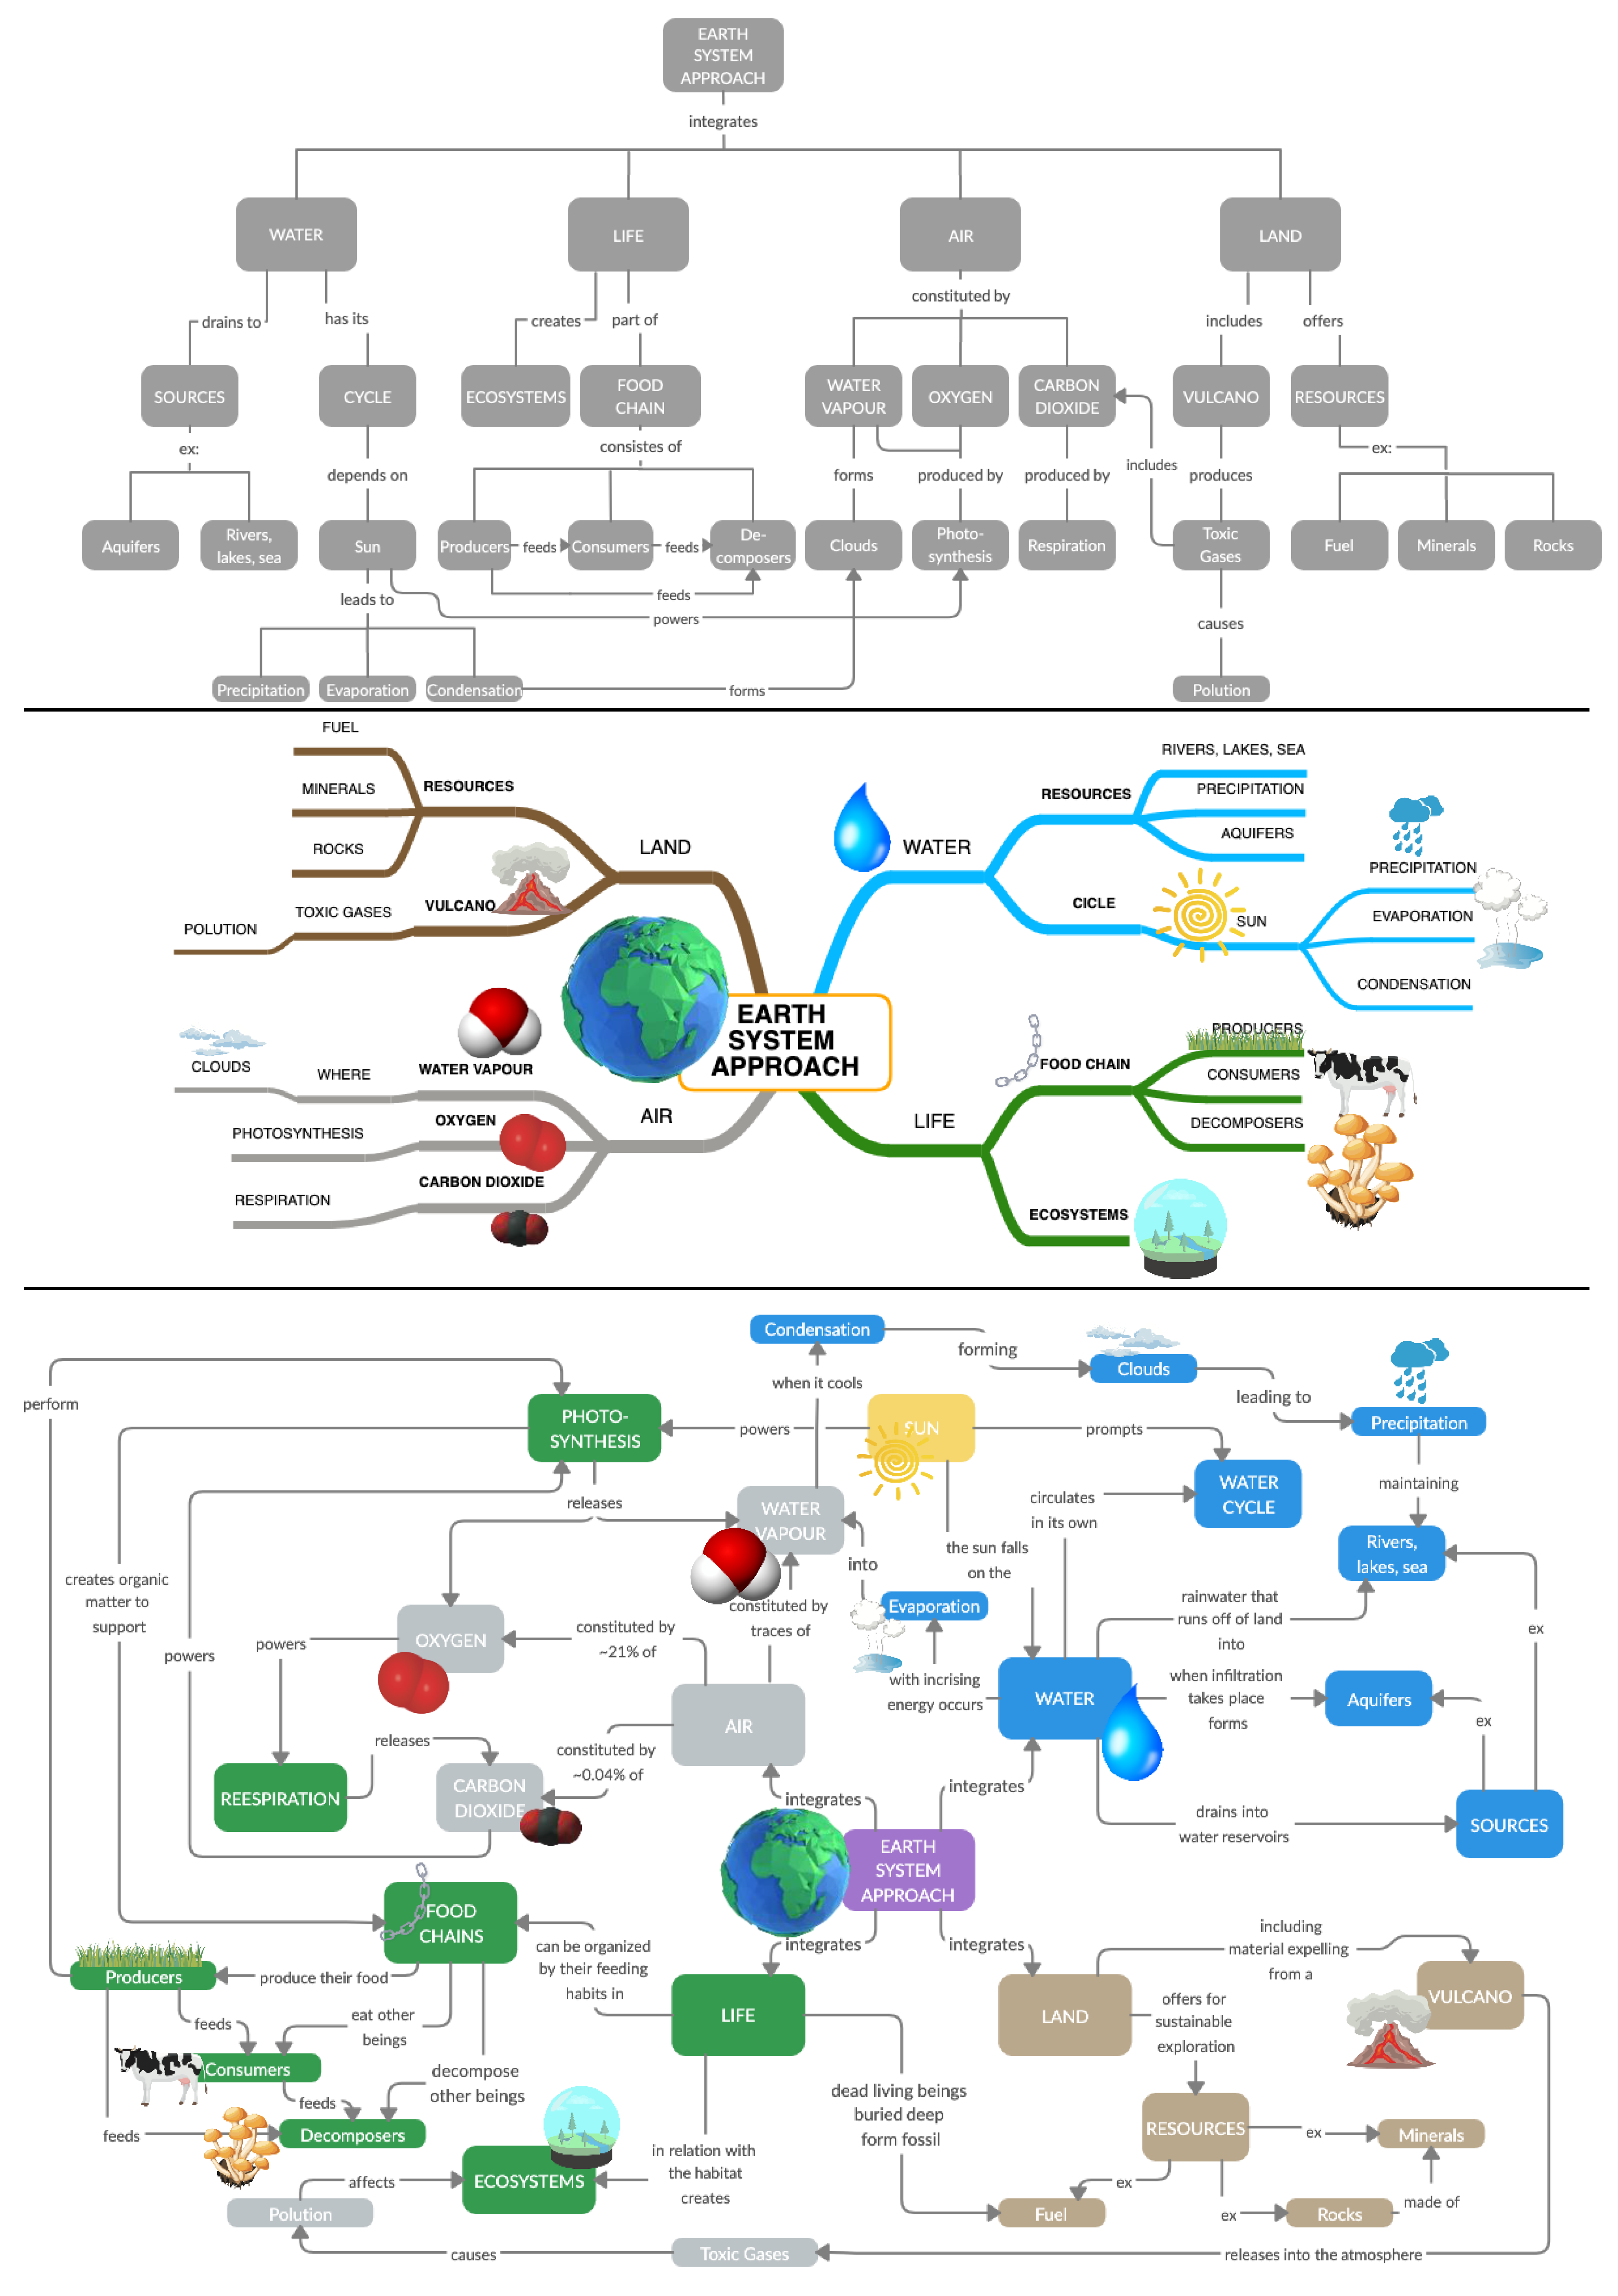
The Novakian standard format also requires that the construction of maps have to obey a hierarchical order, with the most general concepts at the top of the map and the most specific below. In an initial conception, only the concepts in a causal relationship that were either horizontal or were to be read upwards should present an arrowhead, and sometimes a dotted line would be added to represent a secondary, weak, or missing relationship. Furthermore, each concept may be mentioned more than once in the same conceptual map, and pictures, videos or sounds are constitutively absent (Figure 1, upper) [38,40].
Even though the Novakian concept mapping stands out as the most common option amongst educators, its predefined structure is frequently disregarded, as many maps that include encircled linking word(s) together with concepts, for example, are still referred to as concept mapping [41]. It is not rare to find Buzan’s mind maps mistakenly confused by concept maps in the literature [42,43]. Mind mapping follows a process that always begins with a central image or main topic that is developed by adding ideas on branches that sprout in all directions in the pattern of a tree diagram until it reaches a saturation point at each level (Figure 1, middle). Both concepts and possible links are assigned together, following each branch. A specific variant of mind mapping designated “spider maps” [44,45] is sometimes applied as a map with a general concept in the center and with links coming out resembling spokes of a wheel.
In a Novakian standard format, there are some unnecessarily complex rules, which do not allow for a truly personal representation of a creator’s mind. Following Novak and Gowin’s work, other variations started to appear, dropping the hierarchical structure and adopting a loose and less restricted organization [46,47]. Novak has been introducing alternative ideas about concept mapping, giving a better knowledge representation [48]. Overall, the improved concept mapping has been well described by Ahlberg and differentiated from previous conceptions. It is considered to be a learning method as general as writing or speaking [41,49].
The world is a whole integrated system that comprises smaller and interdependent subsystems, for which the best conceptual representation may not always be hierarchical and following a top-down structure. In a conceptual map as a conceptual system, the foremost concept occupying the central position is not mandatory, as long as there is a valid justification. Nevertheless, all concepts are kept inside frames and should be interpreted as the main elements in the process of thinking and learning. Furthermore, these are never repeated unless a good explanation is advanced, much like a geographical map [49].
There are always links connecting concepts that can be as short as a conjugated verb or longer as a whole sentence, together with arrowheads indicating in which direction the connection concept-concept is to be read [41,49] (Figure 1, lower). Both concepts and words or expressions connected as links may be short or long, once there is no limit as long as it accurately expresses the inner thinking process of the author, obtaining meaningful propositions to be readily understood, mostly by the author himself/herself [49]. To achieve this, one may as well connect different colors, pictures (see Figure 1, lower), videos, sounds, or any other associated content [41,50,51].
Although concept maps were initially addressed as an individual construction [52], different approaches, contexts and proposes led to a variety of other maps being produced, spanning from knowledge evoking and perpetuation [53]. It includes the identification of conceptual change, to knowledge management [54], specifically assisting students on the diagnosis of their misconceptions and restructuring their knowledge. In addition to teaching [55], concept mapping can also be applied for assessment [56]. Finally, it may also be developed as a collaborative task, integrated into a group [57], which fosters communication and knowledge sharing (Figure 1). For each different map, a distinct construction technique may be selected, either using paper and pencil or digital/online tools, such as the Novak’s CmapTools software [51].
Concept maps represent a powerful way to trigger interesting new ideas through the development of abstract and creative thinking, enabling the improvement of both teaching and learning processes, achieving higher levels of cognitive and critical thinking as well [58].
Herein, we propose the usage of concept maps pre-constructed but designed to be completed and further integrated and extended by students in a team-group, to evaluate their capacity to think systemically according to the Earth System Science.
To develop the present study, the research team elaborated a reference map used to evaluate student’s performance and to teach them, at the end of the experience, how to fill the map and established relationships between them and the Earth subsystems (Figure 2).
3. Methodology
This case study analyses the holistic view of the Earth System in 8th-grade Natural Sciences Portuguese students, through the development of conceptual maps of the rock cycle, the water cycle, the food chain, and the carbon cycle.
Before the application of this study into the school, a pilot study was carried out with six students from another school: five girls and one boy with a mean age of thirteen years, attending the 8th-grade. The pilot study was developed to evaluate the appropriation and comprehension by students of the elaborated concept maps.
The task required in both pilot and experimental studies was for students to elaborate the four cycles (the rock cycle, the water cycle, the food chain, and the carbon cycle), and to established the correlation between the cycles and the four Earth subsystems (Biosphere, Geosphere, Atmosphere, and Hydrosphere).
The application of the experimental study was carried out by four teachers in training in a school with a protocol with the Porto University. No specific ethical measures were taken, since the protocol already stablished an agreement between both the University and the middle school. Nevertheless, students from the experimental group (n = 83) were explained about the worked that was being carried on and informed consent was given. A volunteer participation was requested and confidentiality was assured. Following an ethical procedure, at the end of the study the reference maps (Figure 2) were presented to the three classes, as well as the various ways of interconnecting them with Earth subsystems.
Qualitative content analysis with a descriptive statistic study has been done to analyze the maps made by the students.
3.1. Problem and Objectives
The research problem was to verify if the traditional teaching of the Natural Sciences in 8th-grade classes allows the development of a holistic view of the Earth system. Two main aims were established: (i) to analyze the reductionist vision of the Earth system of the 8th-grade students; and (ii) to promote the holistic view of the Earth system through improved conceptual maps.
3.2. Sample
A characterization of the sample is presented in Table 1.
The research resort to a convenient sample comprised of 83 students of three classes from the 8th-grade of a middle school located in the city of Porto, with ages from 13 to 15 years (average age of 14 years).
3.3. Instrument
To evaluate the Earth system holistic view of a group of Portuguese Natural Sciences students from the 8th-grade, four improved conceptual maps of the cycles of water, rocks, carbon, and food chains were elaborated by the research team. These conceptual maps had missing spaces that should be completed by students with concepts provided in a list.
As such, the sample was presented with the preconceived concept maps and students were asked to fill in the blanks with the correct concept from the supplied concept list.
3.4. Procedure
Data were collected in three classes of 8th-grade of one middle school in the city of Porto. After organizing the students in groups of four (although there was a group of three students), the procedure was divided into two parts.
Stage 1: To study how students understand the four cycles (rock, food chain, carbon, and water) that they already learned, each element, of each group, complete a conceptual map pre-constructed of one cycle so that each group accomplishes the four cycles. These pre-constructed maps have some pictures and concepts already filled to facilitate and reduce the time of accomplishment since the lesson was 50 minutes long. Moreover, in each corner of each map was one of the four subsystems terrestrial, biosphere, geosphere, hydrosphere, and atmosphere, so that at a later stage the maps could be overlapped, and links established between them. The students took an average of 20 minutes to individually place each of the concepts present in the column in the blanks of their conceptual map. The research team was available if students had any questions and to keep them on task.
Stage 2: Each group has again about 20 minutes to connect each cycle to the four terrestrial subsystems—atmosphere, hydrosphere, geosphere, and biosphere—and add the connections that seem necessary to them. After this, to verify if the students have a holistic representation of the earth system, they had to interconnect the four cycles. This stage mainly focused on the identification of students’ capacities to deal with systems perception. In terms of the system thinking approach, we can call this stage the analysis of the learning environment.
After the two steps, the improved concept maps elaborated by the students were collected and analyzed qualitatively. In the end, the reference maps were presented to the three classes, as well as the various ways of interconnecting them.
4. Results
Since concept maps supply a graphic representation of individual knowledge structures, quantification of the maps is still a controversial issue. The scoring suggested by Novak and Gowin (1984) uses several criteria such as the significance and number of links between concepts, the extension to which the map exhibit an appropriate hierarchy among the concepts, the existence of links between different parts of the concept hierarchy and the provision of appropriate examples.
Even though White and Gunstone [47] do not score concept maps, they define good maps as those that displayed a considerable amount of details, a diversity of kinds of relations, and rich patterns of cross-relations. In this study, to give qualitative value to the improved concept maps, we evaluated the maps according to the correctly placed concepts and the linkages to the subsystems.
The analysis of students’ elaborated concept maps was divided into two parts.
4.1. Analysis: Stage 1
A first analysis consists in verifying if the improved concept maps were correctly elaborated or if there were any mistakes or missing concepts (incorrect maps) and which was the map/cycle with more students being capable of correctly completing it and the map/cycle with fewer students being capable of correctly completing it. The second part analyses the holistic view of the Earth system, focusing on new propositions constructed to include the four subsystems or inter-cycle relations.
There were 83 elaborated concept maps in total, being 20 of them of the food chain and 21 of them of the rock cycle, carbon cycle and water cycle, according to the total number of students not being multiple of four, as shown in Table 2. No relation was observed between correct completion of the concept map and sex (boy or girl) or age.
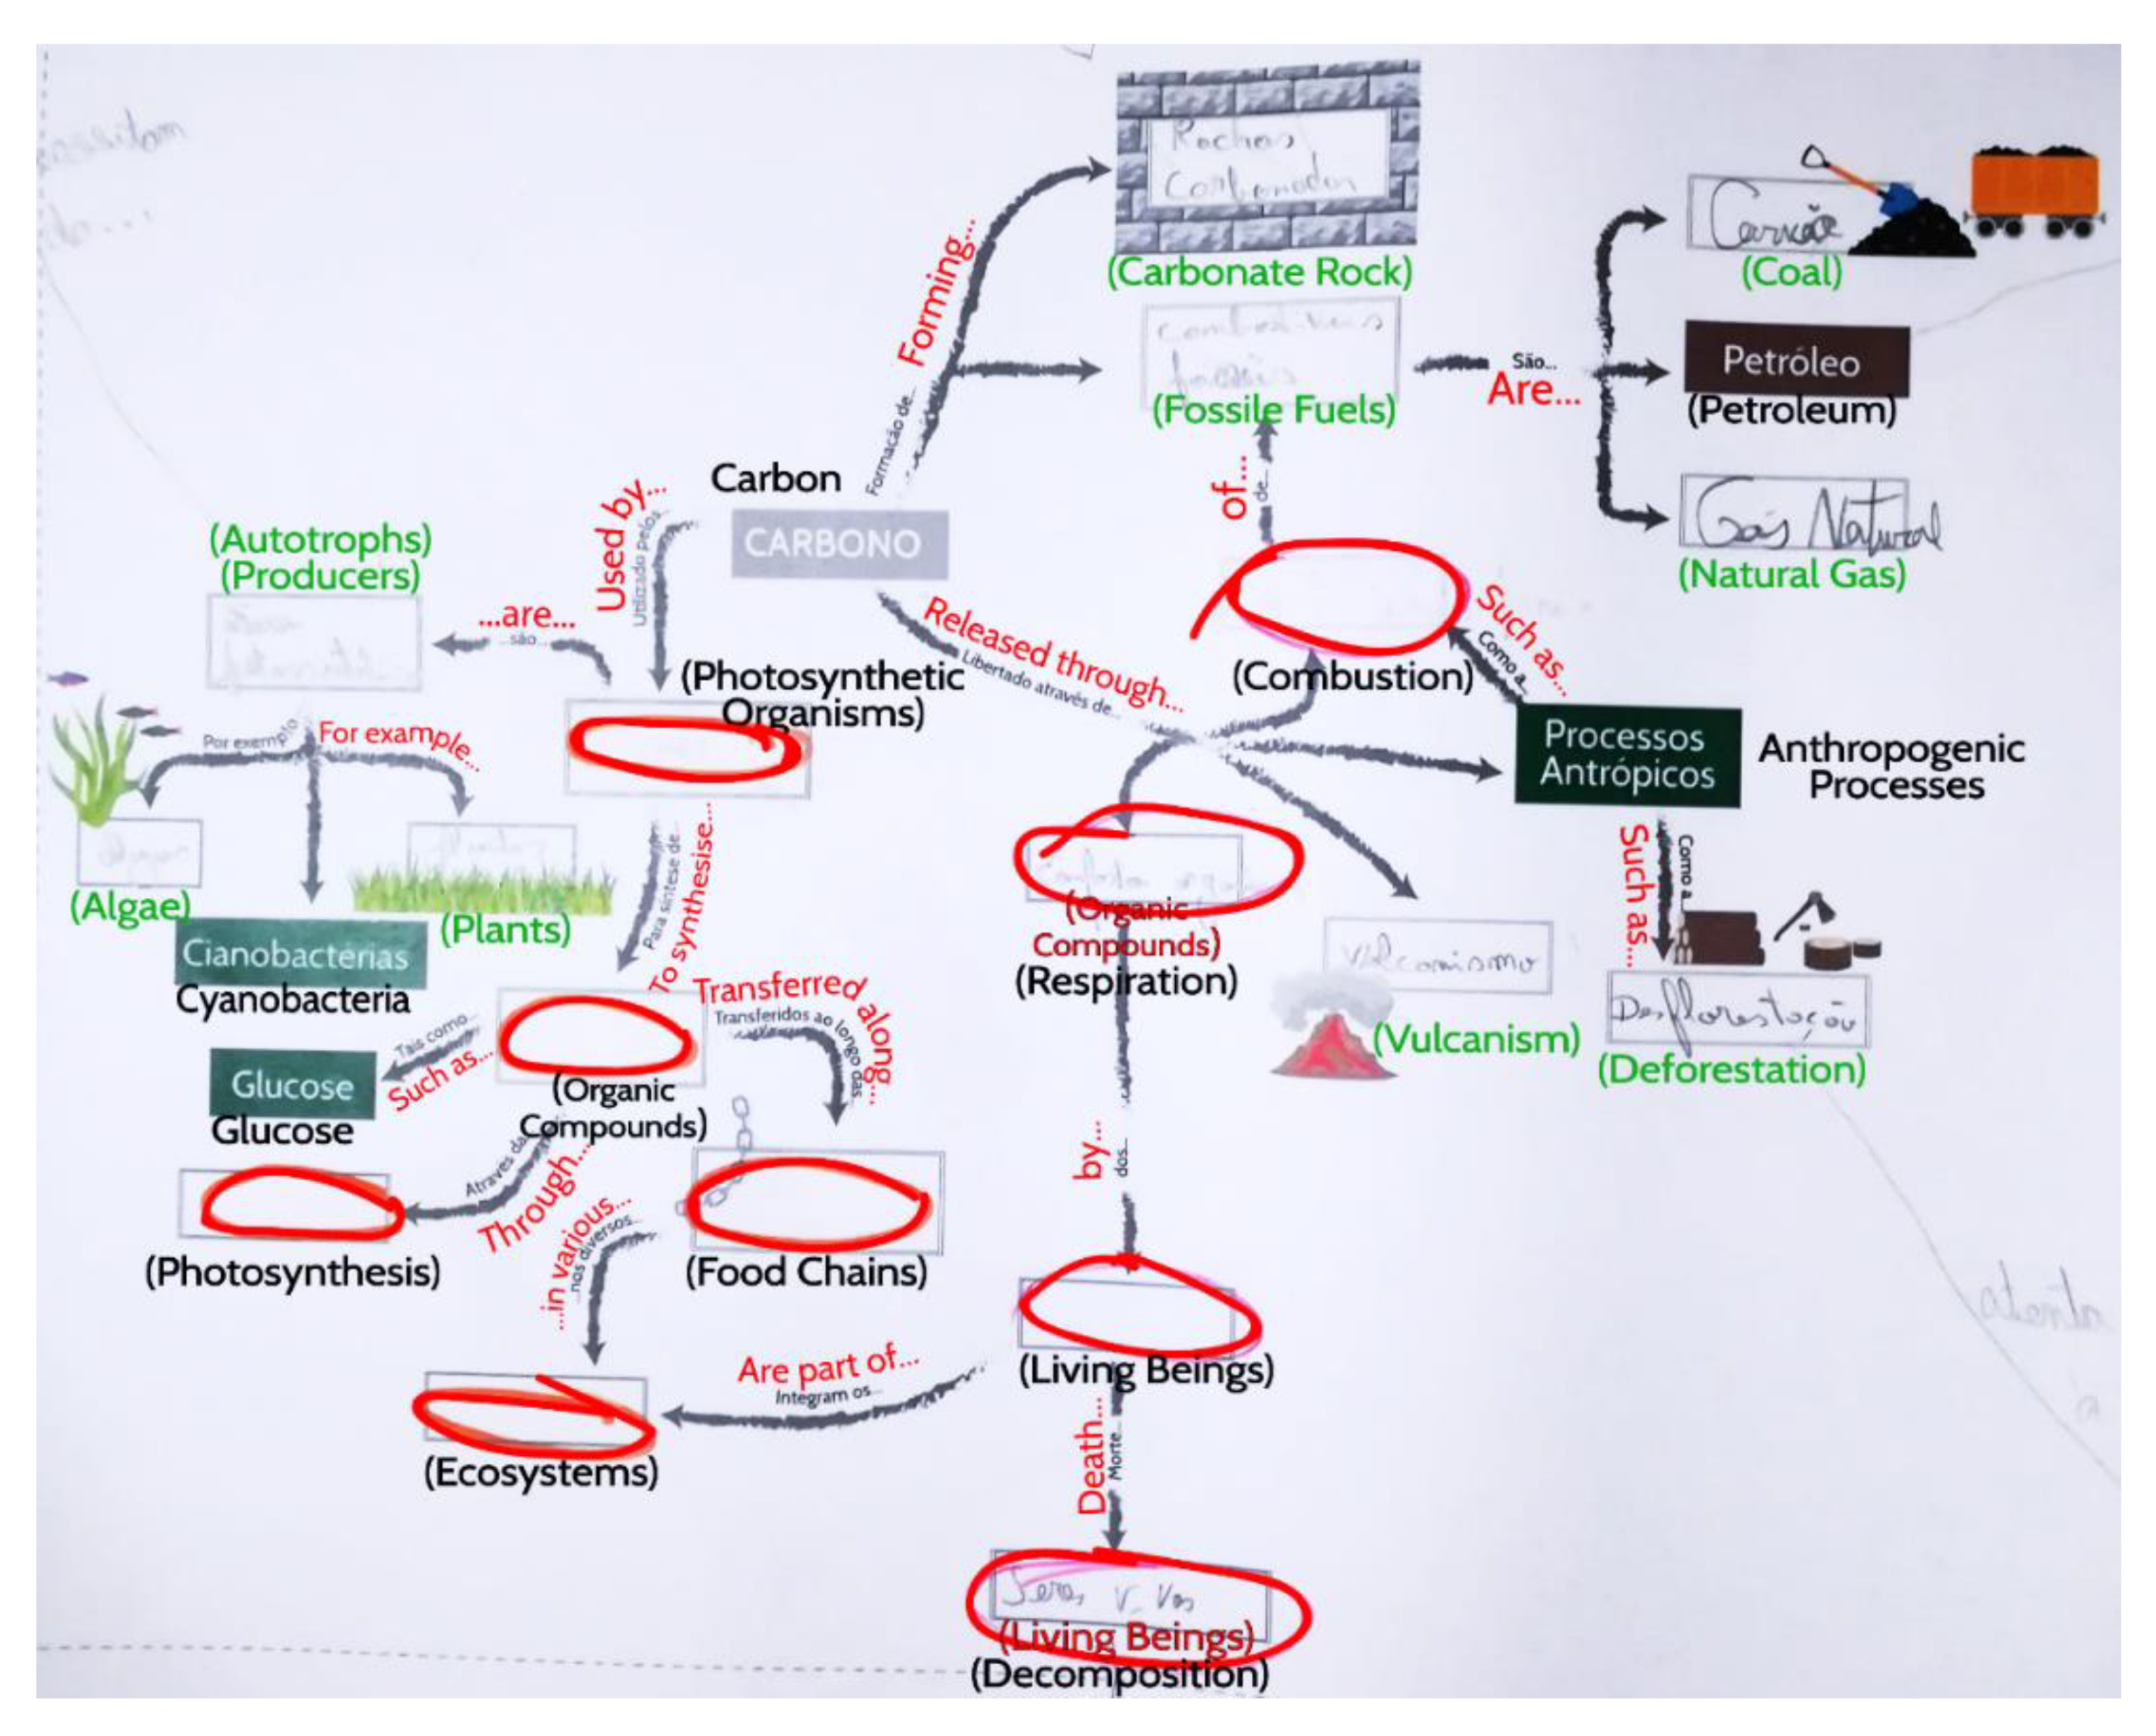
With the data analysis, it was verified that substantially fewer students were capable of correctly completing the improved concept map of the rock cycle, which was correctly completed by 14.3% of the students. The improved concept map most frequently completed and correct was the one related to food chains, in which 75% of the students were able to correctly complete the task. The carbon cycle map was correctly completed by 42.9% of the students, while the water cycle map was correctly completed by 38.1% of the students (Table 2). Furthermore, for the maps which were not completely and correctly completed, those corresponding to rock or carbon cycles (Figure 3) presented more blank spaces or incorrectly placed terms while food chain and water related cycles were usually completed with fewer terms misplaced.
However, another explanation may be added to understand these observable differences, not focused on the content itself, but related instead with the structure of the map. Rock cycle and food chains focused maps present five and three additional concepts, respectively, to be filed, when compared with water and carbon cycles related maps. Moreover, the rock cycle map presented fewer pictures proving the great importance of image used to construct better concept maps.
The greater success of food chains related maps may also rely on the longer links between concepts, allowing propositions to be readily read and avoiding less dubious conceptions. These propositions are considered to be “dynamic” as the replacement of one concept implies a change in the linked concept. While in other cases, propositions are labelled “static”. This characteristic has been used before to evaluate the level of “dynamic system” thinking [59], and may be here regarded as an important feature to construct consistent concept maps easier to interpret. Students’ “dynamic system” thinking will be evaluated next, regarding the integration of each map with the subsystems.
4.2. Analysis: Stage 2
Students, who construct concept maps while collaborating in group, have been found to show more meaningful learning than those who perform the task individually, meeting the paradigm of the social constructivist view [60]. Herein, the opportunity to further construct collaboratively concept maps was proposed. The analysis for the second part of the elaboration of improved concept maps by all the 21 groups of students, focused on the evaluation of the links and additional concepts added to integrate all the four maps with the Earth subsystems. Therefore, it was possible to look for some system thinking components, such as the identification of dynamic relationships within the cycle and the most related subsystem (by the number and quality of linkages and concepts added), and the ability to create relationships between the concepts and all the subsystems, beyond the most related subsystem, which reflect a more holistic perception of the Earth system in a concept map.
Each group had to link the four improved concept maps to the four subsystems and the other three cycles/food chains and were instructed to do so. They would consider being the most appropriate to reflect their thoughts, either drawings, words, arrows, lines, with no limit for words used to link those. During the completion of the task, it was immediately noticed by the preservice teachers that, most students were having difficulties to create any concept or link. Therefore, some examples were used to demonstrate the purpose of the task, when requested by the group.
None of the groups developed drawings and only three groups decided to add a few new concepts, mostly related to the biosphere or geosphere. The analysis of the new placed concepts revealed that most terms were repeated concepts, already present in one of the concept maps, including “water”, geosphere”, “living beings”, “rocks”, “sediments”, “organic matter”, “carbonated rocks”, and “plants”. These were probably used as a replacement for long arrows since only three new concepts were added (“oxygen, “trees”, “overexploitation” and “evapo-transpiration”).
Despite being instructed initially to always use arrows and at least one word as a link to create a meaningful proposition, some groups presented no connections, arrows between the same concept in different maps or just arrows between different concepts, but missing any word liking. Additionally, some propositions correctly constructed were considered to be nonvalid, when a wrong scientific idea was proposed. Still, overall, students understood the explanation on how to construct an improved concept map, retaining the importance of using arrows to guide the reader while interpreting the concept map, as well as the addition of links.
Although almost all groups preferred to establish connections with subsystems, these were mainly simple propositions of “A belongs to (subsystem)”, which may have been encouraged by the format of the pre-constructed improved concept maps. Many groups also proposed some relations inter-cycle, with greater or lower complexity. Since each cycle/food chains are mostly associated with one subsystem, these relations were also considered for the evaluation of earth system thinking in these students. The links were considered to be “complete”, when all the maps were linked to all the subsystems at least once, or “incomplete” when at least one map was not linked to all the subsystems. In a total of 21 groups, only two groups were able to establish complete connections to the systems. In the other 19 groups, it was verified that the subsystem which the students found to be more difficult to link with another concept was the atmosphere, and the one with a greater number of connections was the hydrosphere, but there were no relevant discrepancies between the number of connections to the subsystems. No observable relation was found between gender (boy or girl) or age and the number or quality of links, and, therefore, the capacity of system thinking. However, most students were girls and almost all where 14 years-old, restricting any further analysis. The analysis of the differences between the three classes revealed that the two groups able to complete connections and most of the groups using new terms or establishing a greater number of connections were from class 1, suggesting the teaching approach in this class may be closer to an ESA, compared to class 2 and 3.
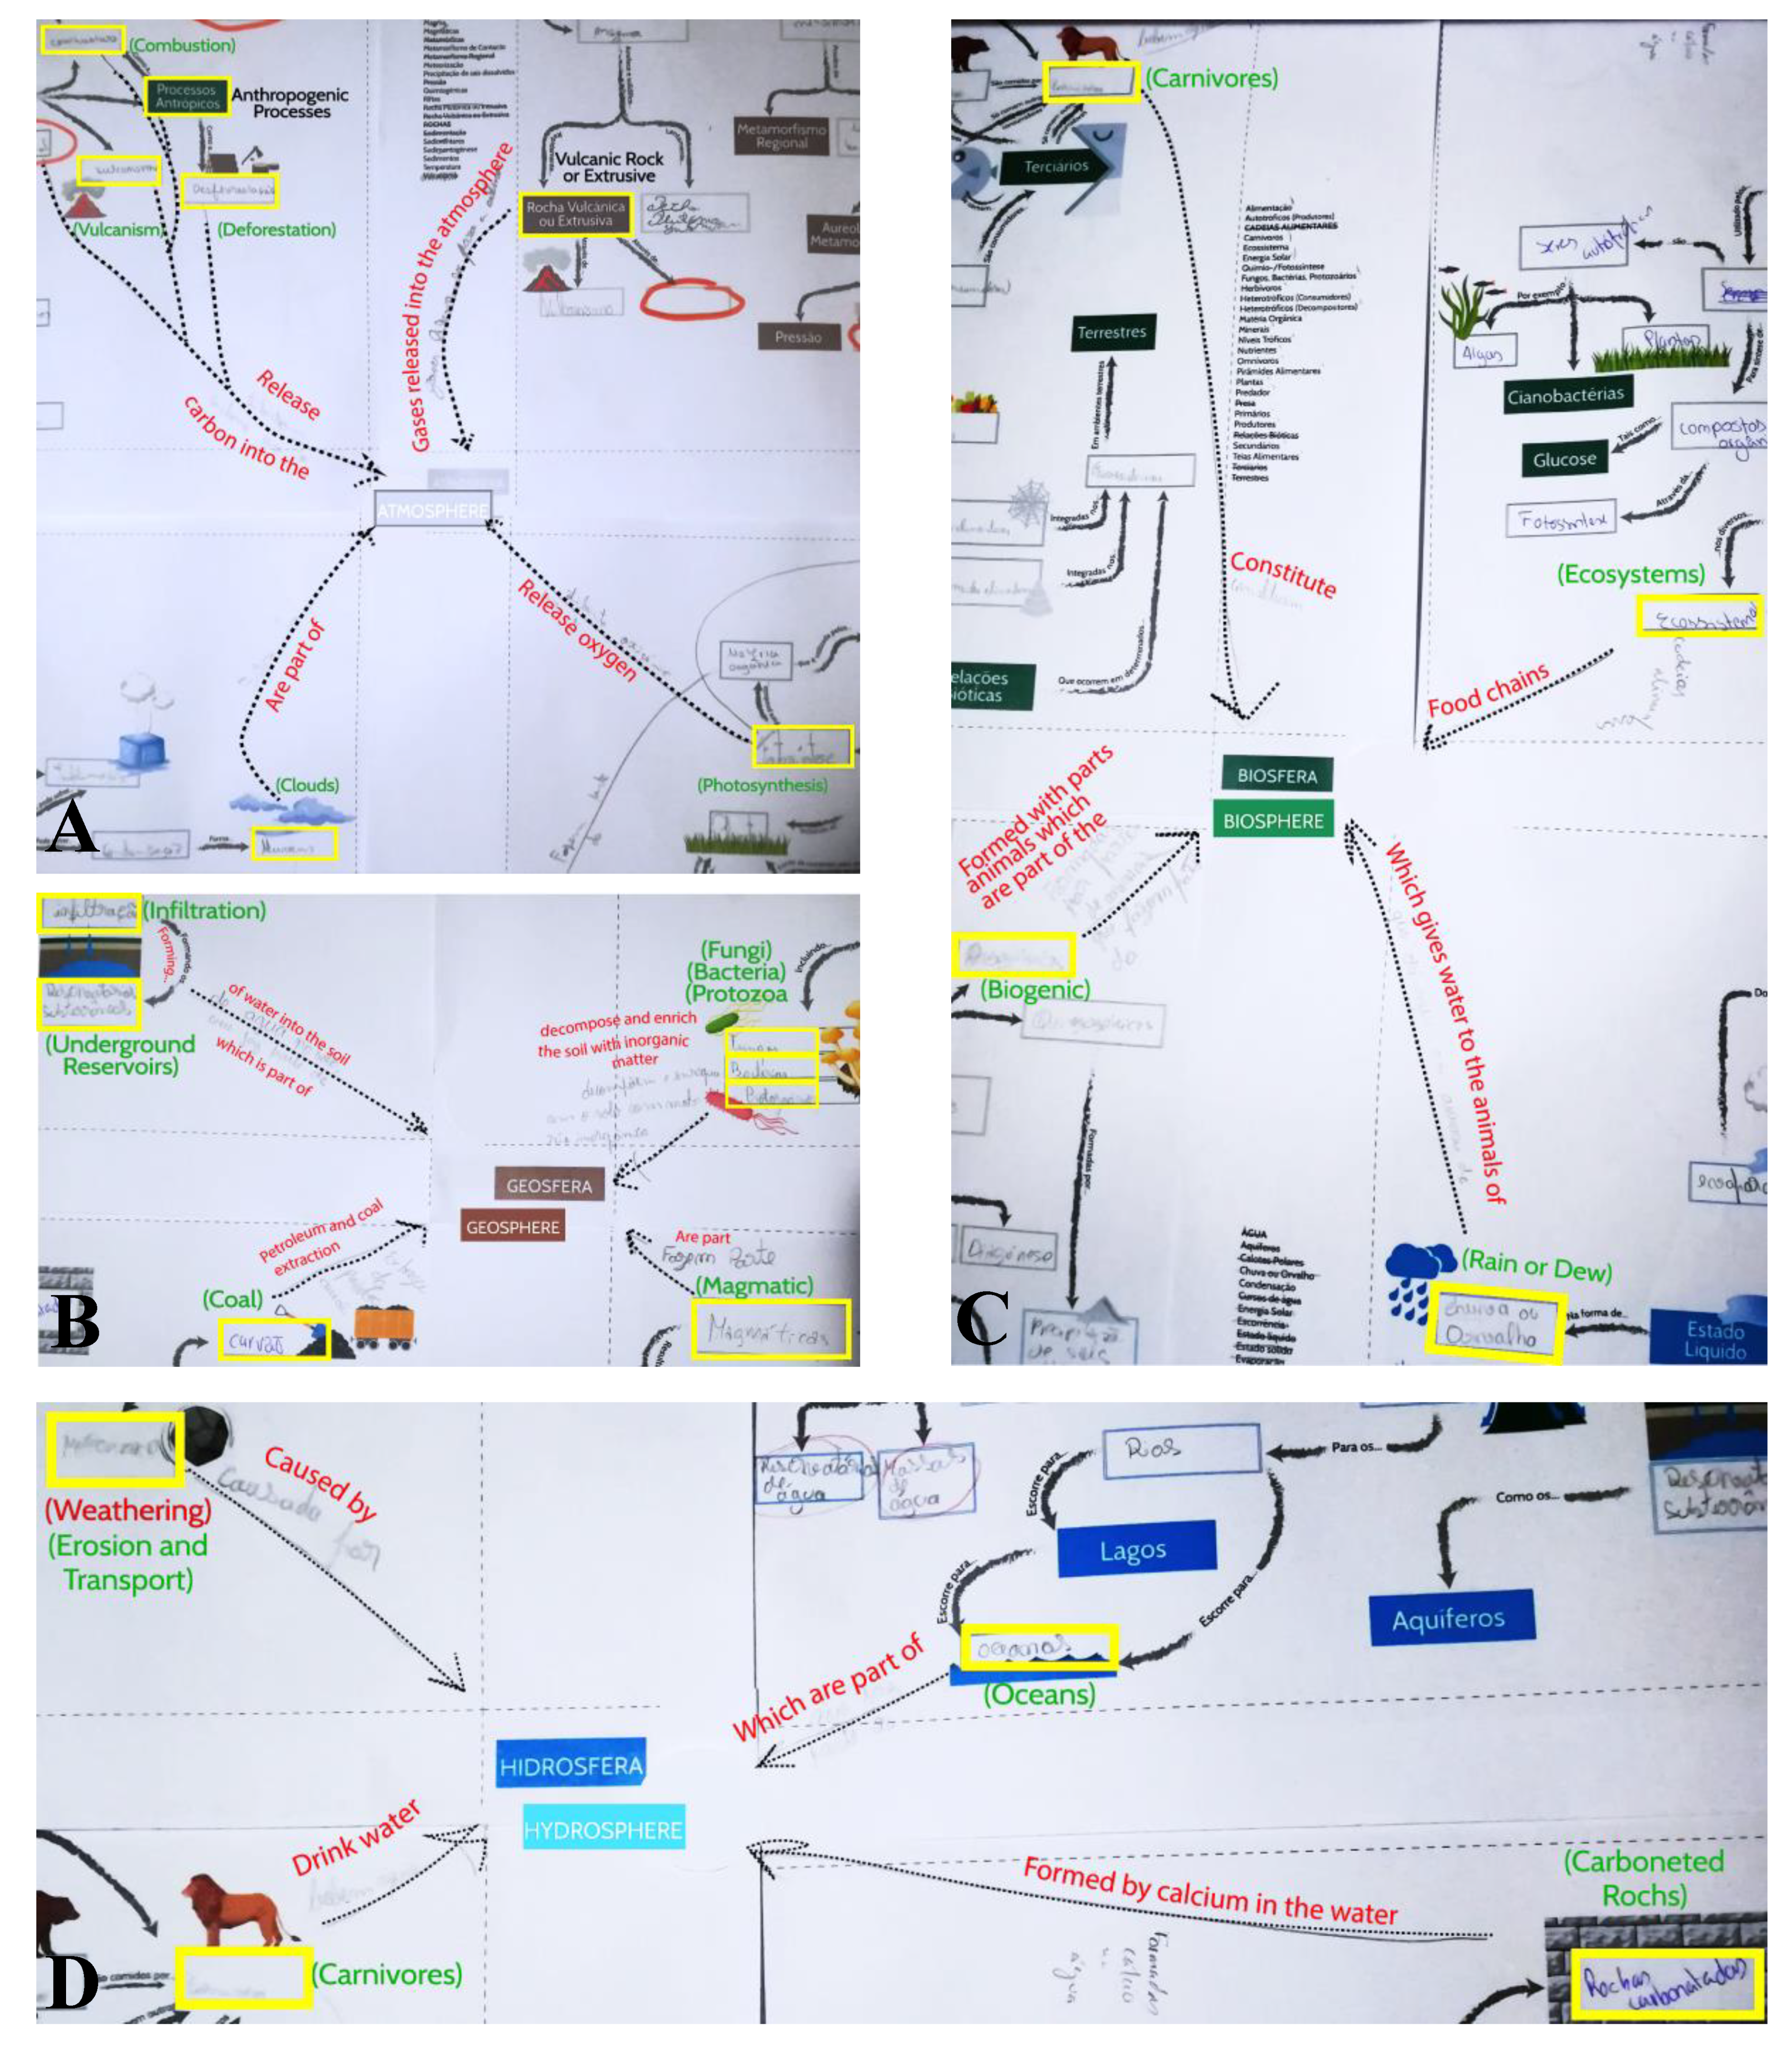
Regarding the correlations considered to be valid, either between concepts of different maps or between the concepts and the subsystems, low variability was found, with propositions being mainly of the type: “A belongs to B”, linking the concepts to their subsystems, for example, “water-hydrosphere” (see examples in Figure 4A–D). Regarding more complex valid propositions, some common ideas were present in all groups in the three different 8th-grade classes, including “water causes erosion”. “vulcanism releases toxic gases into the atmosphere”. “algae live in oceans or lakes”, “deforestation affecting plants” or “fungi, bacteria, and protozoa live in the geosphere” (see example in Figure 4A). These may reflect the examples proposed by the preservice teachers and the structure of each map together with the selected concepts, which favored some direct relations, limiting creativity in the establishment of other links. Moreover, some infrequent new ideas were also proposed, such as “photosynthesis releases O2 into the atmosphere”, “vulcanism poses a threat to herbivores, omnivores, and carnivores”, “carbonated rocks are formed by calcium in the water”, “photosynthesis utilizes water from hydrosphere” and “fungus, bacteria, and protozoa decompose organic matter and enrich the soil with inorganic matter” (see examples in Figure 4A–D). These groups are closer to a “dynamic system” thinking as the propositions drawn are often “dynamic”. Hence, two important limitations may stand as the cause for the apparent lack of a holistic view of the Earth system in these three classes: short time and the structure of pre-constructed maps—differences are more likely to be caused by the way the activity was set up. Students were generally more focused on the completion of their concept maps rather than moving to the next task.
It is important to notice that no clear relation was observed between maps completed correctly and number or quality of the propositions elaborated after, underlying a lack of association between success in fulfilling a pre-determined task, close-ended and mainly interpretative, and system thinking, when an openly creative task is requested instead. Although creative thinking may be regarded as an activity with greater complexity, the observations exposed above may reflect as well as past teaching-learning process focused on short answers, closed-ended, constrained activities ignoring approaches with a higher degree of liberty, and promoting creativity, imagination, and critical thinking.
5. Conclusions
The traditional assessments, like using standardized tests, can provide us information about the amount of knowledge and understanding students have about determined concepts. Nevertheless, in an area such as (geo)science, students must know about the relationships between concepts to obtain a deeper understanding of different phenomena. Concept maps can be a very valuable tool for students of all ages and teachers to assess, not only how students are conceptualizing different topics, how they are relating, organizing, and coherently structuring them, but also to analyse the students’ thinking patterns related to a specific topic and the common misconceptions associated with relationships between concepts. However, the use of concept maps might not be an easy task for teachers.
To improve students’ abilities to develop system thinking, it is important to introduce the first steps of systemic thinking in elementary school learning, namely skills such as the ability to identify the components of the various systems and the relationships between two components (since if students enter junior high school with systemic thinking skills from the lower levels, it will be easier to reach higher levels of systemic thinking already during the junior high school).
The results of this study showed that the students have a reductionist view of the Earth system. The lack of linkages and poor diversity of connexions between the concepts of the maps and the Earth’s subsystems revealed that the students have a poor holistic view of the Earth system. However, the setup of this activity including the time available for its realization may have conditioned the establishment of links. Logical connections between the concepts and subsystems prevailed in prejudice of more meaningful and deeper associations that reveal an all-inclusive aspect amid the cycles and the subsystems. The inability to create these connections demonstrates that it is important to promote an Earth system approach in science education and more specifically in Portuguese curricula. The absence of a correct integration of a holistic vision of our planet on a curricular level harms the development of an informed society, conscious of the consequences of the inert and disruptive manner on how humans explore the Earth. Students are the future of the society; therefore, they will decide about policy and lives that are tangled with a changing planet, that requires urgent shifts in how the natural resources and sustainability are dealt with. Since scientific knowledge is essential to identify proper paths towards sustainability, if the population cannot think holistically, it is possible to conclude that this goal is far from being achieved.
Author Contributions
Conceptualization, methodology, formal analysis, writing—review and editing, and supervision was done by C.V.; Investigation, resources and gathering data was done by F.F., A.R., B.M. and M.M. Writing—original draft preparation was done by F.F. All authors have read and agreed to the published version of the manuscript.
Funding
This research received no external funding.
Conflicts of Interest
The authors declare no conflict of interest.
References
- Autio, O.; Kavivola, T.; Lavonen, J. Context-based approach in teaching science and technology. In How Finns Learn Mathematics and Science; Pehkonen, E., Ahtee, M., Lavonen, J., Eds.; Brill|Sense: Leiden, The Netherlands, 2007; Volume 1, pp. 199–210. [Google Scholar]
- European Commission. Europe Needs More Scientistsz: Report by the High Level Group on Increasing Human Resources for Science and Technology; Office for Official Publications of the European Communities: Luxembourg, 2004; ISBN 92-894-8458-6. [Google Scholar]
- Osborne, J.; Dillon, J. Science Education in Europe: Critical Reflections; King’s College London, The Nuffield Foundation: London, UK, 2008. [Google Scholar]
- Vasconcelos, C.; Torres, J.; Moutinho, S.; Martins, I.; Costa, N. Uncovering Portuguese teachers’ difficulties in implementing sciences curriculum. Cogent. Educ. 2015, 2, e1060755. [Google Scholar] [CrossRef]
- Mueller, C.; Lim, J.; Watson, S.L. First Principles of Attitudinal Change: A Review of Principles Methods and Strategies. Tech. Trends 2017, 61, 560–569. [Google Scholar] [CrossRef]
- Šorgo, A.; Špernjak, A. Practical work in biology, chemistry and physics at lower secondary and general upper secondary schools in Slovenia. Eurasia J. Math. Sci. Tech. Educ. 2012, 8, 11–19. [Google Scholar]
- Valoyes-Chávez, L. On the making of a new mathematics teacher: Professional development, subjectivation, and resistance to change. Educ. Stud. Math. 2019, 100, 177–191. [Google Scholar] [CrossRef]
- Vasconcelos, C.; Amador, F.; Torres, J. Students’ perceptions of the implementations of science curriculum in Portugal: Rethinking paths, reinventing ways. In Proceedings of the 5th International Congress of Education, Research and Innovation, Madrid, Spain, 19–21 December 2012; pp. 2618–2627. [Google Scholar]
- Zimmerman, J. Why some teachers resist change and what principals can do about it. Nassp Bull. 2006, 90, 238–249. [Google Scholar] [CrossRef] [Green Version]
- Anghelachea, V.; Bentea, C.C. Teachers’ motivation and satisfaction for professional activity. Procedia-Social Behav. Sci. 2012, 33, 563–567. [Google Scholar]
- Lovelock, J. Gaia—A New Look at Life on Earth; Oxford University Press: Oxford, UK, 2000. [Google Scholar]
- Orion, N.; Fortner, W.R. Teaching global science literacy: A professional development or a professional change. In Implementing Global Science Literacy; Mayer, V.J., Ed.; Ohio State University: Ohio, OH, USA, 2003; pp. 279–286. [Google Scholar]
- Ausubel, D.P. Educational Psychology: A Cognitive View; Holt Rinehart and Winston: New York, NY, USA, 1968. [Google Scholar]
- Ausubel, D.P. The Psychology of Meaningful Verbal Learning; Grune & Stratton: New York, NY, USA, 1963. [Google Scholar]
- Novak, J.D. A Theory of Education; Cornell University Press: Ithaca, NY, USA, 1977. [Google Scholar]
- Zalasiewicz, J.; Williams, M.; Steffen, W.; Crutzen, P. The new world of Anthropocene. Environ. Sci. Technol. 2010, 44, 2228–2231. [Google Scholar] [CrossRef]
- Crutzen, P.J.; Stoermer, E.F. The “Anthropocene”. IGBP Glob. Chang. NewsLetter 2000, 41, 17–18. [Google Scholar]
- Crutzen, P. The “Anthropocene”. In Earth System Science in the Anthropocene; Springer: Berlin, Germany, 2006. [Google Scholar]
- Crutzen, P.J. Geology of mankind. Nature 2002, 415, 23–27. [Google Scholar] [CrossRef]
- United Nations General Assembly. Transforming our World: The 2030 Agenda for Sustainable Development; United Nations General Assembly: New York, NY, USA, 2015. [Google Scholar]
- WCED, S.W.S. World Commission on Environment and Development. In Our Common Future; Oxford University Press: Oxford, UK, 1987. [Google Scholar]
- Ehlers, E.; Krafft, T. (Eds.) Managing Global Change: Earth System Science in the Anthropocene. In Earth System Science in the Anthropocene: Emerging Issues and Problems; Springer: Berlin, Germany, 2006; pp. 5–12. [Google Scholar]
- Angus, I. (Ed.) A Second Copernican Revolution. In Facing the Anthropocene: Fossil Capitalism and the Crisis of the Earth System; Monthly Review Press: New York, NY, USA, 2016; pp. 27–37. [Google Scholar]
- Hoffman, M.; Barstow, D. (Eds.) Earth as a Dynamic System. In Revolutionizing Earth System Science Education for the 21st Century; TERC: Cambridge, UK, 2007; pp. 17–19. [Google Scholar]
- Oldfield, F.; Steffen, W. The Earth System. In Global Change and the Earth System: A Planet under Pressure; Steffen, W., Sanderson, R.A., Tyson, P.D., Jäger, J., Matson, P.A., Moore III, B., Oldfield, F., Richardson, K., Schellnhuber, H.-J., et al., Eds.; Springer: Berlin, Germany, 2004; pp. 6–8. [Google Scholar]
- Mayer, V.J. Global science literacy: An earth system view. J. Res. Sci. Teach. 1997, 34, 101–105. [Google Scholar] [CrossRef]
- Mayer, V.J.; Fortner, R.W.; Hoyt, W.H. Using cooperative learning as a structure for Earth Systems Education workshops. J. Geol. Edu. 1995, 43, 395–400. [Google Scholar] [CrossRef]
- Orion, N.; Libarkin, J. Earth System Science Education. In Handbook of Research on Science Education; Lederman, N.J., Abell, S.K., Eds.; Routledge: London, UK, 2014; pp. 481–496. [Google Scholar]
- Orion, N. A holistic approach for science education for all. Eurasia J. Math. Sci. Tech. Educ. 2007, 3, 99–106. [Google Scholar] [CrossRef]
- Earth System Science Committee. Earth System Science: A Program for Global Change; National Aeronautics and Space Administration: Washington, DC, USA, 1988.
- Assaraf, O.; Orion, N. Development of system thinking skills in the context of earth system education. J. Res. Sci. Teach. 2005, 42, 518–560. [Google Scholar] [CrossRef]
- Unver, A.; Arabacioglu, S. A comparison of inquiry-based learning (IBL), problem-based learning (PBL) and project-based learning (PJBL) in science education. Acad. J. Educ. Res. 2014, 2, 120–128. [Google Scholar]
- Čyras, V. Distinguishing between knowledge visualization and knowledge representation in legal informatics. In Semantic Web and Social Networks in Legal Informatics, Proceedings of the 12th International Legal Informatics Symposium IRIS 2009, Salzburg, Austria, 26–28 February 2009; Schweighofer, E., Ed.; Austrian Computer Society (OCG): Viena, Austria, 2009; pp. 321–327. ISBN 978-3-85403-259-5. [Google Scholar]
- Olimpo, G. Knowledge flows and graphic knowledge representations. In Technology and Knowledge Flow: The Power of Networks; Trentin, G., Ed.; Chandos Publishing Limited: Cambridge, UK, 2011; pp. 91–131. [Google Scholar]
- García, R. Methodology. In A Semantic Web Approach to Digital Rights Management; Universitat Pompeu Fabra: Barcelona, Spain, 2006. [Google Scholar]
- Sowa, J.F. Knowledge Representation: Logical, Philosophical, and Computational Foundations; Brooks Cole Publishing Co.: Pacific Grove, CA, USA, 2000. [Google Scholar]
- Eppler, M.J.; Burkhard, R.A. Knowledge visualization. In Encyclopedia of Knowledge Management; Schwartz, D.G., Ed.; Idea Group Reference: Hershey, PA, USA, 2006; pp. 551–560. [Google Scholar]
- Novak, J.D.; Gowin, D.B. Learning How to Learn; Cambridge University Press: New York, NY, USA, 1984. [Google Scholar]
- Novak, J.D.; Musonda, D. A Twelve-year longitudinal study of science concept learning. Am. Educ. Res. J. 1991, 28, 117–153. [Google Scholar] [CrossRef]
- Novak, J. The Use of Concept Mapping and Gowin’s “V” Mapping Instructional Strategies in Junior High School Science; The Cornell University “Learning How to Learn” Project; Cornell University Press: Ithaca, NY, USA, 1981. [Google Scholar]
- Ahlberg, M. Concept maps, Vee diagrams and Rhetorical Argumentation (RA) Analysis: Three educational theory-based tools to facilitate meaningful learning. In the Third International Seminar on Misconceptions in Science and Mathematics; Novak, J.D., Ed.; Cornell University: Ithaca, NY, USA, 1993. [Google Scholar]
- Buzan, T. Use Your Head; BBC Works: London, UK, 1974. [Google Scholar]
- Buzan, T.; Buzan, B. The Mind Map Book: Millennium Edition; BBC Consumer Publishing: London, UK, 2000. [Google Scholar]
- Hanf, M.B. Mapping: A technique for translating reading into thinking. J. Read. 1971, 14, 225–230. [Google Scholar]
- Harnisch, D.L.; Sato, T.; Zheng, P.; Yamagi, S.; Connell, M. Concept mapping approach and its applications in instruction and assessment. In Proceeding of Annual Meeting of the American Educational Research Association, New Orleans, LA, USA, 4–8 April 1994. [Google Scholar]
- Brody, M. Understanding of pollution of 4th-, 8th-, and 11th- grade students. J. Env. Educ. 1991, 22, 24–33. [Google Scholar] [CrossRef]
- White, R.; Gunstone, R. Probing Understanding; The Falmer Press: London, UK, 1992. [Google Scholar]
- Novak, J. Meaningful learning: The essential factor for conceptual change in limited or inappropriate prepositional hierarchies leading to empowerment of learners. Sci. Educ. 2002, 86, 548–571. [Google Scholar] [CrossRef] [Green Version]
- Ahlberg, M. Varieties of concept mapping. In Concept Maps: Theory, Methodology, Technology, Proceedings of the First International Conference on Concept Mapping; Cañas, A., Novak, J., Gonzales, F., Eds.; Publicaciones de la Universidad Pública de Navarra: Navarra, Spain, 2004; pp. 25–28. [Google Scholar]
- Gallenstein, N.L.; Larmon, M. Mathematics concept maps: Go figure! Child. Educ. 2012, 88, 6–8. [Google Scholar]
- Novak, J.; Cañas, A. The Theory Underlying Concept Maps and How to Construct Them, Technical Report IHMC CmapTools 2006-01; Florida Institute for Human and Machine Cognition: Pensacola, FL, USA, 2006. [Google Scholar]
- Novak, J. Learning, Creating and Using Knowledge: Concept Maps as Facilitative Tools in Schools and Corporations, 2nd ed.; Routledge: New York, NY, USA, 2010. [Google Scholar]
- Hoffman, R.; Moon, B. Knowledge Capture for the Utilities. In Proceedings of the 7th International Topical Meeting on Nuclear Plant Instrumentation, Control and Human Machine Interface Technologies (NPIC and HMIT 2010), Las Vegas, NV, USA, 7–11 November 2010. [Google Scholar]
- Tergan, S.O. Digital Concept Maps for Managing Knowledge and Information. In Knowledge and Information Visualization. Lecture Notes in Computer Science; Tergan, S.O., Keller, T., Eds.; Springer: Berlin, Germany, 2005; pp. 185–204. [Google Scholar]
- Aguiar, J.G.; Correia, P.R.M. Using concept maps as instructional materials to foster the understanding of the atomic model and matter–energy interaction. Chem. Educ. Res. Pract. 2016, 17, 756–765. [Google Scholar] [CrossRef]
- Moon, B.; Ross, K.; Phillips, J. Cmap-based Assessment for Adult Learners. In Concept Maps: Making Learning Beautiful, Proceedings of the Fourth International Conference on Concept Mapping; Sánchez, J., Cañas, A., Novak, J., Eds.; Lom Ediciones S.A.: Santiago do Chile, Chile, 2010; pp. 128–137. [Google Scholar]
- Gao, H.; Shen, E.; Losh, S.; Turner, J. A review of studies on collaborative concept mapping: What have we learned about the technique and what is next? J. Int. Learn. Res. 2007, 18, 479–492. [Google Scholar]
- Novak, J.D. Learning, Creating, and Using Knowledge: Concept Maps as Facilitative Tools in Schools and Corporations; Lawrence Erlbaum Associates Publishers: Mahwah, NJ, USA, 1998. [Google Scholar]
- Derbentseva, N.; Safayeni, F.; Cañas, A. Concept maps: Experiments on dynamic thinking. J. Res. Sci. Teach. 2007, 44, 448–465. [Google Scholar] [CrossRef]
- Roth, W.M. Student views of collaborative concept mapping: An emancipatory research project. Sci. Educ. 1994, 78, 1–34. [Google Scholar] [CrossRef]
Figure 1.
Example of a Novakian standard concept mapping (upper), mind mapping (middle), and improved method for concept mapping (lower), regarding the same ESA-related concepts.
Figure 1.
Example of a Novakian standard concept mapping (upper), mind mapping (middle), and improved method for concept mapping (lower), regarding the same ESA-related concepts.

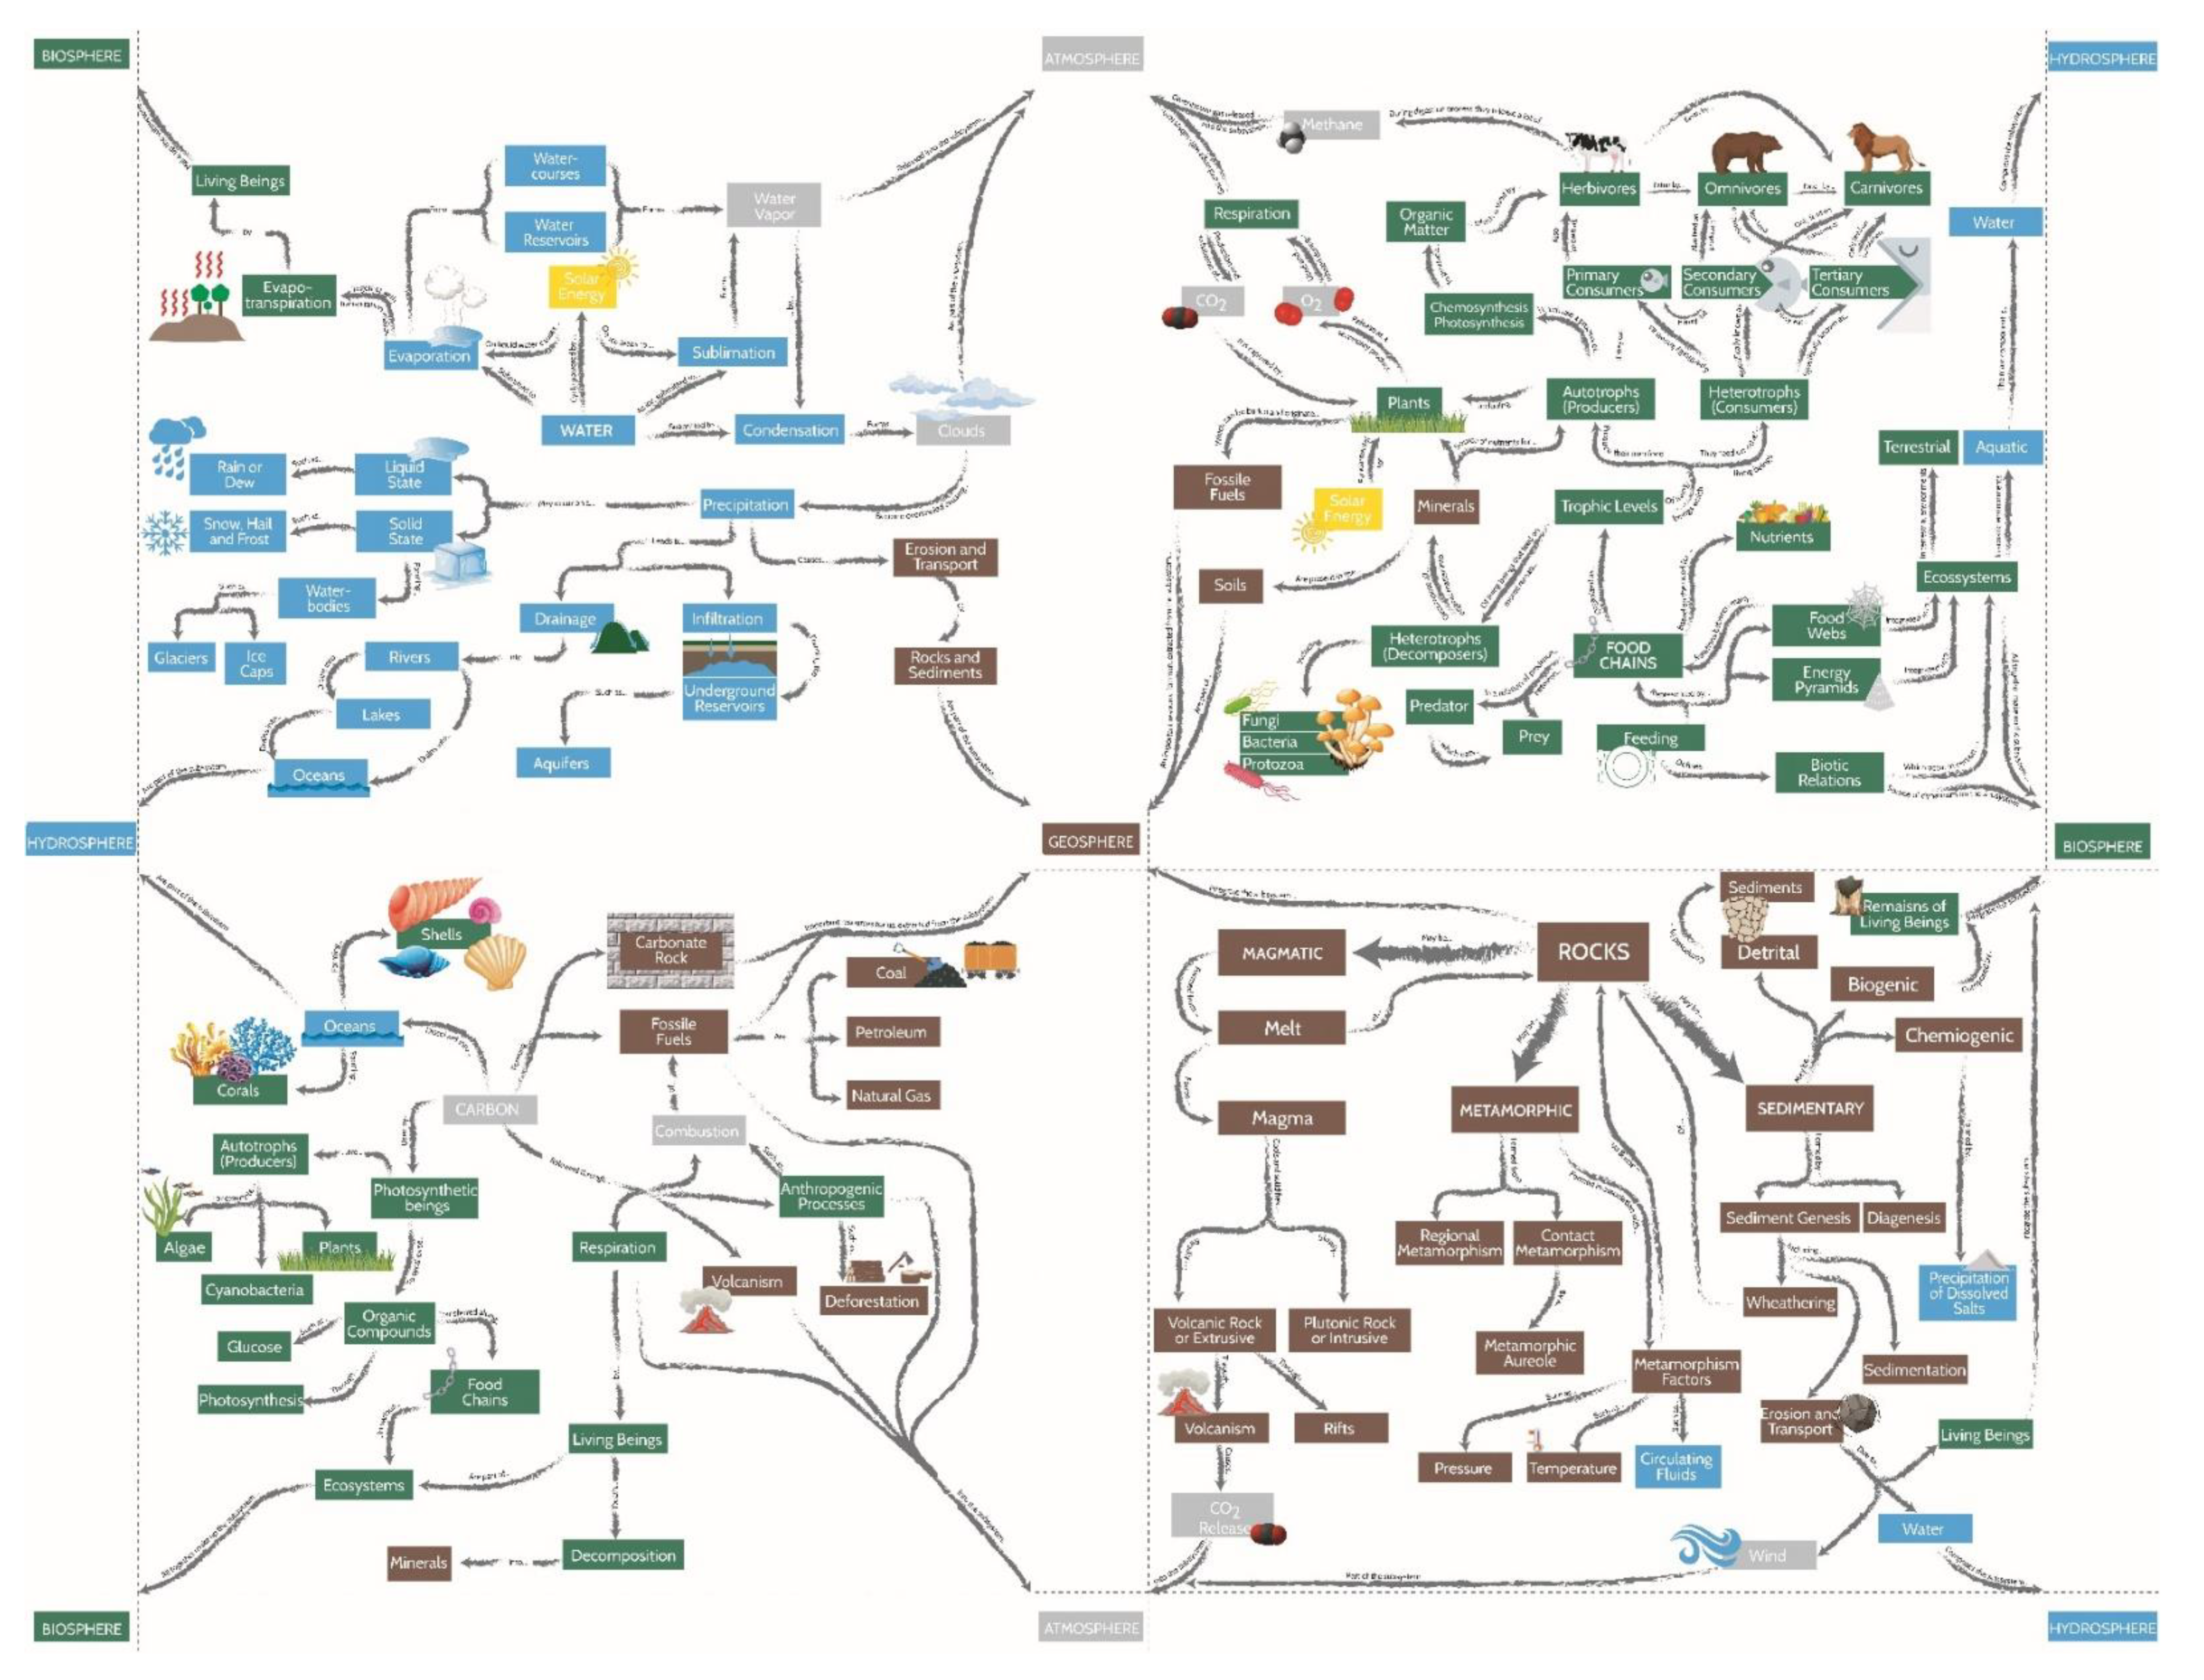
Figure 2.
The research team reference map used to evaluate student’s performance.

Figure 3.
Example of one of the most uncompleted and incorrectly filled concept map (carbon cycle). All empty boxes or incorrect terms are circled in red. Two terms in red were incorrectly placed (*). Terms in green are correctly placed. Terms in black represent the correct term.
Figure 3.
Example of one of the most uncompleted and incorrectly filled concept map (carbon cycle). All empty boxes or incorrect terms are circled in red. Two terms in red were incorrectly placed (*). Terms in green are correctly placed. Terms in black represent the correct term.

Figure 4.
Examples of the most complete relations established between cycles and each one of the earth subsystems ((A)—Atmosphere, (B)—Geosphere, (C)—Biosphere, (D)—Hydrosphere). Terms in red were incorrectly placed (*). Terms in green are correctly placed. Inside the yellow boxes are the terms used to make connections.


Table 1.
Characterization of the sample.
| Class | Age Range | Gender (n; %) |
|---|---|---|
| 1 | 14 | female (19; 67.9%) male (9; 32.1%) |
| 2 | 14 | female (17; 60.7%) male (11; 39.3%) |
| 3 | 13-15 | female (18; 66.7%) male (9; 33.3%) |
Table 2.
Analysis of the 83 elaborated concept maps.
| Food Chain | Rock Cycle | Carbon Cycle | Water Cycle | |
|---|---|---|---|---|
| Correct map | 15 (75%) | 3 (14.3%) | 9 (42.9%) | 8 (38.1%) |
| Incorrect map | 5 (25%) | 18 (85.7%) | 12 (57.1%) | 13 (61.9%) |
| Total | 20 (100%) | 21 (100%) | 21 (100%) | 21 (100%) |
© 2019 by the authors. Licensee MDPI, Basel, Switzerland. This article is an open access article distributed under the terms and conditions of the Creative Commons Attribution (CC BY) license (http://creativecommons.org/licenses/by/4.0/).
Share and Cite
MDPI and ACS Style
Vasconcelos, C.; Ferreira, F.; Rolo, A.; Moreira, B.; Melo, M. Improved Concept Map-Based Teaching to Promote a Holistic Earth System View. Geosciences 2020, 10, 8. https://0-doi-org.brum.beds.ac.uk/10.3390/geosciences10010008
AMA Style
Vasconcelos C, Ferreira F, Rolo A, Moreira B, Melo M. Improved Concept Map-Based Teaching to Promote a Holistic Earth System View. Geosciences. 2020; 10(1):8. https://0-doi-org.brum.beds.ac.uk/10.3390/geosciences10010008
Chicago/Turabian StyleVasconcelos, Clara, Fabio Ferreira, Ana Rolo, Beatriz Moreira, and Mariana Melo. 2020. "Improved Concept Map-Based Teaching to Promote a Holistic Earth System View" Geosciences 10, no. 1: 8. https://0-doi-org.brum.beds.ac.uk/10.3390/geosciences10010008
Note that from the first issue of 2016, this journal uses article numbers instead of page numbers. See further details here.