Using Remote Sensing Data to Identify Large Bottom Objects: The Case of World War II Shipwreck of General von Steuben


Department of Navigation and Hydrography, Faculty of Navigation and Naval Weapons, Polish Naval Academy, 81–127 Gdynia, Poland
Geosciences 2020, 10(6), 240; https://0-doi-org.brum.beds.ac.uk/10.3390/geosciences10060240
Submission received: 25 May 2020
/
Revised: 12 June 2020
/
Accepted: 16 June 2020
/
Published: 19 June 2020
(This article belongs to the Special Issue Marine Habitat Mapping: Selected Papers from "GeoHab 2021")
Abstract
:The seabed of the Baltic Sea is not yet fully searched for and investigated. In 2004 the crew of the Polish Navy hydrographic ship Arctowski discovered a new shipwreck that was not listed in the official underwater objects database nor was it marked on a chart. The identity of a new wreck is most frequently established based on artefacts found in the object by divers as a part of archaeological research, or through underwater inspection with remotely operated vehicle. The aim of this paper is to show how acoustic remote sensing data is used to identify large bottom object without having to go underwater. Bathymetric survey and sonar investigation were conducted over the study area. An appropriate methodology allowed for obtaining high-resolution imagery of the wreck. A review of literature concerning the end of World War II in the Baltic Sea was carried out. Moreover, the author presents a comparative analysis and evaluation of remote sensing data with archival photos, silhouette, and ship characteristics. The proposed approach led to the identification of a new Baltic Sea wreck as the General von Steuben, which was torpedoed in 1945 by soviet submarine. The author’s findings show that state of preservation of the shipwreck, quality data as well as historical records play a key role in establishing the wreck’s identity.
1. Introduction
Over the centuries, ships survived storms, wars, icebergs, and pirates. However, many of them were lost and lie at the bottom of the ocean with their stories, mysteries, and secrets. Some wrecks have been there for a long time, inaccessible to anyone. About three million shipwrecks lie on the sea bottom around the world [1]. Each wreck has its own exceptional history. Because most of the world’s oceans are unreachable to divers, we must rely on advanced remote sensing technology to examine, map, and verify shipwrecks in these areas [2].
Most of the wrecks in the Polish part of the Baltic Sea come from World War II, and from even earlier [3]. The inland nature of the Baltic Sea—conducive to the development of shipping, ports and maritime trade, and numerous naval wars and conflicts, combined with unexpected storms—meant that many vessels found their end at sea bottom. This sea has always been seen as dangerous to navigate. Its weather conditions are considered difficult due to strong winds and high storm waves. This unfavorable aura, imperfection of old shipbuilding techniques, navigation errors, and, finally, simple negligence were the reasons for many maritime accidents and disasters [4]. The number of these tragedies is multiplied by wars during which military operations were also carried out at sea. They led to numerous sinking of vessels and warships. One of them was the German liner General von Steuben (GvS).
After the World War II, wreck search and investigation had top priority to ensure the safety of shipping in the navigation channels that had been cleared of mines. Before the war, wrecks close to the coast used to be mapped with deployment of divers. Wrecks lying in deep waters, which did not pose a threat to navigation, were recorded but not monitored regularly. Many vessels were lost without their position having ever been identified in systematic surveys.
The traditional wreck searching method was to tow ropes across the seabed which were fastened to two ships [5]. This technique continued to be used after the introduction of the first acoustic device because it was capable of locating small or very narrow targets on the seabed which were not detected by echosounders. Wreck search has become easier after the development of sonar equipment during the last World War, which was used to locate submarines. Today wreck search or, more precisely, the investigation of underwater objects, is a special application of hydrographic surveying, that uses the advantages of a multibeam echosounder (MBES), single-beam echosounder (SBES), side-scan sonar (SSS), or remotely operated vehicle (ROV) [6,7,8].
The total number of shipwrecks at the bottom of the Baltic Sea is currently unknown. Numerous detected wrecks remain unidentified. There is often a lot of unverified and false information about them. Identity of the underwater objects is established on the basis of collected photographic and drawing documentation, analysis of historical facts, results of bathymetric and sonar survey, diving inspection, and movie material recorded with a TV camera mounted on an underwater vehicle. Identifying the shipwreck is often a principal issue that a court must address when deciding salvage claims over the wreck [9].
Berg [10] and Keatts [11] claim that the wreck can be reliably identified based on the artefacts found in it. Elements such as a ship’s bell, a hull number, or the name of the vessel clearly confirm the identity of the object. This involves the use of divers. Unfortunately, in the case of older wrecks a significant degree of hull growth is to be expected, which may affect the effectiveness of determining the wreck’s identity. A human diver can only work down to about 30–40 m, and the vast majority of shipwrecks are much deeper than that. What is more, it is very expensive to inspect an entire shipwreck using divers. If no element is found, the process of determining the identity of the wreck can take years.
Grabiec and Olejnik [12] believe that the most effective way to identify a wreck is the use of unmanned vehicles, such as a remotely operated vehicle. The authors claim that only photographic or TV images of the wreck provide 100% certainty in the identification process. The use of ROV may be limited by the depth of the wreck’s lying, its orientation at the bottom, and hydrometeorological conditions of the environment. What is more, carrying out the mission of an underwater vehicle is associated with the danger of entangling the vehicle in the fishing nets or getting stuck inside the wreck. ROV collision with structural components such as masts or funnels is also possible. After all, using ROV also means that the fishing net can get tangled in the vehicle’s propulsion or hooked the cable to the wreck structure. To reach shipwrecks in deep water, archaeologists have rarely partnered with ocean scientists to use an ROV. The costs of ROV operations are high due to the operational expenses of the technology and day rate for the survey vessels. ROV inspection requires that the support vessel must be fitted with a dynamic positioning system (DP). Vessels equipped with DP systems are very expensive to charter [13].
If a new wreck (object) is found a side-scan sonar can provide high quality remote sensing data. [14]. Side-scan sonar can visualize and identify the wreck at a low cost. This acoustic sensor produces high-resolution images of the bottom and objects without the need for inspection dives. SSS is used to create sonar images (sonograph) for a wide range of scientific underwater applications, including deep sea, shallow waters, or inland waters [15]. This sonar is commonly used in marine surveying and mapping, submarine geological exploration, and detection of seabed features [16,17,18]. SSS is probably the best tool for searching and locating shipwrecks that enables the ability to “see” hundreds of meters to each side of the towfish with incredible detail. However, it is worth remembering that feature detection and recognition from sonar imagery are mostly based on manual interpretation, and, thus, its accuracy is significantly affected by the experience of the sonar map reader [19].
This study shows how remote sensing data, especially those acquired with side-scan sonar technology, is used to identify the shipwreck. The process of identifying the object is described based on the shipwreck of World War II, General von Steuben, lying in the Baltic Sea. Based on a comparative analysis of archival documents with Remote Sensing data, taking into account the condition of the wreck, it is possible to carry out a positive identification of the object. It is worth noting that the wreck identification process is performed without the need for diving or ROV inspection of the shipwreck.
The article is structured as follows. The introduction to the study, purpose, and key publications cited are provided in Section 1. Section 2 details the history of the German liner General von Steuben. Section 3 present the circumstances of discovery the wreck by the Polish Navy hydrographic survey ship, Arctowski, and introduces the survey methodology and equipment used in investigating the shipwreck. The survey results, discussion as well as method of wreck’s identification are shown in Section 4. Section 5 concludes the paper.
2. History of the General von Steuben
2.1. Early History
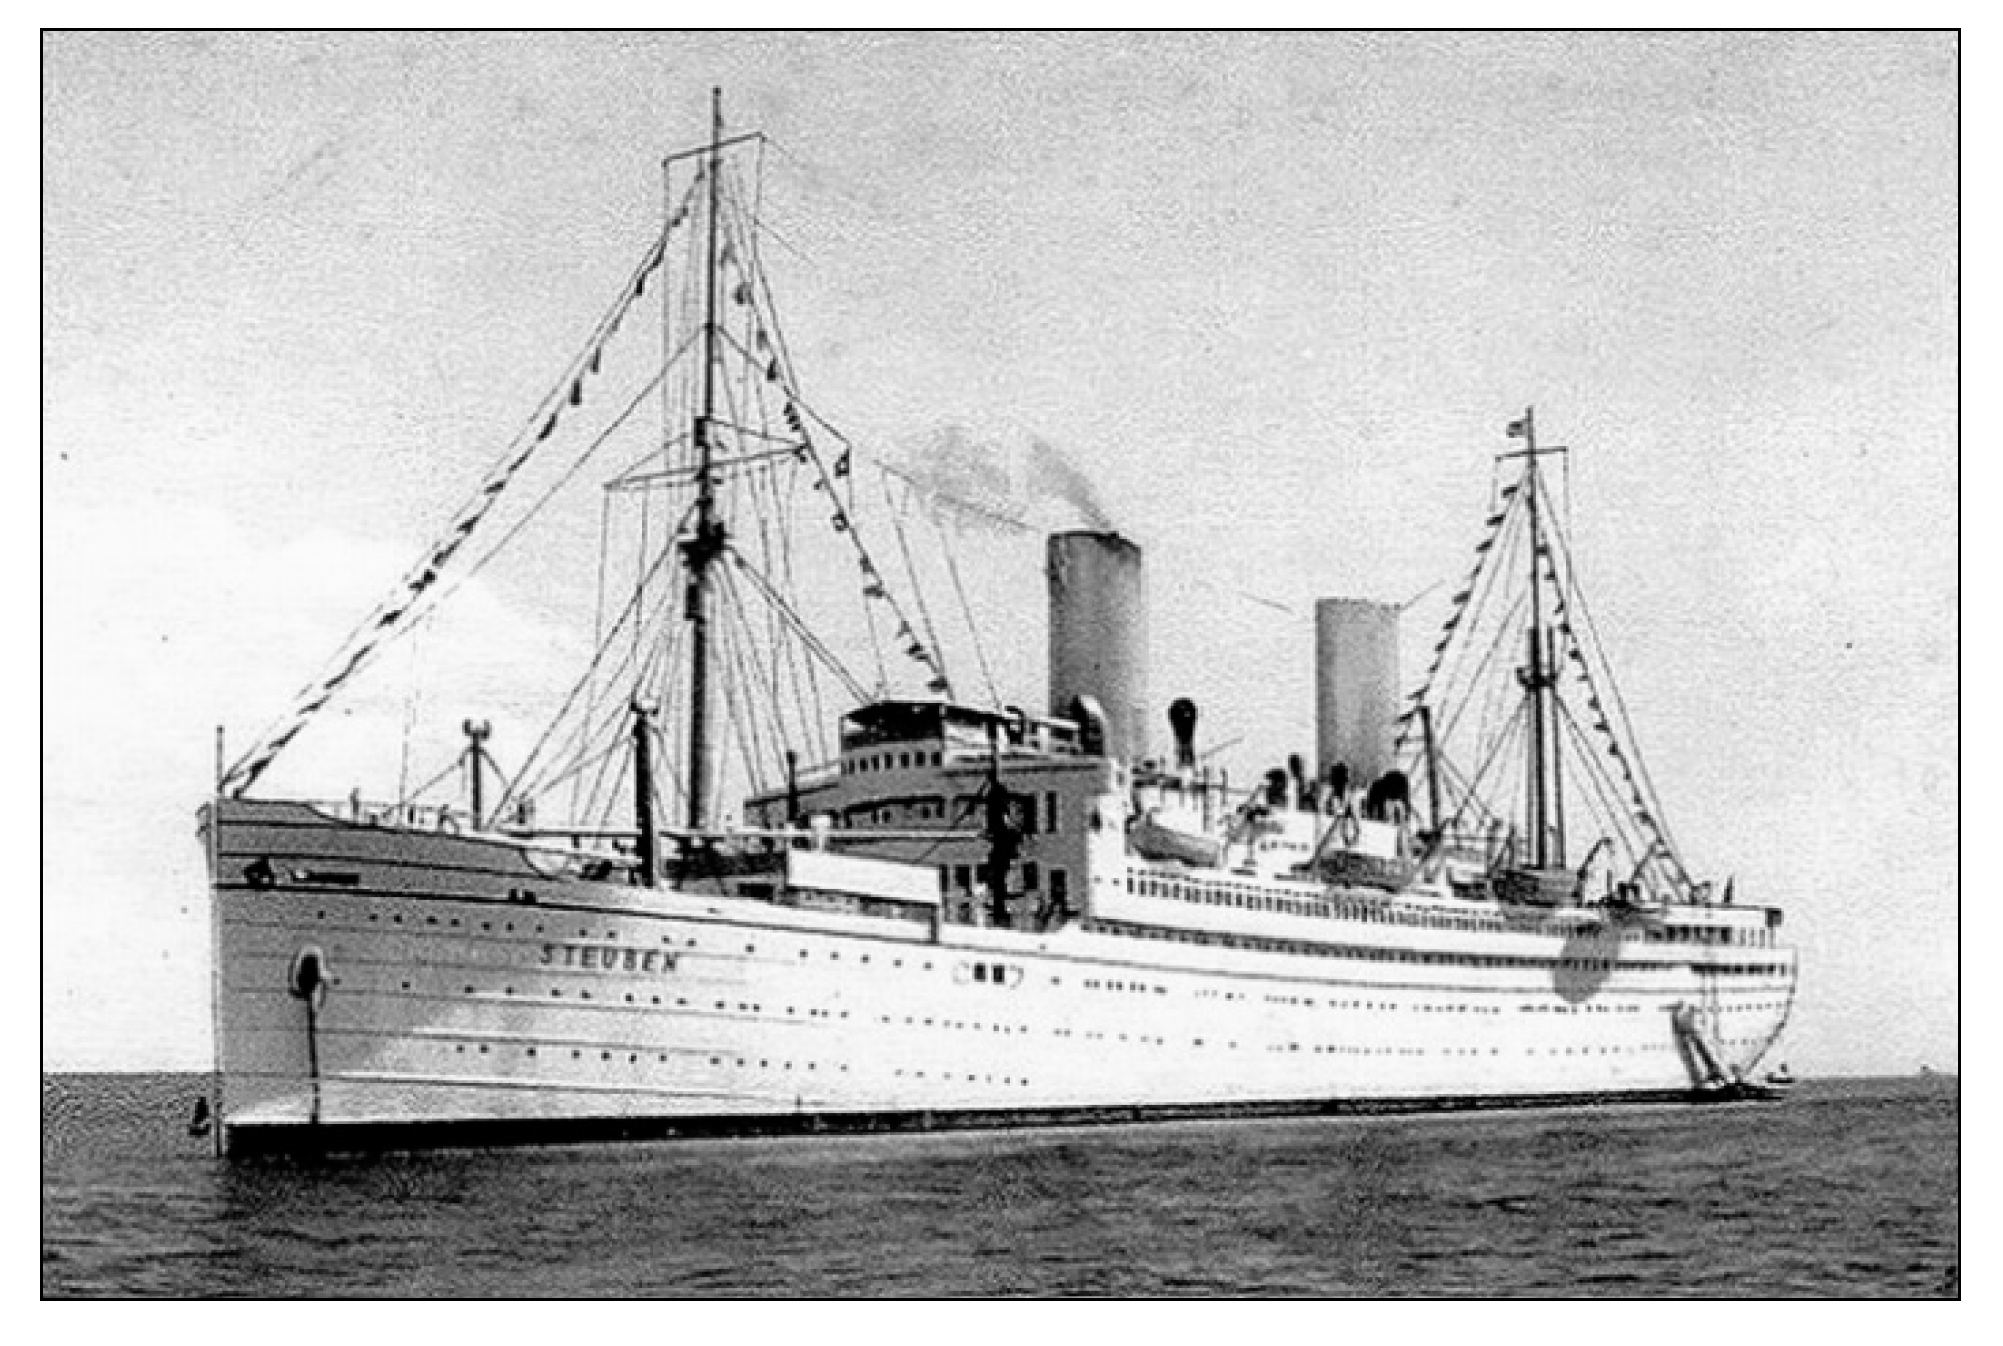
The General von Steuben was a German steamer 14,660 tons, built as the Munchen in 1923 in Vulcan shipyard (Figure 1). The luxurious passenger ship, 168 m of length, 19.8 m of breadth, and 8.5 m of draught could navigate 16 knots [20]. She was often referred to as “the beautiful, white Steuben” in advertising material from that time. The name of the ship comes from the German general fighting for independence of the United States—General von Steuben [21]. Basic ship’s technical data are shown in Table 1.
GvS was the first German commercial ocean liner after the First World War that opened the trade over the Atlantic once again [23]. Munchen was launched in the end of November 1922. She had a steam propulsion and she took 1100 passengers. In the summer of 1923, Munchen went on her first trip to New York. On 11 February 1930, while staying in the port, she suffered a fire that destroyed much of the transatlantic liner. The ship was repaired and rebuilt at the Weser shipyard in Bremen. On 20 January 1931, Munchen set sail on her first cruise under the changed name of General von Steuben. As a luxury passenger ship, she cruised on the Mediterranean and the Norwegian Sea until the outbreak of the war. On 20 December 1938, the passenger liner’s name was shortened to Steuben.
She began her career in the German Kriegsmarine after the outbreak of World War II. Steuben was equipped with 12 anti-aircraft guns and the interior was rebuilt. From 31 July 1940, she was transferred to Hamburg, where she served as a hulk in the new naval construction department. From 1 August 1944, Steuben was used as a transport ship in the Baltic for the army and wounded people. By the end of 1944, the ship made several flights from Piława to Świnoujście and from Riga to Gdynia. From December 23, for one month, the German transport ship was assigned as a hulk to the staff of the U-Boat commander in the East. In January 1945 she was reclassified as a troop-ship for the wounded (Verwundeten-Transport-Schiff (VTS)). Steuben made her last cruise in February 1945, sharing the fate of Wilhelm Gustloff [24].
2.2. The Sinking of the General von Steuben
As the war drew to a close, Steuben, like many other German ships, was pressed into service to evacuate troops and civilians from the Eastern Front. On 9 February 1945, Steuben left Baltiysk, Russia, bound for Kiel, Germany, with 2500 wounded soldiers, 2000 refugees and a crew of 450. On 10 February, shortly before midnight, she was torpedoed twice by the Soviet submarine S-13 and sank with the loss of about 3000 lives [25].
Steuben, like other two ships Wilhelm Gustloff and Goya participated in the evacuation operation from East Prussia under the operation name “Hannibal” [26]. On 8 February 1945 Steuben arrived at the port of Piława. The next day, from the morning hours, the ship began to take on board refugees, wounded soldiers, and the army. Seriously wounded soldiers were placed on the walking deck on unfolded mattresses, less injured on the lower decks. Refugees squeezed in between them. The ship had one goal: To reach Kiel as soon as possible to unload the wounded and fugitives. At around 15:30 tugs led the ship to the center of the port basin. There she was joined by escort ships, the old “T-196” torpedo boat, with a displacement of 810 tons, and the “TF-10” torpedo hunter [21].
It was thought that at high speed of Steuben, dark night, and bad weather conditions it would be possible to sneak out secretly and unnoticed. There was also no required number of life-saving equipment (lifeboats, rafts, and life jackets) onboard the transporter. If the ship was torpedoed, launching lifeboats and rafts would not be fast or efficient due to icy davit. The sea was calm, but the sky was dark, promising snow. Initially, Steuben and the torpedo boat “T-196” went at a speed of 10 to 12 knots. In the basin between Pomerania and Słupsk Bank, the speed was increased to the maximum, because here, Wilhelm Gustloff was recently sunk. At 00:50 on Saturday, 10 February 1945, S-13 fired two torpedoes from stern [20]. Both were accurate. Soon after, further explosions followed, probably under pressure boilers. A few minutes after the torpedo explosion, the bow deck sank into the front funnel. Shortly after one o’clock the ship finally began to sink. About twenty minutes after torpedoing, the ship went down. The rescue operation did not amount to much. The escorting torpedo boat, first tried to destroy the submarine, then for many it was too late. Only 300 people were saved, mostly soldiers [21]. The sinking of the Steuben just after torpedoing Wilhelm Gustloff and almost in the same place was another severe defeat for the German command. The wreck successfully hid in the Baltic Sea for 59 years [27].
3. Materials and Methods
3.1. Discovery of the Shipwreck
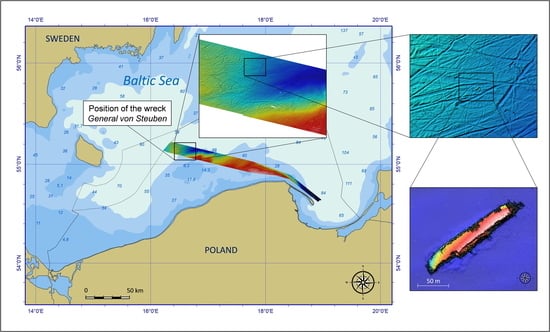
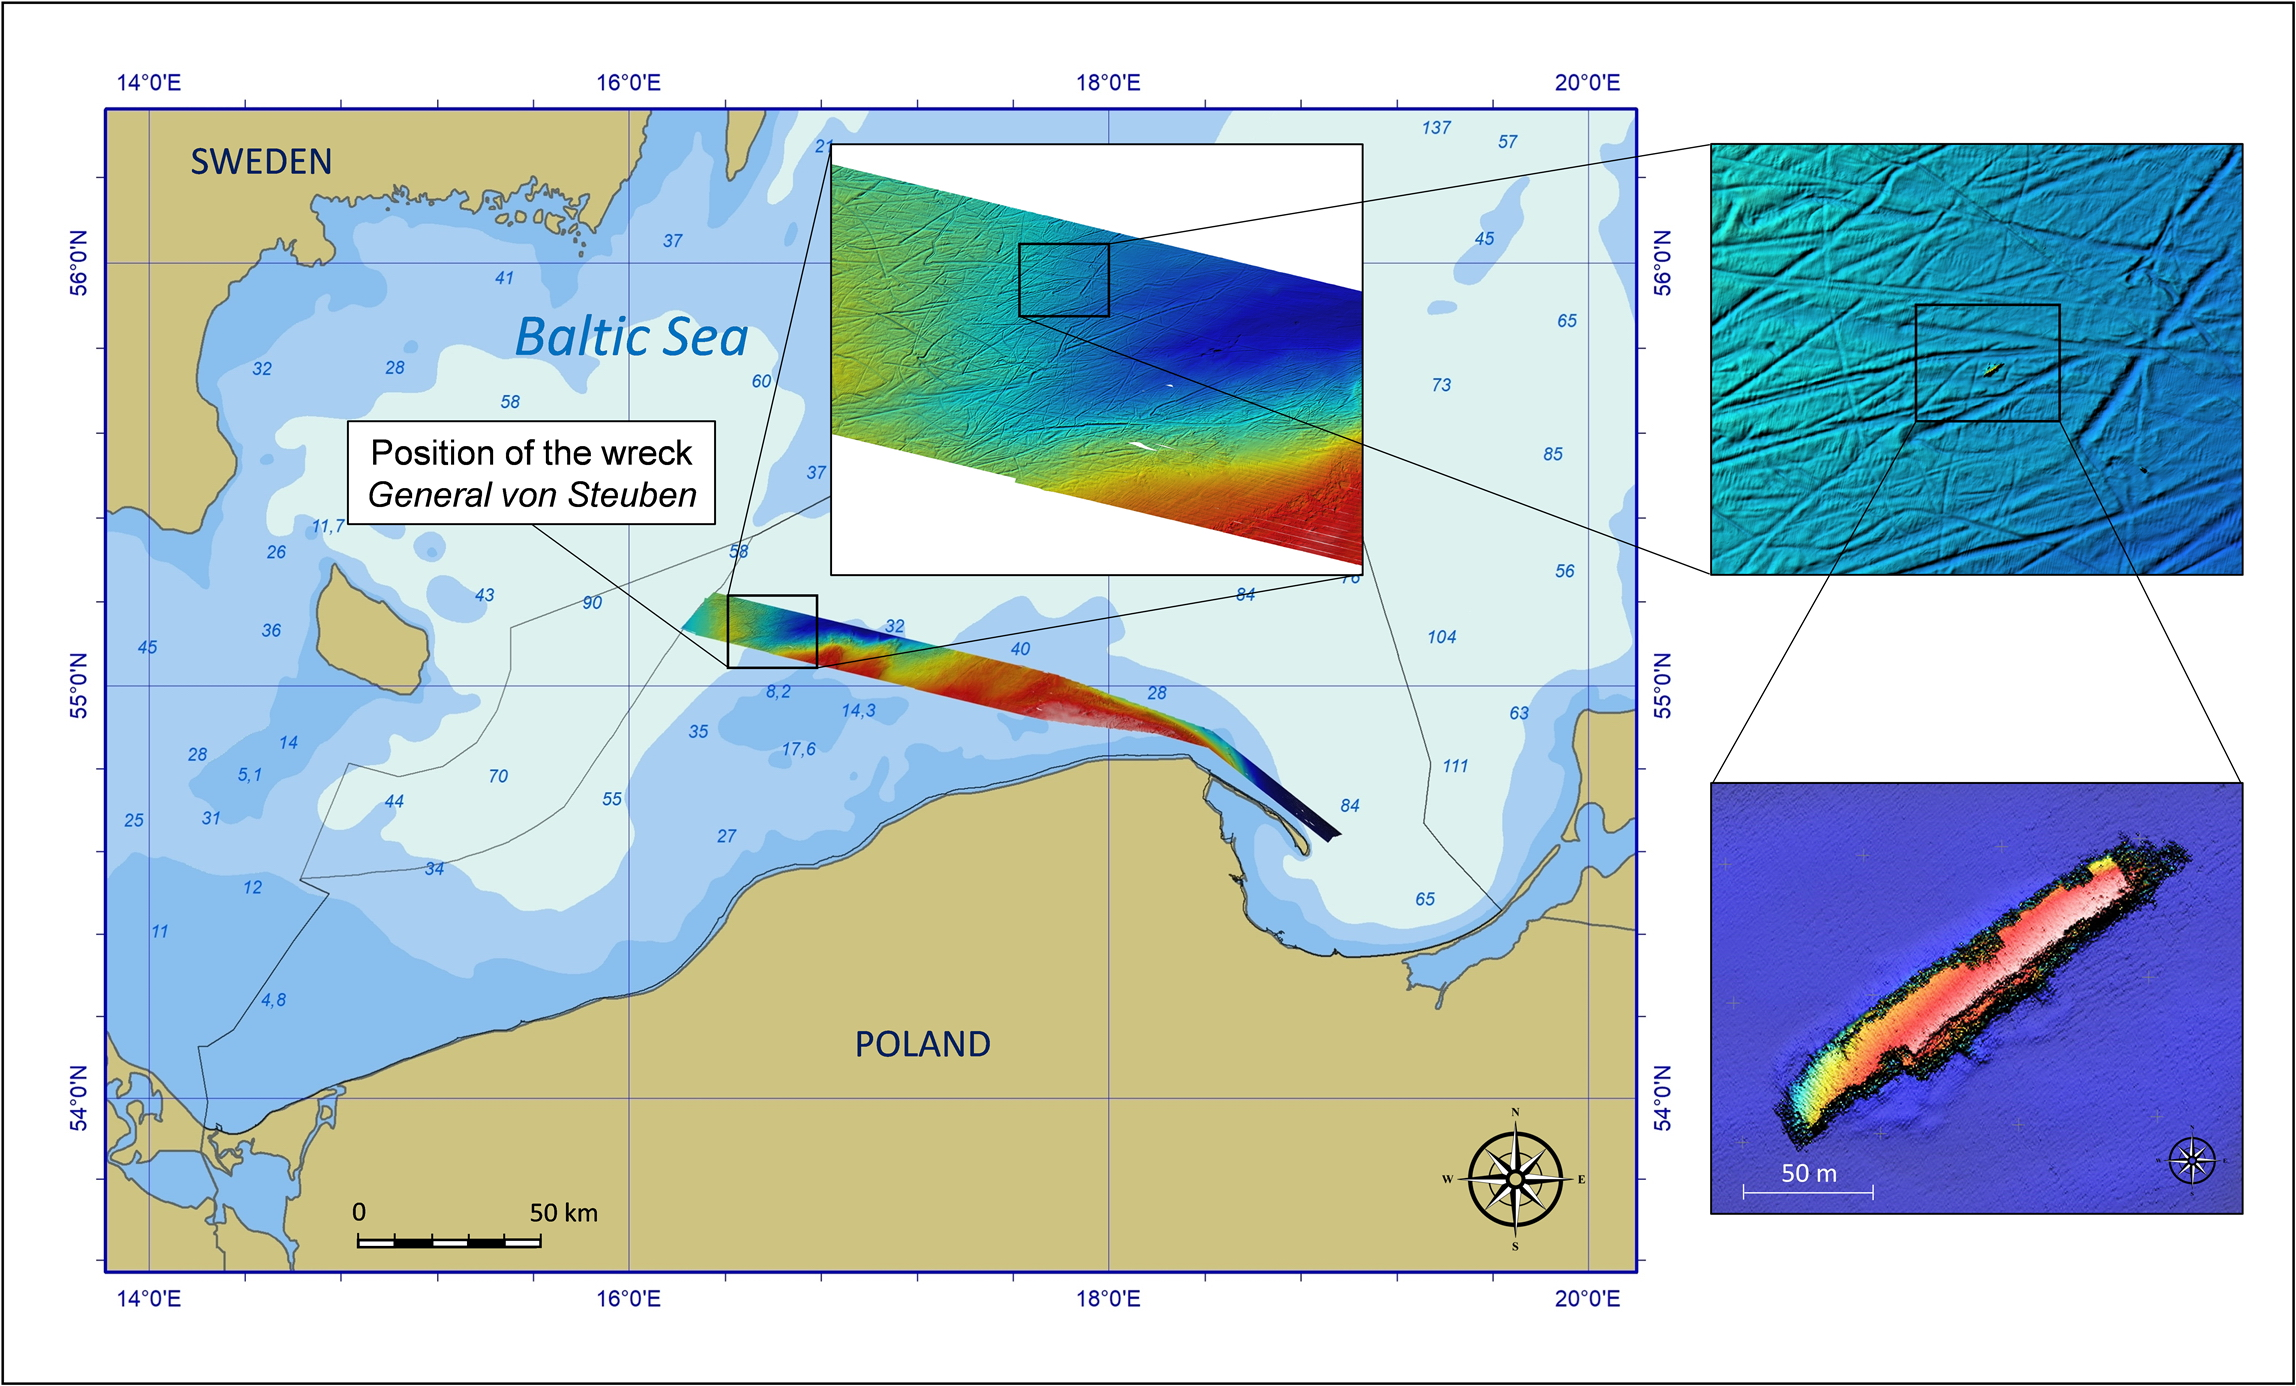
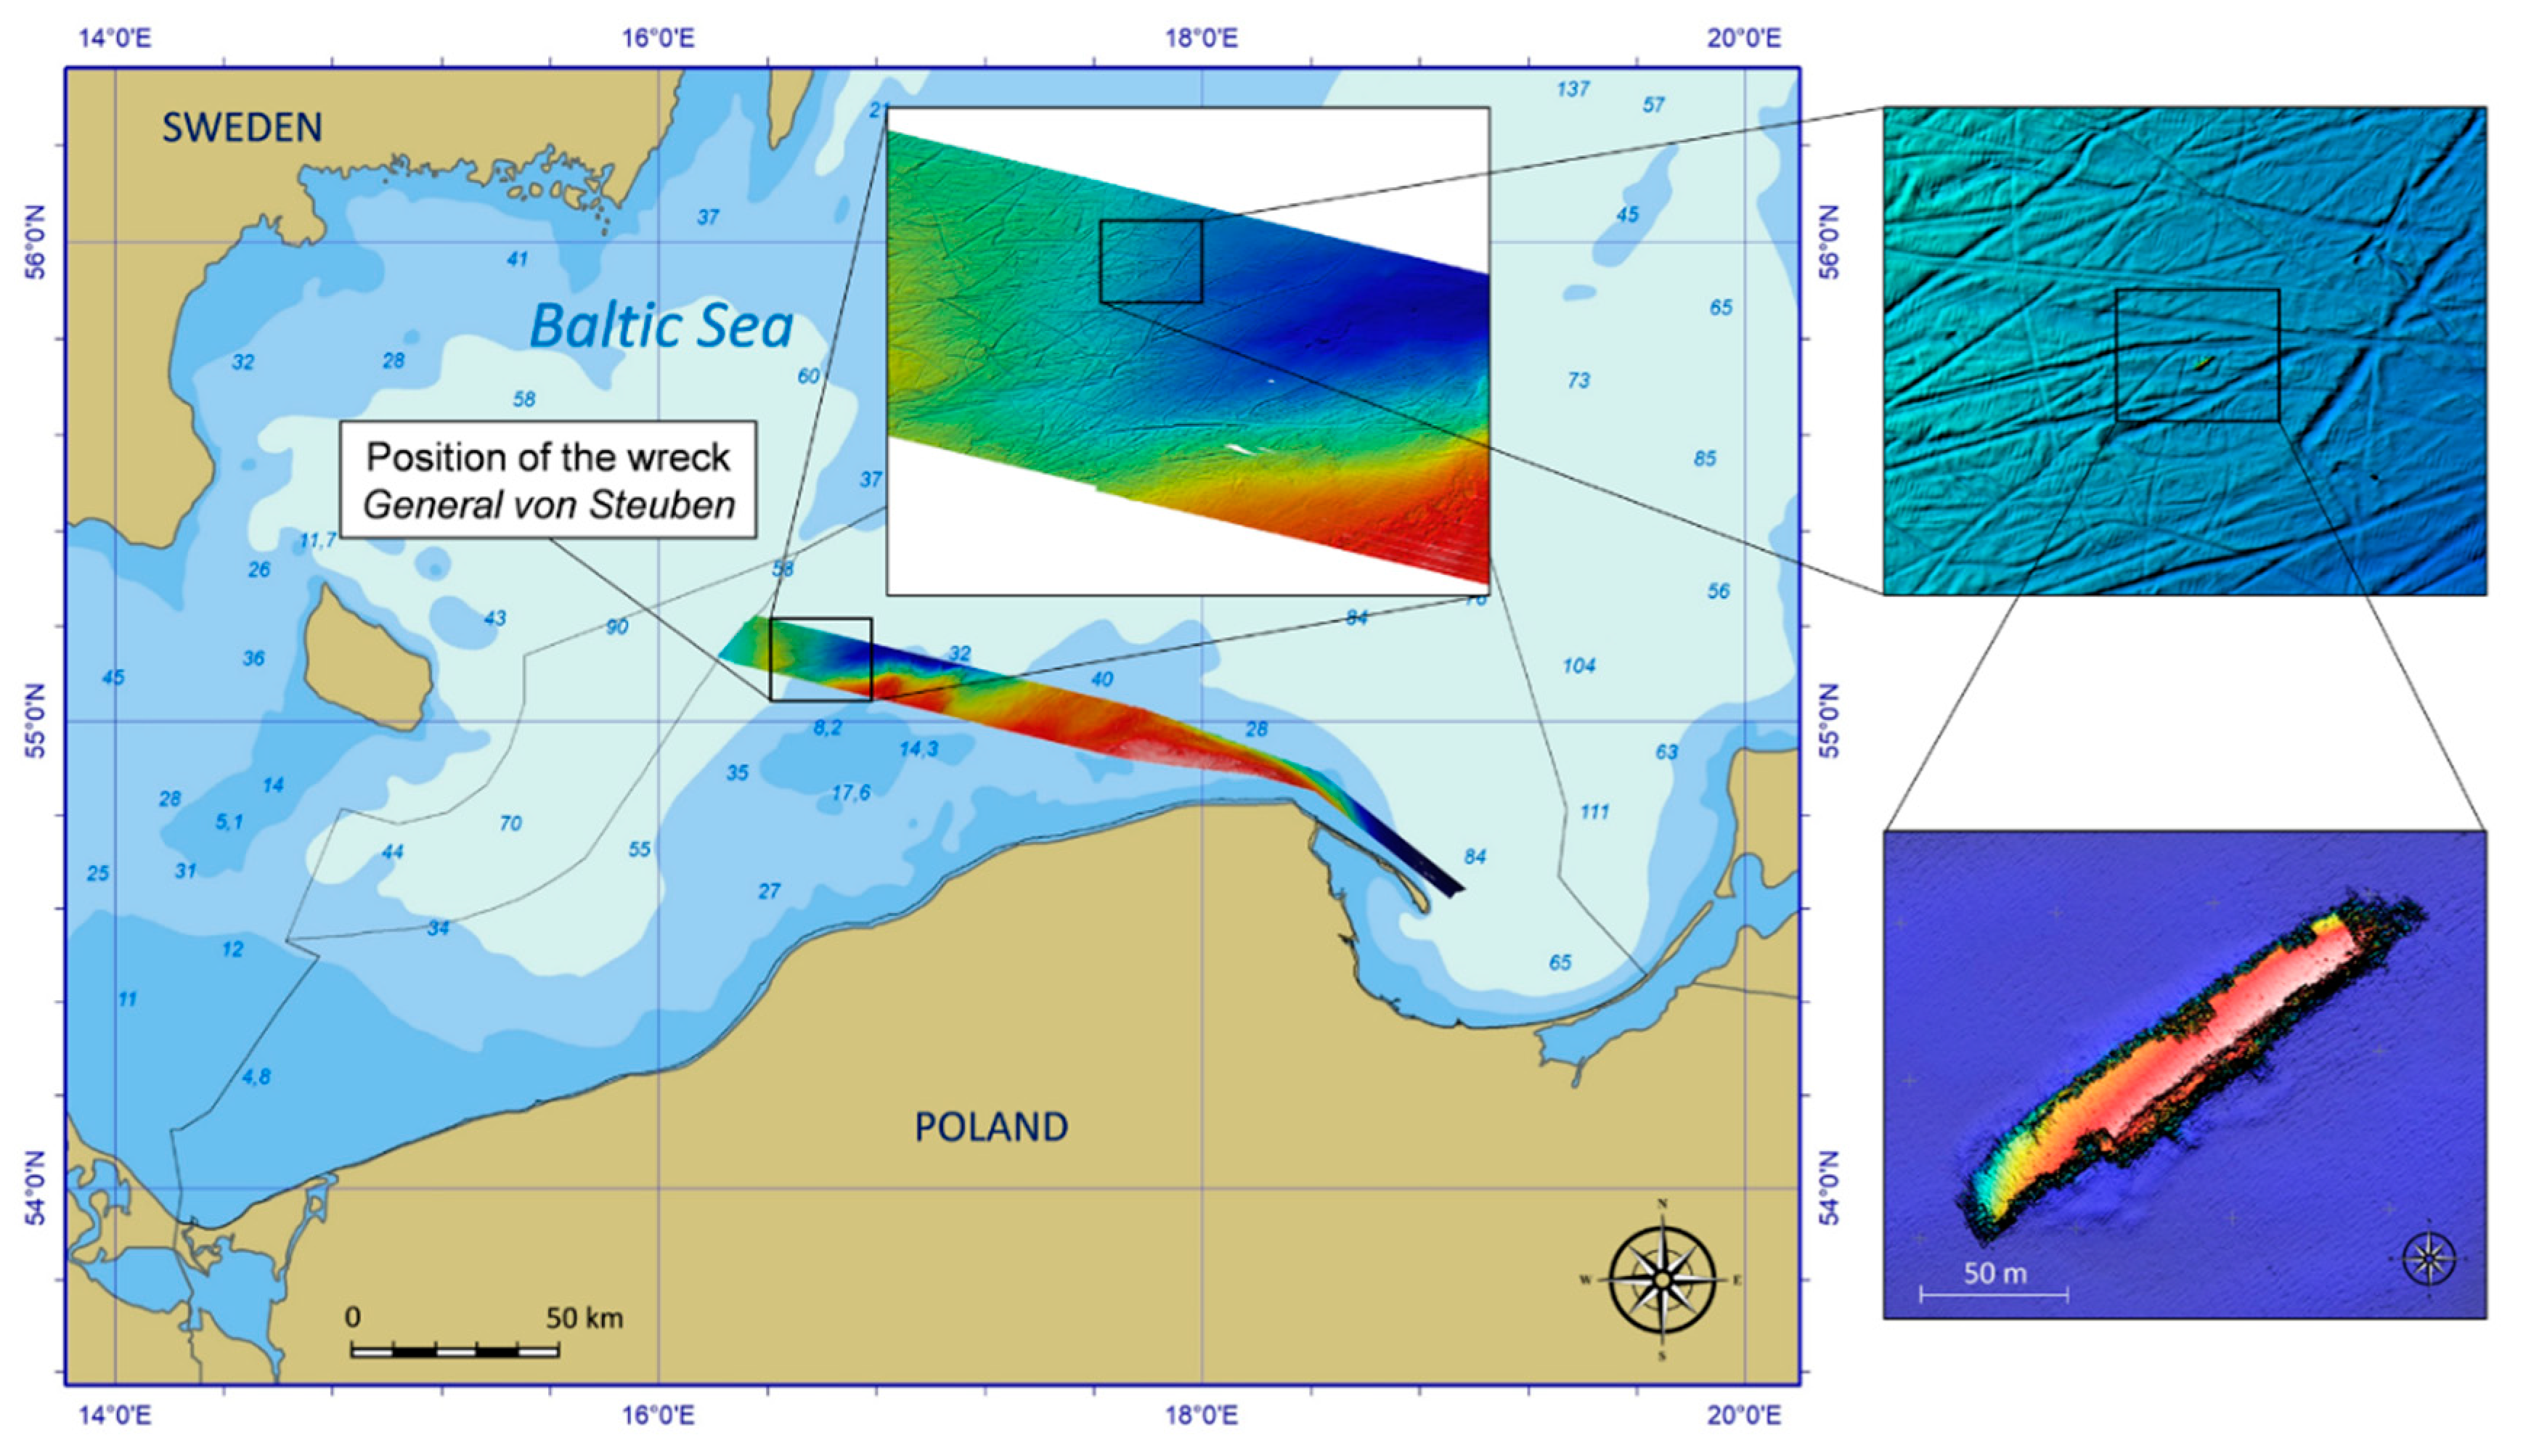
In May 2004, the Polish Navy hydrographic ship Arctowski carried out survey measurement in the exclusive economic zones (EEZ) of Poland (Figure 2). Bathymetric measurements of fairways, side-scan sonar survey as well as locating of underwater objects and navigational obstructions were the main tasks for the survey ship. At 05:30, 26th of May 2004 sonar operator noticed depth change in multibeam echosounder system display. At the same time hull-mounted side-scan sonar recorded a long sharp echo with clear acoustic shadow. There was no wreck in that site according to the underwater objects database. There was no wreck on the nautical chart, neither. At that moment, the sonar officer did not realize that the crew of Arctowski had discovered the shipwreck of the Steuben, a secret of World War II in the Baltic Sea.
3.2. Survey Planning
Newly found wrecks or features which may be dangerous to underwater or surface navigation are to be reported to the National Hydrographic Office (NHO). The role of NHO in Poland is fully within the Hydrographic Office of the Polish Navy (HOPN). Shipwrecks or artificial obstructions that protrude above seafloor may pose a threat to shipping over continental shelf areas. All such targets must be located, investigated, and recorded [28].
After the discovery of a new, uncharted shipwreck hydrographers of the Arctowski started planning the detailed hydrographic survey. The main purpose of the works after discovery of the shipwreck was to determine the exact coordinates of the object, define her geometric dimensions, orientation, measure the safe depth value over the wreck, and determine the type of sea bottom.
3.3. Mapping the Shipwreck-Site
Prior to the survey, the calibration of multibeam echosounder (patch test) was performed and the sound velocity in the water column was measured. Then the actual distribution of sound velocity was introduced into the system. A grid of several dozen parallel survey lines was planned using the QINSy software ver. 7.5 (Quality Integrated Navigation System developed by Quality Positioning Service (Zeist, The Netherlands)). The survey lines were designed to be parallel to the longer axis of the detected wreck. The use of a systematic series of parallel straight lines is the most efficient way of covering a survey area. Weather conditions for the survey were fair with a slight sea state and light wind. Speed over ground was maintained as close to 4 knots as possible. In practice, it varied between 3 and 5 knots depending on the survey direction.
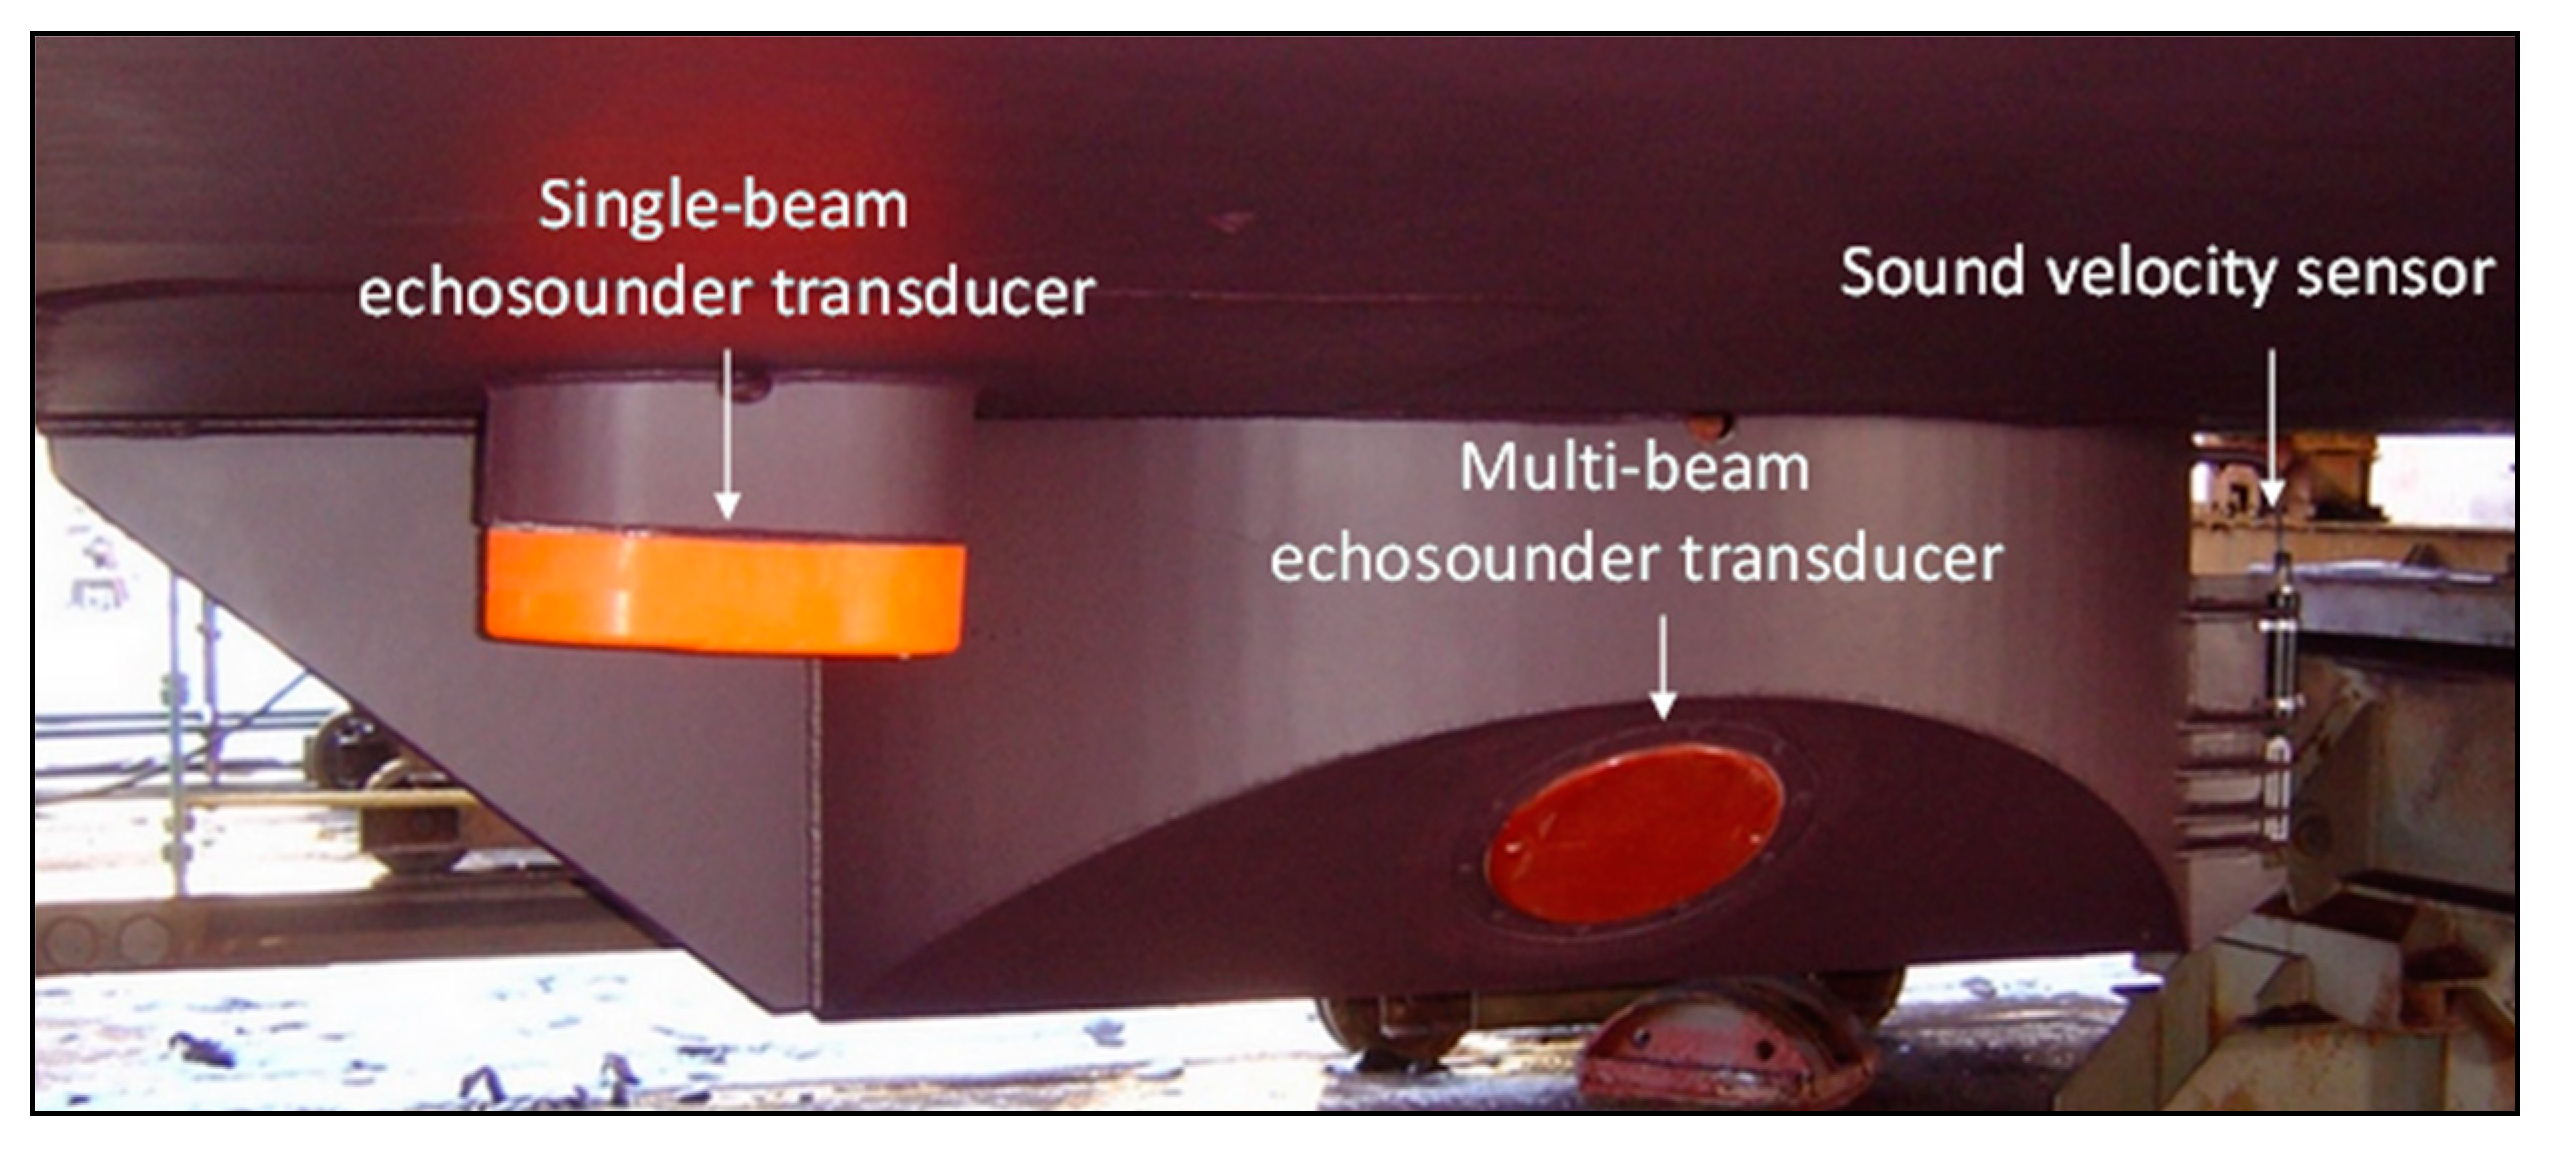
In the first stage of research, hydrographers of the Arctowski took advantage of a multibeam echosounder. MBES is widely used for conducting bathymetric surveys and offers the possibility of complete bottom coverage [29,30]. Multibeam data were acquired using a hull-mounted Kongsberg Maritime EM3002D. The EM3002D is a dual-head configuration system with a mounting tilt angle of the single sonar head 40° (Figure 3). An angular swath coverage used was 140°. The array lengths used in an EM3002D result in 1.5° by 1.5° beams at broadside [31]. The system sonar frequency was nominally 300 kHz. There were 160 simultaneous receive beams for each sonar head. They were either spaced in an equiangular or equidistant pattern within the coverage specified by the operator. There was also a high-density mode where 254 soundings are acquired per head and ping [32]. EM3002D was delivered with the mini Valeport sound velocity sensor (SVS) mounted in the rear part of the blister.
The exact position, heading and roll, and pitch and heave compensation were provided by Seapath 300 multifunction system. The system has two built-in GPS receivers for measuring the position, heading, and speed of the unit. The Seapath also includes the latest generation Motion Reference Unit MRU5. Having a complete depth distribution over the wreck and in her vicinity, several survey lines were designed to pass directly over the object. Then we did measurement using two-channels single-beam echosounder to detect the minimum depth over the wreck.
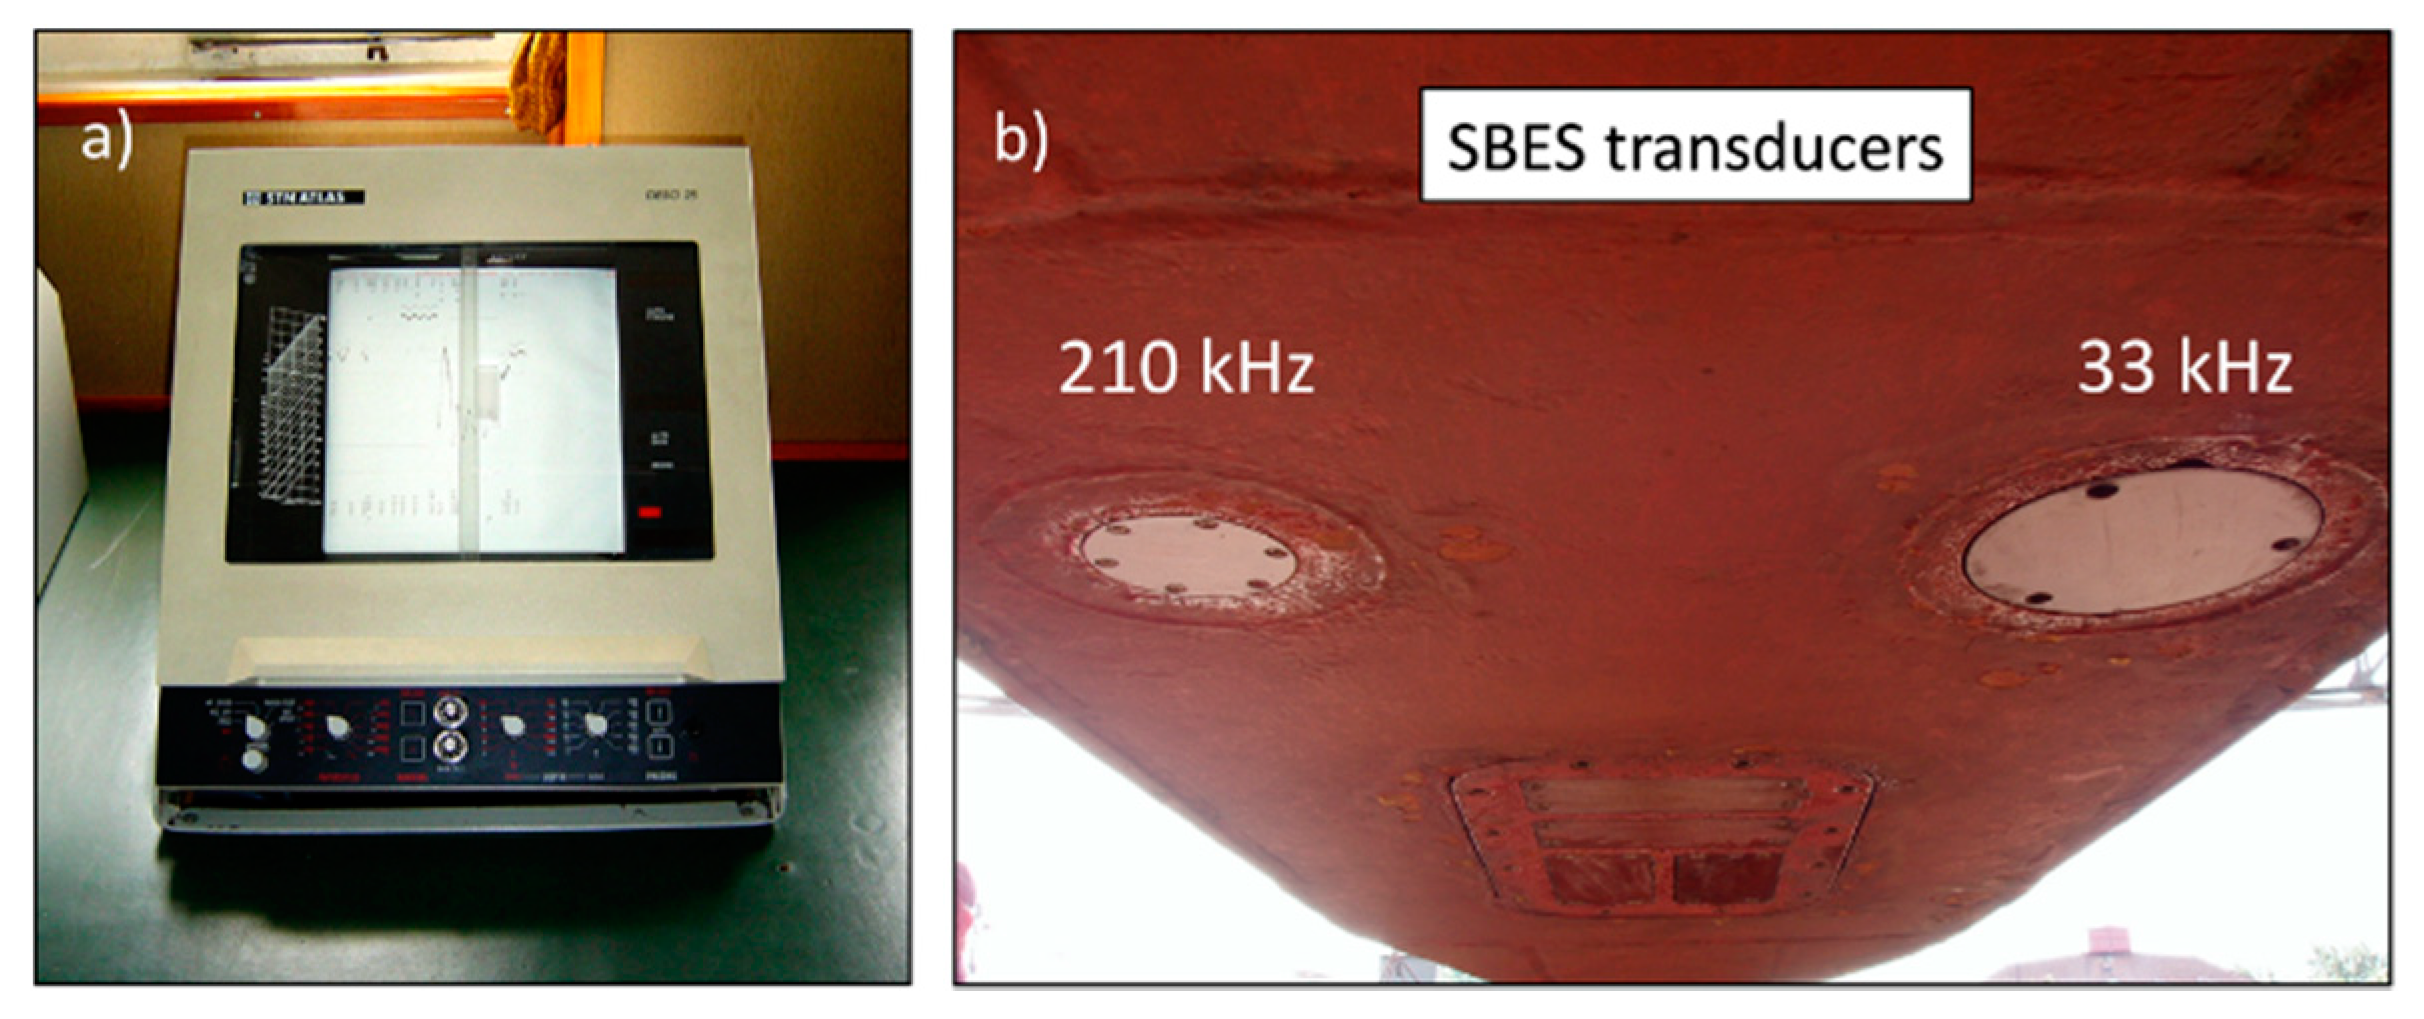
SBES projects a pulse of acoustic energy from the transducer to the seabed. The time delay interval between pulse transmission and reception of the reflected echo is accurately measured and converted into a distance using an estimate of the harmonic mean sound speed along the propagation path [33]. We used two-channels single-beam echosounder to detect the minimum depth over the wreck. Hydrographic SBESs are usually built with two channels of low and high frequency. This allows for the separation of the bottom return from soft layer sediments and the underlying hard surface of the seabed. We applied single-beam echosounder ATLAS Elektronik DESO 25 (ATLAS Elektronik, Bremen, Germany) operating at 33 kHz and 210 kHz (Figure 4).
The wreck should be properly examined by echosounders first. Having a full depth distribution, the height, and orientation of the wreck, it was possible to design survey lines for the sonar survey. Our goal was to obtain as much sonar images as possible. To do that crew of the survey ship Arctowski took advantage of side-scan sonars. High-resolution seafloor mapping with side-scan sonar are commonly used to examine the seabed in coastal waters as well as to survey the shipwrecks and other obstacles [34,35,36]. As for the side-scan sonar, there are in general two types: (a) towed systems and (b) hull-mounted sonars [37]. Sonar emits a wide vertical (40–50°) and narrow horizontal beam (0.2–1°) [38] and receives seabed echoes at fixed time intervals to produce a high-resolution bottom imagery [39]. The returning echoes are displayed as one single line, where dark and light portions represent strong and weak echoes relative to the travel time.
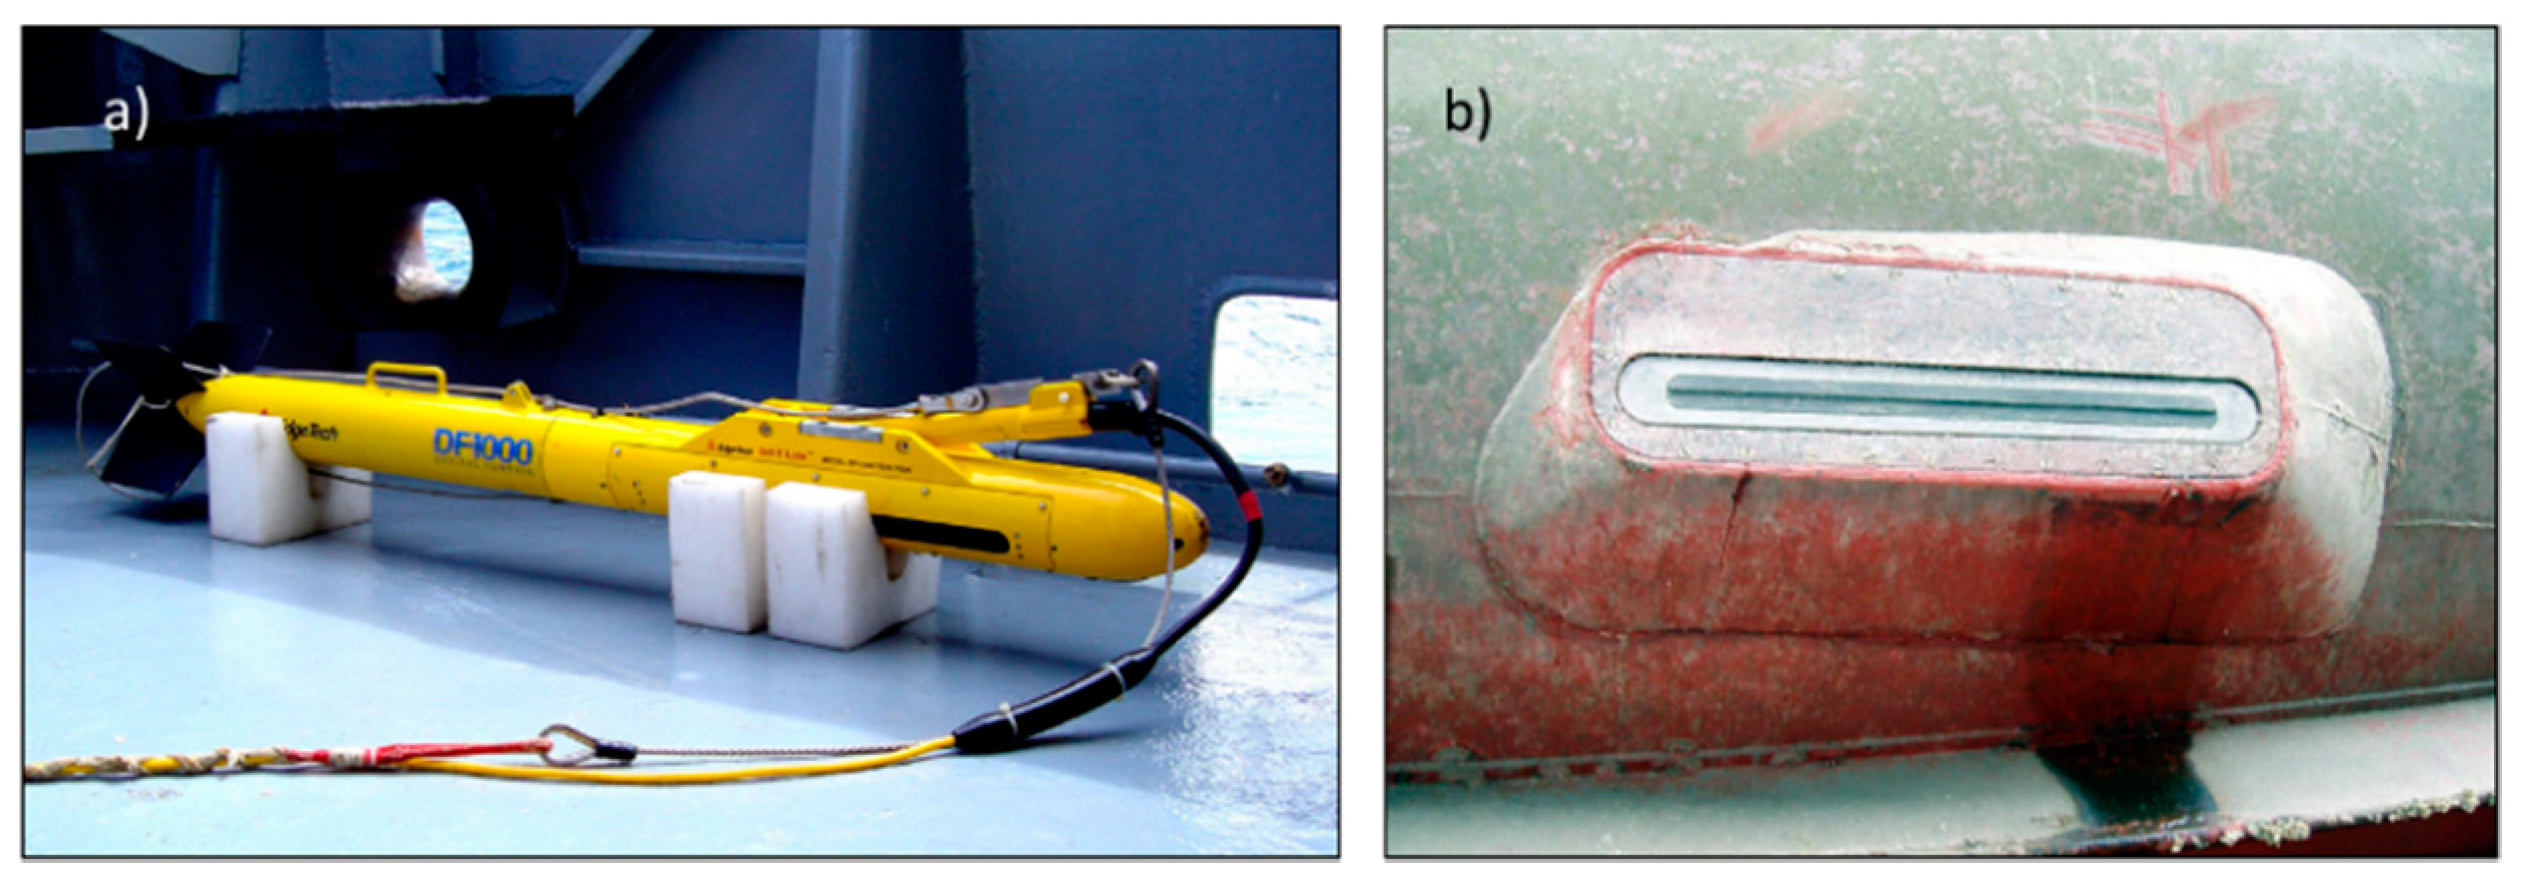
Two sonar systems were used in the research. EdgeTech DF-1000 was towed behind the Arctowski and the second one was hull-mounted side-scan sonar ACSON-100 (Figure 5). DF-1000 system features two frequencies 100 kHz and 500 kHz. Pulse length is 0.1 ms for 100 kHz and 0.01 ms for 500 kHz. Horizontal beamwidth is 1.2° (for 100 kHz) and 0.5° (for 500 kHz).
The sonar operator made use of the highest resolution and used 500 kHz mode. Acquisition ranges of 25, 40, and 75 m were tested at the site. Towed deployment of the sonar was made without an acoustic tracking beacon on the sonar. Sonar position was calculated using layback and offset method. Recording and processing was conducted using CODA data acquisition system, based on Linux. Although the manufacturer declared the maximum tow speed about 12 knots, to obtain the highest resolution and density of data possible over the object the tow speed was reduced to 3–4 knots.
Hull-mounted side-scan sonar ACSON-100 is a low frequency system operating at 100 kHz. Sonar tracks were planned parallel to the long axis of the wreck and at a lateral distance from the object. The principle from larger to smaller ranges, i.e., “from general to detail” was applied to the survey. The primary objectives of the research were to find the optimal geometry between sonar main lobe of acoustic energy and the shipwreck lying on the bottom to record good quality data.
4. Results and Discussion
A full and comprehensive data about the object was obtained. All records were used to identify the wreck and in-depth analysis. Bathymetric data and sonar images enabled the preparation of final report.
4.1. Bathymetric Data
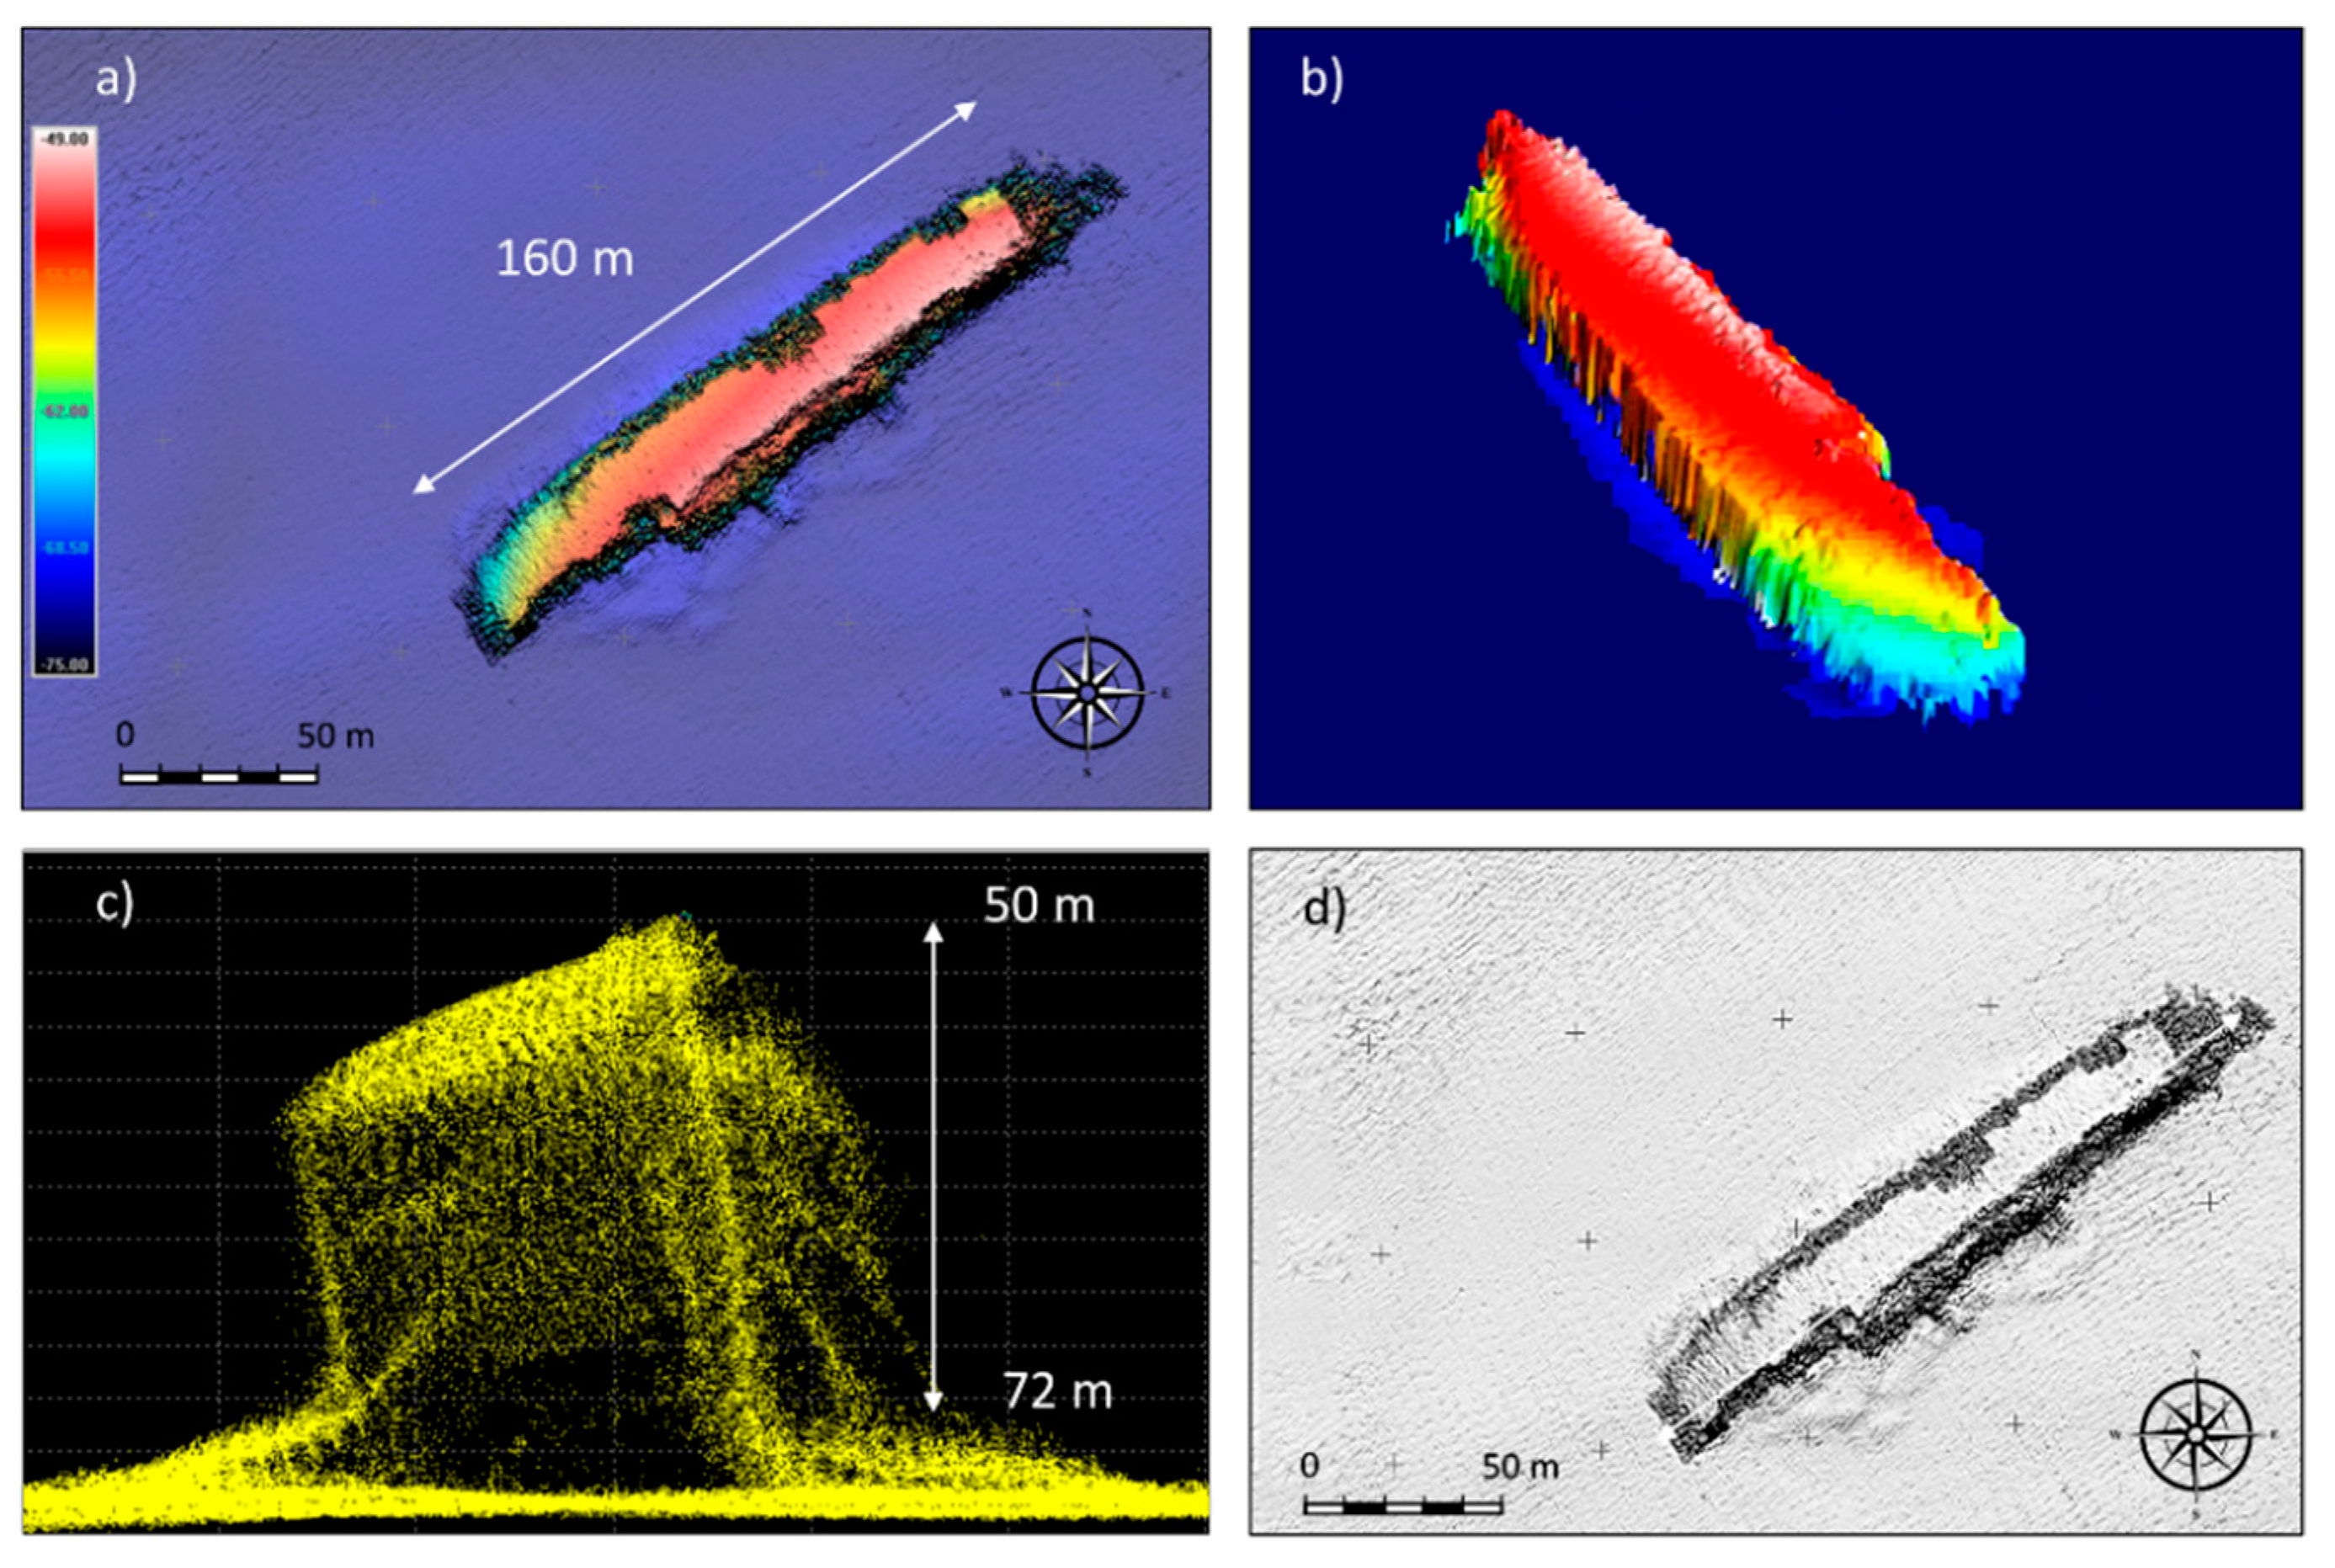
Bathymetric data were logged using QINSy acquisition software. Data processing was performed using Qloud 3D, which is an offline tool fully integrated with QINSy. The wreck lies on her port side at a depth of 71 m, and the hull reaches up to a depth of 50 m. The ship is mainly intact. In the post-processing stage various means of MBES data presentation were adopted, shown in Figure 6. One of them was combination of sun-illumination and colorized grid (Figure 6a), multibeam backscatter grid data (Figure 6d), and profile view data (Figure 6c). However, the most interesting is three-dimensional visualization of bathymetry presented as a digital terrain model (DTM) of the Steuben wreck (Figure 6b). It provides a complete picture of the wreck. The value of the visualization software used to produce the detailed images cannot be overstated. Each of sounding was attributed to given shadow of color. Owing to the applied technique of data “colorizing” one can get an idea of how the wreck looks like.
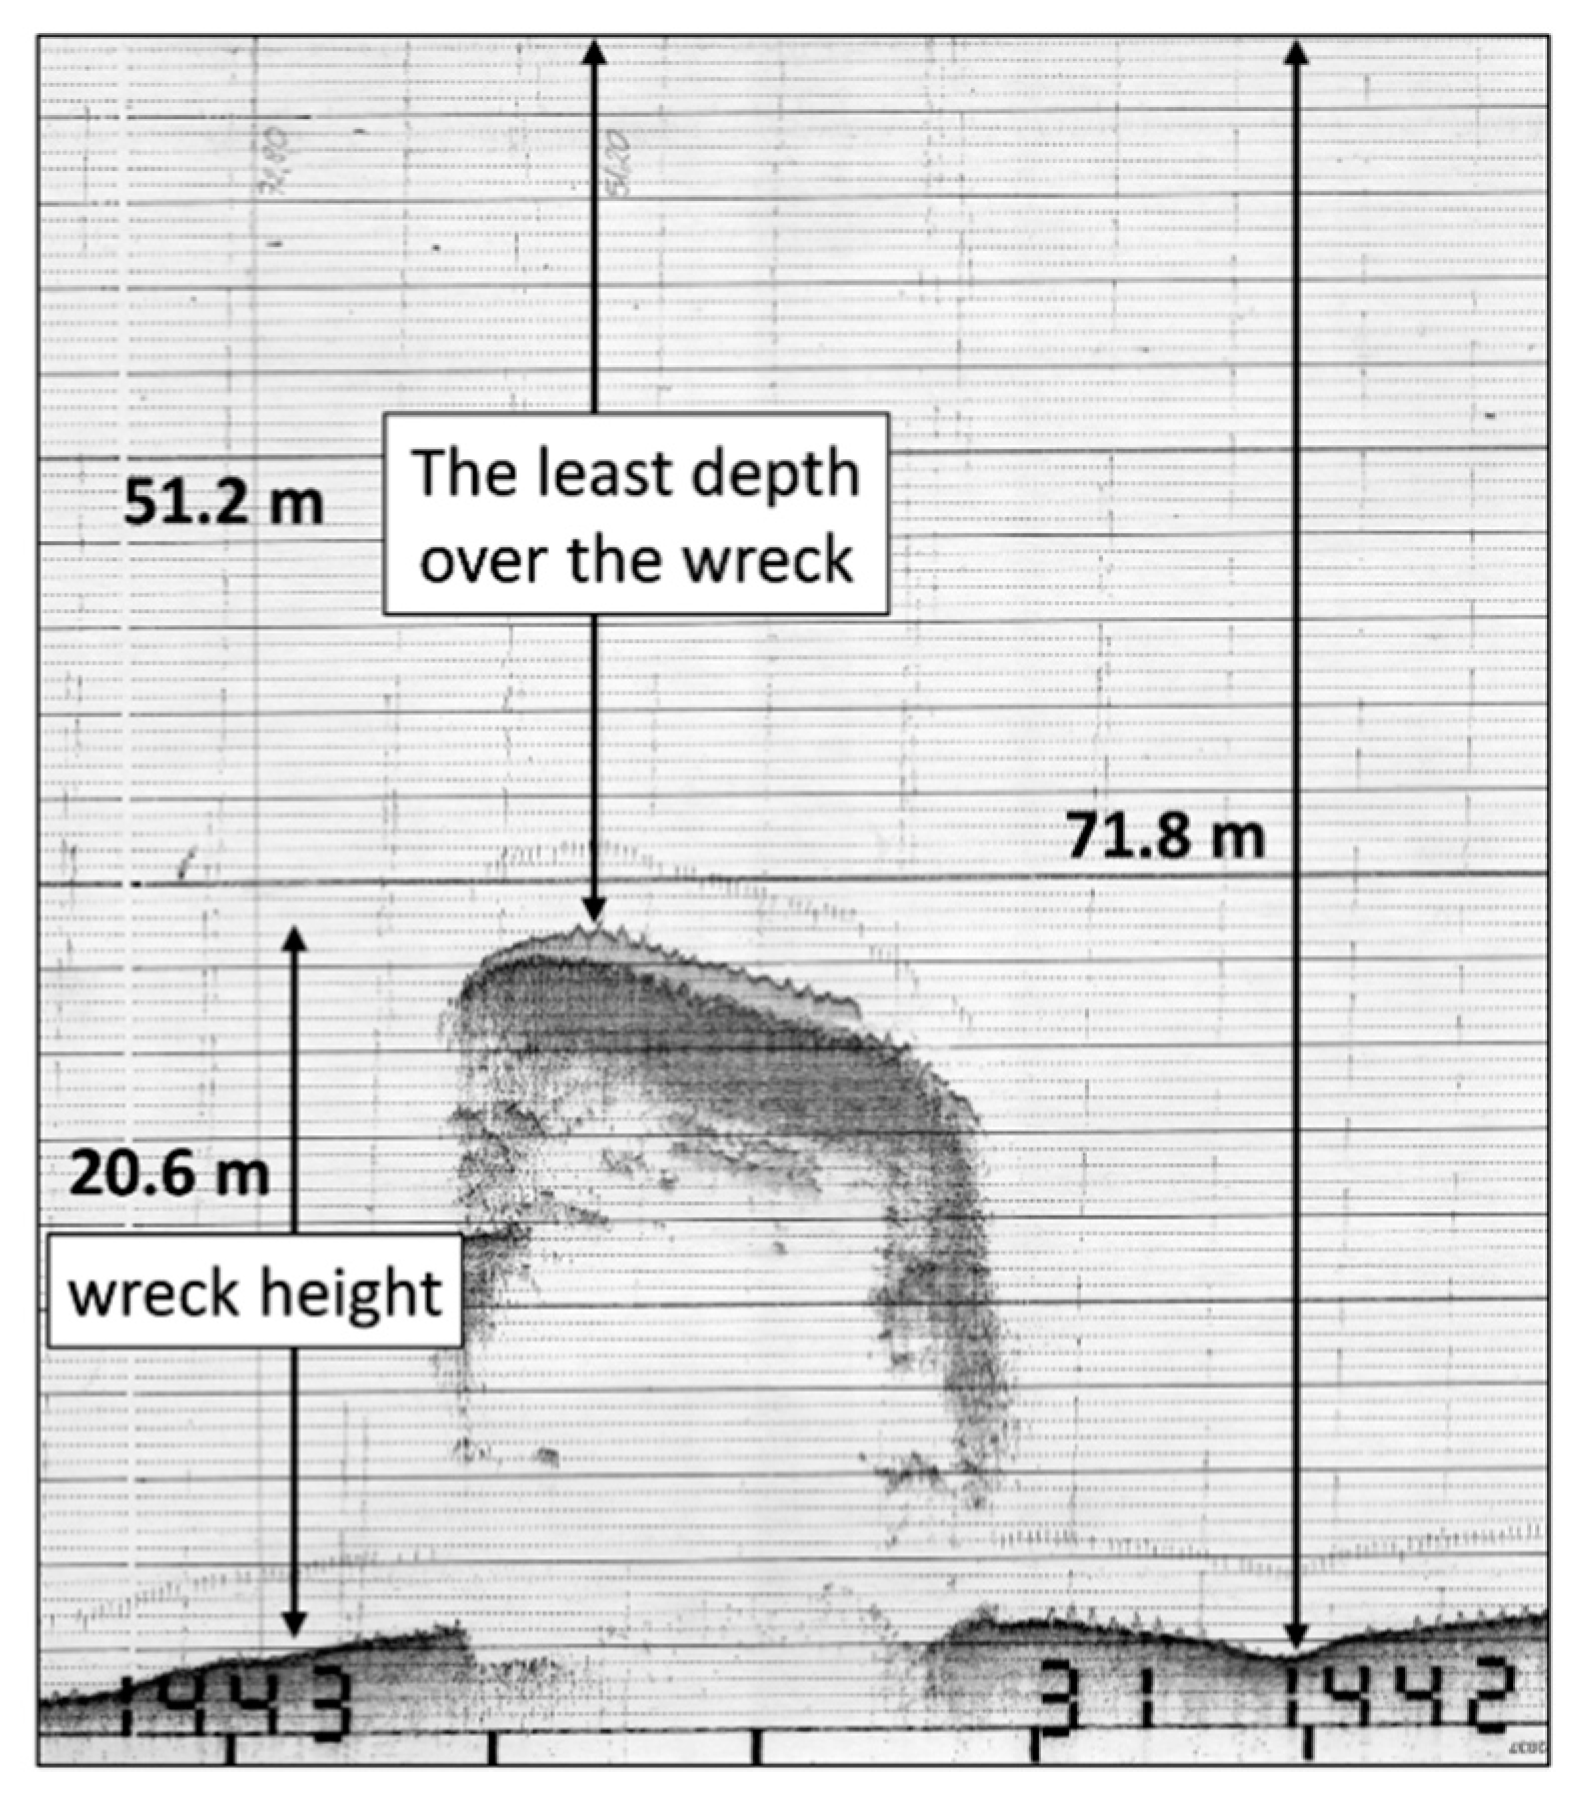
Based on the survey with single-beam echosounder the least, safe depth over the wreck was 51.2 m, the surrounding depth was on average 71–72 m, and the height of the wreck was about 20 m. If the wreck rested on an even keel, the least depth was often represented by the echo coming from the protruding mast, funnel, or superstructure. In case of Steuben, lying on the port side, the height above the bottom is nothing other than the ship’s beam, which was 19.8 m (Table 1). As a result of passing directly over the wreck, we obtained a couple of echograms. One of them is presented in Figure 7.
4.2. Side-Scan Sonar Records and Wreck’s Identification
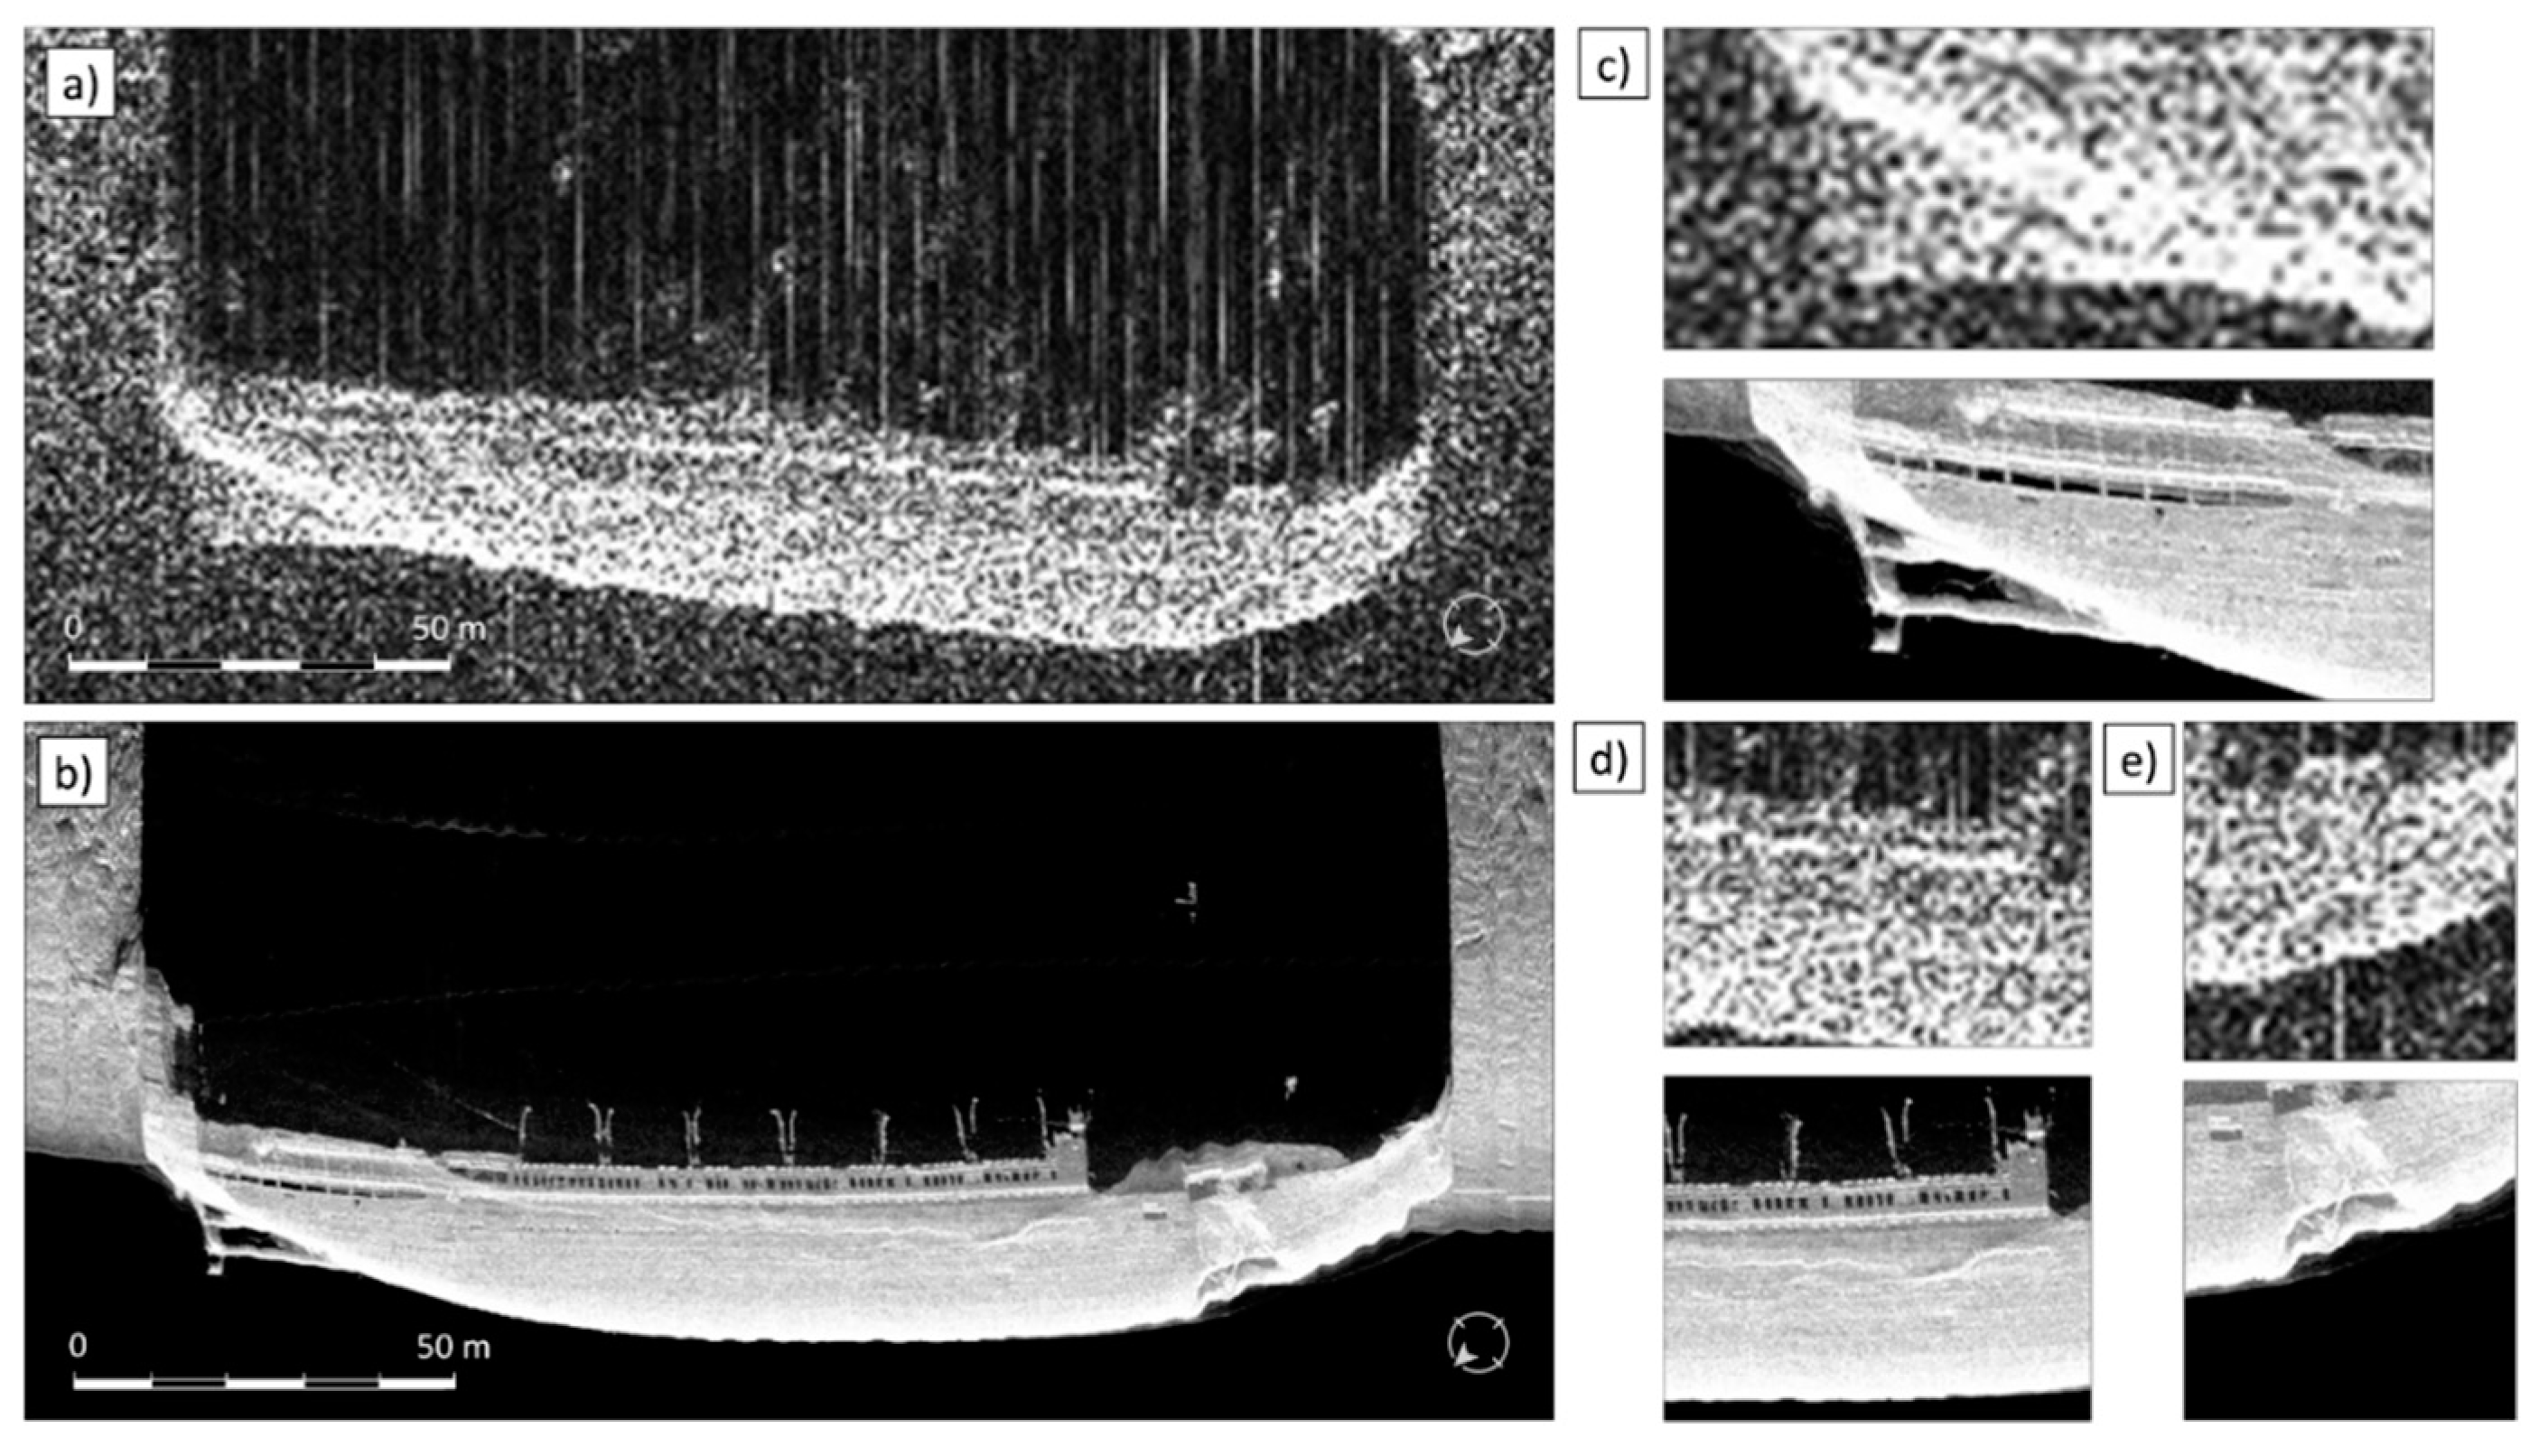
The first passes over the wreck site were performed with a hull-mounted side-scan sonar with a low frequency 100 kHz. Sonographs recorded with this system showed only a general shape of the wreck, with no resolution (Figure 8a). The next passes were done using towed, digital side-scan sonar with a frequency 500 kHz. Figure 8 demonstrates the increased resolution of a digital, high frequency system over an analog, low frequency sonar with transducers mounted in the hull of the survey ship Arctowski. It revealed differences in quality and detail between two systems used. Much more detailed pictures (Figure 8b) comes from sonar towed behind the stern of the survey ship. One can easily distinguish some characteristics such as davits (Figure 8d), shaft, propellers (Figure 8c), and quite big hole in the hull, being the result of a torpedo hit (Figure 8e).
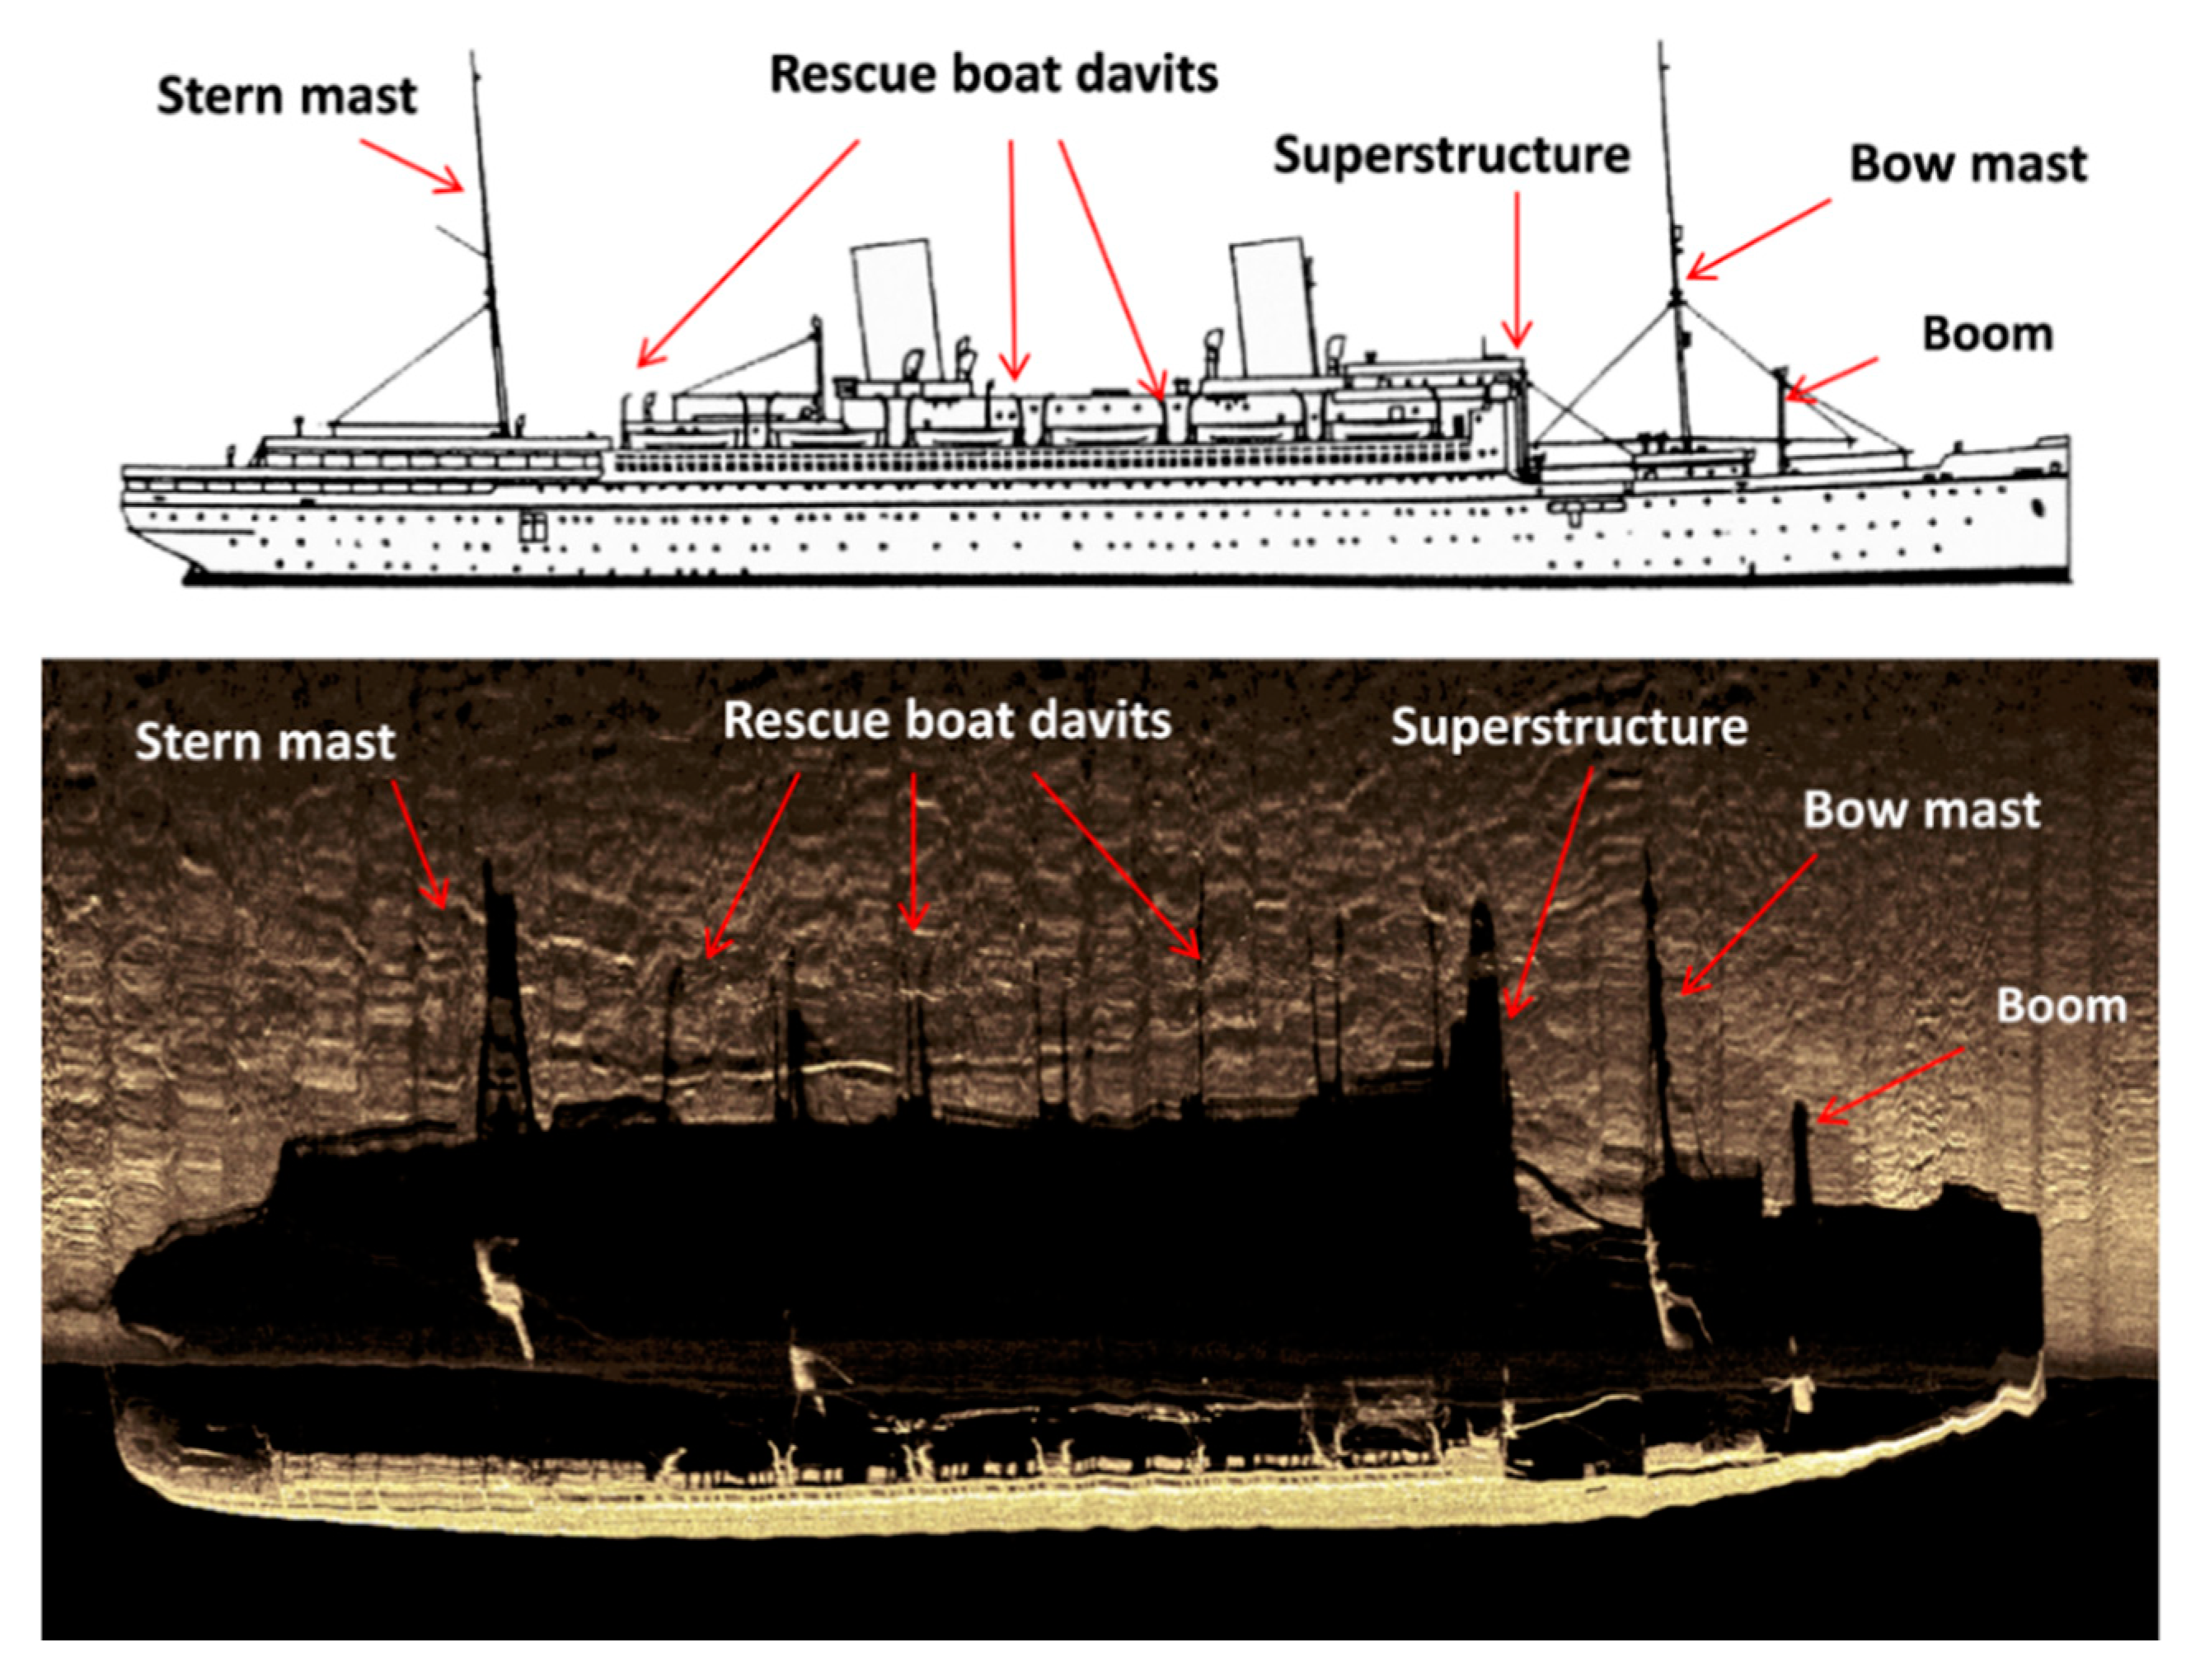
Figure 9 presents another sonogram of Steuben acquired while surveying parallel to the hull and in close lateral distance from the wreck. One can readily notice that the wreck remained intact with bow and stern masts, superstructure, davits, and boom. Measurements on the SSS display gave us primary dimensions and orientation of the wreck. The wreck’s length from sonar measurements was 160 m, height of the object 20 m, and the azimuth was 231°.
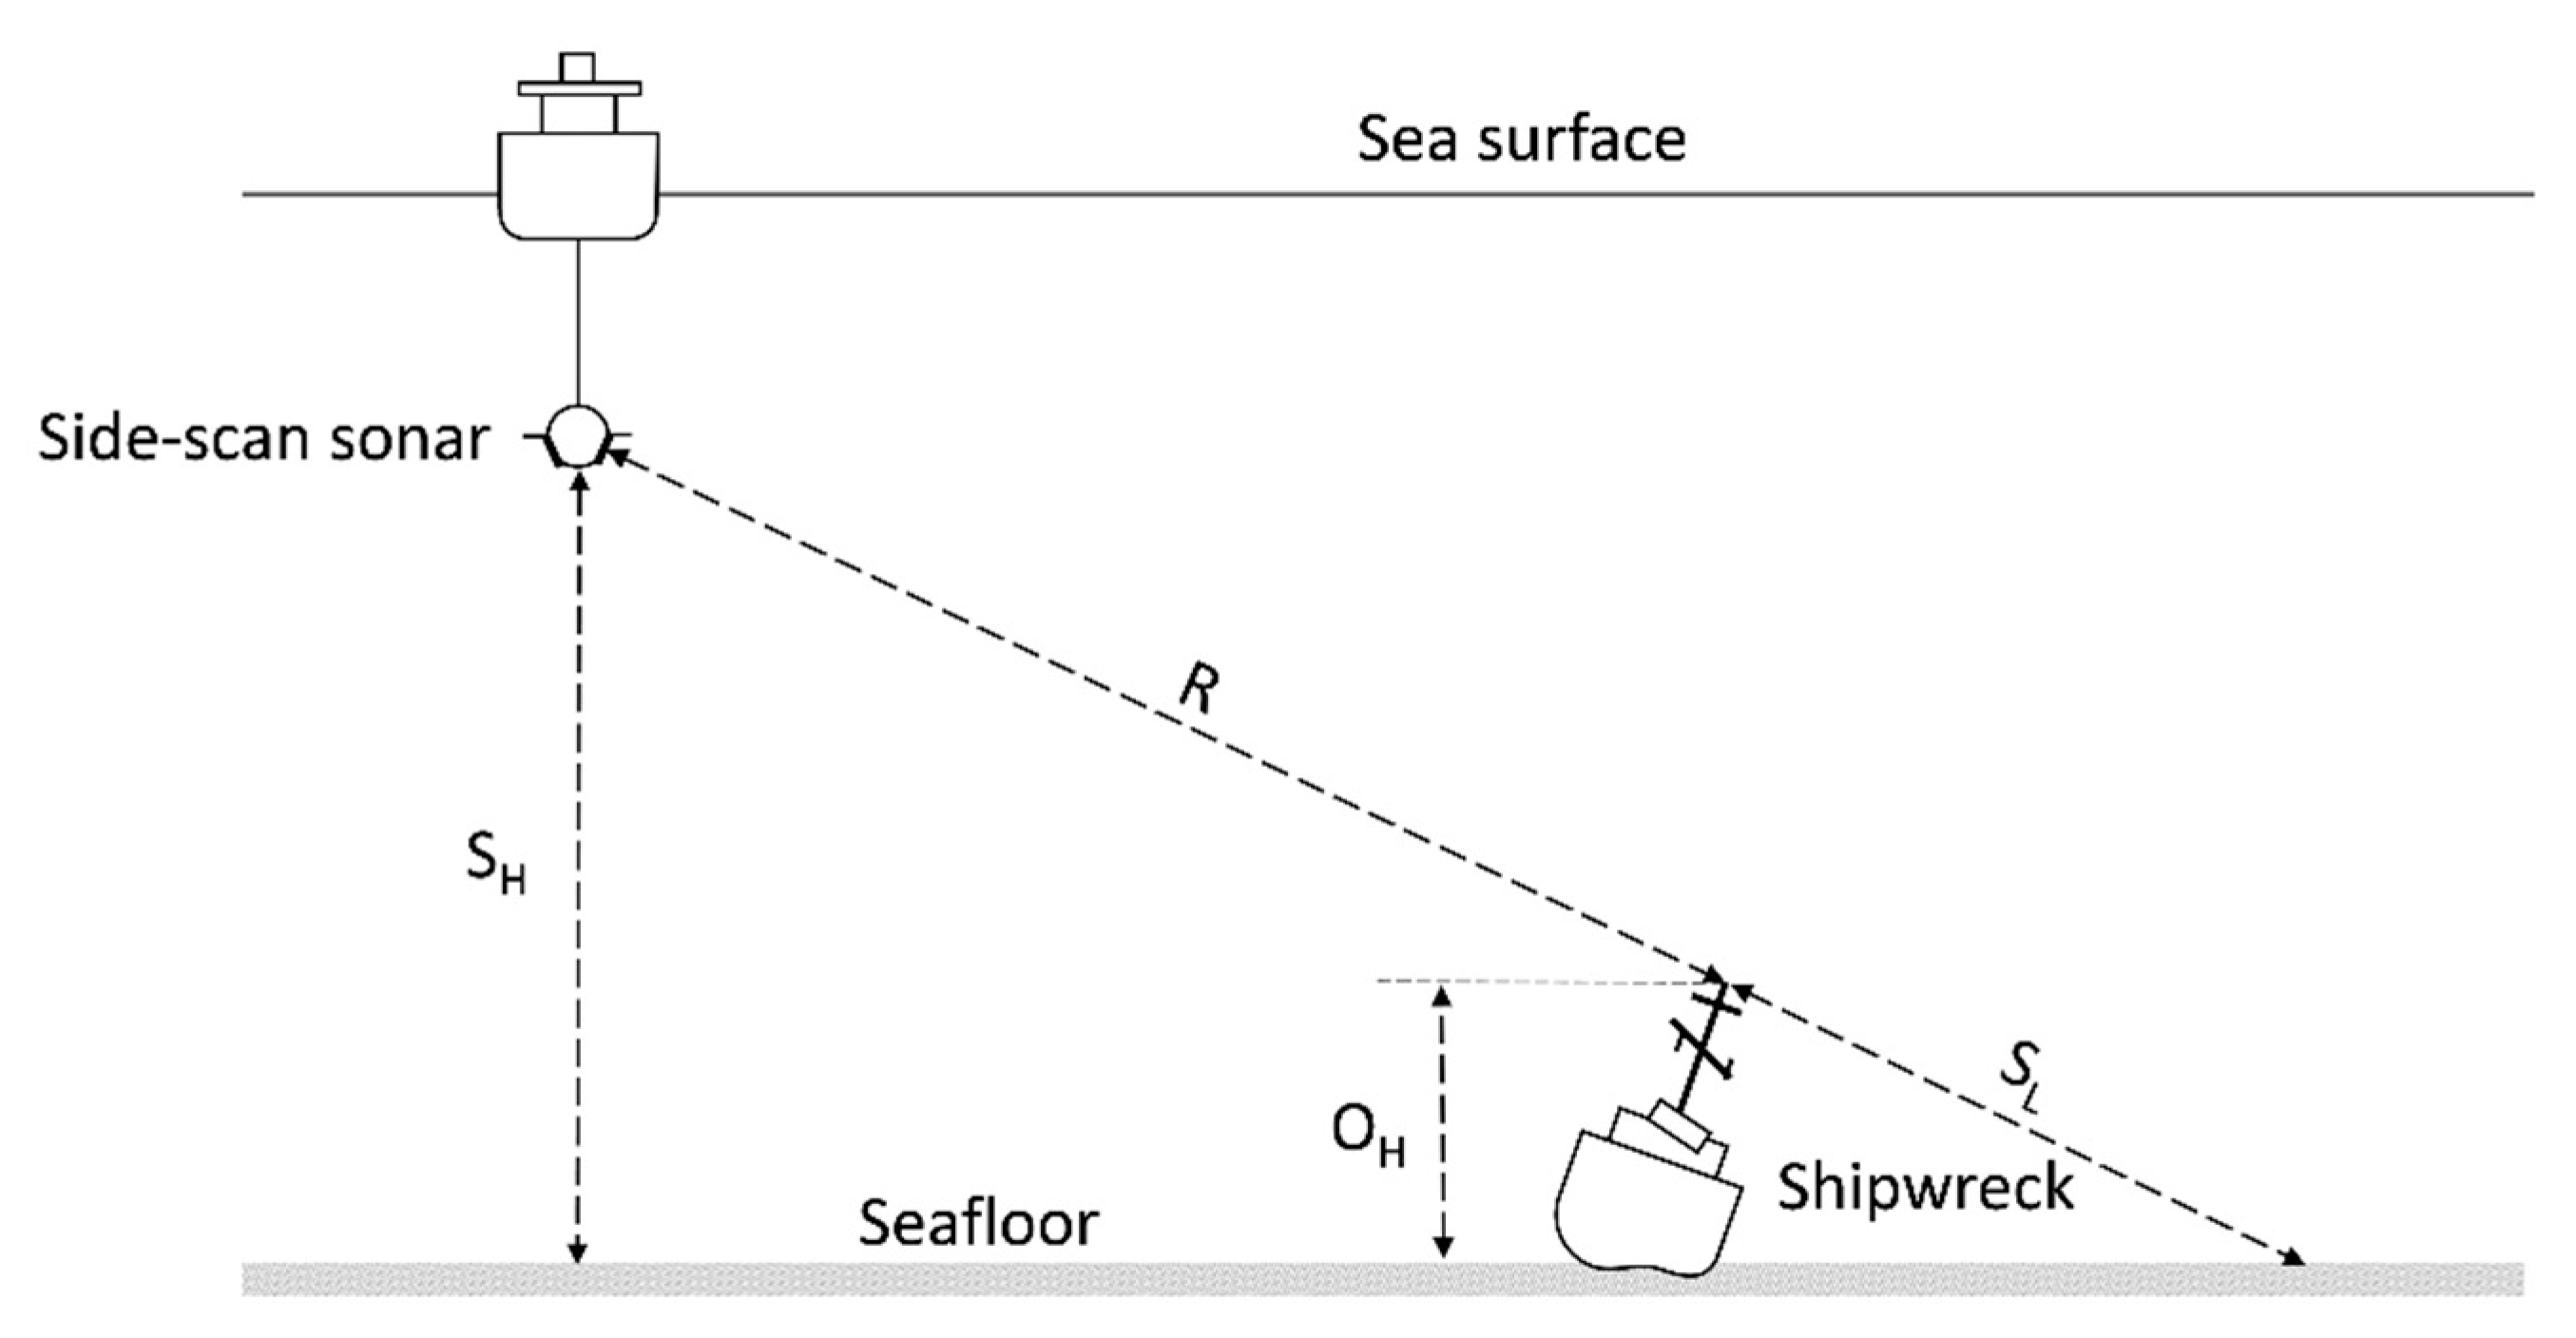
By surveying parallel to the shipwreck elevated from the seafloor, sufficient acoustic shadow was produced. Shadow cast by the wreck was a function of the angle at which the sonar beam ensonified the wreck. The formation of acoustic shadow in side-scan sonar imagery is a key element in data interpretation and, finally, in identification of the shipwreck. Shadows will often have more detail than the direct reflection from a target. By analyzing the “shadows” in a sonograph one can get some valuable information about the wreck [40]. The shadow cast by the Steuben wreck showed the deck boom at the bow, bridge superstructure, bow and stern masts, and davits on the starboard side. In addition, the shadow length was used to calculate the approximate height of the target above the surrounding bottom. The geometry of height estimation from SSS records is shown in Figure 10.
The approximate height of the shipwreck OH can be calculated from the measurements made directly on the sonar image. By virtue of similar triangles characteristics, it follows that:
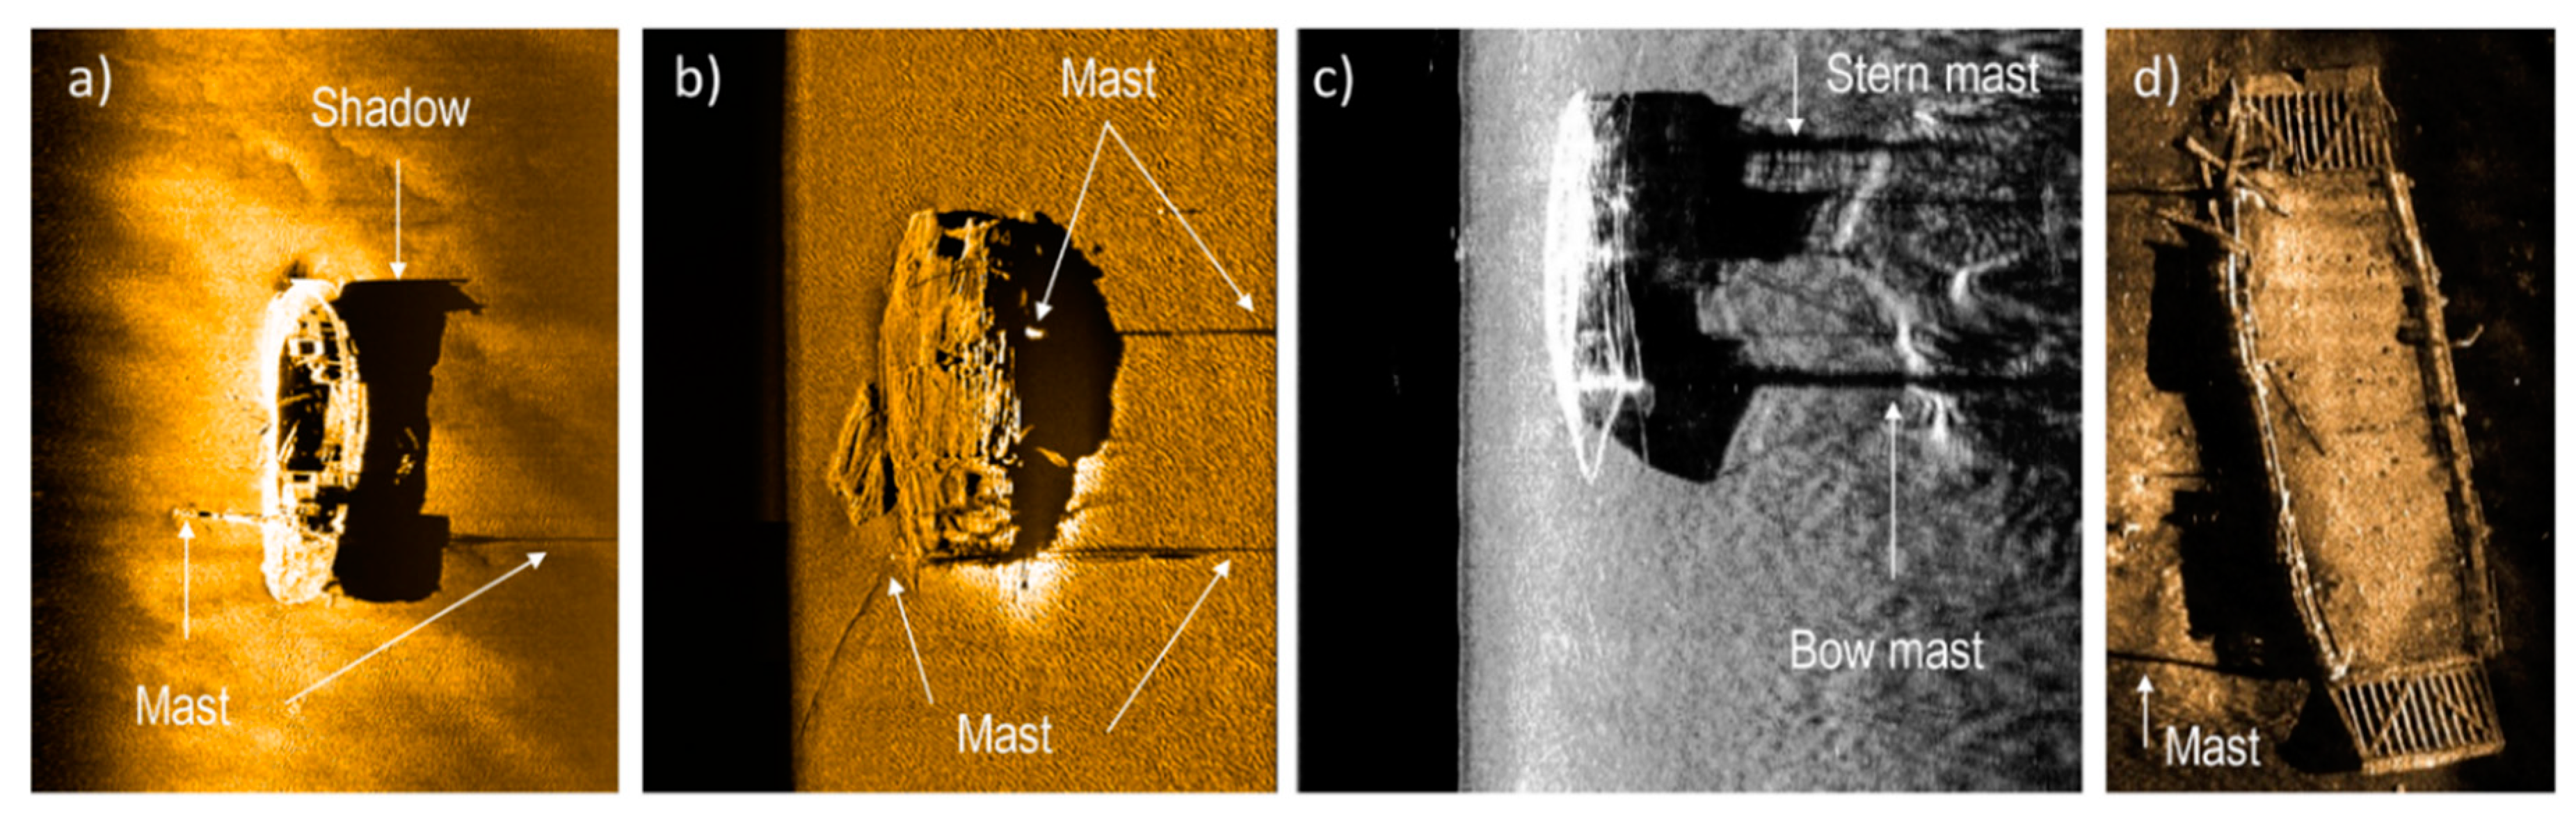
where SH is the height of the sonar above the seafloor (m), SL is the length of the acoustic shadow cast by the object (m), and R is a slant range (m) to the object. To calculate the shipwreck height acoustic shadow must be entirely within the sonar imagery (Figure 9). If the shadow extends beyond the imaging window, then the operator cannot measure the height of the wreck (Figure 8b). An acoustic shadow that reaches out beyond the edge of the sonograph implies wreck with a height that is near or above the altitude of the sonar and might pose a danger on subsequent passes of the sonar survey. This is often the case with wrecks that have undamaged masts, funnels, spars, antennas, vertical booms, and other narrow and high structural elements. Therefore, during data acquisition, the towfish should be towed close to the seabed to optimize the ensonifying geometry. The recommended height of the sonar is 8 to 20% of the selected range scale. Examples of sonograms with shadows extending beyond the sonar imagery area are shown in the Figure 11. The shadows length in case of Steuben were measured from both sides of the wreck and the results averaged. This procedure was to correct for errors introduced by seafloor slope.
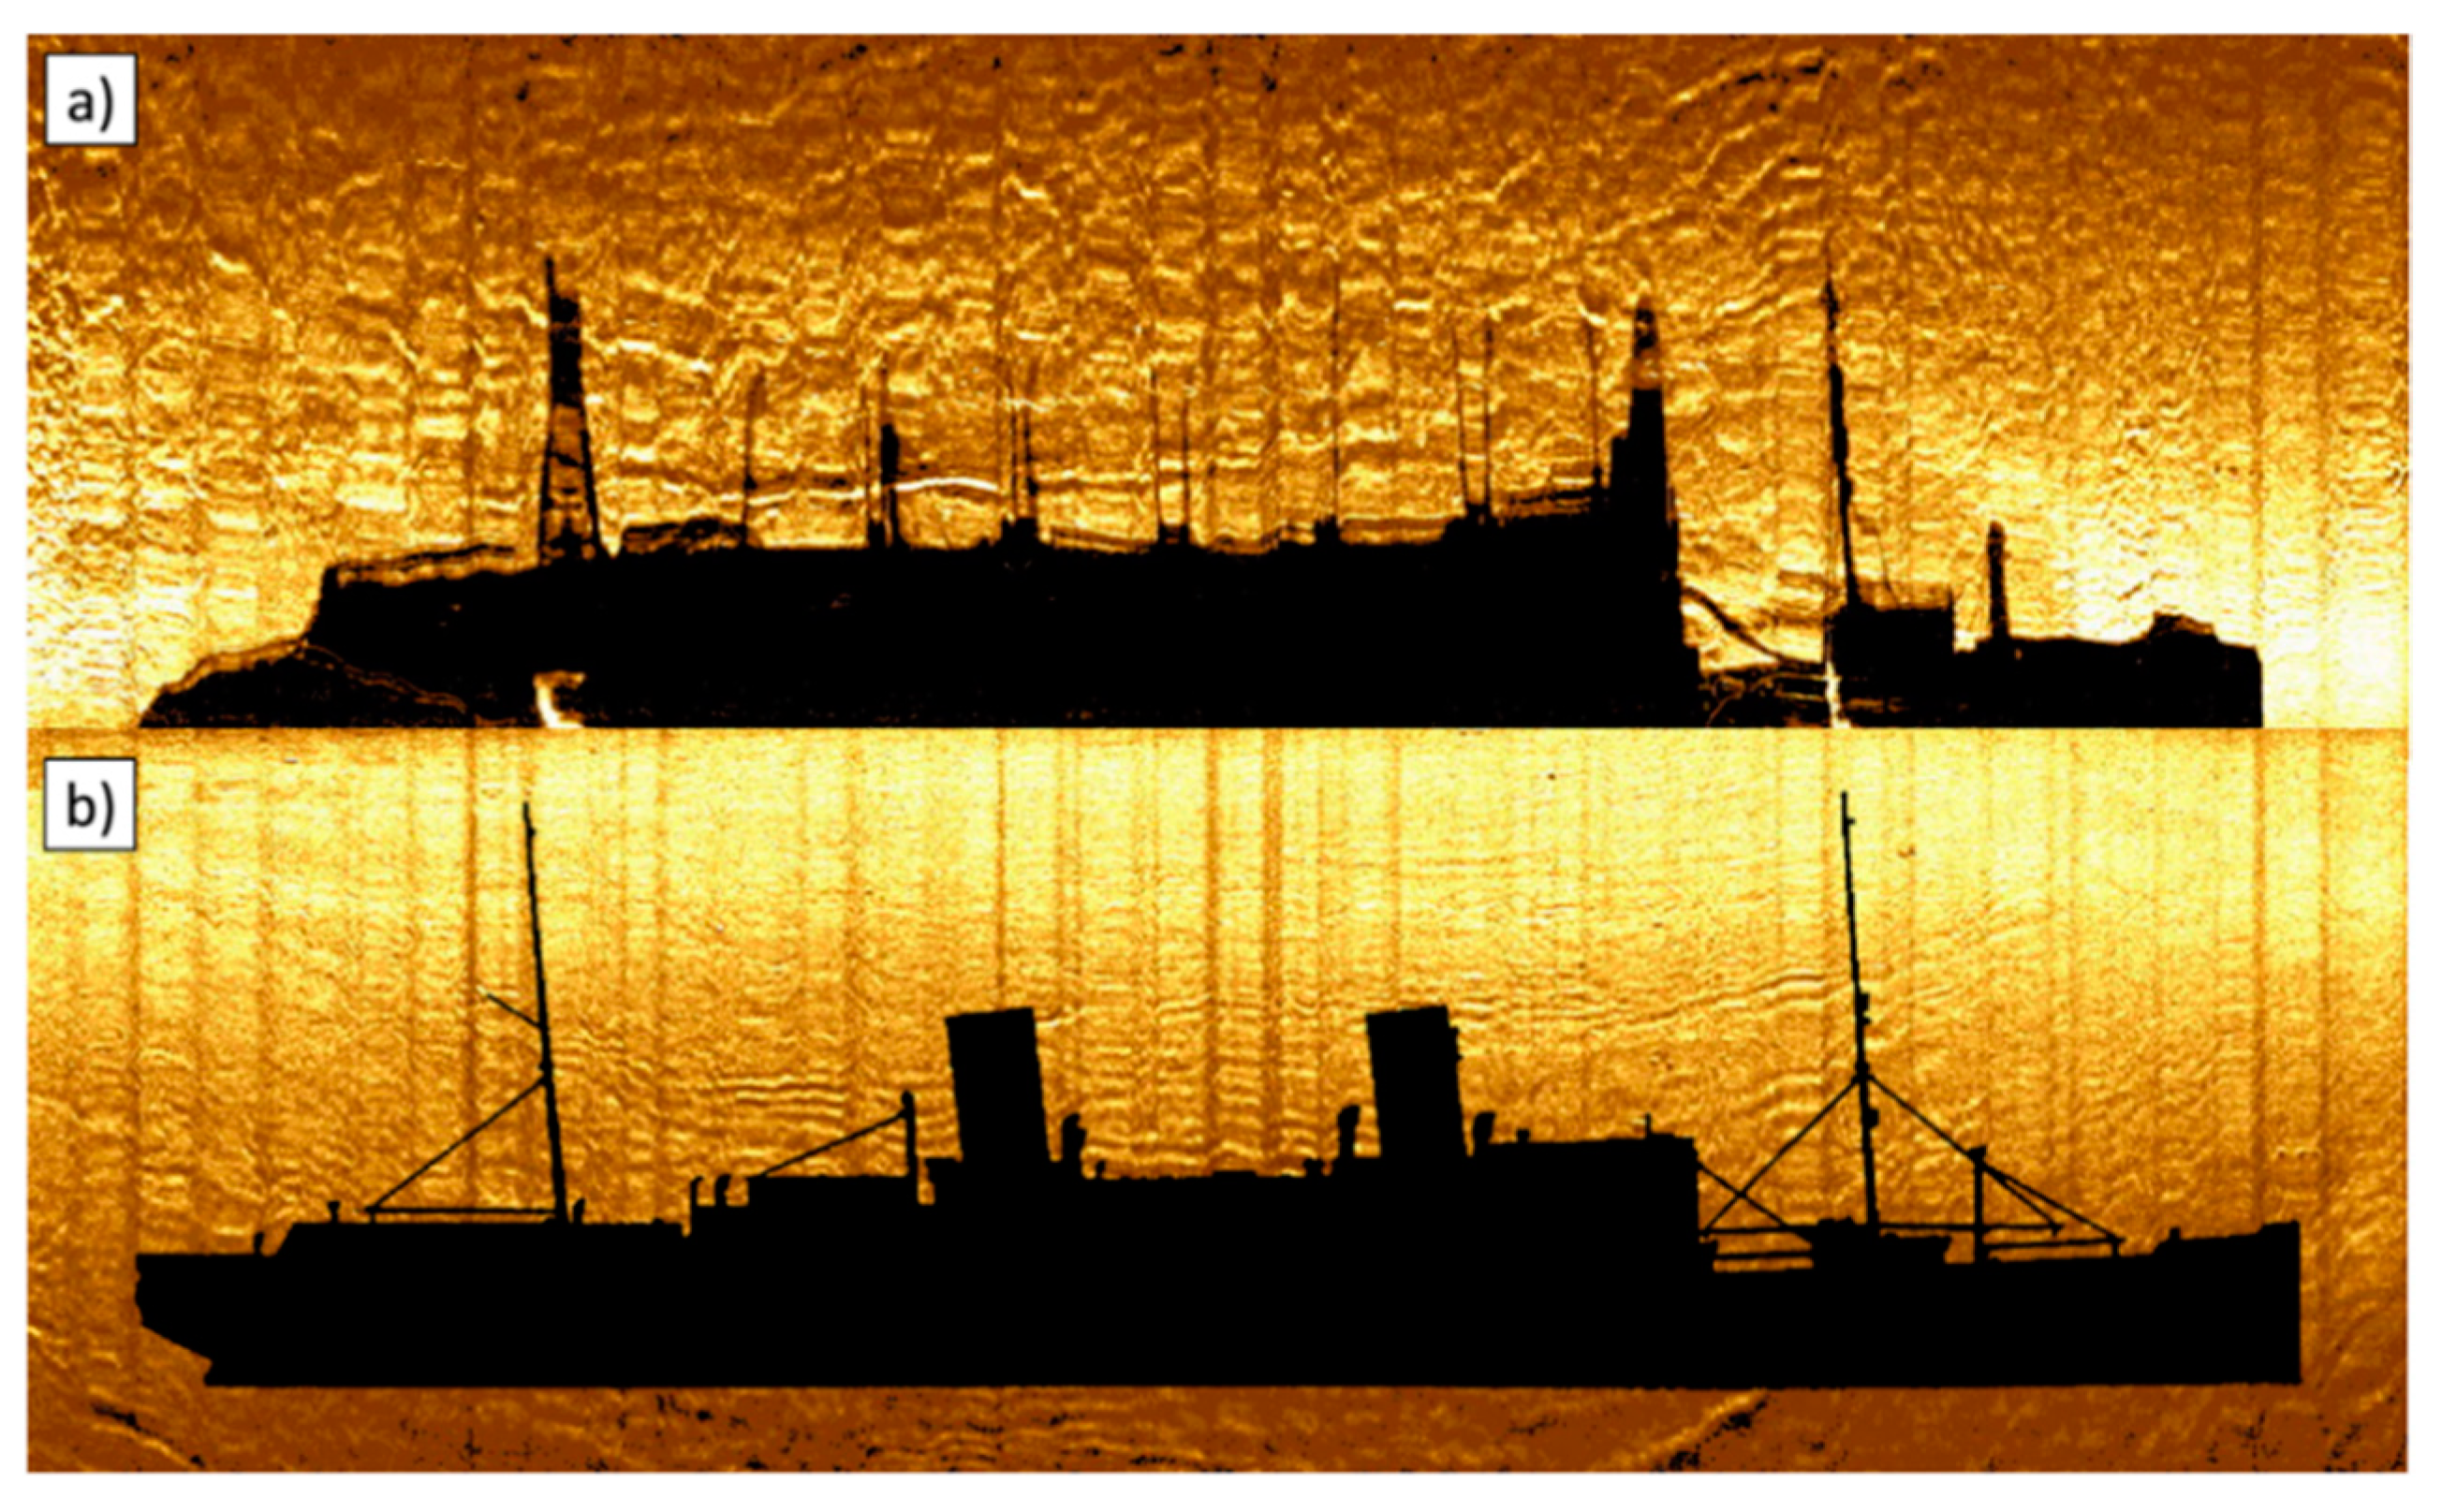
Figure 12 for comparison purposes presents the silhouette of the Steuben ship and part of the sonogram with the acoustic shadow. To show a high level of similarity, the silhouette of the ship was intentionally changed to black and the shadow cast by the wreck was extracted from the entire sonogram. In the area of acoustic shadow, there are no visible funnels, which probably were destroyed during the sinking of the ship and hitting the seabed.
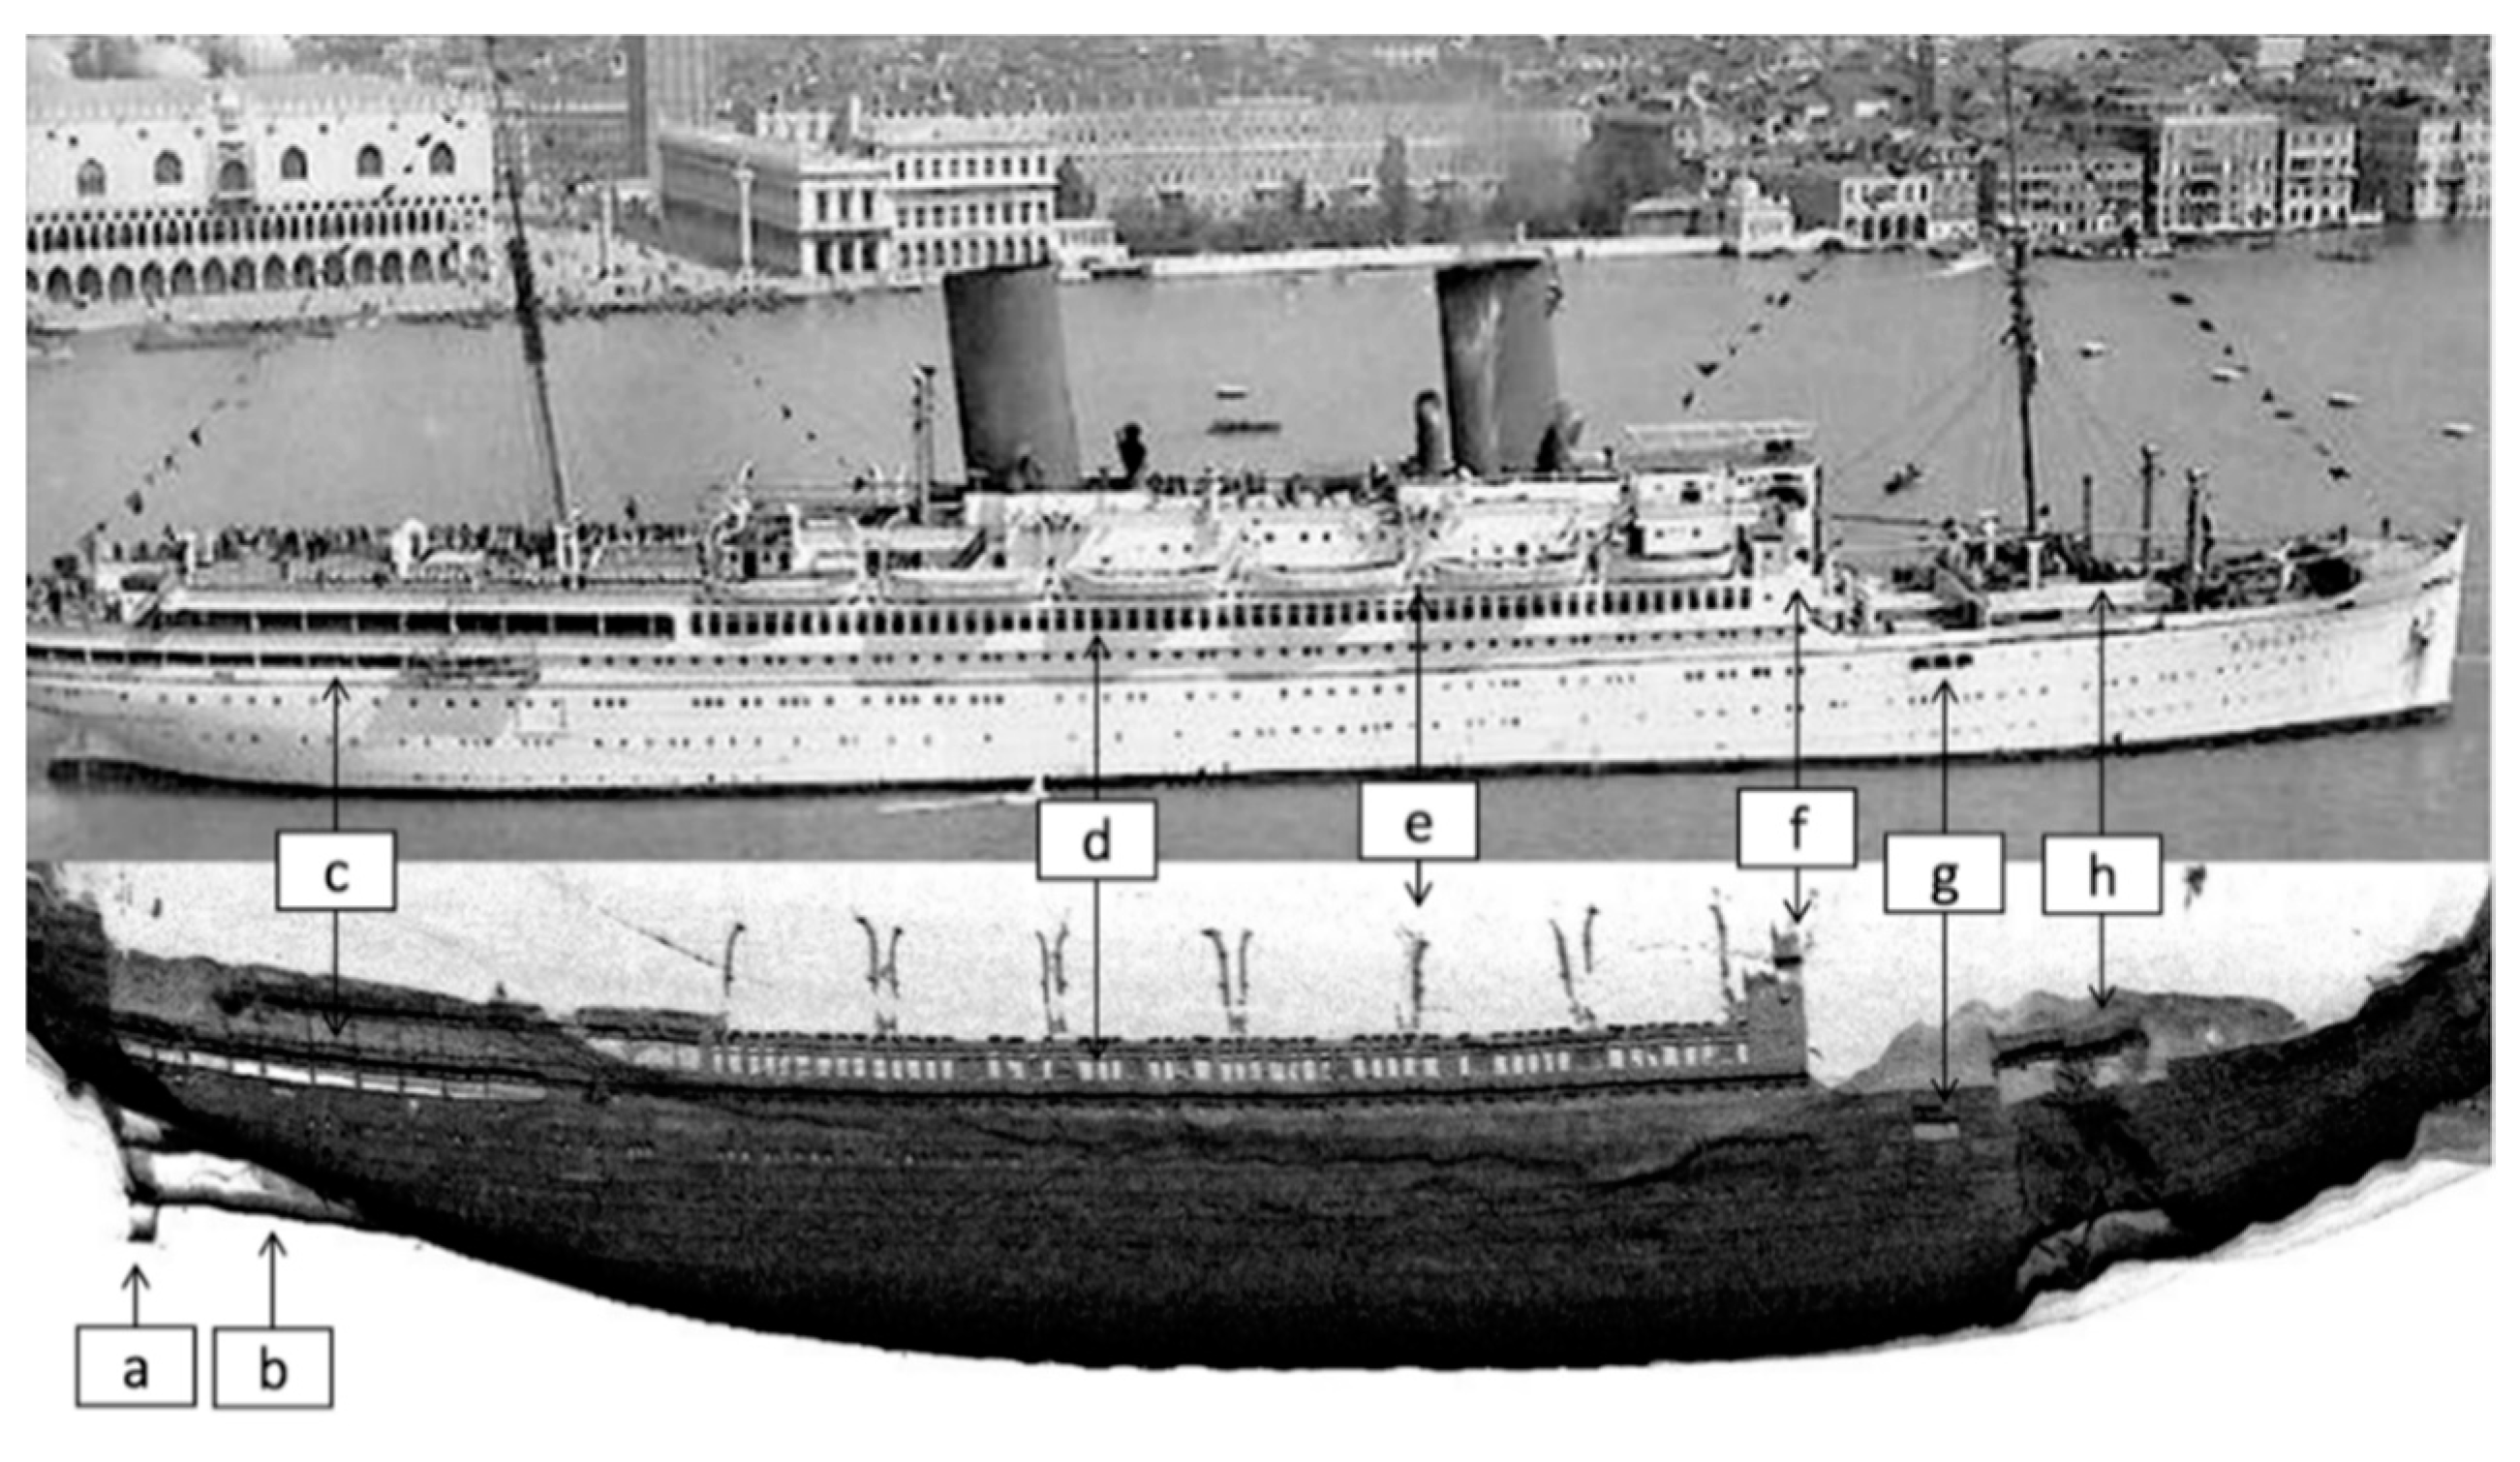
A quite important element of the wreck identification process can be a comparative analysis of remote sensing sonar data with collected archival documentation, especially ship silhouette photos and ship construction plans. The key to positive identification of the wreck is a search for dimensions match, similarities in the shape of the vessel, and common design features (Figure 13). The length and width of the investigated wreck may coincide with the real dimensions of the objects. The greater the compatibility of compared geometric features, the greater the likelihood of positive identification of the discovered wreck. One can compare the wreck’s construction features, seek compatibility and analogy in the location, and shape and size of the construction characteristic of the hull (Figure 12, Figure 13 and Figure 14). These features visible on sonar images are compared with photos and drawing documentation of the ship. The more compliance, matching, and similarities that are obtained during data analysis, the more the identification of the wreck can be successful.
DF-1000 side-scan sonar towed behind the survey ship Arctowski proved to be invaluable equipment and has provided a large number of high-quality shipwreck images. These sonograms were used to identify the wreckage of the German liner from World War II. Based on the sonar images, the length, width, and height of the wreck were measured without having to go underwater. A great aid in identifying the wreck turned out to be acoustic shadow. The presence of shadows was an important clue in the recognition of wreck’s shape and general condition of the object. For this reason, attention must be paid to get the shadow within the image. The primary benefit of SSS was the ability to quickly and efficiently generate detailed images of large areas of the bottom regardless of water clarity. A closer pass by the wreck of Steuben was made for detailed images using 40 m range scale. The wreck was ensonified from different orientations which resulted in acquiring various sonar images completed with new additional information. Because towing speed was critical for optimum along track resolution, a good compromise was found between 3–4 knots. The weather conditions and sea state as well as the size of the survey ship Arctowski were of primary importance. Moreover, the selection of the appropriate survey methodology contributed to the final results.
The identity of a newly discovered wreck is often determined on the basis of the characteristic features, such as artefacts found by divers in the wreck. Another way of identifying the wreck may be recording the film with camera installed on a remotely operated vehicle and searching for the name or hull number of the vessel. Some discoverers are looking for a ship’s bell or a steering wheel that will uniquely answer the question what ship we are dealing with. These methods were presented quite well in [10,11,12], where it was emphasized that only characteristic items found in the wreck and extracted by divers or extensive material recorded with a video camera guarantee full identification of the vessel.
In this study, the author identified a newly discovered wreck in the Baltic Sea. The identification was performed without involving a team of divers. Furthermore, the wreckage was not examined with a remotely operated vehicle. The author applied the appropriate methodology for planning and using hydrographic survey equipment. As a result, very detailed and easy to interpret bathymetric and sonar data were acquired. It is worth noting that the data obtained from the side-scan sonar was high resolution. Due to the quality and completeness of the data, one can distinguish the characteristic features of the wreck construction. However, there are several limitations concerning author’s approach.
The proposed method of identification may not be effective in the case of small underwater objects or if we are dealing with wreckage debris. The use of acoustic remote sensing techniques may not provide the desired results in adverse weather conditions. Full identification of the wreck will also not be possible in case of insufficient amount of historical material collected.
Acoustic remote sensing of the wreck does not pose a threat to human life, does not require expensive ROV operation and is a fast, relatively cheaper method of obtaining high resolution data. Modern hydrographic equipment such as multibeam echosounder or side-scan sonar should be regarded as necessary for complete understanding the newly discovered shipwrecks and other underwater archaeological sites. It is expected that within a few or several years, the underwater survey technology will continue to develop. Improvements will probably concern increase of data resolution, portability, compactness, and autonomous vehicle applications.
5. Conclusions
Almost every year we find out about discoveries of the new wrecks around the world. Many of them remain mysterious, others are inaccessible due to depth or completely destroyed with no chance to be identified.
The aim of this paper was to show how acoustic remote sensing data is used to identify large bottom object such as shipwrecks. The author demonstrated a method of wreck’s identification using bathymetric data and sonar imagery. The proposed approach assumes the application of multibeam echosounder and side-scan sonar technology widely used in hydrographic surveying. This survey equipment combined with the applied methodology enabled the collection of high-resolution remote sensing data that constituted a significant contribution to identification process.
The findings presented suggest that under certain conditions it is possible to identify the shipwreck without diving or using underwater vehicles. This is particularly important in terms of human safety or survey operation costs.
Although the survey results validated the effectiveness of the proposed approach it should be noted that we were dealing with a large, well-preserved hull of the wreck. Identification of such a target is much simpler than establishing the identity of the debris slightly protruding above the sea bottom. Unambiguous identification of a newly discovered shipwreck will sometimes require supplementation with other systems and techniques, e.g., underwater television, diving operation, or archaeological research.
The discovery of the Steuben shipwreck was a spectacular event. The wreck is well preserved and should be left unimpaired and undisturbed. A tremendous role in this matter is played by Polish maritime authorities.
Funding
This research was supported by the Minister of National Defense of Poland as part of the program called Research Grant: “Backscattering of acoustic waves in the aquatic environmental”.
Acknowledgments
Author would like to thank the crew of the Polish Navy hydrographic ship Arctowski, for their dedication, exemplary performance of tasks and a fantastic atmosphere onboard during the hydrographic investigation of the wreck of General von Steuben.
Conflicts of Interest
The author declares no conflict of interest.
References
- Ødegård, Ø.; Sørensen, A.; Hansen, R.; Ludvigsen, M. A new method for underwater archaeological surveying using sensors and unmanned platforms. IFAC-PapersOnLine 2016, 49, 486–493. [Google Scholar] [CrossRef]
- Hutchinson, G. Threats to underwater cultural heritage. Mar. Policy 1996, 20, 287–290. [Google Scholar] [CrossRef]
- Starnawski, K.; Poleszak, S. The dangers of diving in the sea. In Baltic Wrecks: Guide for Divers; Poleszak, S., Ed.; Eliza Poleszak: Gdynia, Poland, 2005; pp. 41–58. ISBN 83-920563-1-0. [Google Scholar]
- Duck, B.; Klein, R.S. Shipwrecks of the Dominican Republic and A Guide to Shipwreck Identification through Recovered Artifacts, 1st ed.; Lulu Press: Morrisville, NC, USA, 2010; 156p, ISBN 978-0-9829477-0-8. [Google Scholar]
- Dierssen, H.M.; Theberge, A.E., Jr. Bathymetry: History of Seafloor Mapping. In Encyclopedia of Natural Resources. Vol. II—Water and Air, 1st ed.; Wang, Y., Raton, B., Eds.; Taylor & Francis Group: Milton Park, UK, 2014; p. 564. [Google Scholar] [CrossRef]
- Bates, C.R.; Lawrence, M.; Dean, M.; Robertson, P. Geophysical Methods for Wreck-Site Monitoring: The Rapid Archaeological Site Surveying and Evaluation (RASSE) programme. Int. J. Naut. Archaeol. 2011, 40, 404–416. [Google Scholar] [CrossRef]
- Brown, C.J.; Blondel, P. Developments in the application of multibeam sonar backscatter for seafloor habitat mapping. Appl. Acoust. 2009, 70, 1242–1247. [Google Scholar]
- Janowski, L.; Trzcinska, K.; Tegowski, J.; Kruss, A.; Rucinska-Zjadacz, M.; Pocwiardowski, P. Nearshore Benthic Habitat Mapping Based on Multi-Frequency, Multibeam Echosounder Data Using a Combined Object-Based Approach: A Case Study from the Rowy Site in the Southern Baltic Sea. Remote Sens. 2018, 10, 1983. [Google Scholar] [CrossRef] [Green Version]
- Huang, J. Maritime archaeology and identification of historic shipwrecks: A legal perspective. Mar. Policy 2014, 44, 256–264. [Google Scholar] [CrossRef] [Green Version]
- Berg, D. Shipwreck Diving; Instant Downloadable E-Book; Aqua Explorers: Baldwin, NY, USA, 2015; p. 90. ISBN 0-9616167-5-X. [Google Scholar]
- Keatts, H.; Skerry, B. Complete Wreck Diving: A Guide to Diving Wrecks, 1st ed.; Aqua Quest Publications: Locust Valley, NY, USA, 1999; p. 270. ISBN 10: 0922769389. [Google Scholar]
- Grabiec, D.; Olejnik, A. Searching for and identifying underwater objects. In Baltic Wrecks: Guide for Divers; Poleszak, S., Ed.; Eliza Poleszak: Gdynia, Poland, 2005; pp. 81–105. ISBN 83-920563-1-0. [Google Scholar]
- Foley, B.P.; Dellaporta, K.; Sakellariou, D.; Bingham, B.S.; Camilli, R.; Eustice, R.M.; Evagelistis, D.; Ferrini, V.L.; Katsaros, K.; Kourkoumelis, D.; et al. The 2005 Chios Ancient Shipwreck Survey: New Methods for Underwater Archaeology. Hesperia J. Am. Sch. Class. Stud. Athens 2009, 78, 269–305. [Google Scholar] [CrossRef] [Green Version]
- Buscombe, D. Shallow water benthic imaging and substrate characterization using recreational-grade sidescan-sonar. Environ. Model. Softw. 2017, 89, 1–18. [Google Scholar]
- Burguera, A.; Oliver, G. High-Resolution Underwater Mapping Using Side-Scan Sonar. PLoS ONE 2016, 11, e0146396. [Google Scholar] [CrossRef] [Green Version]
- Healy, C.A.; Schultz, J.J.; Parker, K. Detecting Submerged Bodies: Controlled Research Using Side-Scan Sonar to Detect Submerged Proxy Cadavers. J. Forensic Sci. 2015, 60, 743–752. [Google Scholar] [CrossRef]
- Bryant, R. Side Scan Sonar for Hydrography-An Evaluation by the Canadian Hydrographic Service. Int. Hydrogr. Rev. 2015, 52, 43–55. [Google Scholar]
- Nakamura, K.; Toki, T.; Mochizuki, N. Discovery of a new hydrothermal vent based on an underwater, high-resolution geophysical survey. Deep Sea Res. Part I Oceanogr. Res. Pap. 2013, 74, 1–10. [Google Scholar] [CrossRef]
- Johnson, H.; Helferty, M. The geological interpretation of side-scan sonar. Rev. Geophys. 1990, 28, 357–380. [Google Scholar] [CrossRef] [Green Version]
- Grooss, P. The Naval War in the Baltic 1939–1945; Naval Institute Press: Barnsley, UK, 2017; 416p, ISBN 10: 152670000X. [Google Scholar]
- Gelewski, T.M. Wilhelm Gustloff i General von Steuben Statki Śmierci czy Zbrodnia Wojenna na Morzu? A.E.L. Publishing House: Gdańsk, Poland, 1997; ISBN 83-903896-4-9. (In Polish) [Google Scholar]
- General von Steuben. Available online: www.danzig-online.pl/gustloff/steubene.html (accessed on 17 March 2020).
- Tagliati, M. General von Steuben. X-Ray Mag 2005, 8, 71–77. Available online: https://xray-mag.com/pdfs/xray08/X-Ray8_Adobe6.pdf (accessed on 25 February 2020).
- Jamkowski, M. Duchy z Głębin Bałtyku. Steuben, Gustloff, Goya; Świat Książki: Warszawa, Poland, 2010; pp. 1–303. ISBN 978-83-247-1803-0. (In Polish) [Google Scholar]
- Ostasz, A. Ostatnie wielkie odkrycie na Bałtyku. Steuben. In Nurkowanie; OKTO Sp. z o.o.: Szczecin, Poland, 2004; Volume 8, pp. 15–21. (In Polish) [Google Scholar]
- Prince, C.J. Death in the Baltic: The World War II Sinking of the Wilhelm Gustloff, 1st ed.; Palgrave MacMillan: New York, NY, USA, 2013; 256p, ISBN 13: 9780230341562. [Google Scholar]
- Grządziel, A. Possibilities of Using Hydrographic Side Scan Sonar to Conduct Mine Counter-Measure Tasks. Master’s Thesis, Polish Naval Academy, Gdynia, Poland, 2007. (In Polish). [Google Scholar]
- International Hydrographic Organization. Manual on Hydrography, 1st ed.; Publication C-13; International Hydrographic Bureau: Monaco, 2005; p. 202. [Google Scholar]
- Held, P.; Schneider von Deimling, J. New Feature Classes for Acoustic Habitat Mapping—A Multibeam Echosounder Point Cloud Analysis for Mapping Submerged Aquatic Vegetation (SAV). Geosciences 2019, 9, 235. [Google Scholar] [CrossRef] [Green Version]
- Mohammadloo, T.H.; Snellen, M.; Renoud, W.; Beaudoin, J.; Simons, D.G. Correcting Multibeam Echosounder Bathymetric Measurements for Errors Induced by Inaccurate Water Column Sound Speeds. IEEE Access 2019, 7, 122052–122068. [Google Scholar] [CrossRef]
- Grządziel, A.; Wąż, M. Estimation of Effective Swath Width for Dual-Head Multibeam Echosounder. Annu. Navig. 2016, 23, 173–183. [Google Scholar] [CrossRef]
- Grządziel, A.; Wąż, M. System echosondy wielowiązkowej w pomiarach batymetrycznych planowanych tras żeglugowych. Logistyka 2014, 6, 4250–4256. Available online: https://www.researchgate.net/profile/Artur_Grzadziel/research (accessed on 18 March 2020).
- Demer, D.A.; Berger, L.; Bernasconi, M.; Bethke, E.; Boswell, K.; Chu, D.; Domokos, R.; Dunford, A.; Fassler, S.; Gauthier, S.; et al. Calibration of Acoustic Instruments; ICES Cooperative Research Report No. 326; International Council for the Exploration of the Sea (ICES): Copenhagen, Denmark, 2015; 133p. [Google Scholar] [CrossRef]
- von Rönn, G.A.; Schwarzer, K.; Reimers, H.-C.; Winter, C. Limitations of Boulder Detection in Shallow Water Habitats Using High-Resolution Sidescan Sonar Images. Geosciences 2019, 9, 390. [Google Scholar]
- Grøn, O.; Boldreel, L.O.; Cvikel, D.; Kahanov, Y.; Galili, E.; Hermand, J.-P.; Nævestad, D.; Reitan, M. Detection and mapping of shipwrecks embedded in sea-floor sediments. J. Archaeol. Sci. Rep. 2015, 4, 242–251. [Google Scholar] [CrossRef]
- Lubis, M.J. Using Side Scan Sonar Instrument for Seabed Identification with Pattern Discrete Equi Spaced Unshaded Line Array (Pdesula) Model. J. Oceanogr. Mar. Res. 2017, 5. [Google Scholar] [CrossRef]
- Tamsett, D.; Hogarth, P. Sidescan sonar beam function and seabed backscatter functions from trace amplitude and vehicle roll data. IEEE J. Ocean. Eng. 2015, 411, 155–163. [Google Scholar] [CrossRef]
- Kolouch, D. Interferometric Side-Scan Sonar. A Topographic Sea-Floor Mapping System. Int. Hydrogr. Rev. 1984, 64, 36–49. [Google Scholar]
- Shang, X.; Zhao, J.; Zhang, H. Obtaining High-Resolution Seabed Topography and Surface Details by Co-Registration of Side-Scan Sonar and Multibeam Echo Sounder Images. Remote Sens. 2019, 11, 1496. [Google Scholar] [CrossRef] [Green Version]
- Singh, H.; Adams, J.; Mindell, D.; Foley, B. Imaging Underwater for Archaeology. J. Field Archaeol. 2000, 27, 319–328. [Google Scholar] [CrossRef]
Figure 1.
German passenger liner General von Steuben before sinking [22].
Figure 1.
German passenger liner General von Steuben before sinking [22].

Figure 2.
Site of discovery of the General von Steuben shipwreck.

Figure 3.
Under-keel blister with sound velocity sensor, single-beam, and multi-beam transducer.

Figure 4.
Components of single-beam echosounder. (a) graphic recorder and (b) keel-mounted transducers of low and high frequency.
Figure 4.
Components of single-beam echosounder. (a) graphic recorder and (b) keel-mounted transducers of low and high frequency.

Figure 5.
Side-scan sonar systems. (a) towed behind the survey vessel and (b) hull-mounted sonar.

Figure 6.
Different types of multibeam data presentation. (a) sun-illuminated grid data, (b) digital terrain model, (c) profile view data, and (d) multibeam backscatter grid data.
Figure 6.
Different types of multibeam data presentation. (a) sun-illuminated grid data, (b) digital terrain model, (c) profile view data, and (d) multibeam backscatter grid data.

Figure 7.
Single-beam echosounder data (echogram) showing the least depth over the wreck, surrounding depth, and the height of the object.
Figure 7.
Single-beam echosounder data (echogram) showing the least depth over the wreck, surrounding depth, and the height of the object.

Figure 8.
Side-scan sonar images of the shipwreck of the General von Steuben. (a) sonar imagery recorded with hull-mounted, 100 kHz side-scan sonar; (b) sonar imagery recorded with towed, 500 kHz side-scan sonar; (c) displaying shafts and propellers; (d) displaying front part of the superstructure and davits; and (e) displaying torpedo hole in the shipwreck hull.

Figure 9.
Identification of the wreck’s construction features.

Figure 10.
Calculation of object’s height based on similar triangles.

Figure 11.
Examples of the wrecks with protruding, vertical structural elements. (a) yacht wreck; (b) barge with piles of wood; (c) fishing boat; and (d) barge.
Figure 11.
Examples of the wrecks with protruding, vertical structural elements. (a) yacht wreck; (b) barge with piles of wood; (c) fishing boat; and (d) barge.

Figure 12.
Comparison of the acoustic shadow shape with the ship’s silhouette. (a) hydroacoustic shadow from the sonogram of the shipwreck and (b) black silhouette of the ship General von Steuben for comparative analysis.
Figure 12.
Comparison of the acoustic shadow shape with the ship’s silhouette. (a) hydroacoustic shadow from the sonogram of the shipwreck and (b) black silhouette of the ship General von Steuben for comparative analysis.

Figure 13.
Comparison of the recorded sonar data with the photographic documentation of the ship. (a) propeller; (b) shaft; (c) pillars and stern decks; (d) sixty rectangular side windows; (e) six pairs of boat davits; (f) front part of the superstructure; (g) hawse-holes; and (h) small bow superstructure.

Figure 14.
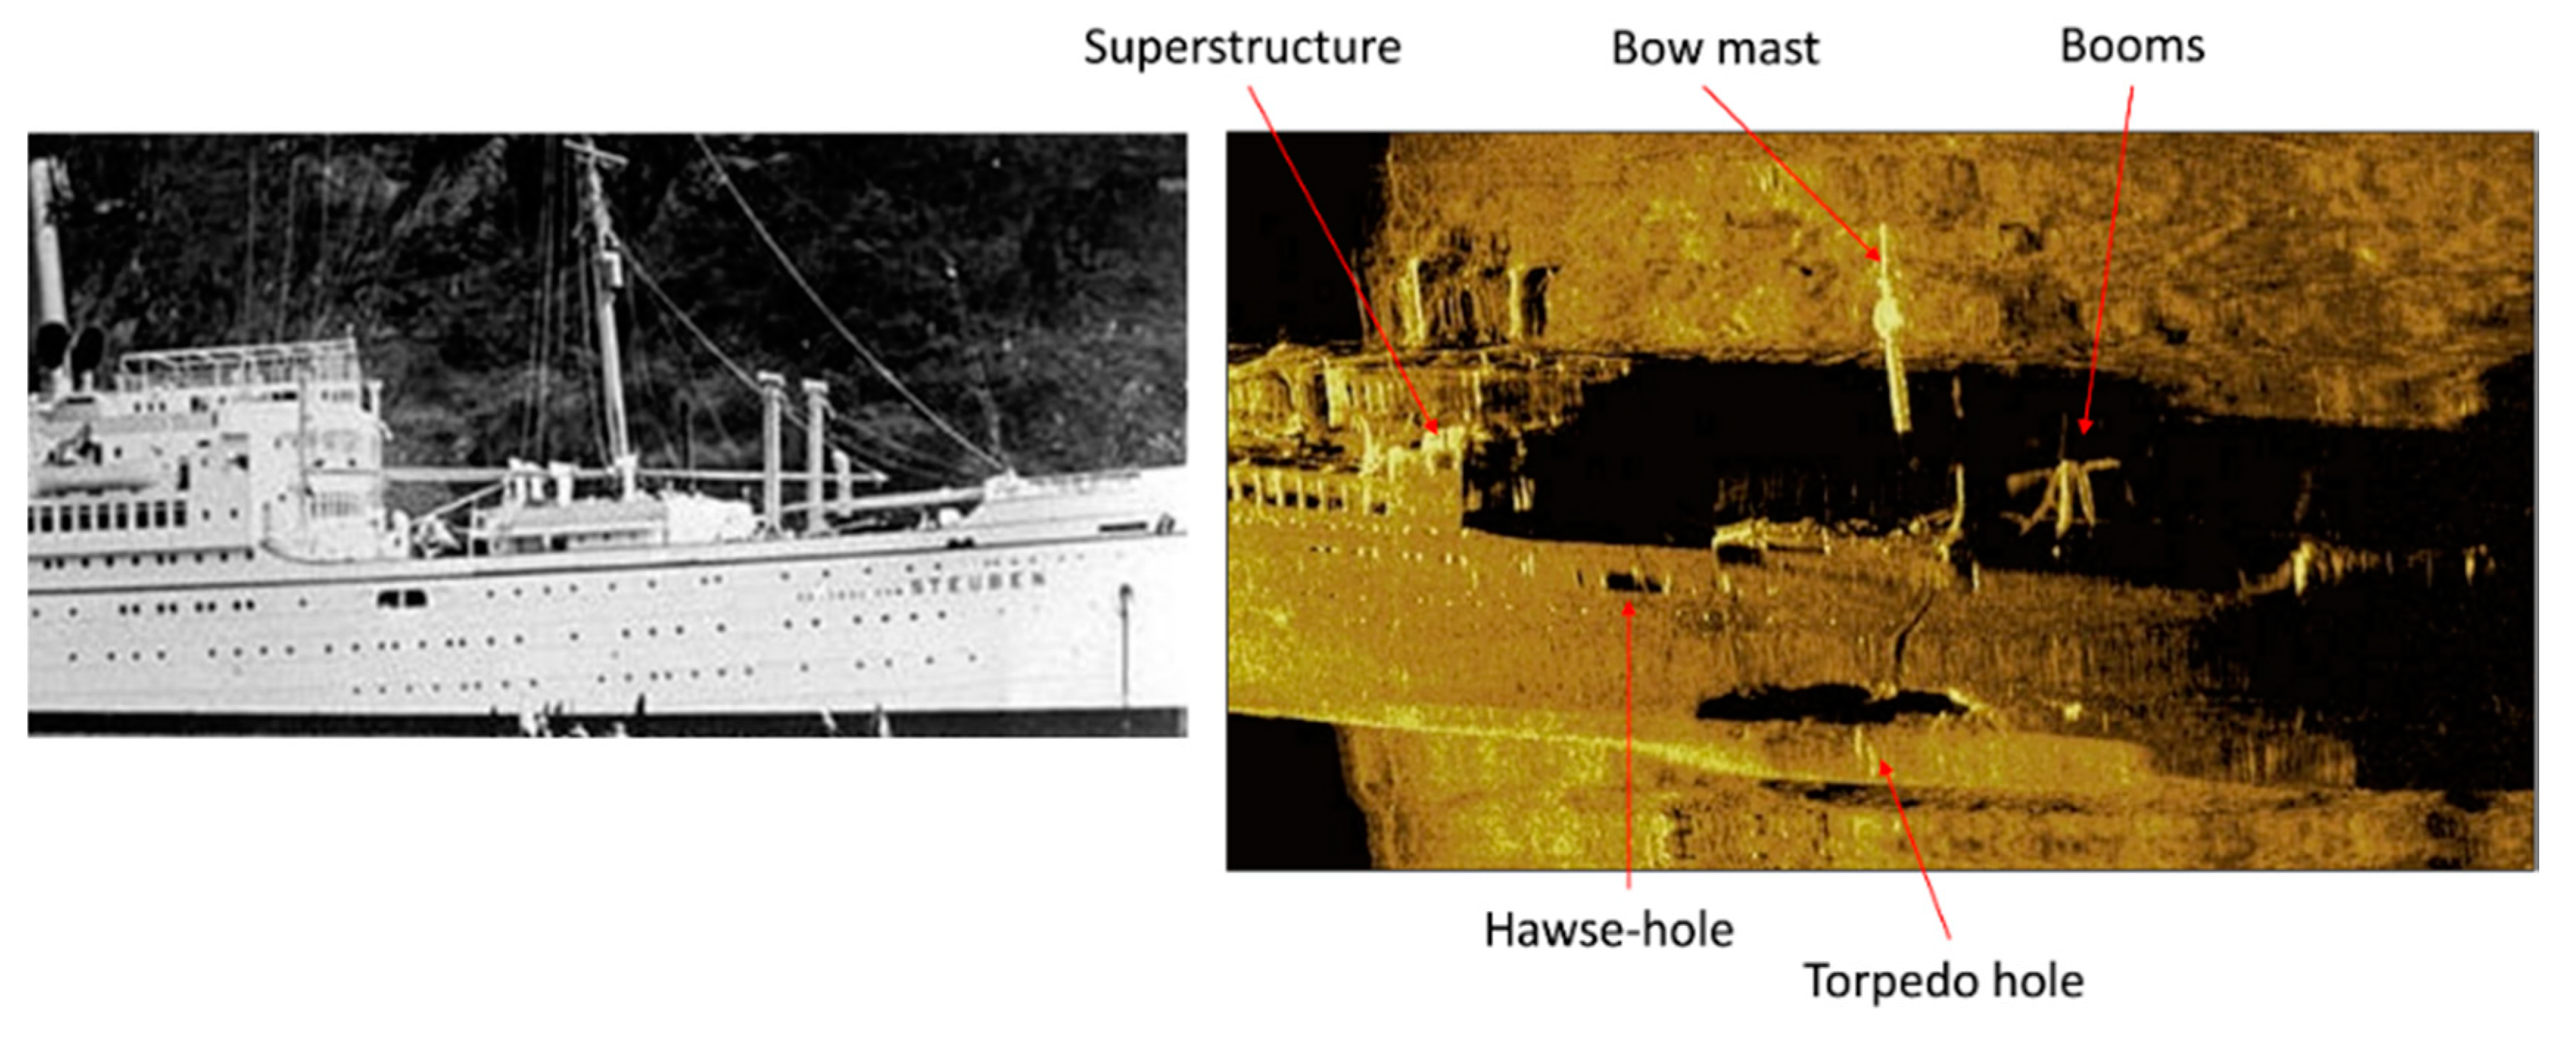
Comparison of the recorded sonar data with the photographic documentation of the bow part of the Steuben ship.
Figure 14.
Comparison of the recorded sonar data with the photographic documentation of the bow part of the Steuben ship.


Table 1.
Characteristics of passenger liner General von Steuben.
| Parameter | Characteristics |
|---|---|
| Name | 1923: Munchen, 1930: General von Steuben, 1938: Steuben |
| Type | Passenger ship |
| Tonnage | 14,660 BRT |
| Dimension | Length 168 m, beam 19.8 m, draft 8.5 m |
| Speed | 16 kts |
| Launched | 1922 |
| Shipyard | Vulcan in Szczecin |
| Propulsion | Steam reciprocating, exhaust turbine, twin propellers; 11,000 hp |
| Fate | Sunk 10 February 1945 |
© 2020 by the author. Licensee MDPI, Basel, Switzerland. This article is an open access article distributed under the terms and conditions of the Creative Commons Attribution (CC BY) license (http://creativecommons.org/licenses/by/4.0/).
Share and Cite
MDPI and ACS Style
Grządziel, A. Using Remote Sensing Data to Identify Large Bottom Objects: The Case of World War II Shipwreck of General von Steuben. Geosciences 2020, 10, 240. https://0-doi-org.brum.beds.ac.uk/10.3390/geosciences10060240
AMA Style
Grządziel A. Using Remote Sensing Data to Identify Large Bottom Objects: The Case of World War II Shipwreck of General von Steuben. Geosciences. 2020; 10(6):240. https://0-doi-org.brum.beds.ac.uk/10.3390/geosciences10060240
Chicago/Turabian StyleGrządziel, Artur. 2020. "Using Remote Sensing Data to Identify Large Bottom Objects: The Case of World War II Shipwreck of General von Steuben" Geosciences 10, no. 6: 240. https://0-doi-org.brum.beds.ac.uk/10.3390/geosciences10060240
Note that from the first issue of 2016, this journal uses article numbers instead of page numbers. See further details here.