Article

Data-Driven Field Observational Method of a Contiguous Bored Pile Wall System Affected by Accidental Groundwater Drawdown

by
Elizabeth Eu-Mee Chong
1,* and
Dominic Ek-Leong Ong
1,2
1
Lecturer, Centre for Sustainable Technologies, Swinburne University of Technology Sarawak Campus, Kuching 93350, Malaysia
2
Senior Lecturer, Griffith University, Nathan, Queensland 4111, Australia
*
Author to whom correspondence should be addressed.
Submission received: 4 June 2020 / Revised: 3 July 2020 / Accepted: 10 July 2020 / Published: 13 July 2020
(This article belongs to the Special Issue Soil-Structure Interaction)

Abstract

:
This paper presents the use of a 700 mm-diameter contiguous bored pile (CBP) wall for a main basement deep excavation project with cut-and-cover tunnel. Due to the presence of cement grout columns between piles behind the CBP wall, the main basement was considered to be ‘impermeable’. However, site observations have shown that installation of ground anchors have unintentionally punctured the water tightness of the wall, creating leakages through the CBP wall and the possibility of localized groundwater lowering, as evidenced by the relatively large settlements. In the absence of cement grout columns at the cut-and-cover tunnel section, immediate groundwater drawdown was observed with the excavation rate. Settlement induced by the excavation and groundwater drawdown only slowed down upon the casting of skinwall to prevent groundwater from flowing through the wall. The accidental groundwater leakage led to small wall deflection. The ratio of maximum settlement to maximum deflection is atypical to those reported in the literature. The analysis also revealed that corner effect is significant with smaller settlement registered at the corners of the wall.

1. Introduction

The rapid development of Kuching City, in the state of Sarawak, Malaysian Borneo, in recent years has seen the needs for more underground structures to be constructed. Deep excavation projects often cause stresses to the surrounding buildings and structures. Among the factors contributing to these stresses are groundwater imbalance, soil movement, and construction sequence and activities.
Many studies of deep excavation in clay have been well documented over the years [1,2,3,4,5,6,7,8,9], but studies of deep excavation in sand are scarce. Moreover, most of the deep excavation projects are often constructed by using diaphragm wall as retaining system as opposed to the contiguous bored pile (CBP) wall used in this study. A database by Long [10] showed that diaphragm wall, sheetpile wall, and contiguous wall are widely used throughout the world although the first two constitute most of the database. One of the characteristics of CBP wall is the gap between successive piles that allow for more economical design. These gaps would allow groundwater to flow through the wall causing groundwater drawdown. In overconsolidated clays in London, Powrie et al. [11] acknowledged the possibility of groundwater flowing through the wall that caused a reduction in long-term pore pressures behind the retaining walls. Through simulations using flowtank, Richards et al. [12] demonstrated the groundwater table immediately behind the wall goes from near vertical to near horizontal, when groundwater were allowed to be discharged. These gaps are often sealed to prevent groundwater flow and despite the measures taken to ensure that all gaps are sealed, leaking may still occur, leading to possibly further drawdown. Leakages are discontinuities in the wall and is experienced in geotechnical applications such as vertical cut-off walls [13], thus reflecting the case presented in this paper. On the other hand, in examining leakages in jet-grouted cut-off walls, Pan et al. [14] stated that the flow rate of the leakages increases with depth and exposed length of the wall, and decreases when more jet-grouted rows with larger diameter and closer spacing were used. These observations in general support the field observations made herein where the rate of leakage reduced when the skinwall (water barrier) was constructed.
As not many deep excavation projects in Kuching have been documented, this gave rise to an opportunity to study the performance of the soil-structure responses of a three-level basement of a shopping mall and hotel complex with a cut-and-cover tunnel situated in the heart of Kuching city. This paper discusses the unique performance of a deep excavation project with CBP wall tied back with two layers of ground anchors. Detailed site information, the subsoil conditions, construction sequence, field measured data, and site observations will be discussed. The effect of ground anchor installation and dewatering on the soil movement around the deep excavation project will be explained in further detail. The three-dimensional corner effect is also presented.

2. Project Background and Subsoil Conditions

This deep excavation project in Kuching City is made up of two main sections, that is, the main basement area which covers approximately 13,000 m2; and a sloping cut-and-cover tunnel of 120 m long. The longest and widest sections of the main excavation area are 96 m and 155 m, respectively. The reduced level (RL) for the existing ground ranges from RL + 3 m to RL + 3.5 m. The ground floor level was built to RL + 3.6 m. There are three levels of basement, i.e., Basement B1 (RL − 0.6 m), Basement B2 (RL − 3.6 m), and Basement B3 (RL − 6.6 m).
The site layout, together with various geotechnical instrumentations, is shown in Figure 1. The project site is surrounded by century-old colonial era buildings, which consist of two-storey masonry shophouses to the West and Northwest, and one- to two-storey concrete buildings to the Northeast, East, and Southwest of the site. The distance of the closest building to the center of the CBP wall is less than 2 m. Most of these shophouses and buildings were built in the early to mid-20th century. The shophouses are suspected to be constructed on timber bakau piles, as evidenced by the remnants of the demolition of the existing buildings to make way for the current project shown in Figure 2. The timber bakau piles are estimated to be about 6–9 m in length, as reported by Goh and Mair [15] for a project constructed in Singapore at about the same time under the British empire. Owing to the shallow depth, the shophouses are considered as ‘floating’ on the timber bakau piles. At the southern side of the site is an open field.
The main basement was bounded by eight walls consisting of six CBP walls, namely Walls A to F, as indicated in Figure 1 and two existing reinforced concrete (RC) walls. It was constructed with a bottom-up method and the total depth of excavation averaged about 10 m. A 700-mm diameter CBP with center-to-center spacing of 750 mm was used as the retaining wall and tied back with two levels of temporary ground anchors installed at a horizontal spacing of 2.25 m. At the concave corners, double strutting was used instead of ground anchors. The use of temporary ground anchors and corner struts provided unobstructed working space for excavation and basement construction. The length of the CBP wall is 14 m, which leaves the CBP wall embedment length to be about 4 m. To seal the gaps between the successive bored piles, 200-mm diameter cement group columns (CGC) were installed until the depth where hard strata could be found. The details of the CBP wall and CGC can be seen in Figure 3.
The cut-and-cover tunnel is one of the two vehicle exits from the basement parking area. Due to this, the depth of the excavation varies along the chainages of the tunnel from 7 m deep to ground level. A similar 700-mm diameter CBP wall lined up both sides of the tunnel and temporary strutting were available at the top of the CBP wall. The absence of cement grout columns that was supposed to plug the gaps between CBPs has created a ‘permeable’ wall condition along this section. Wooden shophouses occupy one side of the tunnel, while a raised Old Court House sits on the other side of the tunnel. The closest distance from the buildings to the tunnel is 0.6 m. Due to such a close proximity, a few bored piles could not be installed as the drilling machine could not be maneuvered to the location and it was replaced with soldier bored piles instead. A river is located perpendicularly approximately 50 m from the end of the cut-and-cover tunnel. Groundwater table was generally encountered at about 0.7 m to 1.0 m below the ground level.

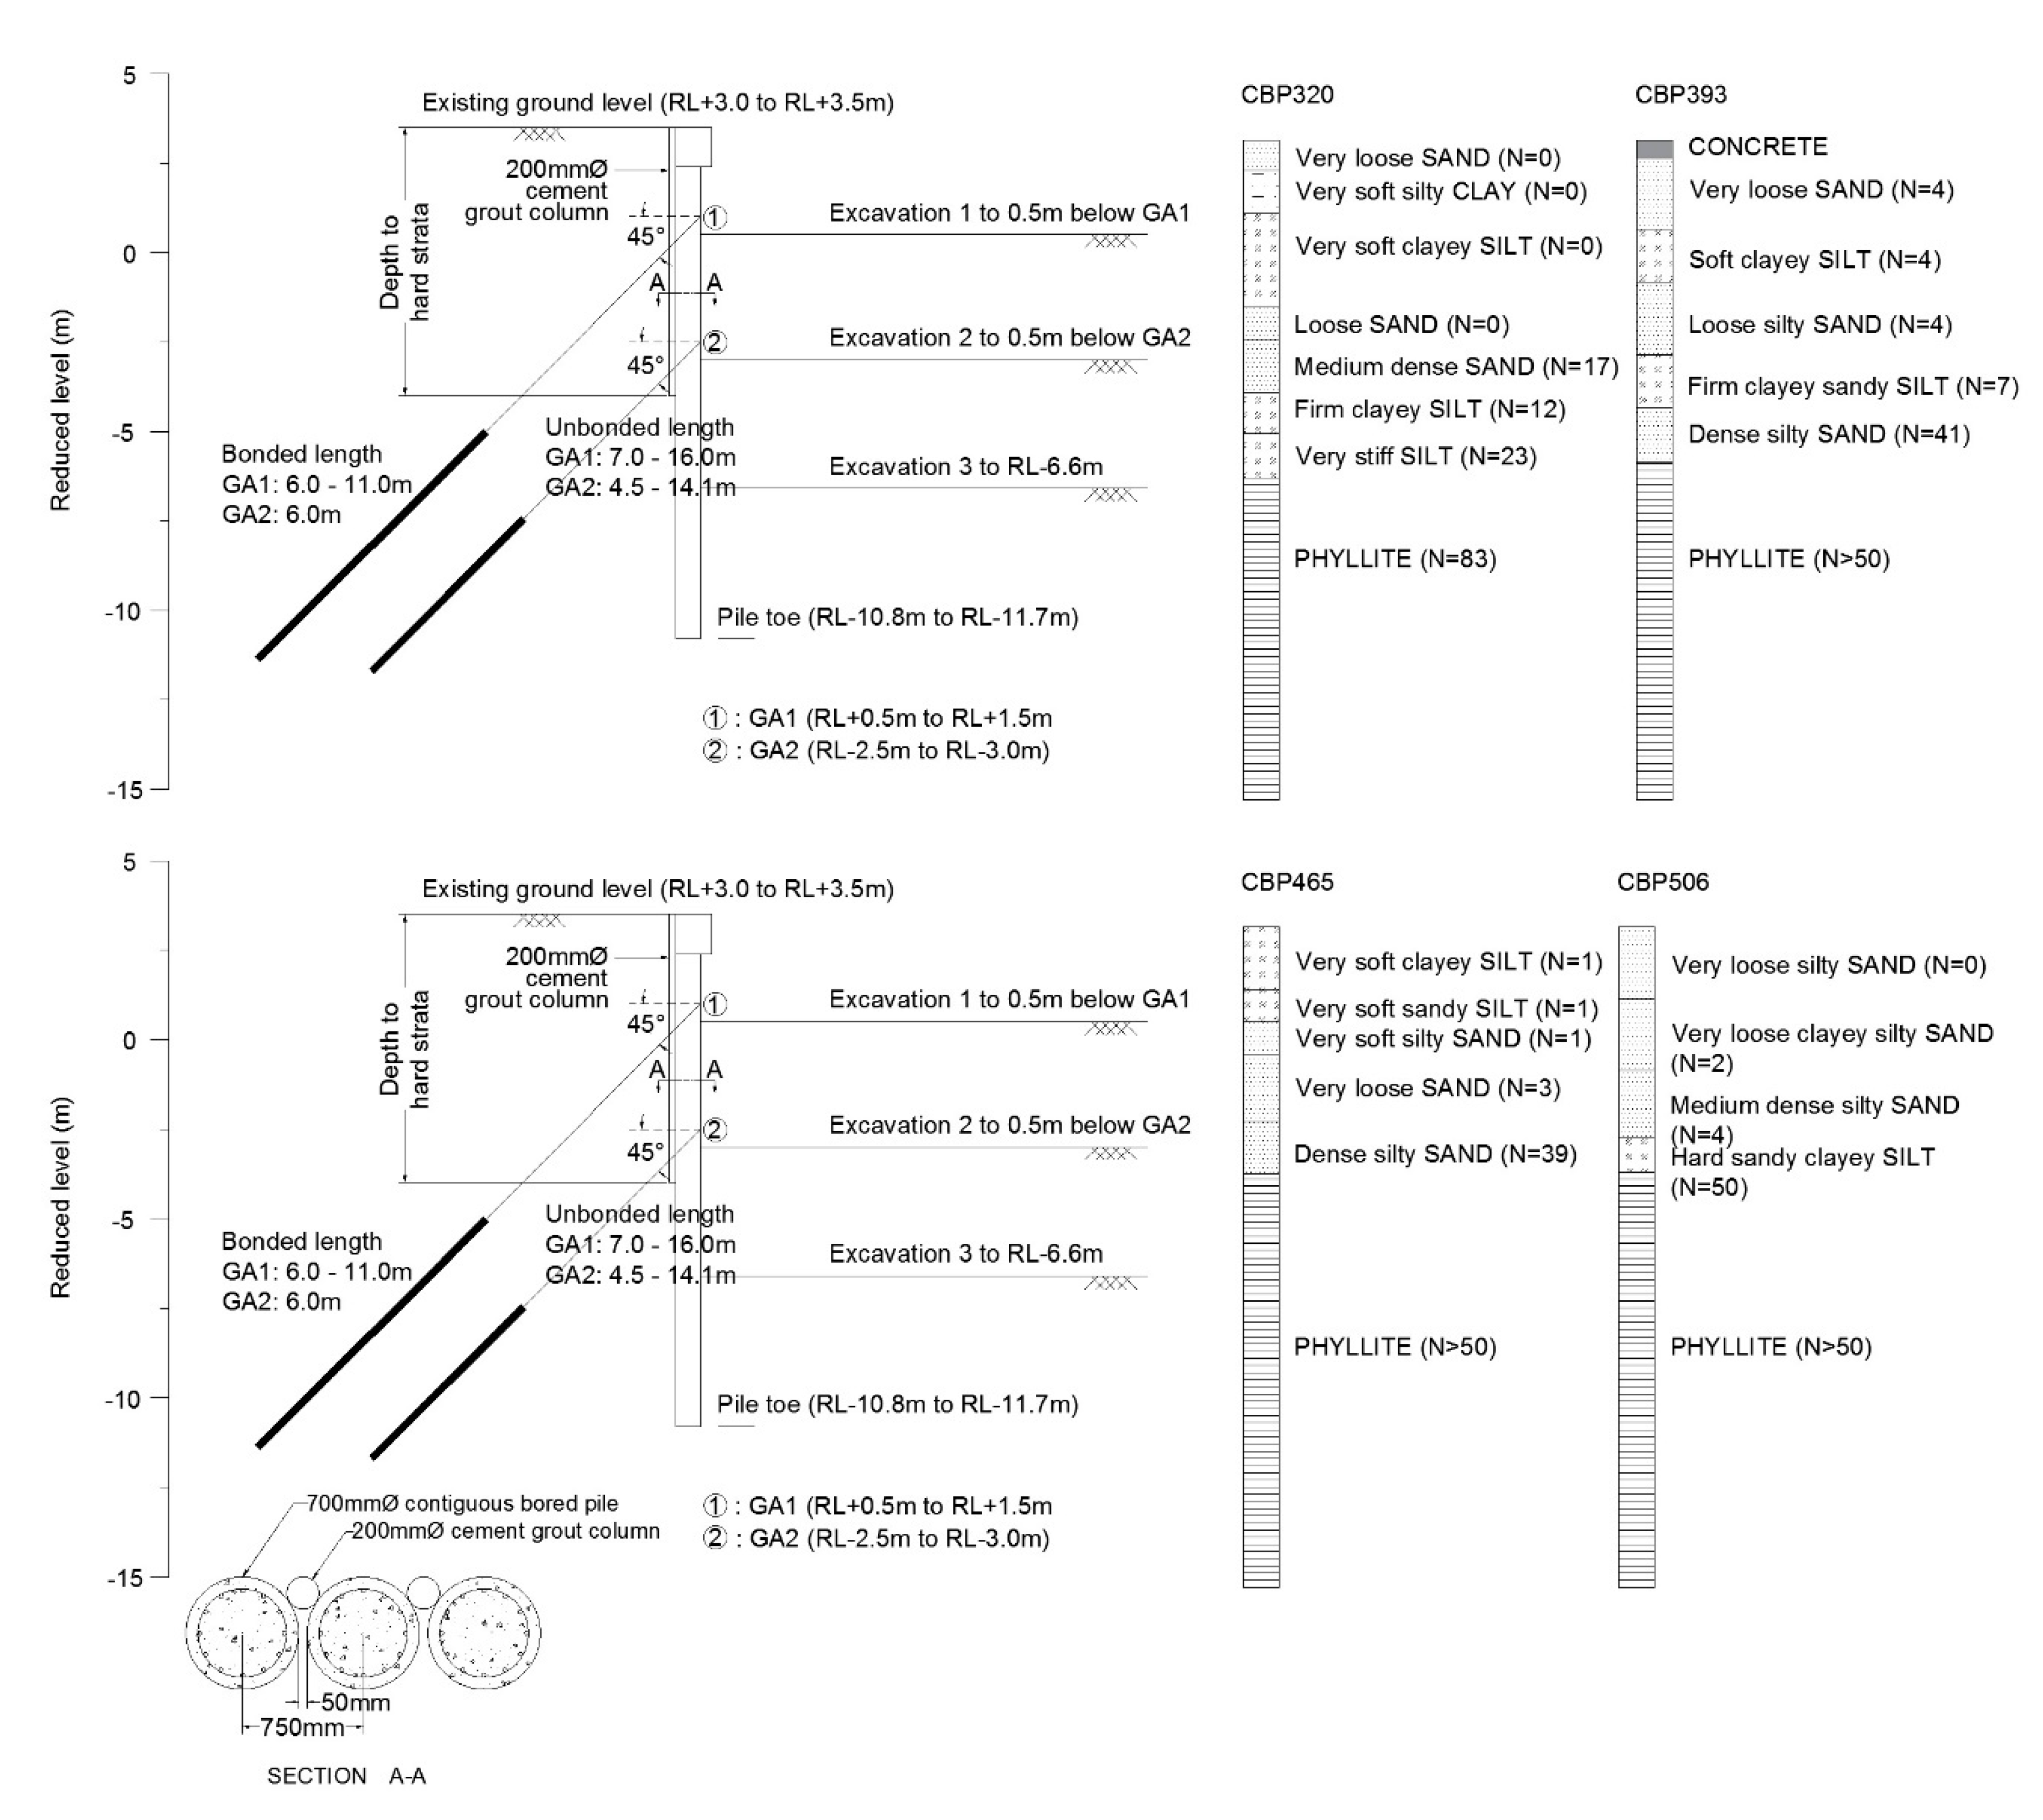
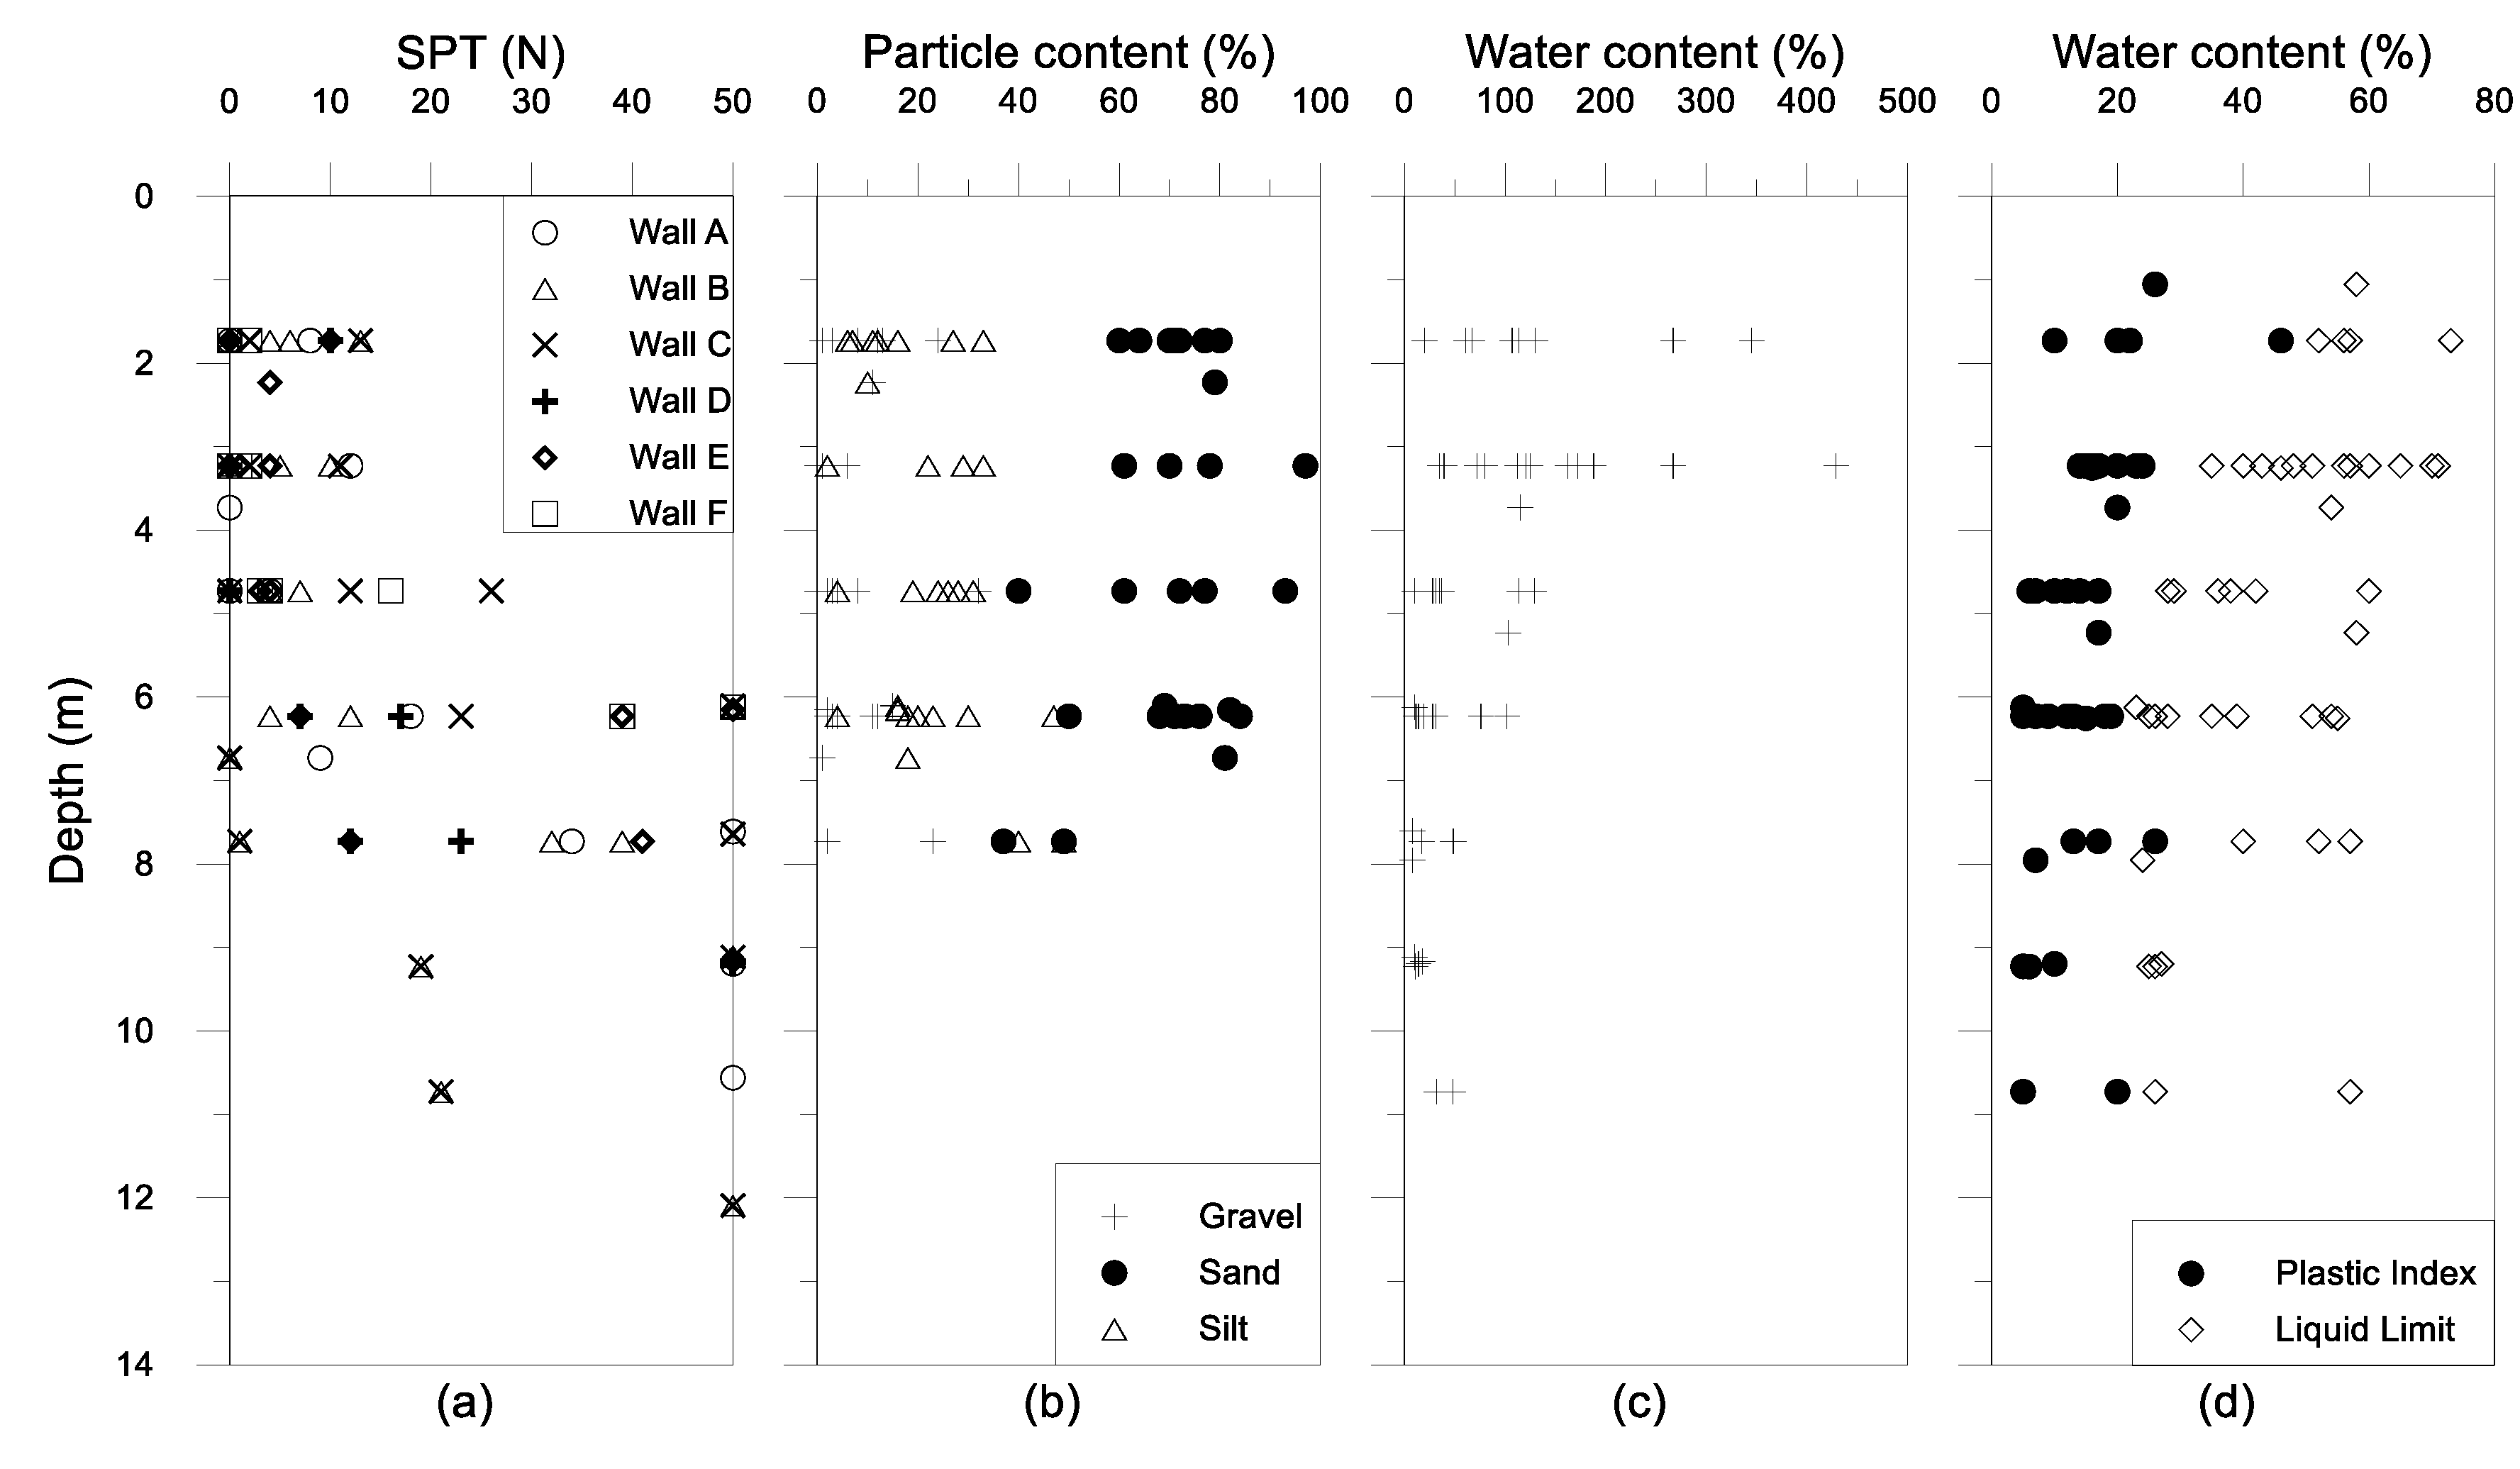
2.1. Soil Conditions

Figure 3 shows the cross sections of the CBP wall and selected soil profiles along Walls D, E, and F. The site is characterized by loose sand interbedded with firm clayey silt with localized pockets of clay and peat. Figure 4 shows the soil properties of standard penetration test (SPT) ‘N’, particle content, water content, plastic limit and liquid limit of the construction site obtained from 28 boreholes drilled during the soil investigation works. The first 5 m have relatively low ‘N’ values, approximately 1–15. This is followed by 15 < N < 50 in the next 5–7 m, i.e., about 8 m from existing ground level. The sand contents are quite high, ranging from 60% to 90% for the top 6 m, as shown in Figure 4b and reduced to 50% at the depth of approximately 8 m. This is consistent with the soil profiles where hard strata in the form of metamorphic phyllite can be found at the depth of approximately 6–8 m below the existing ground level with occasional metasandstone. Despite the fact that the rock quality designation (RQD) of phyllite is less than 25% upon coring, the strength of phyllite as a mass block is relatively undisturbed and exhibited high strength [16]. Due to the presence of rock at shallow depths, the CBP walls are consistently socketed into the predominantly phyllite bedrock.

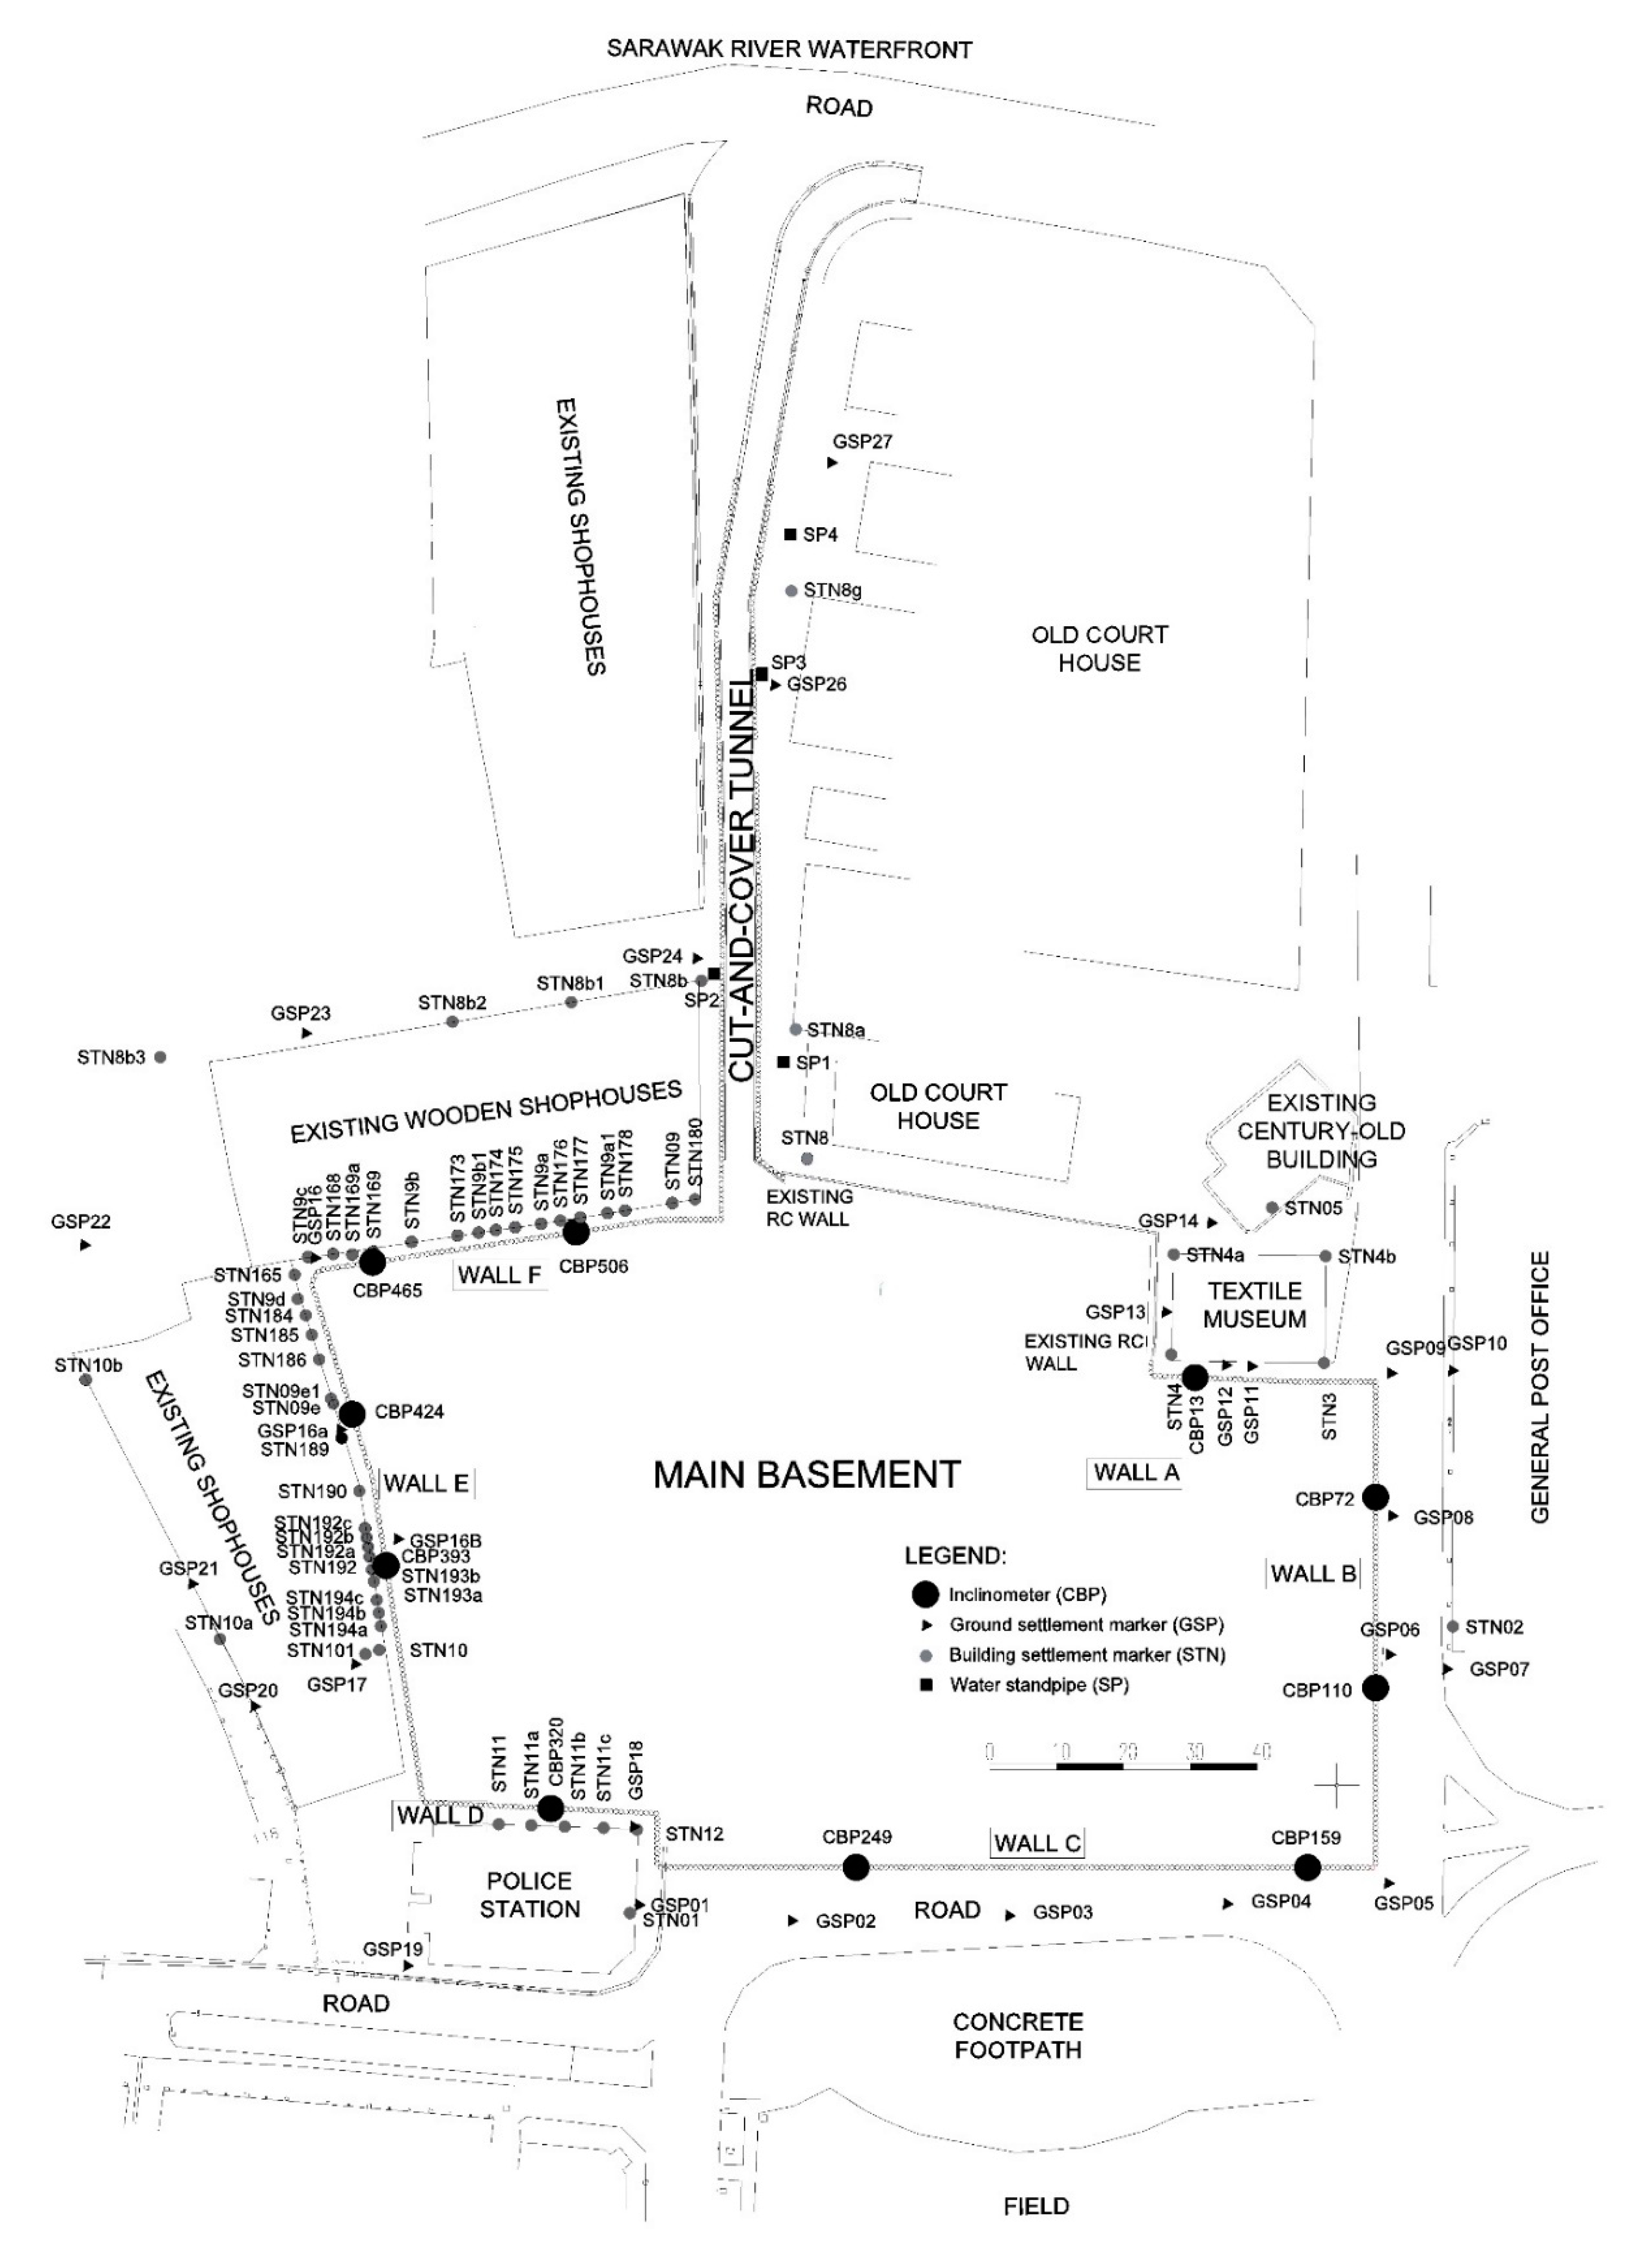
2.2. Geotechnical Instrumentation and Monitoring

In an effort to monitor the performance of the CBP wall during construction, geotechnical monitoring instruments such as inclinometers, building and ground settlement markers, and water standpipe were set up surrounding the excavation site and monitored throughout the whole construction. The layout of the instrumentation plan is shown in Figure 1.
Before the commencement of bored pile installation, there were 45 and 41 numbers of building and ground settlement markers installed surrounding the site, respectively. These settlement points were measured weekly throughout the construction. When relatively large settlements were observed during the construction, additional 40 building markers were installed along Walls E and F, and in the vicinity of the cut-and-cover tunnel. For these sections, the settlement monitoring was carried out biweekly. Unfortunately, 27 of the total settlement markers had to be either replaced or discontinued due to construction activity and disturbance from public.
A total of 10 inclinometers were installed in the CBP wall to measure the lateral movement of the CBP wall. No inclinometer was available at the existing RC wall. Each inclinometer measured at about 20 m length, enabling an extension of 6 m after the pile toe to capture any toe movement, as was reported by Hsieh et al. [17]. A weekly reading was taken for monitoring of wall movement.
Four 50-mm diameter open perforated water standpipes were available along the cut-and-cover tunnel. Monitoring the groundwater level through the open water standpipes is considered sufficient due to the high permeability of the sandy soils. The water levels were taken on a weekly basis at these water standpipes.

2.3. Construction Sequence

Throughout the construction of the basement, three major construction stages could be identified: installation of CBP wall, main excavation works, and substructure constructions. When the contractor took over the site, there was a huge basin at the center of the site left by the demolition of existing buildings. Hacking, relocating, and removing the existing infrastructures within the site perimeter were the initial site preparatory works.
Due to the large excavation size, the excavation progressed clockwise from Wall A to Wall F, followed by excavation at the cut-and-cover tunnel. The construction began with the installation of 700-mm diameter bored piles using concrete grade 40 MPa. An alternate sequence of concreting the bored piles prevented the surrounding soil from collapsing and allowed the concrete to set in the steel casings used. Subsequently, the 50-mm gap between the piles was sealed using 200-mm diameter cement grout columns of varying depths to the bedrock. The pile heads were hacked about 1.5 m from ground level to enable the construction of capping beam. The first stage of excavation was typically about 2–3 m from the existing ground level until 0.5 m below the first level of temporary ground anchor (GA-1), between RL0.0 m to RL + 1.0 m to allow room for ground anchor drill auger to work. Using the rotary wash drilling method, temporary 150-mm diameter ground anchors were installed at 45° angle to provide horizontal restraint for the wall. The ground anchors were made of unravel PC strand system and tested to 1.25 times of the working load. Upon insertion of the ground anchor into the borehole, cement grout of 30 MPa was pumped in through tremie pipe. The ground anchors had 6 m fixed length and approximately 10 m free length, varying from section to section. Once the concrete has set, the ground anchors were pre-stressed to 60 T and the locked off load was 66 T or 110% of the working load to consider for slippage and creep within the tendon [18]. Upon completion, the second stage of excavation took place after the pre-stressing until 0.5 m below the second level of ground anchor (GA-2), which is between RL − 3.0 m to RL − 3.5 m. The same ground anchor installation process is repeated for GA-2. The final stage is excavation to formation level at RL − 6.6 m. The access earth ramp for the construction machineries was located close to CBP249, hence GA-2 installation was done much later. The duration from the start of excavation until the completion of excavation works for each wall section took about three months, except CBP249.
In the middle of the main basement below the formation level, a rectangular pit measuring 15 m × 20 m × 5 m was excavated for septic treatment plant (STP). It was assumed that the construction of the STP has no implication on the soil movement due to (a) being sufficiently far from the CBP walls which is out of the influence zone of an excavation, (b) RC walls were used for the STP, and (c) the whole STP is constructed in mainly phyllite. The construction of substructure began following a dormant period after excavation. After the completion of each level floor slab, skinwalls was concreted over the CBP wall as permanent seal to prevent seepage of groundwater into the basement. Prior to the concreting of skinwalls, the temporary ground anchors were cut off and the anchor heads removed.
For the cut-and-cover tunnel, the construction began with the installation of bored piles which was continued from the main basement. Due to the nature of the cut-and-cover tunnel being an exit ramp, the length of the bored piles varied from 11.5 m at the start of the tunnel to 8.5 m at the end of the tunnel. However, no cement grout column was installed behind the CBP wall. The pile heads were hacked to enable the tunnel cover slab construction. As the excavation progressed, temporary strutting at the top of the piles were installed for the first 90 m of the tunnel. The remaining length of the tunnel did not require temporary strutting due to shallower excavation depths. Construction of skinwalls followed after the concreting of the tunnel slab. The excavation sequence is summarized in Table 1 for main basement and Table 2 for the cut-and-cover tunnel.

3. Site Observations

The dense array of field instrumentations allowed the project to be monitored from many aspects, such as the vertical and horizontal soil movements and the groundwater loss. The allowable building settlement was restricted to 10 mm while the ground settlement was limited to 50 mm. Skempton and MacDonald [19] suggested the allowable settlement for isolated foundations and raft foundations in sands to be 50 mm and 50–75 mm, respectively. Since timber bakau piles were used to support the shophouses along Walls E and F, these buildings were considered to be ‘floating’ raft foundation that will partially settle with the ground.

3.1. Building and Ground Settlements

To facilitate the discussion on the overall response of the building and ground to the construction activities, only the settlement profiles near six out of 10 inclinometer sections will be presented, while the overall settlement for various construction activities will be summarized. Most of the settlement markers were closely located parallel to the CBP walls, due to the location of the existing buildings.
Generally, CBP installation did not contribute much settlement, except for CBP320 and CBP465. Through an empirical method by Clough and O’Rourke [3], the upper bound settlement for diaphragm wall installation in granular soils is 0.12% of the wall depth, equivalent to 16.8 mm in the present case. Gaba et al. [20] suggested the surface movement at wall for CBP wall installation in stiff clay 0.04% of wall depth, which translates to approximately 5.6 mm for the present case. From Table 3, the ground settlement during the CBP installation for the entire site ranges from 0.3 mm to 17.6 mm. If Clough and O’Rourke’s limit were to be used, ground settlement at CBP320 and CBP465, which measured at 17.6 mm and 13.2 mm (both 24% of the total settlement), respectively, would have exceeded the limit. The ground settlement near CBP72, CBP110 and CBP249 shows a rather substantial percentage of settlement, 27%, 22% and 20%, respectively. However, the magnitude of those settlements is relatively smaller than CBP320 and CBP465.
As expected, the main excavation works had caused much of the settlement to occur, especially along Walls E and F. The building settlement near CBP393, CBP424, CBP465, and CBP506 recorded settlement from 18.7 mm to 98.3 mm, much greater than the allowable building settlement of 10 mm. For these sections, the ground settlement markers also recorded similar magnitude to the building markers, ranging from 17.9 mm to 93.3 mm. It can be deduced that the buildings (shophouses) which were founded on timber bakau piles settled together with the ground upon removal of the overburden stresses. Essentially, this means the buildings are ‘floating’ on the timber bakau piles. A separate discussion on these wall sections will be made in the next section. For CBP249, the main excavation works contributed to 16.9 mm ground settlement (77% of the total settlement). The high percentage of settlement was due to the longer construction period as CBP249 was located near the temporary access ramp. Figure 5 shows the overall building and ground settlement profiles for CBP13 and CBP320. There is a remarkable difference between the building and ground settlement. The latter is settling much more than the building settlement. This finding suggested that the buildings near to these two sections were built on solid foundation that were able to tolerate the soil movement. The ground, however, settles when the horizontal stress increases.

3.2. Specific Observations Along Walls E and F

As mentioned in the preceding section, the building and ground settlement along Walls E and F were relatively large during the main excavation works. Figure 6 presents the measured settlements near four inclinometer sections along Walls E and F that had experienced rather substantial movement during the main excavation works and warrant for a closer examination. The main excavation works consist of Stages 3 to 9, that is, the three stages of excavation and ground anchor installation and pre-stressing in between the excavation works. These activities contributed up to 98.3 mm and 93.3 mm settlement, accounting for 55% and 53% of the total building and ground settlement, respectively. Based on the settlement markers that were ideally lined perpendicularly to the inclinometer section (marked by black color line in the figure), STN193b near CBP393 recorded 117.4 mm building settlement at Day 400. For other inclinometer sections, the largest settlement for CBP424, CBP465 and CBP506 measured at 60.9 mm, 43.6 mm and 13.8 mm, respectively. There were other settlement markers that recorded larger settlement than reported here but these settlement markers were not in a perpendicular direction behind the inclinometer sections. Upon the alarming settlement observation, additional settlement markers, mostly building settlement markers, were installed and increased monitoring of twice weekly were practiced.
It was observed that Stages 4, 5, 7, and 8, which are the ground anchor works, contributed to large and immediate settlement. Table 4 summarizes the percentage of settlement during the ground anchor works and excavation works. The ground anchor works had caused building settlement of up to 47% and ground settlement of up to 37%. Meanwhile, the excavation works caused smaller percentage of settlement, except for CBP506 with 80% and CBP465 with 53%. These two outliers could be ignored as the final settlement was only 1.5 mm, and thus the large percentage of settlement was caused by fluctuation in the data. The installation of GA-1 caused smaller settlement compared to GA-2, while the second stage of excavation had the largest settlements. Rotary wash drilling method had been used in the ground anchor installation works. Due to the use of water during drilling process, the soil particles may possibly be washed out from the holes and thus causing large settlements. Kempfert and Gebreselassie [21] reported that for an excavation project in soft soil with soldier piles and tied back with a single layer of ground anchor spaced at 0.90 m, it recorded 60–72% settlement that occurred during anchor installation. They attributed the appreciable settlement to fresh cement–bentonite slurry in the drill hole and the vibration arising from the anchor installation method.
Another possible reason for the relatively large settlements is groundwater loss. An acute observation revealed continuous water stain marks below the ground anchor positions for most of the wall sections, especially Walls D, E, and F, as can be seen in Figure 7a. The CBP wall was considered to be watertight as cement grout columns were used to seal off the gaps in between successive bored piles for the entire wall. This was confirmed through the dry CBP walls at the corner of the main basement (right side of Figure 7a), where corner struts were used instead of ground anchors. However, as the ground anchor center-to-center spacing is 2.25 m, it coincides with the cement grout columns that provides water proofing. The ground anchor drilling process (Figure 7b) cut through the grout columns and ‘punctures’ the water-tightness of the CBP wall. Clough and O’Rourke [3] described several cases where potential water flow may lead to ground settlement, among them are flow through wall flaw as shown in Figure 8. Although the ground anchors were grouted immediately after the insertion of ground anchor, fresh concrete requires curing time to effectively seal the gap. Site observations indicated that at the first opportunity when the puncture occurred, the groundwater showed immediate response by seeping through the drill hole as shown in Figure 7c. As the groundwater table was generally about 1.0m below the existing ground level, which is higher than GA-1 level, the water stain marks occurred for both GA-1 and GA-2 levels. This response further confirms the previously discussed Figure 6, where the large and immediate settlement could be observed during ground anchor works as discussed earlier. The groundwater loss issue ceased when skinwall was constructed. Unfortunately, water standpipes were not available at the main basement, as it was thought to be unnecessary due to the presence of cement grout column.
Figure 9 shows the relationship between the measured maximum building and ground surface settlement (δvm) and the excavation depth (H) for all excavation stages. The δvm generally increase as H increases, especially for Walls D, E, and F. However, there are also a good spread of data that has registered very small δvm, allowing the data to fall within the range of 0% to 1.23%H, for both building and ground settlement. Included in Figure 9b are the δvm /H from databases such as Clough and O’Rourke [3] for excavation in stiff clays, residual soils, and sands; and Moormann [22] for non-cohesive soils; and some data from excavation in sand [23,24,25] for comparison. These case histories had relatively small settlement compared to the present study, generally below 0.33%H. As previously discussed, the flaw in the CBP wall upon ground anchor installation had caused the groundwater loss and significant settlement had been observed. Due to some settlement markers being located further away from the wall or on buildings that has more solid foundation, a big range of δvm /H is observed. Zhang et al. [26] reported a quite similar experience to the present study, where δvm /H was 0.9% and attributed the large ground surface settlements to significant groundwater drawdown.

3.3. Groundwater Levels

The groundwater monitoring was only available at the cut-and-cover tunnel where the CBP walls were considered to be ‘permeable’ due to the absence of cement grout column. During the early stages of construction, it was observed that the soils in the gaps between the pile were constantly damp, indicating slow groundwater leakage through the wall. Figure 10 displays the measured groundwater level and the corresponding settlement profiles for SP1, SP2, SP3, and SP4. It is observed that when the excavation was carried out, the groundwater level behind the wall were immediately drawndown. During the quiescent period for skinwall preparatory works, the groundwater level was noted to maintain at the final excavation levels consistently for SP1, SP2, and SP3. This demonstrated the groundwater loss through the gaps in between the piles experimented by Richards et al. [12]. Prior to concreting the foundation slab, submersible pumps were placed in depressed pump sumps to extract the seepage water on the excavation floor so that concreting can be carried out in the dry. Similarly, the casting of skinwall was carried out in dry condition. Casting of skinwall cut off the groundwater flow through the wall and re-established the groundwater to its original level. Although the settlement was less than 5 mm, the settlement profiles for the three water standpipes showed a similar trend where during the excavation induced groundwater lowering, the settlement occurred at higher rate and slowed down considerably upon the construction of skinwall. This observation also strengthens the earlier observation where groundwater lowering induced by ground anchor installation works had caused relatively large settlement to occur along Walls E and F. At the end of the tunnel, the groundwater level was observed to drawdown gradually with the excavation as shown in Figure 10d. Similarly, with the settlements near the other three standpipes, minimal settlement was observed. Unfortunately, due to SP4 being destroyed during construction activity, no data could be obtained after skinwall construction.

3.4. CBP Wall Deflections

Before further examination of the horizontal wall deflection (δh), there is a need to establish if the wall toe movement is significant. Hwang et al. [27] suggested that the magnitude of the wall deflection is affected by the wall toe movements and further argued that wall deflection simply cannot be moving outward, due to the limit of strut elongation. Figure 11 shows the progression of the wall toe movements at all excavation depths. The first stage of excavation hardly recorded any movement except for CBP159. The second stage of excavation sees a little more movement, but it is within 0.5 mm from the wall. The final stage of excavation caused the wall toe to move inward with the largest movement of 2 mm. With such small measurements, the wall toe movements were considered to be insignificant. This observation further strengthens the fact when the bored piles are socketed into phyllite by about 4 m, the mass block of phyllite layer provided sufficient strength to restrict the wall movement. Furthermore, it is possible to have an outward toe movement in this case, as over-stressing the ground anchor will cause the outward toe movement.
Figure 12 shows the horizontal wall deflections for excavation Stages 3, 6, and 9. It is observed that the wall behaved in cantilever mode at Stage 3, where the largest movement occurred at the top of the wall. This movement is expected as the soil near the top has been excavated for pile head hacking and subsequently to 0.5 m below GA-1. The maximum horizontal deflection (δhm) for Stage 3 occurred at CBP13 with 4.04 mm. After the installation of GA-1, the deflection profile changed to prop mode, where the top of the wall moved towards the retained soil. For CBP13, CBP393, and CBP424, the effectiveness of ground anchors were demonstrated when the wall is pulled into the soil by the ground anchor as indicated by the negative deflection value [28]. Although the wall deflection profiles for CBP159 and CBP249 continued the cantilever mode, it was due to CBP159 being situated in a localized pocket of peat which exerts higher pressure onto the wall, while CBP249 was located near the temporary access ramp with heavy machineries passing by. The largest deflection for Stage 6 occurred at CBP249, measuring 7.9 mm. The deep inward movement for all the sections continued to Stage 9, although CBP393 exhibited otherwise. The largest deflection occurred at CBP249, measuring 14.3 mm.
Most of the δhm occurred near or higher than the excavation surface, similar to observations in clay [29,30]. From Figure 13, the depth to the maximum lateral wall deflection, Hm, is generally close to the excavation depth. Apart from a few exceptions, the data falls within Hm = H to Hm = H–4.5, indicating Hm to occur higher than the excavated surface. For CBP506 at Stage 3, the maximum deflection was recorded at 18-m depth, but it was caused by fluctuation of very small wall deflection. At Stage 9, most of the maximum deflections occurred near the depth of the second excavation. Owing to the shallow depth to hard strata, some of the Stage 9 excavation are done at the phyllite layer. Therefore, smaller deflections were observed near to the surface of final excavation.
Figure 14 presents the relationship between the δhm and H. The entire δhm lie below 0.2%H. The small deflection experienced in the present study is likely due to the groundwater drawdown caused by the puncturing of walls during ground anchor installation. Relief of pore water pressure in the ground due to the accidental dewatering has resulted in less lateral earth pressure to be exerted on the CBP wall. Other reported δhm/H for sandy soils tend to be higher, within the range of 0.28 [23,31] to 1.33 [32], which did not observe any groundwater drawdown. Moormann [22] reported δhm/H = 0.5% for excavation in sand. Besides, the shallow depth of phyllite layer have led to smaller deflections as well.

3.5. Relationship between Maximum Wall Deflections and Maximum Settlements

As has been established in the present study, the building settlements were observed to be relatively large with small wall deflection. Figure 15a examines the normalized relationship of maximum building settlement and maximum wall deflection. A typical relationship is δvm/δhm = 0.5–1.0 [29]. In the present study, the δvm/δhm ratio is 14.8. The upper bound of the ratio is contributed by the large building settlements around CBP393. Ignoring these values, the maximum δvm/δhm ratio will be 6, still significantly larger than the typical value of 0.5–1.0. Zhang et al. [26] reported δvm/δhm of 10 and attributed the excessive ground surface settlements to significant groundwater drawdown due to under-drainage mechanism. Therefore, drawing upon the data from the water standpipes at the cut-and-cover tunnel, it is deduced that groundwater drawdown, caused by ground anchor installation that punctured the wall, has led to significant settlement. The same observation is also extended to the ground settlement where Figure 15b illustrates the maximum δvm/δhm ratio is 14.5. The comparable δvm/δhm ratios between normalized building and ground settlement was due to shophouses being built on ‘floating’ timber bakau piles that follows the ground settlement.

3.6. Corner Effect on the Maximum Settlements

Higher concentration of settlement markers along Walls E and F will be presented for discussion of corner effect. Figure 16a shows the relationship of building settlement (δv) normalized with δvm and distance to corner (d’) normalized with wall length (L) for Wall E. At d’/L = 0.0–0.3, no settlement markers were available. For all the three stages of excavation, the settlement data concentrated within d’/L = 0.3–0.5 (centre of the wall) are larger than those at d’/L = 1.0 (corner). This implies the corner effect is present through the corner restraint of the CBP wall.
Along Wall F, the corner effect for all three stages of excavation displayed the corner effect prominently, as observed from Figure 16b. It is to be noted that the larger settlements occurred from d’/L = 0.0 to d’/L = 0.5 and the left wall corner is located at d’/L = −0.3. The slight shift in the d’/L towards the left corner could be explained by the irregular geometry of the excavation where d’/L = 0 is 80° concave corner while d’/L = 1.0 is a 90° convex corner, which would have lesser earth pressure on the wall, and thus less settlement.
It seems the groundwater lowering due to puncturing of the wall does not seem to diminish the corner effect. Furthermore, the groundwater leakage was observed uniformly for Walls E and F, thus any effect from groundwater lowering on the corner restraint is not significant.

4. Conclusions

This paper presents the construction and monitoring of a deep excavation project in the heart of Kuching City. The site background and observations have been thoroughly discussed. Based on the field measurement results, the following conclusions can be drawn:
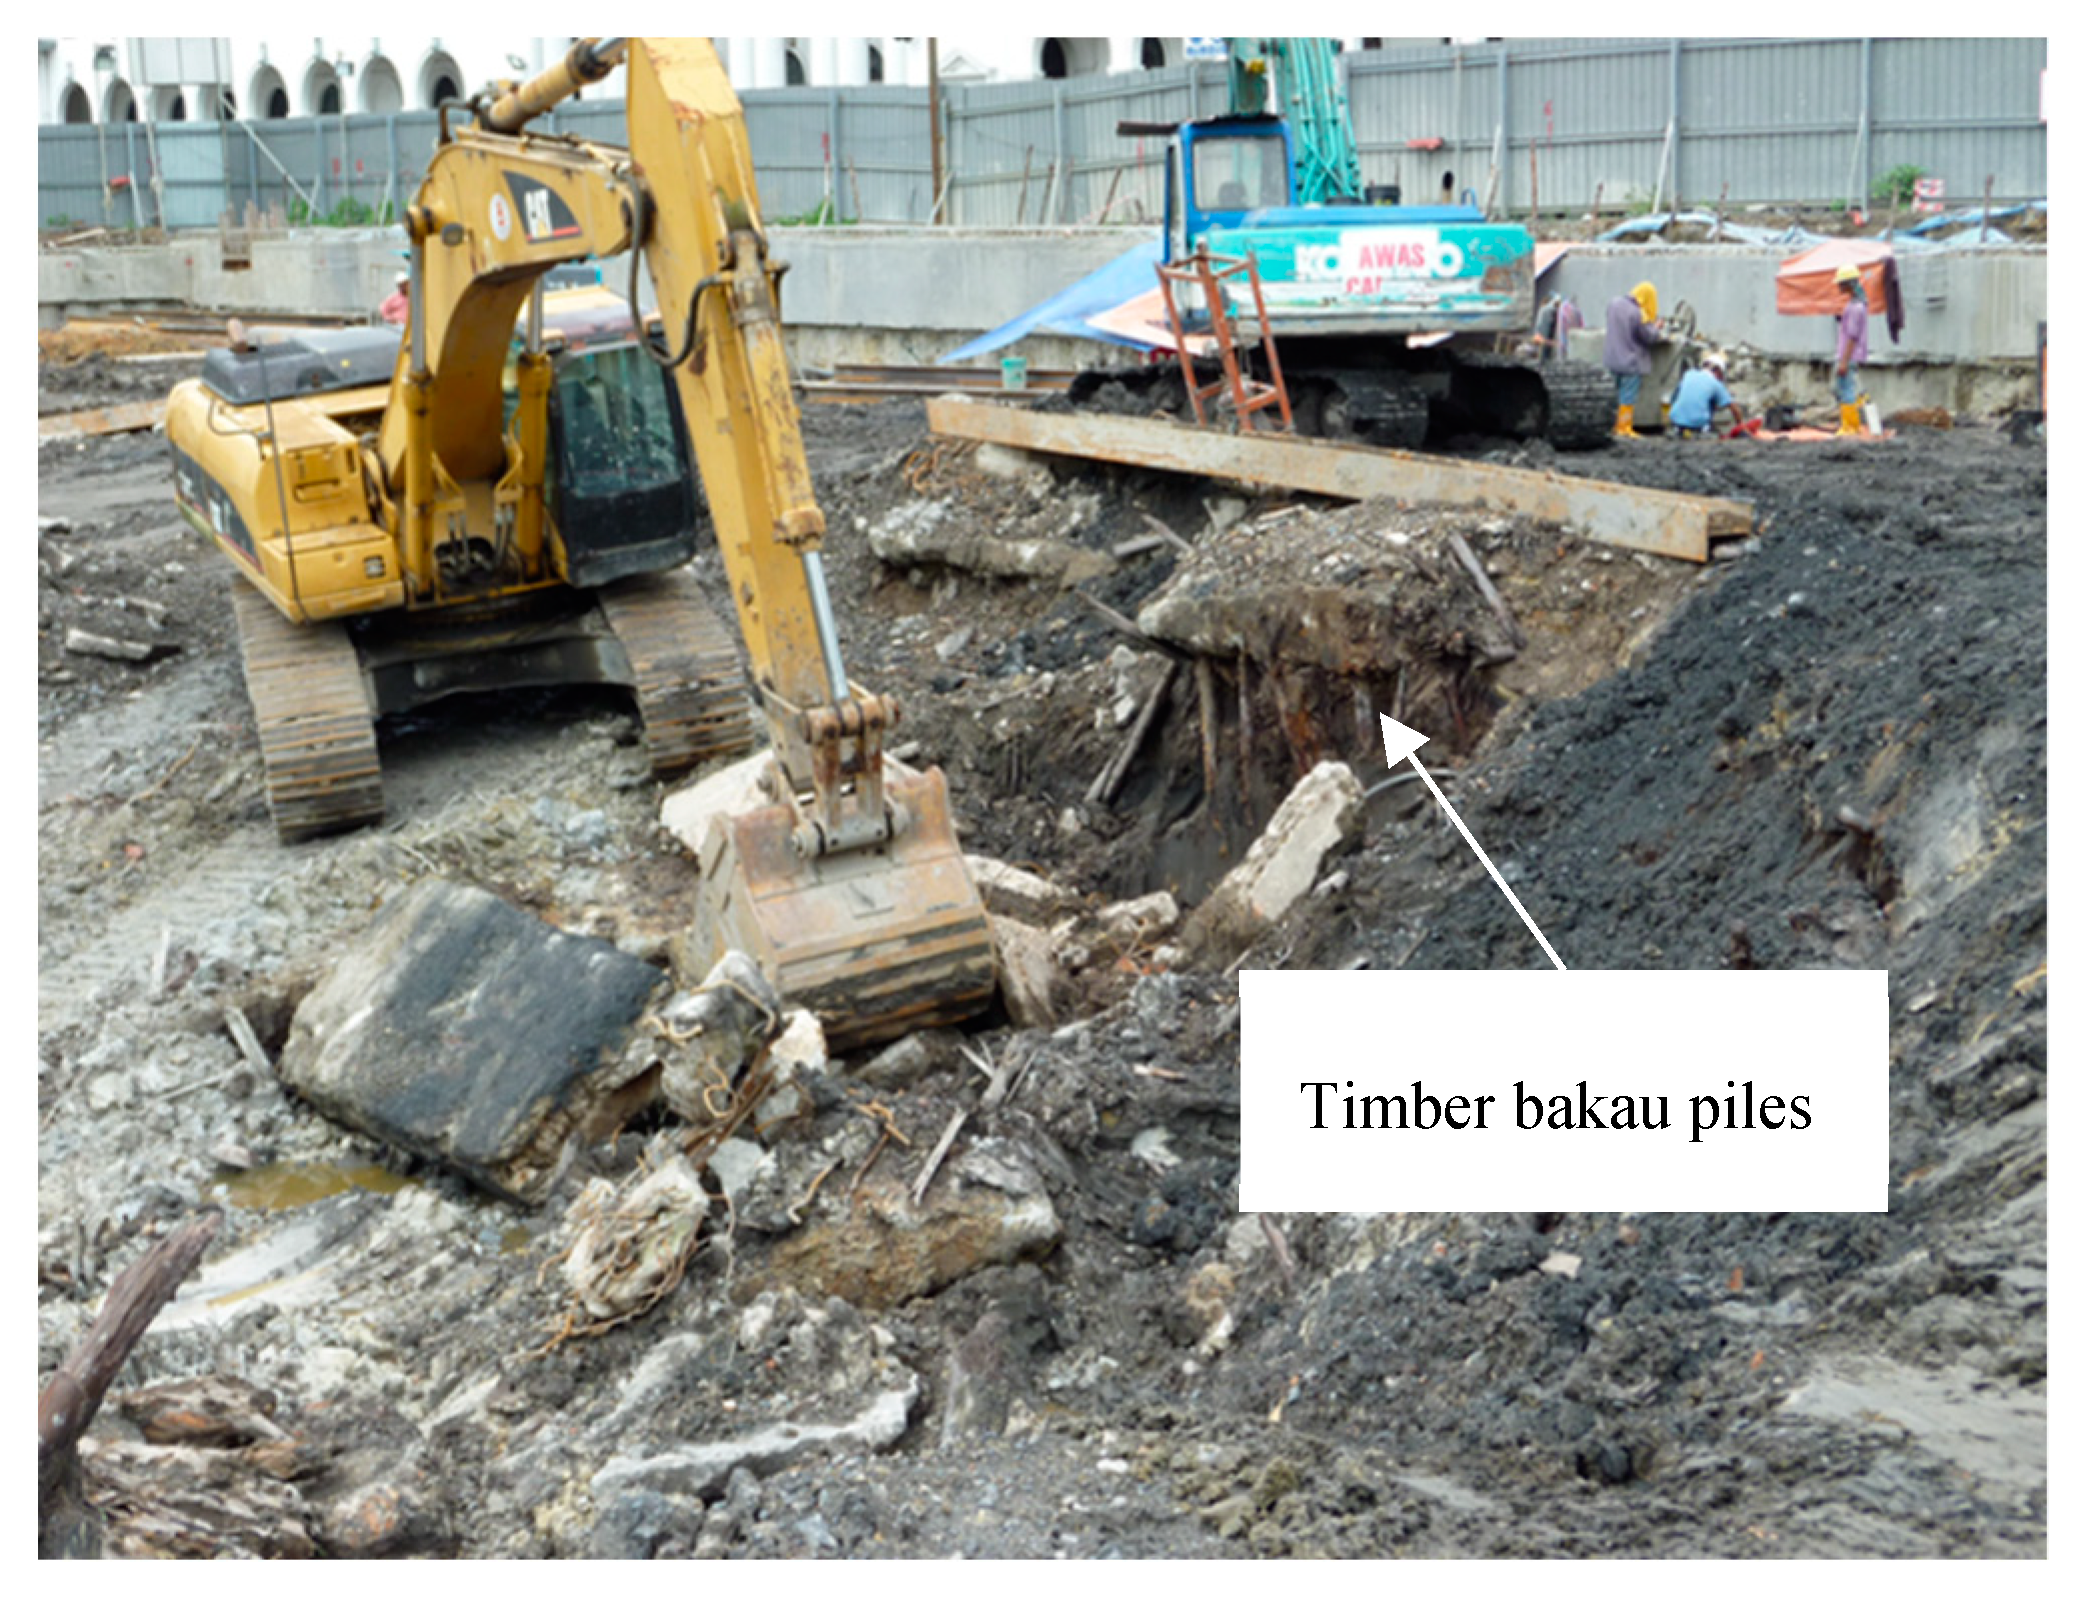
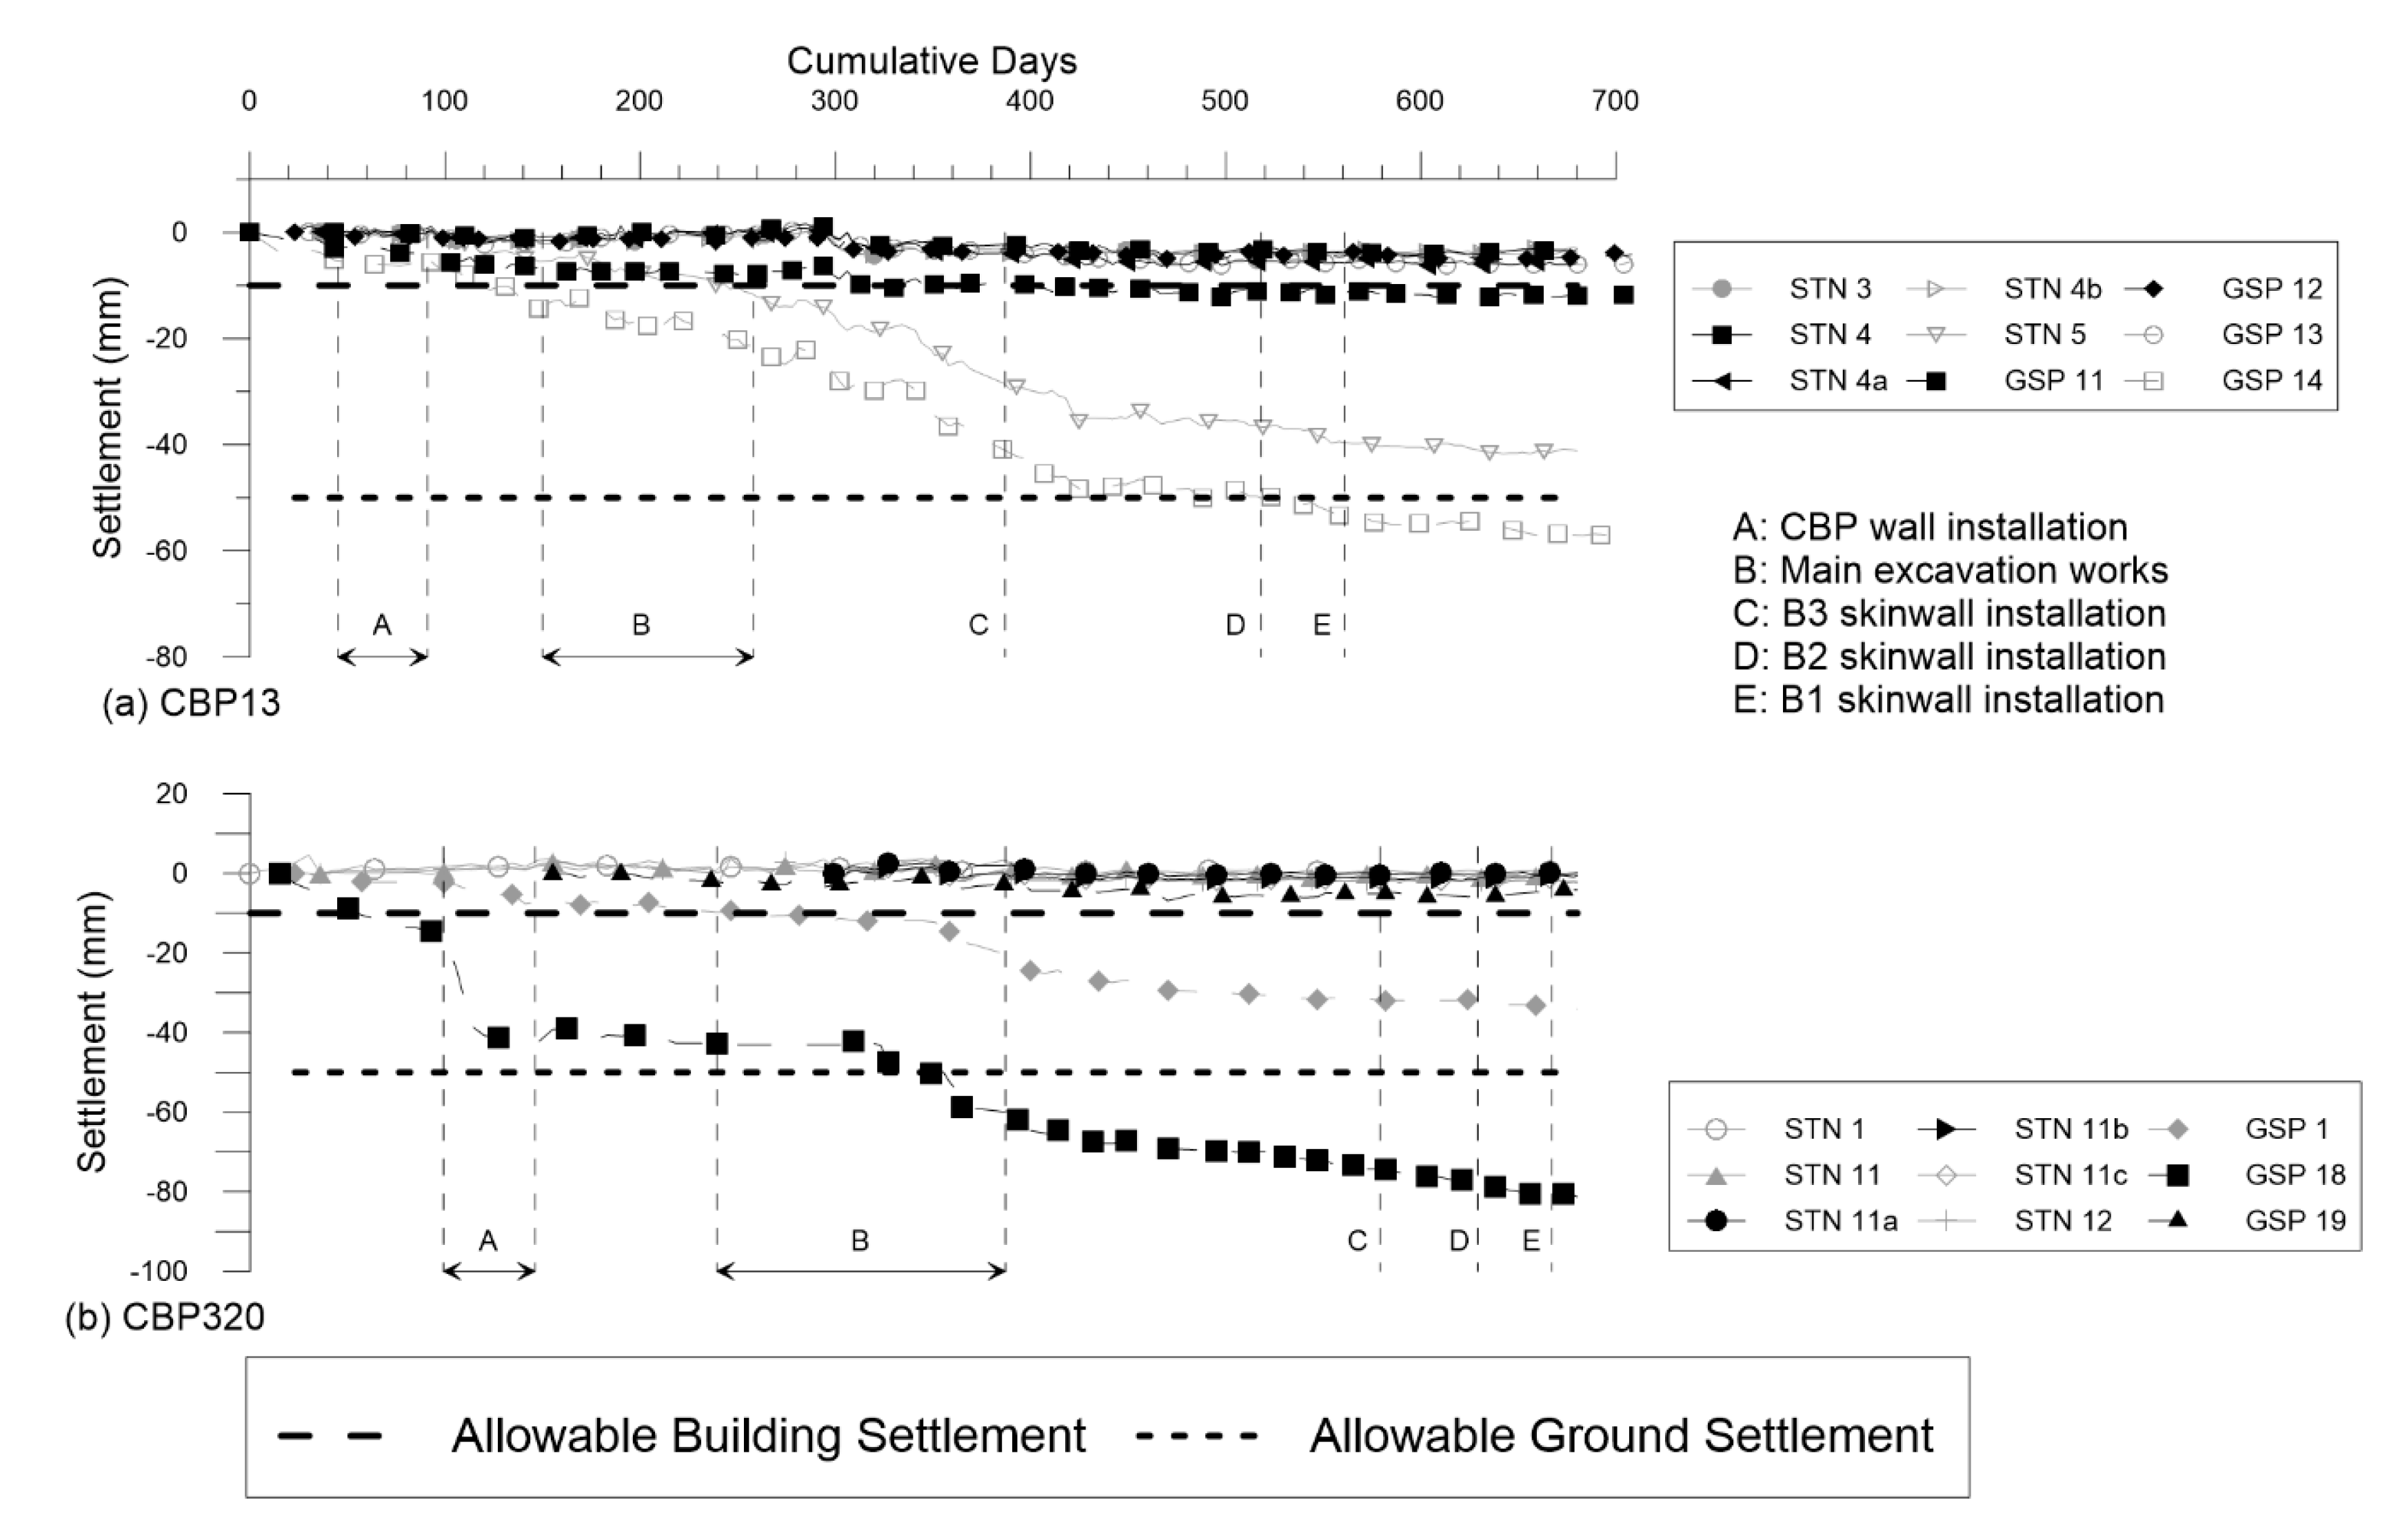
  • Generally, CBP installation works did not cause much settlement to occur. The main excavation works had caused substantial building and ground settlement up to 98.3 mm and 93.3 mm, respectively. This accounts for 55% of the total building settlement and 53% of the total ground settlement. Due to the similarity in magnitude of the settlement, the buildings that are founded on timber bakau piles along Walls E and F are said to be settling together with the ground.
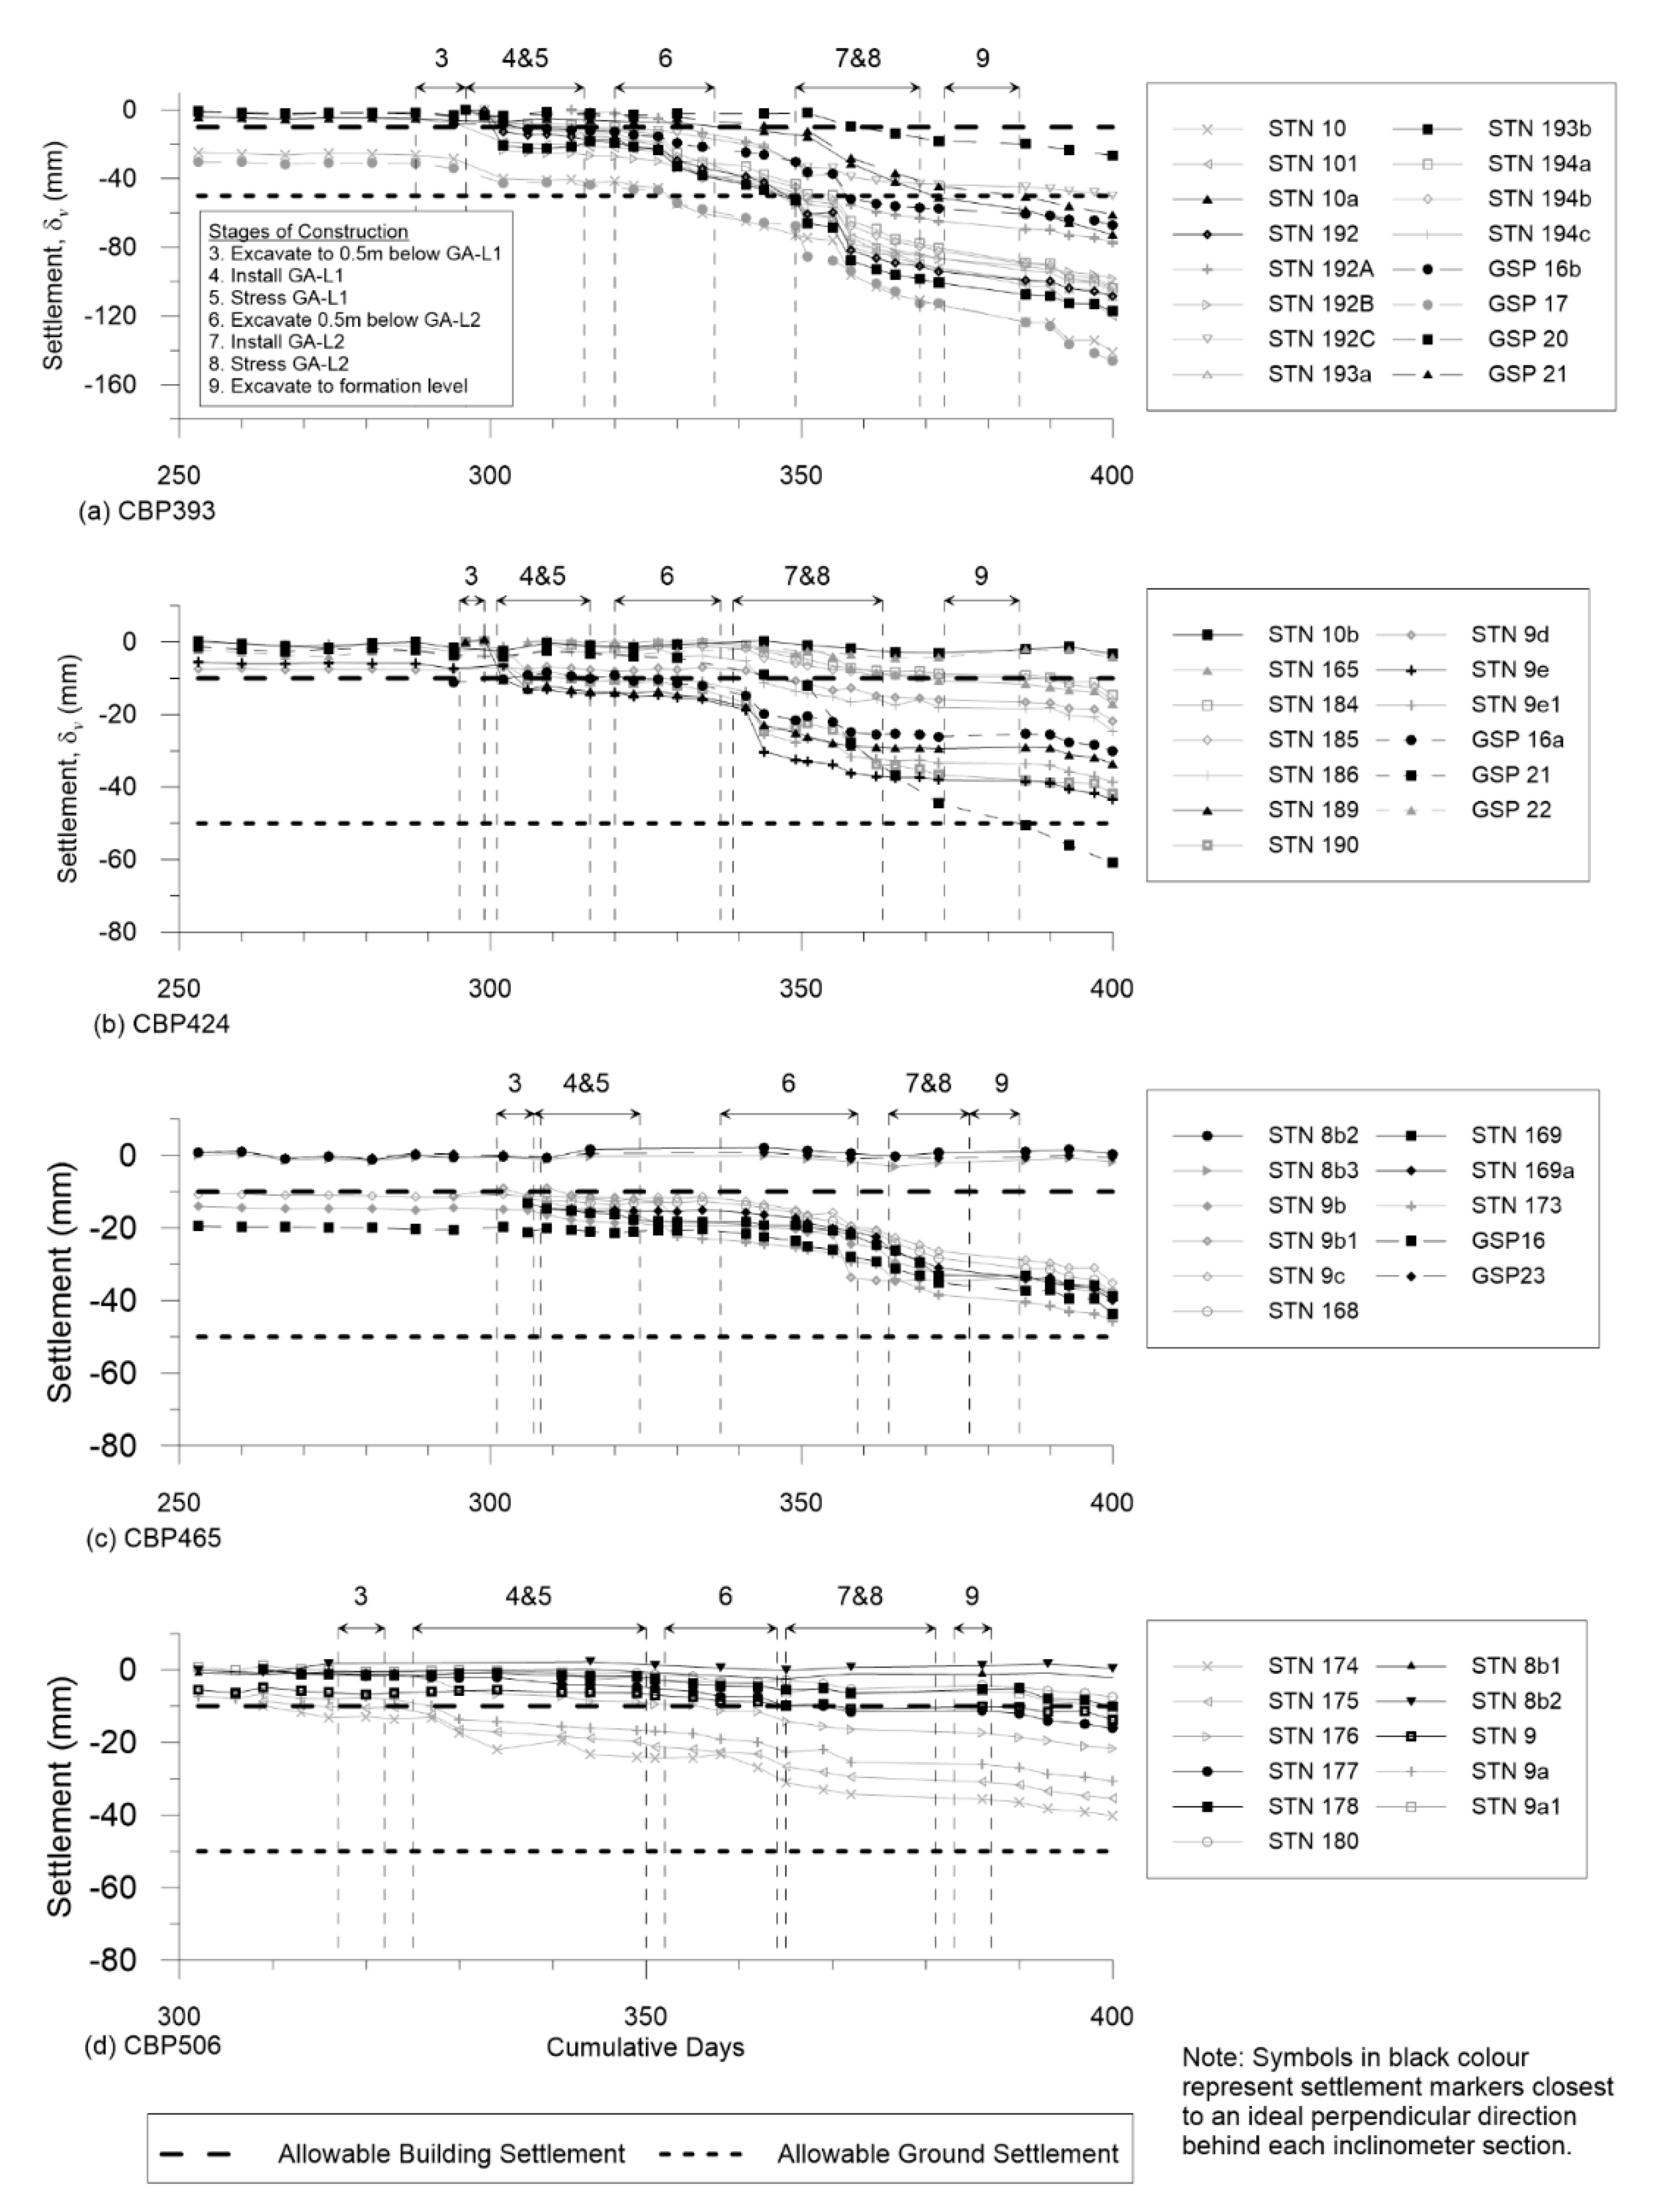
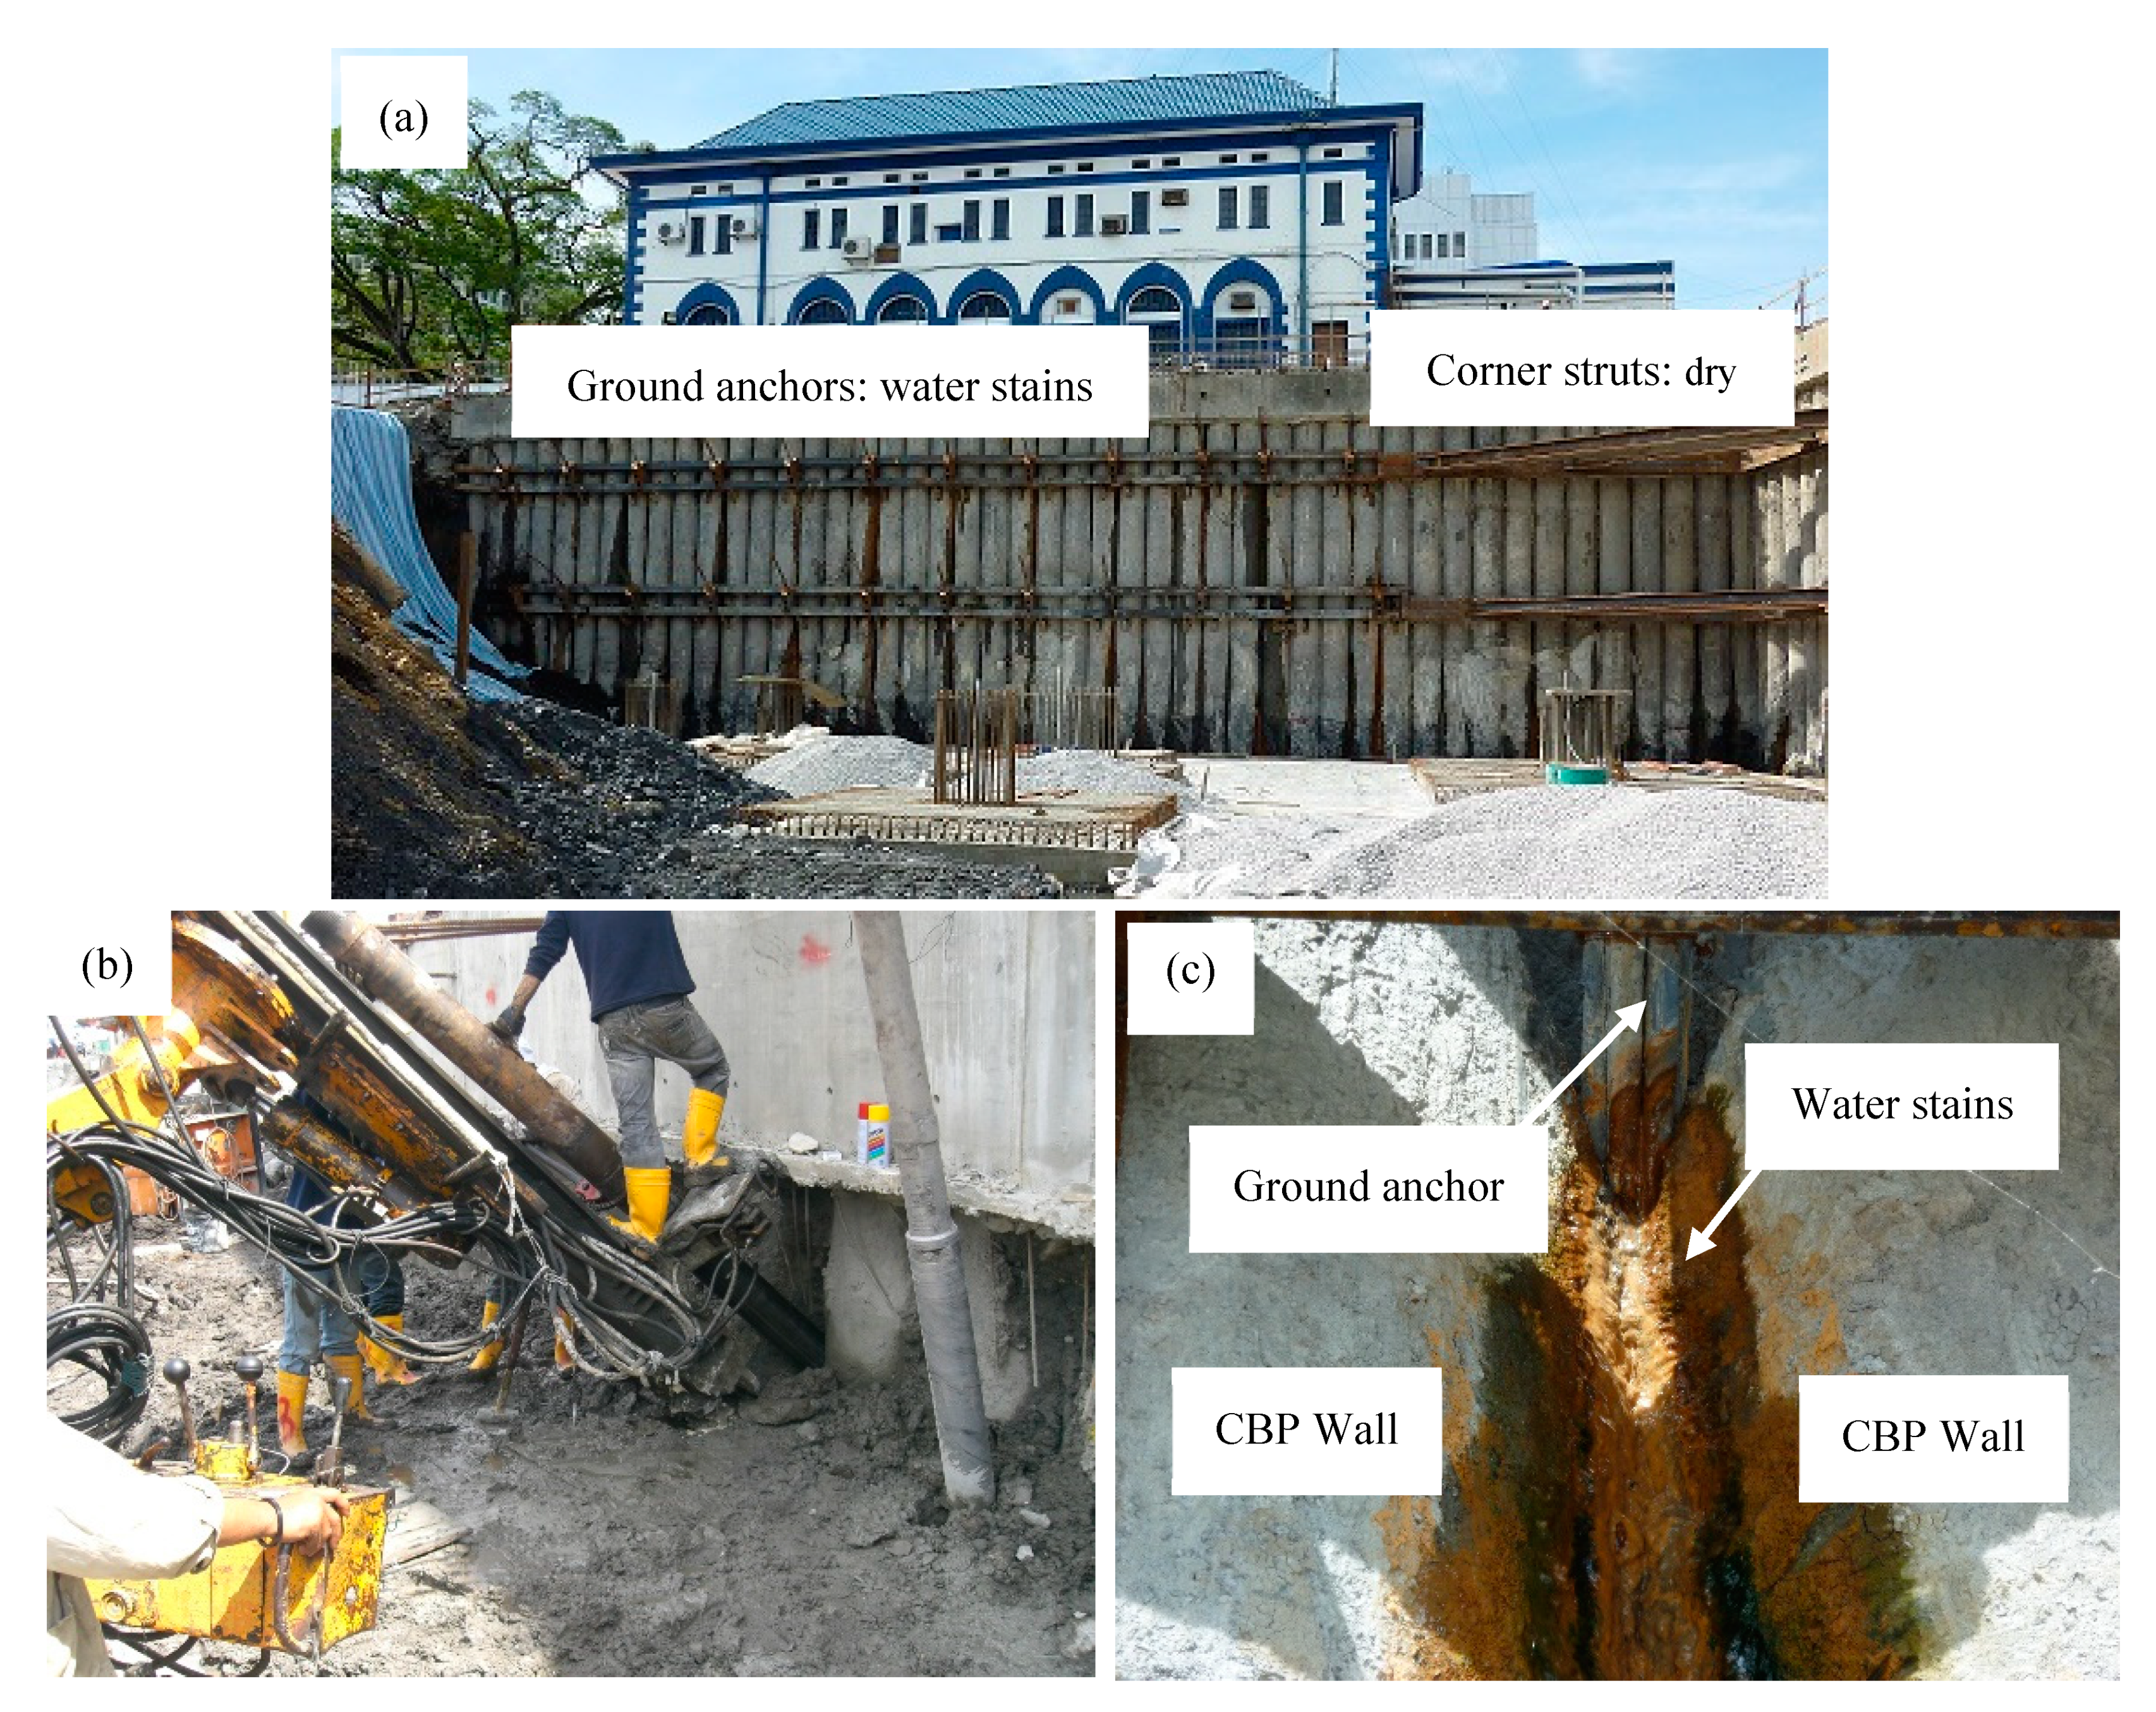
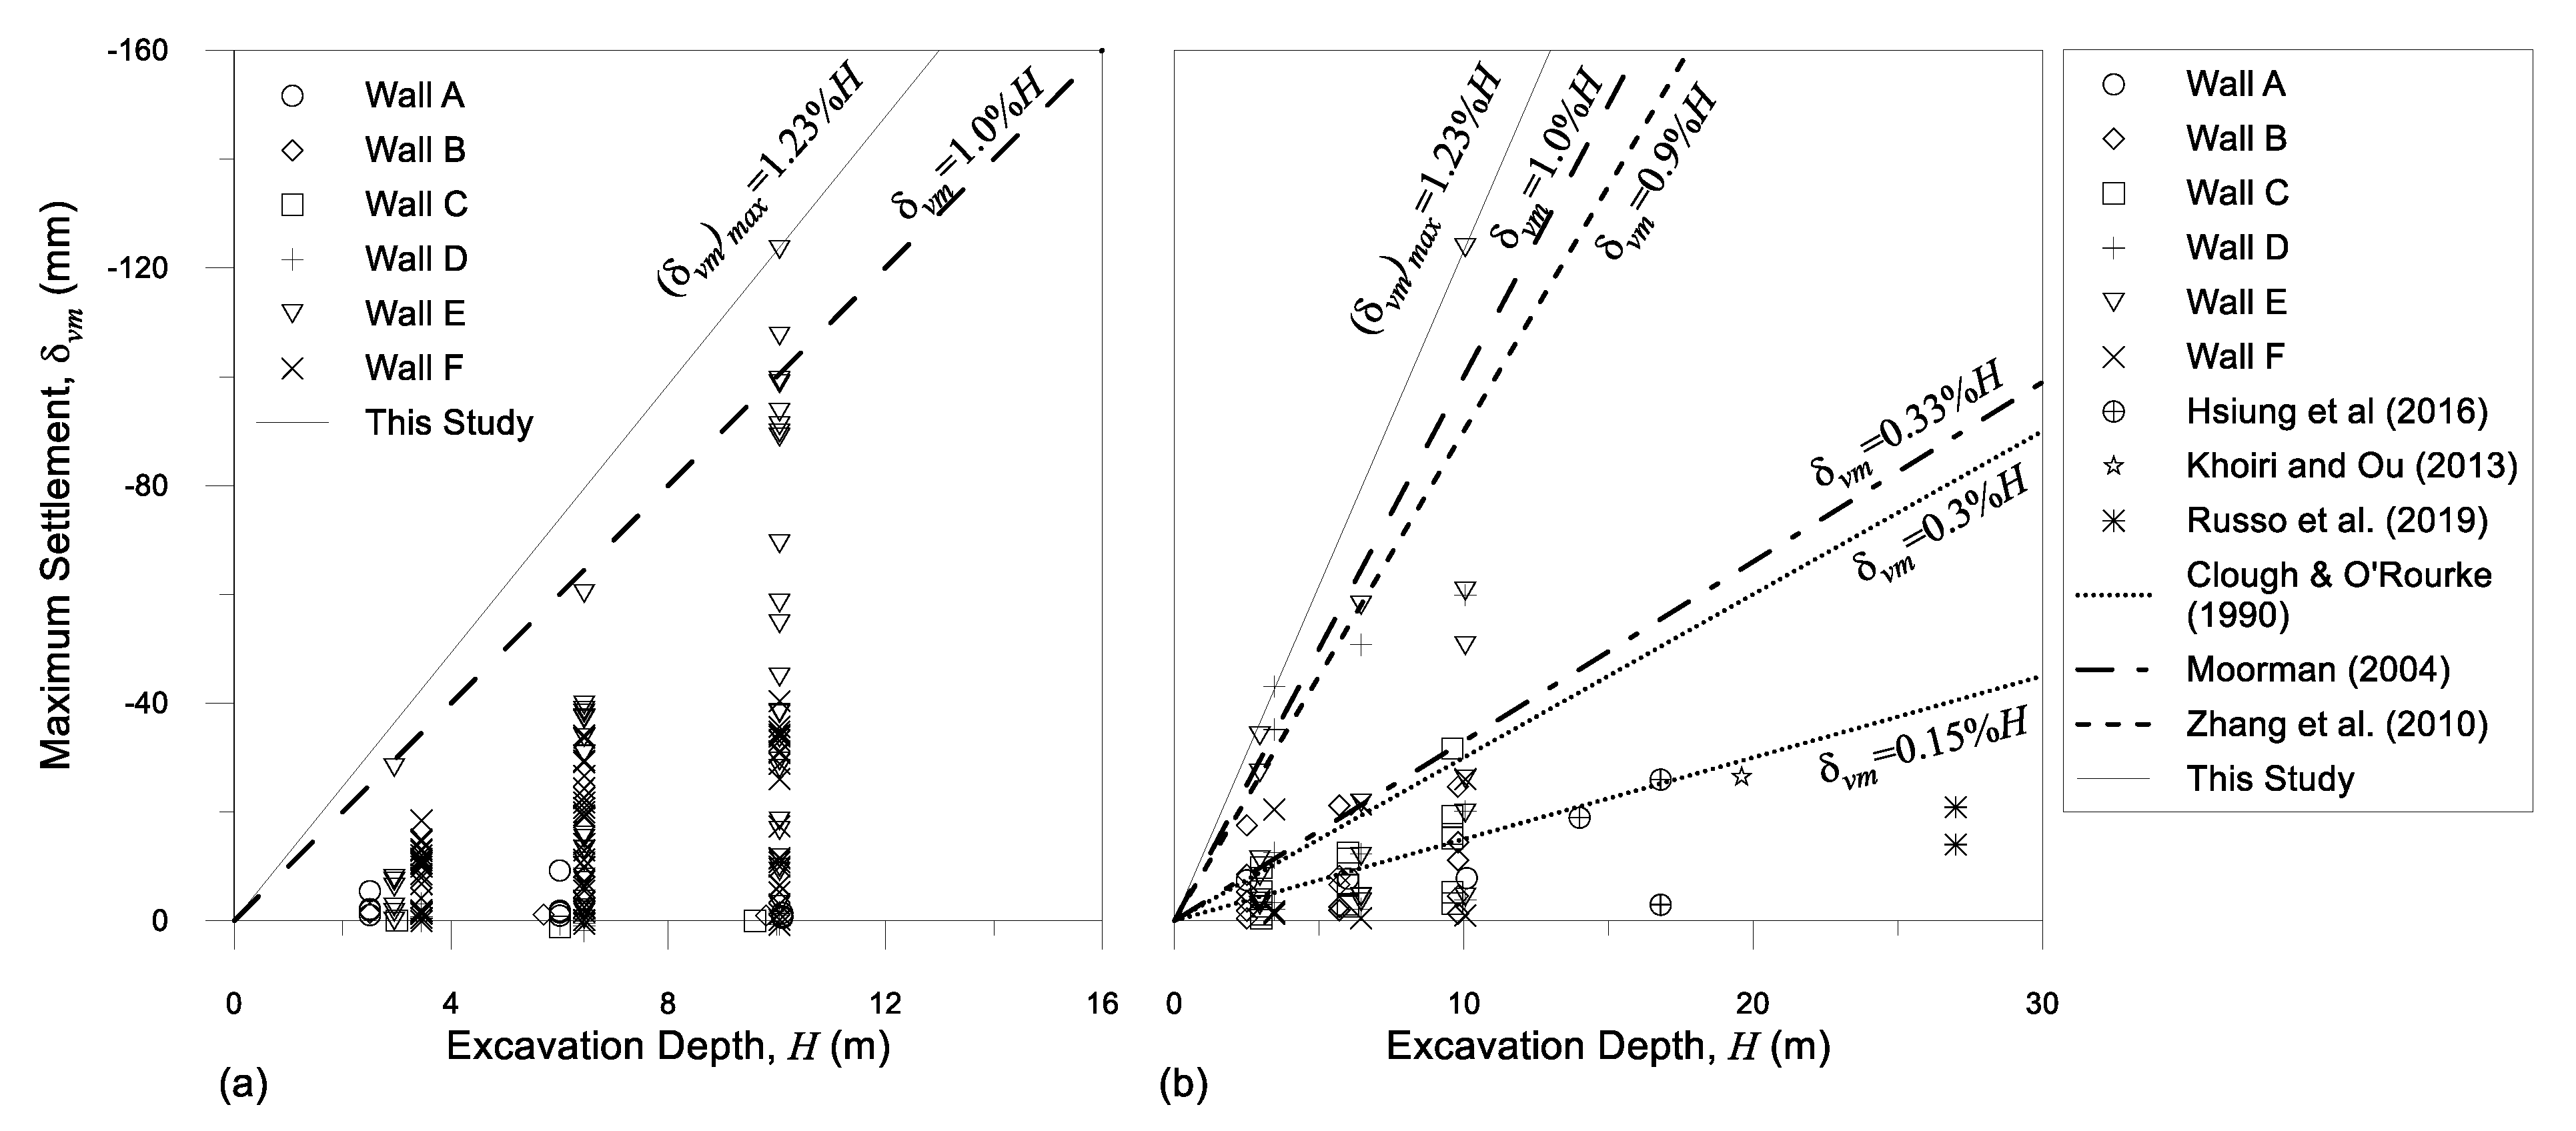
  • Relatively large settlements were observed along Walls E and F, owing to ground anchor works that had (a) caused the soil particle to be washed out during the drilling process; and (b) punctured the CBP walls with cement grout column causing continuous groundwater loss. The ground anchor installation and pre-stressing works contributed up to 47% and 37% of the total building and ground settlement, respectively. The δvm/H is 1.23% for both building and ground settlement, much larger than most case histories.
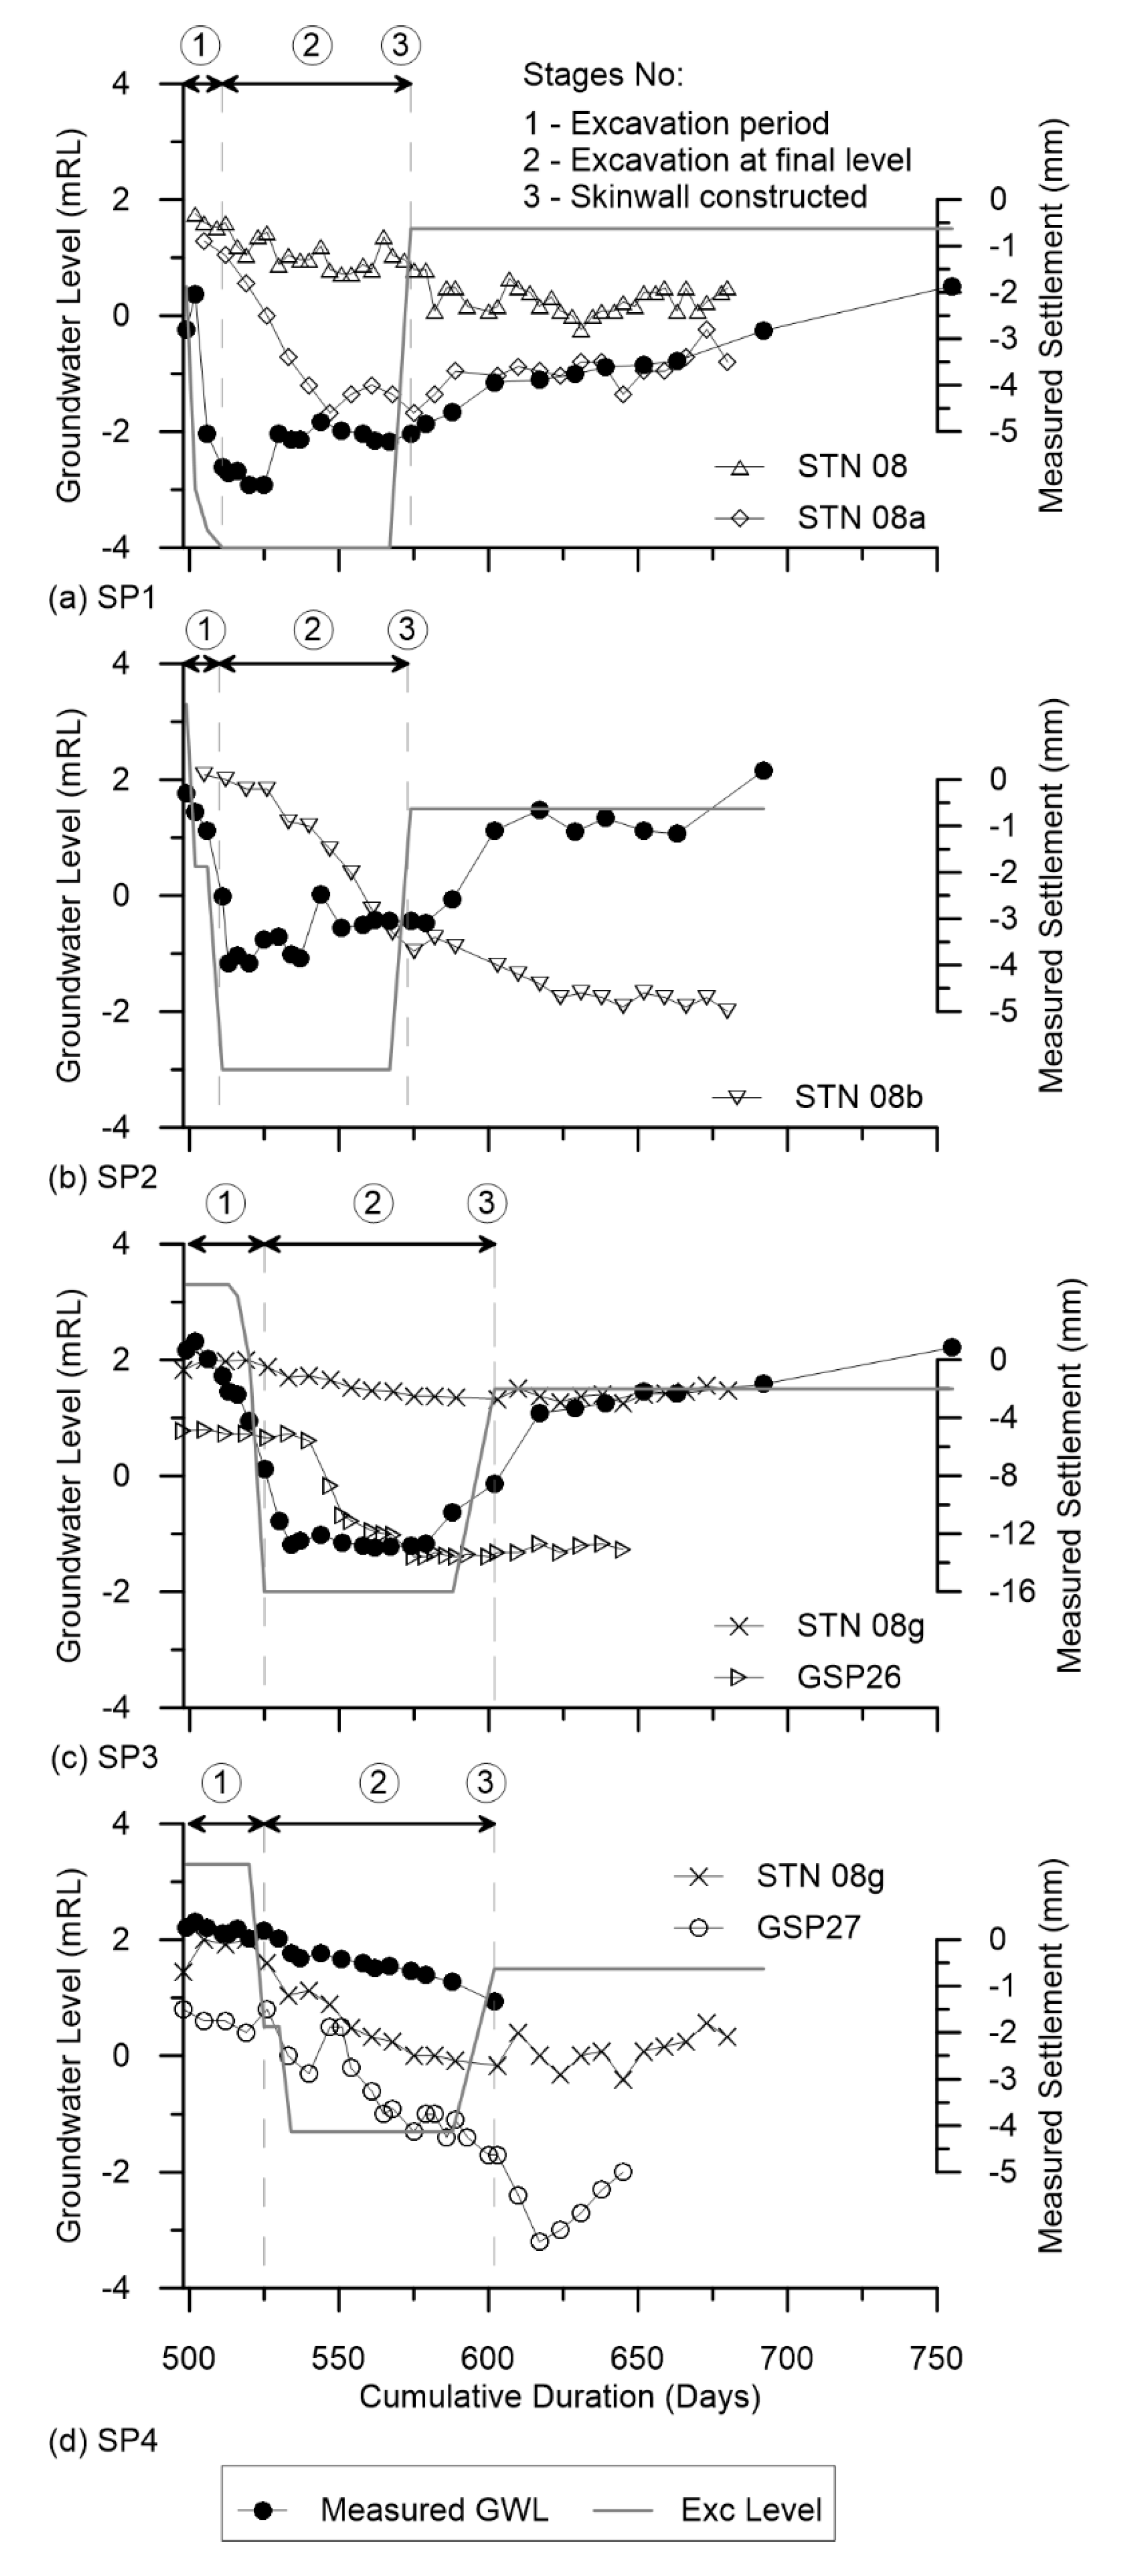
  • For the cut-and-cover tunnel where no CGC were available, the groundwater level was immediately drawn according to the excavation rate. Settlement rate slowed down upon the casting of skinwall. The construction of skinwall had effectively sealed off the site and prevented groundwater from leaking into the site, as evidenced at both the main basement and cut-and-cover tunnel.
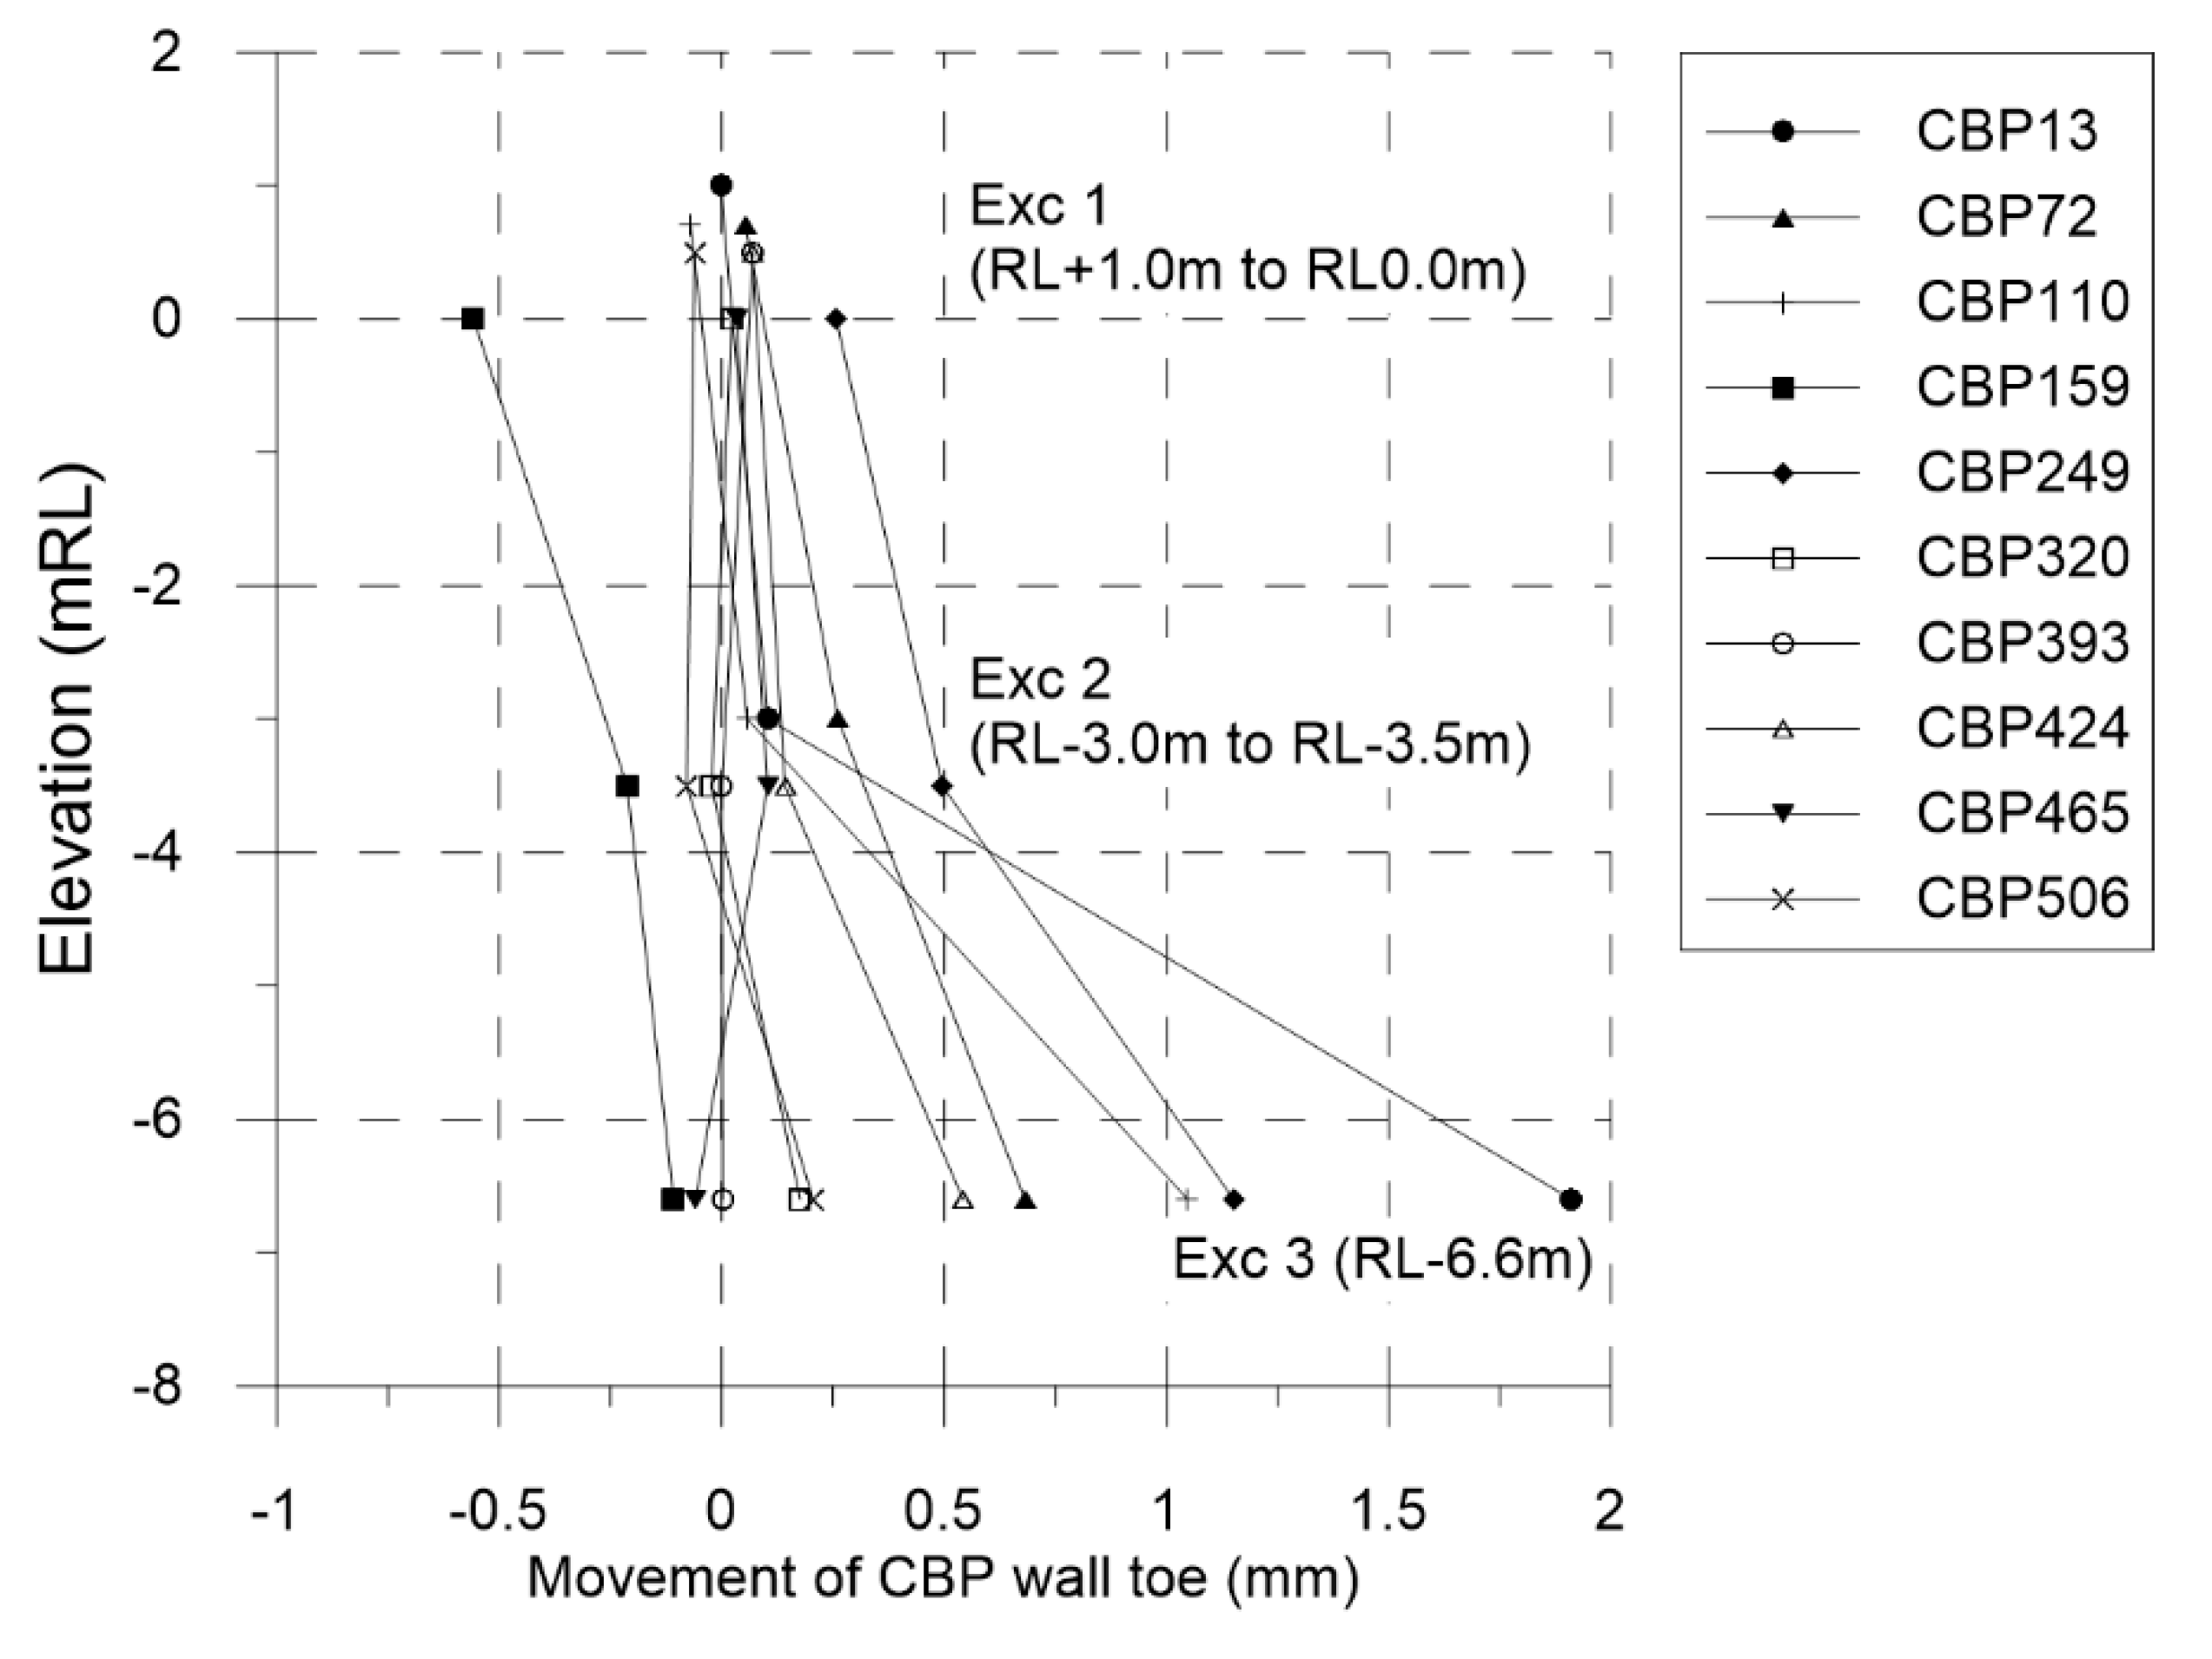
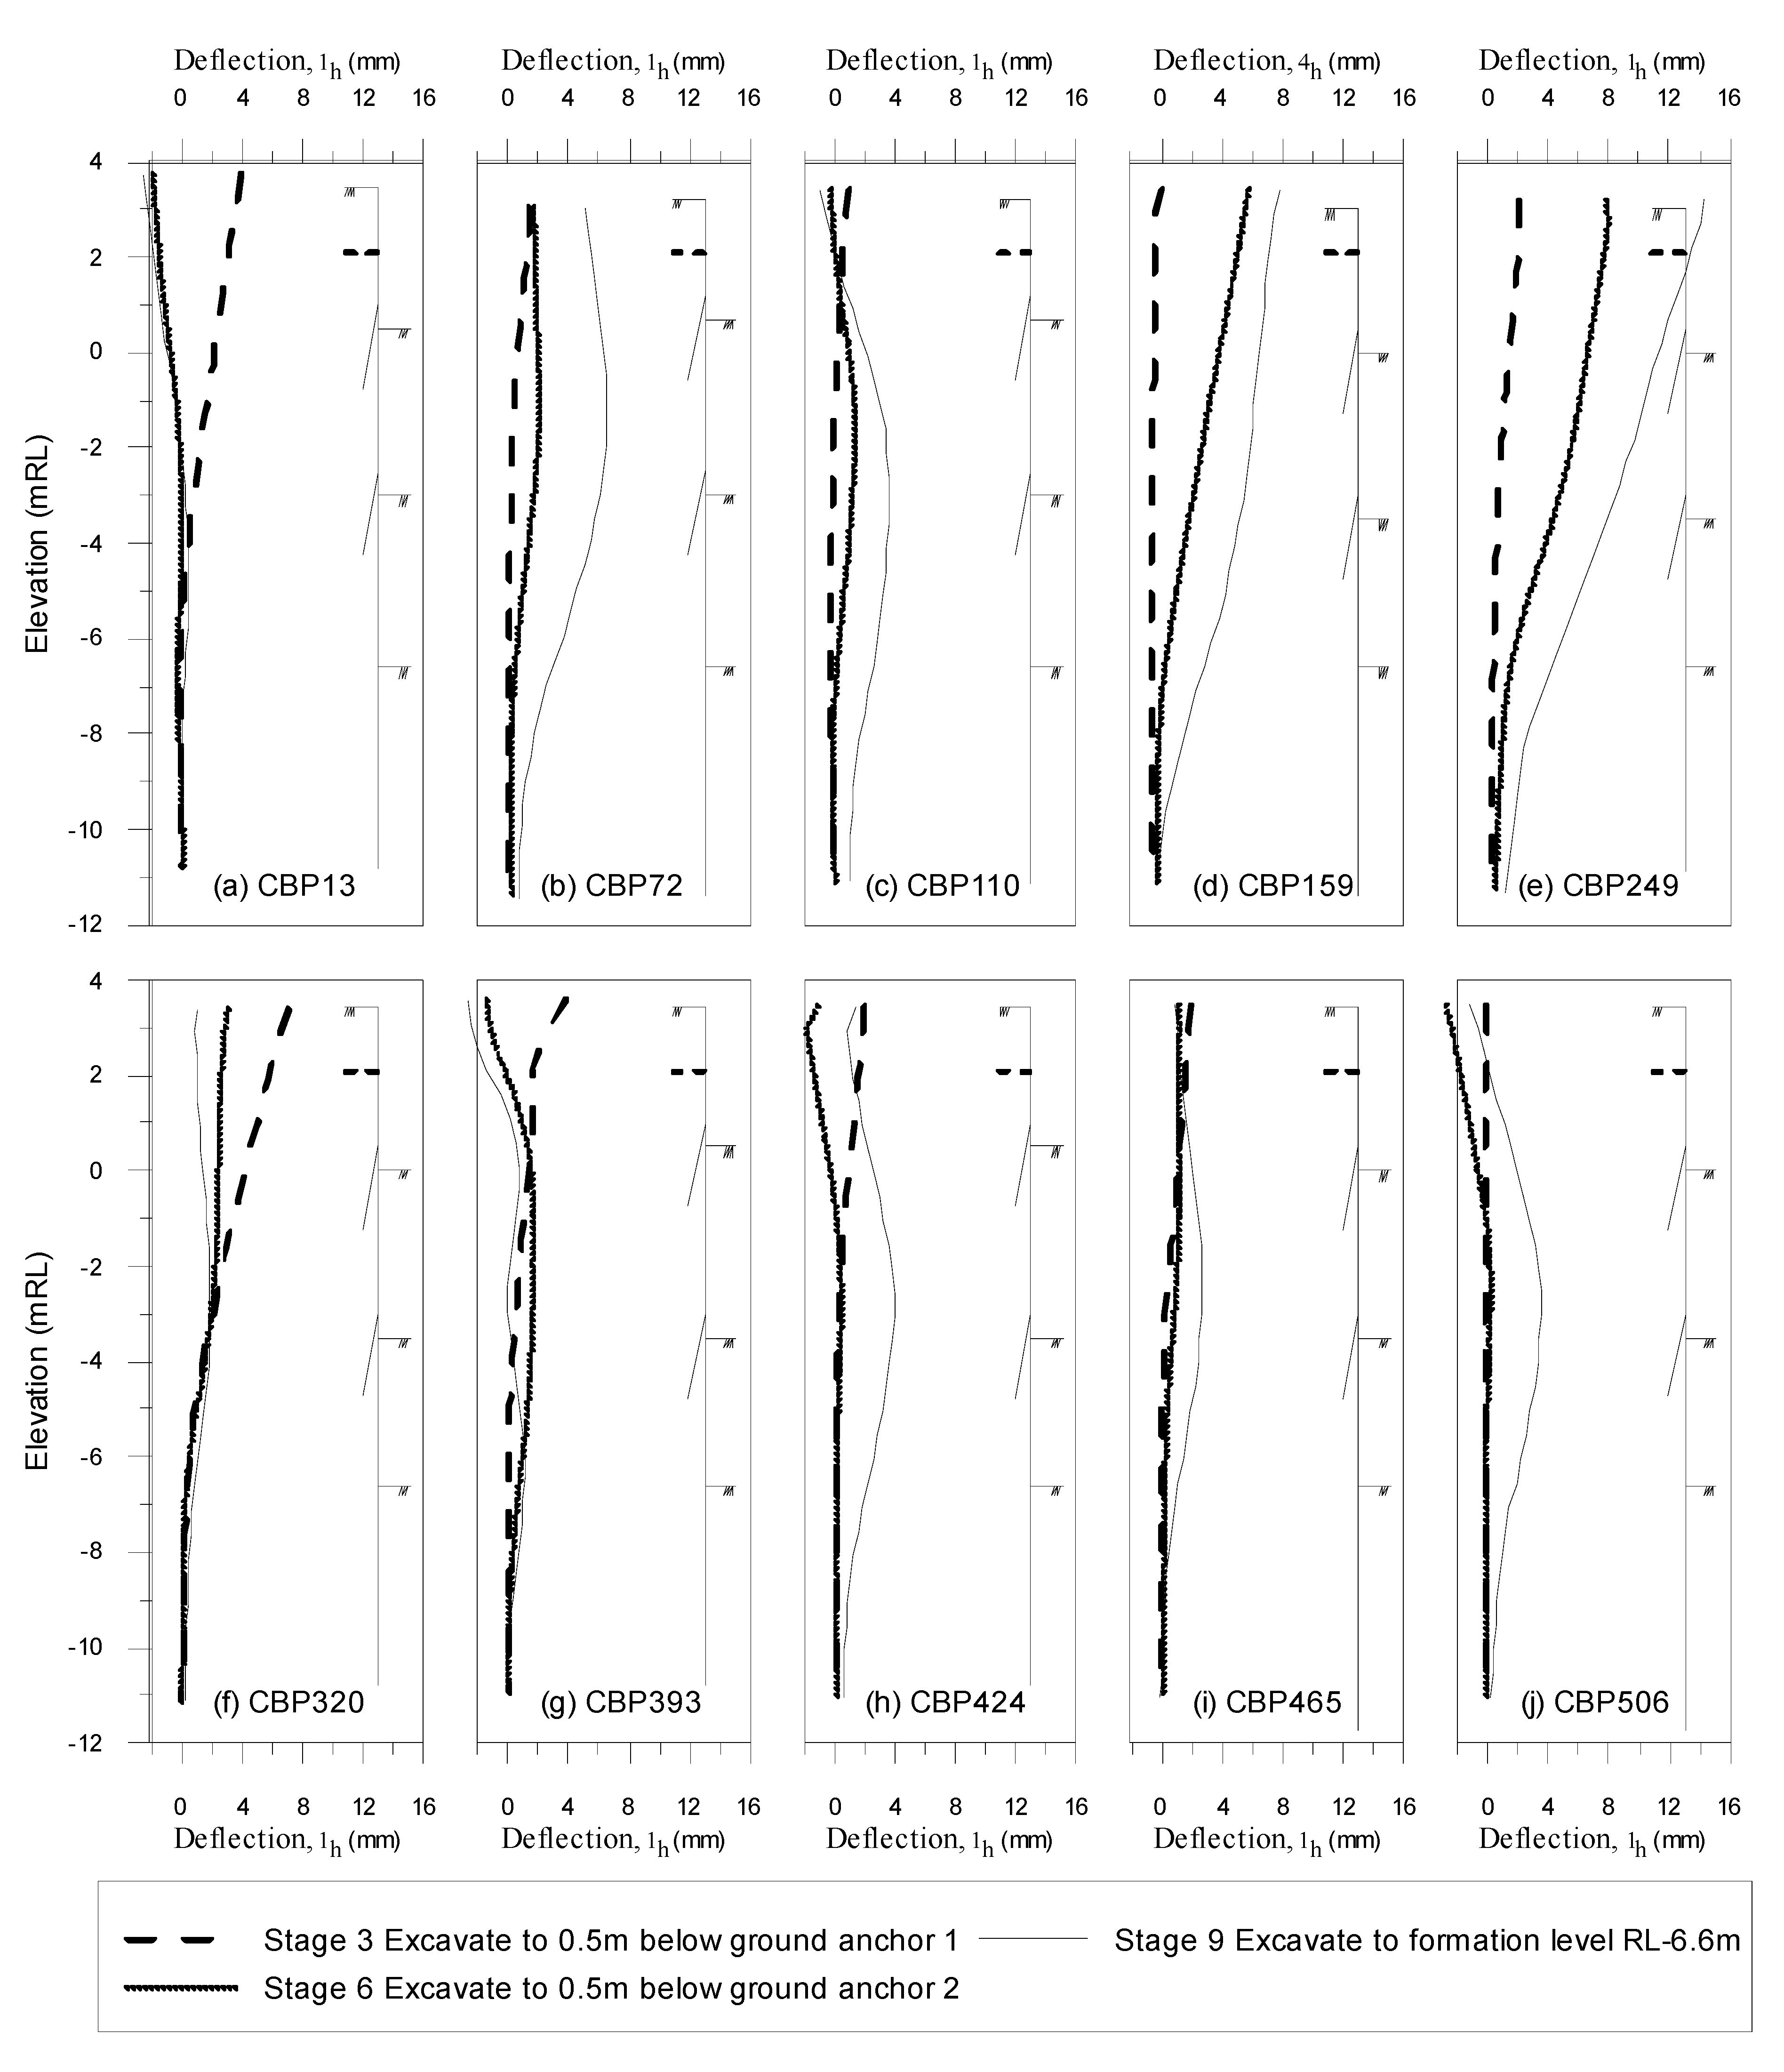
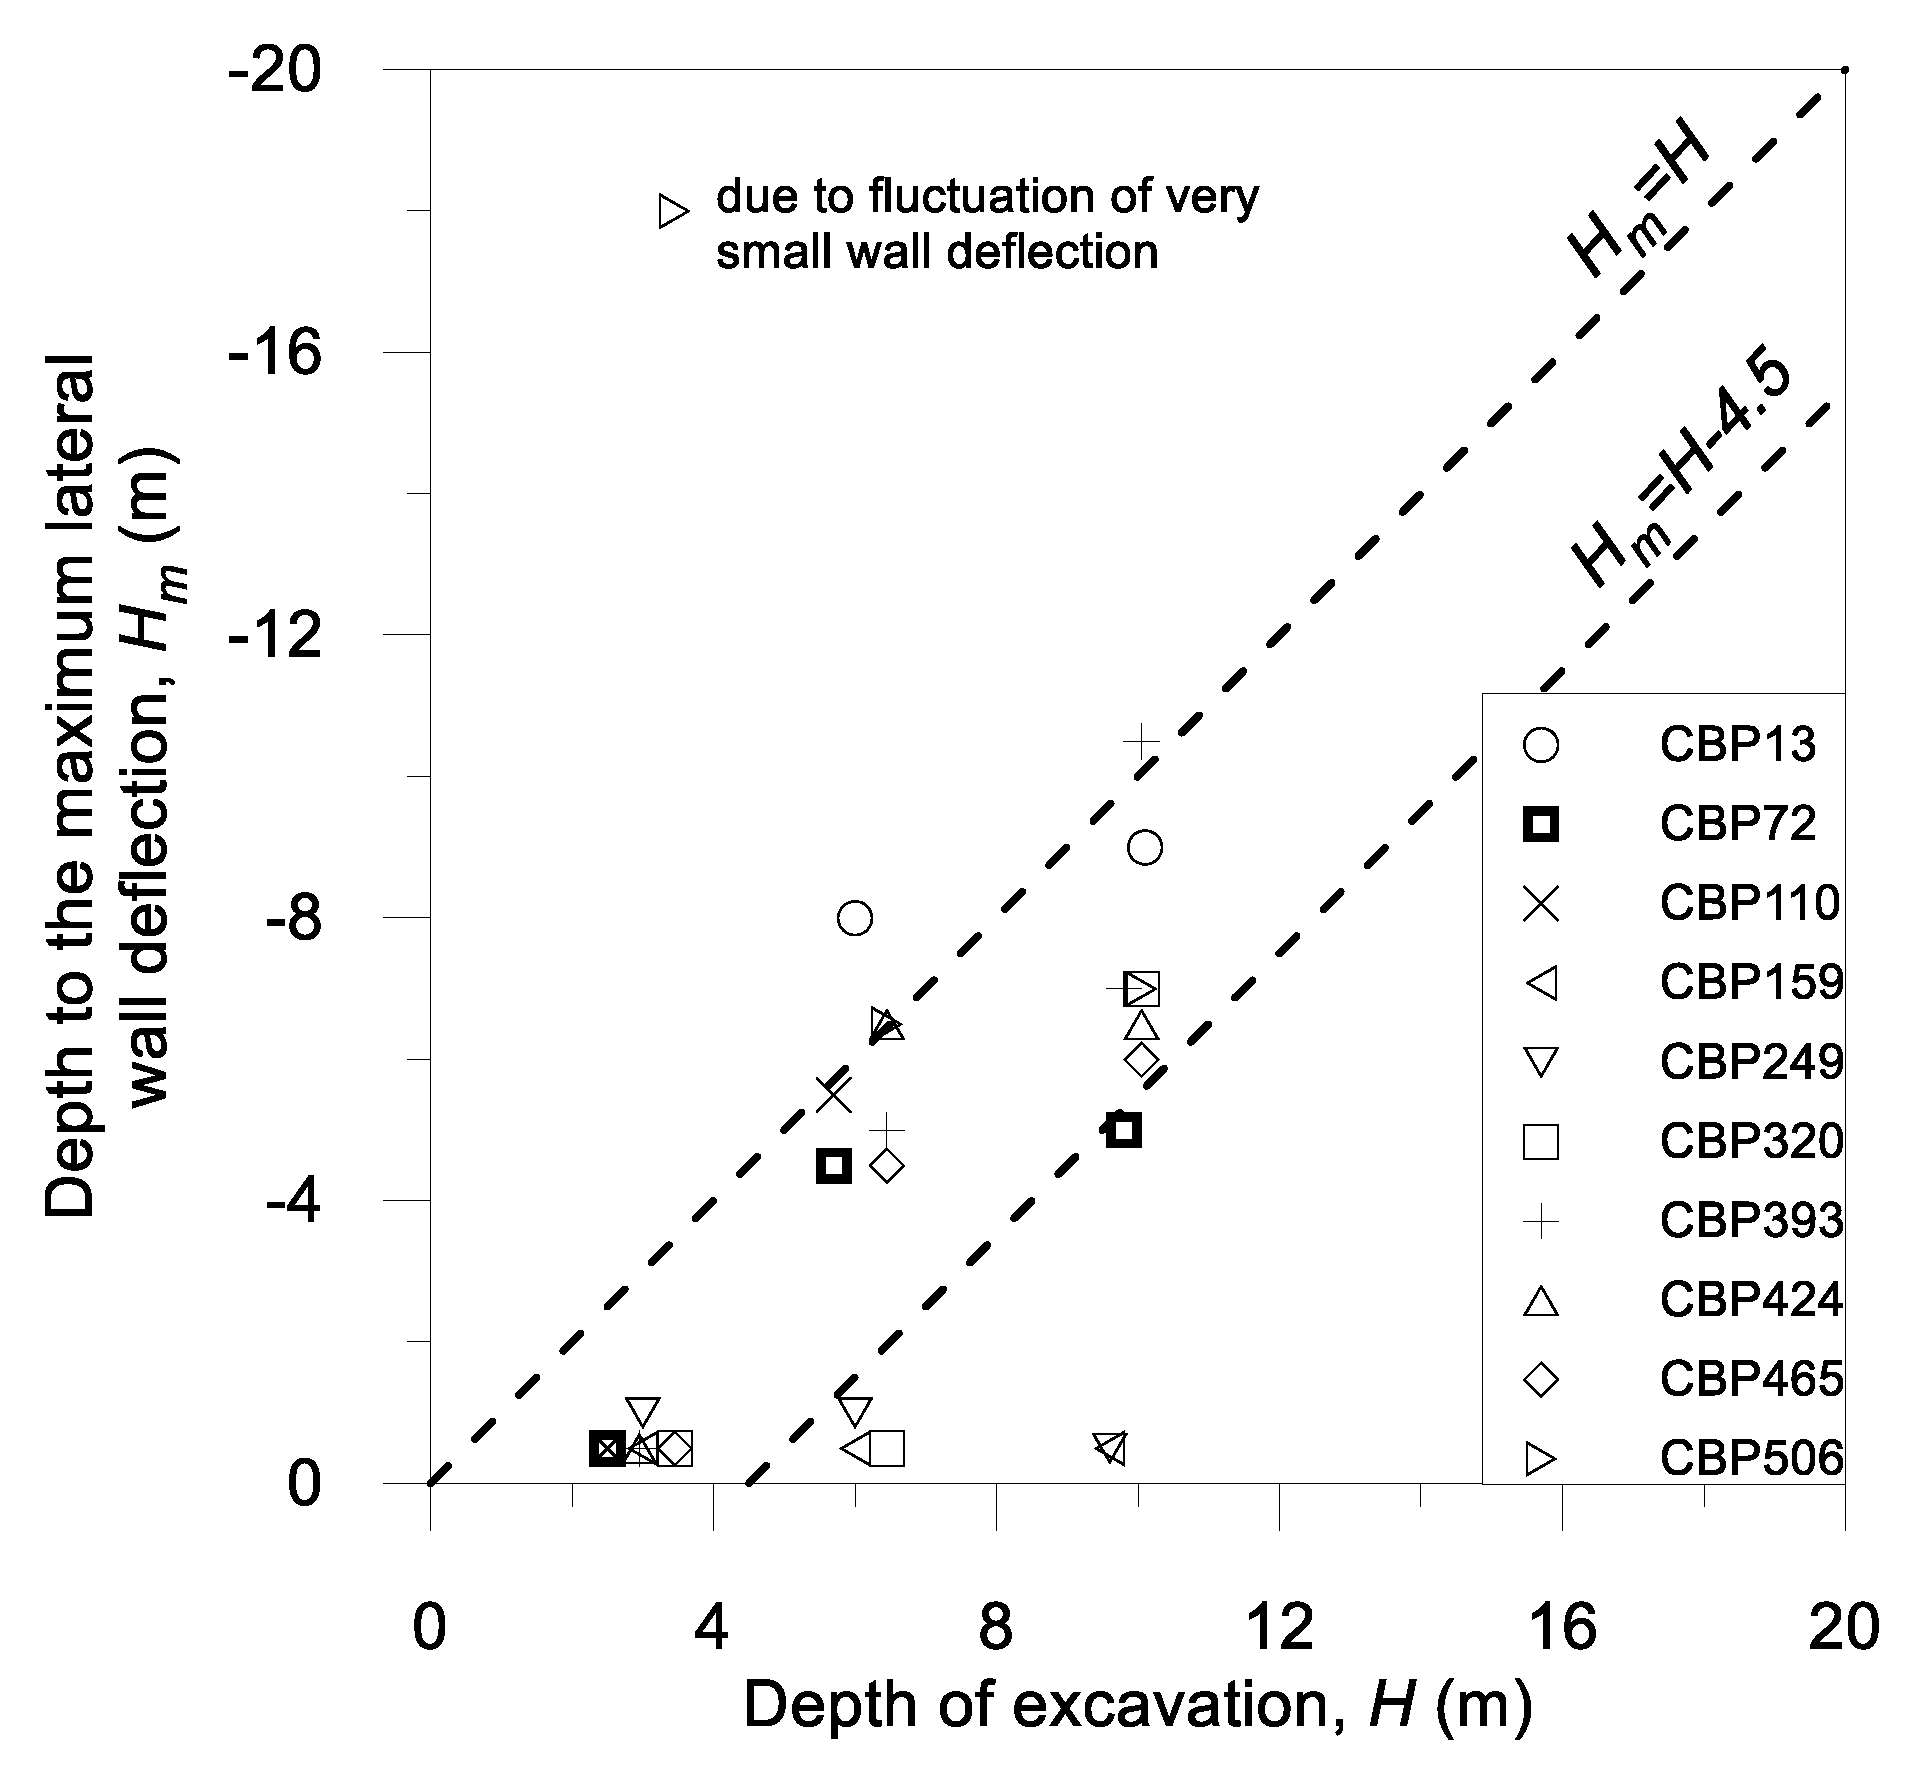
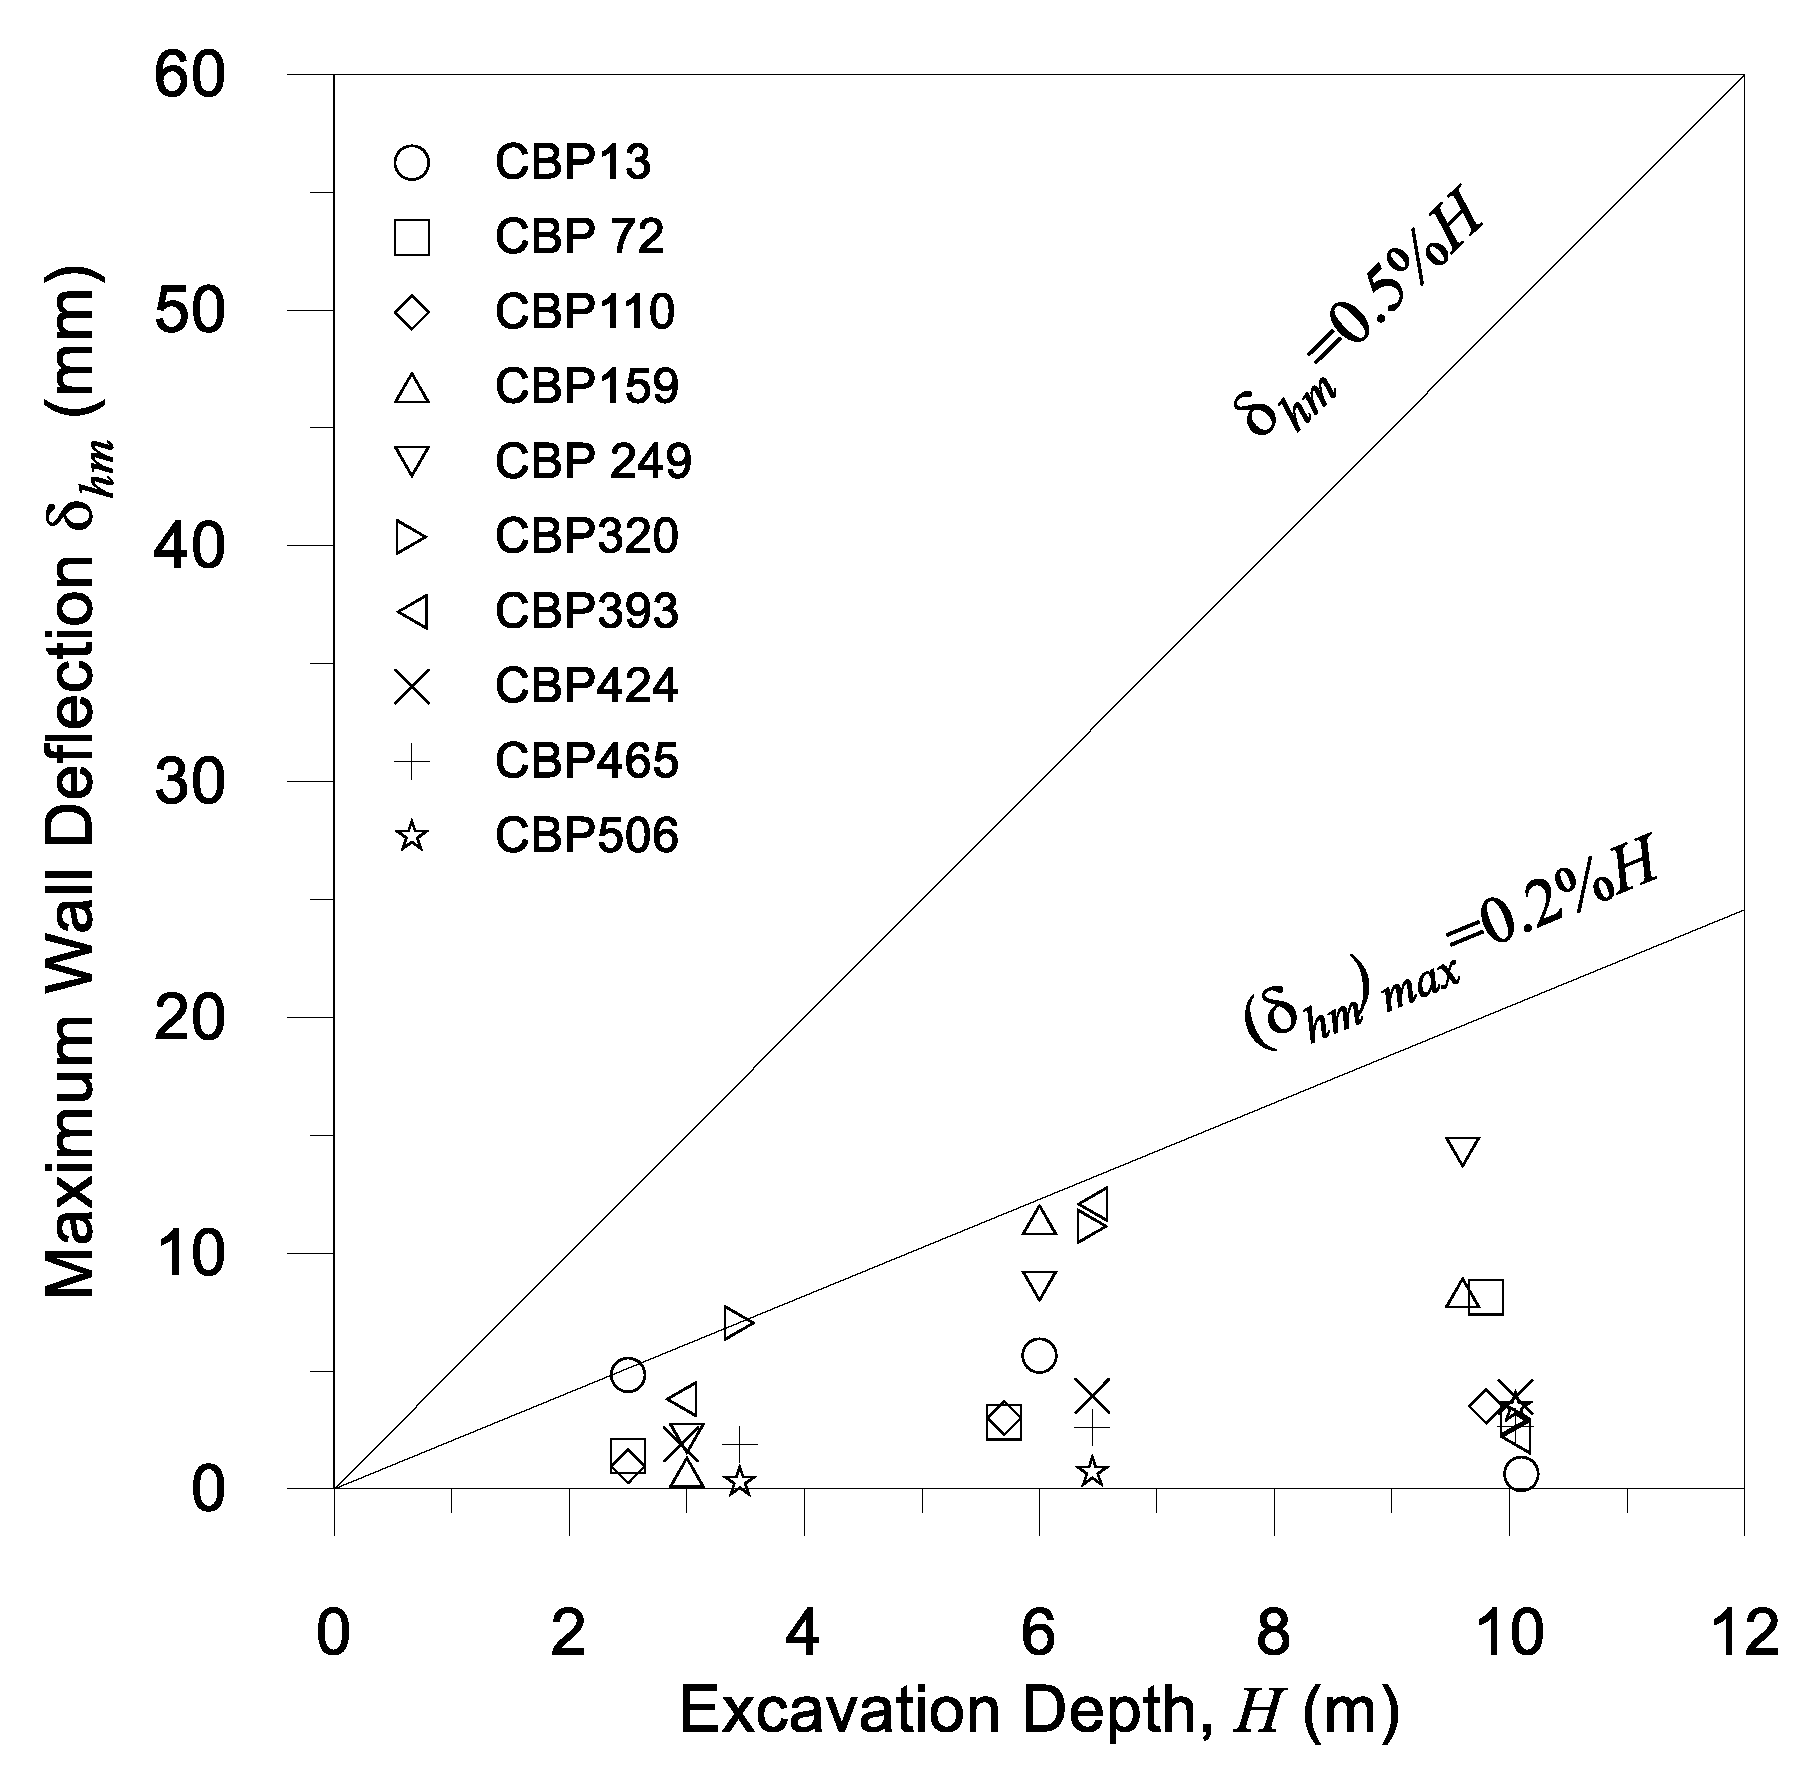
  • The toe movement is minimal, indicating that the wall is indeed properly socketed into phyllite. The initial deflection profile showed cantilever behavior and subsequently changed to prop mode after the installation of ground anchors, with the location of maximum deflection within Hm = H to Hm = H–4.5. The δhm for the final stage of excavation is 14.3 mm, while the δhm/H is less than 0.2%.
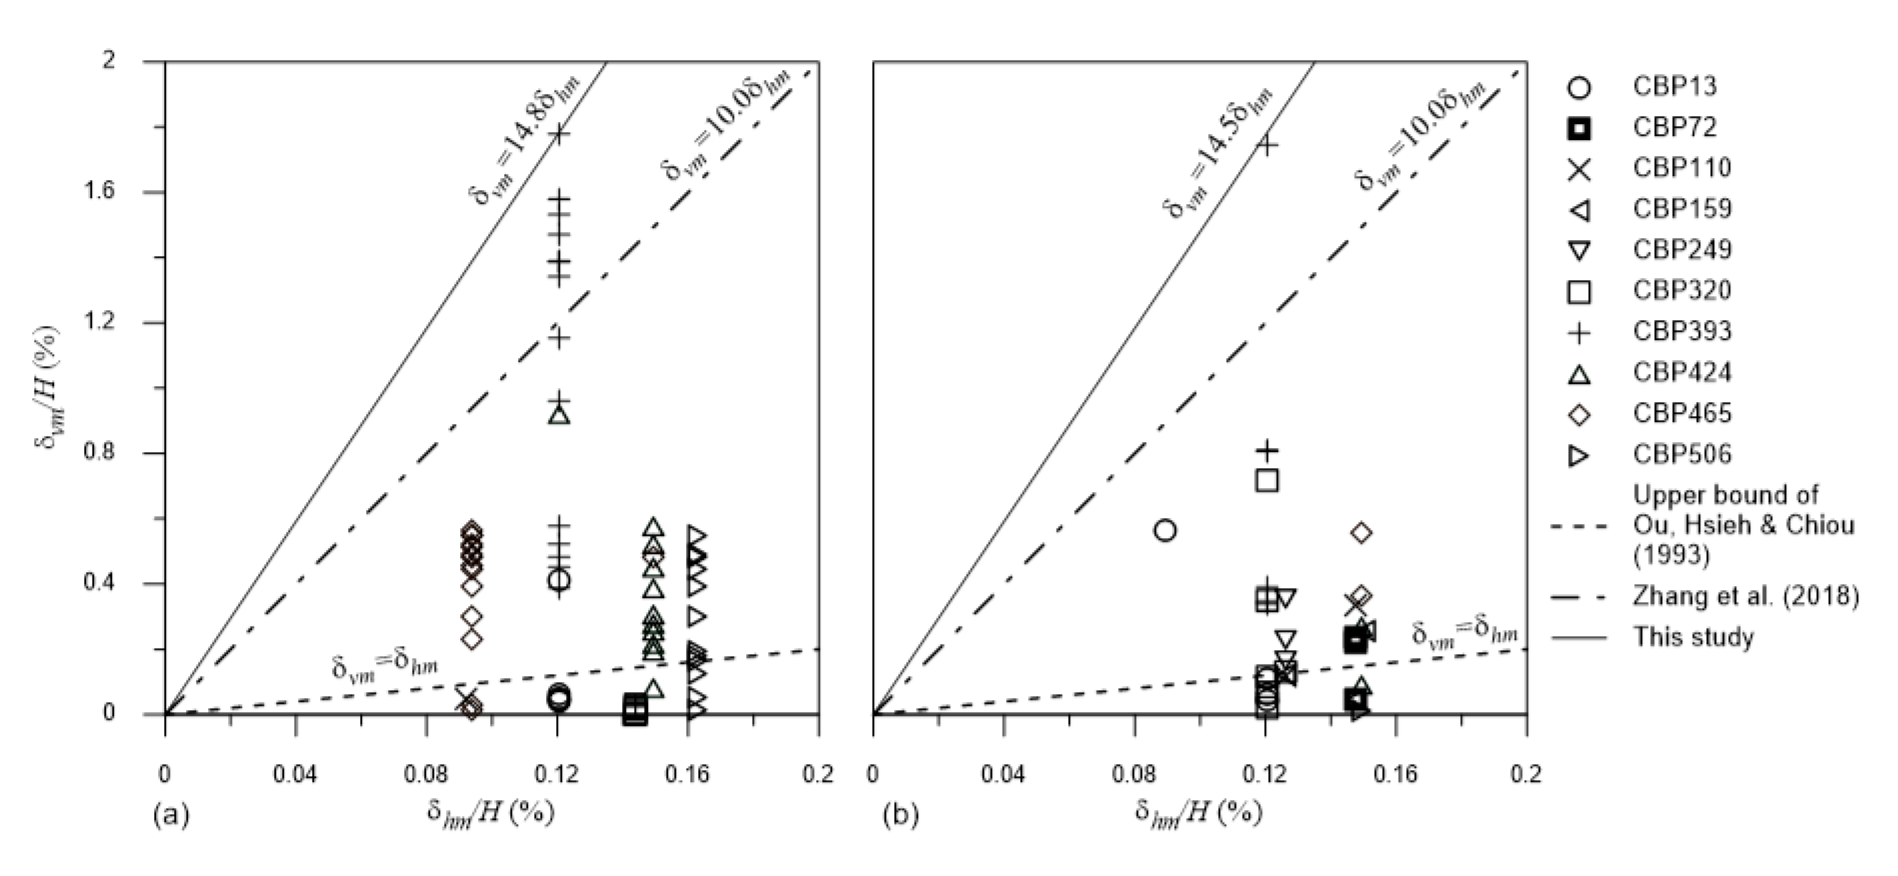
  • Due to the relatively large δvm and small δhm, the δvm/δhm ratio is 14.8 and 14.5 for building and ground, respectively, far greater than those reported in the literature. Again, this further supports the observation where the settlement had been caused by groundwater loss. The similar δvm/δhm ratios between building and ground pointed to the fact that the building and the ground were settling together, as the buildings had been built on ‘floating’ timber bakau piles.
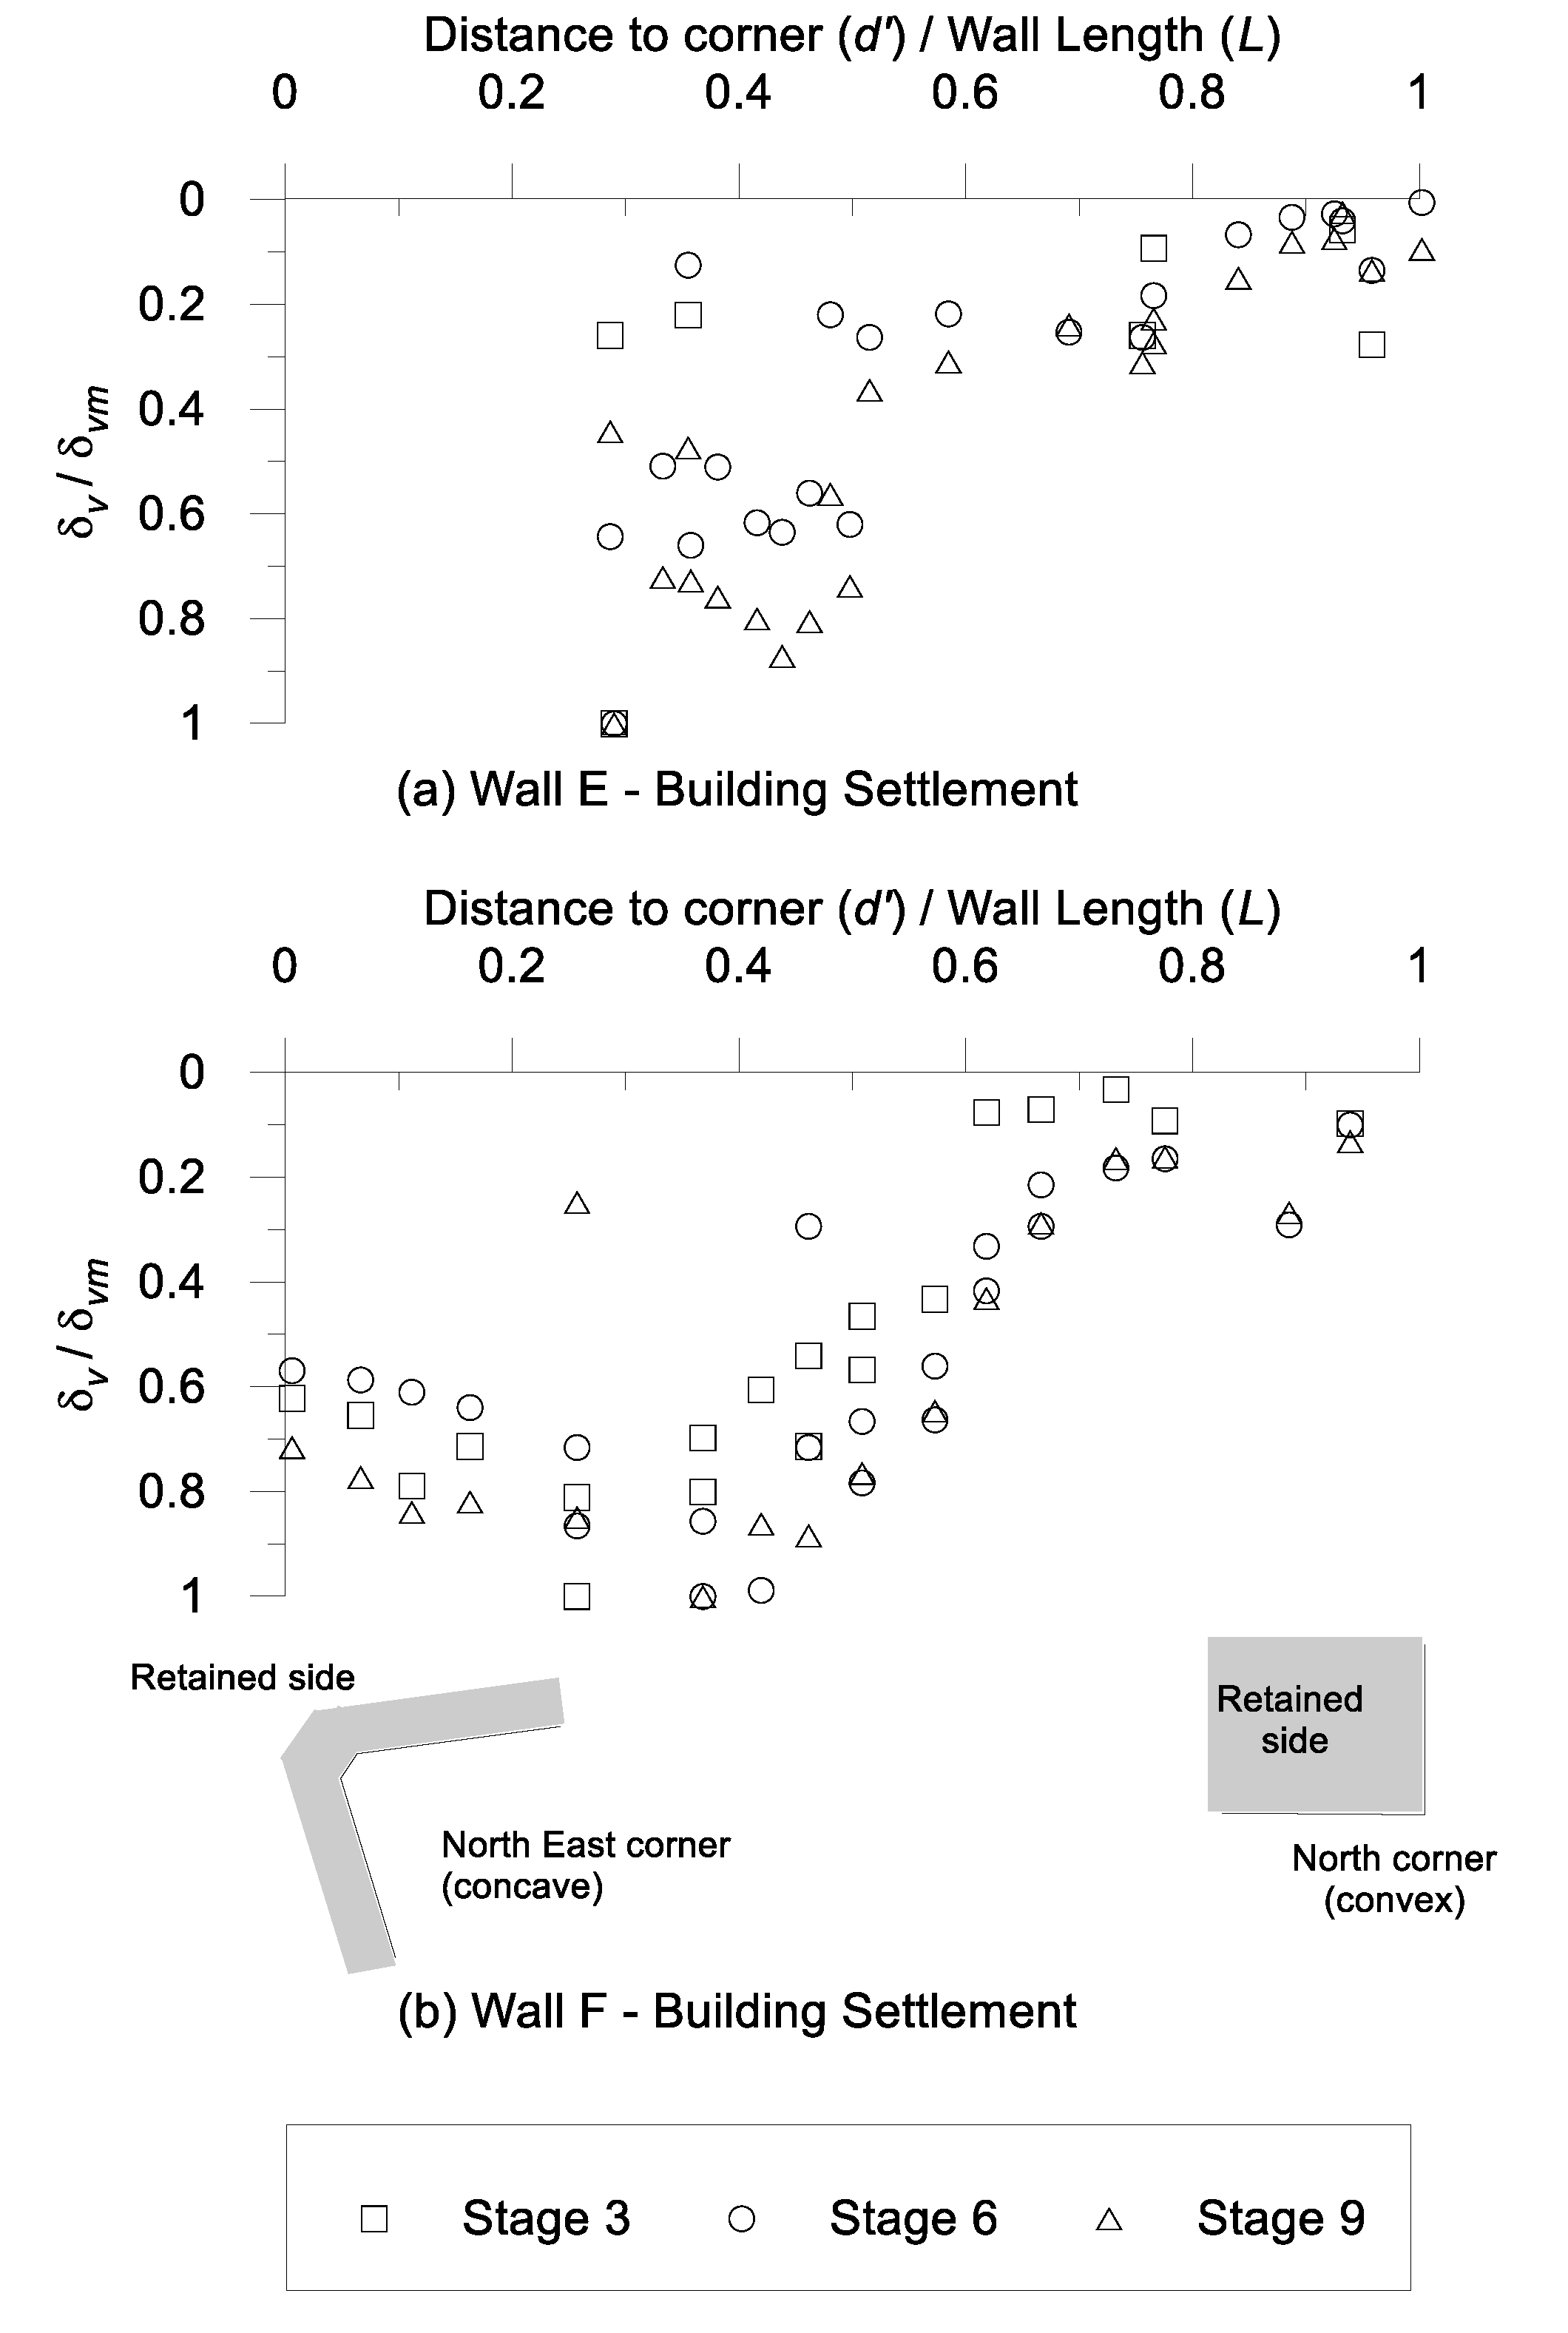
  • Corner effect is apparent for Walls E and F, although the larger d’/L occurred within 0 to 0.5. The imbalance in the plane-strain condition is most likely due to the irregular geometry of the excavation that consists of a concave and a convex corner.

Author Contributions

Conceptualization, E.E.-M.C. and D.E.-L.O.; formal analysis, E.E.-M.C.; investigation, E.E.-M.C.; data curation, E.E.-M.C.; writing—original draft preparation, E.E.-M.C.; writing—review and editing, D.E.-L.O.; supervision, D.E.-L.O.; funding acquisition, D.E.-L.O. All authors have read and agreed to the published version of the manuscript.

Funding

This research was funded by Rakyat Elite Sdn. Bhd.

Acknowledgments

The authors wish to express their gratitude to Bina Puri Construction Sdn. Bhd. and KTA (Sarawak) Sdn. Bhd. for their assistance in the collection of field data and other information.

Conflicts of Interest

The authors declare no conflict of interest. The funders had no role in the design of the study; in the collection, analyses, or interpretation of data; in the writing of the manuscript, or in the decision to publish the results.

References

  1. Blackburn, J.T.; Finno, R. Three-dimensional responses observed in an internally braced excavation in soft clay. J. Geotech. Geoenviron. Eng. 2007, 133, 1364–1373. [Google Scholar] [CrossRef] [Green Version]
  2. Burland, J.B.; Simpson, B.; St. John, H.D. Movements around excavations in London clay. In Proceedings of the 7th European Conference on Soil Mechanics and Foundation Engineering, Brighton, UK, 10–13 September 1979; Balkema: Rotterdam, The Netherlands, 1879; pp. 13–19. [Google Scholar]
  3. Clough, G.W.; O’Rourke, T.D. Construction Induced Movements of In-situ Walls. In Proceedings of the Design and Performance of Earth Retaining Structures, New York, NY, USA, 18–21 June 1990; pp. 439–470. [Google Scholar]
  4. Hashash, Y.M.A.; Whittle, A.J. Ground movement prediction for deep excavations in soft clay. J. Geotech. Eng. 1996, 122, 474–486. [Google Scholar] [CrossRef]
  5. Hsiung, B.-C.; Yang, K.-H.; Aila, W.; Ge, L. Three-dimensional effects of a deep excavation on wall defections in central Jakarta. Tunn. Undergr. Space Technol. 2018, 72, 84–96. [Google Scholar] [CrossRef]
  6. Ng, C.W.W.; Lings, M.L. Effects of Modeling Soil Nonlinearity and Wall Installation on Back-Analysis of Deep Excavation in Stiff Clay. J. Geotech. Eng. 1995, 121, 687–695. [Google Scholar] [CrossRef]
  7. Ng, C.W.W.; Yan, R.W.M. Three-dimensional modelling of a diaphragm wall construction sequence. Géotechnique 1999, 49, 825–834. [Google Scholar] [CrossRef]
  8. Ou, C.-Y.; Hsieh, P.-G.; Lin, Y.-L. A parametric study of wall deflections in deep excavations with the installation of cross walls. Comput. Geotech. 2013, 50, 55–65. [Google Scholar] [CrossRef]
  9. Tan, Y.; Wei, B. Observed Behaviours of a Long and Deep Excavation Constructed by Cut-and-Cover Technique in Shanghai Soft Clay. J. Geotec. Geoenviron. Eng. 2012, 138, 69–88. [Google Scholar] [CrossRef]
  10. Long, M. Database for Retaining Wall and Ground Movements Due to Deep Excavations. J. Geotech. Geoenviron. Eng. 2001, 127, 203–224. [Google Scholar] [CrossRef]
  11. Powrie, W.; Chandler, R.J.; Carder, D.R.; Watson, G.V.R. Back-analysis of an embedded retaining wall with a stabilizing base slab. Proc. Inst. Civ. Eng. Geotech. Eng. 1999, 137, 75–86. [Google Scholar] [CrossRef]
  12. Richards, D.J.; Wiggan, C.A.; Powrie, W. Seepage and pore pressures around contiguous pile retaining walls. Géotechnique 2016, 66, 523–532. [Google Scholar] [CrossRef] [Green Version]
  13. Croce, P.; Modoni, G. Design of jet-grouting cut-offs. Proc. ICE Ground Improv. 2007, 11, 11–19. [Google Scholar] [CrossRef]
  14. Pan, Y.; Liu, Y.; Chen, E.J. Probabilistic investigation on defective jet-grouted cut-off wall with random geometric imperfections. Géotechnique 2019, 69, 420–433. [Google Scholar] [CrossRef]
  15. Goh, K.H.; Mair, R.J. The horizontal response of framed buildings on individual footings to excavation-induced movements. Geotech. Asp. Undergr. Constr. Soft Ground Viggiani 2012, 895–902. [Google Scholar] [CrossRef]
  16. Ong, D.E.L.; Choo, C.S. Sustainable construction of a bored pile foundation system in erratic phyllite. In Proceedings of the ASEAN Australian Engineering Congress, Kuching, Sarawak, Malaysia, 25–27 July 2011. [Google Scholar]
  17. Hsieh, P.-G.; Ou, C.-Y.; Lin, Y.-K.; Lu, F.-C. Lessons Learned in Design of an Excavation with the Installation of Buttress Walls. J. Geoengin. 2015, 10, 63–73. [Google Scholar] [CrossRef]
  18. Puller, M. Deep Excavations: A Practical Manual; Thomas Telford Publishing: London, UK, 1996. [Google Scholar]
  19. Skempton, A.W.; MacDonald, D.H. The allowable settlements of buildings. Proc. Inst. Civ. Eng. 1956, 5, 727–768. [Google Scholar] [CrossRef]
  20. Gaba, A.R.; Simpson, B.; Powrie, W.; Beadman, D.R. Embedded Retaining Walls—Guidance for Economic Design; Ciria: London, UK, 2003; Volume 156. [Google Scholar]
  21. Kempfert, H.G.; Gebreselassie, B. Effect of anchor installation on settlement of nearby structures in soft soils. In Proceedings of the International Symposium on Geotechnical Aspects of Underground Construction in Soft Ground, Tokyo, Japan, 19–20 July 1999; pp. 665–670. [Google Scholar]
  22. Moormann, C. Analysis of wall and ground movements due to deep excavations in soft soil based on a new worldwide database. Soils Found. 2004, 44, 87–98. [Google Scholar] [CrossRef] [Green Version]
  23. Hsiung, B.-C.B.; Yang, K.-H.; Aila, W.; Hung, C. Three-dimensional effects of a deep excavation on wall deflections in loose to medium dense sands. Comput. Geotech. 2016, 80, 138–151. [Google Scholar] [CrossRef]
  24. Khoiri, M.; Ou, C.-Y. Evaluation of deformation parameter for deep excavation in sand through case histories. Comput. Geotech. 2013, 47, 57–67. [Google Scholar] [CrossRef]
  25. Russo, G.; Nicotera, M.V.; Autuori, S. Three-Dimensional Performance of a Deep Excavation in Sand. J. Geotech. Geoenviron. Eng. 2019, 145, 05019001. [Google Scholar] [CrossRef]
  26. Zhang, W.G.; Goh, A.T.C.; Goh, K.H.; Chew, O.Y.S.; Zhou, D.; Zhang, R. Performance of braced excavation in residual soil with groundwater drawdown. Undergr. Space 2018, 3, 150–165. [Google Scholar] [CrossRef]
  27. Hwang, R.; Moh, Z.-C.; Wang, C.H. Toe movements of diaphragm walls and correction of inclinometer readings. J. Geoengin. 2007, 2, 61–71. [Google Scholar] [CrossRef]
  28. Wong, I.H.; Poh, T.Y.; Chuah, H.L. Performance of Excavations for Depressed Expressway in Singapore. J. Geotech. Geoenviron. Eng. 1997, 123, 617–625. [Google Scholar] [CrossRef]
  29. Ou, C.-Y.; Hsieh, P.-G.; Chiou, D.-C. Characteristics of ground surface settlement during excavation. Can. Geotech. J. 1993, 30, 758–767. [Google Scholar] [CrossRef]
  30. Wang, Z.W.; Ng, C.W.W.; Liu, G.B. Characteristics of wall deflections and ground surface settlements in Shanghai. Can. Geotech. J. 2005, 42, 1243–1254. [Google Scholar] [CrossRef]
  31. Hsiung, B.-C.B. A case study on the behaviour of a deep excavation in sand. Comput. Geotech. 2009, 36, 665–675. [Google Scholar] [CrossRef]
  32. Ou, C.-Y.; Lai, C.-H. Finite-element analysis of deep excavation in layered sandy and clayey soil deposits. Can. Geotech. J. 1994, 31, 204–214. [Google Scholar] [CrossRef] [Green Version]
Figure 1. Site layout plan of the main basement and cut-and-cover tunnel with geotechnical instrumentation.
Geosciences 10 00268 g001
Figure 2. Timber bakau piles used as support system for the demolished buildings.
Geosciences 10 00268 g002
Figure 3. Cross section of contiguous bored pile (CBP) wall details and soil profiles for different wall sections.
Geosciences 10 00268 g003
Figure 4. Soil properties obtained from borehole logs: (a) standard penetration test (SPT) ‘N’; (b) particle content; (c) water content; (d) plastic limit and liquid limit.
Geosciences 10 00268 g004
Figure 5. Overall building and ground settlement profiles for (a) CBP13 and (b) CBP320.
Geosciences 10 00268 g005
Figure 6. Specific building and ground settlement profiles throughout the main excavation works at (a) CBP393; (b) CBP424; (c) CBP465; and (d) CBP506.
Geosciences 10 00268 g006
Figure 7. (a) Groundwater leakage from where ground anchors were installed; (b) drilling of ground anchor in between bored piles; and (c) close-up of the water leakage from the ground anchor.
Geosciences 10 00268 g007
Figure 8. Potential water flow which may lead to ground settlement [3].
Geosciences 10 00268 g008
Figure 9. Relationship between maximum settlement and excavation depth for all the excavation stages for (a) building; and (b) ground.
Geosciences 10 00268 g009
Figure 10. Measured groundwater and settlement profiles for (a) SP1; (b) SP2; (c) SP3; and (d) SP4.
Geosciences 10 00268 g010
Figure 11. Progressive wall toe movements at all excavation depths.
Geosciences 10 00268 g011
Figure 12. Horizontal wall deflections for excavation Stages 3, 6, and 9.
Geosciences 10 00268 g012
Figure 13. Relationship between location of maximum horizontal wall deflection and excavation depth.
Geosciences 10 00268 g013
Figure 14. Relationship between maximum wall deflection and excavation depth for all the excavation stages.
Geosciences 10 00268 g014
Figure 15. Relationship of maximum (a) building settlement and maximum wall deflection; and (b) ground settlement and maximum wall deflection.
Geosciences 10 00268 g015
Figure 16. Normalized relationship of maximum settlement and distance to corner for (a) building settlement for Wall E; and (b) building settlement for Wall F.
Geosciences 10 00268 g016
Table 1. Construction sequence for main basement.
StageConstruction Activity
1Installation of CBP Wall
2Casting of Pile Capping Beam
3Excavate to 0.5 m below GA-1 (B1) (RL0.0m to RL + 1.0 m)
4Installation of the first level of ground anchor (GA-1) (RL + 0.5 m to RL + 1.5 m)
5Stressing of the first level of ground anchor (GA-1)
6Excavate to 0.5 m below GA-2 (B2) (RL − 3.0 m to RL − 3.5 m)
7Installation of the second level of ground anchor (GA-2) (RL − 2.5 m to RL − 3.0 m)
8Stressing of the second level of ground anchor (GA-2)
9Excavate to the formation level (B3) (RL − 6.6 m)
Table 2. Construction sequence for cut-and-cover tunnel.
StageConstruction Activity
1Installation of CBP Wall
2Excavation 1 to RL + 0.5 m
3Excavation 2 to RL − 3.0 m
4Installation of temporary struts
5Excavation 3 to RL − 3.7 m
6Excavation 4 to RL − 4.3 m
7Construction of skinwall
Table 3. Summary of building and ground settlement during CBP wall installation and main excavation works.
ActivityCBP Wall Section
1372110159249320393424465506
CBP wall installationBuilding settlement during the activity (mm)−0.1NILNILNILNIL1.4−11.0−5.9−14.0−4.4
% of total settlement1NILNILNILNIL−44611258
Ground settlement during the activity (mm)−0.3−6.4−7.4−3.7−4.3−17.6−4.3−9.6−13.2NIL
% of total settlement1272215202421224NIL
Main excavation worksBuilding settlement during the activity (mm)−6.7NIL0NILNIL4.2−98.3−32.8−20.2−18.7
% of total settlement16NIL0NILNIL−13155623634
Ground settlement during the activity (mm)−7.1−3.1−8.4−10.5−16.9−17.2−93.3−49.3−17.9NIL
% of total settlement121326437724536132NIL
Table 4. Summary of the total building and ground settlement percentage during ground anchor works and excavation works.
ActivityStagesSettlement CategoryPercentage of Total Settlement during the Duration (%)
CBP393CBP424CBP465CBP506
Ground anchor works4&5Building7–150–371–70–8
Ground0–520No data
7&8Building9–3312–471–182–19
Ground0–3410–3711No data
Excavation works3Building1–301–60–4
Ground0–401–15No data
6Building2–182–72–804–53
Ground0–11714No data
9Building1–81–31–180–4
Ground0–848No data

