Ground Response and Historical Buildings in Avellino (Campania, Southern Italy): Clues from a Retrospective View Concerning the 1980 Irpinia-Basilicata Earthquake


Abstract
:1. Introduction
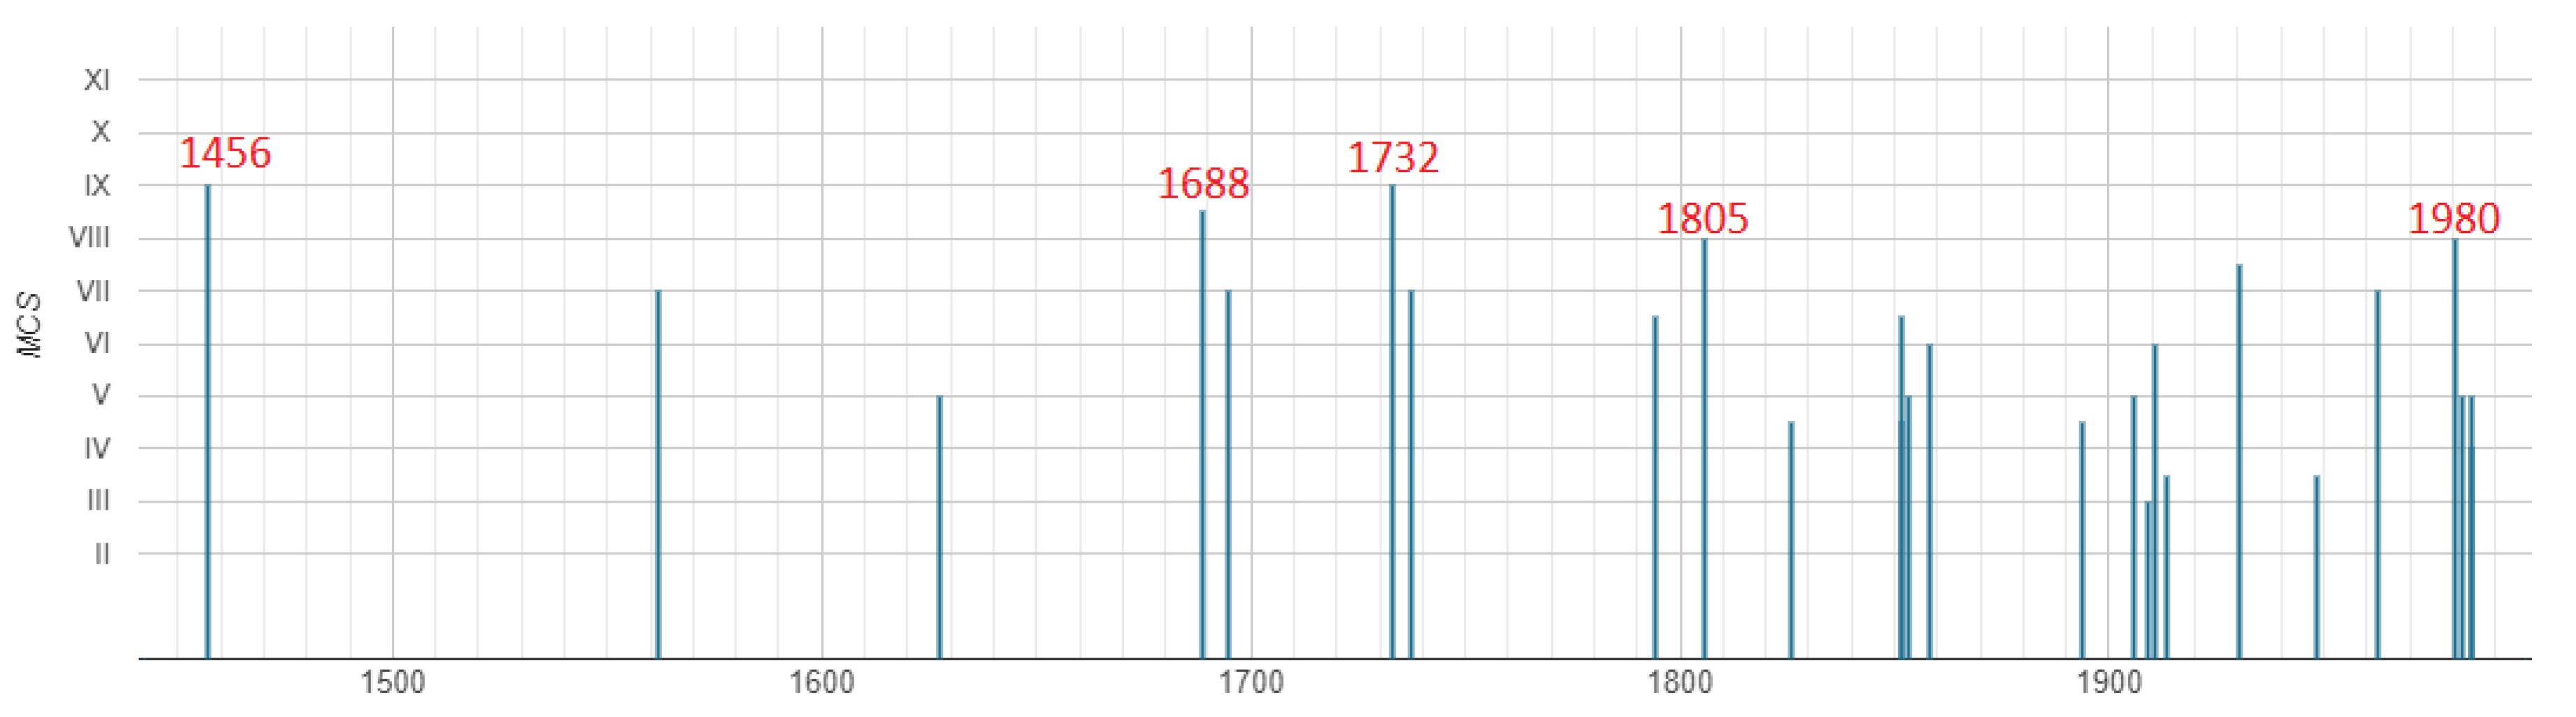
2. Previous Studies
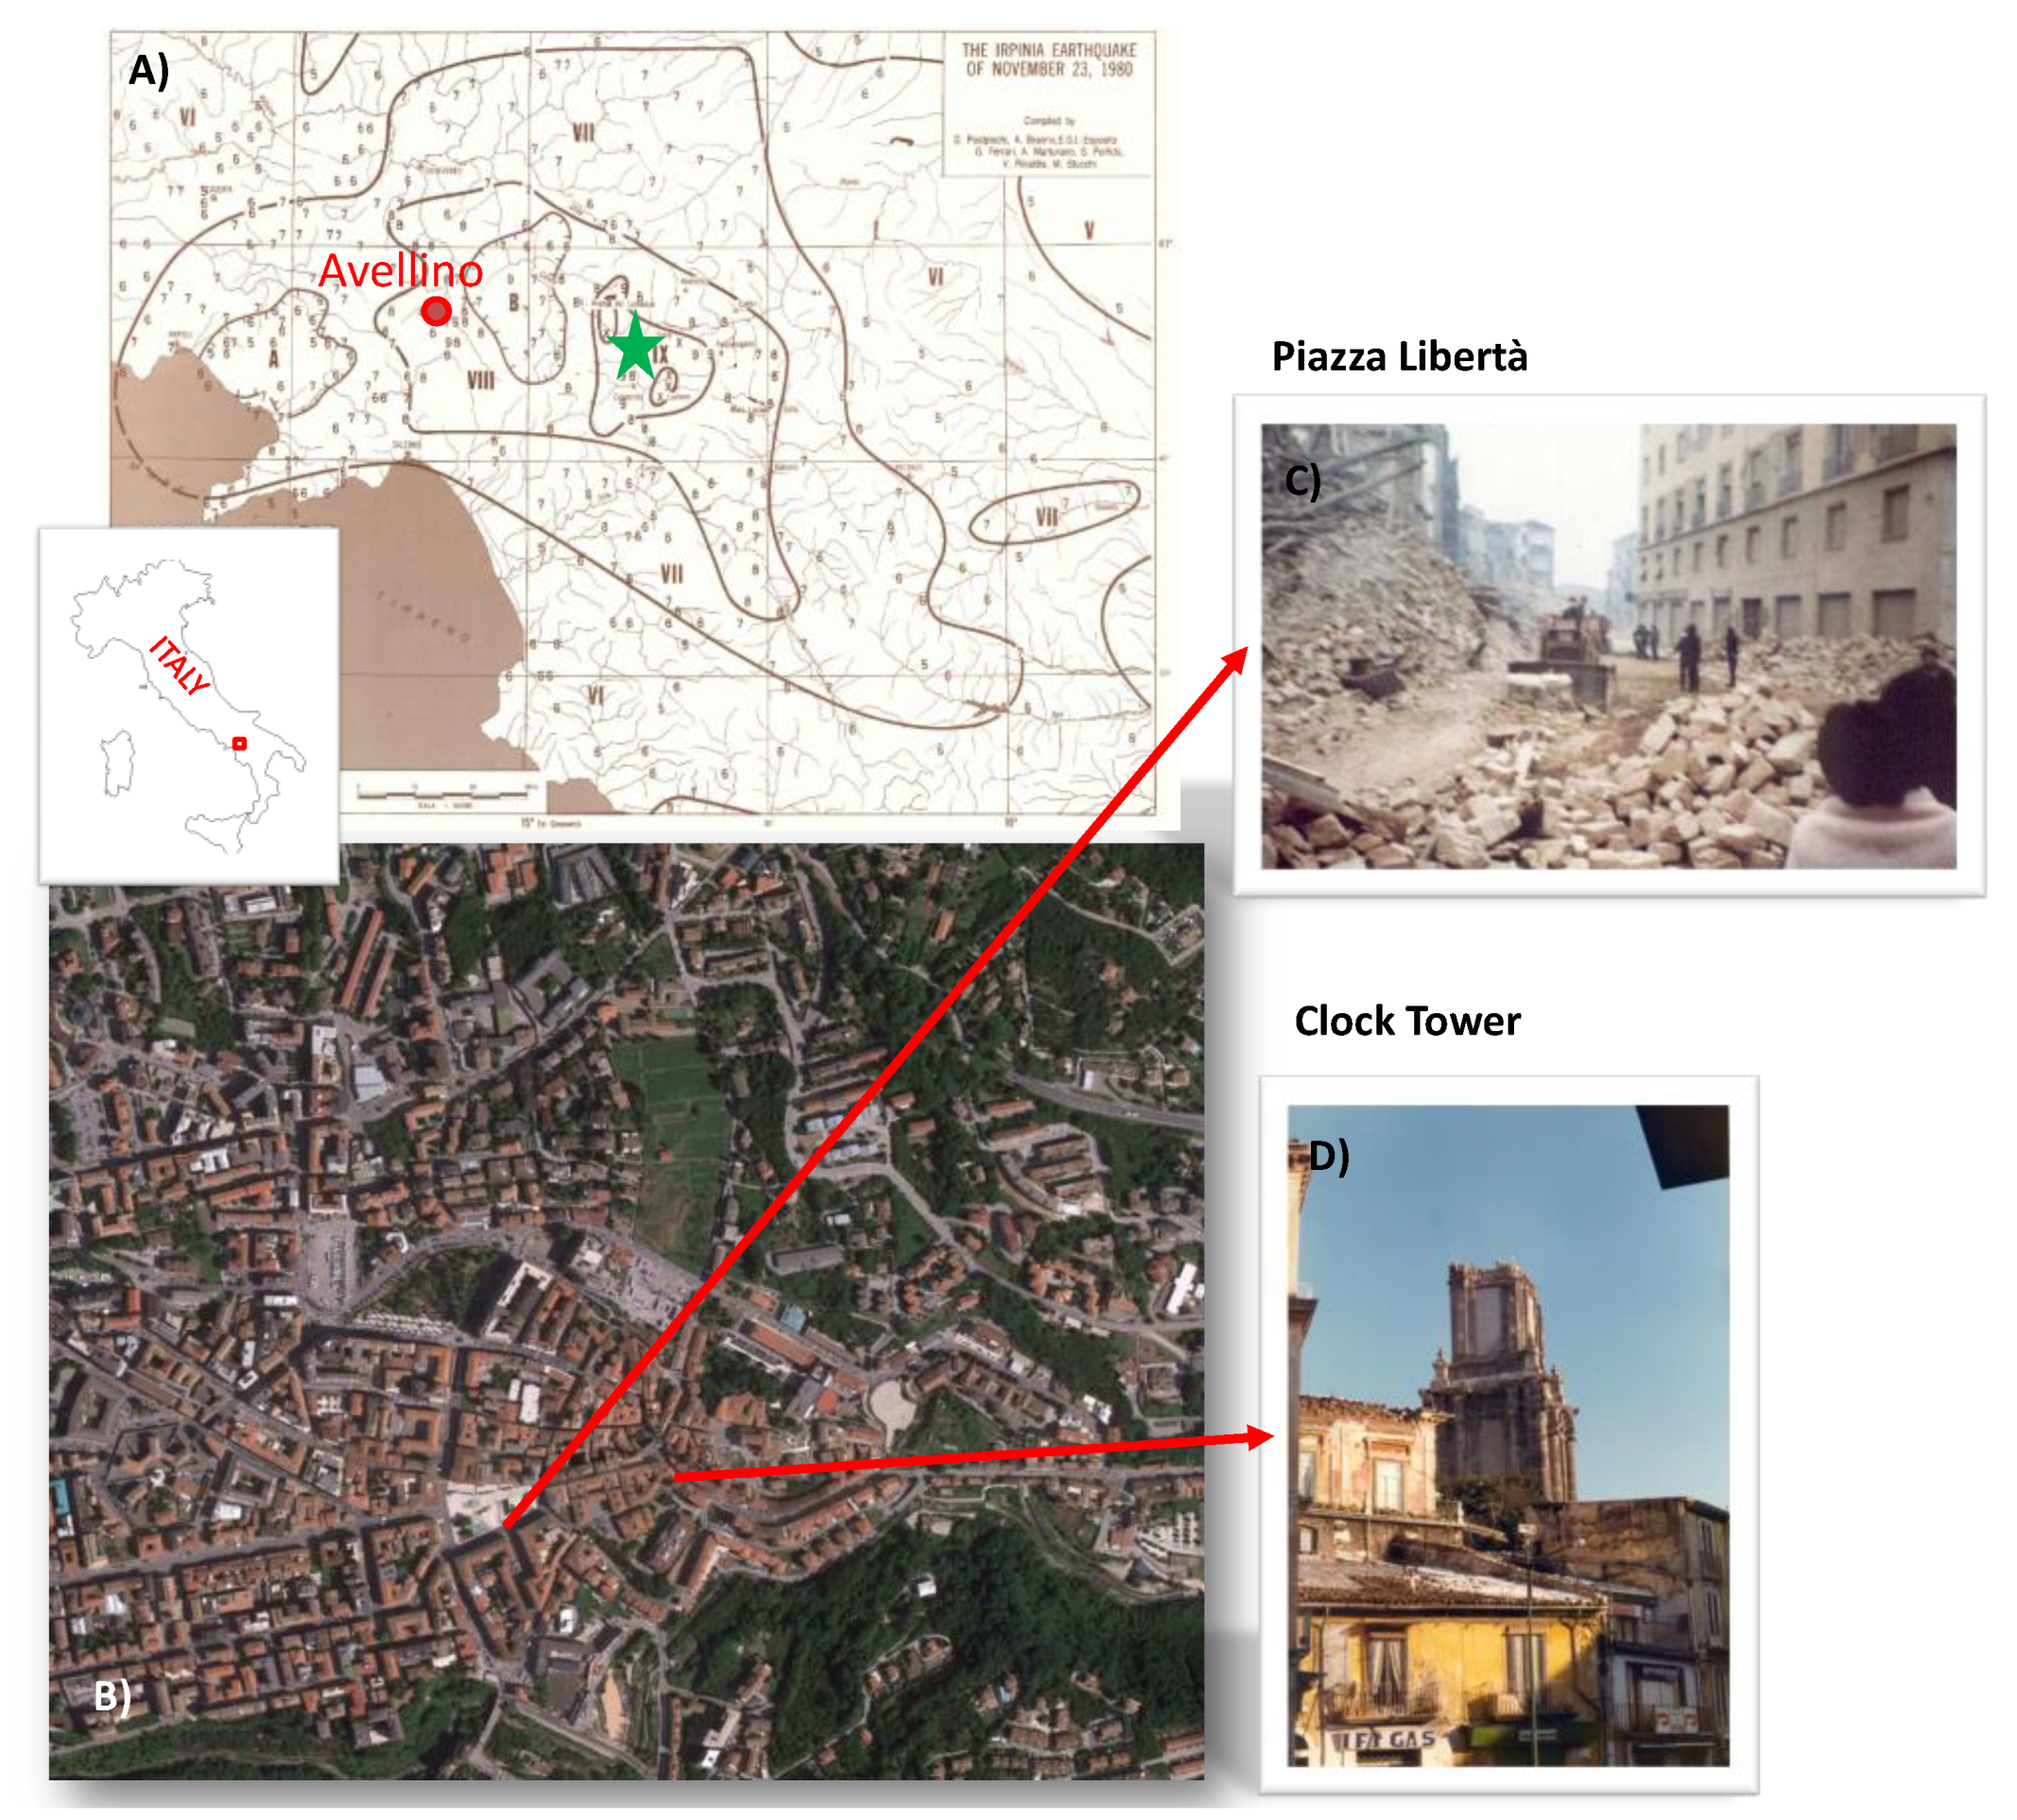
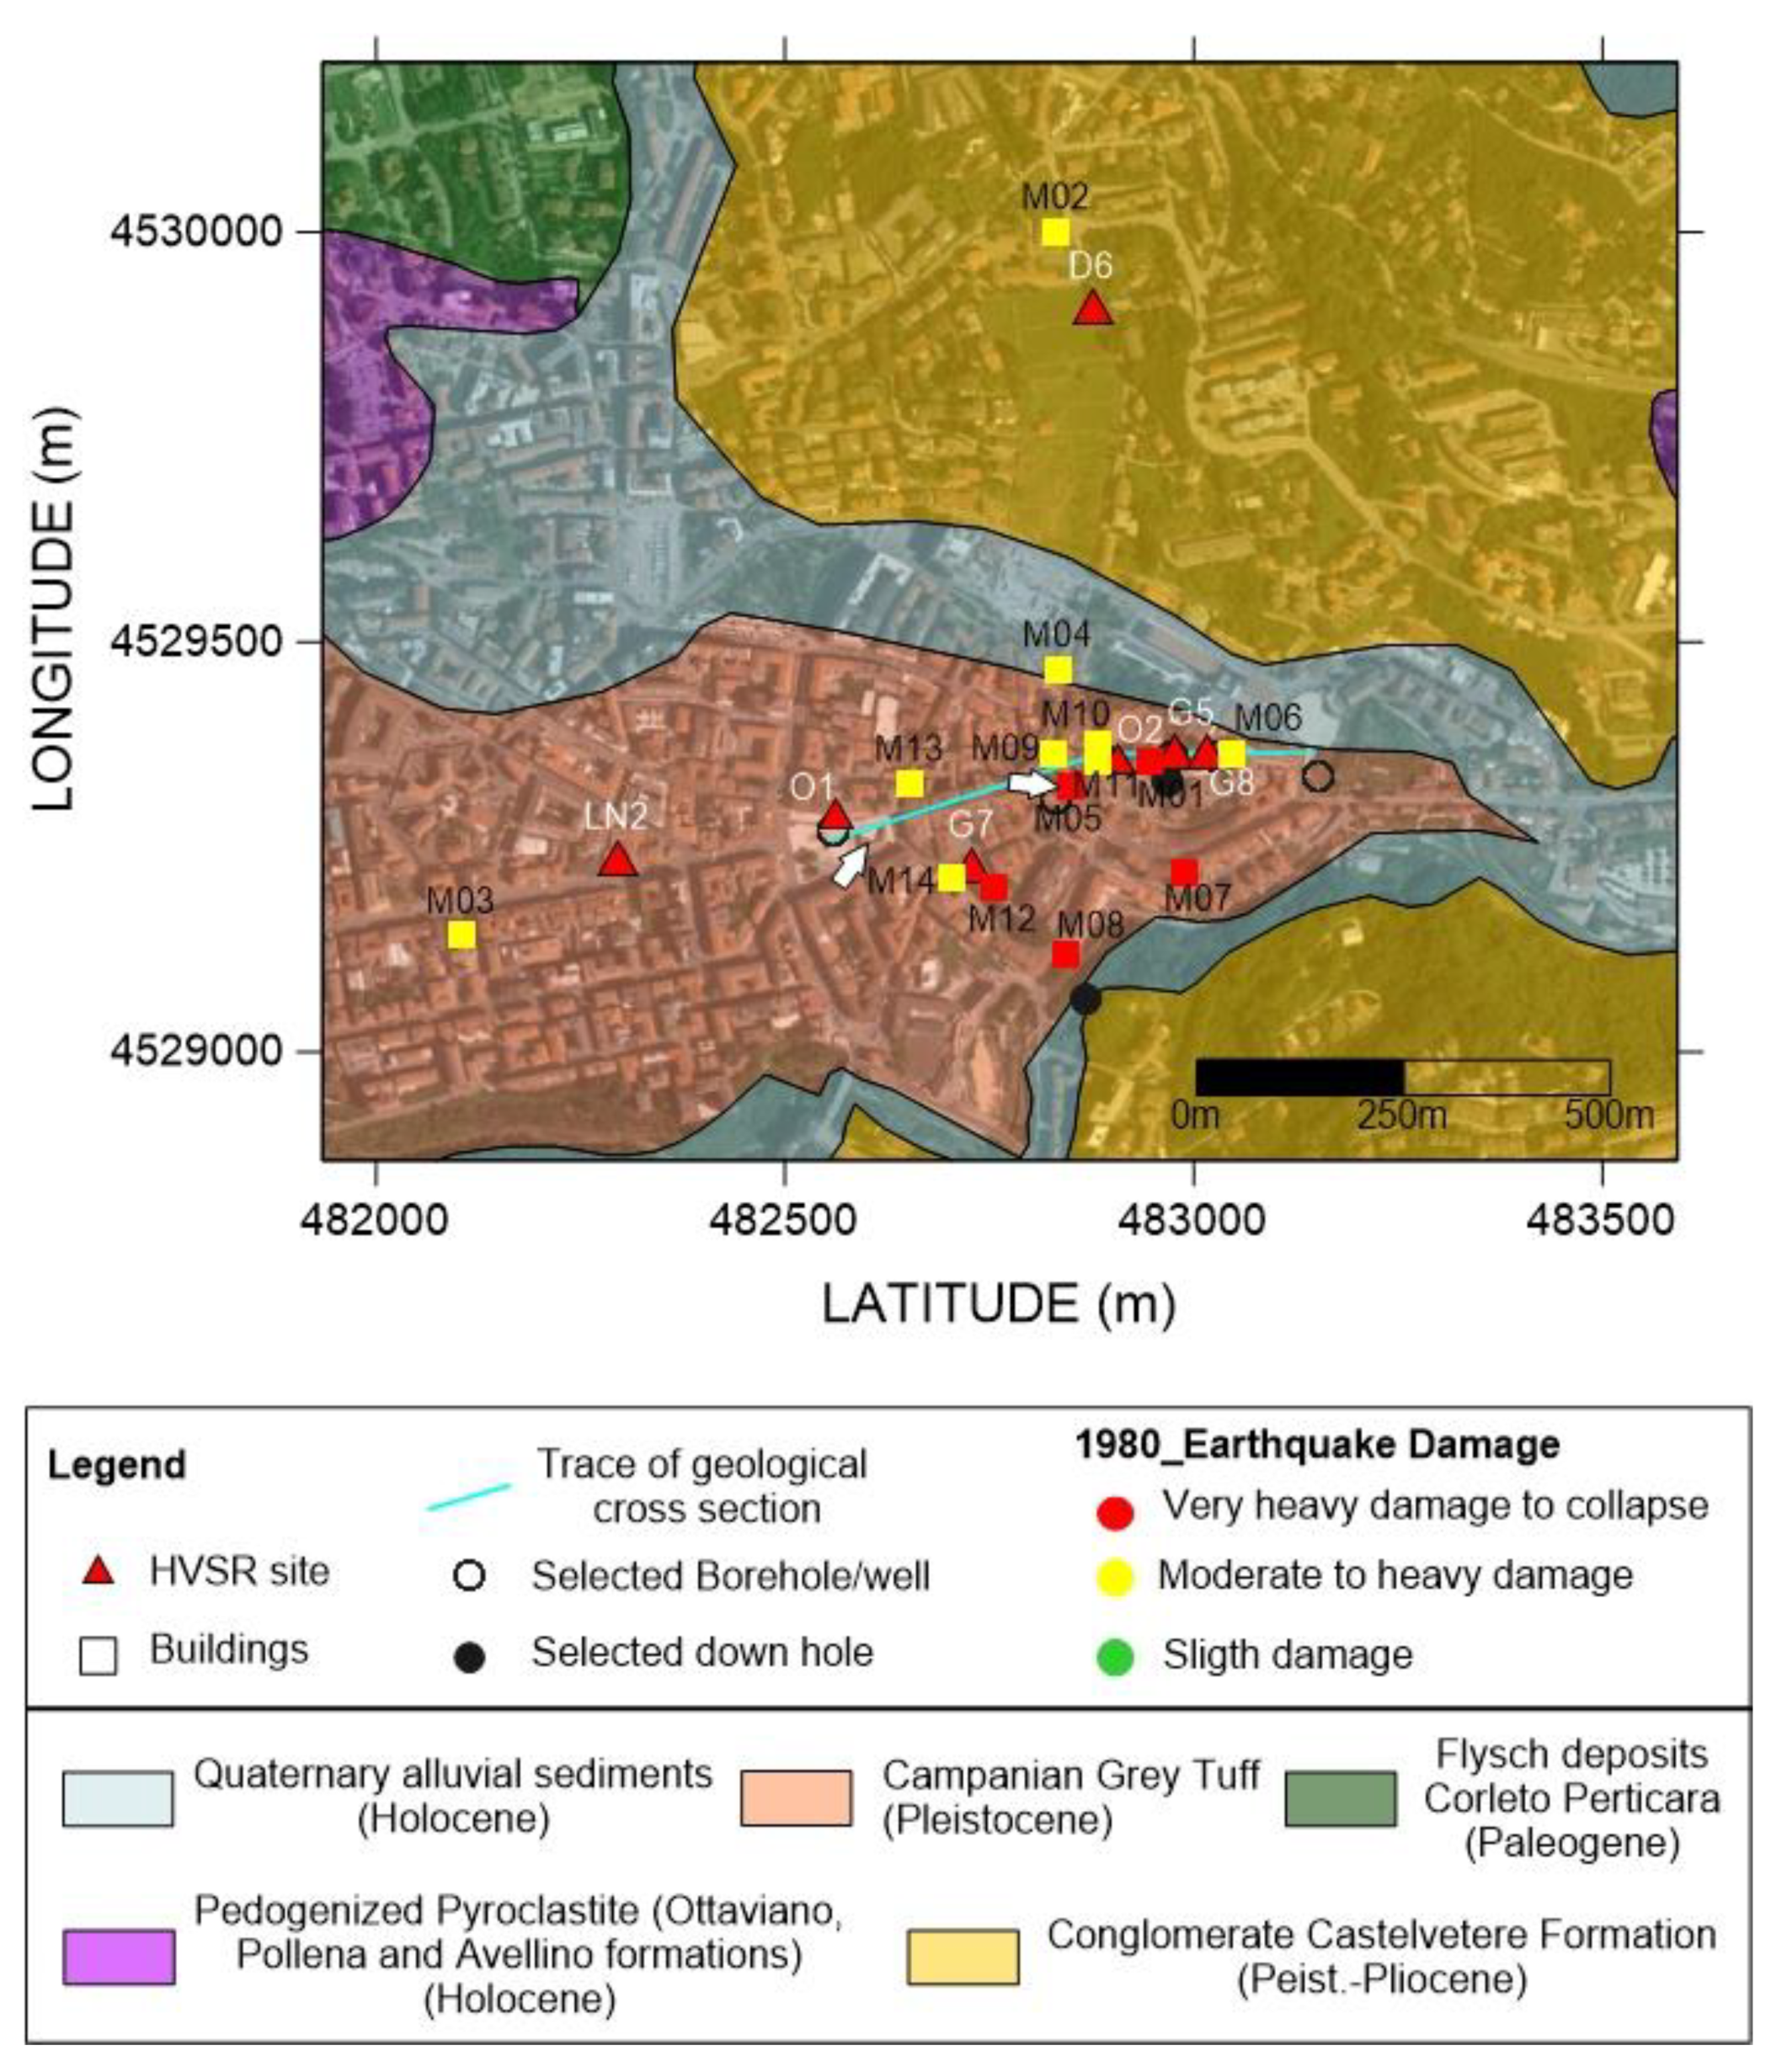
3. Cultural Heritage and 1980 Earthquake Damage
4. Damage Levels and Classification
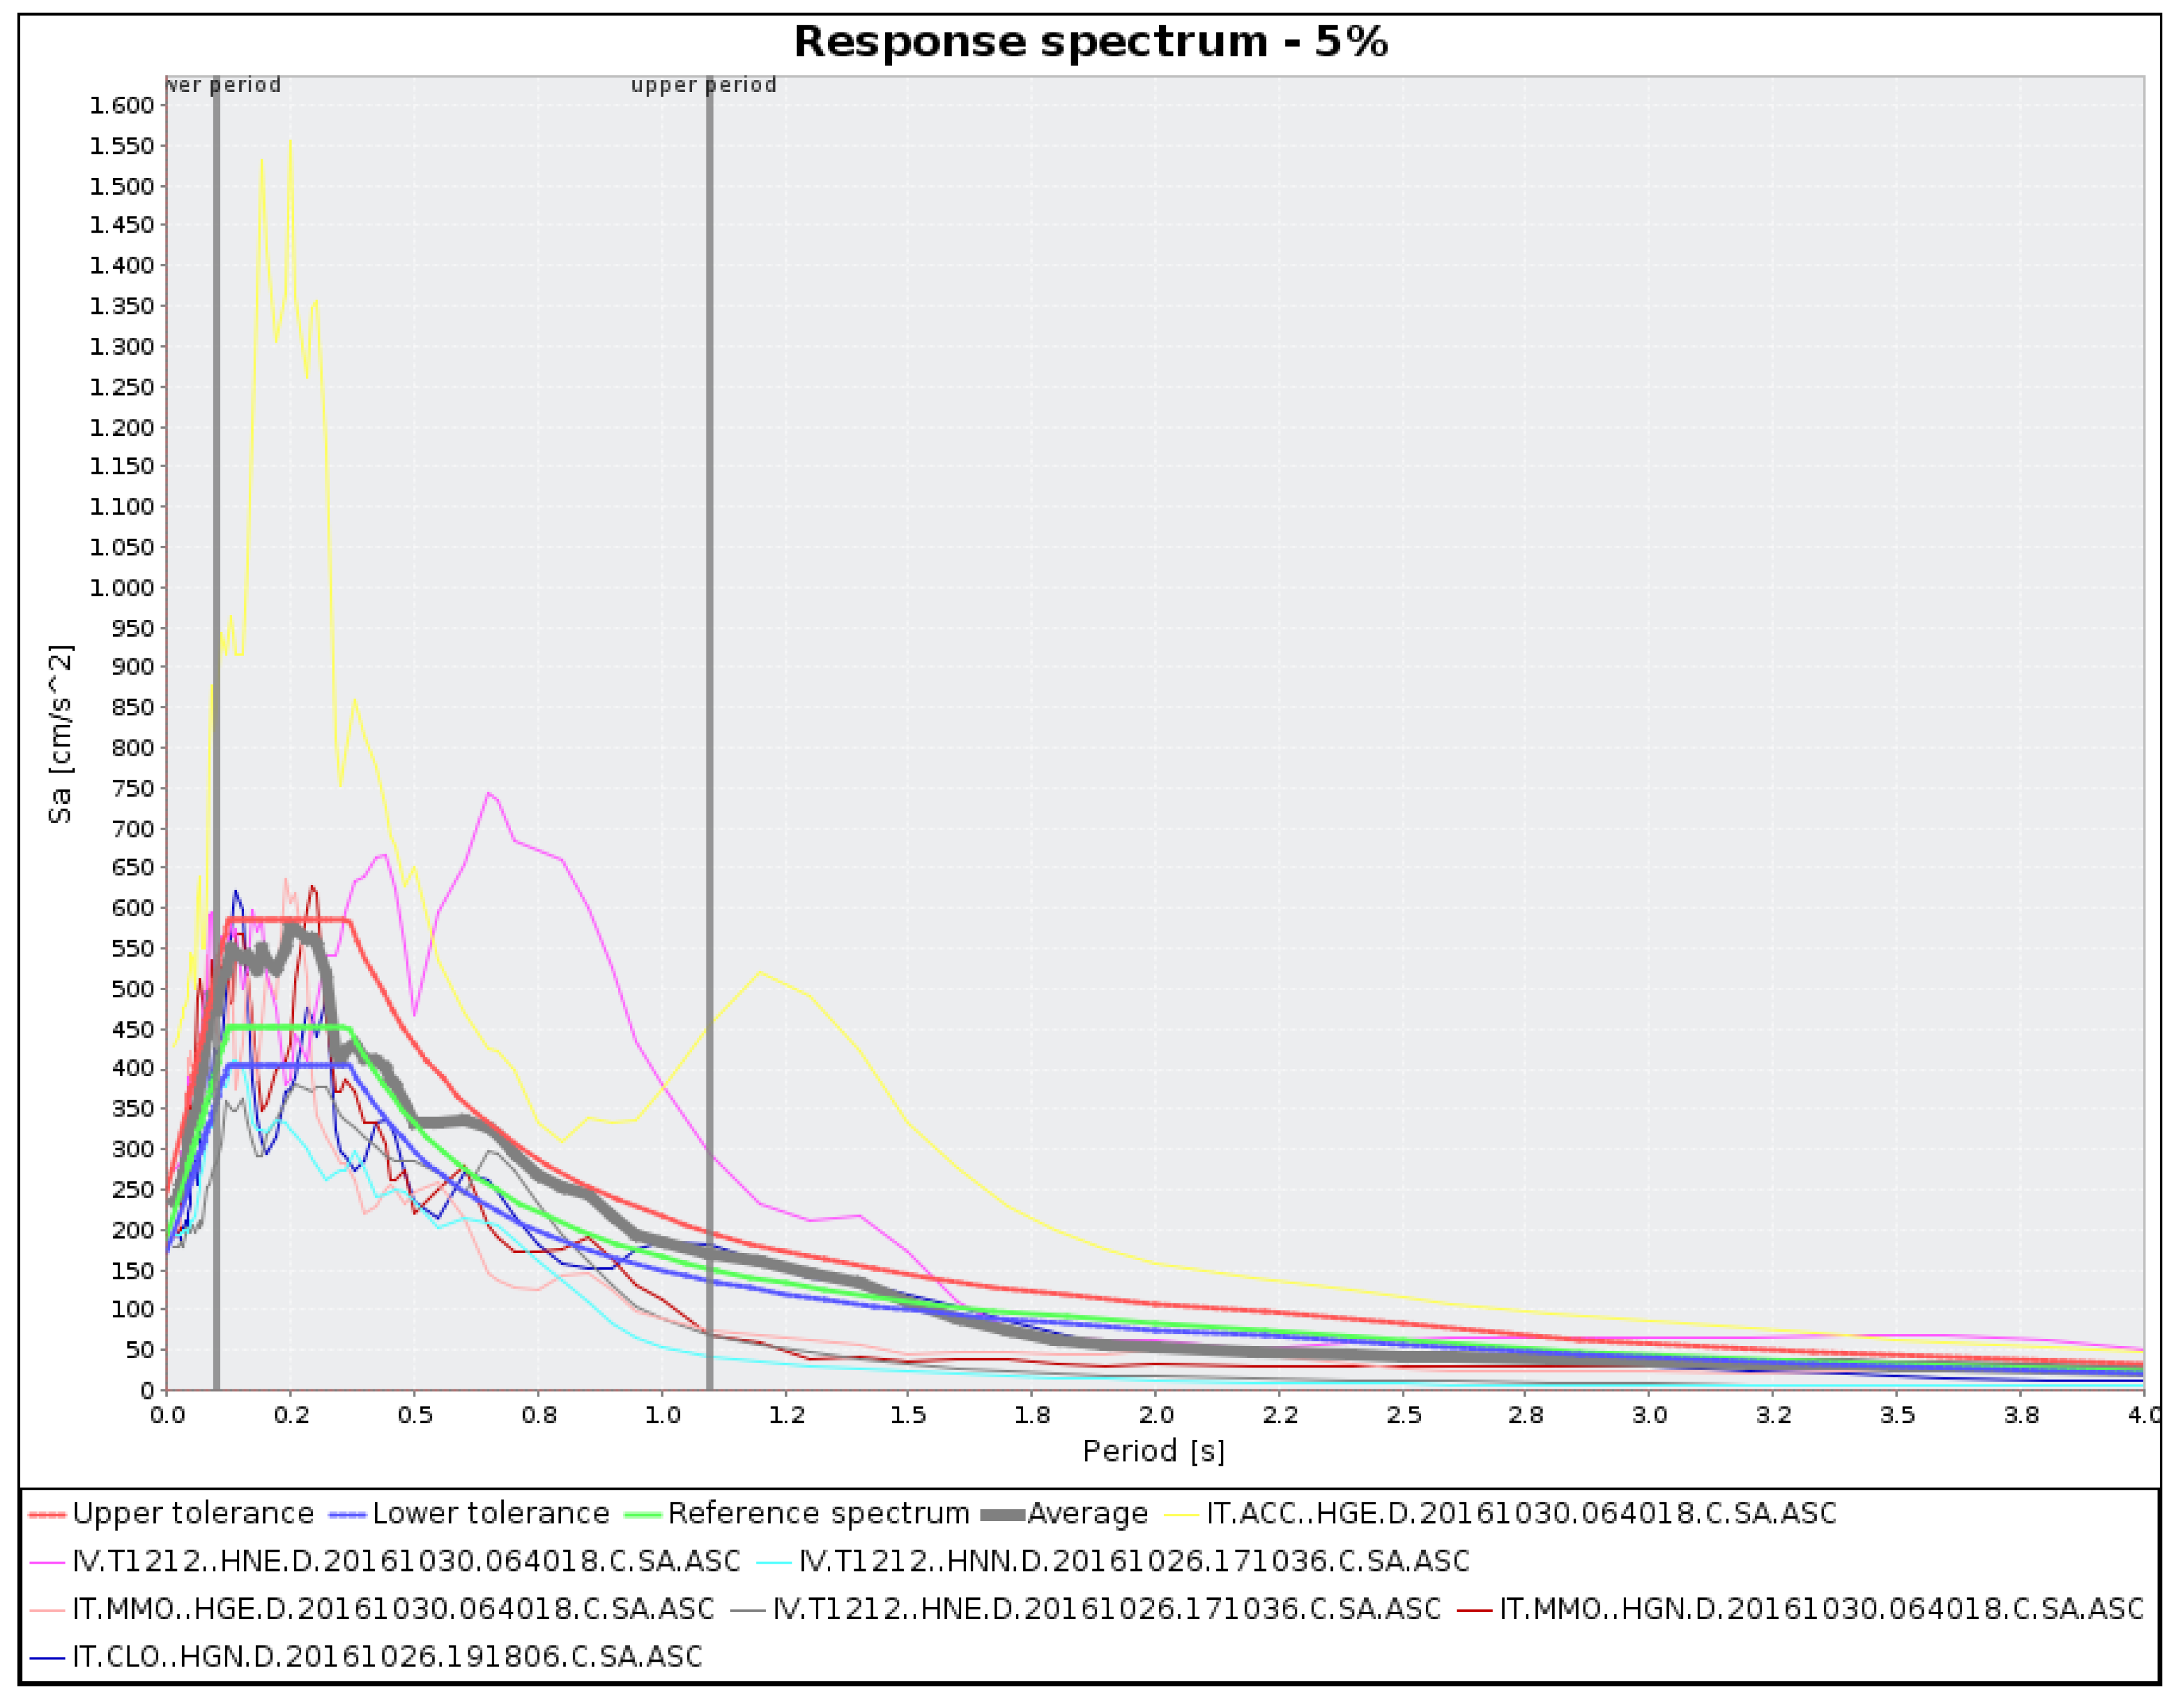
5. Ground Motion Modelling
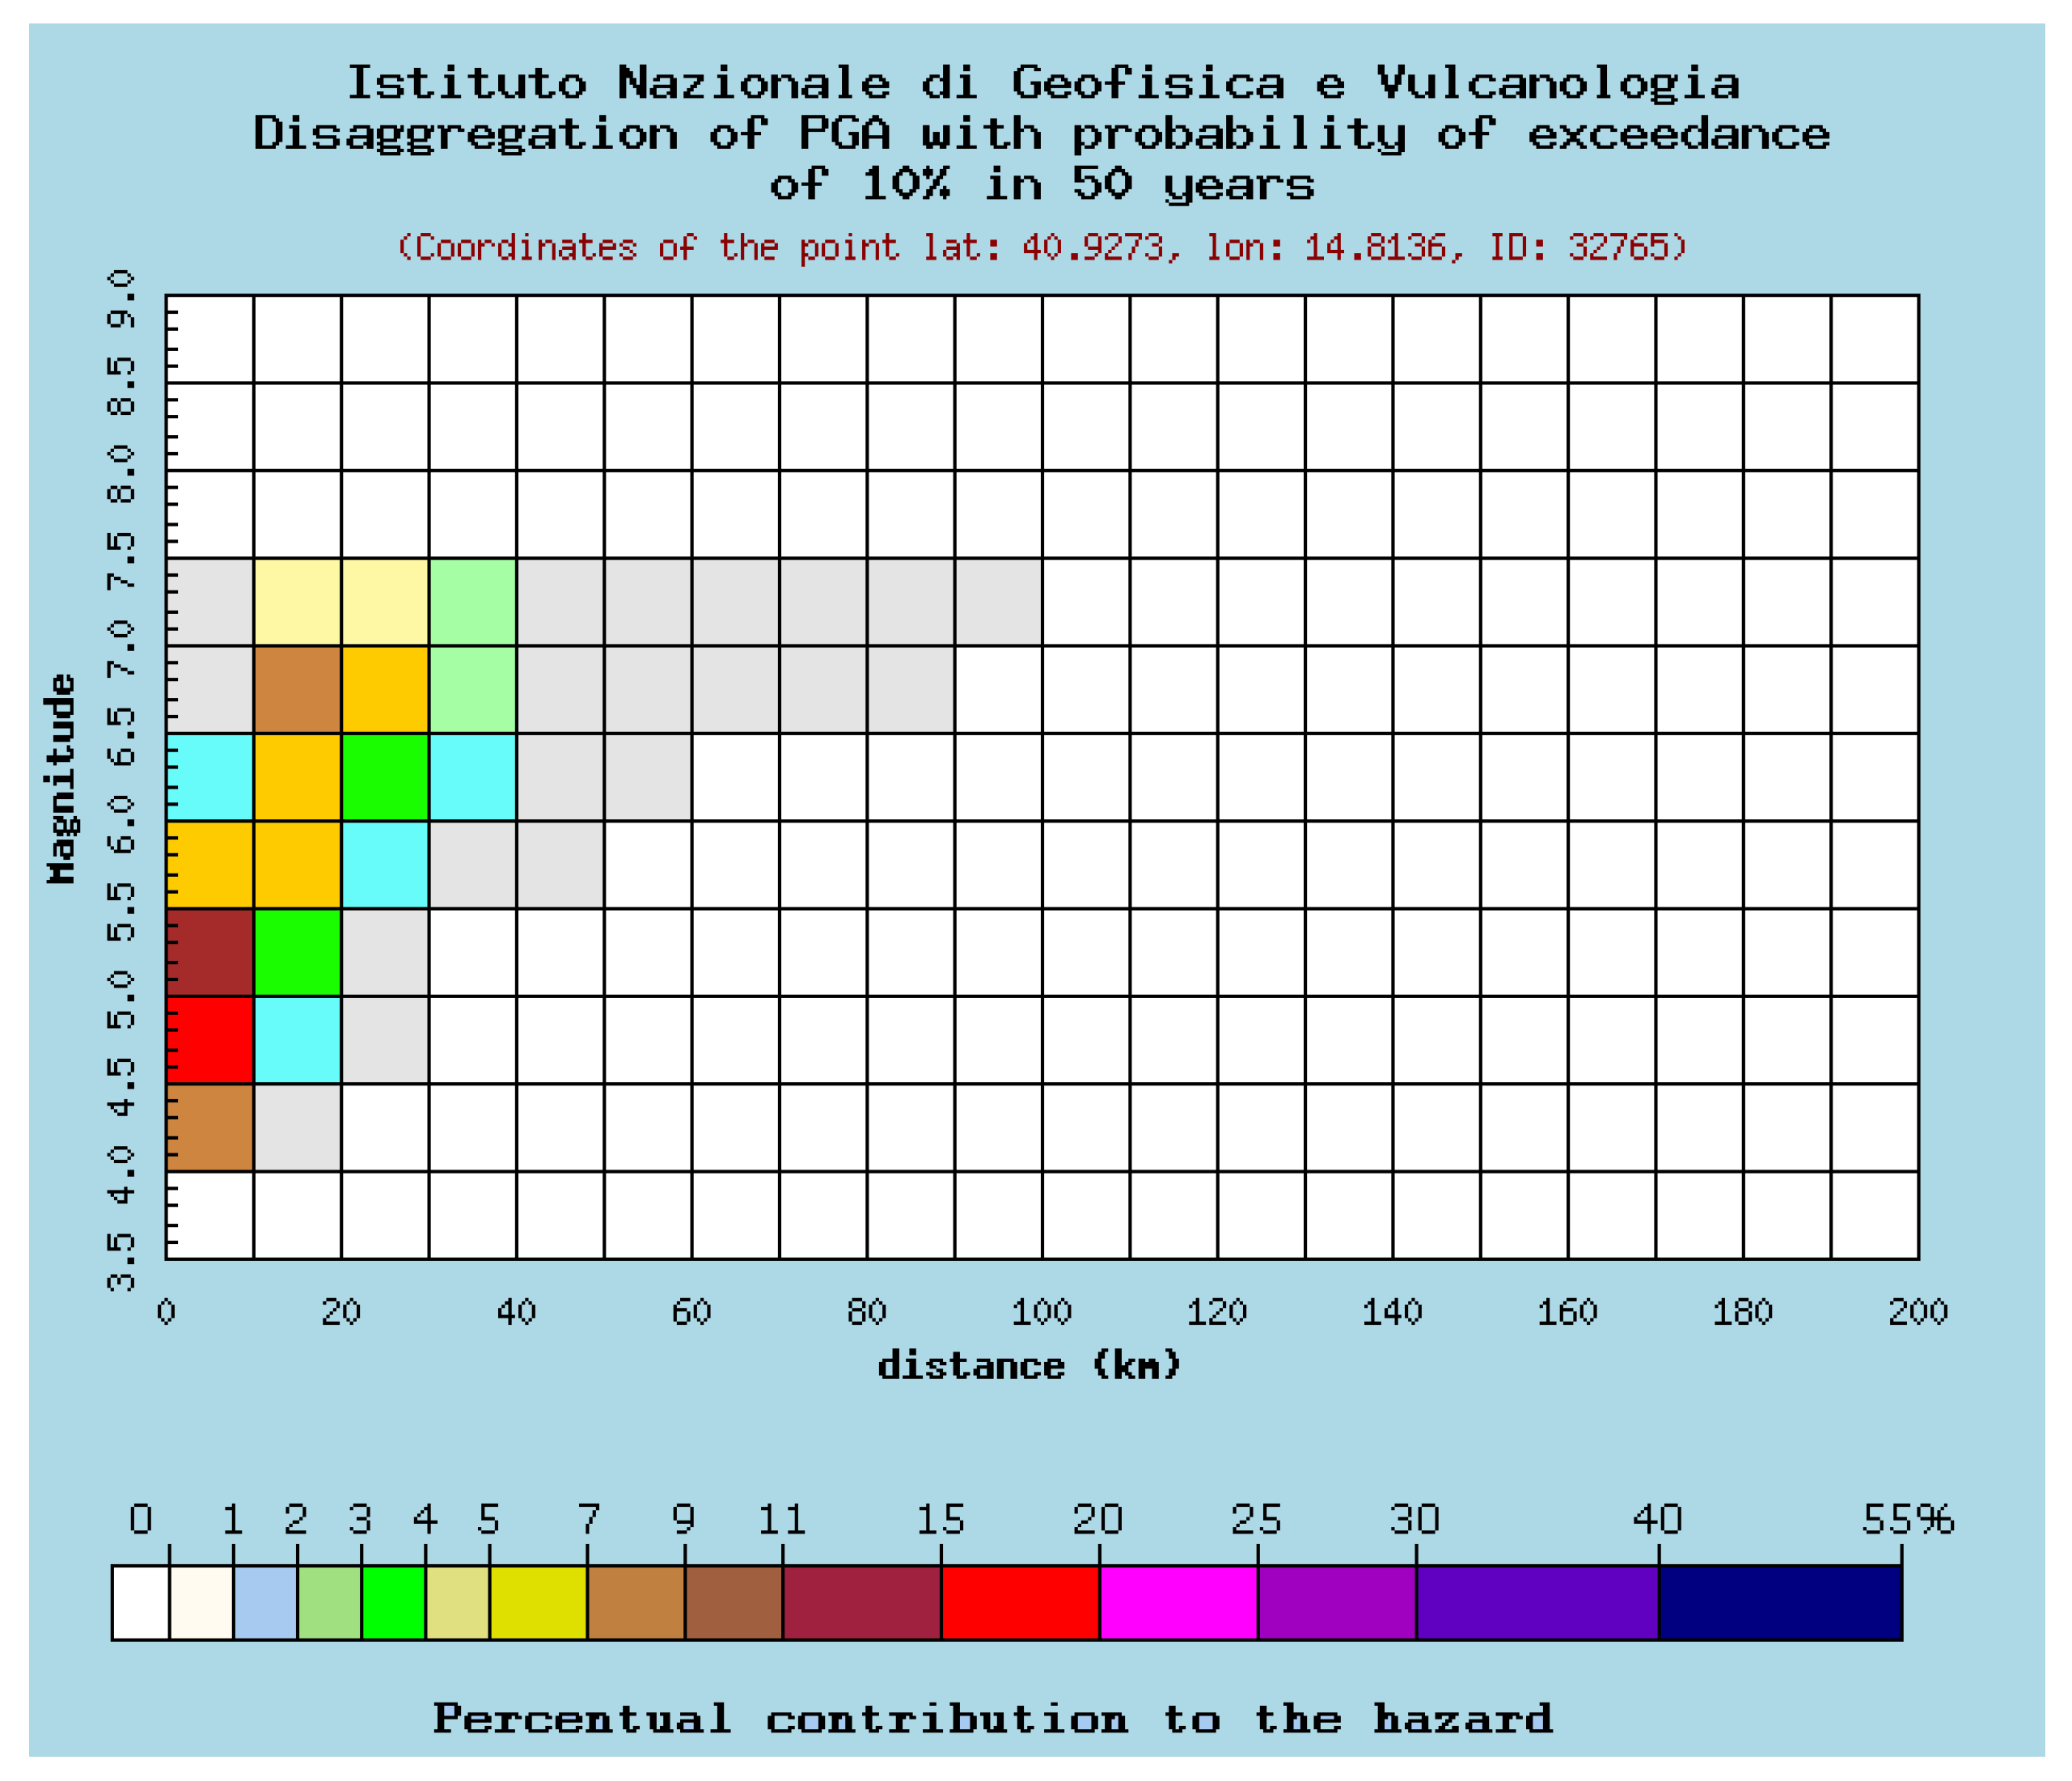
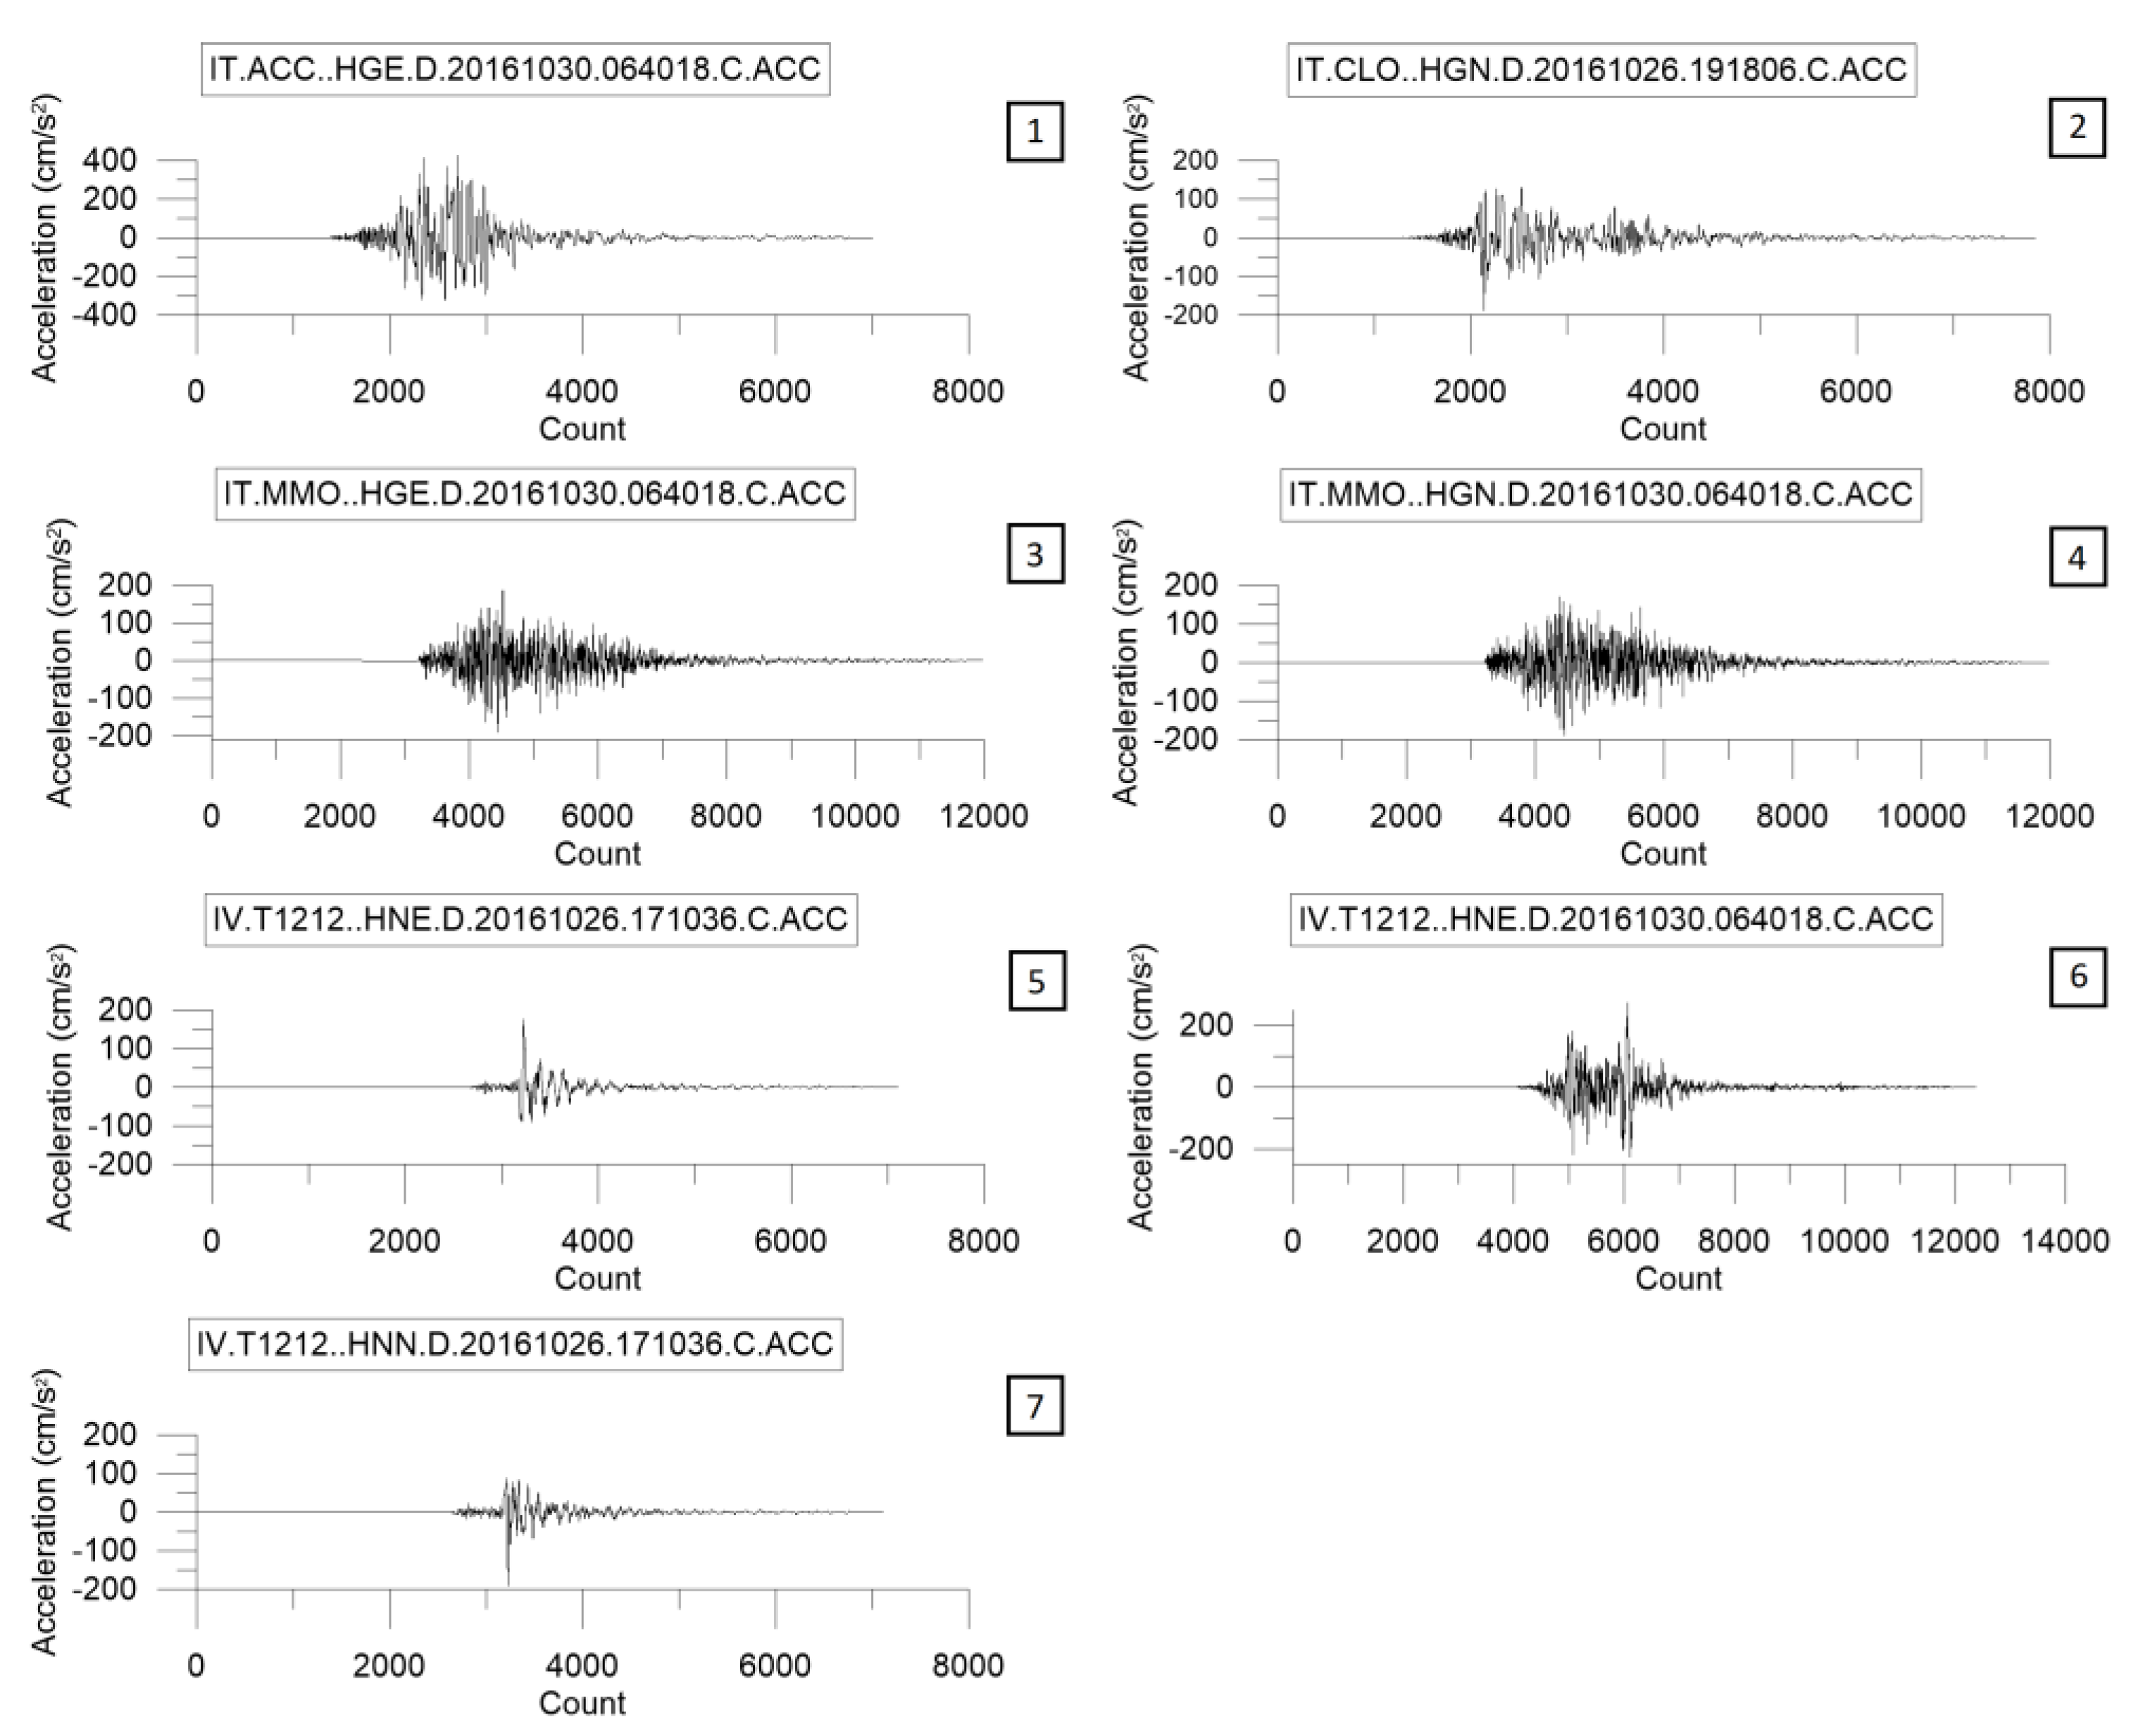
5.1. Disaggregation of Seismic Hazard and Input Motion Selection
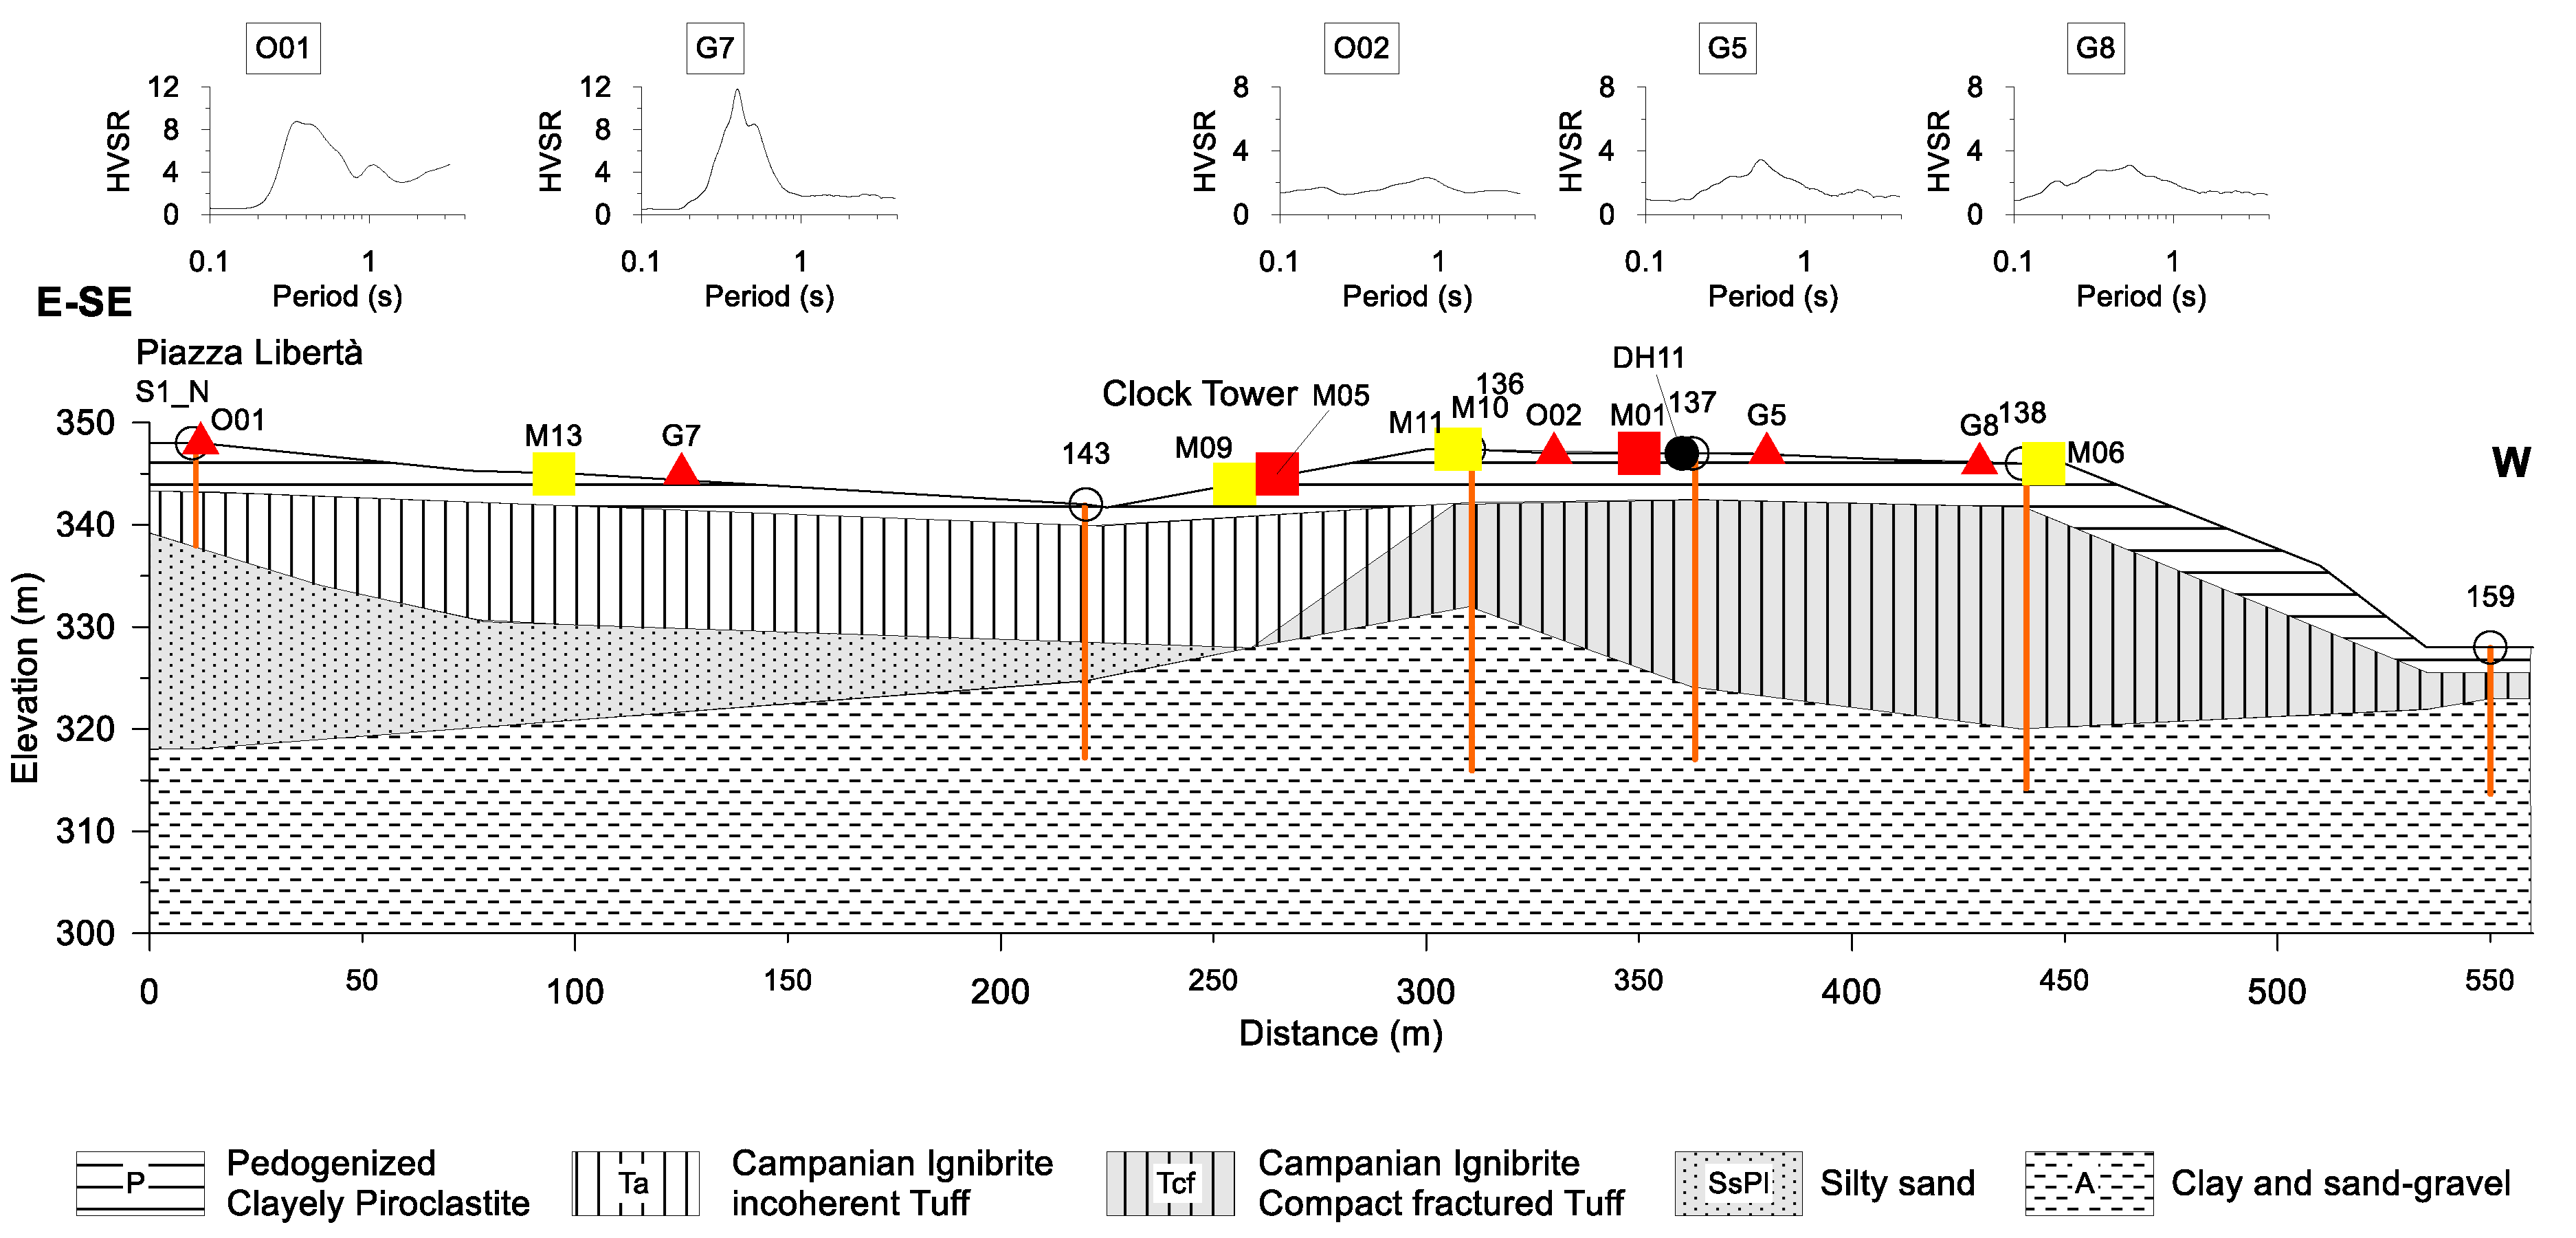
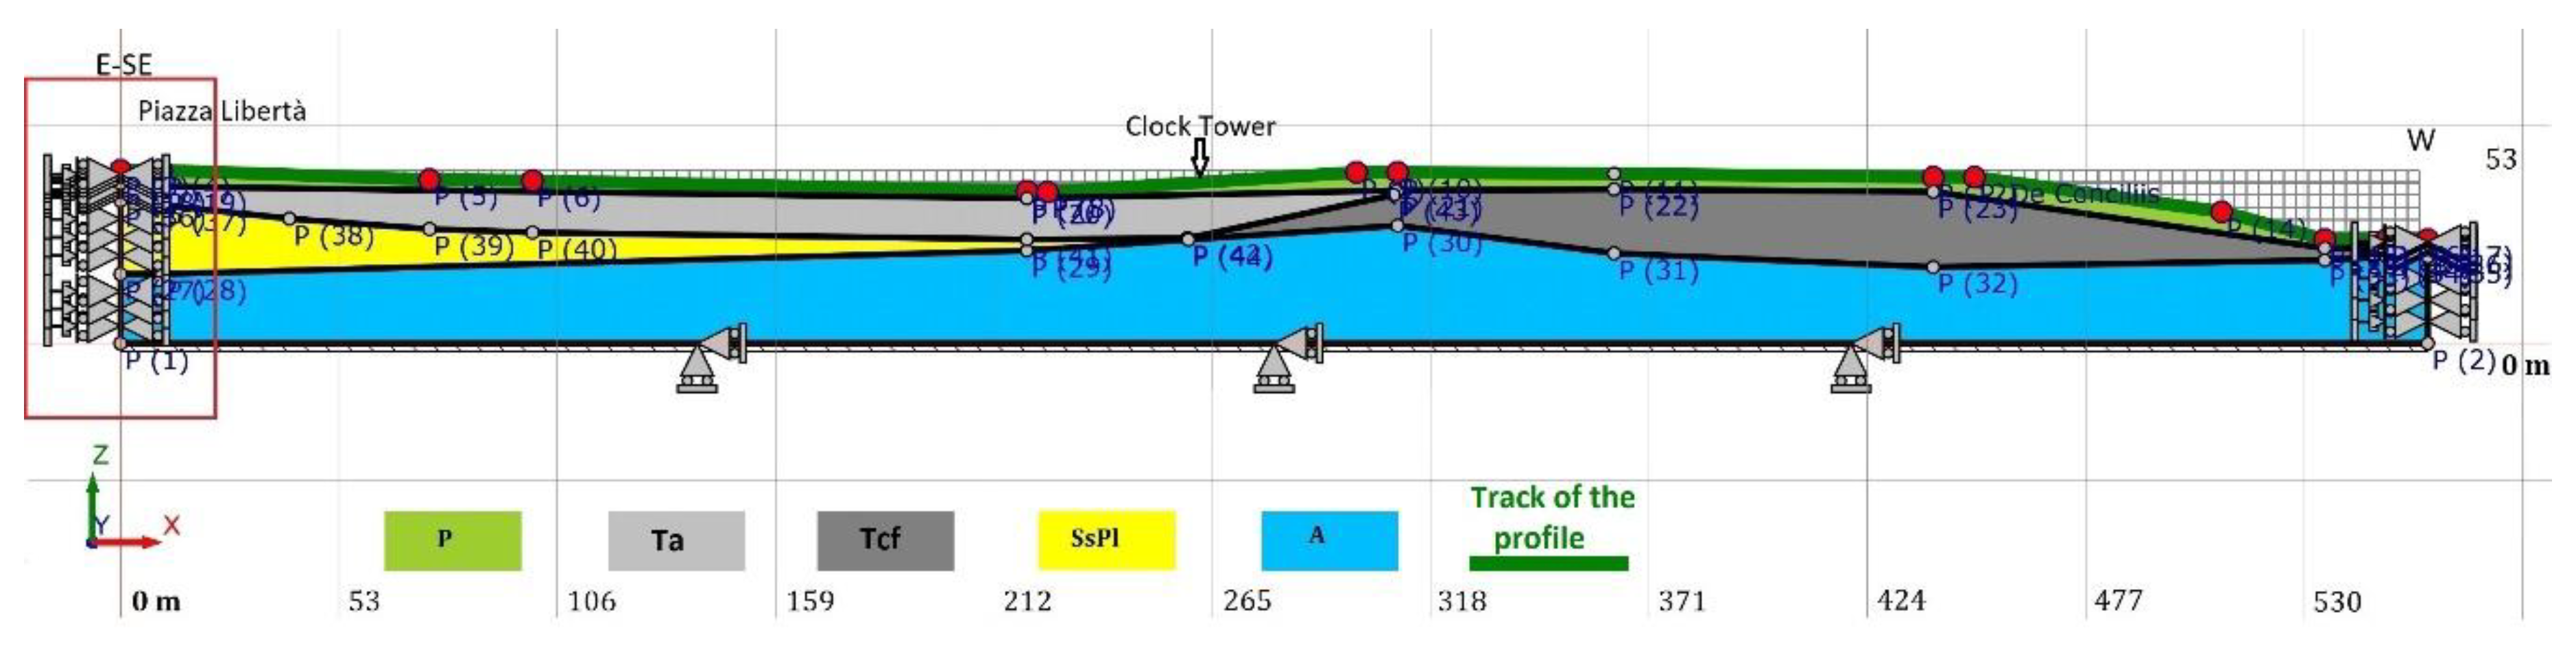
5.2. Geological Model
5.3. Ground Response Analysis
- -
- volume weight, shear modulus, damping at low strain, Poisson’s ratio;
- -
- normalized shear modulus (G/G0) and damping ratio (D) curves versus shear strain (γ);
- -
- constant α for the calculation of the characteristic value of the shear deformation starting from the maximum value of γ (α) (typically equal to 0.65).
- -
- maximum accelerations in all nodes of the mesh;
- -
- maximum tangential stresses and strains in each element;
- -
- time history of the acceleration in the selected nodes (vertical and horizontal components).
6. Discussion and Conclusions
Author Contributions
Funding
Acknowledgments
Conflicts of Interest
References
- Guidoboni, E.; Ferrari, G.; Mariotti, D.; Comastri, A.; Tarabusi, G.; Sgattoni, G.; Valensise, G. CFTI5Med, Catalogo dei Forti Terremoti in Italia (461 a.C.-1997) e Nell’area Mediterranea (760 a.C.-1500); Istituto Nazionale di Geofisica e Vulcanologia (INGV): Rome, Italy, 2018. [Google Scholar] [CrossRef]
- Bernard, P.; Zollo, A. The Irpinia (Italy) 1980 Earthquake: Detailed Analysis of a Complex Normal Faulting. J. Geophys. Res. 1989, 94, 1631–1647. [Google Scholar] [CrossRef]
- Postpischl, D.; Branno, A.; Esposito, E.; Ferrari, G.; Marturano, A.; Porfido, S.; Rinaldis, V.; Stucchi, M. The Irpinia earthquake of November 23, 1980. In Atlas of Isoseismal Maps of Italian Earthquakes, CNR-PFG; CNR: Irpinia, Italy, 1985; pp. 152–157. [Google Scholar]
- Maresca, R.; Nardone, L.; Pasquale, G.; Pinto, F.; Bianco, F. Effects of surface geology on seismic ground motion deduced from ambient-noise measurements in the town of Avellino, Irpinia region (Italy). Pure Appl. Geophys. 2012, 169, 1173–1188. [Google Scholar] [CrossRef] [Green Version]
- Maresca, R.; Nardone, L.; Gizzi, F.T.; Potenza, M.R. Ambient noise HVSR measurements in the Avellino historical centre and surrounding area (southern Italy). Correlation with surface geology and damage caused by the 1980 Irpinia-Basilicata earthquake. Measurement 2018, 130, 211–222. [Google Scholar] [CrossRef]
- Gaudiosi, G.; Alessio, G.; Nappi, R.; Noviello, V.; Spiga, E.; Porfido, S. Evaluation of Damages to the Architectural Heritage of Naples as a Result of the Strongest Earthquakes of the Southern Apennines. Appl. Sci. 2020, 10, 6880. [Google Scholar] [CrossRef]
- Lagomarsino, S.; Podestà, S. Damage and vulnerability assessment of churches after the Molise earthquake (2002). Earthq. Spectr. 2004, 20, S271–S283. [Google Scholar] [CrossRef]
- Lagomarsino, S. Damage assessment of churches after L’Aquila earthquake (2009). Bull. Earthq. Eng. 2012, 10, 73–92. [Google Scholar] [CrossRef]
- Sorrentino, L.; Liberatore, L.; Decanini, L.D. The performance of churches in the 2012 Emilia earthquakes. Bull. Earthq. Eng. 2014, 12, 2299–2331. [Google Scholar] [CrossRef]
- Hofer, L.; Zampieri, P.; Zanini, M.A.; Faleschini, F.; Pellegrino, C. Seismic damage survey and empirical fragility curves for churches after the August 24, 2016 Central Italy earthquake. Soil Dyn. Earthq. Eng. 2018, 111, 98–109. [Google Scholar]
- Gallipoli, M.R.; Gizzi, F.T.; Rizzo, E.; Masini, N.; Potenza, M.R.; Albarello, D.; Lapenna, V. Site features responsible for uneven seismic effects in historical centre of Melfi (Basilicata, Southern Italy). Disaster Adv. 2012, 5, 125–137. [Google Scholar]
- Guidoboni, E.; Mariotti, D.; Giammarinaro, M.S.; Rovelli, A. Identification of amplified damage zones in Palermo, Sicily (Italy), during the earthquakes of the last three centuries. Bull. Seismol. Soc. Am. 2003, 93, 1649–1669. [Google Scholar] [CrossRef]
- Gosar, A. Microtremor HVSR study for assessing site effects in the Bovec basin (NW Slovenia) related to 1998 Mw5. 6 and 2004 Mw5. 2 earthquakes. Eng. Geol. 2007, 91, 178–193. [Google Scholar] [CrossRef]
- Del Monaco, F.; Tallini, M.; De Rose, C.; Durante, F. HVNSR survey in historical downtown L’Aquila (central Italy): Site resonance properties vs. subsoil model. Eng. Geol. 2013, 158, 34–47. [Google Scholar] [CrossRef]
- Leyton, F.; Ruiz, S.; Sepúlveda, S.A.; Contreras, J.P.; Rebolledo, S.; Astroza, M. Microtremors’ HVSR and its correlation with surface geology and damage observed after the 2010 Maule earthquake (Mw 8.8) at Talca and Curicó, Central Chile. Eng. Geol. 2013, 161, 26–33. [Google Scholar] [CrossRef]
- Mucciarelli, M. Ambient noise measurements on soil and buildings. Bull. Earthq. Eng. 2010, 8, 481–482. [Google Scholar] [CrossRef]
- Castellaro, S.; Padrón, L.A.; & Mulargia, F. The different response of apparently identical structures: A far-field lesson from the Mirandola 20th May 2012 earthquake. Bull. Earthq. Eng. 2014, 12, 2481–2493. [Google Scholar] [CrossRef]
- Moisidi, M. Site-building resonance response in a complex geological setting: Ground motions recorded in the centre of Paleohora Basin and at a rock fractured outcrop site close to the basin edge (SW Crete, Greece). Phys. Chem. Earth Parts A/B/C 2017, 98, 73–89. [Google Scholar] [CrossRef]
- Honoré, L.; Courboulex, F.; Souriau, A. Ground motion simulations of a major historical earthquake (1660) in the French Pyrenees using recent moderate size earthquakes. Geophys. J. Int. 2011, 187, 1001–1018. [Google Scholar] [CrossRef] [Green Version]
- Albarello, D.; Cesi, C.; Eulilli, V.; Guerrini, F.; Lunedei, E.; Paolucci, E.; Pileggi, D.; Puzzilli, L.M. The contribution of the ambient vibration prospecting in seismic microzoning: An example from the area damaged by the April 6, 2009 L’Aquila (Italy) earthquake. Boll. Geof. Teor. Appl. 2011, 52, 513–538. [Google Scholar]
- Khanbabazadeh, H.; Hasal, M.E.; Iyisan, R. 2D seismic response of the Duzce Basin, Turkey. Soil Dyn. Earthq. Eng. 2019, 125, 105754. [Google Scholar] [CrossRef]
- Mouzakiotis, E.; Karastathis, V.; Voulgaris, N.; Papadimitriou, P. Site Amplification Assessment in the East Corinth Gulf Using 3D Finite-Difference Modeling and Local Geophysical Data. Pure Appl. Geophys. 2020, 1–19. [Google Scholar] [CrossRef]
- Senatore, M.R.; Boscaino, M.; Pinto, F. The Quaternary geology of the Benevento urban area (Southern Italy) for seismic microzonation purposes. Ital. J. Geosci. 2019, 138, 66–87. [Google Scholar] [CrossRef]
- Nunziata, C.; Costanzo, M.R. Ground Shaking Scenario at the Historical Center of Napoli (Southern Italy) for the 1456 and 1688 Earthquakes. Pure Appl. Geophys 2020, 1–16. [Google Scholar] [CrossRef]
- Macerola, L.; Tallini, M.; Di Giulio, G.; Nocentini, M.; Milana, G. The 1-D and 2-D Seismic Modeling of Deep Quaternary Basin (Downtown L’Aquila, Central Italy). Earthq. Spectra 2019, 35, 1689–1710. [Google Scholar] [CrossRef]
- Giallini, S.; Pizzi, A.; Pagliaroli, A.; Moscatelli, M.; Vignaroli, G.; Sirianni, P.; Mancini, M.; Laurenzano, G. Evaluation of complex site effects through experimental methods and numerical modelling: The case history of Arquata del Tronto, central Italy. Eng. Geol. 2020, 2020, 105646. [Google Scholar] [CrossRef]
- Brando, G.; Pagliaroli, A.; Cocco, G.; Di Buccio, F. Site effects and damage scenarios: The case study of two historic centers following the 2016 Central Italy earthquake. Eng. Geol. 2020, 2020, 105647. [Google Scholar] [CrossRef]
- Pergalani, F.; Pagliaroli, A.; Bourdeau, C.; Compagnoni, M.; Lenti, L.; Lualdi, M.; Madiai, C.; Martino, S.; Razzano, R.; Varone, C.; et al. Seismic microzoning map: Approaches, results and applications after the 2016–2017 Central Italy seismic sequence. Bull. Earthq. Eng. 2019, 18. [Google Scholar] [CrossRef] [Green Version]
- Pagliaroli, A.; Gaudiosi, I.; Razzano, R.; Giallini, S.; De Siva, F.; Chiaradonna, A.; Ciancimino, A.; Foti, S. Site response analyses for seismic microzonation: Case-histories, results and applications in Central Italy. In Proceedings of the 7th lnternational Conference on Earthquake Geotechnical Engineering (VII ICEGE), Roma, Italy, 17–20 June 2019. [Google Scholar]
- Hudson, J.A.; Boore, D.M. Comments on ‘Scattered Surface Waves from a Surface Obstacle’. Geophys. J. R. Astr. Soc. 1980, 60, 123–127. [Google Scholar] [CrossRef] [Green Version]
- Lee, S.J.; Chan, Y.C.; Komatitsch, D.; Huang, B.S.; Tromp, J. Effects of realistic surface topography on seismic ground motion in the Yangminshan region of Taiwan based upon the spectral-element method and LiDAR DTM. Bull. Seismol. Soc. Am. 2009, 99, 681–693. [Google Scholar] [CrossRef]
- Geli, L.; Bard, P.Y.; Jullien, B. The effect of topography on earthquake ground motion: A review and new results. Bull. Seismol. Soc. Am. 1988, 78, 42–63. [Google Scholar]
- Cavallaro, A.; Ferraro, A.; Grasso, S.; Maugeri, M. Topographic effects on the Monte Po hill in Catania (Italy). Soil Dyn. Earthq. Eng. 2012, 43, 97–113. [Google Scholar] [CrossRef]
- Sohrabi-Bidar, A.; Kamalian, M. Effects of three-dimensionality on seismic response of Gaussian-shaped hills for simple incident pulses. Soil Dyn. Earthq. Eng. 2013, 52, 1–12. [Google Scholar] [CrossRef]
- Grelle, G.; Gargini, E.; Facciorusso, J.; Maresca, R.; Madiai, C. Seismic site effects in the Red Zone of Amatrice hill detected via the mutual sustainment of experimental and computational approaches. Bull. Earthq. Eng. 2020, 18, 1–30. [Google Scholar]
- Meletti, C.; Montaldo, V. Stime Di Pericolosità Sismica Per Diverse Probabilità Di Superamento In 50 Anni: Valori Di Ag. Progetto INGV-DPC S1, Deliverable D2; Istituto Nazionale di Geofisica e Vulcanologia (INGV): Rome, Italy, 2007. (In Italian) [Google Scholar]
- Meletti, C.; Galadini, F.; Valensise, G.; Stucchi, M.; Basili, R.; Barba, S.; Vannucci, G.; Boschi, E. A seismic source zone model for the seismic hazard assessment of the Italian territory. Tectonophysics 2008, 450, 85–108. [Google Scholar] [CrossRef]
- C.S.LL.PP (Consiglio Superiore del Lavori Pubblici). Norme tecniche per le costruzioni. Gazzetta Ufficiale della Repubblica Italiana, 4 February 2008. (In Italian) [Google Scholar]
- C.S.LL.PP (Consiglio Superiore del Lavori Pubblici). Aggiornamento delle Norme tecniche per le costruzioni. Gazzetta Ufficiale della Repubblica Italiana, 20 February 2018. (In Italian) [Google Scholar]
- Harmsen, S.; Frankel, A. Geographic deaggregation of seismic hazard in the United States. Bull. Seismol. Soc. Am. 2001, 91, 13–26. [Google Scholar] [CrossRef]
- Akinci, A.; Galadini, F.; Pantosti, D.; Petersen, M.; Malagnini, L.; Perkins, D. Effect of time dependence on probabilistic seismic-hazard maps and deaggregation for the Central Apennines, Italy. Bull. Seismol. Soc. Am. 2009, 99, 585–610. [Google Scholar] [CrossRef] [Green Version]
- Wang, J.P.; Huang, D.; Cheng, C.T.; Shao, K.S.; Wu, Y.C.; Chang, C.W. Seismic hazard analyses for Taipei city including deaggregation, design spectra, and time history with excel applications. Comput. Geosci. 2013, 52, 146–154. [Google Scholar] [CrossRef]
- Jarahi, H. Probabilistic seismic hazard deaggregation for Karaj City (Iran). Am. J. Eng. Appl. Sci. 2016, 9, 520–529. [Google Scholar] [CrossRef] [Green Version]
- Pacor, F.; Paolucci, R.; Luzi, L.; Sabetta, F.; Spinelli, A.; Gorini, A.; Nicoletti, M.; Marcucci, S.; Filippi, L.; Dolce, M. Overview of the Italian strong motion database ITACA 1.0. Bull. Earthq. Eng. 2011, 9, 1723–1739. [Google Scholar] [CrossRef] [Green Version]
- Gambino, N. Cronistoria dei Restauri Nelle Iscrizioni Commemorative; Gambino, N., Ed.; La Cattedrale di Avellino: Cava dei Tirreni, Italy, 1985; pp. 85–86. (In Italian) [Google Scholar]
- Proietti, G. Ministero Per I Beni Culturali E Ambientali—Soprintendenza Generale Agli Interventi Post-Sismici In Campania E Basilicata, Dopo La Polvere. Rilevazione Degli Interventi Di Recupero Post-Sismico Del Patrimonio Archeologico, Architettonico Ed Artistico Delle Regioni Campania E Basilicata Danneggiato Dal Terremoto Del 23 Novembre 1980 e del 14 Febbraio 1981 (Anni 1985–1989); Tomo II, Avellino, Istituto Poligrafico e Zecca dello Stato: Roma, Italy, 1994. (In Italian) [Google Scholar]
- Frattani, P. Sisma 1980. Effetti Sul Patrimonio Artistico Della Campania E Basilicata. Campania. Supplemento Del Bollettino d’Arte; Istituto Poligrafico e Zecca dello Stato: Rome, Italy, 1982. (In Italian) [Google Scholar]
- Grünthal, G. European Macroseismic Scale 1998 (EMS-98). Cahiers du Centre Européen de Géodynamique et de Séismologie 15; Centre Européen de Géodynamique et de Séismologie: Luxembourg, 1998; p. 99. [Google Scholar]
- Bazzurro, P.; Allin Cornell, C. Deaggregation of seismic hazard. Bull. Seismol. Soc. Am. 1999, 89, 501–520. [Google Scholar]
- Bommer, J.J.; Acevedo, A.B. The use of real earthquake accelerograms as input to dynamic analysis. J. Earthq. Eng. 2004, 8, 43–91. [Google Scholar] [CrossRef]
- Spallarossa, D.; Barani, S. Disaggregazione della pericolosità sismica in termini di M-R-ε. Progetto DPC-INGV S1, Deliverable D14. 2007. Available online: http://esse1.mi.ingv.it/d14.html (accessed on 10 September 2020).
- Barani, S.; Spallarossa, D.; Bazzurro, P. Disaggregation of Probabilistic Ground-Motion Hazard in Italy. Bull. Seismol. Soc. Am. 2009, 99, 2638–2661. [Google Scholar] [CrossRef]
- Iervolino, I.; Galasso, C.; Paolucci, R.; Pacor, F. Engineering ground motion record selection in the ITalian ACcelerometric Archive. Bull. Earthq. Eng. 2011, 9, 1761–1778. [Google Scholar] [CrossRef]
- C.E.N. Eurocode 8: Design Provisions for Earthquake Resistance of Structures, Part 1.1: General Rules, Seismic Actions and Rules for Buildings; European Committee for Standardization: Brussels, Belgium, 2003. [Google Scholar]
- Luzi, L.; Hailemikael, S.; Bindi, D.; Pacor, F.; Mele, F.; Sabetta, F. ITACA (ITalian ACcelerometric Archive): A web portal for the dissemination of Italian strong-motion data. Seismol. Res. Lett. 2008, 79, 716–722. [Google Scholar] [CrossRef]
- Stucchi, M.; Akinci, A.; Faccioli, E.; Gasperini, P.; Malagnini, L.; Meletti, C.; Montaldo, V.; Valensise, G. Redazione della Mappa di Pericolosità Sismica prevista dall’Ordinanza PC del 20 marzo 2003, n. 3274, All. 1 Rapporto Conclusivo; Istituto Nazionale di Geofisica e Vulcanologia (INGV): Rome, Italy, 2004. [Google Scholar]
- Seed, H.B.; Sun, J.H. Implication of Site Effects in the Mexico City Earthquake of September 19, 1985 for Earthquake-Resistant Design Criteria in the San Francisco Bay Area of California; Report No. UCB/ EERC-89/03; Earthquake Engineering Research Center: Berkeley, CA, USA, 1989. [Google Scholar]
- Candela, M.; Viggiani, C. The effects of the Irpinia earthquake in the ancient centre of Avellino, Italy. In Proceedings of the International Symposium of IAEG, Athens, Greece, 19–23 September 1988; Volume 3: Earthquakes, Vibrations and Other Hazards in Relation to the Study and the Protection of Monuments and Historical Sites Athens, Greece. Marinos, P.G., Koukis, G.C., Eds.; 1988. [Google Scholar]


| Slight Damage (SLD) | Moderate to Heavy Damage (MHD) | Very Heavy Damage to Collapse (VHDC) |
|---|---|---|
| No structural damage Slight non-structural damage Capillary cracks | Slight to moderate structural damage Cracks with breadth and frequency in walls increasing from moderate to heavy level Isolate collapse of non-structural elements | Heavy and very heavy structural damage Partial and total collapse |
| Site Code | Local Name | Heritage Typology | Latitude (N) | Longitude (E) | Century of First Building | Damage Level |
|---|---|---|---|---|---|---|
| M01 | Duomo | Cathedral | 40.915295 | 14.797219 | XII | VHDC |
| M02 | Chiesa e Convento di S. Maria delle Grazie | Church and Convent | 40.920927 | 14.795772 | XVI | MHD |
| M03 | Chiesa del S.S. Rosario | Church | 40.913279 | 14.787485 | XX | MHD |
| M04 | Chiesa di S. Francesco Saverio | Church | 40.916301 | 14.795762 | XVIII | MHD |
| M05 | Torre dell’Orologio | Clock Tower | 40.915034 | 14.79597 | XVII | VHDC |
| M06 | Palazzo de Conciliis | Palace | 40.915392 | 14.798211 | XVIII | MHD |
| M07 | Chiesa di S. Maria di Costantinopoli | Church | 40.914128 | 14.797541 | XVI | VHDC |
| M08 | Chiesa di S. Antonio Abate | Church | 40.913221 | 14.795846 | XVI | VHDC |
| M09 | Palazzo Balestrieri | Palace | 40.915345 | 14.795645 | XIX | MHD |
| M10 | Palazzo Festa | Palace | 40.915497 | 14.796319 | XVII | MHD |
| M11 | Palazzo Greco | Palace | 40.915301 | 14.796331 | XVI–XVII | MHD |
| M12 | Chiesa di Santa Maria del Carmine | Church | 40.913997 | 14.794816 | XV, no longer existing | VHDC |
| M13 | Chiesa del Gesù Sacramentato | Church | 40.915075 | 14.793691 | XVIII | MHD |
| M14 | Chiesa di Santa Maria del Rifugio | Church | 40.914127 | 14.7942 | XVII | MHD |
| ag [g] | F0 | Tc [s] |
|---|---|---|
| 0.197 | 2.371 | 0.368 |
| N | Epicentral Area | Origin-Time (mm/dd/yyyy; hh:mm) | Latitude | Longitude | Depth (km) | Mw | Station Code | Epicentral Distance (km) |
|---|---|---|---|---|---|---|---|---|
| 1 | Norcia (PG) | 10/30/16 6:40 | 42.8322 | 13.1107 | 9.2 | 6.5 | ACC.HGE | 18.6 |
| 2 | Visso (MC) | 10/26/16 19:18 | 42.9087 | 13.1288 | 7.5 | 5.9 | CLO.HGN | 10.8 |
| 3 | Norcia (PG) | 10/30/16 6:40 | 42.8322 | 13.1107 | 9.2 | 6.5 | MMO.HGE | 19.2 |
| 4 | Norcia (PG) | 10/30/16 6:40 | 42.8322 | 13.1107 | 9.2 | 6.5 | MMO.HGN | 19.2 |
| 5 | Castelsantangelo sul Nera (MC) | 10/26/16 17:10 | 42.8747 | 13.1243 | 8.1 | 5.4 | T1212.HNE | 15.2 |
| 6 | Norcia (PG) | 10/30/16 6:40 | 42.8322 | 13.1107 | 9.2 | 6.5 | T1212.HNE | 10.5 |
| 7 | Castelsantangelo sul Nera (MC) | 10/26/16 17:10 | 42.8747 | 13.1243 | 8.1 | 5.4 | T1212.HNN | 15.2 |
| Lithotype | S wave Velocity (m/s) | Density (kg/m3) | Poisson Ratio | G/G0 and D/D0 Curves |
|---|---|---|---|---|
| P | 180 | 1500 | 0.4 | Piroclastic_CMS_Ischia* |
| Tcf | 635 | 2000 | 0.35 | Tuff_CMS_Ischia* |
| Ta | 475 | 1500 | 0.4 | Tuff_CMS_Ischia* |
| SsPl | 300 | 1800 | 0.35 | [57] |
| A | 825 | 1900 | 0.35 | Average Rock |
Publisher’s Note: MDPI stays neutral with regard to jurisdictional claims in published maps and institutional affiliations. |
© 2020 by the authors. Licensee MDPI, Basel, Switzerland. This article is an open access article distributed under the terms and conditions of the Creative Commons Attribution (CC BY) license (http://creativecommons.org/licenses/by/4.0/).
Share and Cite
Nardone, L.; Gizzi, F.T.; Maresca, R. Ground Response and Historical Buildings in Avellino (Campania, Southern Italy): Clues from a Retrospective View Concerning the 1980 Irpinia-Basilicata Earthquake. Geosciences 2020, 10, 503. https://0-doi-org.brum.beds.ac.uk/10.3390/geosciences10120503
Nardone L, Gizzi FT, Maresca R. Ground Response and Historical Buildings in Avellino (Campania, Southern Italy): Clues from a Retrospective View Concerning the 1980 Irpinia-Basilicata Earthquake. Geosciences. 2020; 10(12):503. https://0-doi-org.brum.beds.ac.uk/10.3390/geosciences10120503
Chicago/Turabian StyleNardone, Lucia, Fabrizio Terenzio Gizzi, and Rosalba Maresca. 2020. "Ground Response and Historical Buildings in Avellino (Campania, Southern Italy): Clues from a Retrospective View Concerning the 1980 Irpinia-Basilicata Earthquake" Geosciences 10, no. 12: 503. https://0-doi-org.brum.beds.ac.uk/10.3390/geosciences10120503