Testing the Environmental Seismic Intensity Scale on Data Derived from the Earthquakes of 1626, 1759, 1819, and 1904 in Fennoscandia, Northern Europe


Abstract
:
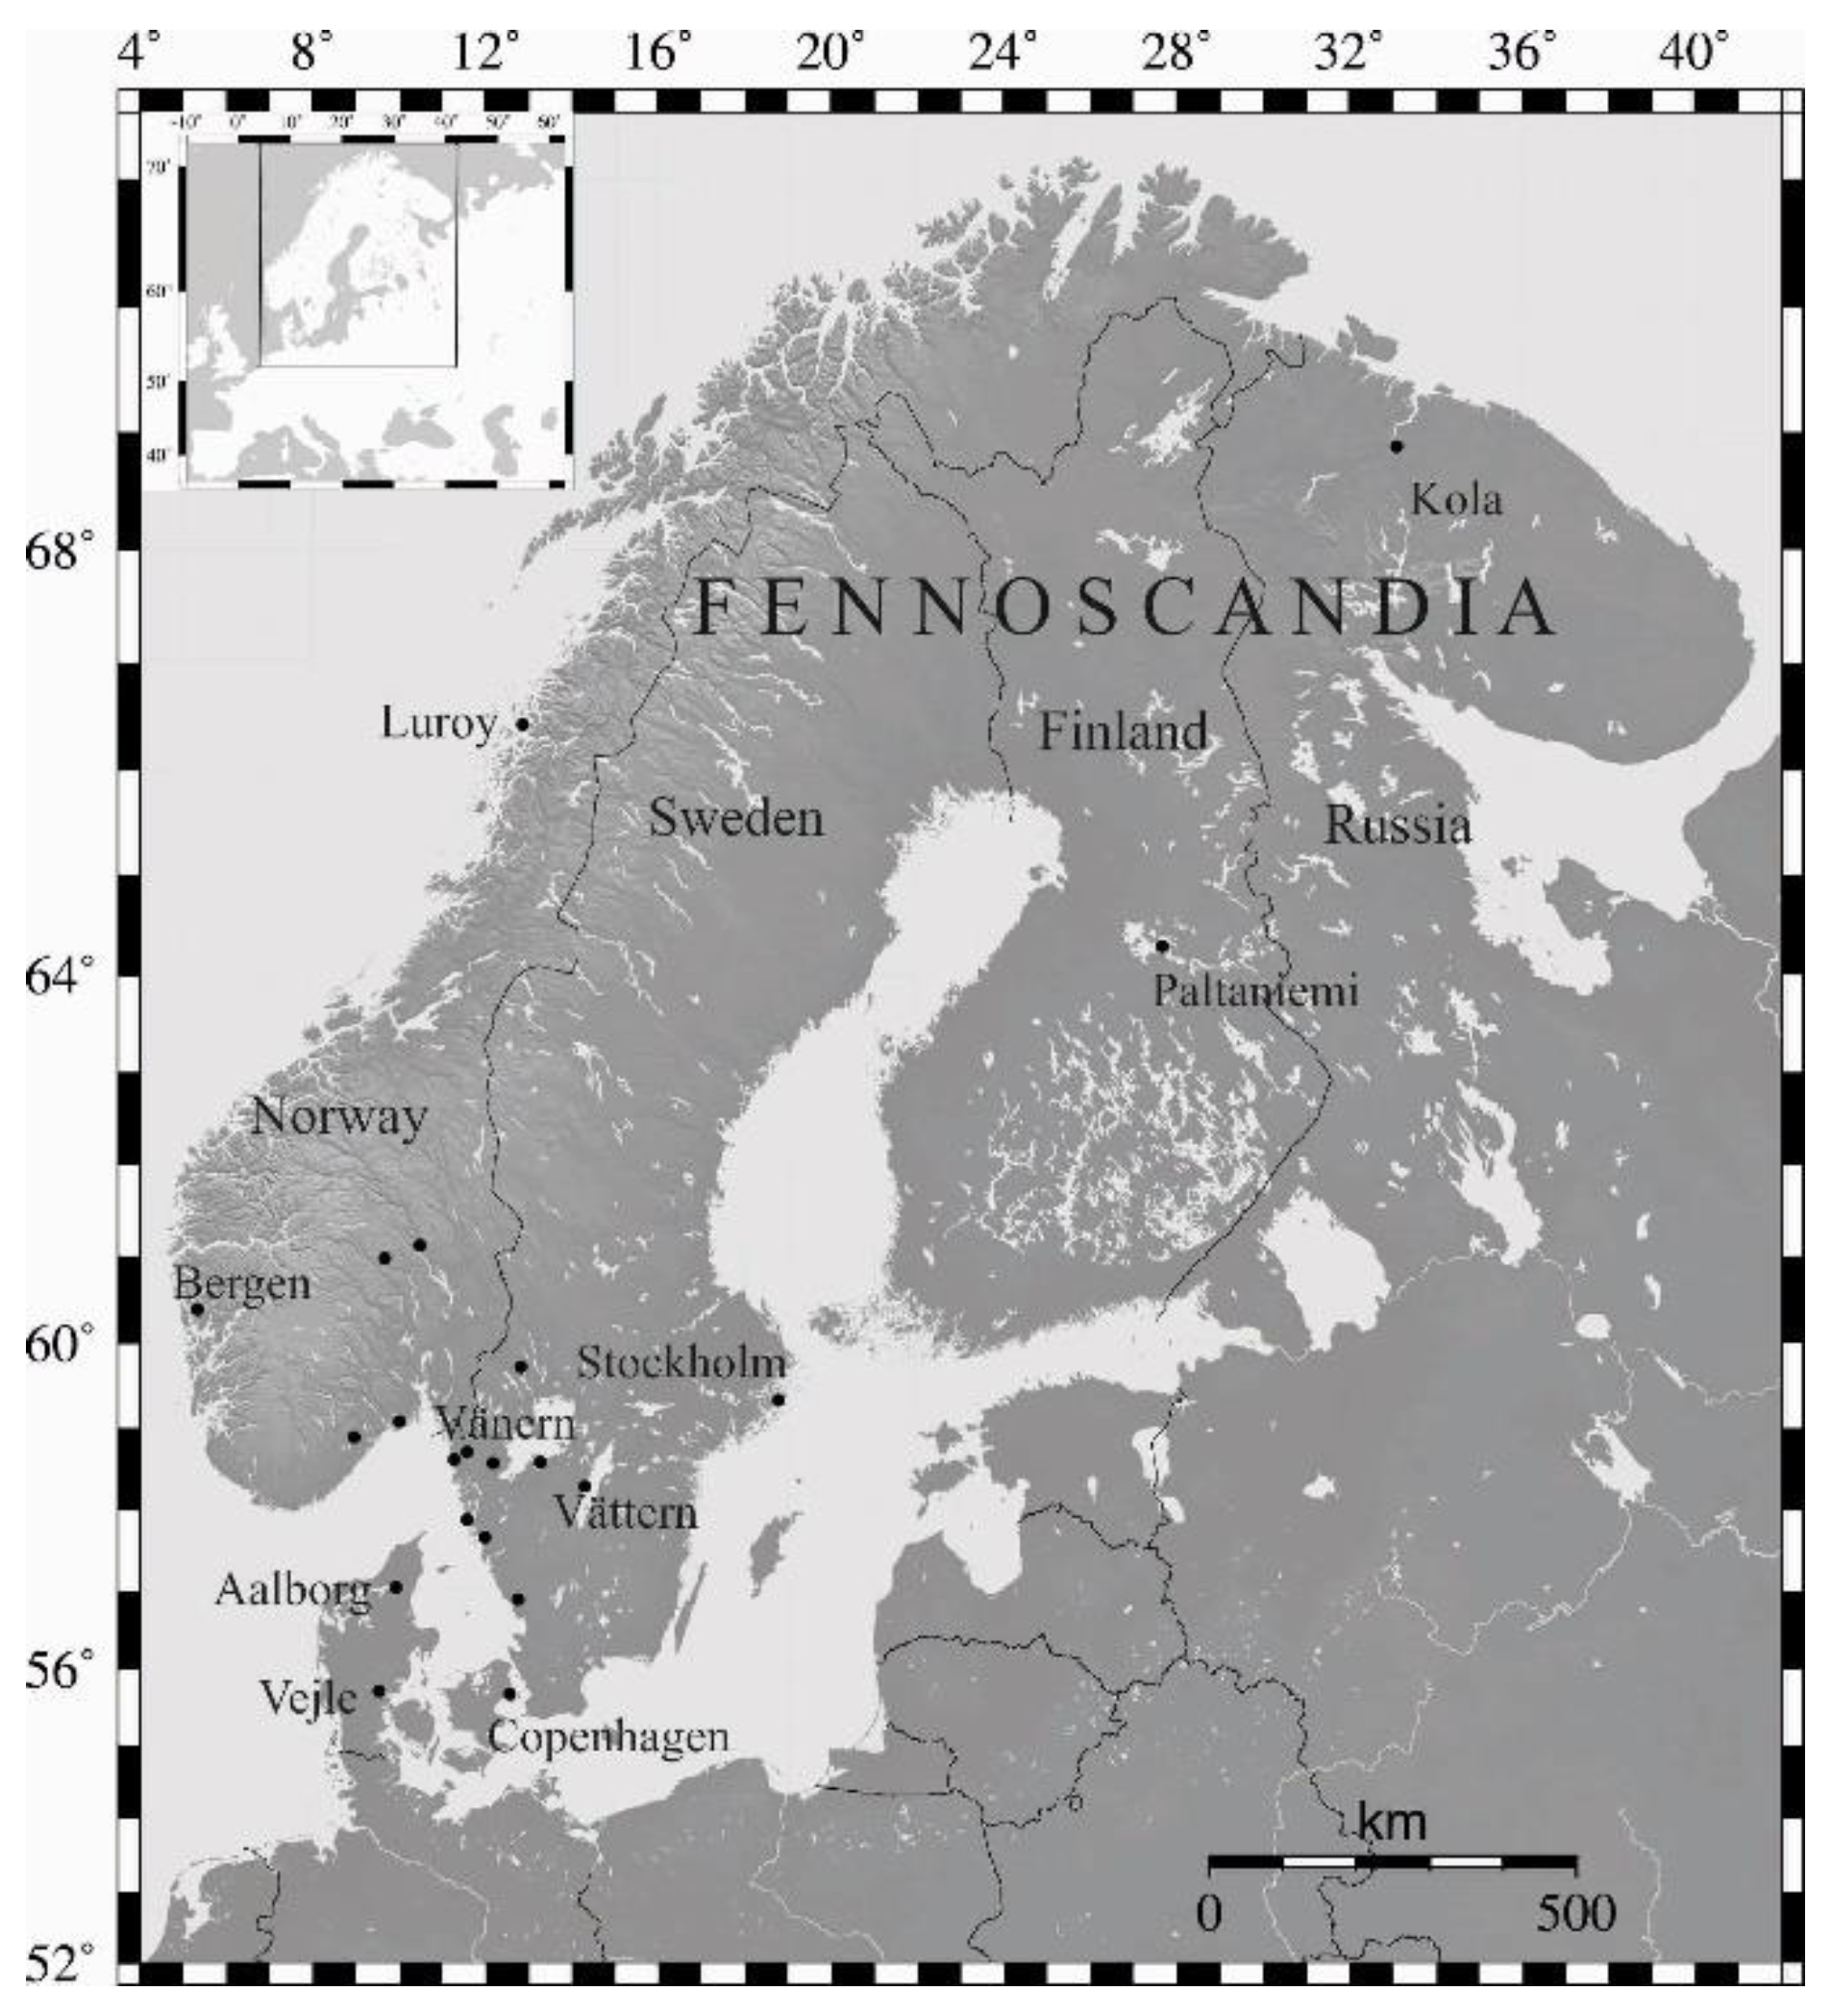
1. Introduction
2. Compilation of EEE Data
2.1. Earthquake Activity in North-Eastern Fennoscandia in the Spring of 1626
2.2. The Kattegat Earthquake of 1759
2.3. The Lurøy, Norway, Earthquake of 1819
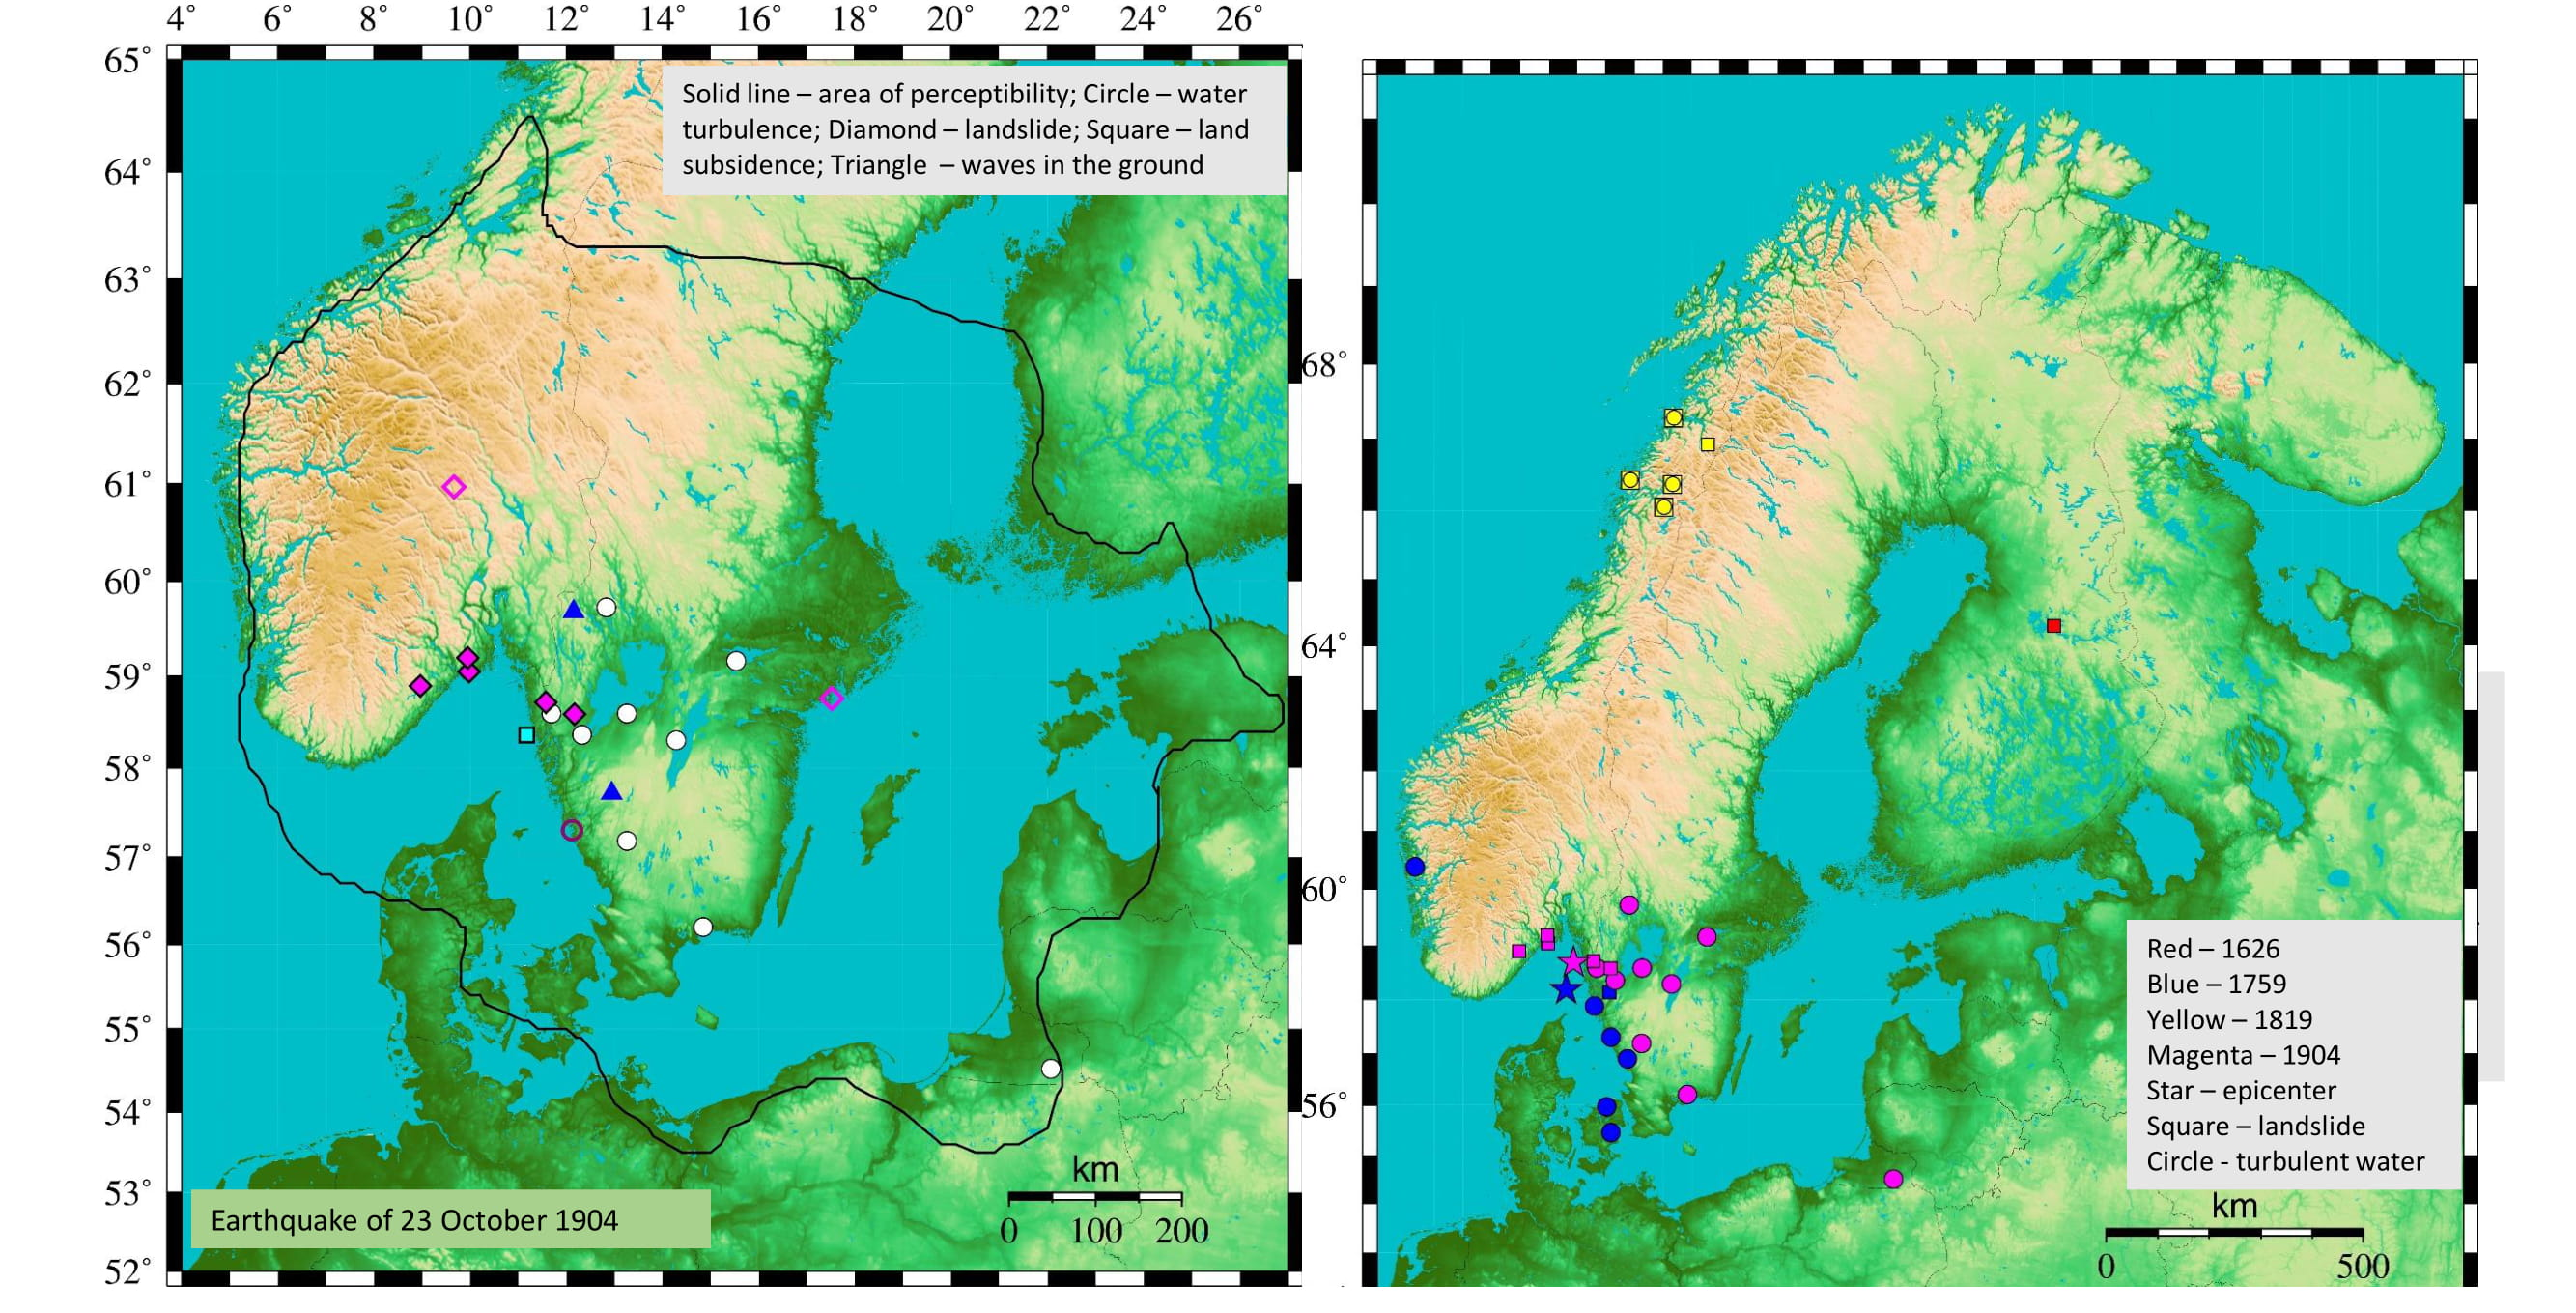
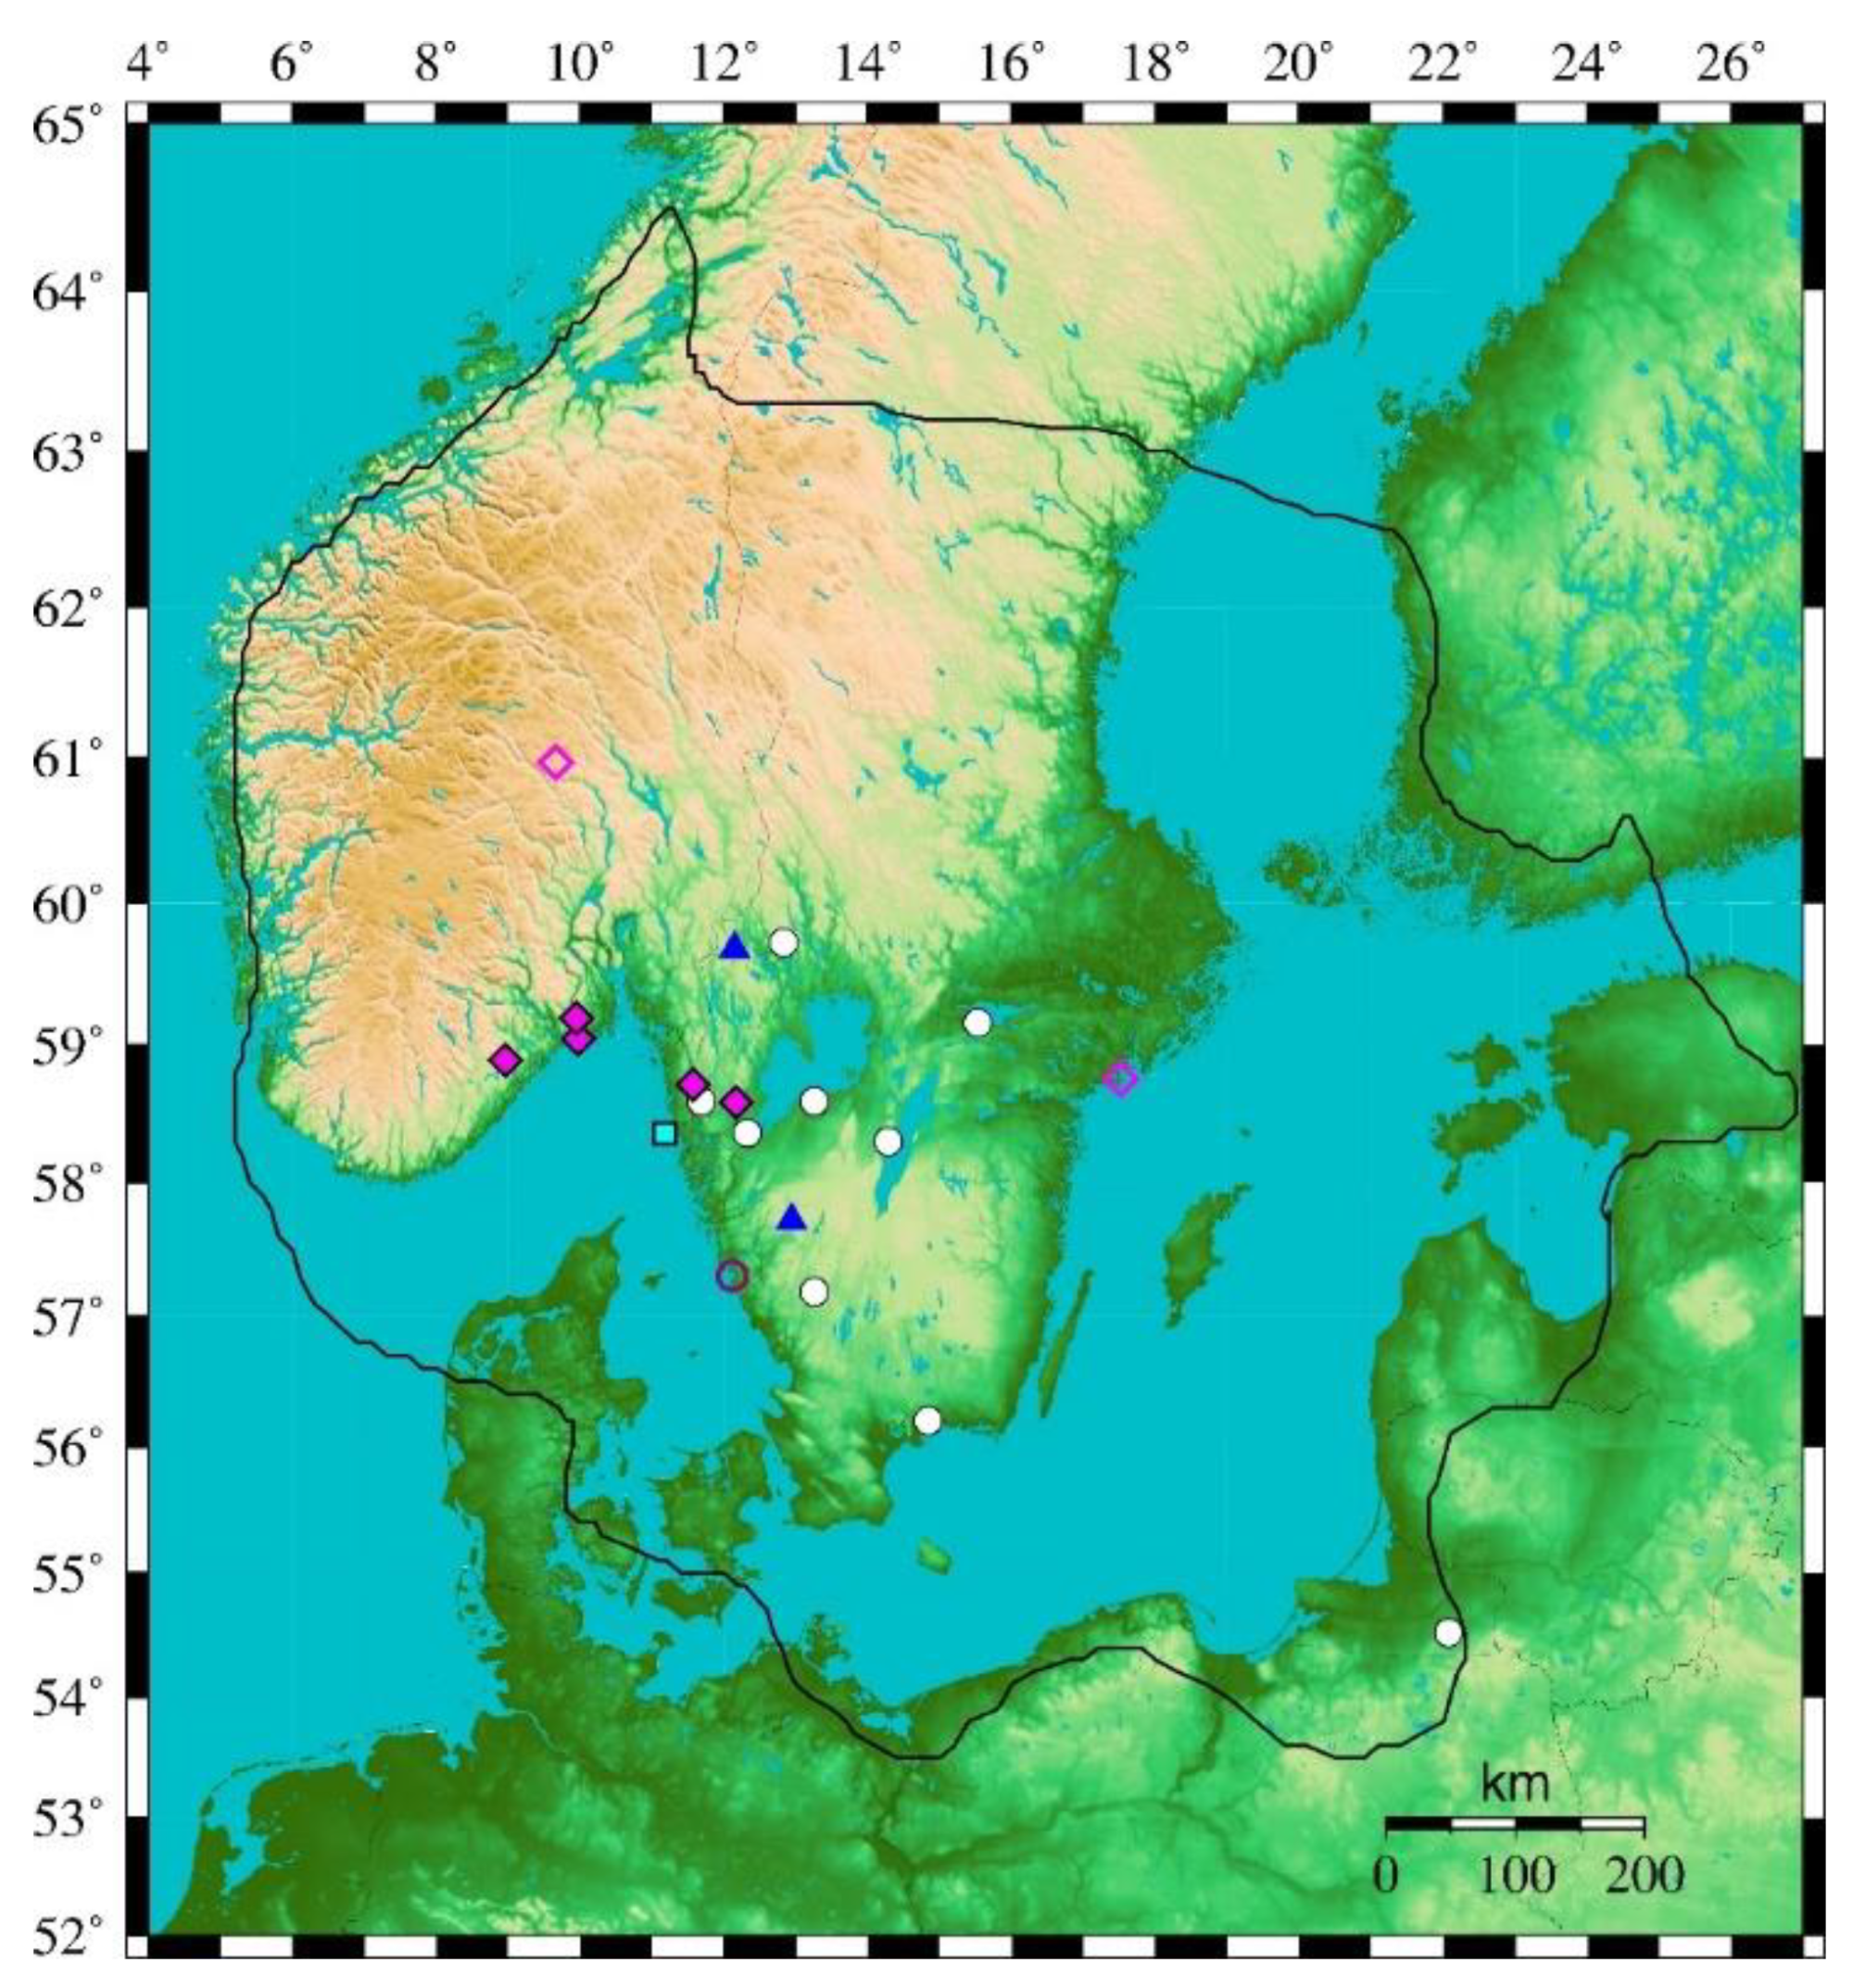
2.4. The Oslofjord Earthquake of 1904
3. Assessment of ESIs and Comparison to EMS-98 Intensities
4. Discussion
5. Conclusions
Author Contributions
Funding
Institutional Review Board Statement
Informed Consent Statement
Data Availability Statement
Acknowledgments
Conflicts of Interest
References
- Aki, K.; Lee, W.H.K. Glossary of interest to earthquake and engineering seismologists. In International Handbook of Earthquake Engineering & Seismology; Lee, W.H.K., Kanamori, H., Jennings, P.C., Kisslinger, C., Eds.; Academic Press: San Diego, CA, USA, 2003; Part B, Appendix 1; pp. 1793–1856. [Google Scholar]
- Eisinger, U.R.; Gutdeutsch, R.; Hammerl, C. Historical earthquake research–An example of interdisciplinary cooperation between geophysicists and historians. In Historical Earthquakes in Central Europe; Gutdeutsch, R., Grünthal, G., Musson, R.M.W., Eds.; Abhandlungen der Geologischen Bundesanstalt: Vienna, Austria, 1992; Volume 1, pp. 33–50. [Google Scholar]
- Musson, R.M.W. Intensity assignments from historical earthquake data: Issues of certainty and quality. Ann. Geofis. 1998, 41, 79–91. [Google Scholar]
- Michetti, A.M.; Esposito, E.; Guerrieri, L.; Porfido, S.; Serva, L.; Tatevossian, R.; Vittori, E.; Audemard, F.; Azuma, T.; Clague, J.; et al. Intensity Scale ESI 2007. Mem. Descr. Carta Geol. D’Italia 2007, 74, 7–54. [Google Scholar]
- Serva, L.; Vittori, E.; Comerci, V.; Esposito, E.; Guerrieri, L.; Michetti, A.M.; Mohammadioun, B.; Mohammadioun, G.C.; Porfido, S.; Tatevossian, R.E. Earthquake hazard and the Environmental Seismic Intensity (ESI) scale. Pure Appl. Geophys. 2016, 173, 1479–1515. [Google Scholar] [CrossRef]
- Serva, L. History of the Environmental Seismic Intensity Scale ESI-07. Geosciences 2019, 9, 210. [Google Scholar] [CrossRef] [Green Version]
- Mäntyniemi, P. Macroseismology in Finland from the 1730s to the 2000s. Part 1: History of the macroseismic questionnaire. Geophysica 2017, 52, 3–21. [Google Scholar]
- Muir Wood, R.; Woo, G.; Bungum, H. The history of earthquakes in the northern North Sea. In Historical Seismograms and Earthquakes of the World; Lee, W.H.K., Meyers, H., Shimazaki, K., Eds.; Academic Press: San Diego, CA, USA, 1988; pp. 297–306. [Google Scholar]
- Svedmark, E. Organisation för systematiska iakttagelser af jordskalf inom Sverige. Geol. Fören. Stockholm Förhandl. 1889, 11, 77–80. [Google Scholar] [CrossRef]
- Muir Wood, R.; Woo, G. The Historical Seismicity of the Norwegian Continental Shelf; Earthquake Loading on the Norwegian Continental Shelf (ELOCS) Report 2-1; Norwegian Geotechnical Institute: Oslo, Norway; NORSAR: Kjeller, Norway; Principia Mechanica Ltd.: London, UK, 1987. [Google Scholar]
- Grünthal, G. (Ed.) European Macroseismic Scale 1998; Cahiers du Centre Européen de Géodynamique et de Séismologie 15, Conseil de l’Europe: Luxembourg, 1998. [Google Scholar]
- Ambraseys, N.N. The seismicity of western Scandinavia. Earthq. Eng. Struct. Dyn. 1985, 13, 361–399. [Google Scholar] [CrossRef]
- Mäntyniemi, P. Town of Tornio in November 1898: A rare survey of earthquake damage in Finland. J. Seismol. 2007, 11, 177–185. [Google Scholar] [CrossRef]
- Haga, T.S. Jordskjelv Som utløser Massebevegelser i Norge og Stabilitetsanalyse av Preikestolen med Seismisk Last. MSc Thesis, University of Bergen, Bergen, Norway, November 2019. [Google Scholar]
- Guerrieri, L. The EEE Catalogue: A global catalogue of Earthquake Environmental Effects. Quat. Int. 2012, 279, 179–180. [Google Scholar] [CrossRef]
- EEE Catalog. Available online: http://193.206.192.211/wfd/eee_catalog/viewer.php (accessed on 19 November 2020).
- Tatevossian, R.E.; Mäntyniemi, P.; Tatevossian, T.N. On the earthquakes in the Northern Baltic Shield in the spring of 1626. Nat. Hazards 2011, 57, 133–150. [Google Scholar] [CrossRef]
- Muir Wood, R. The Scandinavian earthquakes of 22 December 1759 and 31 August 1819. Disasters 1988, 12, 223–236. [Google Scholar] [CrossRef] [PubMed]
- Bondesen, E.; Wohlert, I. Høy Ædle Hr. Biskop. Præsteindberetninger om jordskælvet den 21–22 December 1759; Institut for Miljø, Teknologi og Samfund. Roskilde Universitetscenter og Roskilde Museums Forlag: Roskilde, Denmark, 1999; pp. 57–261. [Google Scholar]
- Unknown author. Fra Kiøbenhavn, den 24 Dec. Kiøbenhanske Danske Post-Tidender, 24 December 1759; pp. 2–3. [Google Scholar]
- Unknown author. Utdrag af Kongl. Vetenskaps Academiens Dagbok, samt några inkomna Bref och Berättelser. Kungliga Vetenskapsakademiens Handlingar, January–March 1760; pp. 70–71. [Google Scholar]
- Ahlelöf, J. Bref. Götheborgska Magasinet, 26 January 1760; pp. 59–61. [Google Scholar]
- Gothenius, J. Utdrag ur bref, rörande jordbäfningen. Götheborgska Magasinet, 5 January 1760; pp. 7–8. [Google Scholar]
- Unknown author. Kiøbenhavn, den 22 Feb. Kiøbenhanske Danske Post-Tidender, 22 February 1760; p. 2. [Google Scholar]
- Unknown author. Kiøbenhavn, den 31 Dec. Kiøbenhanske Danske Post-Tidender, 31 December 1759; p. 3. [Google Scholar]
- Unknown author. Stockholm, 31te Dec. Kiøbenhanske Danske Post-Tidender, 7 January 1760; pp. 1–2. [Google Scholar]
- Holmberg, A.E. Bohusläns Historia och Beskrifning. II Allmän Beskrifning; G.G. Malmgren: Uddevalla, Sweden, 1843; Available online: http://hdl.handle.net/2077/52241 (accessed on 14 September 2020).
- Geological Survey of Sweden, Landslides. Available online: https://www.sgu.se/samhallsplanering/risker/skred-och-ras/stora-skred-i-sverige (accessed on 11 May 2020).
- Mäntyniemi, P.B.; Sørensen, M.B.; Tatevossian, T.N.; Tatevossian, R.E.; Lund, B. A reappraisal of the Lurøy, Norway, earthquake of 31 August 1819. Seismol. Res. Lett. 2020, 91, 2462–2472. [Google Scholar] [CrossRef]
- Bungum, H.; Pettenati, F.; Schweitzer, J.; Sirovich, L.; Faleide, J.I. The 23 October 1904 Ms5.4 Oslofjord earthquake: Reanalysis based on macroseismic and instrumental data. Bull. Seismol. Soc. Am. 2009, 99, 2836–2854. [Google Scholar] [CrossRef]
- Svedmark, E. Jordskalfvet den 23 oktober 1904. Sveriges Geol. Und. Årsbok 1908, 2, 29–124. [Google Scholar]
- Doss, B. Das skandinavische Erdbeben vom 23. Oktober 1904 in seinen Wirkungen innerhalb der russischen Ostseeprovinzen und des Gouvernements Kowno. Korrespondenzblatt des Naturforscher-Vereins zu Riga 1905, 38, 249–301. [Google Scholar]
- Kolderup, C.F. Norges jordskælv med særlig hensyn til deres utbderselse i rum og tid. Bergen. Mus. Aarb. 1913, 8, 1–152. [Google Scholar]
- Unknown author. Det märkliga jordskalfvet. Nya meddelanden. Hade jordskalfvet sin härd i Värmland? Arvika Tidning, 28 October 1904; p. 3. [Google Scholar]
- Unknown author. Ett häftigt jordskalf. Elfsborgs Läns Tidning, 25 October 1904; p. 2. [Google Scholar]
- Unknown author. Det stora jordskalfvet. En efterskörd. Engelholms Tidning, 25 October 1904; p. 2. [Google Scholar]
- Unknown author. En häftig jordskakning. Hallandsposten, 24 October 1904; p. 3. [Google Scholar]
- Unknown author. Hjo. Jordskalfvet i söndags. Hjo Tidning, 28 October 1904; p. 2. [Google Scholar]
- Brøgger, W.C. Jordskjælvet den 23de Oktober 1904. Aftenposten, 24 October 1904; pp. 1–2. [Google Scholar]
- Unknown author. Jordskalfvet. Halland, 25 October 1904; p. 2. [Google Scholar]
- Unknown author. En märklig följd. Karlshamns Allehanda, 27 October 1904; p. 2. [Google Scholar]
- Unknown author. Gumbinej, 2. Novemberi. Dranghtês-Laikkas, 8 November 1904; p. 2. [Google Scholar]
- Landslide database of The Norwegian Water Resources and Energy Directorate. Available online: http://www.skrednett.no (accessed on 2 November 2020).
- Kolderup, C.F. Jordskjælvet den 23. Oktober 1904. Bergens Mus. Aarbok 1905, 1, 172. [Google Scholar]
- Unknown author. Bergsskred. Uddevalla-Tidningen, 5 December 1904; p. 3. [Google Scholar]
- Unknown author. Jordskred. Uddevalla-Tidningen, 4 November 1904; p. 3. [Google Scholar]
- Unknown author. Jordskalfvets värkan. Norra Bohuslän, 12 November 1904; p. 2. [Google Scholar]
- Delgado, J.; Garrido, J.; López-Casado, C.; Martino, S.; Peláez, J.A. On far field occurrence of seismically induced landslides. Eng. Geol. 2011, 123, 204–213. [Google Scholar] [CrossRef]
- Jibson, R.W.; Harp, E.L. Extraordinary distance limits of landslides triggered by the 2011 Mineral, Virginia, earthquake. Bull. Seismol. Soc. Am. 2012, 102, 2368–2377. [Google Scholar] [CrossRef]
- De Capell Broke, A. Travels through Sweden, Norway, and Finmark, to the North Cape; Rodwell and Martin: London, UK, 1823; pp. 262–263. [Google Scholar]
- Unknown author. Untitled letter. Den Norske Rigstidende, 10 December 1819; p. 1. [Google Scholar]
- Heltzen, I.A. Ranens Beskrivelse 1834; Rana Museums-og historielag: Mo i Rana, Norway, 1981. [Google Scholar]
- Keilhau, B.M. Efterretninger om Jordskjælv i Norge. Mag. Nat. 1836, 2, 82–165. [Google Scholar]
- Aasvik, K. Norges kraftigste jordskjelv. In Lurøyboka–85, Årbok for Lurøy; Lofotboka: Værøy, Norway, 1985; pp. 39–41. [Google Scholar]
- Sommerfelt, S.C. Saltdalens Præstegaard, den 31te Aug. Den Norske Rigstidende, 15 October 1819; p. 1. [Google Scholar]
- Unknown author. Karlshamn, Ett starkt jordskalf. Karlshamns Allehanda, 25 October 1904; p. 2. [Google Scholar]
- Unknown author. Efterskörd från jordskalfvet. Sydsvenska Dagbladet, 26 October 1904; p. 3. [Google Scholar]
- Unknown author. Jordskalf. Öfver hela Skandinavien. Kyrkor och byggnader skadade. Panik i kyrkorna. Strömstads Tidning, 26 October 1904; p. 3. [Google Scholar]
- Unknown author. Jordskalfvet. Sydsvenska Dagbladet, 25 October 1904; p. 2. [Google Scholar]
- Unknown author. S.I.T. Jordskred. Sörmlandsposten, 2 November 1904; p. 3. [Google Scholar]
- Messerschmidt, D.G. Forschungsreise durch Sibirien 1720–1727: 3. Tagebuchaufzeichnungen Mai 1724-Februar 1725; Akademie-Verlag: Berlin, Germany, 1966; pp. 254–255. [Google Scholar]
- Unknown author. Maanjäristystä Wirolahdellakin. Koitar, 22 February 1900; p. 3. [Google Scholar]
- Parshad, R.; Kumar, P.; Snehmani; Srivastava, P.K. Seismically induced snow avalanches at Nubra-Shyok region of Western Himalaya, India. Nat. Hazards 2019, 99, 843–855. [Google Scholar] [CrossRef]


| Country | Locality (Coordinates) Distance from the Epicenter | Excerpt or Summary of the Written Documentation [Reference no.] | ESI | EMS-98 |
|---|---|---|---|---|
| 1626 | ||||
| Finland | Paltaniemi (27.664, 64.293) unknown | The slopes of Lake Oulujärvi collapsed [17]. Largely observed, damage to a wooden church [17]. | IV | IV |
| 1759 | ||||
| Denmark | Frederiksværk (12.019, 55.969) 260 km | Strongly felt in the water [19]. The tremor was so strong that, in some places, objects fell, doors swung open, not that strong in every place, but anyway with large movement and crashing sound [19]. | V | V |
| Køge (12.18, 55.456) 320 km | A fisherman observed unusual water movement [19]. Pieces of furniture moved rather strongly [19]. | IV | IV–V | |
| Sweden | Frillesås (57.303, 12.182) 137 km | Two persons in a boat had great difficulty in coping with the sudden strong waves [22]. The whole house shook, with doors and windows; the reporter felt dizzy in the head from the tremor [22]. | V | V |
| Halland (12.744, 56.888) 194 km | The sea and waves were seen to make an unusual roar and rose in a similar way as on 1 November 1755 [21]. Much stronger in Halland (than in Stockholm), strong shaking and jolts in houses, houses seemed to swing and rise, and be on the verge of collapse, doors swung open, loose pieces of furniture were shifted back and forth or fell over, but no particular damage was sustained at any place [21]. | V | V–VI | |
| Hjärtum (12.126, 58.145) 90 km | Large landslips occurred along the banks of the entire Göta River. It was seen how the frozen river sprang up and threw pieces of ice high in the air [27]. The size of this landslide was given as 11 ha [28]. It was reported that the earthquake was very strong in the region (Bohuslän). Doors swung open, loose pieces of furniture moved back and forth, or fell over [21]. | VI | V–VI | |
| Marstrand (11.589, 57.886) 67 km | Unusual roar of the sea and sea waves were reported [21]. The walls of the fortress have been inspected, but no cracks were found. In the bigger houses, both glasses and china clattered. In some places, glasses fell over. People were awakened [23]. | IV | IV–V | |
| Norway | Bergen (5.33, 60.389) 385 km | Turbulent water bubbling and swirling was seen together with ground shaking, although the weather was calm [24]. Houses shook [24]. | V | IV–V |
| 1819 | ||||
| Norway | Bodö (Hundholm) (14.38, 67.28) 115 km (distance from Lurøy) | Very severely felt. Some farms and several rocks were thrown down, the crest of one of which, overhanging the sea, was greatly shattered. The captain of a small vessel off Hundholm received so great a shock that he instantly let fall both his anchors, and prepared to warp off, thinking the ship had run aground [50]. | VI–VII | VII–VIII |
| Hemnes (Hemnäs) (14.03, 66.05) 67 km | The ground was trembling extremely strongly for 4 min, such that one thought, that the windows would fall in; the milk was splashing out of the troughs; in some places, the chimneys were damaged. Stor-Elven [river] was agitated as in the strongest storm. In several places, the water was seen both in the rivers and in Ransfjorden rising up as a fountain and accompanied by waves common for the strongest storm, though there was no wind in the air. During the earthquake, which was felt in the night before 1 September, a field of barrel seed sank into the deep at the farm Storstrand by Ransfjorden; later it fell piece for piece, such that 200 “alen” (a traditional Scandinavian unit of distance, about 60 cm) of the man’s farmed land has fallen away, thereby creating a drop (orig. Leerfald) of 30 ”alen” in height, and it is not further than 4 “alen” from his dwelling, which is why the village was rapidly summoned and helped him move the houses of the farm. The first field that had sunken and transitioned to water came up again during a smaller ground shaking some days later. The beach front is filled with clay, creating a long, pointy headland [51]. At the farm Storstrand, in the Hemnæs district, this earthquake was devastating. The farmhouses were located on a large hill, and at the foot of this hill there was a non-negligible plain farmed with potatoes. During the earthquake, this plain dropped off together with the western part of the hill on which the houses stood. A very large 30–40 fathom (“favn,” 1 favn = 1.8288 m) drop was created in the mentioned hill and the plain below stood under water. The bank of the fjord, which was deep enough for the largest boats, was filled with gravel such that it was difficult to reach land. One neighbor had to, with the help of some people, move his farm [52]. | VII | VII–VIII | |
| Lurøy (12.86, 66.43) | Not only the houses were shaking, but also the surrounding mountains, from which large rocks fell down, such that they were surrounded by much rock dust, as if they were surrounded by fog. Several springs, arising from the foot of the mountains, became unclear, as if they were mixed with milk, and their water was until on the third day undrinkable, even for the animals. The water had a smell of Sulphur, which was noticed at several places [53]. The houses were shaking. Rocks fell down from Lurøyfjellet in clouds of dust, and the water in the brooks became so cloudy that the farm animals would not drink it for 3 days. That the soil in several places is volcanic seems reasonable based on the frequent earthquakes occurring here, as well as it has been shown that it contains sulfur, which among others can be seen, at a brook at Lurøy farm, springing forth at the foot of Lurøefjeldet, and with a lovely, crystal clear water; during the strong earthquake, which occurred in 1819, for several days it gave a milk-white water, had a strong sulfur taste, and was completely undrinkable [54]. In Lurøe Fjerding and Trænøerne, the earthquake has expressed itself strongly. From the large summits in Trænen, rocks fell, and out at sea and in the sounds rays of water were seen, and many of those who were at sea thought their boats would turn over [52]. | VII–VIII | VIII | |
| Rana commune (Ranen) in Nordland county (14.34, 66.37) 66 km | For a long time, the air had been full of rainy clouds, when finally, after 3 weeks of pouring rain, the sky cleared. The ground shook so violently that the windows shattered against the sun; in many places, the walls supporting the roofs fell down and the hollow roaring sound in the air lasted for 5 min, sounding terrible. In the mountain houses where the farmer had his milk standing on shelves under the roof, it splashed over. One saw on the completely calm Ransfiord rays of water standing high as a mast, and the water rose, even though the sea fell, over its highest flood banks. In some places, very fine sand was spraying up; it seems to have been taken from the intestines of the Earth, since one has been looking for it with no success. The mountains were shaking so strongly that the weathered rock masses on their tops and from their sides fell down with much banging and as a rain of dust against the sun’s rays. The streams were cloudy from clay and soil. The ground shook so strongly that the people, who were out in the field, could not stand, since their knees would not carry them. This scene of horror lasted, as mentioned, for about 5 min, and when it stopped a violent hurricane came from the southeast, which did not last longer than 10 min [52]. | VII–VIII | VIII | |
| Saltdal (15.56, 66.92) 131 km | The house was shaking so strongly, that the windows were rattling, and the floor seemed to have a wavelike motion, when walking across it. The weather was very warm, without clear sunshine, and quiet. It was the first more or less clear day in the last 3 weeks, during which time southwesterly wind and rain had ruled constantly. At the foot of the high mountain above the vicarage is a stream with two springs in the mountain itself. Its water turned completely white with clay, which could not be observed at its banks; this is usually not at all the case, not even during spring flooding. By further investigation, it was found that the water sprang out from the foot of the mountain, which seemed clearly to show how the shaking has worked in the lap of the Earth [55]. A strong rumble from the west-southwest, and the floor was as in a wavelike motion. The water in nearby streams became cloudy from clay, and some old stone walls fell down [54]. | VI | V–VI | |
| Country | Locality (Coordinates) Distance from the Epicenter | Excerpt or Summary of the Written Documentation (Reference no.) | ESI | EMS-98 |
|---|---|---|---|---|
| Sweden | Asarum (14.843, 56.199) 365 km | A dry well was filled up with water after the earthquake [41]. The earthquake was felt differently in different parts of the town (Karlshamn). It was felt most strongly by people indoors in the southern and eastern parts of the town, where small objects shifted and flower-pots by the windows almost fell down in many places. Here and elsewhere, people outdoors felt weak shaking or nothing at all [56]. | IV | IV |
| Bollungen (12.167, 58.590) 76 km | Several larger boulders, almost resembling small hills, got loose and fell from the top of the mountain, which is at least 100 m high, down to the main road by the foot of the mountain, where a particularly large boulder landed, several cubic meters in size [45]. In near-by areas, very strong ground shaking was felt. In houses, pieces of furniture and objects shook so that much was broken; collapsed or partly damaged chimneystacks are seen here and there. Shop owners lost many items. Panic in the church [57]. | VI–VII | VI | |
| Bullaren (11.567, 58.717) 40 km | Steady regular rockfalls of boulders and stones have since (the main shock) been observed. Last night between Saturday and Sunday (29 and 30 October), a large landslide occurred, in which thousands of cubic meters of earth slid from the mountain into the river, blocking it over a distance of 40 to 50 m. The water is rising as this is being written, fast, and has already reached patches of rye field, where it causes damage [46]. Houses shook strongly, here and there a chimneystack collapsed, people run out of houses, many were frightened, houses sustained some nonstructural damage [58]. | VI | VI | |
| Flöghult (11.419, 58.985) 46 km | Trees shook back and forth; in one pond water began to move strongly as if in a storm [31]. Chimneystacks collapsed, walls were cracked, mortar fell. The ground moved in waves so that many persons had difficulty in maintaining their balance [31]. | VII | VII | |
| Gothenburg (11.981, 57.675) 131 km | In the sea, large waves appeared, lifting and pushing boats. Many observations of shaking from boats in the archipelago [31]. Felt everywhere in the town, chandeliers rattled, pendulum clocks stopped, lamps and other objects fell, pieces of furniture shifted, persons fell from the coach to the floor, people ran out of houses, frightened, damage to wallpaper and walls [59]. | VI | VI | |
| Gräbbestad (Grebbestad) (11.254, 58.694) 23 km | Small boats moved strongly up and down on strong incoming waves in the harbor; further out in the open sea strong jolts were felt in boats [31]. Many chimneystacks collapsed completely or partly; many walls cracked [31]. | V–VI | VI | |
| Hjo (14.288, 58.302) 204 km | Water level in Lake Vättern seemed to recede after having rippled for a while. In a steamboat near the harbor pier, it was believed that the boat ran aground [38]. The ground shaking was felt differently in different parts of the town. Not everyone indoors noticed anything unusual, and some of those outdoors did not notice anything at all. Panic in the church and people ran out; a crack appeared in one of the church’s walls. Here and there, pictures fell from the walls, smaller objects fell, mortar fell from the walls in some places, and some walls fell [38]. | V | V–VI | |
| Idala (12.324, 57.379) 169 km | Trees shook violently [31]. Houses shook, so that windowpanes rattled, smaller objects fell, strong crashing of the walls [31]. | V | IV–V | |
| Kville (11.362, 58.569) 32 km | The water in a nearby stream began to move strongly, and bubbles appeared on the surface [31]. Pieces of furniture shook and kind of jumped, pendulum clocks stopped, chimneystacks fell, and stones got loose from walls [31]. | IV–V | V | |
| Lidköping (13.15, 58.498) 134 km | The ground shaking pushed the water of Kinneviken in a strong movement [37]. Parts of chimneys collapsed; panic in the church [37]. | V | VI | |
| Mangskog (12.823, 59.751) 162 km | Large waves suddenly appeared in calm Lake Mangen. A flat-bottom rowboat was close to toppling over because of the waves [34]. Strong ground shaking, many minor cracks appeared in the church walls, panic in the church, the uppermost part of the church steeple, made of wood, shifted towards the east [34]. | VI | V–VI | |
| Resön (11.174, 58.802) 22 km | Water shook in springs so that it became mixed with clay. Strong water movement west of the island. Sailors felt such strong jolts that they thought they had run aground [31]. Strong ground shaking, hanging objects began to swing, objects fell from tables and shelves, chimneystacks fell and broke roof tiles, foundations of walls were cracked, stove pipes broke, etc. In some places, the pipes broke during the first shock, in others during the second one. Outdoors the tremor was so strong that people fell over [31]. | VI | VII | |
| Väddö, Tanum (Veddö) (11.267, 58.620) 25 km | A sandbank with a length of 24 m and a width of 16 m sank and disappeared entirely [31,47]. The earthquake was felt very strongly [47]. | VII | VI–VII | |
| Vänersborg (12.324, 58.365) 92 km | The jolt was felt strongly in boats on Lake Vänern. In one boat, located at a quarter of an hour’s journey from the town, it was thought that the boat had hit a rock. The shaking sent ripples across the water [35]. Strong shaking, many windowpanes of shops were broken [31,35]. | VI | V |
Publisher’s Note: MDPI stays neutral with regard to jurisdictional claims in published maps and institutional affiliations. |
© 2020 by the authors. Licensee MDPI, Basel, Switzerland. This article is an open access article distributed under the terms and conditions of the Creative Commons Attribution (CC BY) license (http://creativecommons.org/licenses/by/4.0/).
Share and Cite
Mäntyniemi, P.; Sørensen, M.B.; Tatevossian, R.E. Testing the Environmental Seismic Intensity Scale on Data Derived from the Earthquakes of 1626, 1759, 1819, and 1904 in Fennoscandia, Northern Europe. Geosciences 2021, 11, 14. https://0-doi-org.brum.beds.ac.uk/10.3390/geosciences11010014
Mäntyniemi P, Sørensen MB, Tatevossian RE. Testing the Environmental Seismic Intensity Scale on Data Derived from the Earthquakes of 1626, 1759, 1819, and 1904 in Fennoscandia, Northern Europe. Geosciences. 2021; 11(1):14. https://0-doi-org.brum.beds.ac.uk/10.3390/geosciences11010014
Chicago/Turabian StyleMäntyniemi, Päivi, Mathilde B. Sørensen, and Ruben E. Tatevossian. 2021. "Testing the Environmental Seismic Intensity Scale on Data Derived from the Earthquakes of 1626, 1759, 1819, and 1904 in Fennoscandia, Northern Europe" Geosciences 11, no. 1: 14. https://0-doi-org.brum.beds.ac.uk/10.3390/geosciences11010014