
Development of a New Type of Geodiversity System for the Scoria Cones of the Chaîne des Puys Based on Geomorphometric Studies


Abstract
:1. Introduction
2. Materials and Methods
2.1. Geodiversity Overview
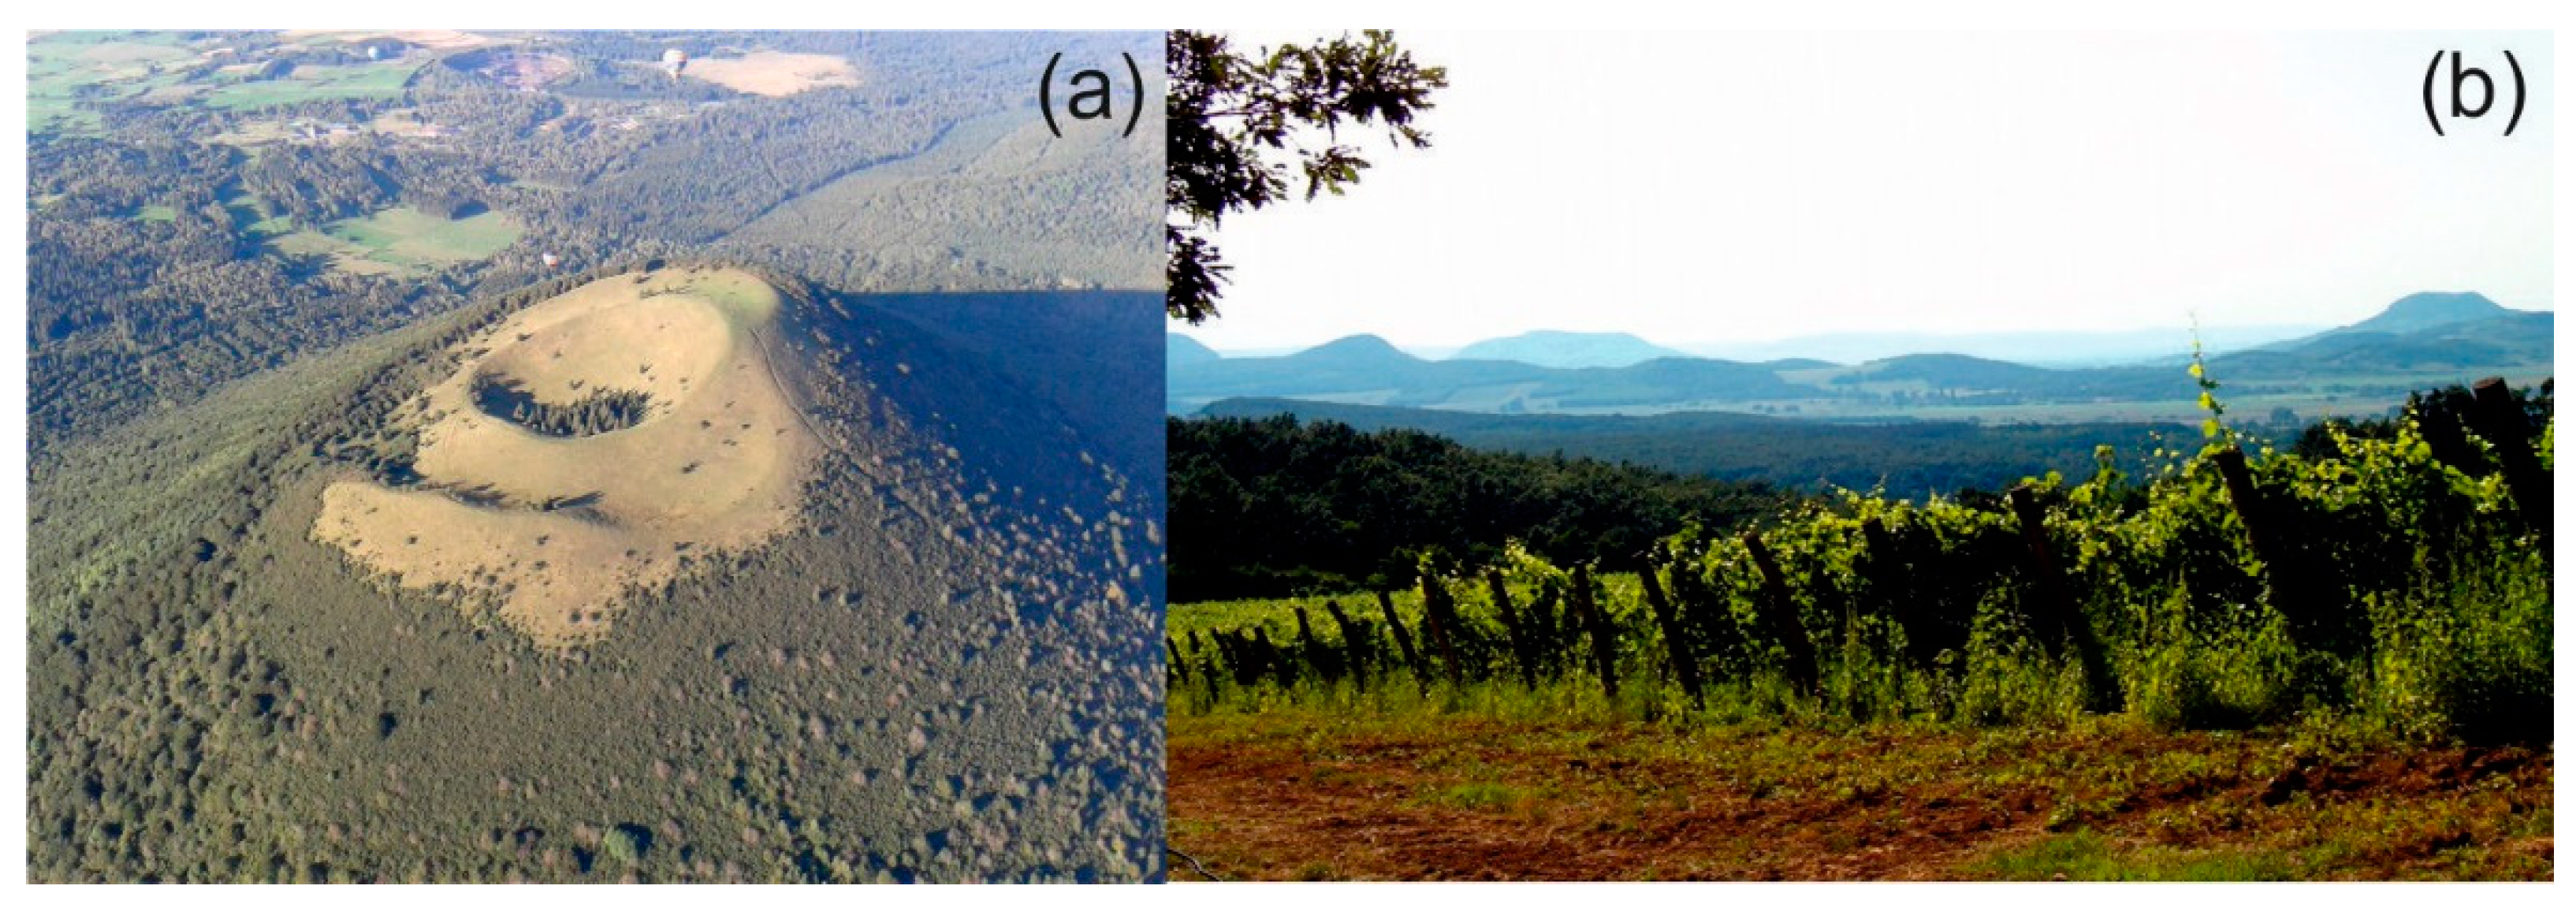
2.2. Scoria Cones and Their Role in the Landscape
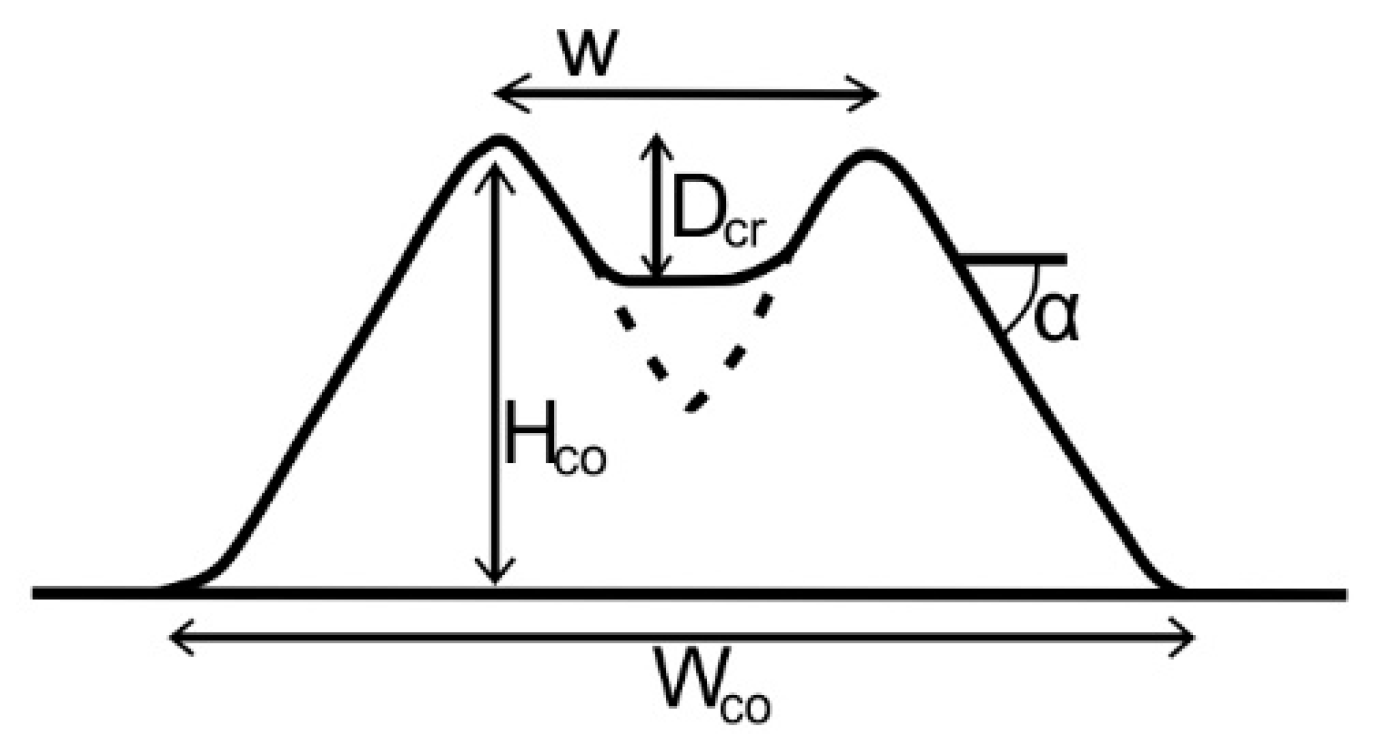
2.3. Previous Geomorphometric Studies on Scoria Cones
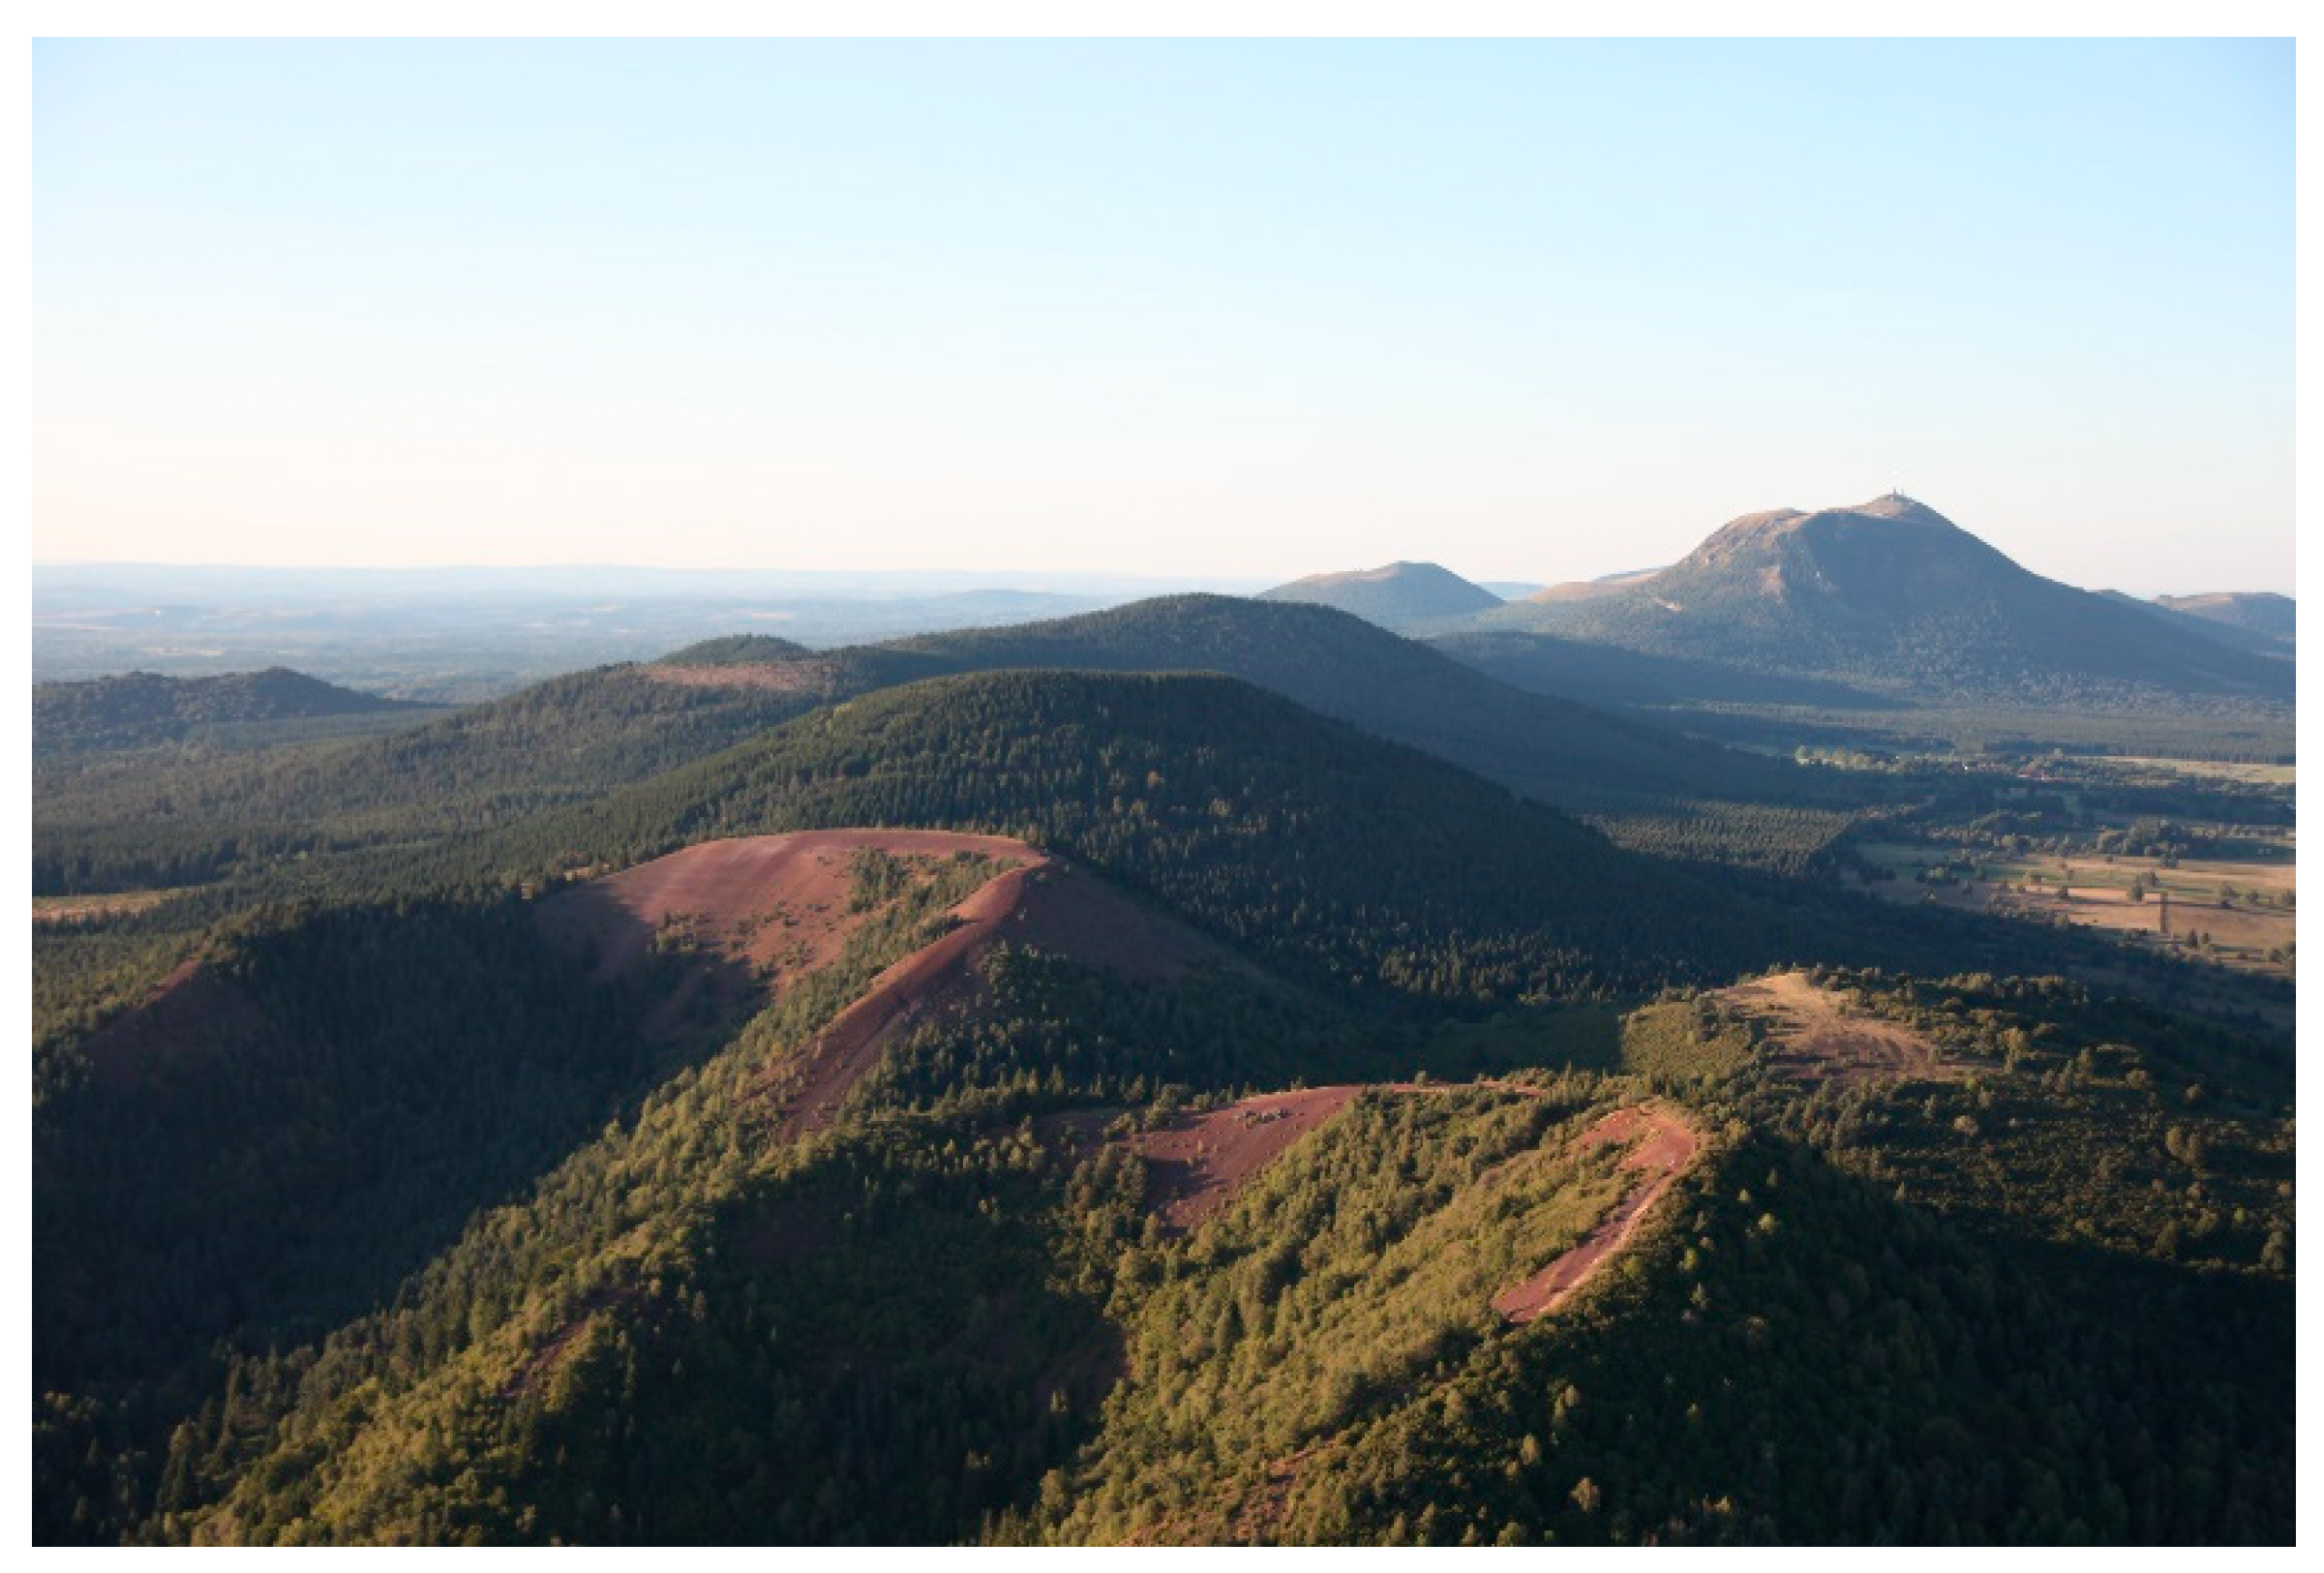
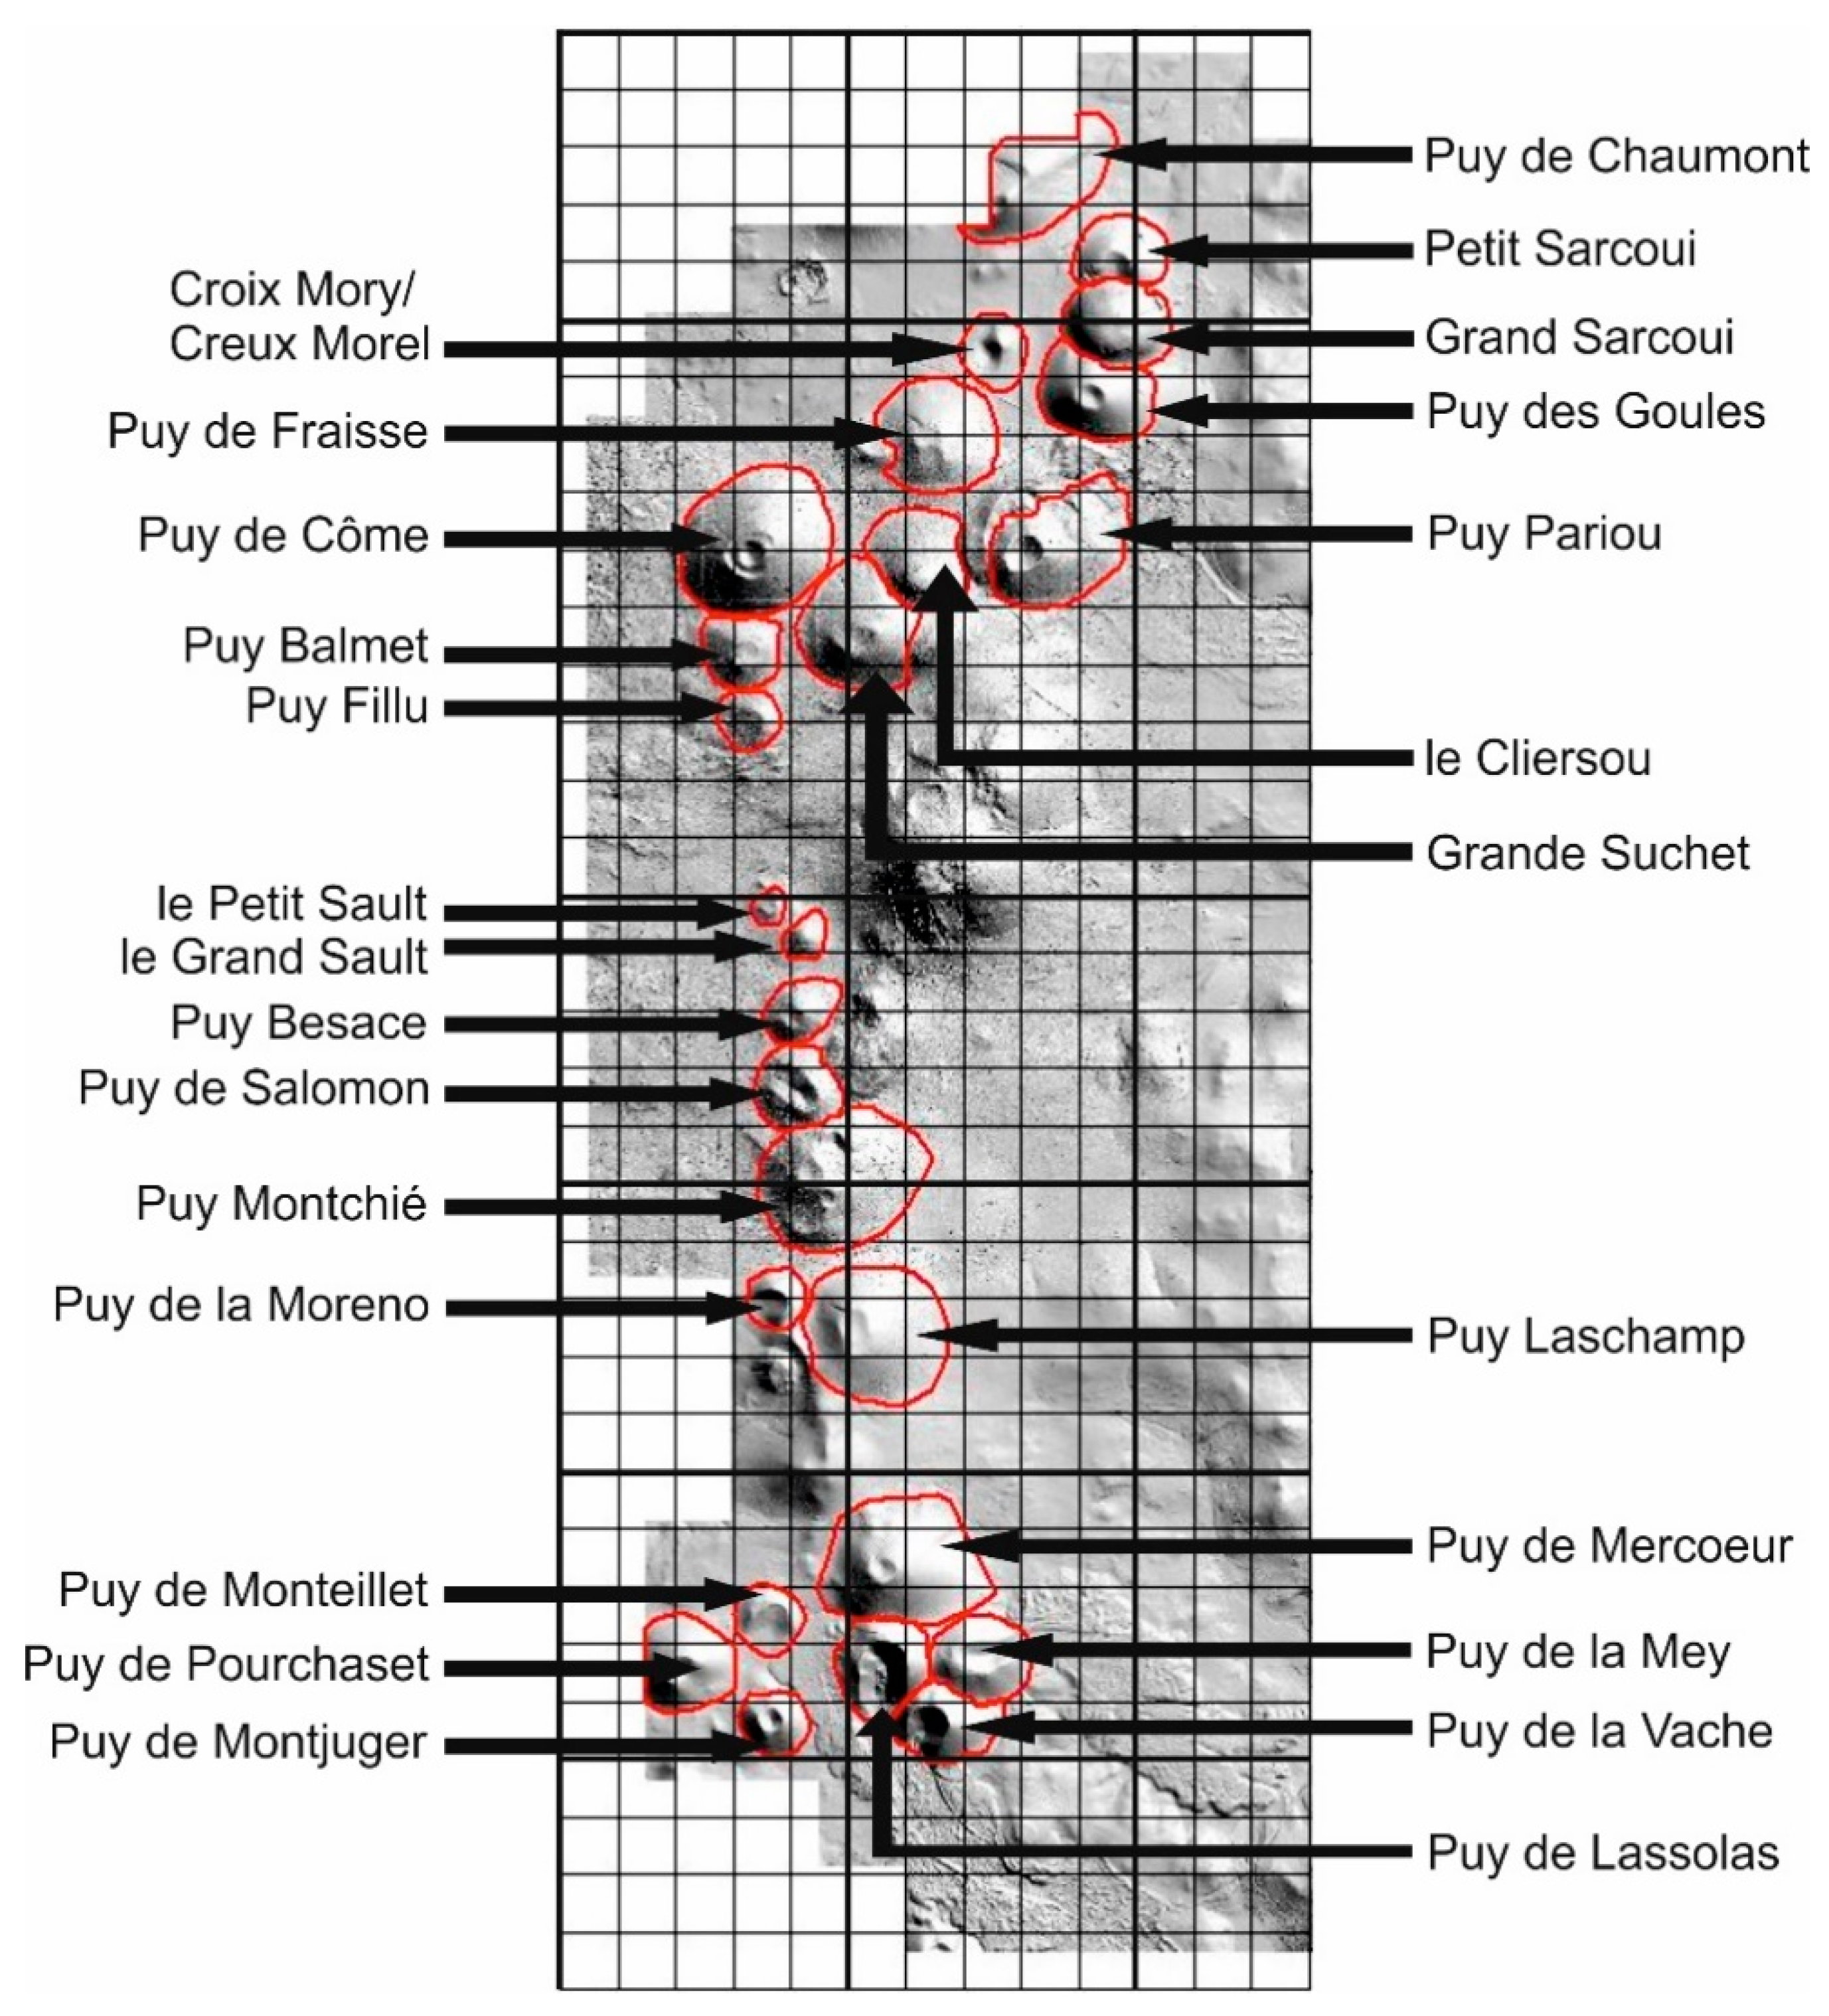
2.4. The Chaîne des Puys
2.5. LiDAR Data
2.6. Calculation of Geodiversity Indices: Traditional Approach
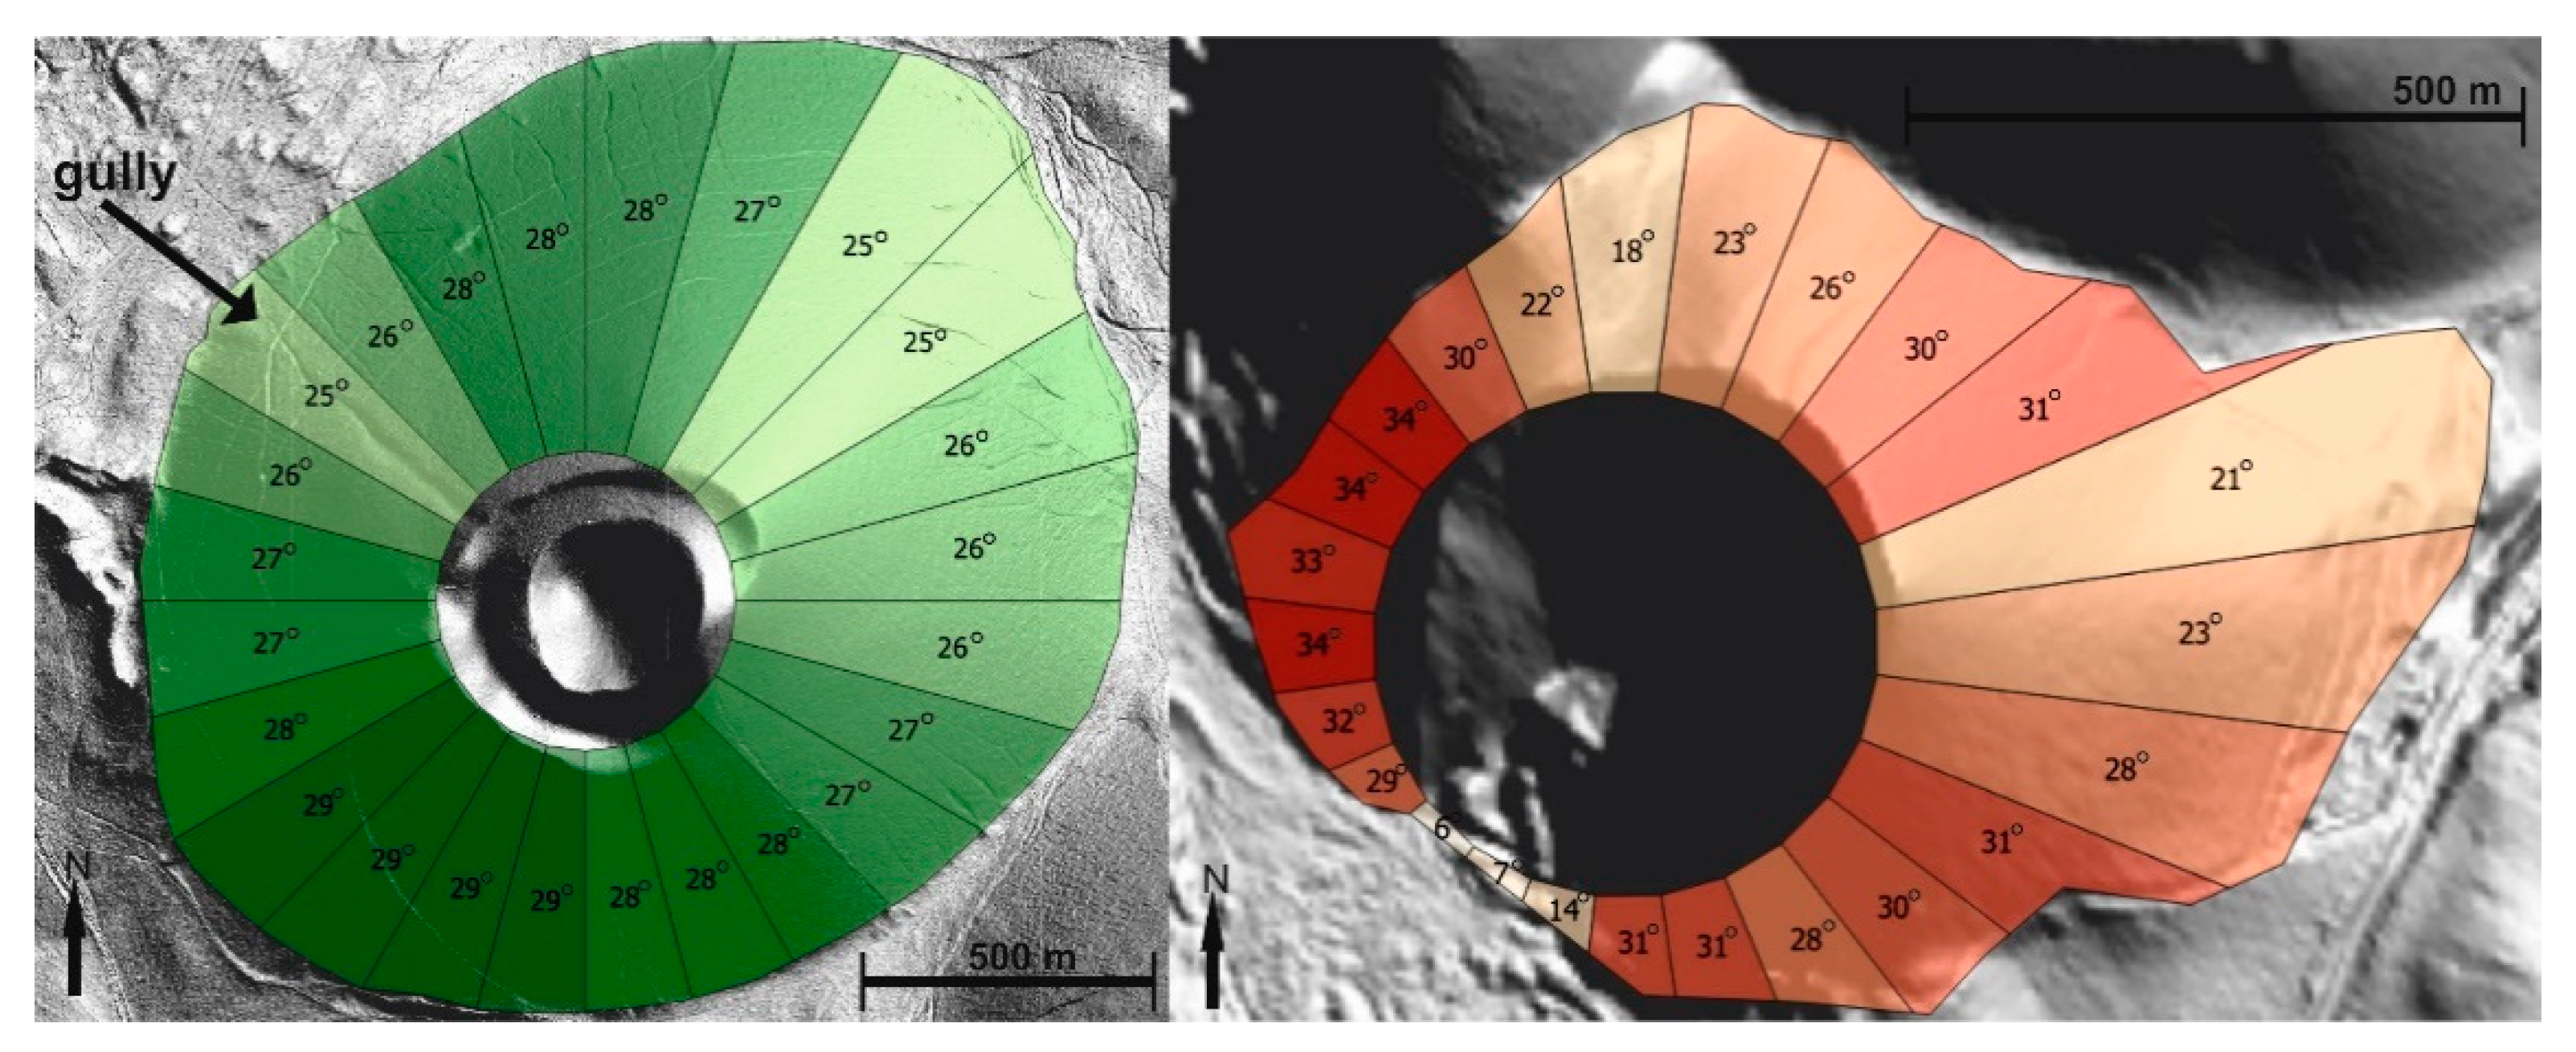
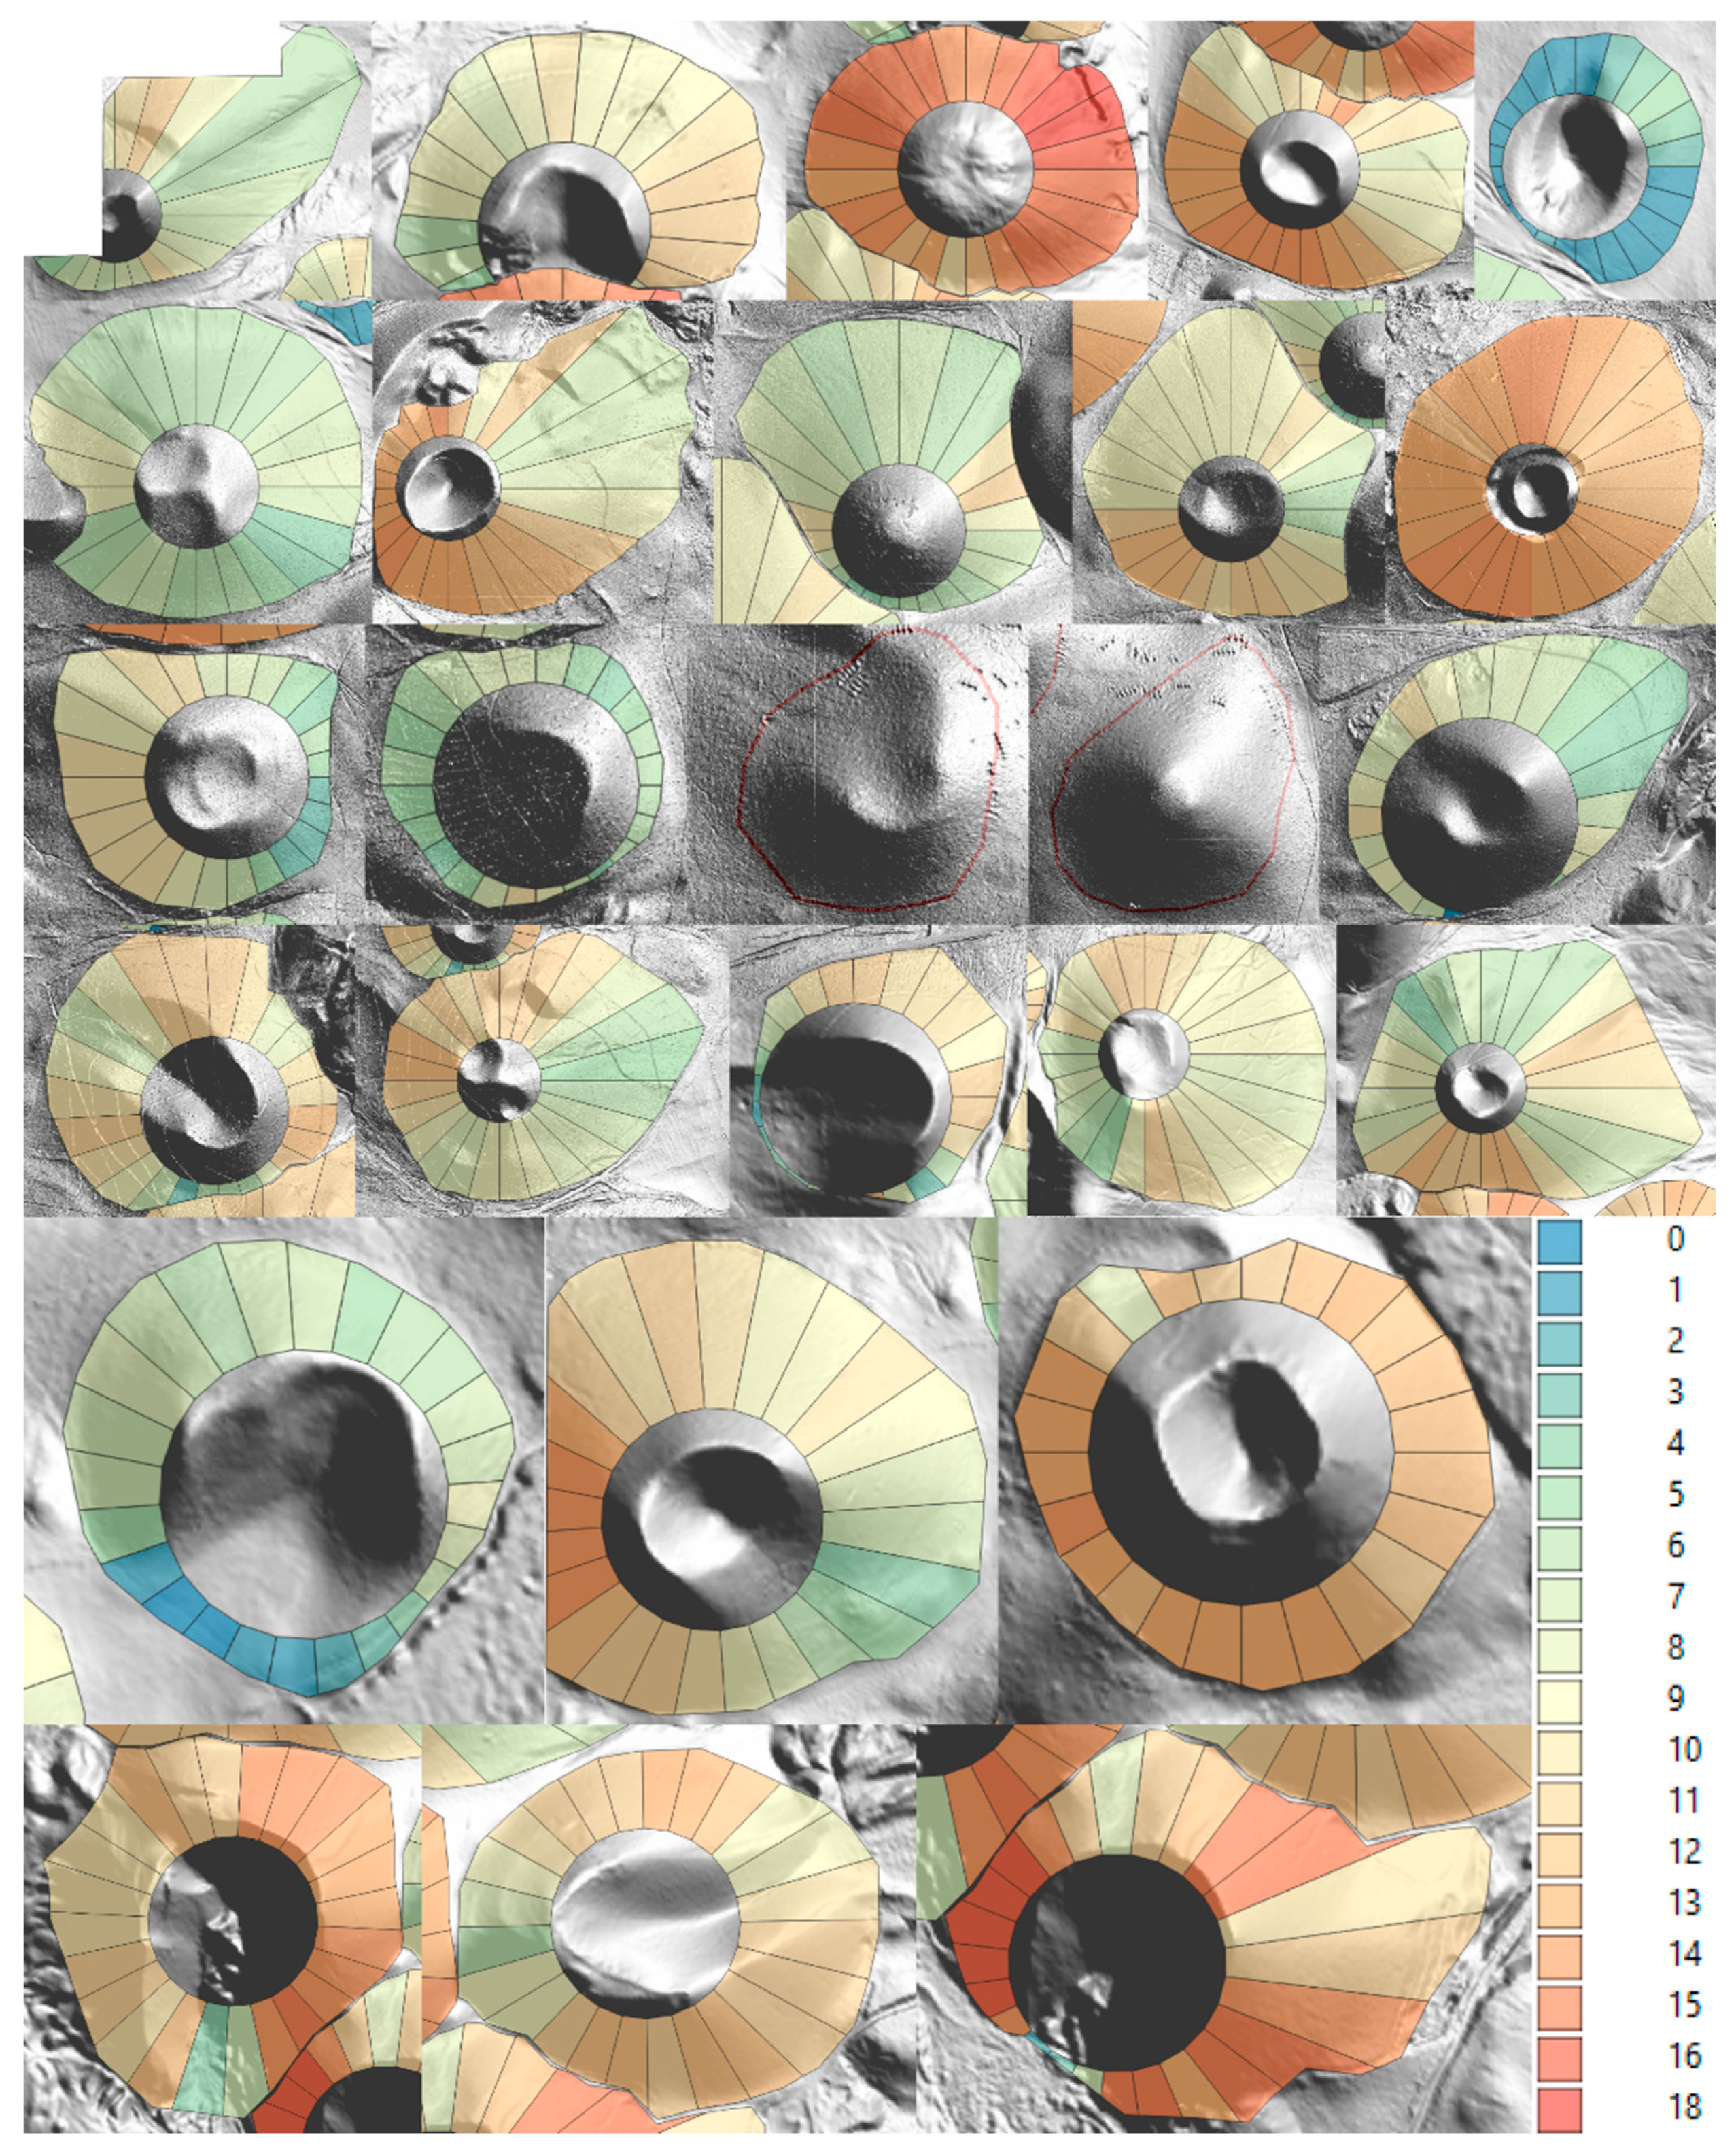
2.7. Input for the Calculation of the Proposed Geodiversity Component: Sectorization
3. Results
4. Discussion
- The subindex for paleontological diversity is obviously zero, as there are no fossils in volcanic rocks (not presented here);
- The geological subindex due to the small-scale base material is mapped as rather uniform for the whole scoria cone (some lava flows may add variability at places), and consequently the geological subindex will also be very low;
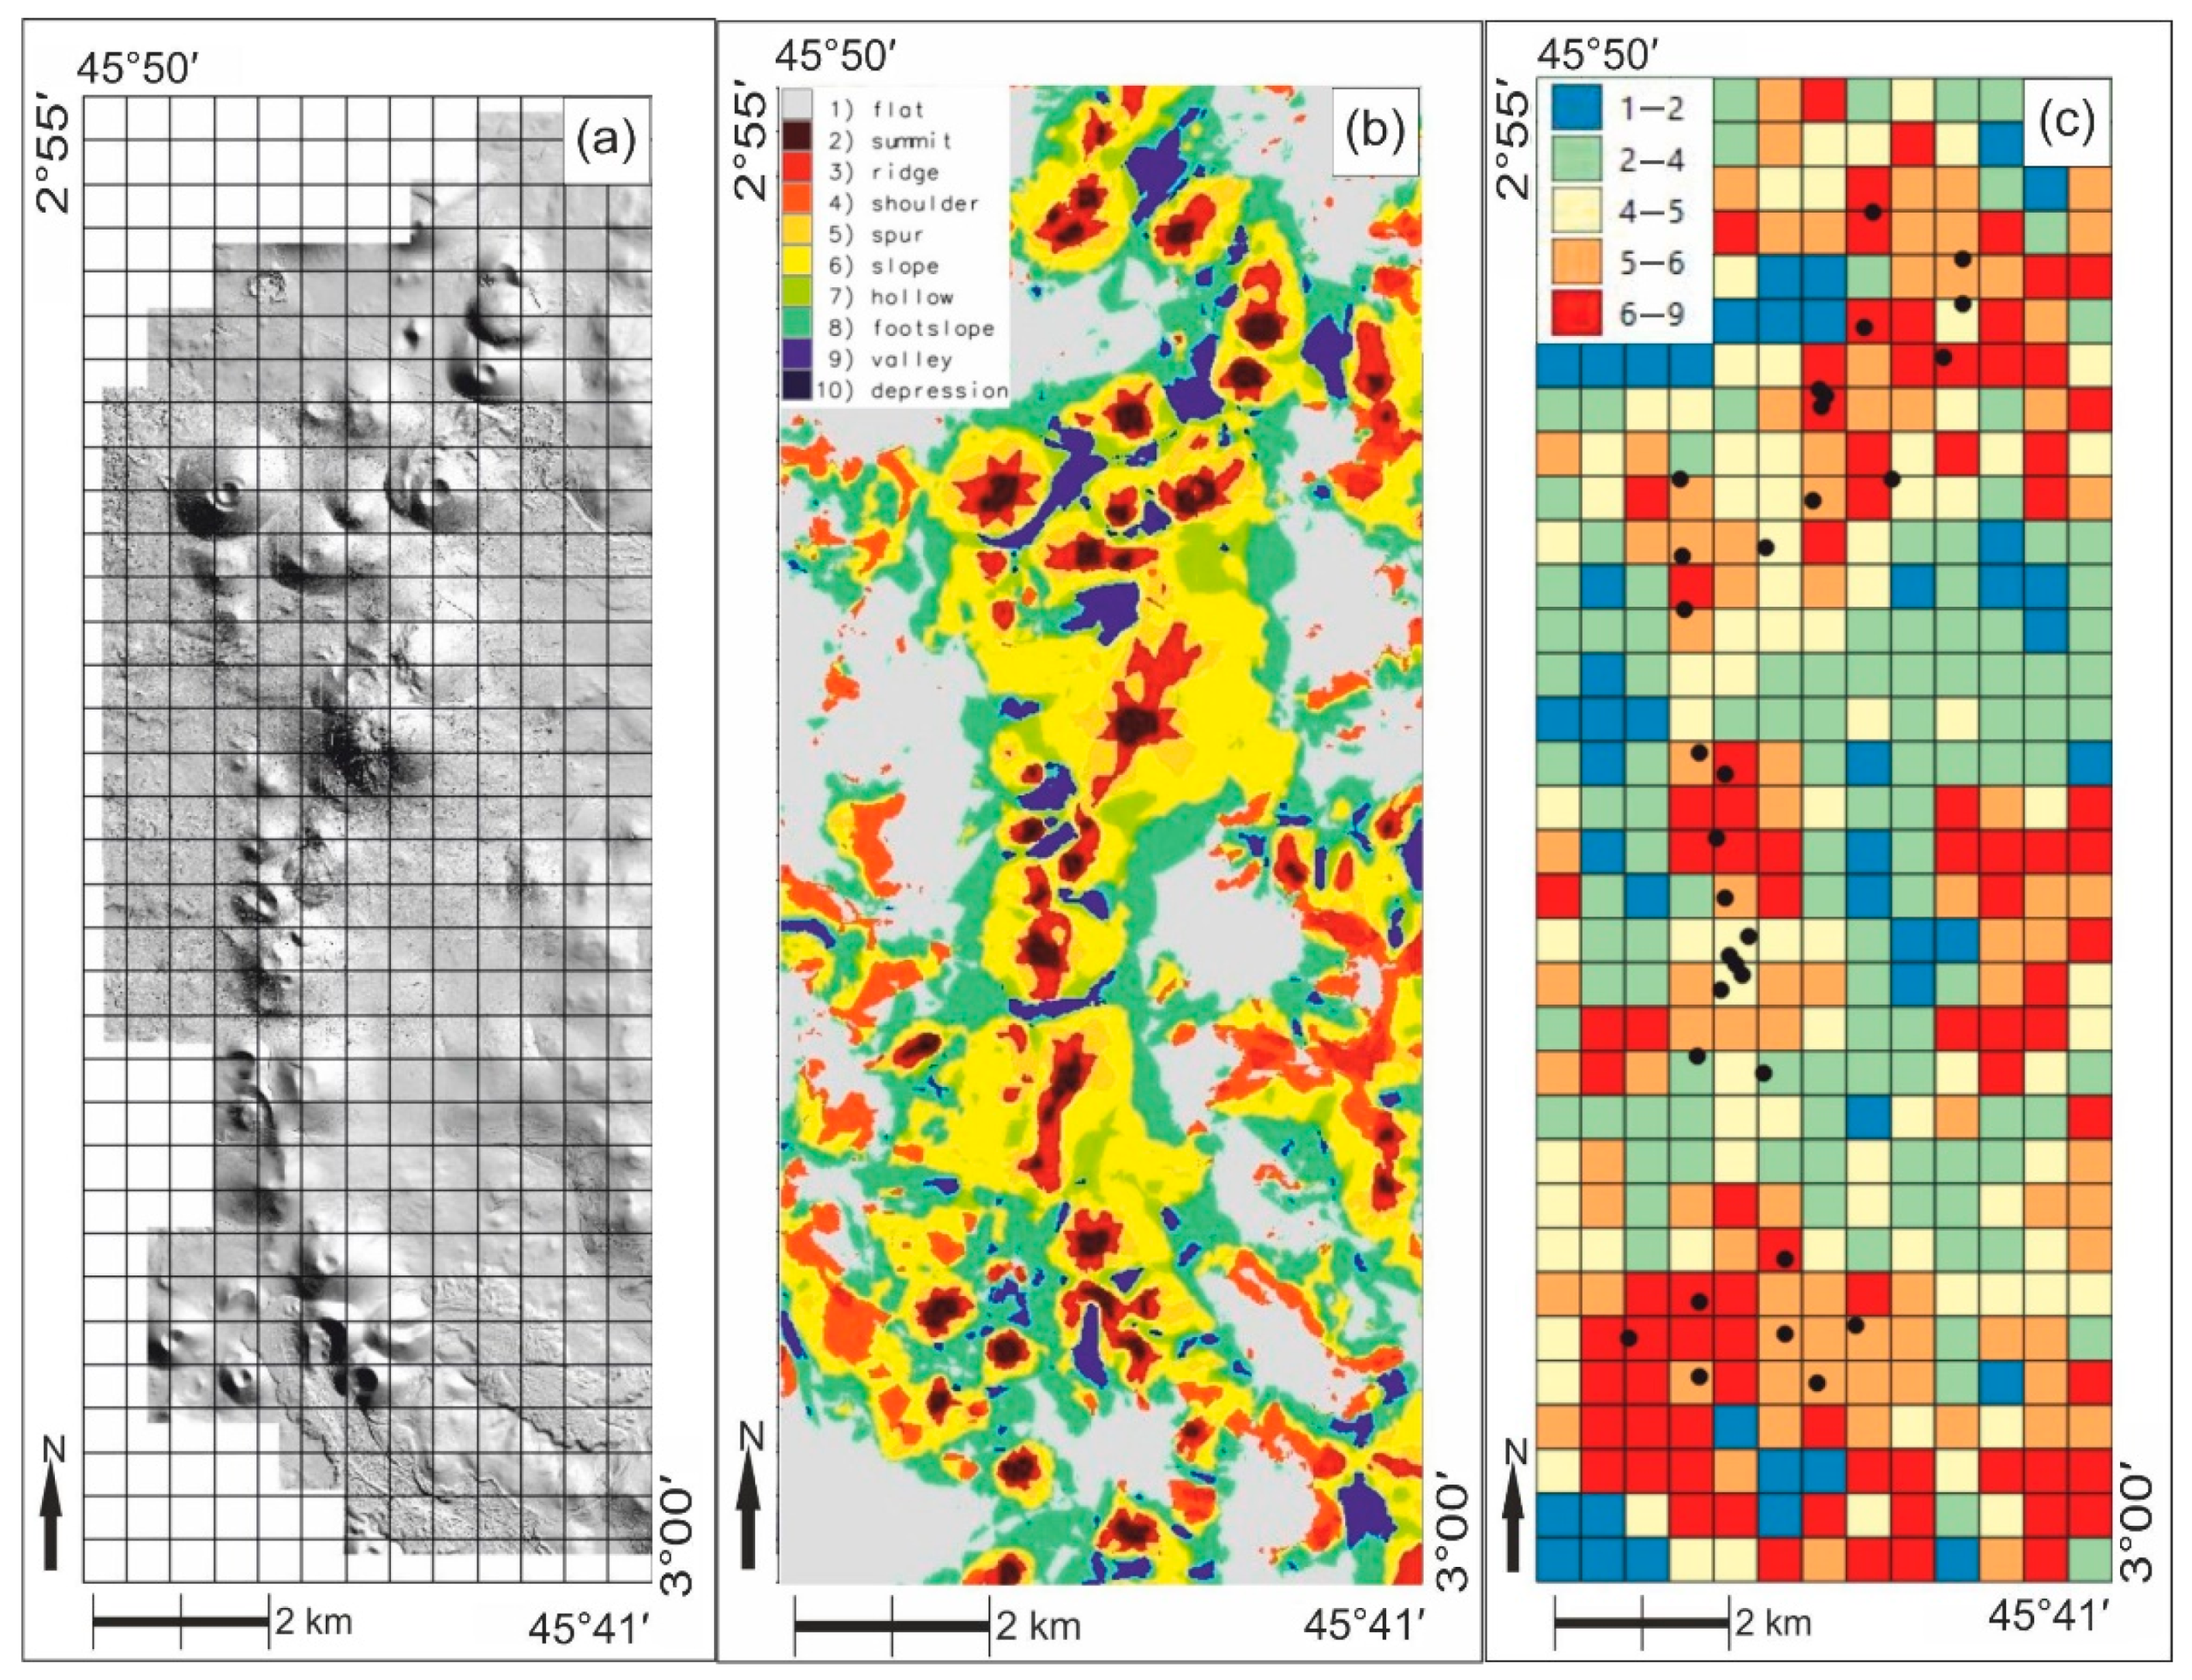
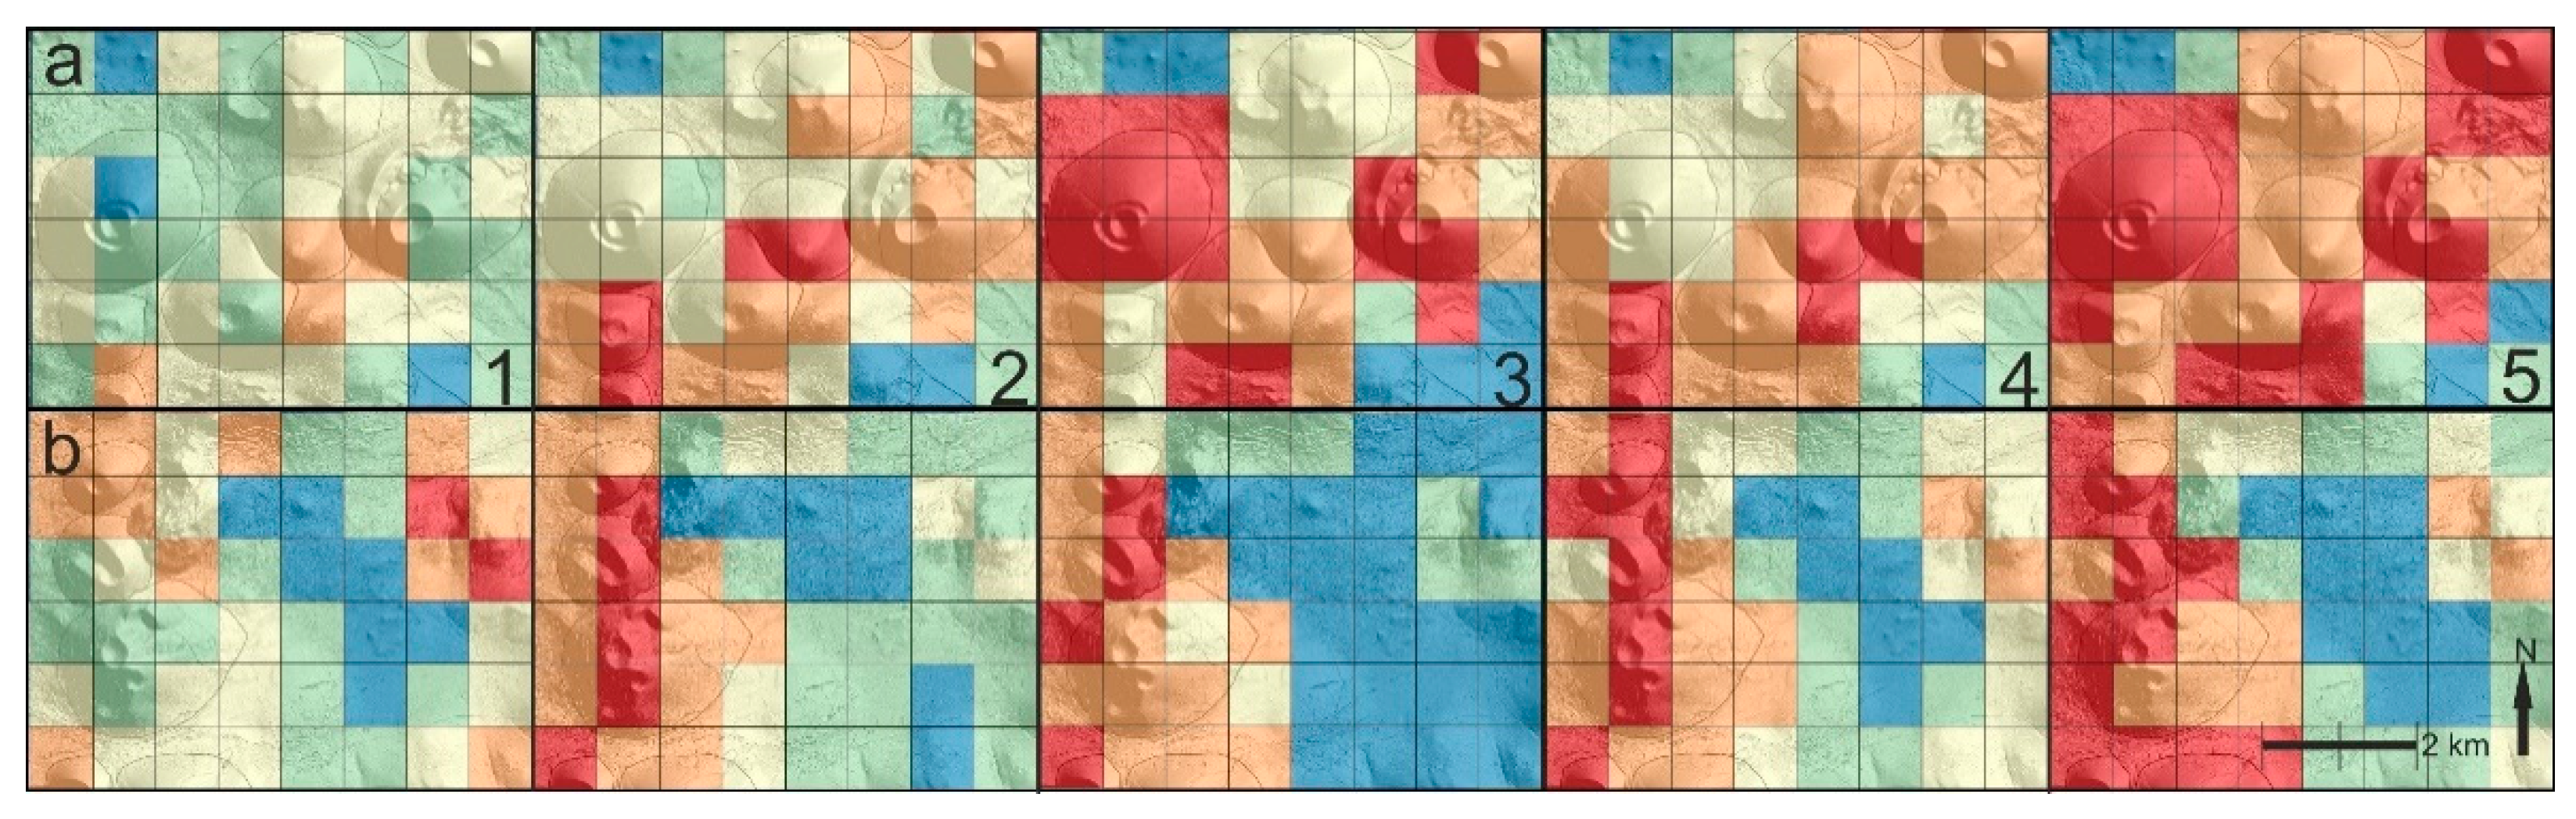
- the conical shapes with uniform slopes that are described by slope categories.
- the asymmetry, either due the original volcanogenic processes or post-volcanic collapses, other mass movements, or erosional features.
- the chains of partly overlapping conical forms, parasite cones, etc.
5. Conclusions
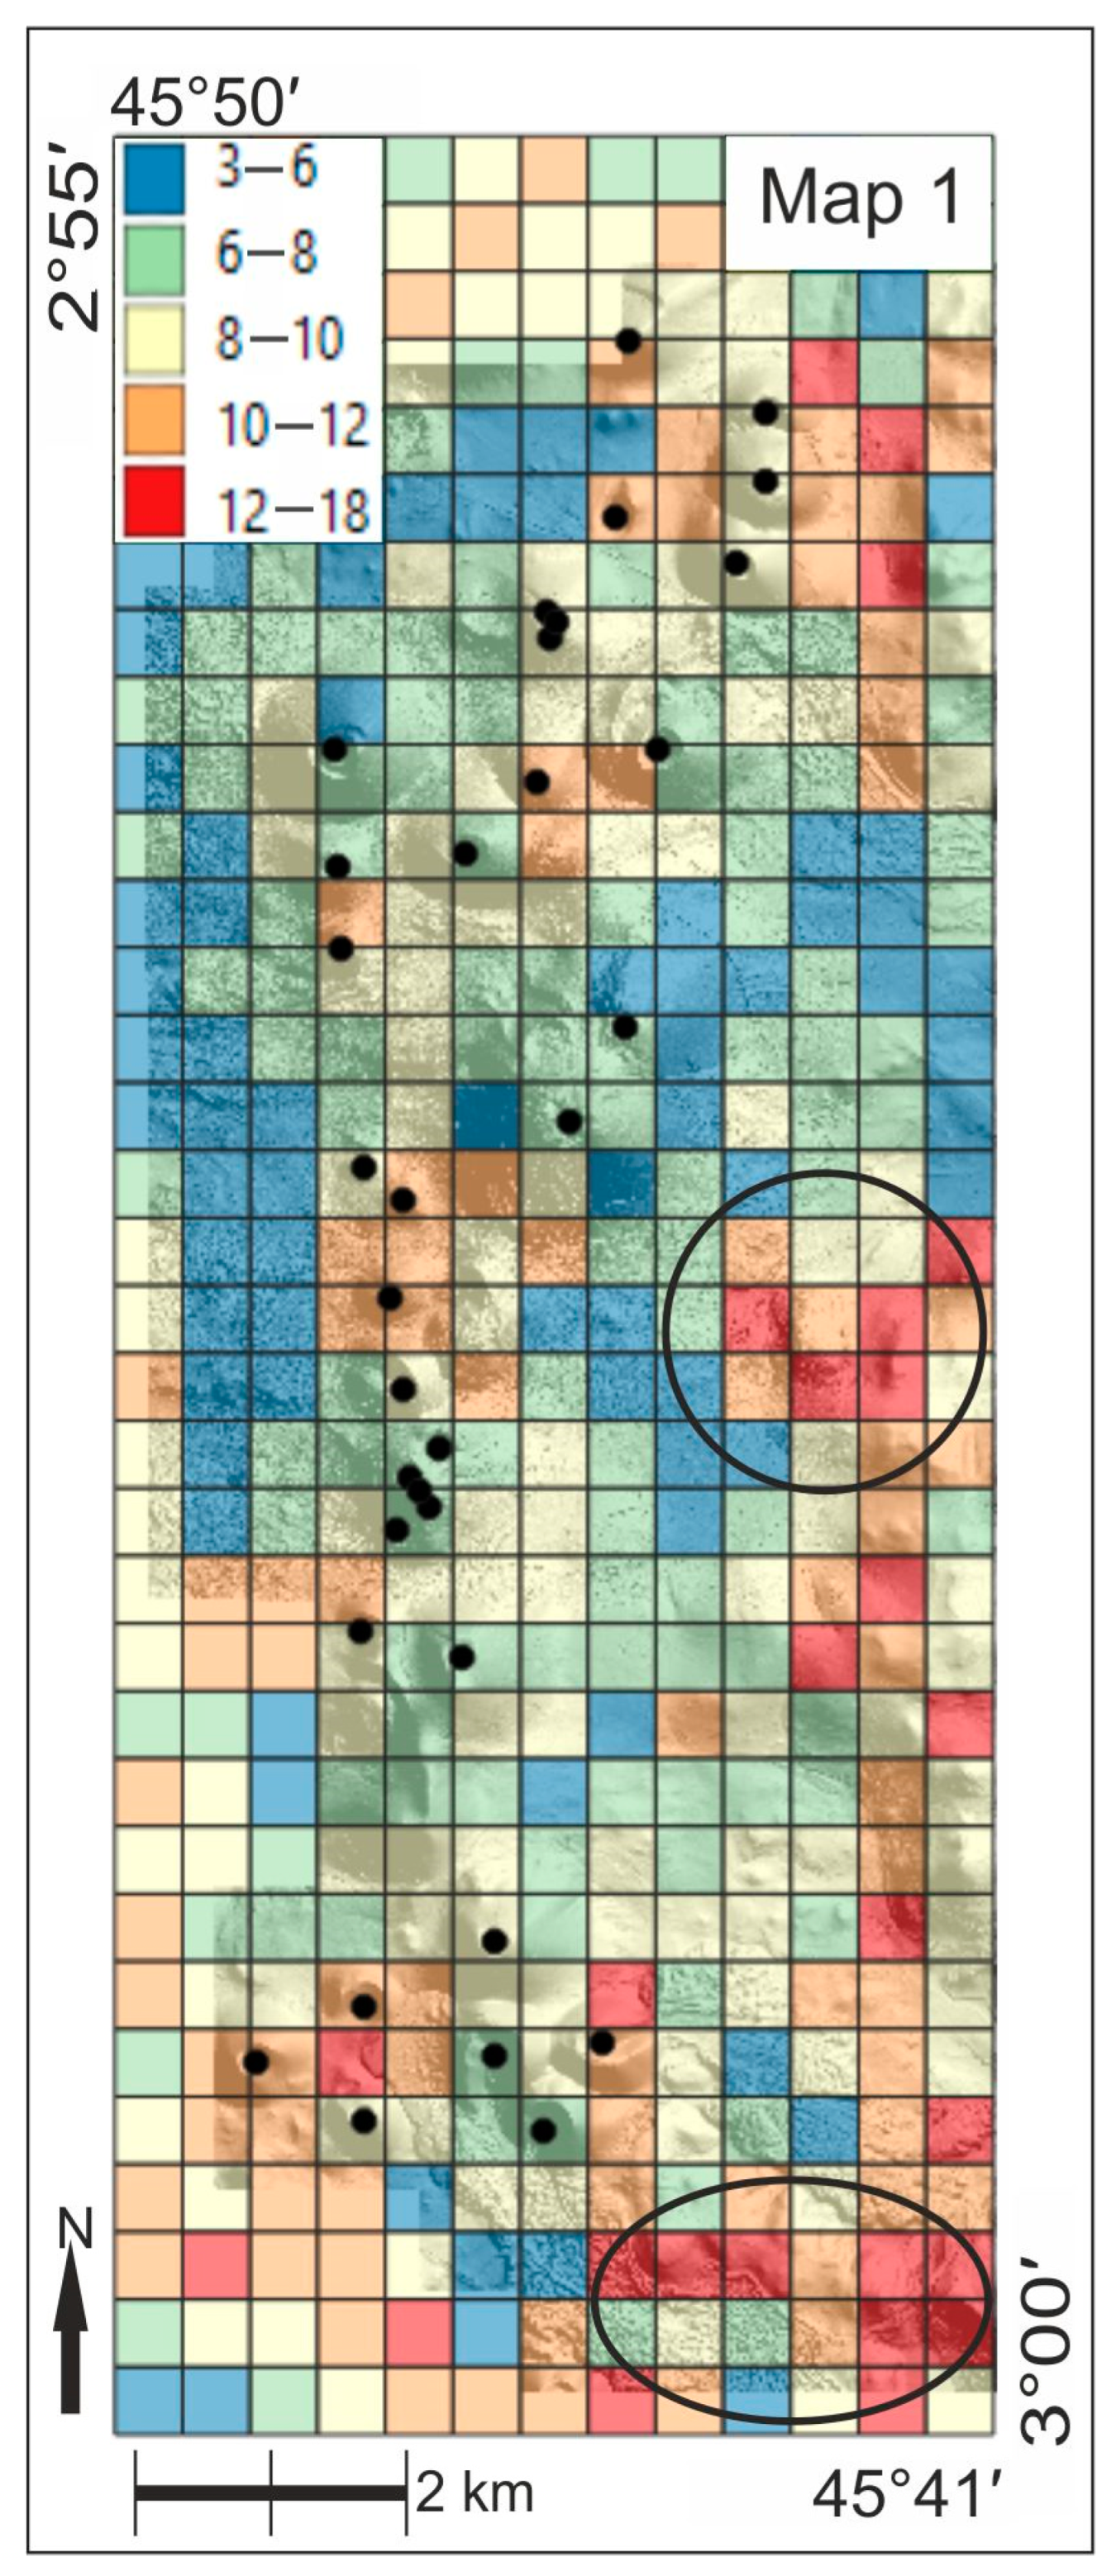
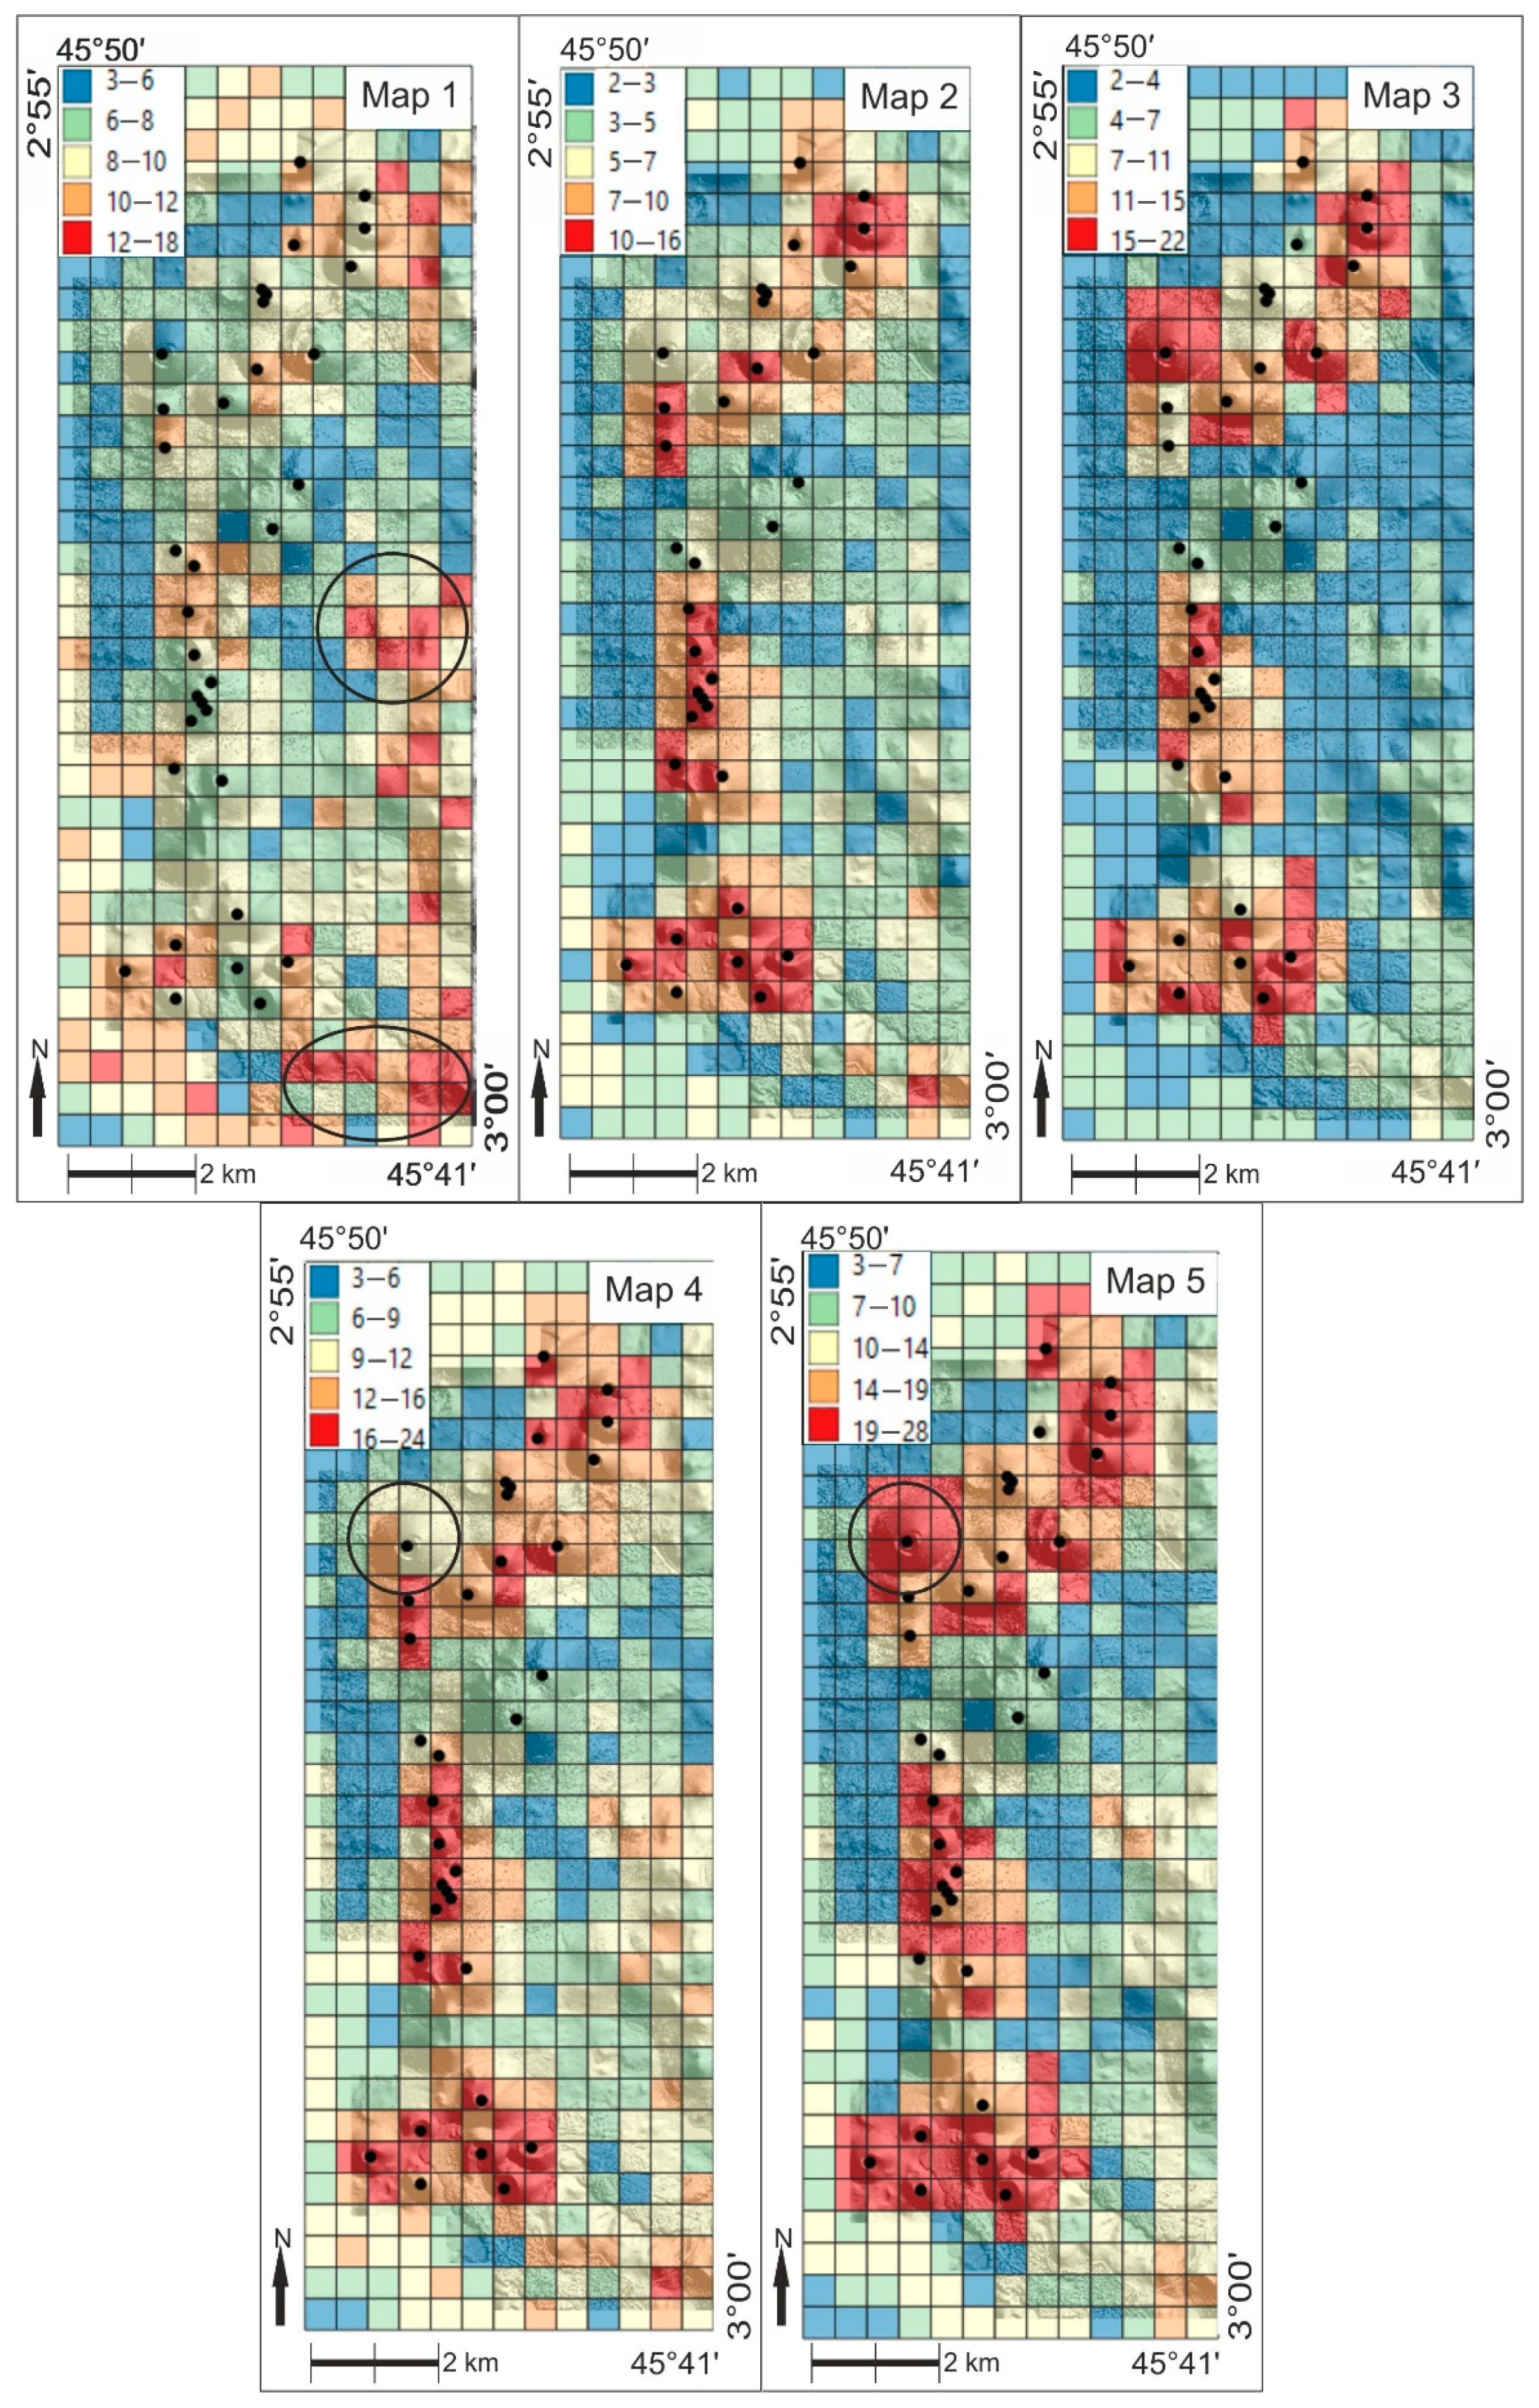
- The proposed geodiversity subindex performs well in highlighting the volcanic cones and volcanic chains.
- The resulting (integrated) geodiversity index works both in the volcanic field and outside.
- Resolution issues should be solved; however, if high-resolution LiDAR DTM is available, this problem is subordinate.
- Further studies are needed in other volcanic fields of the world for verification; however, we propose that the modified method is robust and can already be generally used.
- Further modifications for other special landform types, such as faults, sand dunes, and karst, could be incorporated.
Author Contributions
Funding
Conflicts of Interest
References
- Gray, M. Valuing and Conserving Abiotic Nature; John Wiley & Sons, Ltd.: Hoboken, NJ, USA, 2004; ISBN 0470848952. [Google Scholar]
- Kozłowski, S. Geodiversity. The concept and scope of geodiversity. Prz. Geol. 2004, 52, 833–837. [Google Scholar]
- Serrano, E.; Ruiz-Flaño, P. Geodiversity: A theoretical and applied concept. Geogr. Helv. 2007, 62, 140–147. [Google Scholar] [CrossRef]
- Pereira, D.I.; Pereira, P.; Brilha, J.; Santos, L. Geodiversity assessment of Paraná State (Brazil): An innovative approach. Environ. Manag. 2013, 52, 541–552. [Google Scholar] [CrossRef] [PubMed] [Green Version]
- De Paula Silva, J.; Rodrigues, C.; Pereira, D.I. Mapping and Analysis of Geodiversity Indices in the Xingu River Basin, Amazonia, Brazil. Geoheritage 2015, 7, 337–350. [Google Scholar] [CrossRef] [Green Version]
- Balaton-Felvidék—Wikipédia. Available online: https://hu.wikipedia.org/wiki/Balaton-felvidék (accessed on 29 December 2020).
- Székely, B.; Vörös, F. Studying the distributions of DTM derivatives of cinder cones: A statistical approach in volcanic morphometry. EGU Gen. Assem. 2020, 10465. [Google Scholar] [CrossRef]
- Vörös, F.; van Wyk de Vries, B.; Guilbaud, M.-N.; Székely, B. Comparative geomorphometric analysis of scoria cones of Chaîne desPuys (France) and Sierra Chichinautzin (Central México). EGU Gen. Assem. 2018, 20, 1163. [Google Scholar]
- Soulé, M.E.; Wilcox, B.A. Conservation Biology: An Evolutionary-Ecological Perspective; Sinauer Associates Inc.: Sunderland, MA, USA, 1980; ISBN 978-0-87893-800-1. [Google Scholar]
- Wilcox, B.A. In situ conservation of genetic resources: Determinants of minimum area requirements. Natl. Park. Conserv. Dev. 1984, 639–647. [Google Scholar] [CrossRef]
- Tangley, L. A New Plan to Conserve the Earth’s Biota. Bioscience 1985, 35, 334–337. [Google Scholar]
- Minelli, A.; Bonato, L. Diversity of Life. In eLS; John Wiley & Sons, Ltd.: Chichester, UK, 2012; pp. 1–7. ISBN 9780470015902. [Google Scholar]
- Gray, M. Geodiversity: The origin and evolution of a paradigm. Geol. Soc. Lond. Spec. Publ. 2008, 300, 31–36. [Google Scholar] [CrossRef]
- Gray, M. Geodiversity: The Backbone of Geoheritage and Geoconservation; Elsevier Inc.: Amsterdam, The Netherlands, 2018; ISBN 9780128095423. [Google Scholar]
- De Vries, B.V.W.; Hagos, M.; Guilbaud, M. Geoheritage, Geodiversity and natural landscape enhanced and protected through anthropogenic activity: A case study using the Chaîne des Puys and Limagne Fault, Afar and Mexico City. EGU Gen. Assem. Conf. Abstr. 2015, 17, 15542. [Google Scholar]
- Wood, C.A. Morphometric analysis of cinder cone degradation. J. Volcanol. Geotherm. Res. 1980, 8, 137–160. [Google Scholar] [CrossRef]
- Wood, C.A. Morphometric evolution of cinder cones. J. Volcanol. Geotherm. Res. 1980, 7, 387–413. [Google Scholar] [CrossRef]
- Van Wyk de Vries, B.; Márquez, A.; Herrera, R.; Granja Bruña, J.L.; Llanes, P.; Delcamp, A. Craters of elevation revisited: Forced-folds, bulging and uplift of volcanoes. Bull. Volcanol. 2014, 76, 875. [Google Scholar] [CrossRef]
- Németh, K.; Kereszturi, G. Monogenetic volcanism: Personal views and discussion. Int. J. Earth Sci. 2015, 104, 2131–2146. [Google Scholar] [CrossRef]
- Porter, S.C. Distribution, morphology, and size frequency of cinder cones on mauna kea volcano, hawaii. Bull. Geol. Soc. Am. 1972, 83, 3607–3612. [Google Scholar] [CrossRef]
- Colton, S.H. The basaltic cinder cones and lava flows of the San Francisco Mountain volcanic field. Mus. N. Ariz. Bull. 1937, 10, 1–49. [Google Scholar]
- Settle, M. The structure and emplacement of cinder cone fields. Am. J. Sci. 1979, 279, 1089–1107. [Google Scholar] [CrossRef]
- Tanaka, K.L.; Shoemaker, E.M.; Ulrich, G.E.; Wolfe, E.W. Migration of Volcanism in the San-Francisco Volcanic Field, Arizona. Geol. Soc. Am. Bull. 1986, 97, 129–141. [Google Scholar]
- Hooper, D.M.; Sheridan, M.F. Computer-simulation models of scoria cone degradation. J. Volcanol. Geotherm. Res. 1998, 83, 241–267. [Google Scholar] [CrossRef]
- Tibaldi, A. Morphology of pyroclastic cones and tectonics. J. Geophys. Res. Solid Earth 1995, 100, 24521–24535. [Google Scholar] [CrossRef]
- Favalli, M.; Karátson, D.; Mazzarini, F.; Pareschi, M.T.; Boschi, E. Morphometry of scoria cones located on a volcano flank: A case study from Mt. Etna (Italy), based on high-resolution LiDAR data. J. Volcanol. Geotherm. Res. 2009, 186, 320–330. [Google Scholar] [CrossRef]
- Fornaciai, A.; Favalli, M.; Karátson, D.; Tarquini, S.; Boschi, E. Morphometry of scoria cones, and their relation to geodynamic setting: A DEM-based analysis. J. Volcanol. Geotherm. Res. 2012, 217–218, 56–72. [Google Scholar] [CrossRef]
- Boivin, P.; Besson, J.C.; Briot, D.; Camus, G.; de Goër, A.; Gourgaud, A.; Labazuy, P.; de Larouzière, D.; Livet, M.; Mergoil, J.; et al. Volcanologie de la Chaîne des Puys, Carte et Fascicule. 2004. Available online: https://www.esrifrance.fr/iso_album/p10_11.pdf (accessed on 30 December 2020).
- Miallier, D.; Pilleyre, T.; Sanzelle, S.; Boivin, P.; Lanos, P. Numéro 4 Revised chronology of the youngest volcanoes of the chaîne des puys (french Massif central), Quaternaire. Quat. Rev. l’Assocation Fr. l’étude Quat. 2012, 23, 283–290. [Google Scholar] [CrossRef]
- Miallier, D.; Boivin, P.; Deniel, C.; Gourgaud, A.; Lanos, P.; Sforna, M.; Pilleyre, T. La dernière éruption sommitale du Puy de Dôme (Chaîne des Puys, Massif central français), il y a environ 10 700 ans. Comptes Rendus Geosci. 2010, 342, 847–854. [Google Scholar] [CrossRef]
- Petronis, M.; van Wyk de Vries, B.; Garza, D. The Leaning Puy de Dôme (Auvergne, France) tilted by shallow intrusions. Volcanica 2019, 2, 161–186. [Google Scholar] [CrossRef]
- Langley, R.B. RTK GPS. GPS World 1998, 9, 70–75. [Google Scholar]
- Kraus, K.; Pfeifer, N. Determination of terrain models in wooded areas with airborne laser scanner data. ISPRS J. Photogramm. Remote Sens. 1998, 53, 193–203. [Google Scholar] [CrossRef]
- 2011_site_puy_de_dome_lidarverne-Fichiers-Drive Opendata du CRAIG. Available online: https://drive.opendata.craig.fr/s/opendata?path=%2Flidar%2Fautres_zones%2F2011_site_puy_de_dome_lidarverne (accessed on 29 December 2020).
- Vörös, F.; van Wyk de Vries, B.; Székely, B. Geomorphometric descriptive parameters of scoria cones from different dtms: A resolution invariance study. In Proceedings of the 7th International Conference on Cartography and GIS, Sozopol, Bulgaria, 18–23 June 2018; pp. 603–612. [Google Scholar]
- Shields, J. The Morphometry of the Chaine des Puys; Université Blaise Pascal: Clermont-Ferrand, France, 2010. [Google Scholar]
- Cartes Géologiques Départementales à 1/50 000 (Bd Charm-50); Bureau de Recherches Géologiques et Minières (French Geological Survey): Orléans, France, 2004.
- ESDAC European Soil Database v2.0. Available online: https://esdac.jrc.ec.europa.eu/ (accessed on 29 December 2020).
- EuroGeoSurveys Mineral Resources Map. Available online: http://www.europe-geology.eu/mineral-resources/mineral-resources-map/ (accessed on 29 December 2020).
- Jasiewicz, J.; Stepinski, T.F. Geomorphons—A pattern recognition approach to classification and mapping of landforms. Geomorphology 2013, 182, 147–156. [Google Scholar] [CrossRef]
- Jenks, G.F. The Data Model Concept in Statistical Mapping. Int. Yearb. Cartogr. 1967, 7, 186–190. [Google Scholar]


| Subindex | Minimum | Maximum | |
|---|---|---|---|
| geological | 1 | 8 | |
| pedological | 1 | 2 | |
| mineral/paleontological | 0 | 0 | |
| geomorphological | relief | 1 | 9 |
| hydrology | 0 | 1 | |
| volcano index | 0 | 18 | |
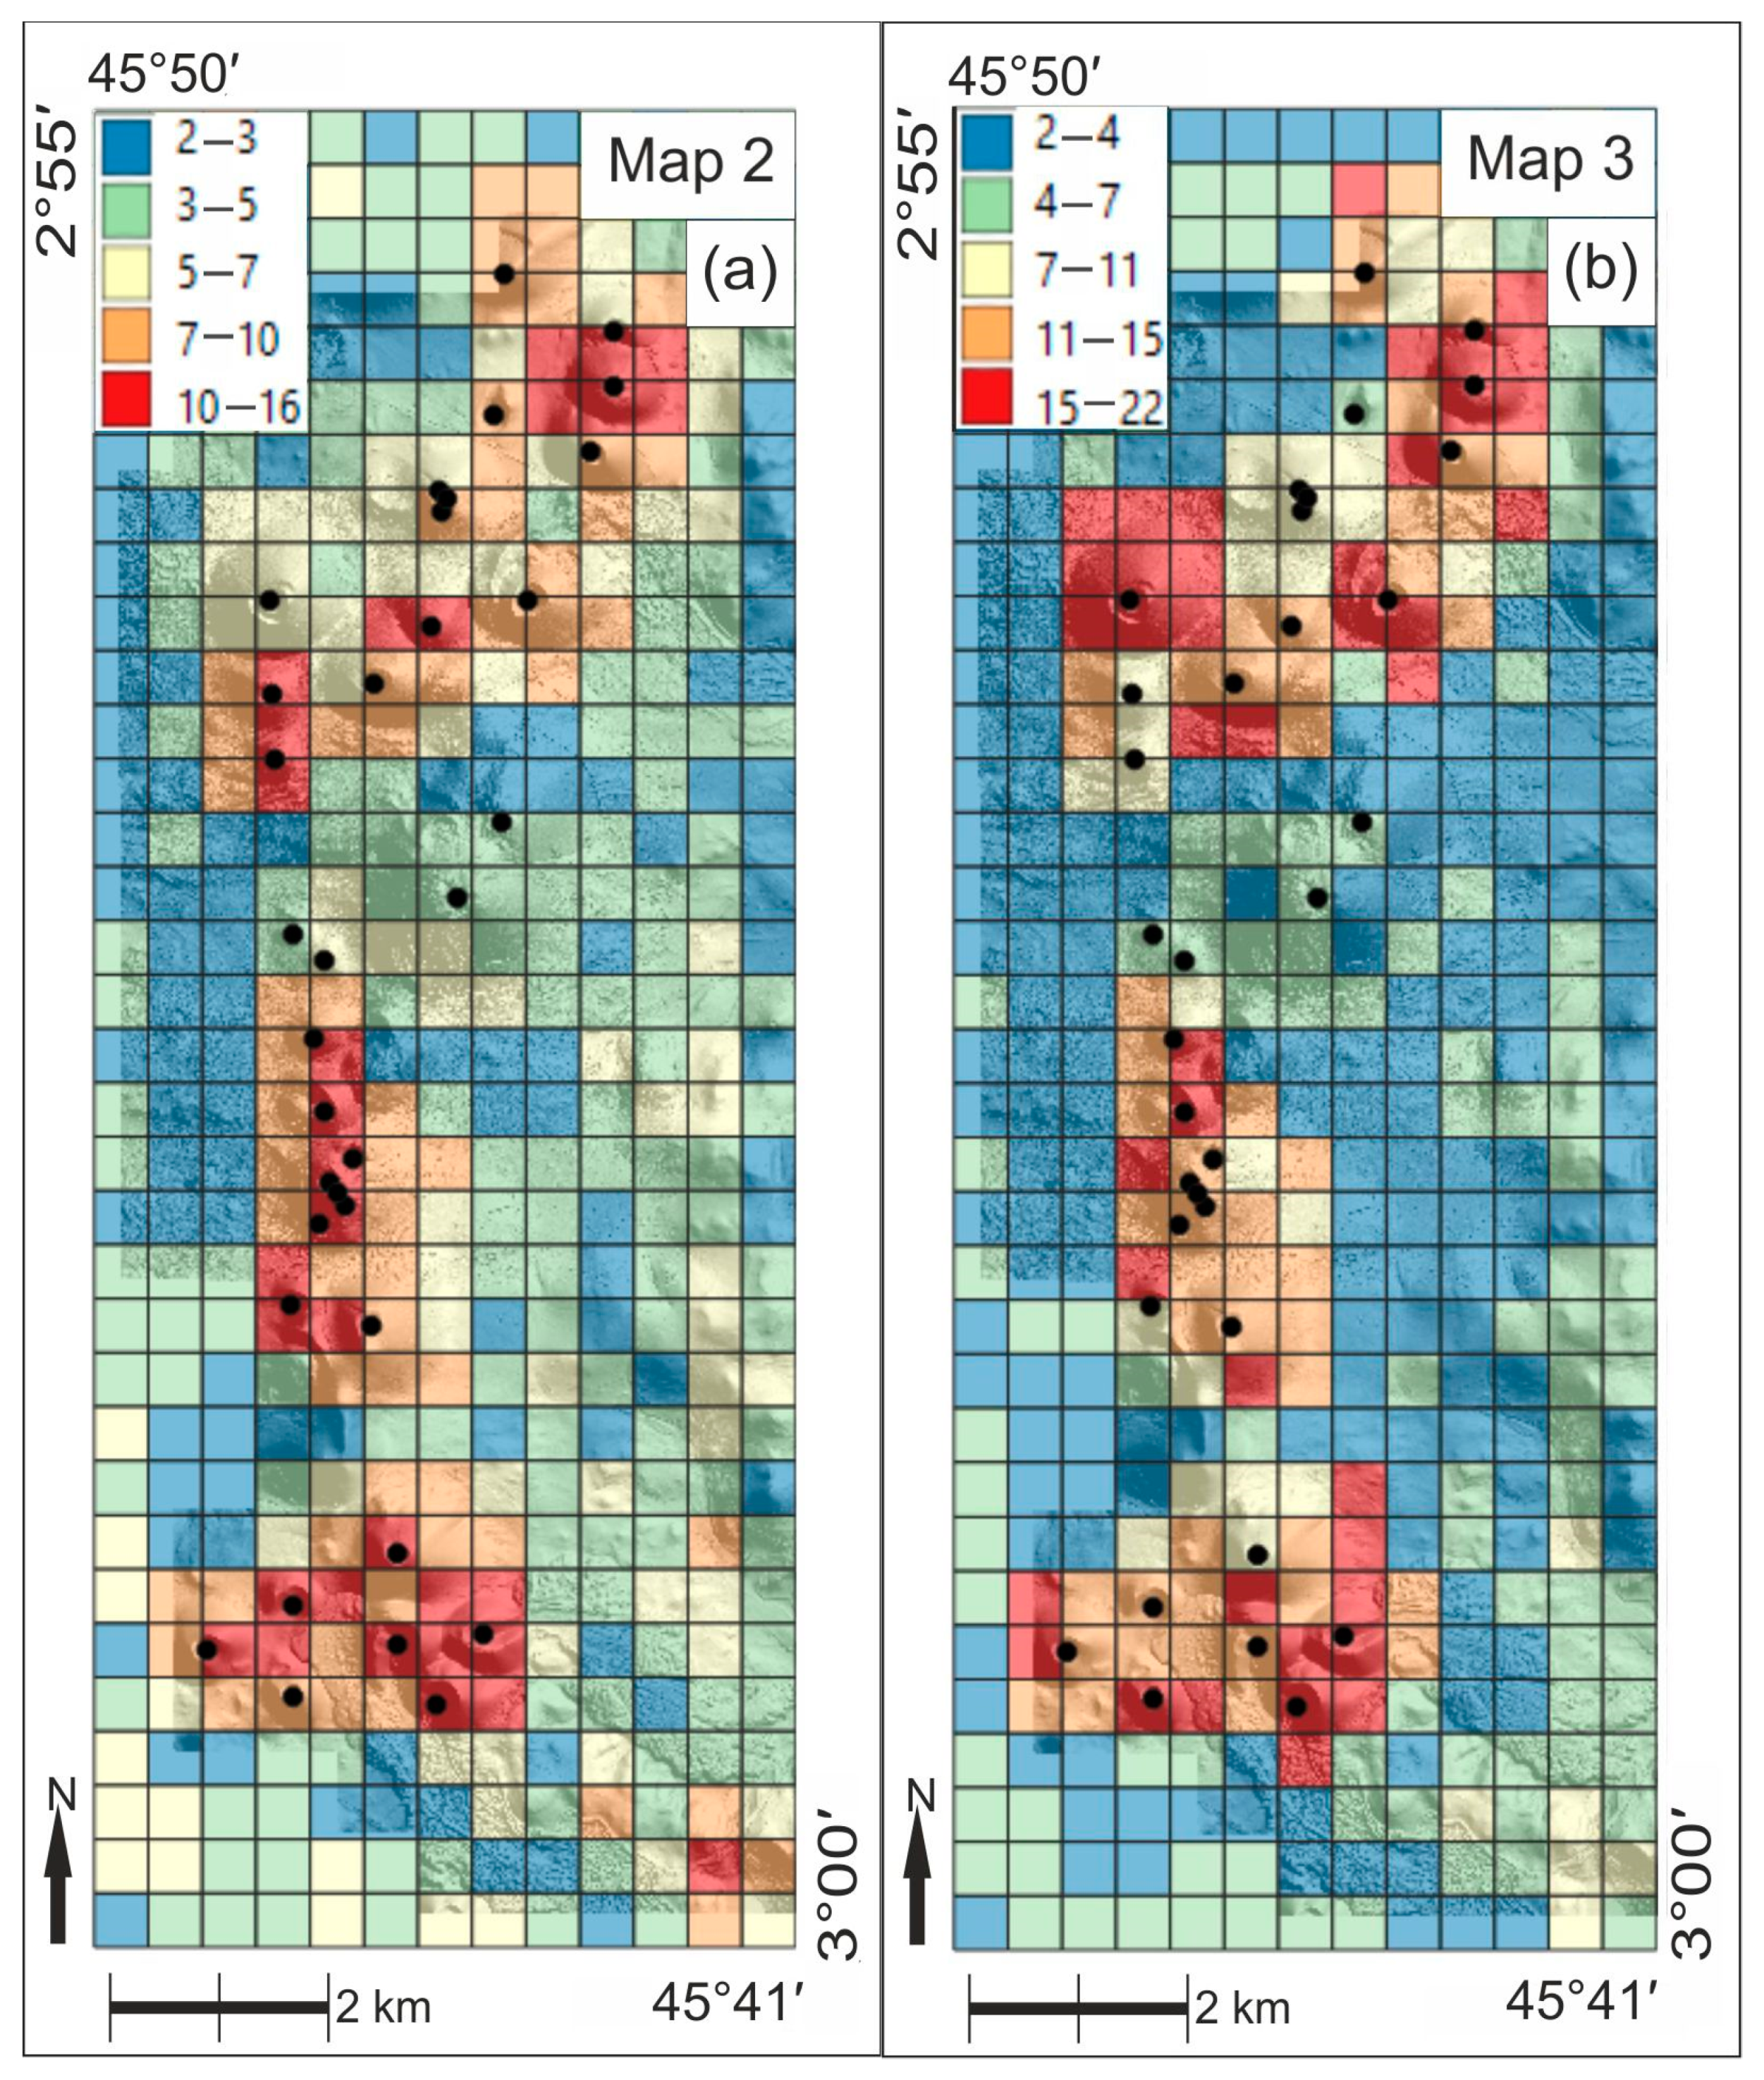
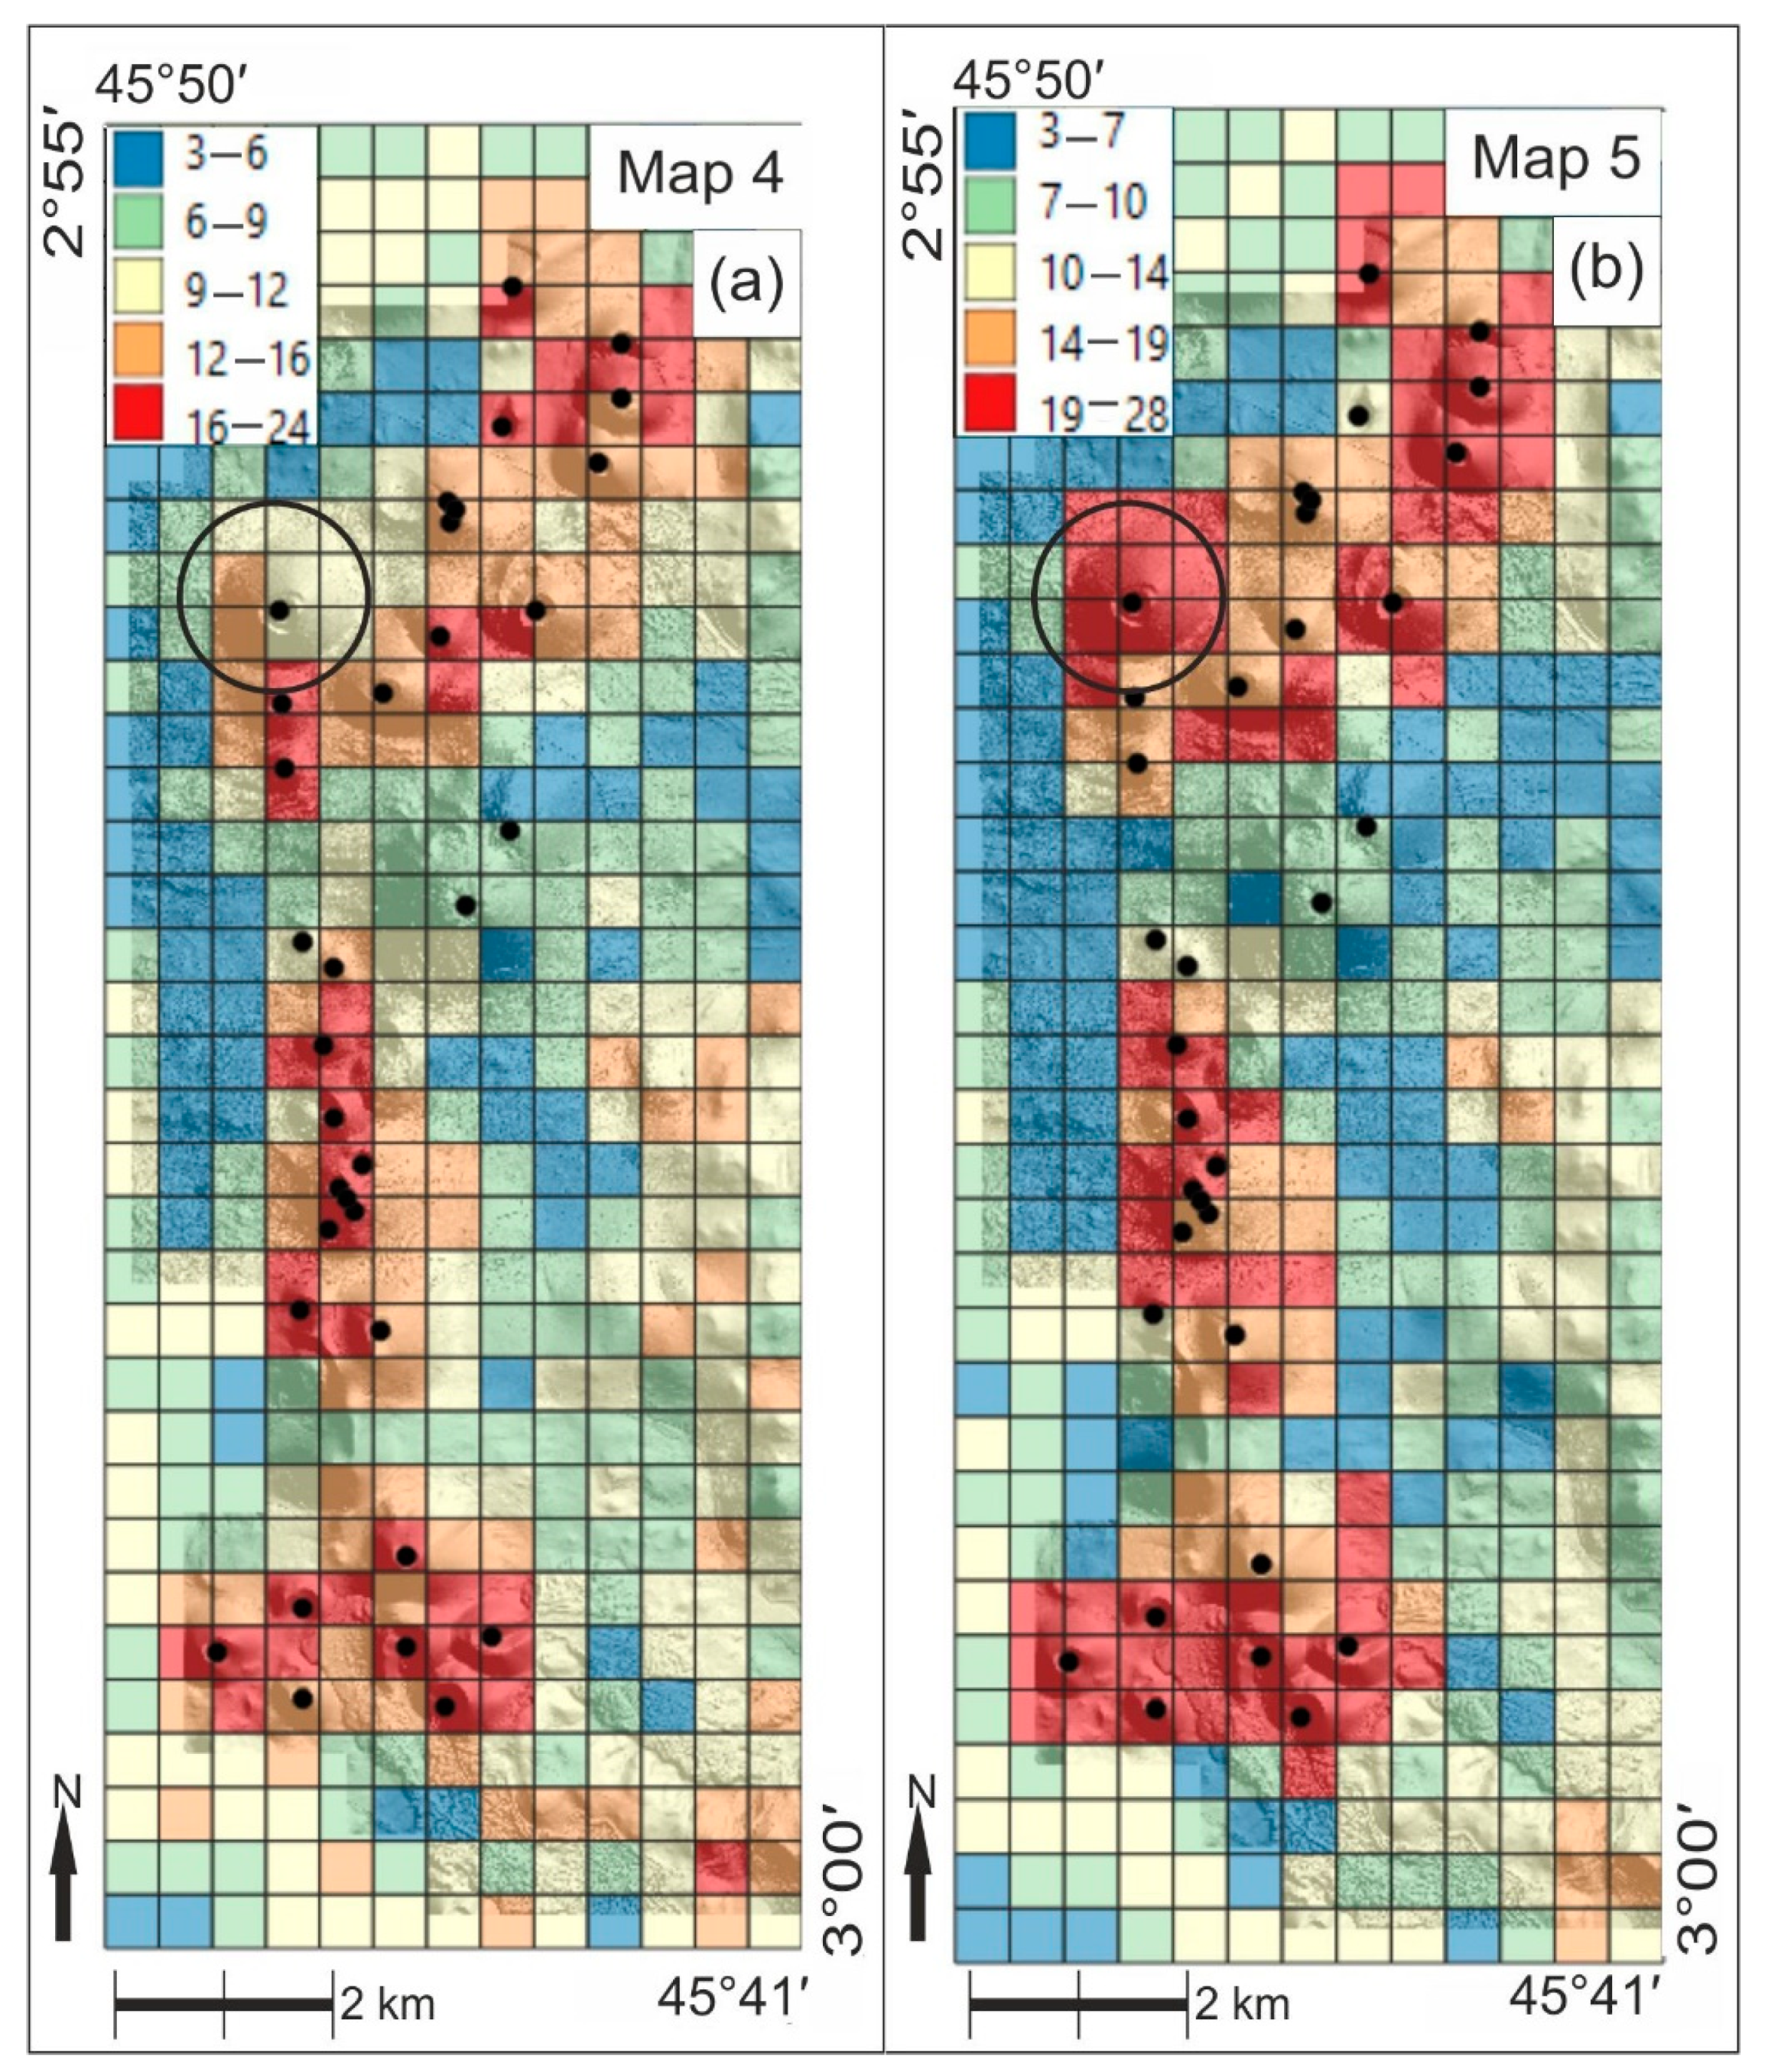
| Subindex | Map 1 | Map 2 | Map 3 | Map 4 | Map 5 | |
|---|---|---|---|---|---|---|
| geological | 1–8 | 1–8 | 1–8 | 1–8 | 1–8 | |
| pedological | 1–2 | 1–2 | 1–2 | 1–2 | 1–2 | |
| mineral/paleontological | 0 | 0 | 0 | 0 | 0 | |
| geomorphological | relief | 1–9 | 0 | 0 | 1–9 | 1–9 |
| hydrology | 0–1 | 0–1 | 0–1 | 0–1 | 0–1 | |
| volcano index | cone existence | 0 | 0–1 | 0–1 | 0–1 | 0–1 |
| number of different sectors | 0 | 0–11 | 0 | 0–11 | 0 | |
| median of sectors | 0 | 0 | 0–16 | 0 | 0–16 | |
| total (possible minimum–possible maximum) | 3–20 | 2–23 | 2–28 | 3–32 | 3–37 | |
Publisher’s Note: MDPI stays neutral with regard to jurisdictional claims in published maps and institutional affiliations. |
© 2021 by the authors. Licensee MDPI, Basel, Switzerland. This article is an open access article distributed under the terms and conditions of the Creative Commons Attribution (CC BY) license (http://creativecommons.org/licenses/by/4.0/).
Share and Cite
Vörös, F.; Pál, M.; van Wyk de Vries, B.; Székely, B. Development of a New Type of Geodiversity System for the Scoria Cones of the Chaîne des Puys Based on Geomorphometric Studies. Geosciences 2021, 11, 58. https://0-doi-org.brum.beds.ac.uk/10.3390/geosciences11020058
Vörös F, Pál M, van Wyk de Vries B, Székely B. Development of a New Type of Geodiversity System for the Scoria Cones of the Chaîne des Puys Based on Geomorphometric Studies. Geosciences. 2021; 11(2):58. https://0-doi-org.brum.beds.ac.uk/10.3390/geosciences11020058
Chicago/Turabian StyleVörös, Fanni, Márton Pál, Benjamin van Wyk de Vries, and Balázs Székely. 2021. "Development of a New Type of Geodiversity System for the Scoria Cones of the Chaîne des Puys Based on Geomorphometric Studies" Geosciences 11, no. 2: 58. https://0-doi-org.brum.beds.ac.uk/10.3390/geosciences11020058