
Texture and Shape Analysis of Quartzite Mylonites of the Metamorphic Sole of the Samail Ophiolite (Oman): Evidence for Syn- and Post-Obduction Deformation


Abstract
:1. Introduction

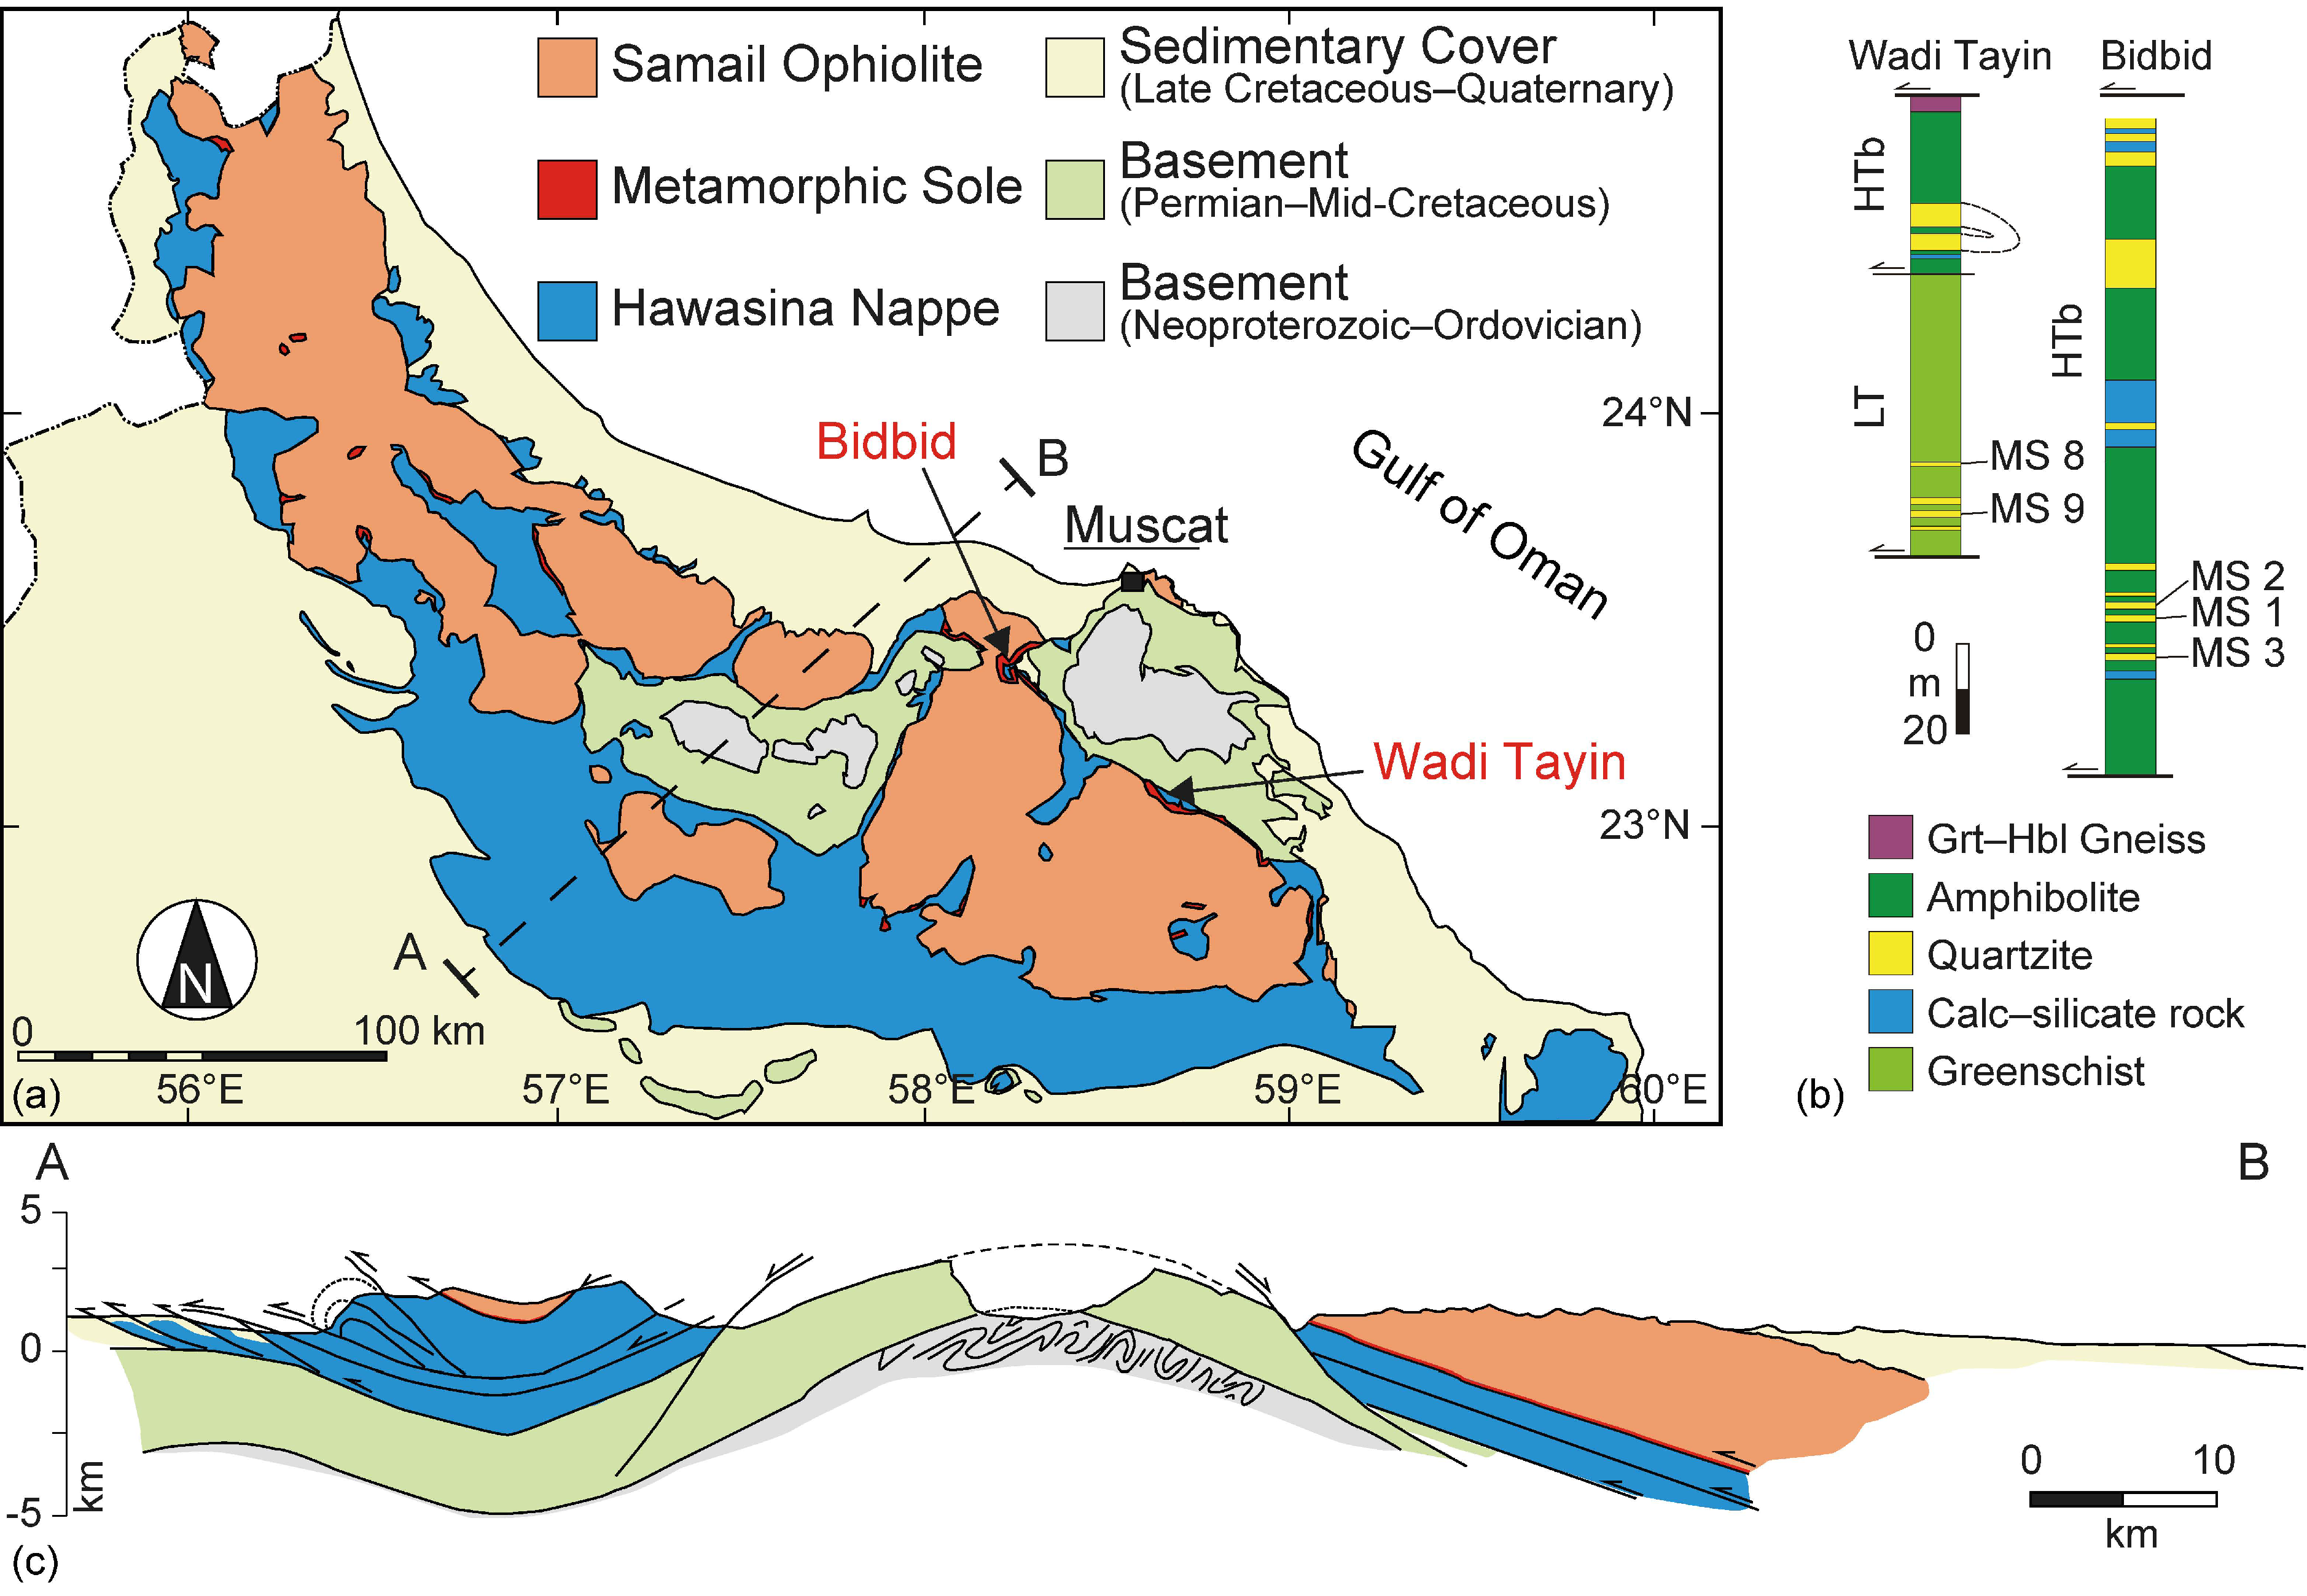
2. Geological Setting and Previous Work
3. Methods
3.1. Sampling
3.2. Neutron Time-of-Flight Texture Analyses
3.3. Electron Backscatter Diffraction
4. Results
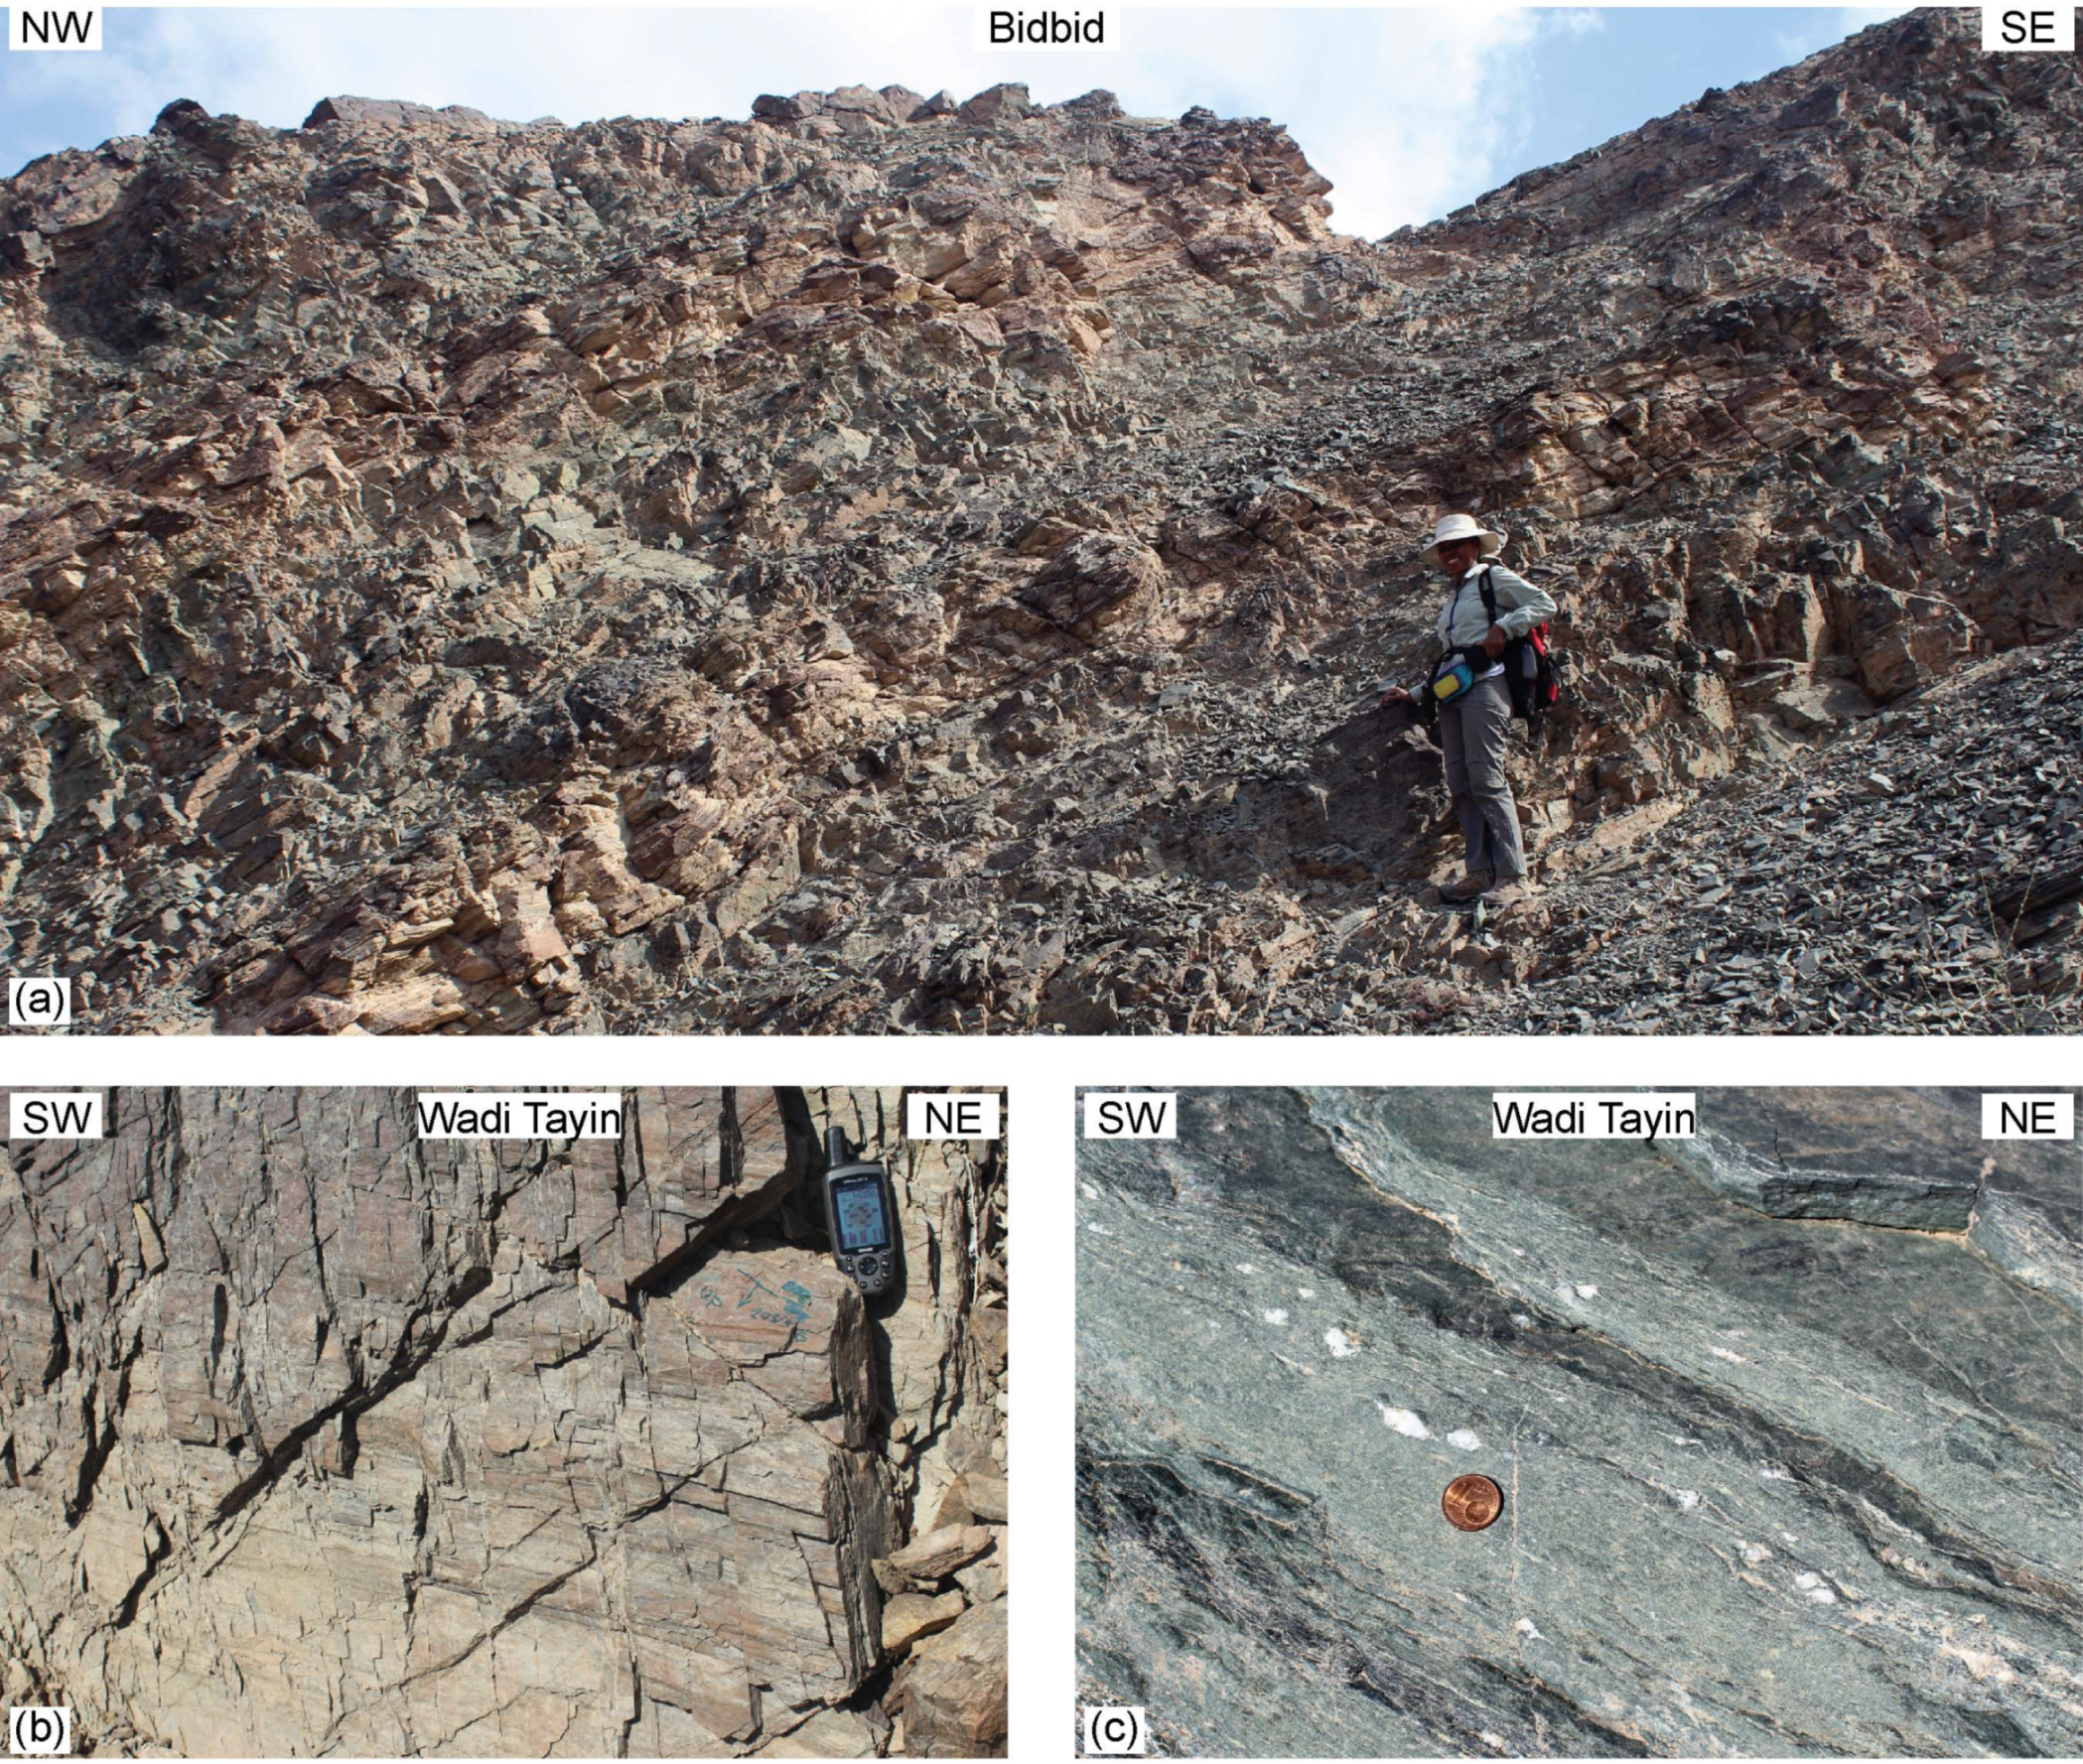
4.1. Sample Description and (Micro-) Structures
4.2. Quartz
4.3. Calcite
5. Discussion
5.1. Quartz Microstructure and Texture-Forming Process
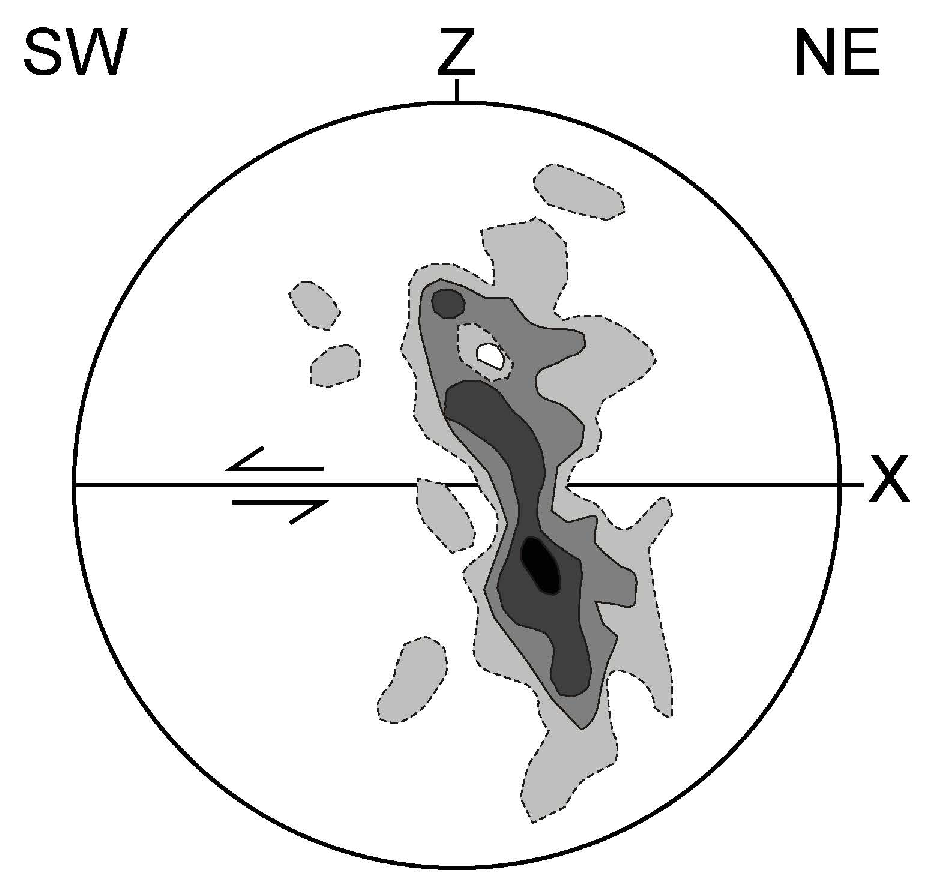
5.2. Tectonic Implications: Type of Strain and Sense of Shear
6. Conclusions
- Differences in texture and microstructure within the quartzites of the metamorphic sole result from strain variations rather than temperature differences. Additionally, GBM in the HTb part and SGR in the LT part were likely contemporaneous. Thus, during quartz texture development, there is a regional (HTb vs. LT part) and probably local strain partitioning;
- The quartz recrystallization and texture development in the HTb and LT part of the metamorphic sole occurred during the sole accretion or thrusting on the Arabian Plate (except MS 3). SGR is the most important recrystallization process for microstructural fabric development. In the upper part, SGR gets overprinted by GBM, while in the lower part, SGR is still active. Thus, grain long-axis distribution from different crustal depths is frozen in the upper and lower parts of the metamorphic sole. We conclude that the differences in simple shear direction correlate to ophiolite rotation during obduction (i.e., older SSW direction in the HTb part and younger SW direction in the LT part). Additionally, it is proposed that the main strain accumulation during ongoing obduction and thrusting onto the Arabian Plate propagates towards the footwall, away from the base of the ophiolite;
- BLG nucleation, quartz whole-rock texture, and quartz SPO of MS 3 and calcite CPO and SPO point to low-temperature coaxial deformation with a minor simple shear component, indicating top-to-the-NNE kinematics. These late texture developments of the metasediments of the metamorphic sole correlate with the post-obduction extensional tectonic event, which is predominantly documented in the underlying autochthonous units.
Supplementary Materials
Author Contributions
Funding
Institutional Review Board Statement
Informed Consent Statement
Data Availability Statement
Acknowledgments
Conflicts of Interest
References
- Searle, M.P.; Cox, J. Subduction zone metamorphism during formation and emplacement of the Semail ophiolite in the Oman Mountains. Geol. Mag. 2002, 139, 241–255. [Google Scholar] [CrossRef]
- Searle, M.P. Structural geometry, style and timing of deformation in the Hawasina Window, Al Jabal al Akhdar and Saih Hatat culminations, Oman Mountains. GeoArabia 2007, 12, 99–130. [Google Scholar]
- Cowan, R.; Searle, M.; Waters, D. Structure of the metamorphic sole to the Oman ophiolite, Sumeini Window and Wadi Tayyin: Implications for ophiolite obduction processes. Geol. Soc. Spec. Publ. 2014, 392, 155–175. [Google Scholar] [CrossRef]
- Hacker, B.; Mosenfelder, J. Metamorphism and deformation along the emplacement thrust of the Samail ophiolite. Oman. Earth Planet. Sci. Lett. 1996, 144, 435–451. [Google Scholar] [CrossRef]
- Soret, M.; Agard, P.; Ildefonse, B.; Dubacq, B.; Prigent, C.; Rosenberg, C. Deformation mechanisms in mafic amphibolites and granulites: Record from the Semail metamorphic sole during subduction infancy. Solid Earth 2019, 10, 1733–1755. [Google Scholar] [CrossRef] [Green Version]
- Soret, M.; Agard, P.; Dubacq, B.; Plunder, A.; Yamato, P. Petrological evidence for stepwise accretion of metamorphic soles during subduction infancy (Semail ophiolite, Oman and UAE). J. Metamorph. Geol. 2017, 35, 1051–1080. [Google Scholar] [CrossRef]
- Rioux, M.; Garber, J.; Bauer, A.; Bowring, S.; Searle, M.; Kelemen, P.; Hacker, B. Synchronous formation of the metamorphic sole and igneous crust of the Semail ophiolite: New constraints on the tectonic evolution during ophiolite formation from high-precision U-Pb zircon geochronology. Earth Planet. Sci. Lett. 2016, 451, 185–195. [Google Scholar] [CrossRef] [Green Version]
- Guilmette, C.; Smit, M.A.; van Hinsbergen, D.J.J.; Gürer, D.; Corfu, F.; Charette, B.; Maffione, M.; Rabeau, O.; Savard, D. Forced subduction initiation recorded in the sole and crust of the Semail Ophiolite of Oman. Nat. Geosci. 2018, 11, 688–695. [Google Scholar] [CrossRef]
- Rioux, M.; Bowring, S.; Kelemen, P.; Gordon, S.; Miller, R.; Dudás, F. Tectonic development of the Samail ophiolite: High-precision U-Pb zircon geochronology and Sm-Nd isotopic constraints on crustal growth and emplacement. J. Geophys. Res. Solid Earth 2013, 118, 2085–2101. [Google Scholar] [CrossRef] [Green Version]
- Boudier, F.; Ceuleneer, G.; Nicolas, A. Shear zones, thrusts and related magmatism in the Oman ophiolite: Initiation of thrusting on an oceanic ridge. Tectonophysics 1988, 151, 275–296. [Google Scholar] [CrossRef]
- Boudier, F.; Nicolas, A.; Bouchez, J. Kinematics of oceanic thrusting and subduction from basal sections of ophiolites. Nature 1982, 296, 825–828. [Google Scholar] [CrossRef]
- Grobe, A.; Virgo, S.; Von Hagke, C.; Urai, J.; Littke, R. Multiphase structural evolution of a continental margin during obduction orogeny: Insights from the Jebel Akhdar Dome, Oman Mountains. Tectonics 2018, 37, 888–913. [Google Scholar] [CrossRef]
- Mattern, F.; Scharf, A. Postobductional extension along and within the Frontal Range of the Eastern Oman Mountains. J. Asian Earth Sci. 2018, 154, 369–385. [Google Scholar] [CrossRef]
- Le Métour, J.; Platel, J.P.; Béchennec, F.; Berthiaux, A.; Chevrel, S.; Dubreuilh, J.; Roger, J.; Wyns, R. Geological Map of Oman, Scale 1:1,000,000; Directorate General of Minerals, Oman Ministry of Petroleum and Minerals: Muscat, Oman, 1993. [Google Scholar]
- Hacker, B.R.; Mosenfelder, J.L.; Gnos, E. Rapid emplacement of the Oman ophiolite: Thermal and geochronologic constraints. Tectonics 1996, 15, 1230–1247. [Google Scholar] [CrossRef] [Green Version]
- Blechschmidt, I.; Dumitrica, P.; Mater, A.; Krystyn, L.; Peters, T. Stratigraphic architecture of the northern Oman continental margin—Mesozoic Hamrat Duru Group, Hawasina complex, Oman. GeoArabia 2004, 9, 81–132. [Google Scholar]
- Agard, P.; Searle, M.P.; Alsop, G.I.; Dubacq, B. Crustal stacking and expulsion tectonics during continental subduction: P-T deformation constraints from Oman. Tectonics 2010, 29, 1–19. [Google Scholar] [CrossRef]
- Garber, J.M.; Rioux, M.; Kylander-Clark, A.R.; Hacker, B.R.; Vervoort, J.D.; Searle, M.P. Petrochronology of Wadi Tayin metamorphic sole metasediment, with implications for the thermal and tectonic evolution of the Samail Ophiolite (Oman/UAE). Tectonics 2020, 39. [Google Scholar] [CrossRef]
- Miller, J.M.; Gregory, R.; Gray, D.; Foster, D.A. Geological and geochronological constraints on the exhumation of a high-pressure metamorphic terrane, Oman. Geol. Soc. Spec. Publ. 1999, 154, 241–260. [Google Scholar] [CrossRef]
- Csontos, L.; Pocsai, T.; Sasvári, Á.; Palotai, M.; Árgyelán-Bagoly, G.; Fodor, L.I.; Magyari, Á.; Al-Wardi, M. Structural evolution of the Hawasina Window, Oman Mountains. GeoArabia 2010, 15, 85–124. [Google Scholar]
- Boudier, F.; Coleman, R.G. Cross section through the peridotite in the Samail ophiolite, southeastern Oman Mountains. J. Geophys. Res. Solid Earth 1981, 86, 2573–2592. [Google Scholar] [CrossRef]
- Béchennec, F.; Le Metour, J.; Rabu, D.; Bourdillon-de-Grissac, C.; De Wever, P.; Beurrier, M.; Villey, M. The Hawasina Nappes: Stratigraphy, palaeogeography and structural evolution of a fragment of the south-Tethyan passive continental margin. Geol. Soc. Spec. Publ. 1990, 49, 213–223. [Google Scholar] [CrossRef]
- Scharf, A.; Mattern, F.; Pracejus, B. Two new microscopic ductile kinematic indicators from the Oman Mountains. J. Struct. Geol. 2019, 119, 107–117. [Google Scholar] [CrossRef]
- Mann, A.; Hanna, S.S.; Nolan, S.C. The post-Campanian tectonic evolution of the Central Oman Mountains: Tertiary extension of the Eastern Arabian Margin. Geol. Soc. Spec. Publ. 1990, 49, 549–563. [Google Scholar] [CrossRef]
- Keppler, R.; Ullemeyer, K.; Behrmann, J.H.; Stipp, M. Potential of full pattern fit methods for the texture analysis of geological materials: Implications from texture measurements at the recently upgraded neutron time-of-flight diffractometer SKAT. J. Appl. Crystallogr. 2014, 47, 1520–1534. [Google Scholar] [CrossRef]
- Hielscher, R.; Schaeben, H. Multi-scale texture modeling. Math. Geosci. 2008, 40, 63–82. [Google Scholar] [CrossRef]
- Hielscher, R.; Schaeben, H. A novel pole figure inversion method: Specification of the MTEX algorithm. J. Appl. Crystallogr. 2008, 41, 1024–1037. [Google Scholar] [CrossRef]
- Hazen, R.; Finger, L.; Hemley, R.; Mao, H. High-pressure crystal chemistry and amorphization of α-quartz. Solid State Commun. 1989, 72, 507–511. [Google Scholar] [CrossRef]
- Markgraf, S.A.; Reeder, R.J. High-temperature structure refinements of calcite and magnesite. Am. Mineral. 1985, 70, 590–600. [Google Scholar]
- Britton, T.; Jiang, J.; Guo, Y.; Vilalta-Clemente, A.; Wallis, D.; Hansen, L.; Winkelmann, A.; Wilkinson, A. Tutorial: Crystal orientations and EBSD—Or which way is up? Mater. Charact. 2016, 117, 113–126. [Google Scholar] [CrossRef] [Green Version]
- Hallas, P. Tectonics of an Intracontinental Exhumation Channel in the Erzgebirge, Central Europe. Ph.D. Thesis, TU Bergakademie Freiberg, Freiberg, Germany, 2020. [Google Scholar]
- Kilian, R.; Heilbronner, R. Analysis of crystallographic preferred orientations of experimentally deformed Black Hills Quartzite. Solid Earth 2017, 8, 1095–1117. [Google Scholar] [CrossRef] [Green Version]
- Stipp, M.; Stünitz, H.; Heilbronner, R.; Schmid, S.M. The eastern Tonale fault zone: A ‘natural laboratory’ for crystal plastic deformation of quartz over a temperature range from 250 to 700 °C. J. Struct. Geol. 2002, 24, 1861–1884. [Google Scholar] [CrossRef]
- Wenk, H.-R.; Yu, R.; Vogel, S.; Vasin, R. Preferred orientation of quartz in metamorphic rocks from the Bergell Alps. Minerals 2019, 9, 277. [Google Scholar] [CrossRef] [Green Version]
- Lister, G.; Hobbs, B. The simulation of fabric development during plastic deformation and its application to quartzite: The influence of deformation history. J. Struct. Geol. 1980, 2, 355–370. [Google Scholar] [CrossRef]
- Schmid, S.; Casey, M. Complete fabric analysis of some commonly observed quartz c-axis patterns. Geophys. Monogr. 1986, 36, 263–286. [Google Scholar]
- Law, R.D. Deformation thermometry based on quartz c-axis fabrics and recrystallization microstructures: A review. J. Struct. Geol. 2014, 66, 129–161. [Google Scholar] [CrossRef]
- Tokle, L.; Hirth, G.; Behr, W.M. Flow laws and fabric transitions in wet quartzite. Earth Planet. Sci. Lett. 2019, 505, 152–161. [Google Scholar] [CrossRef]
- Morris, A.; Meyer, M.; Anderson, M.W.; MacLeod, C.J. Clockwise rotation of the entire Oman ophiolite occurred in a suprasubduction zone setting. Geology 2016, 44, 1055–1058. [Google Scholar] [CrossRef]


| Sample | Northing | Easting | s_f | l_min | Petrography | ||
|---|---|---|---|---|---|---|---|
| azi | dip | azi | dip | ||||
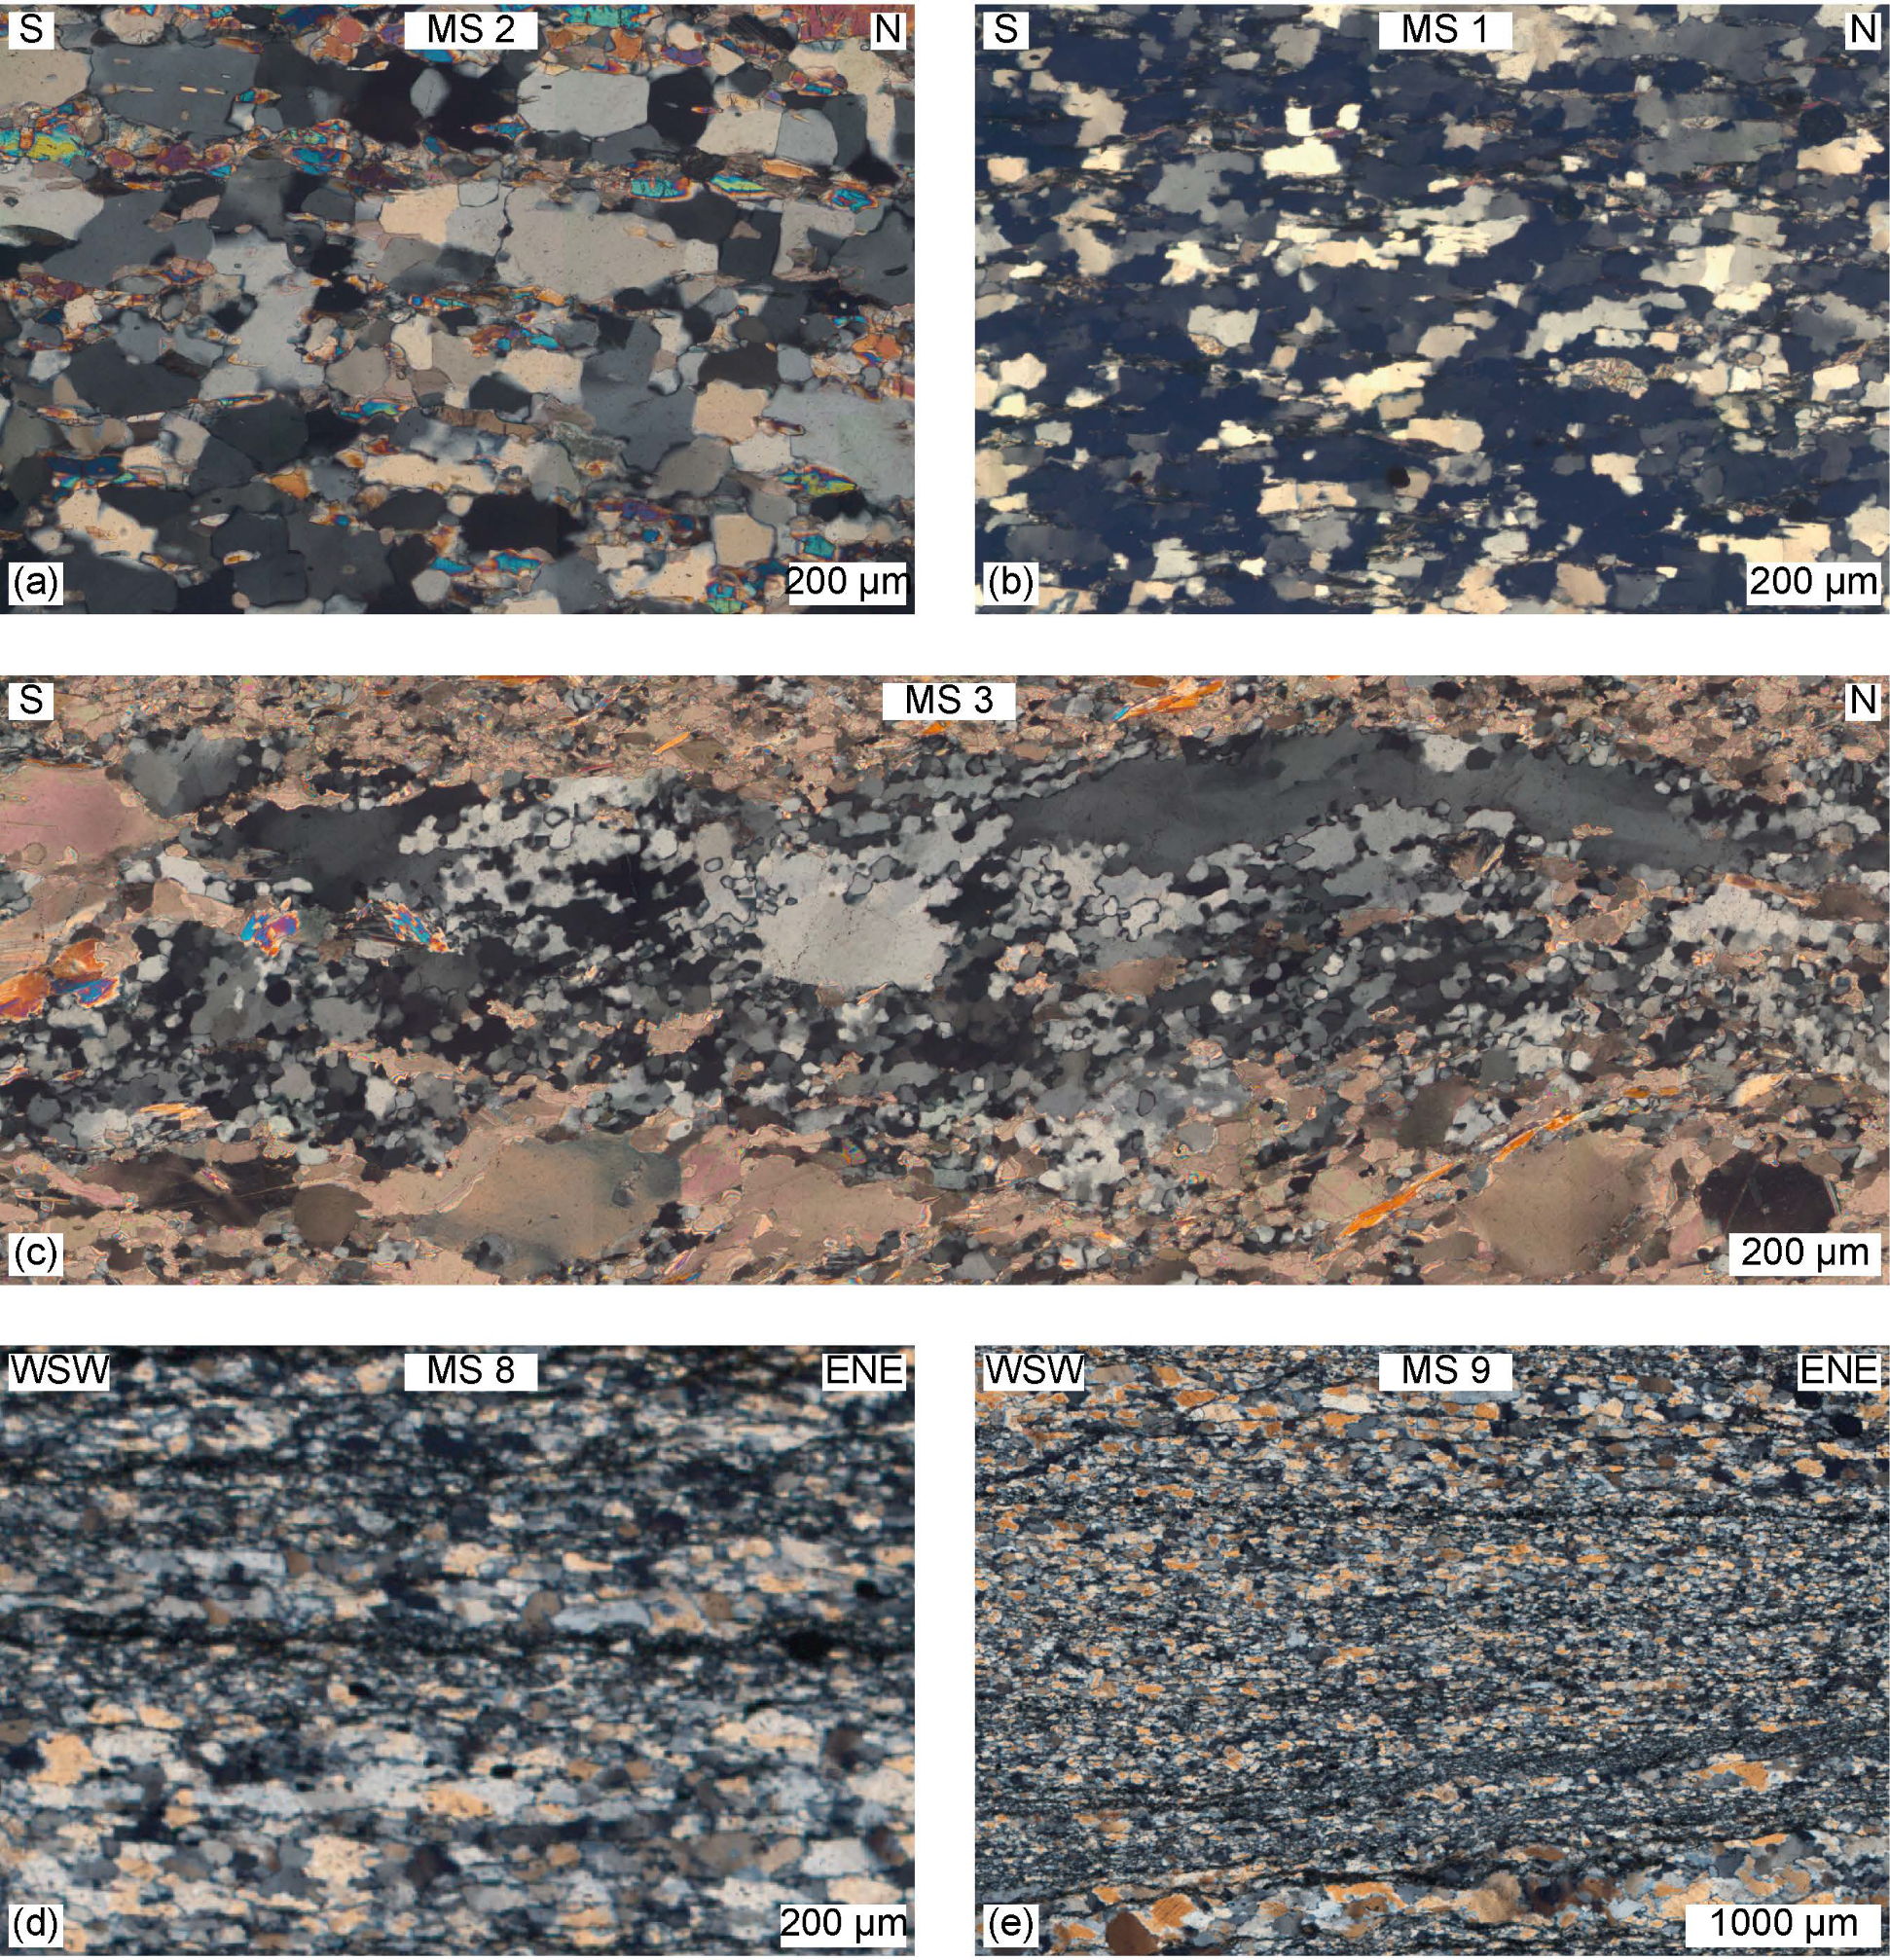
| MS 1 (HTb) | 23°25′24.6″ | 58°08′32.0″ | 292 | 54 | 022 | 24 | Grains show SPO that defines a continuous foliation developed by SGR or due to boundary pinning of a secondary phase. Irregular grain boundaries point to an overprint by GBM. |
| MS 2 (HTb) | 23°25′24.9″ | 58°08′32.6″ | 309 | 56 | 010 | 18 | Relatively high grain size of grains that show highly lobate grain boundaries indicative of predominant GBM (restricted due to calcite grains). |
| MS 3 (HTb) | 23°25′24.8″ | 58°08′31.6″ | 310 | 55 | 022 | 24 | Relicts of large leftover quartz grains with undulose extinction and weak elongated subgrains pass into domains of small new grains formed by BLG.Large grains are presumably signs of an older deformation with predominantly GBM. These show high intracrystalline deformation (undulose extinction). |
| MS 8 (LT) | 23°03′53.9″ | 58°35′49.4″ | 028 | 61 | 028 | 61 | Ultramylonitic quartzite characterized by uniform grain size, strong SPO, brick-shaped grains with plain boundaries. Microfabric resulted from thoroughgoing SGR. No hint of GBM. |
| MS 9 (LT) | 23°03′53.9″ | 58°35′49.5″ | 029 | 50 | 092 | 34 | Ultramylonitic quartz fabric comparable to MS 8. |
Publisher’s Note: MDPI stays neutral with regard to jurisdictional claims in published maps and institutional affiliations. |
© 2021 by the authors. Licensee MDPI, Basel, Switzerland. This article is an open access article distributed under the terms and conditions of the Creative Commons Attribution (CC BY) license (http://creativecommons.org/licenses/by/4.0/).
Share and Cite
Hallas, P.; Bauer, W. Texture and Shape Analysis of Quartzite Mylonites of the Metamorphic Sole of the Samail Ophiolite (Oman): Evidence for Syn- and Post-Obduction Deformation. Geosciences 2021, 11, 111. https://0-doi-org.brum.beds.ac.uk/10.3390/geosciences11030111
Hallas P, Bauer W. Texture and Shape Analysis of Quartzite Mylonites of the Metamorphic Sole of the Samail Ophiolite (Oman): Evidence for Syn- and Post-Obduction Deformation. Geosciences. 2021; 11(3):111. https://0-doi-org.brum.beds.ac.uk/10.3390/geosciences11030111
Chicago/Turabian StyleHallas, Peter, and Wilfried Bauer. 2021. "Texture and Shape Analysis of Quartzite Mylonites of the Metamorphic Sole of the Samail Ophiolite (Oman): Evidence for Syn- and Post-Obduction Deformation" Geosciences 11, no. 3: 111. https://0-doi-org.brum.beds.ac.uk/10.3390/geosciences11030111