
Effects of Stem Density and Reynolds Number on Fine Sediment Interception by Emergent Vegetation


1
Department of Geography, University of California, Berkeley, CA 94720, USA
2
Department of Civil and Environmental Engineering, University of California, Berkeley, CA 94720, USA
3
Department of Statistics, University of California, Berkeley, CA 94720, USA
*
Author to whom correspondence should be addressed.
†
Current address: California Institute of Technology, Pasadena, CA 91125, USA.
Geosciences 2021, 11(3), 136; https://0-doi-org.brum.beds.ac.uk/10.3390/geosciences11030136
Submission received: 11 January 2021
/
Revised: 4 March 2021
/
Accepted: 8 March 2021
/
Published: 14 March 2021
(This article belongs to the Special Issue Ecohydraulics and Ecomorphodynamics)
Abstract
:Suspended sediment collected by vegetation in marshes and wetlands contributes to vertical accretion, which can buffer against rising sea levels. Effective capture efficiency (ECE), a parameter quantifying the fraction of incoming suspended particles directly captured by underwater vegetation surfaces, plays a key role in determining the significance of direct interception in morphodynamic models. The ways in which physical characteristics of collectors and transitionally turbulent flows affect ECE are not yet thoroughly understood. We conducted a set of 12 experiments at three flow velocities and three stem densities (plus equivalent zero-collector control experiments), plus four experiments where biofilm was allowed to accumulate. We determined that ECE decreases with increasing collector Reynolds number (study range: 66 to 200; p < 0.05 for two of three treatments) and increasing collector density (solid volume fraction: 0.22% to 1.17%; p < 0.05 for two of three treatments). Adding biofilm increased ECE in all cases, by a multiplicative factor ranging from 1.53 to 7.15 at different collector densities and biofilm growth durations. In some cases, the impact of biofilm on ECE far outweighed that of collector Reynolds number and density. By combining our data with those of one similar study, we present a preliminary model quantitatively assessing the effect of collector density on ECE.
1. Introduction
1.1. Background
Coastal marsh and wetland ecosystems will likely suffer habitat degradation and range contraction due to sea level rise over the course of the 21st century [1,2]. However, models predict that vegetation will play an important role in determining the vertical accretion rate of these same habitats, which factors into their degree of adaptability to sea level rise [3,4]. In order to better predict sedimentation rates, as well as other properties that are related to sediment transport such as water quality [5] and ecological productivity [6], researchers and modelers require empirical estimates of the magnitudes of different interactions between aquatic vegetation and suspended sediment.
Aquatic plants affect sedimentation in many different ways. Stems, leaves, and other plant surfaces intercept suspended sediment [7,8,9] via direct capture, diffusional deposition, and inertial impaction [10,11,12] (Figure 1). Direct capture describes the mechanism whereby particles moving along flow streamlines in close proximity to the surface of a collector (e.g., stem) contact and are retained on that surface (Figure 2). Diffusional deposition describes collection due to Brownian motion and turbulent diffusion of particles. Inertial impaction describes capture where the inertia of sufficiently massive particles carries them into contact with collectors despite flow separation around the collectors.
Additionally, effects of plants on turbulence and flow patterns impact the rate at which suspended particles settle out of the water column due to gravity [8,9,13,14,15,16]. Plants also affect bedload transport [17,18,19] and reentrainment of cohesive sediment [20] and sand [21] by turbulent flow. Whereas larger particles may settle out of the water column due to decreased turbulence in vegetation patches [8,9,22,23], finer particles may be destined to either impact vegetation and be captured or to pass through vegetated areas without being retained.
It is widely agreed that vegetation biomass increases sedimentation in most tidal wetland settings [4,9,24,25,26], although the potential of stems to increase resuspension [21,27] suggests exceptions may occur in water with low suspended sediment concentration. As for the relative importance of the different mechanisms by which vegetation affects accretion rate, and the ways in which environmental and flow parameters shape these relationships, much remains unknown. Numerical modeling suggests that the proportion of sedimentation attributable to direct capture varies widely across various environmental conditions [9]. These models predict that in conditions with adequately high biomass and mean flow velocity, as much as 70% of the instantaneous sedimentation flux of fine (∼20 in diameter) particles may be attributable to direct capture. These sedimentation models applied a model of direct capture based on flume experiments involving a single isolated stem [28]. Subsequent laboratory studies [10,29] have found quite different results for patches of many collectors, which could impact the quantitative results of the sedimentation model.
1.2. Particle Capture Models
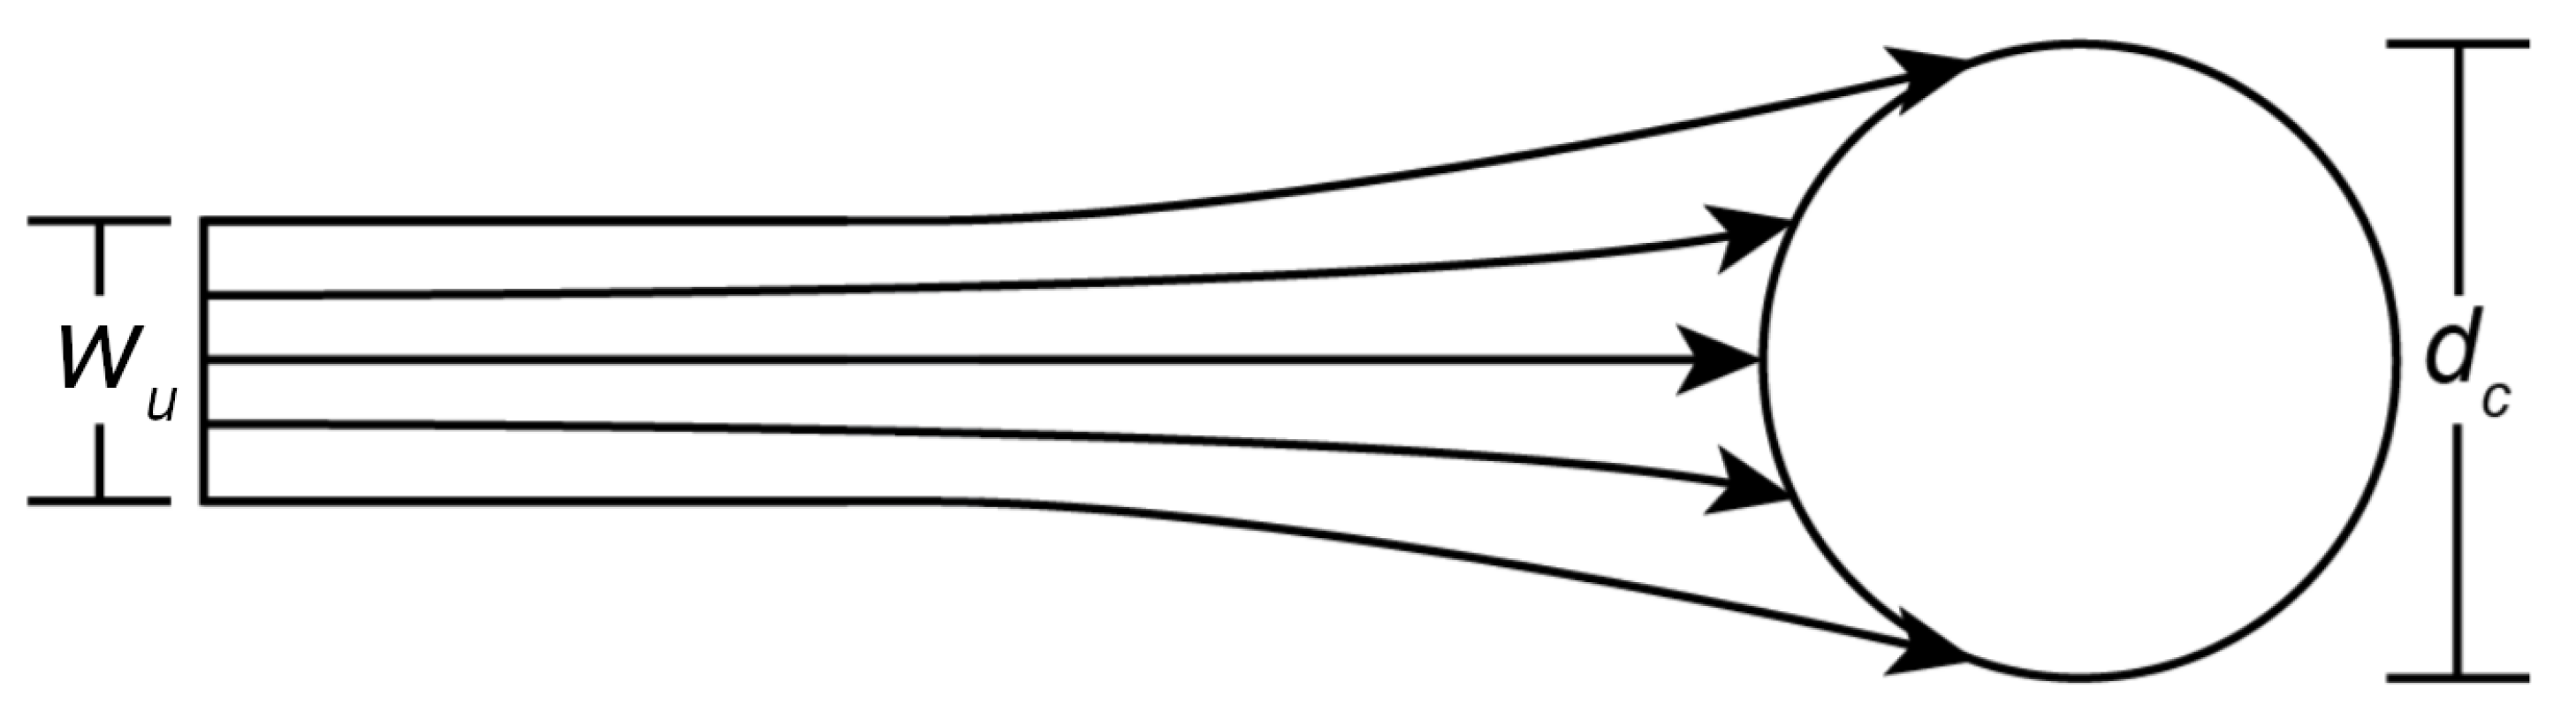
Capture efficiency () is a dimensionless parameter that describes the ability of a collector to capture suspended particles in an open-channel flow. For a collector modeled as a cylinder that extends from the channel bed to the air-water interface (e.g., emergent vegetation stems, dock pilings, bridge supports), in laminar flow, is defined as the ratio () between the upstream width of streamlines that reach the cylinder () and the diameter of the cylinder itself () [28] (Figure 2).
Figure 2.
A diagram illustrating capture efficiency for a cylindrical collector. is the cross-sectional width of streamlines in the upstream flow containing particles that will ultimately be captured, and is collector diameter. Adapted from Palmer et al. (2004) [28].
Figure 2.
A diagram illustrating capture efficiency for a cylindrical collector. is the cross-sectional width of streamlines in the upstream flow containing particles that will ultimately be captured, and is collector diameter. Adapted from Palmer et al. (2004) [28].

Effective capture efficiency (ECE; ) arose as a correction to that accounts for lateral dispersion in transitionally turbulent flows [30], the fact that not all particles contacting a collector will adhere to it [11,31], and the fact that affixed particles may later be sheared off [10,32]. These factors confound the estimation of in experimental and field settings, which was the primary motivation for the conception of ECE. In practice, ECE is also commonly conceptualized as the proportion of particles passing through the upstream projected cross-section of a collector that are effectively captured by the collector. While this overlooks the fact that lateral dispersion may bring particles from outside this projected cross-section into contact with the collector, it allows for simple conversion between ECE and , using a multiplicand conventionally referred to as the probability of retention ():
Physical properties of collectors, particles, and flow environments all affect capture efficiency, though their relative importances remain unclear. Greater flow velocities (u)—represented nondimensionally through the collector Reynolds number (), where is kinematic viscosity—and larger particle diameters () result in greater direct capture and inertial impaction of particles on stems in isolation [28,33]. However, increased u also results in increased turbulence intensity, particularly within vegetation canopies. Increased turbulence might trap particles in vortices distant from collector surfaces [29,34] and shear particles off of collectors [10], resulting in lower ECE. Increased and spatial density of collectors, which we parameterize as solid volume fraction, i.e., the fraction of underwater volume in a patch of vegetation occupied by plant matter (), can increase turbulence intensity in collector wakes. However, at sufficiently high densities, decreasing interstitial distance can limit turbulent eddy scale and have a damping effect on turbulence kinetic energy (TKE) [8,35]. Lastly, biofilm comprising algae, cyanobacteria, and other microorganisms that live on the surfaces of submerged vegetation, also affects capture efficiency [10]. Increased stem roughness [28] seems a likely mechanism for this effect, along with possibly improved particle adherence [36].
While analytical expressions exist for particle capture in creeping and potential flows [33,37,38], the complexity of the effects described above precludes theoretical solutions for laminar to transitional flow (approximately ), which occurs commonly in vegetated aquatic environments and on the length scales of aquatic macrophytes. Seeking to bridge this knowledge gap using empirical estimation, Palmer et al. [28] conducted flume experiments on an isolated single cylinder coated with grease, for which retention was assumed to be complete (), yielding the model:
where . Wu et al. [39] studied single-collector capture efficiency of colloid particles, which have different physicochemical interactions with collector surfaces than sediment particles, and which fit a different model:
where is contact efficiency, which accounts for due to particles not adhering on initial contact but still assumes zero resuspension, and is the Peclet number (, where D is the diffusion coefficient of the sediment). We include Equation (3) because of its novel prediction of a negative relationship between and ECE. However, because their study focused on laminar flow, Equation (3) might not scale to transitionally turbulent conditions, and its derivation from study of colloid particles in particular might limit its applicability to capture of the range of sediment diameters in real-world environments.
Before our investigation, two other laboratory studies examined sediment capture in patches of multiple collectors [10,29]. Purich [29], who also used greased cylindrical collectors, found a negative relationship between and for their intermediate collector-density treatment, but little to no effect—and low absolute values—for their high- and low-density treatments. Fauria et al. [10] studied artificial leaves as opposed to stems and yielded a new model for ECE in patches of multiple collectors based on the form of Equation (2):
They left C as a coefficient dependent on their other explicative variables: collector density and biofilm. While they did find higher ECE at lower collector density, and with biofilm present, they only examined two collector-density treatments, and only determined the effect of biofilm for one of the two. Their study design also did not differentiate enhanced gravitational settling theorized to occur in the proximity of collectors from direct capture on their surfaces. Perhaps most importantly, neither study examined uncertainty in their respective ECE or estimates. Quantifying experimental and statistical uncertainty, especially important for laborious flume experiments that often have few replicates, could shed light on the reported discrepancies in results across experiments.
With numerous variables differing between relatively few studies, additional experimental work is needed to fill in yet unexplored parameter combinations. For example, Fauria et al. [10] tested Equation (4) on leaf-shaped collectors as opposed to the vertical cylinders used in prior studies [28,29], and the predictions of that equation have yet to be compared to laboratory measurements for ECE in patches of multiple vertical stems. Additionally, the physical properties of the synthetic particulate matter used by Purich [29]—who did study patches of multiple stems—do not match those expected for suspended sediment in most natural settings.
With so little presently understood about interception processes, “rigorous” quantification involves understanding how both physical and chemical/biological factors affect capture efficiency. Because surficial properties of biofilm vary widely with species composition and environmental conditions (e.g., temperature, light, nutrient levels, macrophyte species) [40,41,42,43], we adopted an experimental flume approach with surrogate collectors (dowels) to isolate the effects of physical factors on interception, holding the influence of surficial properties constant by coating the dowels with silicone grease. In a second set of experiments, we cultured biofilm on the dowel surfaces to semi-quantitatively estimate the potential importance of varying surficial properties relative to that of varying physical properties in conditions representative of wetlands. Our study builds on previous work by testing Equation (4) for cylindrical collectors across a range of similar to Fauria et al. [10], but with an expanded range of values to explicitly uncover its relationship to ECE. Additionally, we measured TKE in situ to assess its role as a mediator variable between collector density and ECE, estimated the importance of biofilm relative to and across a range of collector densities, estimated uncertainty in ECE for our particular experimental conditions, and took the first steps towards developing a quantitative model for ECE as a function of . We refer readers to Stein et al. [44] for development of a synthesis model for ECE based conjunctively on this study and others reported in the literature.
2. Materials and Methods
2.1. Experimental Methods
2.1.1. Materials
We conducted our experiments in the Ecogeomorphology flume, an indoor (22.2 ± 1 ) recirculating flume located in McCone Hall at the University of California, Berkeley. The flume has a rectangular open-channel section (5.25 m length × 0.6 m width × 0.6 m height) with a bed and sidewalls that are smooth and transparent and a removable false bottom. At both its upstream and downstream ends, this section connects to rectangular ducts with gradually changing hydraulic diameter and rounded corners with curved vertical manifolds. Upstream of the open-channel section, a honeycomb flow collimator further straightens flow streamlines (Figure 3). These features mitigate development of secondary and large-scale circulation features outside of the experimental test section.
In turn, the ducts guide water to and from the inlet and outlet of the pump array, which consists of a disc pump (Discflo Pumps Corporation, Santee, CA), and a magnetic flowmeter, connected by PVC pipe. This type of pump uses rotating discs to generate viscous drag, which entrains fluid and suspended particles through its interior chamber while maintaining laminar flow and avoiding structural disruption, pulsation, and abrasion [45]. Altogether, the flume design maintains constant, adjustable discharge through the open channel, minimizing background turbulence and other artifacts that arise with other types of pumps, and is particularly suitable for experimental studies of fine sediment transport.
Within the open channel, we instrumented a test section 1.95 m in length with the following devices:
- A flat-bedded array positioned flush with the neighboring channel bed, containing vertical, emergent collector stems.
- Two battery-operated peristaltic pumps (Cole-Parmer, Vernon Hills, IL) used to sample suspended particle concentration via three hose inlets each (inside diameter = 3.1 mm), which were suspended at a range of heights from the channel bed (5; 14; 27 cm); these were positioned 50 cm upstream and downstream of the test section and were sampled at a flow rate equivalent to the mean flume velocity.
- Sediment traps (n = 9) with 2.5 cm circular openings flush with the bed and collection filters (Whatman GF/F) on perforated filter holders recessed in a 5 cm deep cylindrical cavity (trap Reynolds number and aspect ratio chosen to minimize bias [46]), interspersed among the collectors in a grid-like pattern (Figure 3).
We used 1/8 (0.3175 cm) cylindrical wooden dowels as collectors, which we covered in silicone grease (Chemplex 710, Fuchs Petrolub, Mannheim, Germany) in order to retain impacted particles, and spread randomly throughout the test section at the appropriate density. Crushed walnut shell served as an analogue for suspended sediment because it has physical properties comparable to the organic-rich types common in wetlands [47,48,49], has been used widely in flume experiments [50,51,52], and is easily attainable in controlled grain-size distributions. We used WF5-200 grade (Composition Materials Co., Milford, CT, USA), which passes entirely through a #60 sieve ( 250 ) and has an average particle diameter () of based on measurements using a laser-scattering-based instrument (LISST-Portable|XR, Sequoia Scientific, Bellevue, WA, USA; See Appendix A.1 in Appendix A). We also empirically estimated the particle density of this specific walnut shell flour to be 1.53 / using volume displacement. The settling velocity of a median-sized particle () was estimated at 0.19 mm/s using Stokes’ law, which provides a reasonable approximation for the relatively low TKE values observed.
2.1.2. Suspended Particle Concentration Analysis
We conducted experimental runs for a fully-crossed parameter space of collector Reynolds number (67; 134; 200) and collector density (0; 285; 821; 1487 collectors/m bed area). We chose these values, as well as other experimental parameters held constant throughout, because they correspond to those that might occur for emergent grasses or reeds in natural settings (Table 1) [53]. We used a zero-collector control density to isolate the effects of our experimental installations from the background effects of the rest of the flume.
Before each experiment, we filled the flume with tap water to 0.4 m depth in the test section, which was enough to fully submerge the pump and almost the entirety of the duct length. At this depth, the volume of water in the entire flume measured approximately 2.43 m (See Appendix A.2). We used a Nortek Vectrino Profiler ADV (acoustic Doppler velocimeter; Nortek AS, Vangkroken 2, 1351 Rud, Norway) to calibrate the pump flow rate to channel mean flow velocity. At the experimental flow velocities (2.0; 4.0; 6.0 /), circulation times for the entire system were 506 s, 253 s, and 169 s, respectively. We did not detect an effect of drag forces caused by collectors on upstream or downstream flow velocities. We also used the Vectrino Profiler to measure bed shear stress and shear velocity for the maximum flow-velocity treatment. We positioned the probe in the middle of the channel, as close to the bed as possible while avoiding signal interference (10 cm), and estimated shear stress from the velocity profile measured (∼4–6 cm from the bed) [63] and the dynamic viscosity of water at ( ). This method yielded a shear stress value of Pa in a region of the flow at the maximum collector-density treatment, and Pa for a region free of collectors, from which we computed shear velocities of 2.94 mm/s and 3.10 mm/s, respectively.
We installed sediment traps before each run, then added a slurry consisting of 200 g of crushed walnut shell suspended in 15.1 L of tap water using a spigot calibrated to finish draining after a period roughly equal to circulation time (3 min). Test-section flow velocity remained at 6 cm/s during this period across treatments, before being adjusted to the appropriate value for the treatment. This procedure distributed particles longitudinally throughout the flume fairly evenly. The estimated depth-averaged starting concentration was 82.3 mg/L ( /).
In preliminary experiments, we determined that 100 min was more than adequate to capture the effects of settling and capture on suspended sediment concentrations across our parameter space. We sampled suspended sediment concentration from the six peristaltic pump hoses every five minutes, the first sample occurring five minutes after we began adding sediment to the flume. Samples measured approximately 140 mL in volume, and our sampling frequency resulted in 19 sampled time steps per experiment. We covered sediment traps with a plunger at 100 min and then removed them. We processed peristaltic pump samples using vacuum filtration through pre-weighed glass microfiber filters (Whatman GF/F). Both peristaltic pump and sediment trap samples underwent oven-drying to constant weight at 40 , and finally gravimetric mass analysis. We attributed individual samples with anomalously low (<8 mg/L) or high (>80 mg/L) concentrations to measurement error and did not include them in analyses.
2.1.3. Estimating Collector-Induced Turbulence
We measured mid-water-column TKE within the collectors for each combination of and collector density using the Vectrino Profiler ADV mounted on a frame suspended above the test section. The ADV measured longitudinal, lateral, and vertical flow velocity components at a frequency of 10 Hz. We collected 5 min of data per treatment in order to achieve stationarity of flow and turbulence statistics. We then filtered these measurements to leave out timepoints where the two vertical velocity measurements differed by more than 50% or the signal-to-noise-ratio reading was less than 5 dB, and despiked them using a phase-space thresholding algorithm [64]. We derived TKE from the cleaned Vectrino data according to its definition as half the sum of the variances of the velocity components:
2.1.4. Biofilm Growth
The effect of biofilm on the surficial properties of collectors, and thereby their ECE, was another factor of interest for our experiment. While we did not incorporate biofilm into the fully-crossed parameter space of other explicative variables due to the time-intensiveness of growing microbial communities, we did carry out an auxiliary experiment to roughly assess its effect size. After one of the experiments at each collector density, the water in the flume came to rest, and the collectors then remained constantly illuminated by a fluorescent grow-light for a measured number of days. The crushed walnut shell served as the food source for the microorganisms constituting the biofilm.
Once biofilm became visually apparent on the surfaces of the collectors, we conducted an experiment using the same materials and protocols as the treatments without biofilm, holding constant between biofilm treatments. The length of time it took for robust biofilm growth to occur differed between the minimum, intermediate, and maximum collector-density treatments (13; 18; 20 days, respectively). For the maximum collector-density treatment, we performed a follow-up experiment with a longer growth period (46 days). We did not quantitatively assess biofilm mass but assumed that the number of days it was allowed to grow could act as a proxy, albeit nonlinear due to the likelihood of exponential or logistic growth.
2.2. Sediment Transport and Particle Capture Model
2.2.1. Model Derivation
We used an exponential decay model for suspended sediment concentration in the flume adapted from Fauria et al. [10] to estimate ECE ():
Here, is the depth-averaged suspended sediment concentration at time t, where h is water depth, z is height above the bed, and is concentration at height z. is the exponential time-decay rate of due to effective settling corrected by a constant proportion () for entrainment (represented through the dimensionless entrainment rate ), a simplification justifiable for the constant flow conditions of the flume experiment. Effective settling is calculated from settling velocity (), h, and a constant () that relates to near-bed sediment concentration. Because we observed a nearly homogeneous vertical profile of suspended sediment concentration (See Appendix A.3), for our experiments. A detailed derivation of is available in Fauria et al. [10]. = is the rate at which particles are removed from suspension due to capture by collectors. is collector density, where is the total number of stems, and V is the volume of water in which stems are contained; for emergent stems, simplifies to the count of collectors per unit area of the channel bed. Equation (6) assumes that potential particle binding sites on the stems remain unsaturated. The solution of this differential equation is as follows:
To calculate , we began by calculating the average mass of sediment that settled per sediment trap over the duration of the experiment (100 min). We then scaled this measurement up from the area of a sediment trap’s horizontal opening (5.07 m) to the total test section bed area (1.17 m), and divided the resulting estimate of the sediment mass settled in the test section () by the total mass removed from suspension during a run in order to calculate the proportion of the decrease due to settling. We multiplied this proportion by the total exponential decay coefficient, k, to calculate :
where is the mass of sediment suspended at the beginning of the experiment and T is the total duration of the experiment.
The equations above model capture and settling in the test section alone. To account for settling and reentrainment outside the test section, we estimated a background exponential decay rate () using the control runs with zero collectors for each treatment (). We then calculated ECE for our collector-density treatments from . Also, because collectors only act on suspended particles while they are passing through the test section, we scaled this estimate for ECE by the ratio (5.19) between the total volume of water in the flume ( ) and :
2.2.2. Model Execution
In order to correct for observed heteroscedasticity (See Appendix A.4) across time, with earlier, higher-concentration measurements showing greater variance, we log-transformed the exponential model (Equation (7)). This resulted in a linear model taking the form
which was evaluated for each experimental configuration separately. Bold font signifies vector variables, and is the random error term of the model. We used the error propagation formula for independent variables [65] to propagate the standard error of the k term from Equation (10) and the standard deviation of estimates from sediment traps through Equations (8) and (9), for both control and treatment runs, yielding our uncertainty estimates for ECE.
Because we observed a nearly homogeneous vertical profile of suspended sediment concentration (See Appendix A.3), we opted to pool data from all six suspended sediment sampling locations. While we might slightly overestimate or underestimate absolute concentration this way, we expect k to be vertically invariant and thus estimated ECE would not be affected.
We used a Monte Carlo approach to assess the significance of the effects of our independent variables, and , on ECE. We parameterized separate normal probability density functions (PDFs) for each combination of and (n = 9), with mean equal to the empirically estimated ECE for that combination, and standard deviation equal to the standard error of that estimate. We then generated one vector for each PDF, consisting of 30,000 values sampled randomly from that distribution. Because we expected effects of and on ECE to fit a power law, we performed logarithmic transformation on these values. For each level of a given independent variable, we performed ordinary least squares regression on triplets comprising one randomly sampled value from each of the three levels of the other independent variable, calculating a combined total of 30,000 × 6 = 180,000 slopes (). We used these distributions of slopes, which were roughly normal, in two-tailed t-tests (null hypothesis: ; ) to determine the significance of each independent variable’s effect on ECE for each level of the other.
3. Results
Our experimental runs consistently yielded good fit to Equation (10) (See Appendix A.5). For runs without biofilm, our estimates of k spanned – s, spanned – s, spanned – s, and spanned – s.
3.1. Particle Capture
ECE decreased with increasing and throughout our parameter space, with one exception (Figure 4). This exception occurred at the minimum collector density (), where the intermediate treatment () had lower ECE than both the minimum and maximum treatments. When compared to the other treatments with the same intermediate value, the ECE calculated for this minimum collector-density treatment was slightly lower than the intermediate collector-density treatment, and was greater than the maximum collector-density treatment. Our experimental uncertainty was great enough that this might be attributable to random error. However, repeating the experiment with the same parameters yielded a nearly identical result (omitted from analysis).
Monte Carlo analysis revealed that there is a significant negative relationship between ECE and collector density for the minimum (p = 0.004) and maximum (p = 0.019) treatments, but did not detect a significant effect (p > 0.05) for the intermediate treatment (Figure 5a). We also found a significant negative relationship between ECE and for the minimum (p = 0.026) and maximum (p = 0.046) collector-density treatments, but an insignificant (p > 0.05) trend for the intermediate collector-density treatment (Figure 5b).
3.2. Turbulence
TKE consistently increased with increasing flow velocity as expected (Table 2). Generally, greater collector density also led to greater TKE, with the greatest increase in terms of both absolute and relative magnitude taking place between the minimum and intermediate collector-density treatments. A slight decrease actually occurred thereafter (i.e., between the intermediate and maximum collector densities) for the intermediate and maximum treatments, with a slight increase in the case of the minimum treatment. The similarity of TKE for the upper two collector-density treatments suggests a potential threshold occurring before or near the value of the intermediate treatment. ECE and TKE exhibited a negative relationship across the experimental parameter space (n = 9) taken as a whole (Figure 6).
3.3. Biofilm Effects
We observed robust biofilm growth throughout the test section. Biofilm grew on the surfaces of collectors in filaments less than 5 cm long that were oriented downstream. Biofilm growth consistently increased ECE (Figure 7). For the runs conducted when biofilm was first observed to be abundant in the test section (13–20 days), both absolute (+0.71% ECE) and relative (an improvement to 2.48 times non-biofilm ECE) increase were greatest by a considerable margin at the minimum collector density, which also had the shortest growth period (13 days). The intermediate and maximum collector densities demonstrated fairly similar absolute increase (+0.09% ECE and +0.07% ECE, respectively) and relative increase (1.53 times and 1.73 times, respectively). Interestingly, in our test of a longer grow time (46 days) at the maximum collector density, ECE increased with far greater relative (7.15 times) and absolute (+0.60% ECE) magnitude, suggesting that the other runs might not have been at saturation in terms of biofilm mass.
3.4. Comparison to Previous Models of Capture Efficiency
Aside from the outlier at the intermediate × minimum collector-density treatment, all of our observations were in agreement with Equation (4). In no other case did the model prediction differ from our empirical observation by more than one standard error (Figure 8). Moreover, the model relating C in Equation (4) to yielded a good fit (; Figure 9):
The model underestimated C for all of the collector-density treatments tested here, and overestimated it for both of those from Fauria et al. ( = 0.82%, 2.16%). However, the magnitudes of these residuals were small in comparison to the absolute differences in C among the various values (n = 5). Data scarcity should be considered a limiting factor in the interpretation of these results.
4. Discussion
4.1. Inferred Mechanisms of Effect for Collector Density and Reynolds Number
Previously published models for ECE by Fauria et al. [10] and for by Palmer et al. [28] focus primarily on the effects of and R on particle capture. However, our results (Figure 8 and Figure 9) imply that the sensitivity of ECE to is greater than its sensitivity to . We attribute the greater sensitivity of ECE to to the enhanced levels of turbulence in denser vegetation canopies. Based on single-collector theory, all experimental runs here fall within laminar ( < 150) to transitional (150 < < 300) flow regimes, with alternate shedding of vortices in a von Karman vortex street for 40 < < 150. At low vegetation densities approaching single-collector scaling, increasing results in increased eddy size, lengthening the distance between particles trapped in eddy cores and stems and thereby decreasing the likelihood of capture via van der Waals forces [34]. Increases in vegetation density, however, can promote flow regime transitions at lower , as seems apparent in the abrupt shift to high TKE at the = 134 level (i.e., slightly lower than the = 150 shift to transitional flow in single-collector theory) in our data for of 0.64% and higher (Table 2). When levels of TKE increase substantially as such, streamlines become less straight, deflecting incoming particles away from collectors downstream of the leading edge of the patch. Additionally, stronger velocity gradients around stems with increased TKE would produce greater shear stress on affixed particles, promoting resuspension and decreasing ECE (e.g., [10]). Intuitively, the effects on ECE of reduced delivery of particles to stems and increased resuspension, arising as a result of canopy-induced turbulence, would outweigh those of increased eddy scale associated with over the ranges of and evaluated here.
Our results suggested that at combinations of canopy densities and adequate for onset of turbulence (i.e., ≥ 134 and ≥ 0.64%), further increases in while holding constant produced a slight decrease in TKE (Table 2). This shift in the relationship between TKE and collector density likely reflects convergence of the turbulent eddy scale and the distance between collectors, so that additional collectors acted to damp eddies as much or more than they acted to create them. This compounds previous evidence, from both field observations [8] and laboratory studies [29,35], of a local negative relationship between collector density and turbulence intensity. Accounting for the nonlinear relationship between collector density and collector-induced turbulence in future models and experiments seems feasible and important. In general, moving on from simplistic power-law models, developed to bridge the gap between analytical expressions for creeping and potential flows, to more robust empirical models for transitionally turbulent conditions [44] shows promise as an avenue for future investigation.
Altogether, our results demonstrate that Equation (4) remains a reasonably good predictor of ECE even at collector densities lower than those studied by Fauria et al. [10]. Further, they add to the pool of evidence that ECE in vegetation canopies is negatively related to [10,29,36], as opposed to the positive relationship observed for single collectors [28]. This finding has implications for realistic modeling of sedimentation in coastal wetlands under sea-level rise scenarios, as existing models that incorporate particle interception [9,20] assume the positive relationship of Palmer [28] (see detailed comparison in [44]). These models, however, would also need to incorporate the unsteady flow dynamics typical of tidal wetlands, and variable flow directions may result in ECE values different from estimates arising from unidirectional flume experiments.
4.2. Relative Importance of Biofilm
The high prevalence of biofilm on plants in nature [40,41], in combination with our observation that biofilm growth (on top of silicone gel) consistently increased ECE values beyond those observed for solely a silicone gel coating, suggests that our non-biofilm ECE estimates are conservative relative to values expected in natural settings amenable to microbial colonization. Because Fauria et al. [10] already confirmed that the negative effect of on ECE occurs both with and without biofilm present, and because the duration of growth makes biofilm runs quite time-intensive, we focused solely on the interactions between collector density and biofilm. Roughly equivalent biofilm growth across our collector density parameter range resulted in similar relative increase of ECE (improvement to 1.53–2.38 times control), despite the difference in absolute values of ECE across the collector density range. As Fauria et al. [10] found for , runs with biofilm—like biofilm-absent runs—exhibited a consistent decline in ECE with increasing collector density.
Absolute effects of biofilm were similar in magnitude to those of and collector density across our parameter space. At the Reynolds number (200) used for biofilm experiments, ECE ranged from 0.10% to 0.48% across our collector-density treatments without biofilm, for an effect size of 0.38%, and absolute effects of biofilm ranged from +0.07% ECE to +0.71% ECE. Absolute effects of (0.20%–1.71% ECE) on ECE for specific collector densities were larger than the biofilm effect sizes by a ratio of roughly 2.5:1. This demonstrates that biofilm yields an effect size on the same order of magnitude as the other variables. We will also highlight the fact that a longer growth period resulted in a much greater biofilm effect in terms of relative magnitude (improvement to 7.15 times control). If this indicates that our other runs were not saturated in terms of biofilm mass, then it leaves open the possibility that in natural waters where biofilm faces little light or nutrient limitation, the effect of biofilm might play a dominant role in driving sediment capture. This could result in capture efficiencies considerably greater than those we observed in our laboratory setting.
The multiplicative nature of the relationship between biofilm and ECE, and the apparent importance of biofilm relative to other factors, together warrant research to better quantify the effects of biofilm on a per-mass basis. We are unable to do so here because we did not measure biofilm growth quantitatively, aside from our effort to standardize it across treatments of the other variables. To develop such a model, more sophisticated hydroponic equipment to monitor and account for factors impacting growth rate [66,67], and protocols for measuring the mass and other characteristics of biofilm grown [68,69], should be incorporated in future experiments. Additionally, the strands we observed forming on collectors led us to question the relative proportion of capture due to filamentous versus surface-clinging biofilm, another question in need of investigation.
5. Conclusions
Interception of sediment by vegetation stems and leaves has remained a poorly understood component of coastal sedimentation budgets, despite recent empirical progress. Our set of flume experiments served to (1) fill gaps in understanding the nature of the functional relationship between ECE and Reynolds number and stem density over the full range in these values expected for natural settings; (2) provide insight into apparent inconsistencies in this functional relationship across previous experimental studies; and (3) elucidate the relative magnitude of the effects of stem biofilms on ECE in comparison to other drivers. Our results provided strong support for a negative relationship between ECE and but suggested that, for relatively low (i.e., < 0.64%), increasing has a more substantial negative effect on ECE than increasing . We attribute this strong negative effect of to the production of turbulence within vegetation canopies in a regime that would otherwise be dominantly characterized by laminar flow patterns, and the consequent deflection of particles away from stems, together with shear-driven resuspension of particles already captured by stems. The effect diminishes for further increases in stem density as turbulence eddy scale becomes limited by stem spacing and is also small when is not sufficient for transitional flow regardless of canopy structure. On the whole, however, the effect of on ECE—distinct from that of —is well represented through a negative power-law relationship.
With the modified coefficient formulated as a power-law function of , the model of Fauria et al. [10] fits our set of experimental observations—obtained over a range of canopy densities and flow velocities expected in tidal wetlands—well, within experimental error bounds. These results indicate that the equation currently used to represent interception in some models [9,20] is poorly applicable to vegetation canopies and hence should be updated. While predicted values of ECE resulting from the model of Fauria et al. [10] are lower than predictions from the latter model (typically less than 1.0%, except for laminar flow conditions, with < 100), these low efficiencies may result in substantial sedimentation fluxes when sediment is delivered to stems continually or periodically over long periods of time (see Stein et al. [44]).
Last, our results suggest that the presence or absence of biofilm on vegetation stems has an effect on ECE that is of a magnitude similar to that of varying or over their full expected ranges, and possibly greater if stems become saturated with biofilm. The effect of biofilm likely varies in a site-specific way, dependent on light, nutrients, and species compositions, and hence may be more difficult to incorporate into sedimentation models. Though further study is warranted, our results suggest that the presence of biofilm may increase the magnitude of ECE by up to a factor of ∼7.
Author Contributions
Conceptualization, L.L., J.N., and J.W.; methodology, L.L. and J.W.; software, L.L., J.N., J.W., and C.Y.; validation, J.W.; formal analysis, J.W. and C.Y.; investigation, J.N., J.W., and C.Y.; resources, L.L.; data curation, J.W.; writing—original draft preparation, J.N., J.W., and C.Y.; writing—review and editing, L.L., J.N., J.W., and C.Y.; visualization, J.N., J.W., and C.Y.; supervision, L.L., J.W., and C.Y.; project administration, L.L. and J.W.; funding acquisition, L.L. All authors have read and agreed to the published version of the manuscript.
Funding
This research was funded by NSF award EAR-1455362, with additional funding from the Berkeley Undergraduate Research Apprenticeship Program.
Data Availability Statement
Raw data and computer code for this study are available publicly on our repository.
Acknowledgments
The authors wish to thank and acknowledge Colin Keating and Aaron Hurst for their helpful work on preliminary flume experiments. We also wish to express great thanks to Yayla Sezginer, Elle Chen, Nicole Ulakovic, Katrina Ginsberg, and Danielle Satin for their time spent preparing for experiments, maintaining the flume, and carrying out other important laboratory tasks. We wish to thank Sam Stein and Sheila Trampush for graciously sharing data and participating in brainstorming sessions while working on concurrent studies within the same general topic area. Last, we thank two anonymous reviewers and the associate editor for comments that resulted in substantial improvement of the manuscript.
Conflicts of Interest
The authors declare no conflict of interest.
Abbreviations
The following notations are used in this manuscript:
| capture efficiency, dimensionless | |
| upstream width of streamlines that intersect a collector, cm | |
| collector diameter, cm | |
| effective capture efficiency (ECE), dimensionless | |
| probability of particle retention, dimensionless | |
| u | flow velocity, cm/s |
| collector Reynolds number, dimensionless | |
| kinematic viscosity, / | |
| particle diameter, | |
| collector solid volume fraction, dimensionless | |
| R | particle-collector diameter ratio, dimensionless |
| Peclet number, dimensionless | |
| D | diffusion coefficient, / |
| depth-averaged suspended sediment concentration, / | |
| t | time, s |
| h | water depth, cm |
| z | height above the bed, cm |
| suspended sediment concentration at height z, / | |
| concentration time-decay due to settling, s | |
| settling velocity, cm/s | |
| constant relating near-bed concentration to depth-averaged concentration, dimensionless | |
| entrainment rate, dimensionless | |
| concentration time-decay due to capture, s | |
| collector height density, / | |
| number of collectors, # | |
| V | test-section water volume, |
| sediment mass settled in test section, g | |
| sediment mass suspended at beginning of experiment, g | |
| T | total duration of experiment, s |
| k | total concentration time decay, s |
| background concentration time-decay, s | |
| power-law coefficient for parameter i, dimensionless |
Appendix A. Secondary Methodology
Appendix A.1. Particle Size
Figure A1.
Walnut shell flour (WF5-200) particle size distribution, as measured by LISST-XR|Portable. (a) Probability density function, with mode ( ) indicated. (b) Cumulative density function, with 50th ( ) and 84th ( ) percentiles highlighted.
Figure A1.
Walnut shell flour (WF5-200) particle size distribution, as measured by LISST-XR|Portable. (a) Probability density function, with mode ( ) indicated. (b) Cumulative density function, with 50th ( ) and 84th ( ) percentiles highlighted.

Appendix A.2. Flume Volume
In order to estimate ECE based on the decline in measured suspended sediment concentrations over time, we needed to correct flume-averaged decay by accounting for the ratio between the test section volume (1.95 m × 0.6 m × 0.4 m = m3) and the water volume of the flume’s entire wetted floorplan under experimental conditions (depth = 0.4 m in test section). To derive this ratio, we calculated the wetted volume of the flume empirically.
We drained the flume after an experiment while measuring flow rate at the drain outlet over time, performed polynomial regression (Figure A2), and calculated a definite integral () from when draining began to when the part of the flume involved in the experimental flows was empty. Polynomials of second order and above fit well and yielded very similar volume estimates, lending confidence to our use of as the flume volume in the calculations (Table A1).

Table A1.
Polynomial model summary.
| Model | Estimated Volume (m3) | R2 |
|---|---|---|
| Linear | 2.4309 | 0.80 |
| Quadratic | 2.4277 | 0.90 |
| Cubic | 2.4373 | 0.94 |
| 4th-order | 2.4294 | 0.96 |
Figure A2.
Polynomial models predicting the rate at which the flume drained.

Appendix A.3. Concentration Profile
To roughly estimate the shape of the concentration profile, we pooled suspended sediment concentration data from all 9 non-biofilm runs with collectors present. Because average concentration changed over time, measurements were normalized in proportion to the average of concentration measurements collected at the same time step of the same experiment, then were plotted by depth (Figure A3). Sample sizes varied slightly between heights due to outlier removal as described in Section 2.1.2. The primary finding of this analysis is that the vertical concentration profile is close enough to homogeneous that is a safe assumption.
Figure A3.
A ridgeline plot of suspended sediment concentration measurements. At each height where we measured concentration (5, 14, and 27 cm above the bed), a smoothed histogram of normalized concentration measurements at that height is inset. Points and dashed vertical lines indicate mean values (), which are also annotated along with sample size.

Appendix A.4. Heteroscedasticity Reduction
Because measurement error was proportional to sample concentration, which was greater at the beginning of experiments than at the end, heteroscedasticity occurred in our suspended concentration data. We log transformed the data and then performed linear regression, confirming that heteroscedasticity decreased in comparison to least-squares exponential regression on the raw data (Figure A4).
Figure A4.
Plots of residuals and residual variance pooled from all 12 experimental treatments including controls. Red lines are locally-weighted smoothing functions (a) Residuals of the exponential model. (b) Residuals of the log-transformed linear model used in analyses. (c) Variance of the residual values of the exponential model. (d) Variance of the residual values of the log-transformed linear model used in analyses.

Appendix A.5. Results of Experimental Runs
Figure A5.
Data from our experimental runs (black points), after outlier removal (See Section 2.1.2), demonstrating the fit of the log-transformed linear model (red lines). Concentrations are presented in volumetric parts per million ( /). Plots are arranged according to collector solid volume fraction () and . All runs without biofilm present are shown.

References
- Thorne, K.; MacDonald, G.; Guntenspergen, G.; Ambrose, R.; Buffington, K.; Dugger, B.; Freeman, C.; Janousek, C.; Brown, L.; Rosencranz, J.; et al. US Pacific coastal wetland resilience and vulnerability to sea-level rise. Sci. Adv. 2018, 4, eaao3270. [Google Scholar] [CrossRef] [PubMed] [Green Version]
- Jankowski, K.L.; Törnqvist, T.E.; Fernandes, A.M. Vulnerability of Louisiana’s coastal wetlands to present-day rates of relative sea-level rise. Nat. Commun. 2017, 8, 1–7. [Google Scholar] [CrossRef] [PubMed] [Green Version]
- Kirwan, M.L.; Guntenspergen, G.R.; D’Alpaos, A.; Morris, J.T.; Mudd, S.M.; Temmerman, S. Limits on the adaptability of coastal marshes to rising sea level. Geophys. Res. Lett. 2010, 37. [Google Scholar] [CrossRef] [Green Version]
- Fagherazzi, S.; Kirwan, M.L.; Mudd, S.M.; Guntenspergen, G.R.; Temmerman, S.; D’Alpaos, A.; Van De Koppel, J.; Rybczyk, J.M.; Reyes, E.; Craft, C.; et al. Numerical models of salt marsh evolution: Ecological, geomorphic, and climatic factors. Rev. Geophys. 2012, 50. [Google Scholar] [CrossRef]
- Goodwin, T.H.; Young, A.R.; Holmes, M.G.; Old, G.H.; Hewitt, N.; Leeks, G.J.; Packman, J.C.; Smith, B.P. The temporal and spatial variability of sediment transport and yields within the Bradford Beck catchment, West Yorkshire. Sci. Total Environ. 2003, 314, 475–494. [Google Scholar] [CrossRef]
- Kirwan, M.L.; Murray, A.B. A coupled geomorphic and ecological model of tidal marsh evolution. Proc. Natl. Acad. Sci. USA 2007, 104, 6118–6122. [Google Scholar] [CrossRef] [Green Version]
- Stumpf, R.P. The process of sedimentation on the surface of a salt marsh. Estuar. Coast. Shelf Sci. 1983, 17, 495–508. [Google Scholar] [CrossRef]
- Leonard, L.A.; Luther, M.E. Flow hydrodynamics in tidal marsh canopies. Limnol. Oceanogr. 1995, 40, 1474–1484. [Google Scholar] [CrossRef]
- Mudd, S.M.; D’Alpaos, A.; Morris, J.T. How does vegetation affect sedimentation on tidal marshes? Investigating particle capture and hydrodynamic controls on biologically mediated sedimentation. J. Geophys. Res. Earth Surf. 2010, 115. [Google Scholar] [CrossRef] [Green Version]
- Fauria, K.E.; Kerwin, R.E.; Nover, D.; Schladow, S.G. Suspended particle capture by synthetic vegetation in a laboratory flume. Water Resour. Res. 2015, 51, 9112–9126. [Google Scholar] [CrossRef]
- Spielman, L.A. Particle capture from low-speed laminar flows. Annu. Rev. Fluid Mech. 1977, 9, 297–319. [Google Scholar] [CrossRef]
- Rubenstein, D.I.; Koehl, M.A. The mechanisms of filter feeding: Some theoretical considerations. Am. Nat. 1977, 111, 981–994. [Google Scholar] [CrossRef]
- Christiansen, T.; Wiberg, P.; Milligan, T. Flow and sediment transport on a tidal salt marsh surface. Estuar. Coast. Shelf Sci. 2000, 50, 315–331. [Google Scholar] [CrossRef] [Green Version]
- Nielsen, P. Turbulence effects on the settling of suspended particles. J. Sediment. Res. 1993, 63, 835–838. [Google Scholar]
- Jacobs, C.N.; Merchant, W.; Jendrassak, M.; Limpasuvan, V.; Gurka, R.; Hackett, E.E. Flow scales of influence on the settling velocities of particles with varying characteristics. PLoS ONE 2016, 11, e0159645. [Google Scholar] [CrossRef] [PubMed] [Green Version]
- Wang, Y.; Lam, K.M.; Lu, Y. Settling velocity of fine heavy particles in turbulent open channel flow. Phys. Fluids 2018, 30, 095106. [Google Scholar] [CrossRef]
- Yager, E.; Schmeeckle, M. The influence of vegetation on turbulence and bed load transport. J. Geophys. Res. Earth Surf. 2013, 118, 1585–1601. [Google Scholar] [CrossRef]
- Yang, J.Q.; Nepf, H.M. Impact of vegetation on bed load transport rate and bedform characteristics. Water Resour. Res. 2019, 55, 6109–6124. [Google Scholar] [CrossRef]
- Jordanova, A.A.; James, C. Experimental study of bed load transport through emergent vegetation. J. Hydraul. Eng. 2003, 129, 474–478. [Google Scholar] [CrossRef]
- D’Alpaos, A.; Lanzoni, S.; Marani, M.; Rinaldo, A. Landscape evolution in tidal embayments: Modeling the interplay of erosion, sedimentation, and vegetation dynamics. J. Geophys. Res. Earth Surf. 2007, 112. [Google Scholar] [CrossRef] [Green Version]
- Tinoco, R.; Coco, G. Turbulence as the main driver of resuspension in oscillatory flow through vegetation. J. Geophys. Res. Earth Surf. 2018, 123, 891–904. [Google Scholar] [CrossRef]
- Dietrich, W.E. Settling velocity of natural particles. Water Resour. Res. 1982, 18, 1615–1626. [Google Scholar] [CrossRef]
- Yang, S.; Li, H.; Ysebaert, T.; Bouma, T.; Zhang, W.; Wang, Y.; Li, P.; Li, M.; Ding, P. Spatial and temporal variations in sediment grain size in tidal wetlands, Yangtze Delta: On the role of physical and biotic controls. Estuar. Coast. Shelf Sci. 2008, 77, 657–671. [Google Scholar] [CrossRef]
- Morris, J.T.; Sundareshwar, P.; Nietch, C.T.; Kjerfve, B.; Cahoon, D.R. Responses of coastal wetlands to rising sea level. Ecology 2002, 83, 2869–2877. [Google Scholar] [CrossRef]
- Braskerud, B. The influence of vegetation on sedimentation and resuspension of soil particles in small constructed wetlands. J. Environ. Qual. 2001, 30, 1447–1457. [Google Scholar] [CrossRef] [PubMed]
- Gleason, M.L.; Elmer, D.A.; Pien, N.C.; Fisher, J.S. Effects of stem density upon sediment retention by salt marsh cord grass, Spartina alterniflora Loisel. Estuaries 1979, 2, 271–273. [Google Scholar] [CrossRef]
- Tinoco, R.O.; Coco, G. A laboratory study on sediment resuspension within arrays of rigid cylinders. Adv. Water Resour. 2016, 92, 1–9. [Google Scholar] [CrossRef]
- Palmer, M.R.; Nepf, H.M.; Pettersson, T.J.; Ackerman, J.D. Observations of particle capture on a cylindrical collector: Implications for particle accumulation and removal in aquatic systems. Limnol. Oceanogr. 2004, 49, 76–85. [Google Scholar] [CrossRef] [Green Version]
- Purich, A. The Capture of Suspended Particles by Aquatic Vegetation. Ph.D. Thesis, University of Western Australia, Perth, Australia, 2006. [Google Scholar]
- Tanino, Y.; Nepf, H.M. Laboratory investigation of lateral dispersion within dense arrays of randomly distributed cylinders at transitional Reynolds number. Phys. Fluids 2009, 21, 046603. [Google Scholar] [CrossRef]
- Wu, L.; Gao, B.; Muñoz-Carpena, R.; Pachepsky, Y.A. Single collector attachment efficiency of colloid capture by a cylindrical collector in laminar overland flow. Environ. Sci. Technol. 2012, 46, 8878–8886. [Google Scholar] [CrossRef]
- Peruzzo, P.; Defina, A.; Nepf, H. Capillary trapping of buoyant particles within regions of emergent vegetation. Water Resour. Res. 2012, 48. [Google Scholar] [CrossRef]
- Fuchs, N.A. The Mechanics of Aerosols; Pergamon Press: London, UK, 1964. [Google Scholar]
- Durham, W.M.; Climent, E.; Barry, M.; De Lillo, F.; Boffetta, G.; Cencini, M.; Stocker, R. Turbulence drives microscale patches of motile phytoplankton. Nat. Commun. 2013, 4, 1–7. [Google Scholar] [CrossRef] [Green Version]
- Nepf, H.M. Drag, turbulence, and diffusion in flow through emergent vegetation. Water Resour. Res. 1999, 35, 479–489. [Google Scholar] [CrossRef]
- Wu, L.; Muñoz-Carpena, R.; Gao, B.; Yang, W.; Pachepsky, Y.A. Colloid filtration in surface dense vegetation: Experimental results and theoretical predictions. Environ. Sci. Technol. 2014, 48, 3883–3890. [Google Scholar] [CrossRef] [PubMed]
- Lamb, H. Hydrodynamics; University Press: Cambridge, UK, 1932. [Google Scholar]
- Langmuir, I.; Rodebush, W.; Lamer, V. Filtration of Aerosols and Development of Filter Materials; OSRD-865; Office of Scientific Research and Development: Washington, DC, USA, 1942. [Google Scholar]
- Wu, L.; Gao, B.; Muñoz-Carpena, R. Experimental Analysis of Colloid Capture by a Cylindrical Collector in Laminar Overland Flow. Environ. Sci. Technol. 2011, 45, 7777–7784. [Google Scholar] [CrossRef]
- Pang, S.; Zhang, S.; Lv, X.; Han, B.; Liu, K.; Qiu, C.; Wang, C.; Wang, P.; Toland, H.; He, Z. Characterization of bacterial community in biofilm and sediments of wetlands dominated by aquatic macrophytes. Ecol. Eng. 2016, 97, 242–250. [Google Scholar] [CrossRef]
- Crump, B.C.; Koch, E.W. Attached bacterial populations shared by four species of aquatic angiosperms. Appl. Environ. Microbiol. 2008, 74, 5948–5957. [Google Scholar] [CrossRef] [Green Version]
- DiCesare, E.W.; Hargreaves, B.; Jellison, K. Biofilm roughness determines Cryptosporidium parvum retention in environmental biofilms. Appl. Environ. Microbiol. 2012, 78, 4187–4193. [Google Scholar] [CrossRef] [PubMed] [Green Version]
- Searcy, K.E.; Packman, A.I.; Atwill, E.R.; Harter, T. Capture and retention of Cryptosporidium parvum oocysts by Pseudomonas aeruginosa biofilms. Appl. Environ. Microbiol. 2006, 72, 6242–6247. [Google Scholar] [CrossRef] [PubMed] [Green Version]
- Stein, S.; Wingenroth, J.; Larsen, L. A functional form for particle interception in vegetated environments. Geosciences 2021. (in review). [Google Scholar]
- Discflo Disc Pumps: Installation, Operation, and Maintenance Manual; Discflo: Santee, CA, USA, 2003.
- Butman, C.A. Sediment trap biases in turbulent flows: Results from a laboratory flume study. J. Mar. Res. 1986, 44, 645–693. [Google Scholar] [CrossRef]
- Müller, M.; De Cesare, G.; Schleiss, A.J. Experiments on the effect of inflow and outflow sequences on suspended sediment exchange rates. Int. J. Sediment Res. 2017, 32, 155–170. [Google Scholar] [CrossRef]
- Jenzer Althaus, J.M.; Cesare, G.D.; Schleiss, A.J. Sediment evacuation from reservoirs through intakes by jet-induced flow. J. Hydraul. Eng. 2015, 141, 04014078. [Google Scholar] [CrossRef]
- Redding, T.; Devito, K. Particle densities of wetland soils in northern Alberta, Canada. Can. J. Soil Sci. 2006, 86, 57–60. [Google Scholar] [CrossRef]
- Baar, A.W.; de Smit, J.; Uijttewaal, W.S.; Kleinhans, M.G. Sediment transport of fine sand to fine gravel on transverse bed slopes in rotating annular flume experiments. Water Resour. Res. 2018, 54, 19–45. [Google Scholar] [CrossRef]
- Fisher, J.S.; Sill, B.L.; Clark, D.F. Organic detritus particles: Initiation of motion criteria on sand and gravel beds. Water Resour. Res. 1983, 19, 1627–1631. [Google Scholar] [CrossRef]
- Tlili, L. The Effect of External Controls on Channel-Belt Stacking Patterns in the Fluvio-Deltaic Domain of a Landscape Flume. Master’s Thesis, Utrecht University, Utrecht, The Netherlands, 2013. [Google Scholar]
- Nepf, H. Vegetated flow dynamics. Ecogeomorphol. Tidal Marshes 2004, 59, 137–163. [Google Scholar]
- Nikora, V.; Larned, S.; Nikora, N.; Debnath, K.; Cooper, G.; Reid, M. Hydraulic resistance due to aquatic vegetation in small streams: Field study. J. Hydraul. Eng. 2008, 134, 1326–1332. [Google Scholar] [CrossRef]
- Kadlec, R.H. Overland flow in wetlands: Vegetation resistance. J. Hydraul. Eng. 1990, 116, 691–706. [Google Scholar] [CrossRef]
- Lee, J.K.; Roig, L.C.; Jenter, H.L.; Visser, H.M. Drag coefficients for modeling flow through emergent vegetation in the Florida Everglades. Ecol. Eng. 2004, 22, 237–248. [Google Scholar] [CrossRef]
- Nepf, H.M. Flow and transport in regions with aquatic vegetation. Annu. Rev. Fluid Mech. 2012, 44, 123–142. [Google Scholar] [CrossRef] [Green Version]
- Wright, K.; Hiatt, M.; Passalacqua, P. Hydrological connectivity in vegetated river deltas: The importance of patchiness below a threshold. Geophys. Res. Lett. 2018, 45, 10–416. [Google Scholar] [CrossRef]
- Hejduk, L.; Banasik, K. Variations in Suspended Sediment Grain Sizes in Flood Events of a Small Lowland River; IAHS Publication: Wallingford, UK, 2010; Volume 337, pp. 189–196. [Google Scholar]
- Noe, G.B.; Harvey, J.W.; Schaffranek, R.W.; Larsen, L.G. Controls of suspended sediment concentration, nutrient content, and transport in a subtropical wetland. Wetlands 2010, 30, 39–54. [Google Scholar] [CrossRef]
- Aiona, A.R. Can a Constructed Stormwater Facility Remove Fine Particles from Urban Runoff? Master’s Thesis, University of California, Davis, CA, USA, 2013. [Google Scholar]
- McKenzie, E.R.; Wong, C.M.; Green, P.G.; Kayhanian, M.; Young, T.M. Size dependent elemental composition of road-associated particles. Sci. Total Environ. 2008, 398, 145–153. [Google Scholar] [CrossRef] [PubMed] [Green Version]
- The Comprehensive Manual for Velocimeters; Nortek: Rud, Norway, 2018.
- Goring, D.G.; Nikora, V.I. Despiking acoustic Doppler velocimeter data. J. Hydraul. Eng. 2002, 128, 117–126. [Google Scholar] [CrossRef] [Green Version]
- Ku, H.H. Notes on the use of propagation of error formulas. J. Res. Natl. Bureau Stand. 1966, 70, 263–273. [Google Scholar] [CrossRef]
- Schnurr, P.J.; Espie, G.S.; Allen, D.G. The effect of light direction and suspended cell concentrations on algal biofilm growth rates. Appl. Microbiol. Biotechnol. 2014, 98, 8553–8562. [Google Scholar] [CrossRef]
- Trulear, M.G.; Characklis, W.G. Dynamics of biofilm processes. J. Water Pollut. Control Fed. 1982, 54, 1288–1301. [Google Scholar]
- Liu, D.; Lau, Y.; Chau, Y.; Pacepavicius, G. Simple technique for estimation of biofilm accumulation. Bull. Environ. Contam. Toxicol. 1994, 53, 913–918. [Google Scholar] [CrossRef] [PubMed]
- Characklis, W.G.; Trulear, M.; Bryers, J.; Zelver, N. Dynamics of biofilm processes: Methods. Water Res. 1982, 16, 1207–1216. [Google Scholar] [CrossRef]
Figure 1.
Photographs of fine sediment captured on vegetation in a field setting. (a) Stems obtained from a tidal freshwater marsh within the Wax Lake Delta, southern Louisiana. (b) A magnified () image of one of these stems. (c) In places like the freshwater nontidal Everglades, Florida, fine sediment is often captured by thick coatings of epiphyton on vegetation stems.

Figure 3.
The Ecogeomorphology flume. Not all measurements are to scale. (a) Photograph of the test section (center-left) and pump (right). (b) Conceptual diagram of the flume as seen from above. Labeled parts are: (1) pump, (2) magnetic flowmeter, (3) test section, and (4) honeycomb flow collimator. Arrows indicate direction of flow. Green points represent the inlets for the peristaltic pumps sampling suspended particle concentration. Red circles represent the sediment traps. (c) A side view of the open-channel part of the system, where size differences in sediment trap symbols portray distance from the given perspective.

Figure 4.
Estimates of effective capture efficiency calculated from laboratory experiments across the collector density × Reynolds number () parameter space. Error bars represent ± 1 SE. (a) Estimates plotted over , colored by solid volume fraction (). (b) Estimates plotted over , colored by .
Figure 4.
Estimates of effective capture efficiency calculated from laboratory experiments across the collector density × Reynolds number () parameter space. Error bars represent ± 1 SE. (a) Estimates plotted over , colored by solid volume fraction (). (b) Estimates plotted over , colored by .

Figure 5.
Effect size estimates from Monte Carlo regression analysis, showing the direction and significance of trends in ECE. Error bars represent 95% confidence intervals. Asterisks mark the parameter values at which the effect size was found to be significant. (a) Estimates of the effect of log-transformed collector solid volume fraction () on log-transformed ECE, stratified by . (b) Estimates of the effect of log-transformed () on log-transformed ECE, stratified by .

Figure 6.
Effective capture efficiency (ECE) as a function of turbulence kinetic energy (TKE) for all experimental treatments studied. Error bars represent ± 1 SE. ECE is plotted on a log scale to make differences at higher TKE values apparent.
Figure 6.
Effective capture efficiency (ECE) as a function of turbulence kinetic energy (TKE) for all experimental treatments studied. Error bars represent ± 1 SE. ECE is plotted on a log scale to make differences at higher TKE values apparent.

Figure 7.
Estimates of effective capture efficiency calculated from experimental runs with varying degrees of biofilm growth. Colors represent the different collector densities, expressed as solid volume fraction (). Straight lines connect the points that represent our experiments, and the shaded areas represent 95% confidence intervals for ECE inferred from our measurement uncertainty.

Figure 8.
A comparison of our experimental estimates of effective capture efficiency, colored according to collector solid volume fraction (), and the predictions of the Fauria et al. [10] power-law model (Equation (4); black lines), with uniquely calibrated C values for each group. Effective capture efficiency is plotted on a logarithmic scale in order to display model fit more precisely at small values. Error bars represent ± 1 SE.

Figure 9.
A comparison of the C values (Equation (4)) for each of our collector-density treatments to those calculated by Fauria et al. [10]. The black line represents the power-law model of best fit (R = 0.82) between C and collector solid volume fraction () for our collector-density treatments combined with those of Fauria et al. (n = 5).

Table 1.
Experimental and natural parameter ranges. Natural values are based on approximations or measurements from cited studies and literature reviews in wetlands or other low-gradient flows.
Table 1.
Experimental and natural parameter ranges. Natural values are based on approximations or measurements from cited studies and literature reviews in wetlands or other low-gradient flows.
| Parameter | This Study | Fauria et al. (2015) | Purich (2006) | Natural |
|---|---|---|---|---|
| Flow velocity ( /) | 2.0–6.0 | 1.8–6.1 | 1.0–10.2 | 0–25 [54] |
| Flow depth ( ) | 40 | 14–17 | 12 | 0–50 [55] |
| Reynolds number 1 | 8400–25,200 | 2520–10,400 | 1400–12,800 | 70–65,000 [8,56] |
| Collector shape | Cylindrical | Bladed | Cylindrical | Varies |
| Collector diameter ( ) | 0.318 | 0.3 | 0.6 | 0.1–1.2 [57,58] |
| Collector Reynolds number | 66–200 | 54–183 | 70–640 | 5–1000 [55] |
| Collector density () | 285–1487 | 2724–7209 | 1013–4053 | 10–2700 [58] |
| Solid volume fraction (%) | 0.22–1.17 | 0.82–2.16 | 2.86–11.5 | 0.1–1 [57] |
| Particle type | Walnut shell | Road dust | Pliolite® | Sediment |
| Particle density ( /) | 1.53 | 2.27–2.61 2 | 1.03 | 1.43–2.39 [49] |
| Average particle diameter, ( ) | 25.2 | ∼10–15 3 | 212–250 | 45–100 [59,60] |
| Suspended concentration ( /) | 5–55 | <9–50 | ∼110 | 2–25 [60,61] |
| Particle-collector diameter ratio, R | 0.0079 | 0.0004–0.083 3 | 0.037 | <0.25 |
Table 2.
Turbulence kinetic energy (TKE) for all collector solid volume fraction () and treatments, including the control (zero-collector) treatments for reference.
Table 2.
Turbulence kinetic energy (TKE) for all collector solid volume fraction () and treatments, including the control (zero-collector) treatments for reference.
| Mid-Water-Column TKE (mm2/s2) | ||
|---|---|---|
| Control | 67 | 2.48 |
| 134 | 2.98 | |
| 200 | 3.37 | |
| 0.22% | 67 | 1.23 |
| 134 | 5.26 | |
| 200 | 12.2 | |
| 0.64% | 67 | 9.13 |
| 134 | 35.9 | |
| 200 | 59.6 | |
| 1.17% | 67 | 11.1 |
| 134 | 29.8 | |
| 200 | 54.4 |
Publisher’s Note: MDPI stays neutral with regard to jurisdictional claims in published maps and institutional affiliations. |
© 2021 by the authors. Licensee MDPI, Basel, Switzerland. This article is an open access article distributed under the terms and conditions of the Creative Commons Attribution (CC BY) license (http://creativecommons.org/licenses/by/4.0/).
Share and Cite
MDPI and ACS Style
Wingenroth, J.; Yee, C.; Nghiem, J.; Larsen, L. Effects of Stem Density and Reynolds Number on Fine Sediment Interception by Emergent Vegetation. Geosciences 2021, 11, 136. https://0-doi-org.brum.beds.ac.uk/10.3390/geosciences11030136
AMA Style
Wingenroth J, Yee C, Nghiem J, Larsen L. Effects of Stem Density and Reynolds Number on Fine Sediment Interception by Emergent Vegetation. Geosciences. 2021; 11(3):136. https://0-doi-org.brum.beds.ac.uk/10.3390/geosciences11030136
Chicago/Turabian StyleWingenroth, Jordan, Candace Yee, Justin Nghiem, and Laurel Larsen. 2021. "Effects of Stem Density and Reynolds Number on Fine Sediment Interception by Emergent Vegetation" Geosciences 11, no. 3: 136. https://0-doi-org.brum.beds.ac.uk/10.3390/geosciences11030136
Note that from the first issue of 2016, this journal uses article numbers instead of page numbers. See further details here.