
Influence of Tsunami Aspect Ratio on Near and Far-Field Tsunami Amplitude

1
Joint Institute for Marine and Atmospheric Research, University of Hawai’i at Mānoa, Honolulu, HI 96822, USA
2
Pacific Marine Environmental Laboratory, NOAA Center for Tsunami Research, National Oceanic and Atmospheric Administration, Seattle, WA 98115, USA
3
Department of Applied Mathematics, University of Colorado, Boulder, CO 80309, USA
*
Author to whom correspondence should be addressed.
Geosciences 2021, 11(4), 178; https://0-doi-org.brum.beds.ac.uk/10.3390/geosciences11040178
Submission received: 18 February 2021
/
Revised: 13 April 2021
/
Accepted: 14 April 2021
/
Published: 16 April 2021
(This article belongs to the Special Issue Tsunami Science and Future Mitigation Strategies)
Abstract
:This study presents a numerical investigation of the source aspect ratio (AR) influence on tsunami decay characteristics with an emphasis in near and far-field differences for two initial wave shapes Pure Positive Wave and N-wave. It is shown that, when initial total energy for both tsunami types is kept the same, short-rupture tsunami with more concentrated energy are likely to be more destructive in the near-field, whereas long rupture tsunami are more dangerous in the far-field. The more elongated the source is, the stronger the directivity and the slower the amplitude decays in the intermediate- and far-fields. We present evidence of this behavior by comparing amplitude decay rates from idealized sources and showing their correlation with that observed in recent historical events of similar AR.
1. Introduction
The most destructive tsunami are generated by large subduction zone earthquakes with hypocenter located close to the shore [1]. The highest coastal run-up usually occurs near the source caused by the onshore propagating wave, in contrast the offshore traveling wave may show strong directivity and can remain hazardous at trans-oceanic distances [2]. This was evidenced by the far-field impacts of the 2004 Sumatra-Andaman tsunami (300 deaths in Somalia), the 1960 Chile tsunami (203 deaths in Hawaii and Japan), and the 1946 Aleutian tsunami (162 deaths in California, the Marquesas and Hawaii) [3,4,5,6]. The two major factors defining how far tsunami remain dangerous are source parameters responsible for initial surface elevation and bathymetry.
Bathymetric structures such as submarine ridges can trap the waves and/or focus the wave in specific directions. The importance of tsunami wave scattering by seafloor topographic features in the open ocean has been previously demonstrated analytically and numerically by several authors [7,8].
One of the most significant uncertainties in tsunami wave height prediction comes from the difficulty of accurate estimation of source parameters [9,10]. In general, two types of fault parameters are involved in a tsunami source model: static parameters (width, length, depth, slip, dip, rake and strike) and dynamic parameters (rupture velocity and rise time) [11]. Recent studies show that the dynamic parameters might affect the tsunami wave characteristics [12,13,14]. It is a current practice in numerical tsunami modeling to assume that seismic rupture takes place instantaneously and that co-seismic seafloor deformation is identically transferred to the ocean surface [15,16]. Under these assumptions, the fault plane parameters together with the use of a dislocation model are the required input for the generation of the initial water surface condition for tsunami prediction models. It is, therefore, important to understand how the uncertainty in these parameters would affect the final prediction of tsunami wave heights. Thus, sensitivity analyses of earthquake source parameters become essential to check the variation of tsunami wave characteristics in the near- and far-fields [3,9,17,18,19,20,21,22,23,24,25,26,27,28].
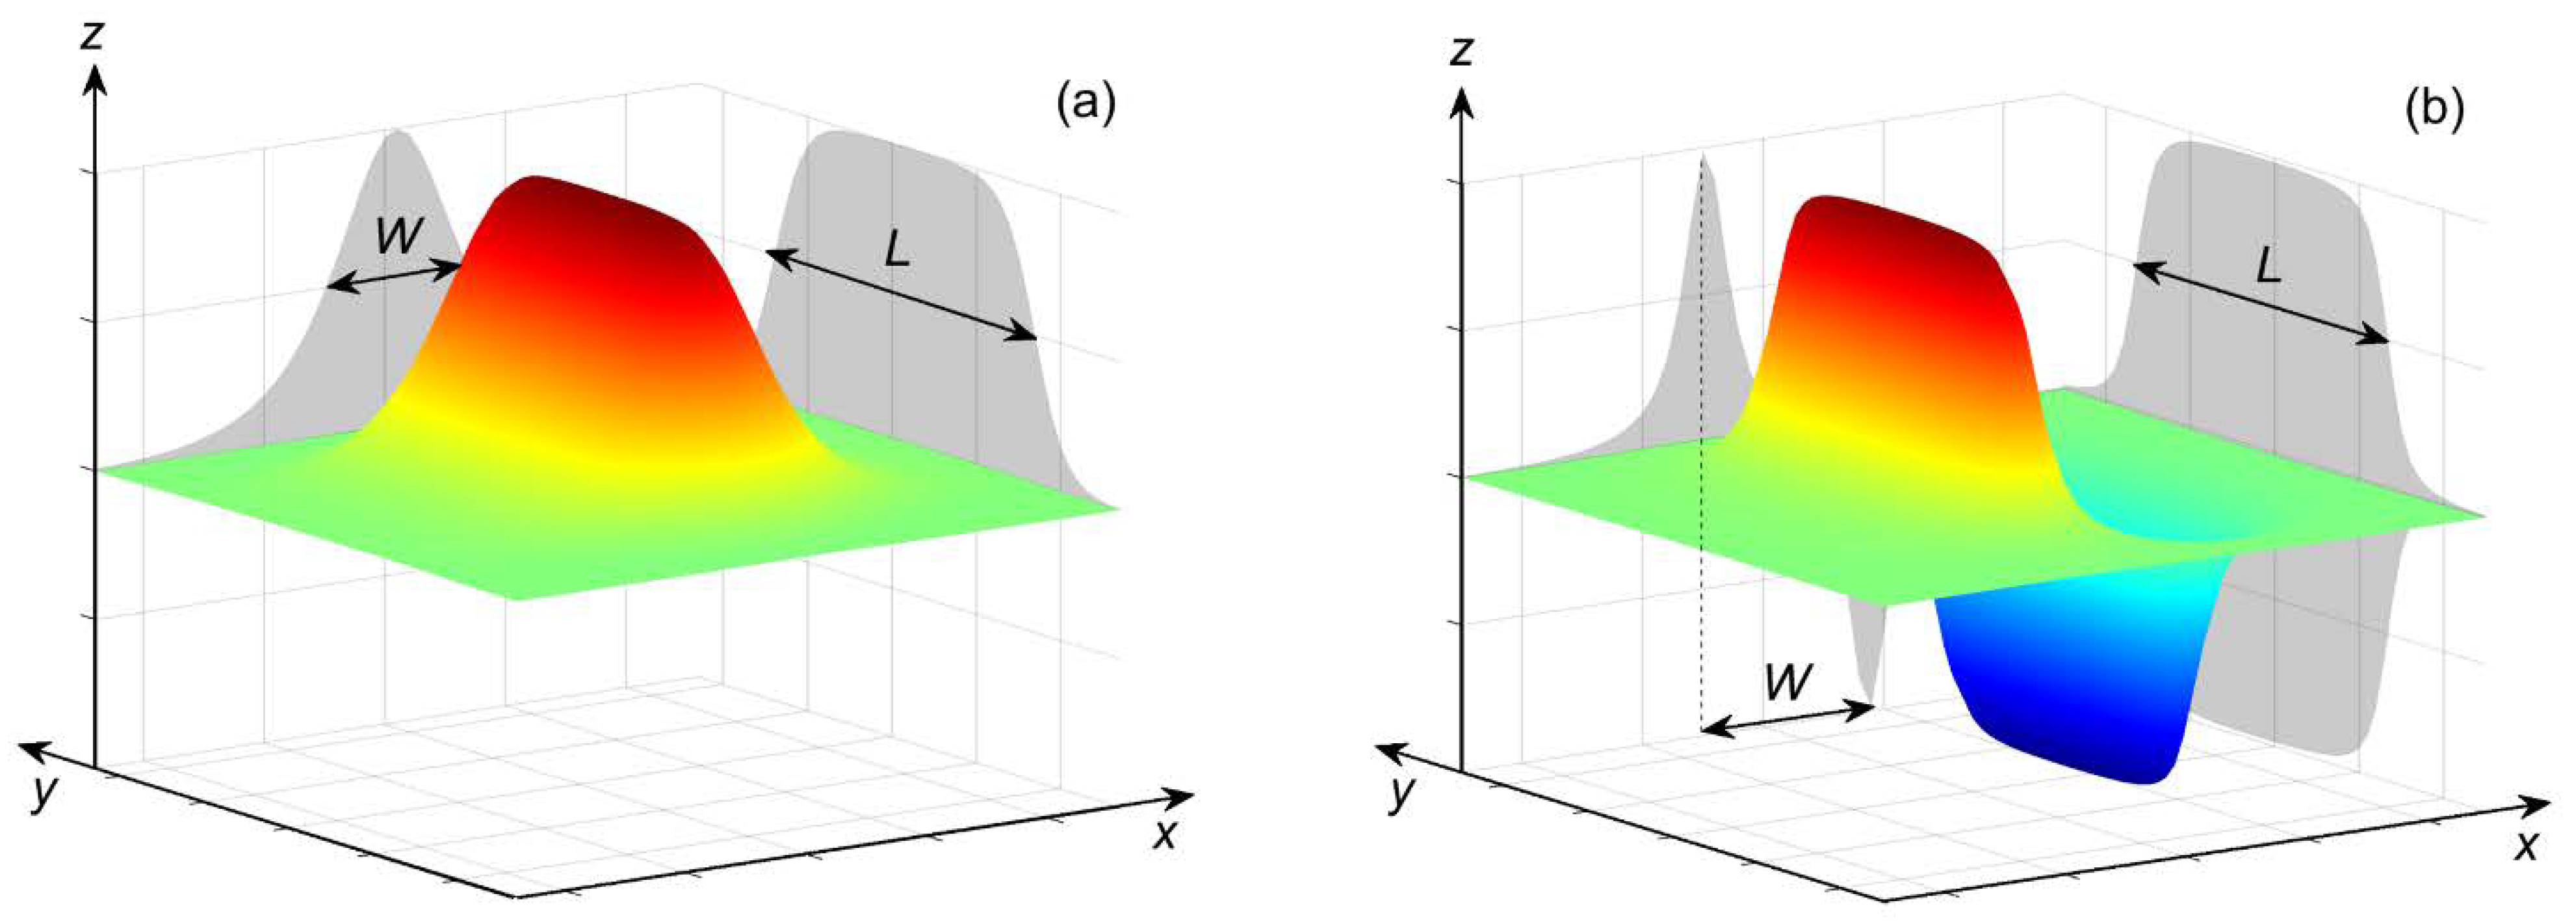
We define the source characteristic—the aspect ratio (AR)—as the source length (L) to width (W) ratio, where L is determined along strike (Figure 1).
The influence of source length on wave directivity has been studied previously [29]. The main goal of the current research is to investigate source fault AR influence on tsunami decay characteristics, particularly, to show that short rupture tsunami are more dangerous in the near-field while long rupture tsunami are more dangerous in far-field when the initial total energy is kept constant.
Carrier and Yeh [29] analytically showed, based on classical linear shallow-water-wave theory, that the more elongated the source is, the stronger the directivity. The degradation in wave height becomes more pronounced with increasing offset of the propagation direction from the line perpendicular to the major axis of source elongation. This result was confirmed earlier experimentally [30] and analytically [31].
The fault size influence on tsunami wave heights in the far-field was investigated in [9,28,32,33]. Gica et al. [9] showed that, under the same earthquake magnitude, variations in the fault dimensions can cause a large change in the wave heights in the far-field. For example, a 100% increase in fault length coupled with a 50% reduction in width can cause a 35–46% change in the wave heights in the far-field. Yolsal and Taymaz [33] showed that the variation in maximum vertical displacement of the sea surface resembling the historical Eastern Mediterranean tsunami led to very different tsunami amplitudes at each pseudo tide gauge station. Unlike previous papers, in the studies conducted by Titov et al. [28] and Okal and Synolakis [32] the moment magnitude was preserved when varying the fault length by changing the source slip (keeping the width the same). The results implied that tsunami waves exhibit minor sensitivity to the dimensions of the rupture plane in the far-field. The difference in amplitudes of the leading waves is within 50% of the maximum, although the corresponding areas of the fault planes (and vertical displacements of the ocean bottom) differ by a factor of three [28].
For a constant distance from the shore to the centroid of rupture, enlargement of the rupture area reduces the scatter in the wave amplitude due to propagation. Reducing the fault length while increasing the seismic slip (to keep the moment magnitude of the sources equal) enhances the wave run-up in the near field and narrows its distribution along a nearby beach [25].
Given the demonstrated importance of source size and AR on the directionality and decay of tsunami amplitude and the fact that important questions remain unanswered, the current study is focused on the differential behavior of wave amplitude in the intermediate- and far- fields for sources of varying AR. At first, we confirm the fact that tsunami generated by sources with small AR values exhibit faster decay than those generated by sources with larger AR values. Next, we investigate what distance from the source the initial wave amplitude for a tsunami from a source with small AR falls below the amplitude for a tsunami from a source with larger AR of identical energy. Finally, whether these tsunami characteristics identified in ideal scenarios (flat bottom on an infinite ocean) are preserved and remain identifiable in more realistic settings with real bathymetry or, on the contrary, are obscured perhaps beyond recognition is investigated.
2. Methodology
The sensitivity of tsunami wave amplitude to fault AR was studied by conducting a series of numerical experiments. The Method of Splitting Tsunami (MOST) model, a suite of finite difference numerical codes based on the long wave approximation [34,35,36], was used for calculations. The effects of nonlinearity prevail over the effects of dispersion in the current model (kh << 1, where k—wave number, h—basin depth). MOST uses the final dislocation field from a seismic deformation model to initialize hydrodynamic computations, and the basin bathymetry, as input data to compute wave propagation and run-up. Equations in the MOST model are solved numerically using the splitting method [35].
Two different initial wave shapes were considered in the current study. The first one—the Pure Positive Wave (PPW)—is defined as
and is a product of two independent functions
where A is the maximum initial wave amplitude, f1(x) represents the profile of the cross section of the initial wave in the x direction (along dip), f2(y) is the profile of the cross section in the y direction (along strike), parameters γ1 and γ2 determine the steepness of the initial wave profile in x and y directions, respectively, (x0, y0) are the coordinates of the source center, and parameter L0 determines the initial rupture length along the y-direction (Figure 1a).
The second type of initial surface displacement considered is a more seismically realistic N-Wave (NW) shape (Figure 1b). This deformation is derived from Okada’s [37] solution for seismic deformation (reverse fault) in an elastic half space and is often used to approximate seismic static deformation for tsunami model initialization. Only the vertical component of the deformation in Okada’s solution is considered here as is standard practice in tsunami modeling. The Okada model takes as input the slip amount on a rectangular patch representing the interface between two tectonic plates with relative motion described by a series of parameters: dip angle, strike angle, rake angle, slip amount, fault width, fault length and focal depth.
For this study, the variable parameters are initial deformation (source) length and initial amplitude (slip). The rest of the parameters are kept constant and selected in accordance with realistic geophysical values: γ1 = 6, γ2 = 12 for PPW; strike = 0, rake = 90, fault width = 50 km, fault depth = 8 km for NW. The computed initial deformations are elongated shapes along the strike direction (y-axis).
Consistent with Okada’s equation, the initial deformation length (L) is determined by measuring the distance between the two points along the centerline (y-direction) where the deformation falls to one half of the maximum amplitude z = |A|/2. A similar criterion is used to measure the width (W) of PPW but this time in the x-direction (Figure 1a). The width of the NW deformation is defined as the distance between the maximum point along the cross section of the deformation to the point with the minimum value on the other end along the x-direction (Figure 1b). The use of these metrics yields values of deformation length and width consistent with those specified in the fault plane parameters of Okada’s equations.
Tsunami propagation from these idealized sources were conducted both, over an idealized infinite, flat-bottom ocean and in the Pacific Ocean basin within a domain with longitude limits 120° E—68° W and latitude limits 74° S—62° N. Bathymetry data were obtained from the General Bathymetric Chart of the Oceans (GEBCO) dataset [38]. The propagation scenarios did not include inundation. Fully absorbing boundary conditions along the deep-water edges of the grids and a purely reflective condition at 20 m water depth were implemented in the Pacific basin simulations. The grid spatial resolution used was 2 arcminutes and the numerical time step was set to 5 s to ensure Courant–Friedrichs–Lewy (CFL) stability.
3. Results and Discussions
3.1. Idealized Scenarios in the Basin with Constant Depth
3.1.1. Comparison with Analytical Solution
First, in order to validate the numerical results obtained with MOST and presented in this and later sections, analytical solutions of tsunami propagation over an idealized infinite, flat-bottom ocean with wave amplitudes small relative to depth were considered. In these approximations the linearized shallow water equations can be reduced to the wave equation in two space dimensions
with initial conditions
where η is the wave elevation, t—time, g—gravitational constant, h—basin depth.
The solution of systems (4)—(5) is presented in [39].
3.1.2. Wave Decay
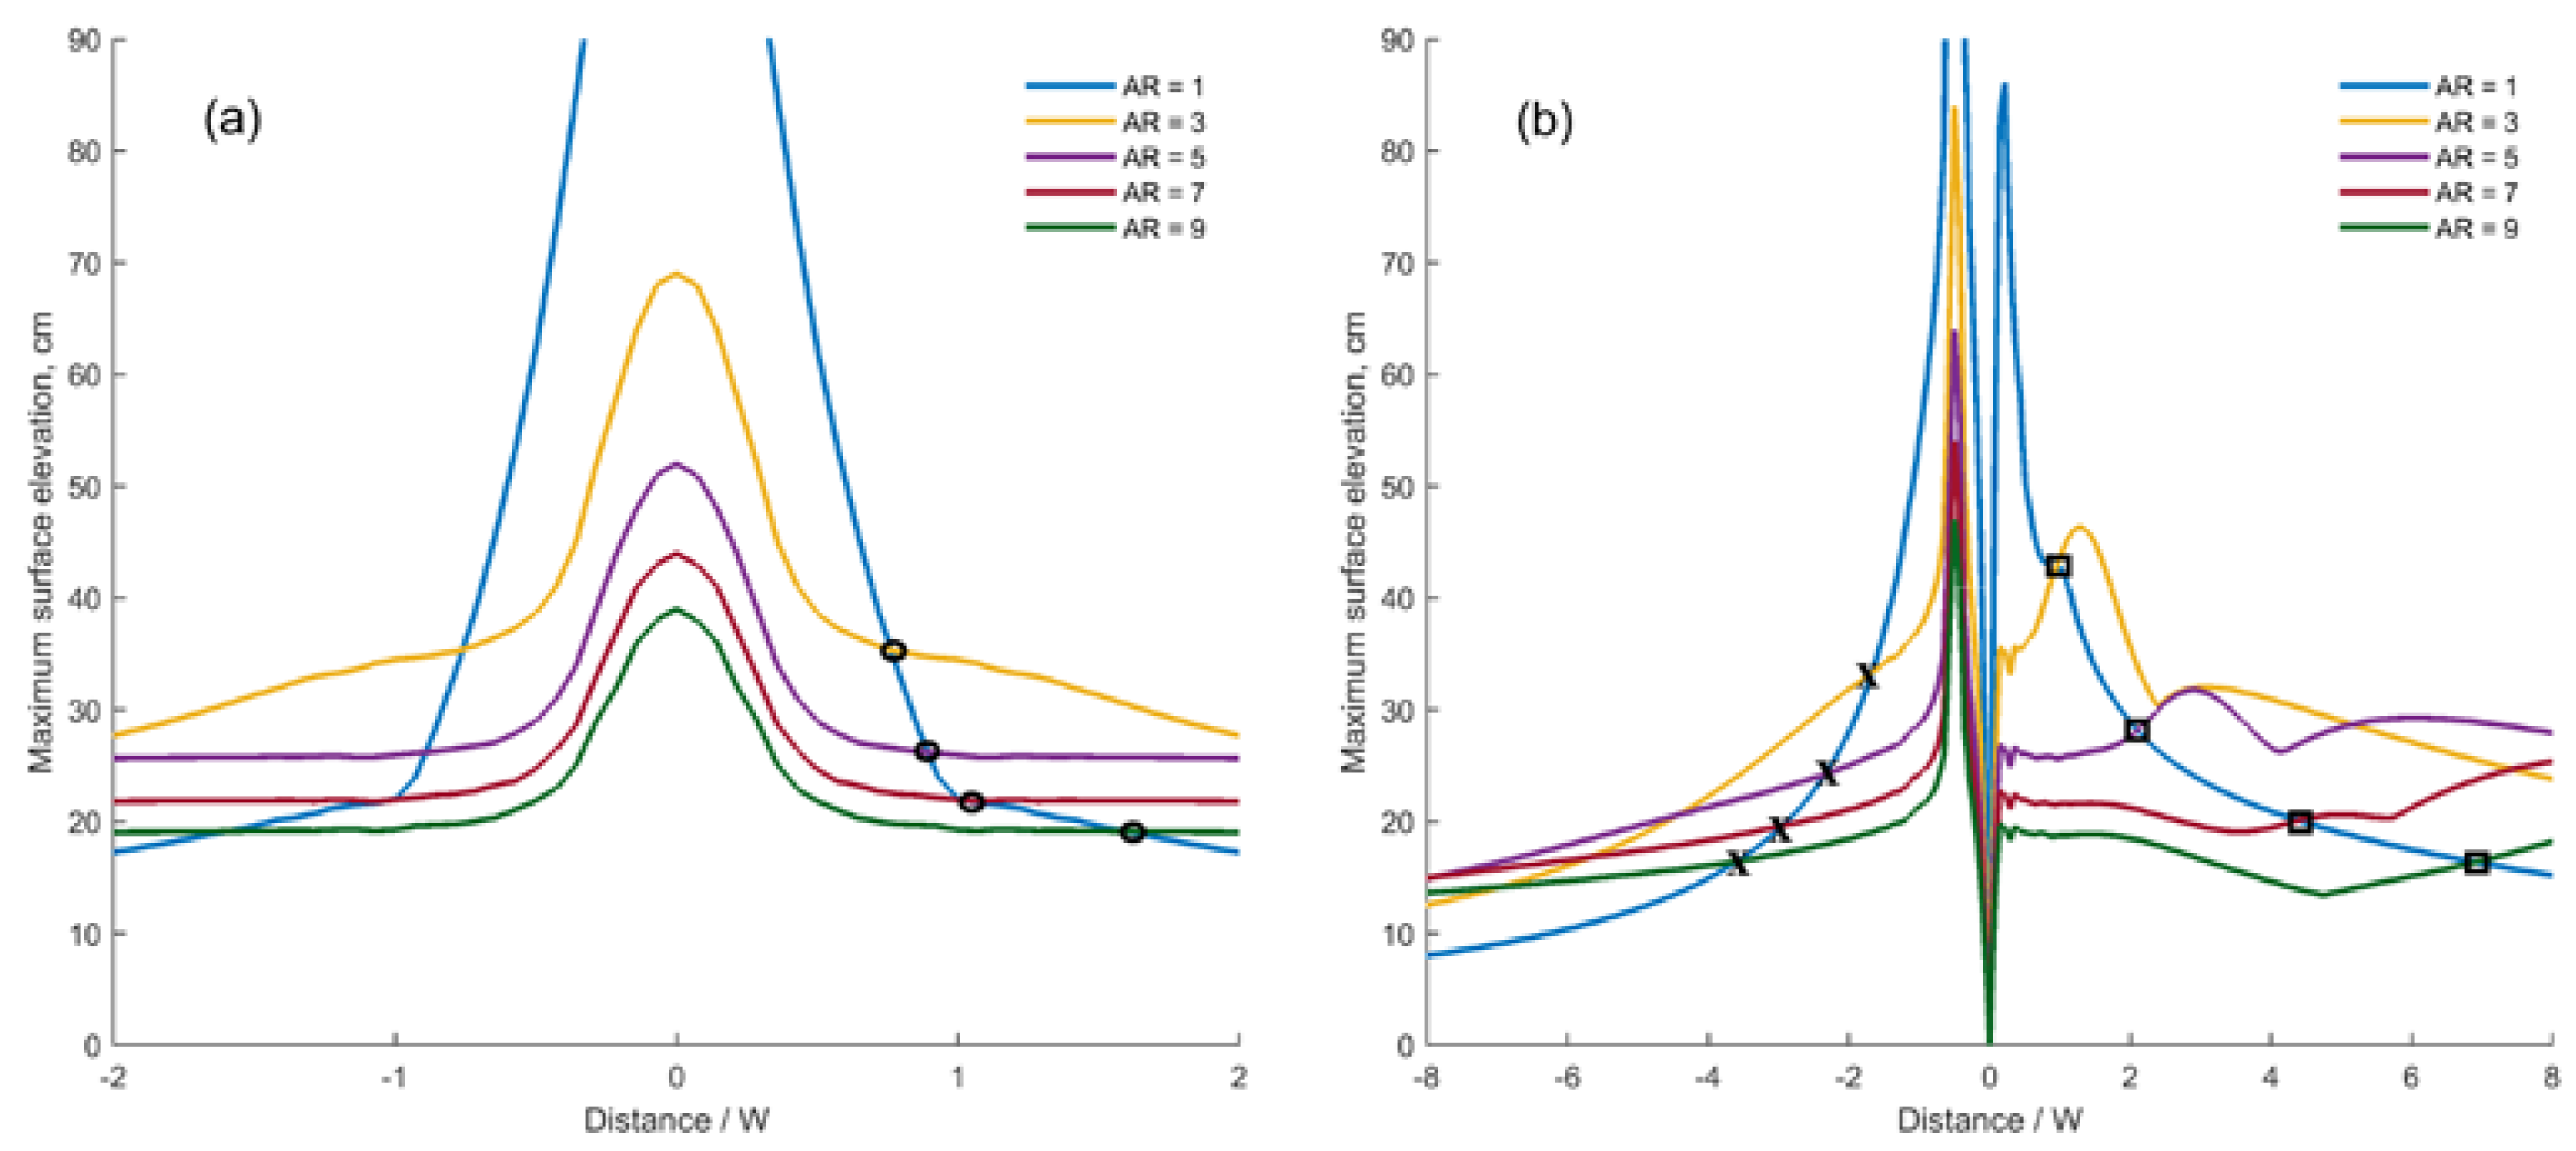
Given the linearity of the problem in deep water (amplitude << depth), the non-dispersive nature of the equations and the fact that idealized scenarios presented in the current paper include a constant depth ocean, a tsunami waveform would propagate indefinitely without any significant change in shape along a wave ray, other than the expected reduction in amplitude. This characteristic implies that the wave decay rate is identical for any point in the wave profile regardless of phase. Therefore, in order to assign a decay rate to the wave generated by a particular source, it suffices to follow the amplitude decay rate of any point in the wave form with constant phase. For simplicity we focus our study on the amplitude decay of the maximum amplitude point in the wave (red curves on Figure 2).
To investigate amplitude decay rates from idealized sources with different AR, the basin depth was first set constant and equal to 4 km. Amplitude decays rates were computed in the direction perpendicular to the strike axis of the fault plane (along the x-direction) as this is the main direction of wave directivity [29]. AR range (AR = 1–9) was selected within realistic geophysical values based on scaling laws by Wells and Coppersmith [40].
In the case of initial PPW, the wave packets propagating away from the source in opposite directions are symmetrical with respect to the location of the initial deformation exhibiting a leading elevation wave, so the amplitude decay curves for left- and right-travelling waves are identical (Figure 2a). In the case of NW, the wave packets are antisymmetric with respect to the initial location with a leading depression wave propagating in the direction of increasing longitude and a leading elevation wave—in the opposite direction (Figure 2b). The amplitudes of both left- and right-travelling waves decay with identical decay rate after the initial transient response vanishes and the wave profile stabilizes onto a steadily propagating wave train.
Carrier and Yeh [29] pointed out that the amplitudes of spatial long wave in a basin with constant depth decay as a power function. In order to quantify the wave decay in our study, maximum wave amplitude was calculated for PPW and NW sources of varying AR and approximated using power functions of the form
where η—the normalized wave amplitude, C—decay coefficient depending on AR, x—the distance normal to the wave-crest that the wave has travelled, λ—empirical parameter which varies with the shape of the initial deformation (λ = 0.6 for the PPW and λ = 0.8 for the NW). An initial set of values λ were initially pre-selected from a trial set by visual inspection of curve fits, and the final value was extracted out of the initial selection by minimizing the Root Mean Square error with the data.
We note here that for the limiting case of a single-pulse point source, the proposed approximation will recover the well-known decay rate of 1/r for this type of propagation by setting the values of, both C and λ to 1.
Results from the numerical simulations reveal an almost linear behavior of the parameter C in the current power function approximation in both cases, PPW and NW, with waves decaying faster with smaller values of AR. The more elongated the source is, the stronger the directivity and the larger the values of C were recorded (Figure 2c).
3.1.3. Cross-Over Point
Based on these observations it becomes important to estimate how far from the source the amplitude from a short-rupture tsunami (small AR) drops below that of a source with similar energy but longer rupture length (large AR). We name the distance from the source where it happens the cross-over points. To keep the results consistent for the sources of different widths the distance from the source is normalized by the initial elevation width.
For consistency in our comparisons, the total energy for sources of different AR was kept constant. For tsunami energy estimation the approach presented in [41] was used. The total energy that is transmitted from the ocean bottom to the water column during earthquake generation is the best parameter to estimate the tsunami intensity. Based on the static assumption of the water surface deformation at the initial time, the total energy ET is equal to the potential energy of the source, Ep, calculated as
where ρ is the water density, η—the initial ocean surface deformation, Σ—calculation area, ds—area differential.
When the total energy is kept constant, concentrated short-rupture tsunami exhibit larger initial wave amplitudes and are likely to be more destructive in the near-field than long rupture events of the same energy. However, in the far-field, the effect of faster amplitude decay rates, associated with short-rupture tsunami, result in lower wave amplitudes than in the case of long-rupture tsunami (Figure 3). Consistent with this behavior, the distance away from the origin where the wave amplitude of sources with AR > 1 becomes larger than that generated by a source with AR = 1 was measured (marked by circles and squares on Figure 3). Increasing the AR of the source leads to longer distances in the location of the cross-over point. In the case of PPW, all cross-over point distances are within 2W from the source center (Figure 3a), in the case of NW–7W (Figure 3b).
Based on these results, important remarks relevant to tsunami forecasting can be made. Namely, for two tsunami of the same energy, generated by earthquakes with fault planes of varying length, the tsunami generated by the shorter fault plane rupture will result in a more destructive tsunami along near-field coastlines, whereas those generated by the longer fault plane will persist more intensely in the far-field, making them more dangerous than its short fault plane counterpart for coastal communities, hours away from the source.
3.2. Idealized Sources in the Pacific Ocean
In real life scenarios, amplitude and directivity of the propagating tsunami are largely affected by the geometry of the coastline close to the source, and by near- and far-field bathymetric features. The following series of numerical experiments was conducted to find out whether the effects, described in the previous section for idealized scenarios are still visible when more realistic conditions are introduced to the problem.
3.2.1. Source AR and Damaging Potential in the Near- and Far-field
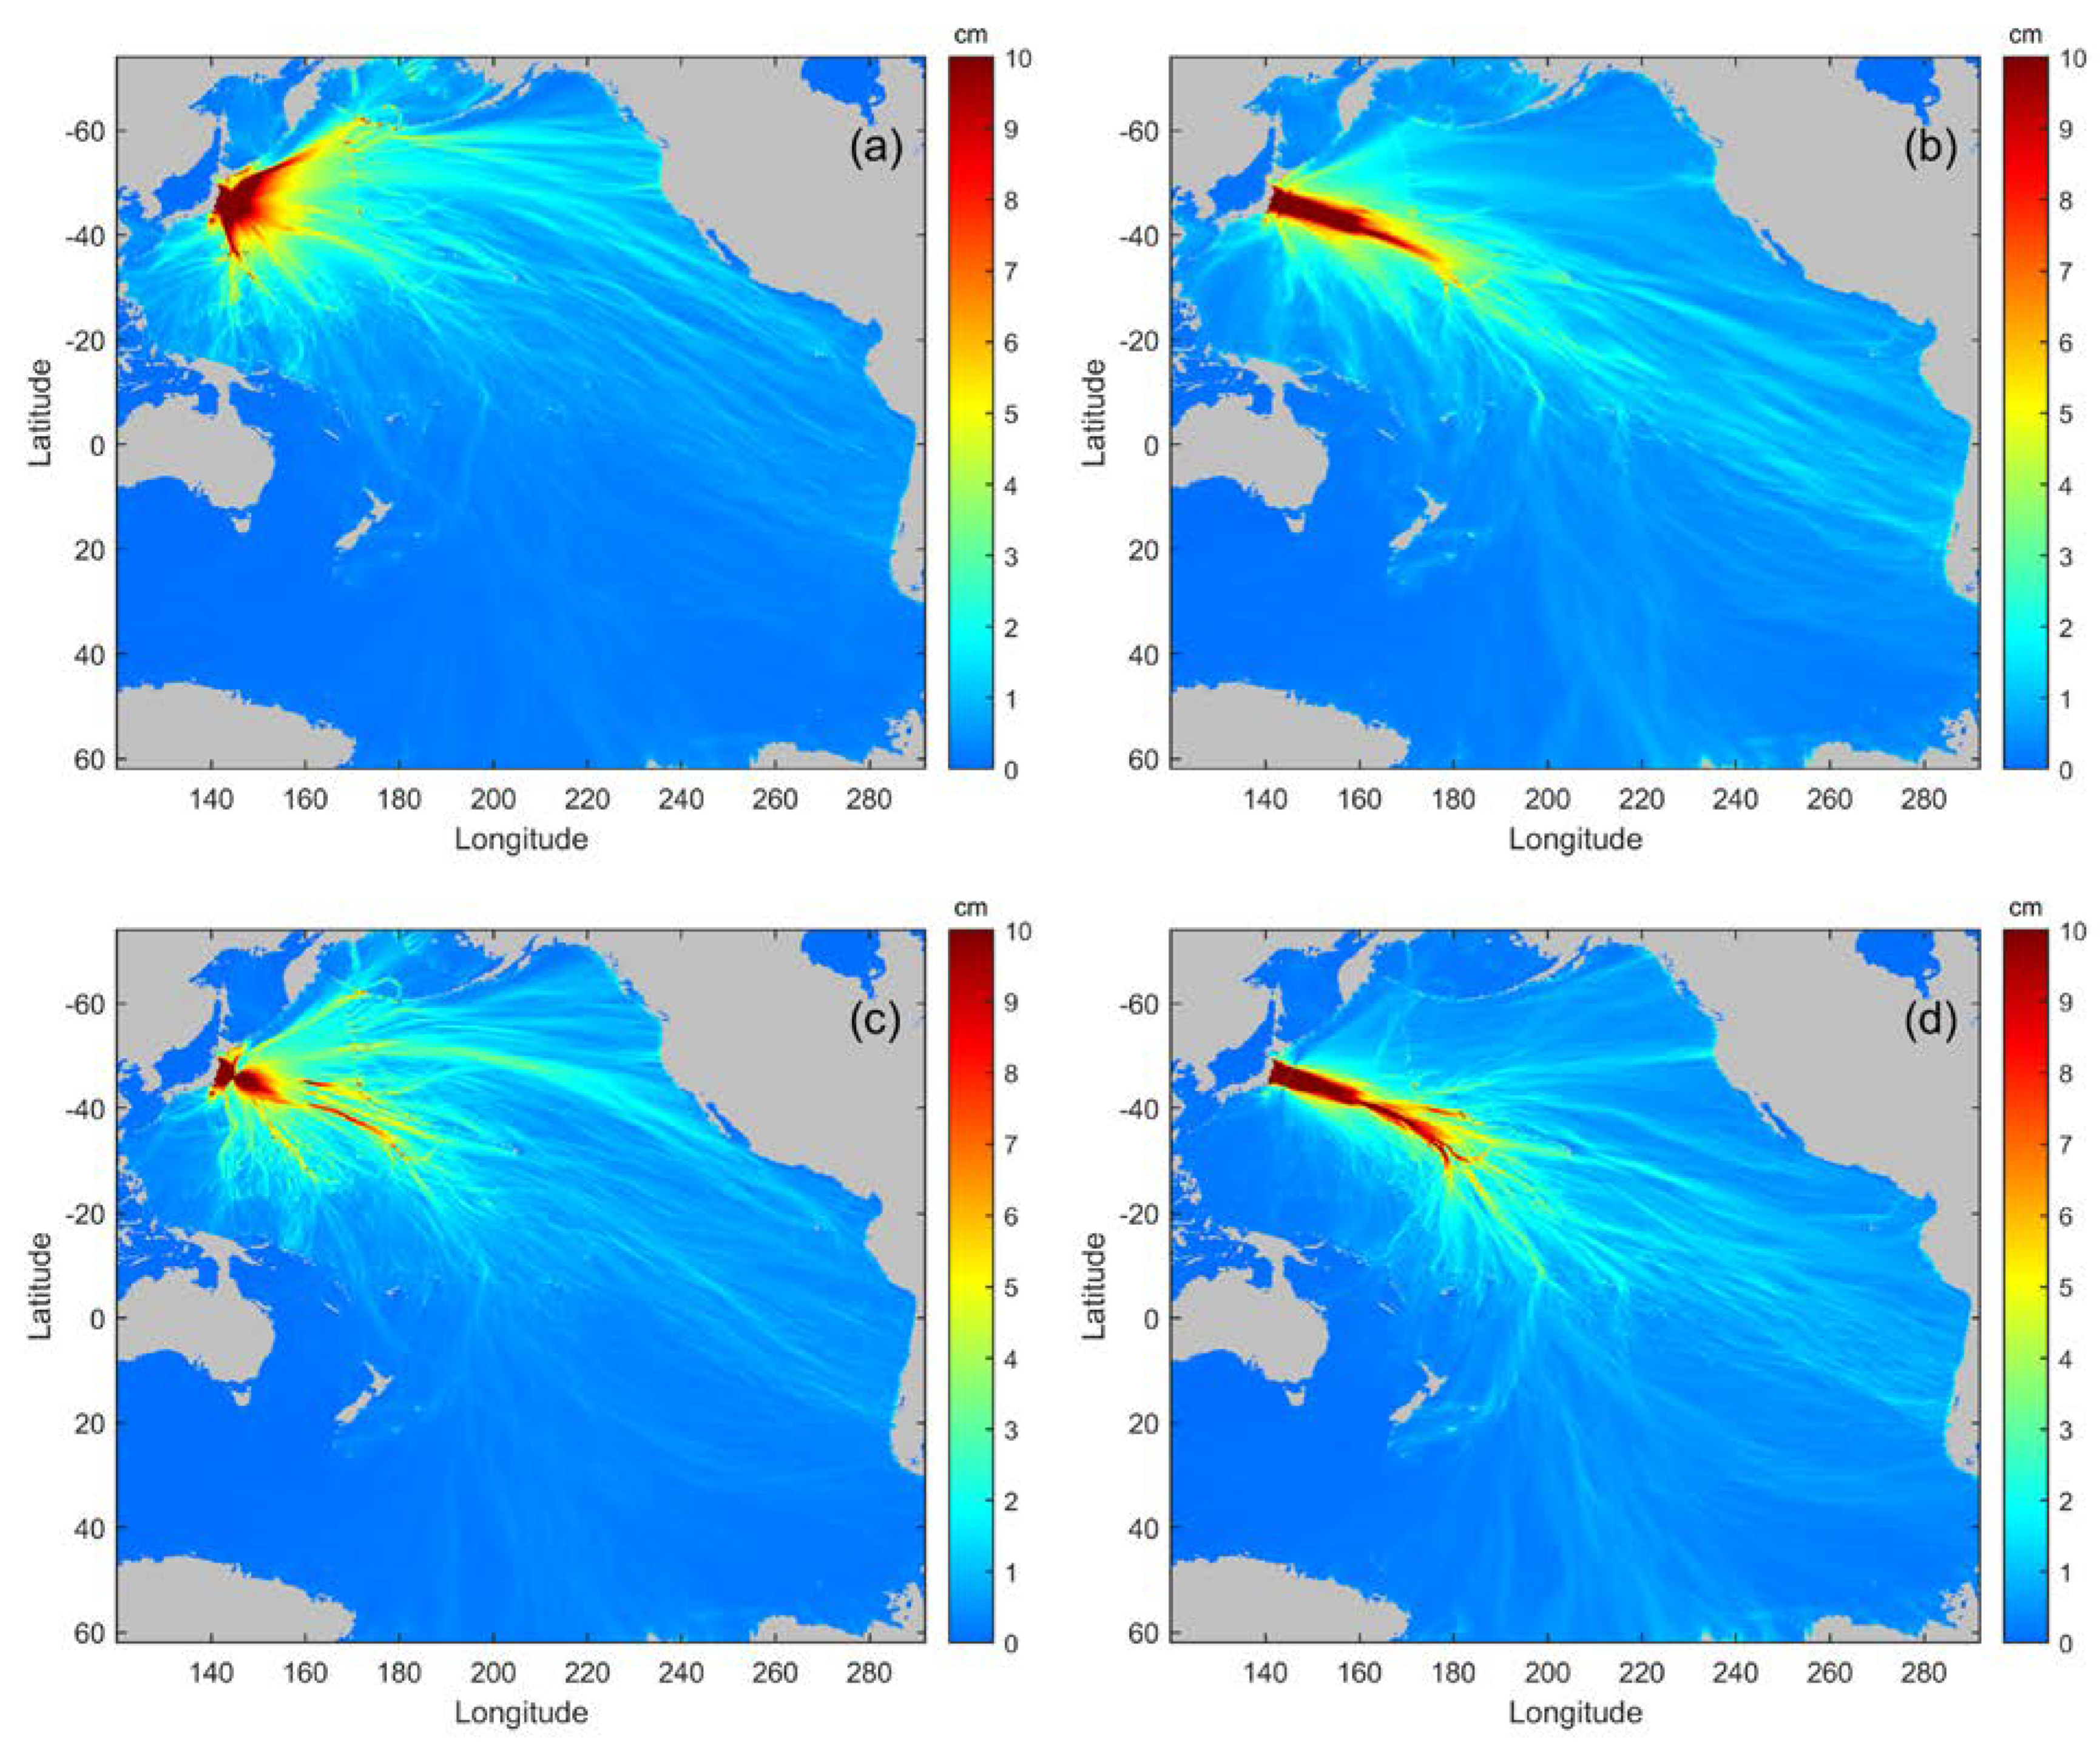
In the first group of experiments, the fixed energy PPW and NW sources with different values of AR, described in the previous section were placed at the location of the source of the Tohoku tsunami (Japan, 2011). This location was chosen arbitrarily with the only objective of locating considered idealized sources in a location where these types of events are likely to occur. The amplitude of the waves was recorded in the near- and far-field to confirm the behavior described in the Section 3.1.
Propagation for the short-rupture (AR = 1) and long-rupture (AR = 9) tsunami in the Pacific Ocean was investigated (Figure 4). For better comparison, the total energy values for both tsunami were kept constant and defined as described in Section 3.1.3.
The initial amplitude of short-rupture sources (Figure 4a,c) is more than three times larger than that of long-rupture sources (Figure 4b,d). Nonetheless, the amplitude of their tsunami waves decays rapidly as they propagate away from the source, dropping below the amplitude level of the waves generated by the long-rupture sources. Elevated wave amplitudes are preserved at larger distances from the origin in the case of long-rupture sources making them more dangerous to distant coastlines (Figure 4b,d). This confirms the conclusions made in the previous section and demonstrates that the effect described there persists even in the presence of other phenomena affecting tsunami directivity and contributing to obscure this effect, such as wave reflection from nearby coastlines and interaction with non-trivial bathymetry.
3.2.2. Real Events in the Pacific Ocean
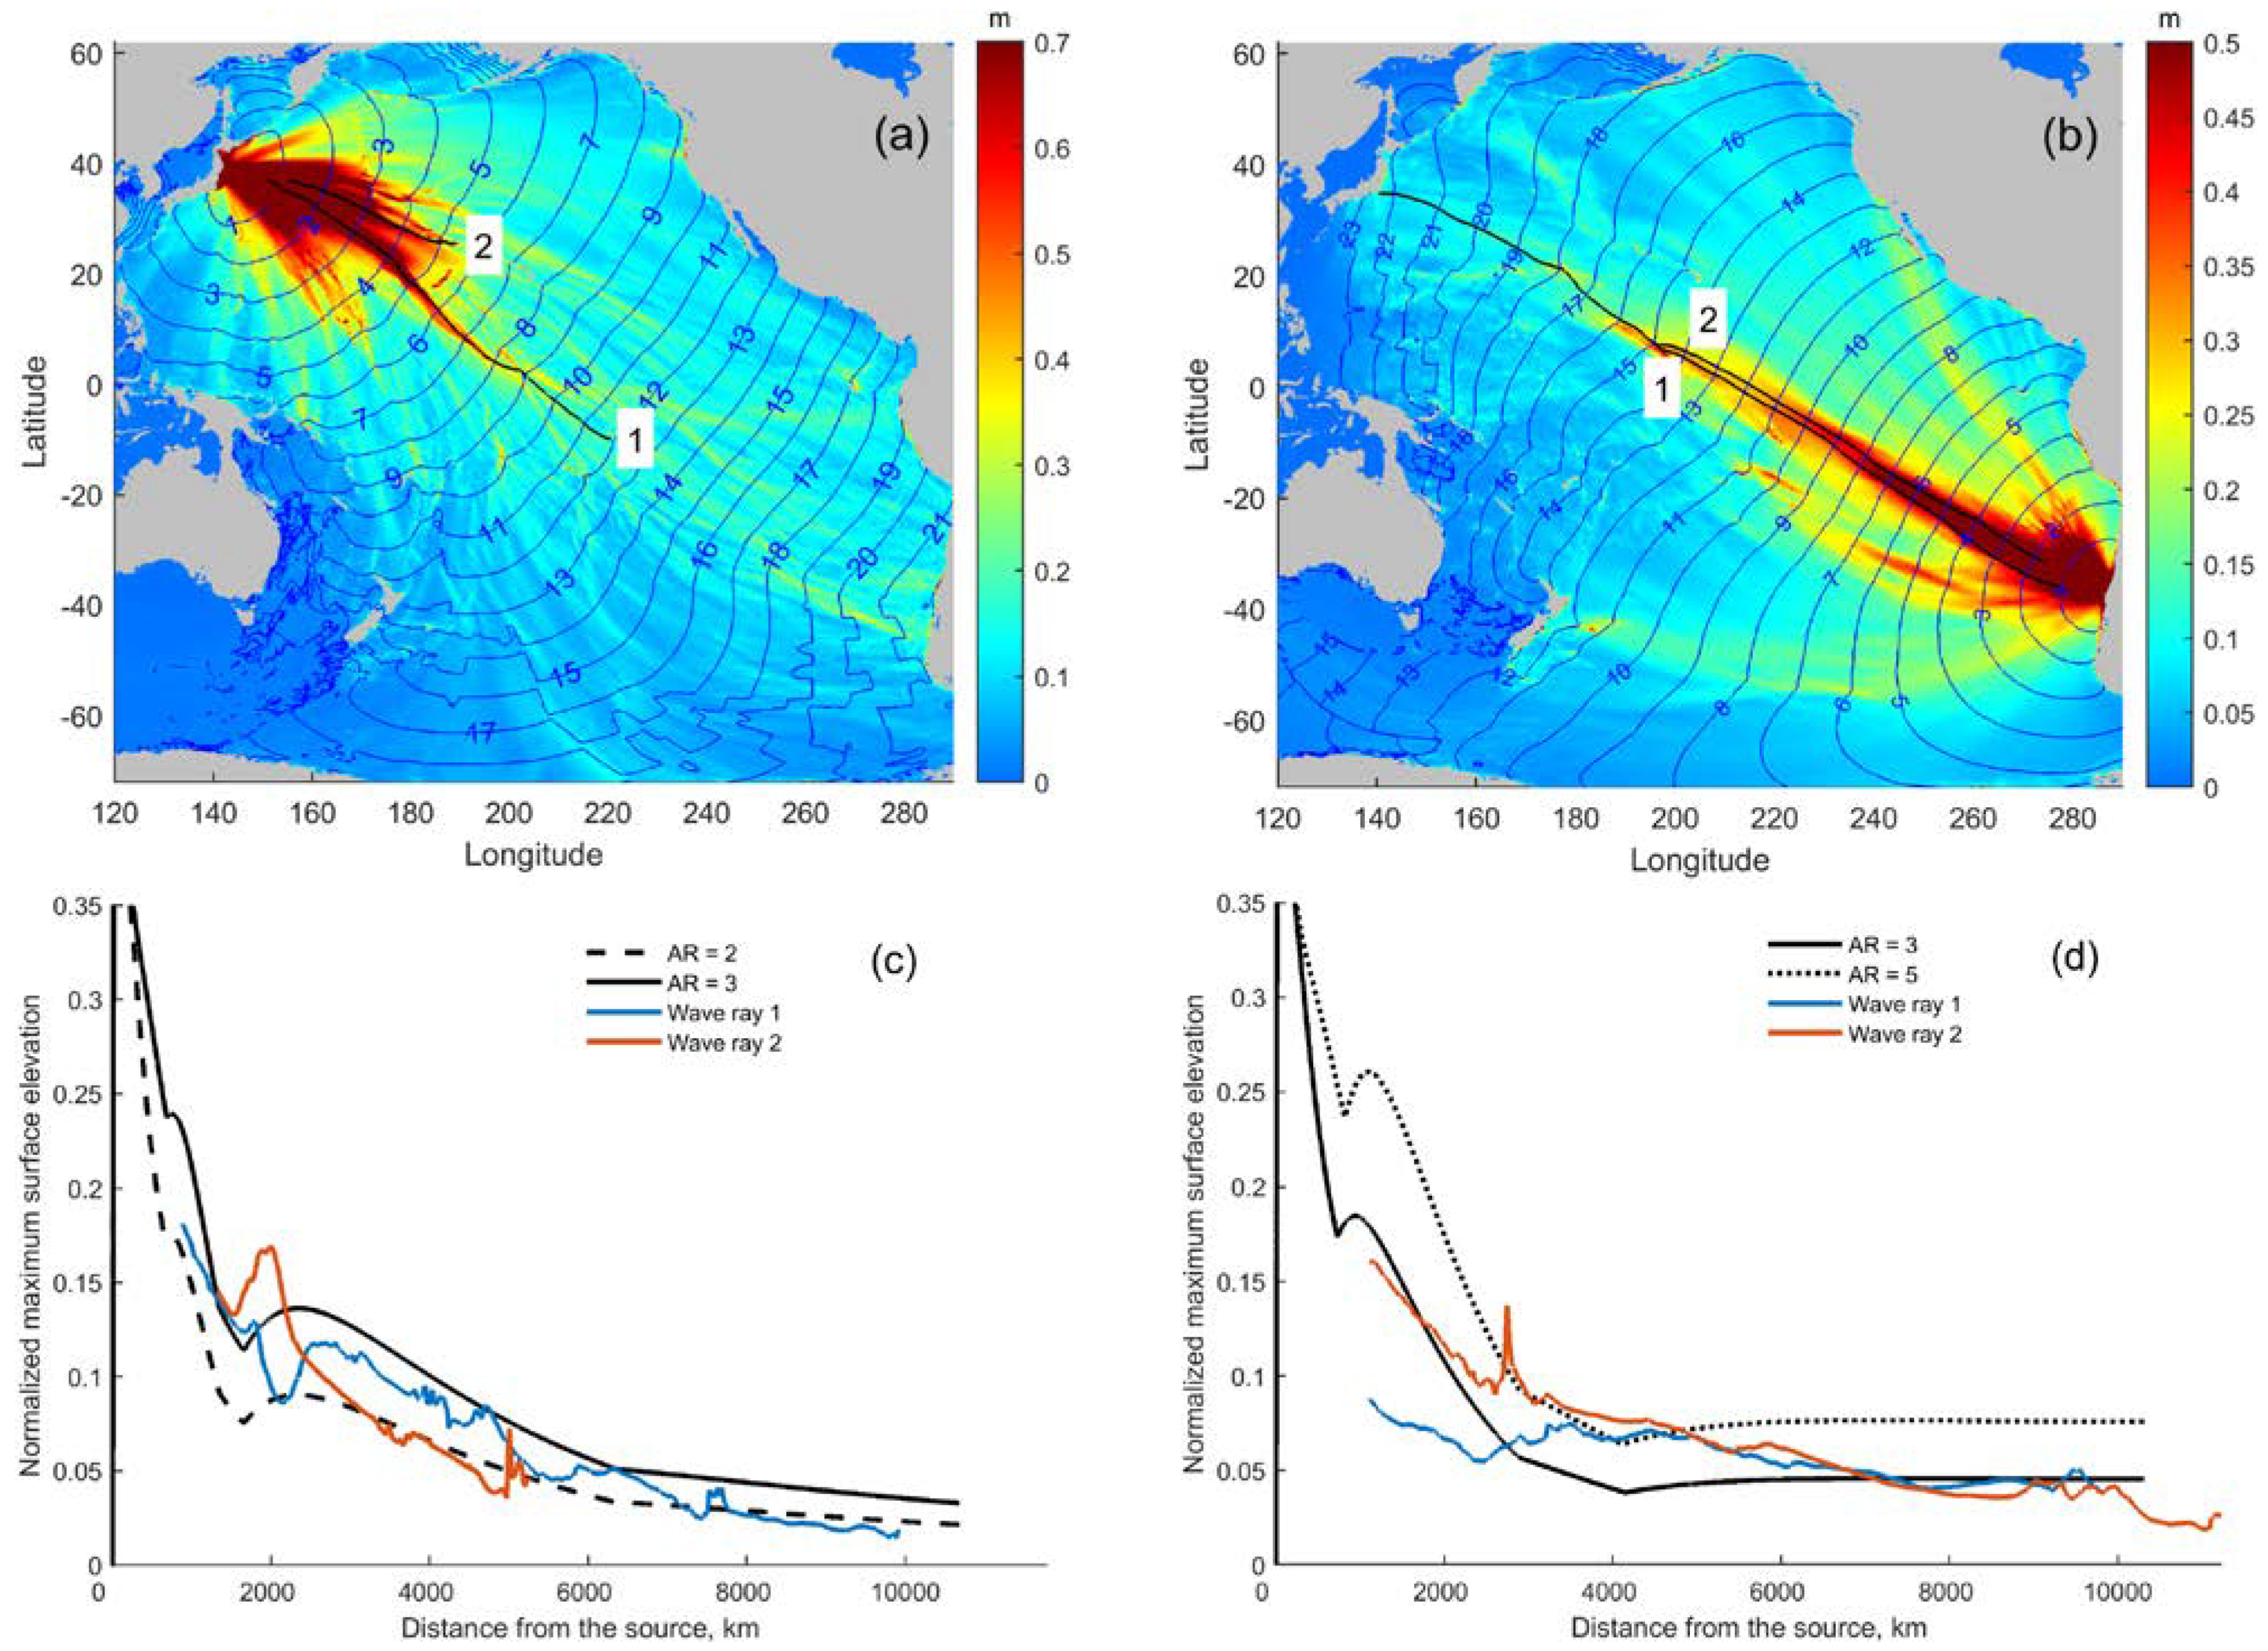
As in the previous case, the second set of experiments was designed to validate and show evidence of the observed decay rates of idealized scenarios in real tsunami sources, and in the presence of other potentially competing effects. In these experiments, amplitude decays for two major recent Pacific tsunami were compared with those obtained for the NW case over the constant depth, as most real tsunami present an initial deformation that correlates well with that type of waveform. The first considered tsunami, Tohoku (Japan, 2011), is representative of a short-rupture event (AR ≈ 2) (Figure 5a), while the second one, Maule (Chile, 2010), represent a longer-rupture event (AR ≈ 5) [19,41] (Figure 5b). The source ARs were estimated via inversion of deep-ocean tsunameter data using pre-computed tsunami source functions [19,37,42].
In order to compare decay rates of idealized scenarios and actual events, wave propagation amplitude distribution for the 2011 Tohoku and 2010 Maule events obtained from numerical modeling were collected and normalized with maximum amplitude at the source. Wave rays along the directions of the highest energy concentration emanating from each source were computed and wave amplitudes along the rays were extracted from the numerically simulated wave amplitude field. These data were then plotted in Figure 5c,d together with the normalized maximum amplitude along the source centerline for NW sources of different length over constant depth, presented in Section 3.1.2. The path of tsunami wave rays was computed as pathlines orthogonal to the isochrones (lines connecting points of equal travel time from the source). The width of the NW source was set to match that estimated for Tohoku and Maule events widths (120 km and 90 km, respectively).
The amplitude decay rates along wave rays of highest energy concentration (wave rays 1 and 2) for the Tohoku event lie between the maximum amplitude decay rates corresponding to AR = 1 and AR = 3 for NW waveforms (Figure 5c). For Maule, they lie between those associated with NW sources of AR = 3 and AR = 5 (Figure 5d). The numerically calculated amplitude decay rates from real sources along the wave rays of highest energy concentration correlate well with those recorded for idealized cases from sources of similar AR. Discrepancies between the shape of amplitude decay rates of real events and those of idealized scenarios are explained by the Pacific Ocean bathymetry and tsunami source specificities [43].
4. Short Summary and Conclusions
This study presents a numerical investigation of the influence of source aspect ratio on tsunami decay. Numerical simulations were conducted using the propagation version of the MOST model, a finite-difference solver of the non-linear shallow water equations in spherical coordinates based on the splitting method [34,35,36]. Two different idealized initial wave shapes were considered: the pure positive waveform and the more realistic N-wave driven instantaneously by Okada finite fault model. Fault parameters and AR range were selected within realistic geophysical values.
Normalized maximum amplitude decays from idealized sources with different AR in a basin with constant depth were numerically computed and approximated with power function of the form
where η—the normalized wave amplitude, C—coefficient depending on AR, x—the distance normal to the wave-crest that the wave has travelled, λ—decay parameter. Results from the numerical simulations reveal that, in both cases, PPW and NW the smaller AR the faster amplitude decay. In the case of PPW, the best fitted function has a power of 0.6; in the case of NW, the best fitted function has a power of 0.8. C increases linearly with AR. The more elongated the source is, the stronger the directivity and the bigger C is.
Short-rupture and long-rupture tsunami propagation in the Pacific Ocean was investigated. The initial total energy for both tsunami types was kept the same, which results in higher initial wave amplitude values at the source for events with short-rupture length. Consequently, these concentrated short-rupture tsunami are likely to be more destructive in the near-field than long-rupture events of similar energy, which typically exhibit lower values of wave amplitude at the source. At the same time, the faster decay of short-rupture tsunami degrades their initial larger amplitude and makes them drop below that of long-rupture tsunami some distance away from the source.
The second part of the current work aims at showing that these effects persist beyond the idealized situations investigated in the first part of this study and they are still observable in actual tsunami of recent years. To do this, tsunami decays were correlated with historical events Tohoku (Japan, 2011) and Maule (Chile, 2010). It was shown that the real amplitude decay along the wave rays with most energy concentration correlates well with the decay from an idealized source of the same AR.
The analysis presented in this last part of the study intends to bridge the gap between the idealized scenarios used in parametric studies and the real world, by identifying evidence of those effects in real events. The results can help to anticipate tsunami behavior and to understand the potential for tsunami hazards in the near- and far-field coastlines based on some of the source characteristics.
Author Contributions
Conceptualization, H.S. and D.A.; methodology, D.A.; software, N.K.S. and D.A.; validation, N.K.S. and D.A.; formal analysis, N.K.S., D.A., and H.S.; investigation, N.K.S., D.A., and H.S.; resources, D.A.; data curation, N.K.S.; writing—original draft preparation, N.K.S.; writing—review and editing, N.K.S., D.A., and H.S.; visualization, N.K.S.; supervision, D.A.; project administration, N.K.S., D.A., and H.S.; funding acquisition, D.A. All authors have read and agreed to the published version of the manuscript.
Funding
This study is partially funded by PMEL with this publication representing contribution number 5187 and by cooperative agreement NA16NMF4320058 between the JIMAR and NOAA with contribution number 20-399. Harvey Segur was supported by the Division of Mathematical Sciences of the National Science Foundation (Grant Number DMS-1716156).
Data Availability Statement
The data used to produce the results presented in the study are both: cited in the paper and publicly available from the General Bathymetric Chart of the Oceans (https://www.gebco.net/data_and_products/gridded_bathymetry_data/, accessed on 18 February 2021).
Conflicts of Interest
The authors declare no conflict of interest.
References
- Arcas, D.; Segur, H. Seismically generated tsunamis. Philos. Trans. R. Soc. A Math. Phys. Eng. Sci. 2012, 370, 1505–1542. [Google Scholar] [CrossRef] [PubMed] [Green Version]
- Ben-Menahem, A.; Rosenman, M. Amplitude patterns of tsunami waves from submarine earthquakes. J. Geophys. Res. Space Phys. 1972, 77, 3097–3128. [Google Scholar] [CrossRef]
- Davies, G.; Griffin, J. Sensitivity of Probabilistic Tsunami Hazard Assessment to Far-Field Earthquake Slip Complexity and Rigidity Depth-Dependence: Case Study of Australia. Pure Appl. Geophys. 2020, 177, 1521–1548. [Google Scholar] [CrossRef] [Green Version]
- Fritz, H.M.; Borrero, J.C. Somalia Field Survey after the December 2004 Indian Ocean Tsunami. Earthq. Spectra 2006, 22, 219–233. [Google Scholar] [CrossRef]
- Okal, E.A. Tsunamigenic Earthquakes: Past and Present Milestones. Pure Appl. Geophys. 2010, 168, 969–995. [Google Scholar] [CrossRef]
- Okal, E.A.; Synolakis, C.E.; Fryer, G.J.; Heinrich, P.; Borrero, J.C.; Ruscher, C.; Arcas, D.; Guille, G.; Rousseau, D. A Field Survey of the 1946 Aleutian Tsunami in the Far Field. Seism. Res. Lett. 2002, 73, 490–503. [Google Scholar] [CrossRef]
- Kowalik, Z.; Horrillo, J.; Knight, W.; Logan, T. Kuril Islands tsunami of November 2006: Impact at Crescent City by distant scattering. J. Geophys. Res. Space Phys. 2008, 113, 01020. [Google Scholar] [CrossRef] [Green Version]
- Mofjeld, H.O.; Gonzalez, F.I.; Titov, V.V.; Newman, J.C. Tsunami scattering provinces in the Pacific Ocean. Geophys. Res. Lett. 2001, 28, 335–337. [Google Scholar] [CrossRef]
- Gica, E.; Teng, M.H.; Liu, P.L.-F.; Titov, V.; Zhou, H. Sensitivity Analysis of Source Parameters for Earthquake-Generated Distant Tsunamis. J. Waterw. Port Coastal Ocean Eng. 2007, 133, 429–441. [Google Scholar] [CrossRef]
- Synolakis, C.; Roush, W. SEISMOLOGY: Enhanced: Tsunamigenic Sea-Floor Deformations. Science 1997, 278, 598–600. [Google Scholar] [CrossRef]
- Fukutani, Y.; Anawat, S.; Imamura, F. Uncertainty in tsunami wave heights and arrival times caused by the rupture velocity in the strike direction of large earthquakes. Nat. Hazards 2016, 80, 1749–1782. [Google Scholar] [CrossRef]
- Williamson, A.; Melgar, D.; Rim, D. The Effect of Earthquake Kinematics on Tsunami Propagation. J. Geophys. Res. Solid Earth 2019, 124, 11639–11650. [Google Scholar] [CrossRef]
- Kawata, Y.; Okumura, Y.; Koshimura, S. Influence of dynamic fault rupture effects on tsunami generation. Proc. Coast. Eng. Conf. Jpn. Soc. Civ. Eng. 2006, 53, 291–295. (In Japanese) [Google Scholar]
- Suppasri, A.; Imamura, F.; Koshimura, S. Effects of the Rupture Velocity of Fault Motion, Ocean Current and Initial Sea Level on the Transoceanic Propagation of Tsunami. Coast. Eng. J. 2010, 52, 107–132. [Google Scholar] [CrossRef]
- Kajiura, K. Tsunami source, energy and the directivity of wave radiation. Bull. Earthq. Res Inst. 1970, 48, 835–869. [Google Scholar]
- Le Gal, M.; Violeau, D.; Benoit, M. Influence of timescales on the generation of seismic tsunamis. Eur. J. Mech. B Fluids 2017, 65, 257–273. [Google Scholar] [CrossRef]
- Geist, E.L. Local Tsunamis and Earthquake Source Parameters. Adv. Geophys. 1998, 39, 117–209. [Google Scholar] [CrossRef]
- Geist, E.L. Rapid tsunami models and earthquake source parameters: Far-field and local applications. ISET J. Earthq. Technol. 2005, 42, 127–136. [Google Scholar]
- Gica, E.; Spillane, M.C.; Titov, V.V.; Chamberlin, C.D.; Newman, J.C. Development of the Forecast Propagation Database for NOAA’s Short-Term Inundation Forecasting for Tsunamis (SIFT); U.S. Department of Commerce, National Oceanic and Atmospheric Administration, Office of Oceanic and Atmospheric Research, Pacific Marine Environmental Laboratory: Seattle, WA, USA, 2008.
- Goda, K.; Mai, P.M.; Yasuda, T.; Mori, N. Sensitivity of tsunami wave profiles and inundation simulations to earthquake slip and fault geometry for the 2011 Tohoku earthquake. Earth Planets Space 2014, 66, 105. [Google Scholar] [CrossRef] [Green Version]
- Ioualalen, M. Sensitivity tests on relations between tsunami signal and seismic rupture characteristics: The 26 December 2004 Indian Ocean event case study. Environ. Model. Softw. 2009, 24, 1354–1362. [Google Scholar] [CrossRef]
- Levin, B.W.; Nosov, M. Physics of Tsunamis. Metzler, J.B., Ed.; Springer: Berlin/Heidelberg, Germany, 2016. [Google Scholar]
- Necmioglu, O.; Ozel, N. An Earthquake Source Sensitivity Analysis for Tsunami Propagation in the Eastern Mediterranean. Oceanogr. 2014, 27, 76–85. [Google Scholar] [CrossRef] [Green Version]
- Okal, E.A. Seismic parameters controlling far-field tsunami amplitudes: A review. Nat. Hazards 1988, 1, 67–96. [Google Scholar] [CrossRef]
- Okal, E.A.; Synolakis, C.E. Source discriminants for near-field tsunamis. Geophys. J. Int. 2004, 158, 899–912. [Google Scholar] [CrossRef] [Green Version]
- Pires, C.; Miranda, P.M.A. Sensitivity of the adjoint method in the inversion of tsunami source parameters. Nat. Hazards Earth Syst. Sci. 2003, 3, 341–351. [Google Scholar] [CrossRef] [Green Version]
- Satake, K.; Tanioka, Y. Tsunami generation of the 1993 Hokkaido Nansei-Oki earthquake. Pure Appl. Geophys. PAGEOPH 1995, 144, 803–821. [Google Scholar] [CrossRef]
- Titov, V.V.; Gonzales, F.I.; Mofjeld, H.O.; Newman, J.C. Offshore Forecasting of Alaska-Aleutian Subduction Zone Tsunamis in Hawaii; NOAA Technical Memorandum ERL PMEL-U.S. Government Publishing Office: Seattle, WA, USA, 1999.
- Carrier, G.F.; Yeh, H. Tsunami propagation from a finite source. Comput. Model. Eng. Sci. 2005, 10, 113–121. [Google Scholar] [CrossRef]
- Takahashi, R.; Hatori, T. A model experiment on the tsunami generation from a bottom deformation area of elliptic shape. Bull. Earthq. Res. Inst. 1962, 40, 873–883. [Google Scholar]
- Okal, E.A. Normal Mode Energetics for Far-field Tsunamis Generated by Dislocations and Landslides. Pure Appl. Geophys. 2003, 160, 2189–2221. [Google Scholar] [CrossRef]
- Okal, E.A.; Synolakis, C.E. Far-field tsunami hazard from mega-thrust earthquakes in the Indian Ocean. Geophys. J. Int. 2008, 172, 995–1015. [Google Scholar] [CrossRef]
- Yolsal, S.; Taymaz, T. Sensitivity analysis on relations between earthquake source rupture parameters and far-field tsunami waves: Case studies in the Eastern Mediterranean region. Turk. J. Earth Sci. 2010, 19, 313–349. [Google Scholar] [CrossRef]
- Synolakis, C.E.; Bernard, E.N.; Titov, V.V.; Kânoğlu, U.; González, F.I. Validation and Verification of Tsunami Numerical Models. Pure Appl. Geophys. 2008, 165, 2197–2228. [Google Scholar] [CrossRef]
- Titov, V.V.; Synolakis, C.E. Numerical Modeling of Tidal Wave Runup. J. Waterw. Port Coastal Ocean Eng. 1998, 124, 157–171. [Google Scholar] [CrossRef]
- Titov, V.V.; Gonzalez, F.I. Implementation and Testing of the Method of Splitting Tsunami (MOST) Model; NOAA Technical Memorandum ERL PMEL-U.S. Government Publishing Office: Seattle, WA, USA, 1997.
- Okada, Y. Surface deformation due to shear and tensile faults in a half space. Bull. Seismol. Soc. Am. 1985, 75, 1135–1154. [Google Scholar]
- Tozer, B.; Sandwell, D.T.; Smith, W.H.F.; Olson, C.; Beale, J.R.; Wessel, P. Global Bathymetry and Topography at 15 Arc Sec: SRTM15+. Earth Space Sci. 2019, 6, 1847–1864. [Google Scholar] [CrossRef]
- Polyanin, A.D. Linear partial differential equations for Engineers and Scientists; Chapman and Hall/CRC: London, UK; New York, NY, USA; Washington, DC, USA, 2002; pp. 354–356. [Google Scholar]
- Wells, D.; Coppersmith, K. New empirical relationships among magnitude, rupture length, rupture width, rupture area, and surface displacement. Bull. Seismol. Soc. Am. 1994, 84, 974–1002. [Google Scholar]
- Tang, L.; Titov, V.V.; Bernard, E.N.; Wei, Y.; Chamberlin, C.D.; Newman, J.C.; Mofjeld, H.O.; Arcas, D.; Eble, M.C.; Moore, C.; et al. Direct energy estimation of the 2011 Japan tsunami using deep-ocean pressure measurements. J. Geophys. Res. Space Phys. 2012, 117, 08008. [Google Scholar] [CrossRef]
- Gusiakov, V.K. Static displacement on the surface of an elastic space. In Ill-Posed Problems of Mathematical Physics and Interpretation of Geophysical Data; Computer Center of Soviet Academy of Sciences: Novosibirsk, Russia, 1978; pp. 23–51. [Google Scholar]
- Omira, R.; Baptista, M.A.C.V.; Lisboa, F. Tsunami Characteristics Along the Peru–Chile Trench: Analysis of the 2015 Mw8.3 Illapel, the 2014 Mw8.2 Iquique and the 2010 Mw8.8 Maule Tsunamis in the Near-field. Pure Appl. Geophys. 2016, 173, 1063–1077. [Google Scholar] [CrossRef]
Figure 1.
Initial waves: (a) Pure Positive Wave, (b) N-Wave.

Figure 2.
Wave dynamics with time along the centerline of the deformation in the x-direction (AR =5) from the PPW (a) and NW (b) and dependence of C on AR of the source (c).
Figure 2.
Wave dynamics with time along the centerline of the deformation in the x-direction (AR =5) from the PPW (a) and NW (b) and dependence of C on AR of the source (c).

Figure 3.
Not normalized maximum amplitudes distribution from the PPW (a) and NW (b) along the centerline of the deformation in the x-direction for the sources of different AR over constant depth. Symbols on the figure show the distance where the amplitude of the AR = 1 wave decays below that of each other case.

Figure 4.
Maximum wave amplitude distribution from the initial PPW (a,b) and NW (c,d) in the Pacific Ocean: (a,c)—AR = 1; (b,d)—AR = 9.
Figure 4.
Maximum wave amplitude distribution from the initial PPW (a,b) and NW (c,d) in the Pacific Ocean: (a,c)—AR = 1; (b,d)—AR = 9.

Figure 5.
Maximum wave amplitude distribution from Tohoku (a) and Maule (b) events with selected wave rays and comparison of normalized maximum amplitude decays along these wave rays with normalized maximum amplitudes decays from NW over the basin with constant depth along the source centerline (c—Tohoku, d—Maule). Colors indicate the maximum wave amplitudes defined by the color bars on the right (a,b). The blue lines represent isochrones indicating the position of the wave front at different times in hours after the earthquake (a,b).

Publisher’s Note: MDPI stays neutral with regard to jurisdictional claims in published maps and institutional affiliations. |
© 2021 by the authors. Licensee MDPI, Basel, Switzerland. This article is an open access article distributed under the terms and conditions of the Creative Commons Attribution (CC BY) license (https://creativecommons.org/licenses/by/4.0/).
Share and Cite
MDPI and ACS Style
Sannikova, N.K.; Segur, H.; Arcas, D. Influence of Tsunami Aspect Ratio on Near and Far-Field Tsunami Amplitude. Geosciences 2021, 11, 178. https://0-doi-org.brum.beds.ac.uk/10.3390/geosciences11040178
AMA Style
Sannikova NK, Segur H, Arcas D. Influence of Tsunami Aspect Ratio on Near and Far-Field Tsunami Amplitude. Geosciences. 2021; 11(4):178. https://0-doi-org.brum.beds.ac.uk/10.3390/geosciences11040178
Chicago/Turabian StyleSannikova, Natalia K., Harvey Segur, and Diego Arcas. 2021. "Influence of Tsunami Aspect Ratio on Near and Far-Field Tsunami Amplitude" Geosciences 11, no. 4: 178. https://0-doi-org.brum.beds.ac.uk/10.3390/geosciences11040178
Note that from the first issue of 2016, this journal uses article numbers instead of page numbers. See further details here.