
Seismic Attribute Analyses and Attenuation Applications for Detecting Gas Hydrate Presence


1
School of Geosciences, University of Oklahoma, 100 East Boyd Street, RM 710, Norman, OK 73019, USA
2
Department of Geoscience, University of Calgary, Calgary, AB T2N 1N4, Canada
*
Author to whom correspondence should be addressed.
Geosciences 2021, 11(11), 450; https://0-doi-org.brum.beds.ac.uk/10.3390/geosciences11110450
Submission received: 4 August 2021
/
Revised: 25 October 2021
/
Accepted: 27 October 2021
/
Published: 31 October 2021
(This article belongs to the Special Issue Gas Hydrate Exploration and Interpretation Analysis)
Abstract
:Identifying gas hydrates in the oceanic subsurface using seismic reflection data supported by the presence of a bottom simulating reflector (BSR) is not an easy task, given the wide range of geophysical methods that have been applied to do so. Though the presence of the BSR is attributed to the attenuation response, as seismic waves transition from hydrate-filled sediment within the gas hydrate stability zone (GHSZ) to free gas-bearing sediment below, few studies have applied a direct attenuation measurement. To improve the detection of gas hydrates and associated features, including the BSR and free gas accumulation beneath the gas hydrates, we apply a recently developed method known as Sparse-Spike Decomposition (SSD) that directly measures attenuation from estimating the quality factor (Q) parameter. In addition to performing attribute analyses using frequency attributes and a spectral decomposition method to improve BSR imaging, using a comprehensive analysis of the three methods, we make several key observations. These include the following: (1) low-frequency shadow zones seem to correlate with large values of attenuation; (2) there is a strong relationship between the amplitude strength of the BSR and the increase of the attenuation response; (3) the resulting interpretation of migration pathways of the free gas using the direct attenuation measurement method; and (4) for the data analyzed, the gas hydrates themselves do not give rise to either impedance or attenuation anomalies that fully differentiate them from nearby non-hydrate zones. From this last observation, we find that, although the SSD method may not directly detect in situ gas hydrates, the same gas hydrates often form an effective seal trapping and deeper free gas accumulation, which can exhibit a large attenuation response, allowing us to infer the likely presence of the overlying hydrates themselves.
1. Introduction
Gas hydrates have been garnering interest in the academic and industrial climate within the last few decades, primarily with respect to their role in the petroleum industry and climate. Unfortunately, the detection of gas hydrates is not a straightforward process in seismic data analyses, the problem of which motivated this research. Gas hydrates, which commonly contain methane gas, are naturally occurring trapped biogenic or thermogenic [1] molecules within a crystalline lattice of hydrogen-bonded water molecules [2]. Experiments show that the formation of gas hydrates occurs once the conditions of pressure and temperatures are within what is known as the gas hydrate stability zone (GHSZ), observed in temperature–pressure phase diagrams [3]. Beneath the GHSZ, seismic data can potentially mark the transition from partially hydrate-filled sediments to a zone of partially gas-filled and/or water-filled sediments [4], via a strong seismic reflection known as a bottom-simulating reflector (BSR). The physical properties that govern their formation in low-temperatures and high-pressure conditions are linked to their natural occurrence in both the underlain sections of permafrost, and the shallow subsurface of continental deep-water environments. Unfortunately, due to the specific temperature–pressure regimes required to keep gas hydrates in their solid form, any alterations to this can affect the stability of the sea floor and surrounding lithology, creating potential drilling hazards in addition to sediment erosion [5,6].
Methane hydrates have been a topic of interest in both academia and the energy industry [7,8,9]. Although continental margins with subduction zones are not, at present, typical prospective regions for oil and gas exploration, these zones host a significant portion of the global supply of methane hydrates [10]. One example of the role of gas hydrates in petroleum industry is the 1967 discovery of the Messoyakha gas hydrate field in eastern Siberia. This field showed gas hydrate deposits within a sandy-argillaceous stratum of Middle Jurassic, Lower- and Upper Cretaceous Paleocene-age sediment [9]. The Messoyakha field study highlighted a few key findings with respect to gas hydrates. These included the negative environmental impacts, such as elevated levels of carbon footprint, the potential for methane to be exploited as cleaner sources of energy production, and the effects methane gas emission derived from the hydrate lattice can have on surrounding sediment stability. For these reasons, it is important to improve our methods of detecting gas hydrates in the subsurface via seismic reflection methods.
1.1. Detecting Gas Hydrates in the Subsurface
BSRs are associated with two types of phenomena. One is associated with diagenetic boundaries in siliceous sediments, the other is as a result of a negative impedance contrast caused by the transition from the gas hydrate-bearing sediments to the underlying free gas-bearing sediments [11]. This common approach of discerning the BSR is often distinct from the background geology, such that it follows a reflection with a reversed or “negative” polarity to that of the seafloor, and in most cases cross cuts natural stratigraphic units [12]. However, many studies have been performed on seismic data, which have noted that BSRs are not always present in regions where hydrates exist in the GHSZ [11,13,14]. Due to the elusive nature of detecting the presence of BSRs in seismic reflection data, multiple alternative geophysical methods need to be applied to determine the presence of gas hydrates in marine environments.
1.1.1. Strong Continuous and Weak Discontinuous BSRs
Continuous BSRs can be described as a continuous coherent anomalous reflector that mimics the seafloor whilst cross cutting stratigraphic units [11]. Paganoni et al. [15] observed the presence of gas hydrate from cores above (structure I) and below (structure II) an identified BSR in seismic, in which this interval also correlated with high-resistivity well log data. Vadakkepuliyambatta [16] inferred gas accumulation associated with hydrate dissociation of a likely thermogenic source, in addition to interpreting vertical fluid flow of gas chimneys in the seismic reflection data, contributing to the BSR presence. The aforementioned studies highlight just a few of the subsurface characteristics associated with strong-continuous BSRs observed in seismic.
Like strong continuous BSRs, weak discontinuous BSRs can also cross cut stratigraphic units and run roughly parallel the seafloor, and can additionally be recognized in seismic as widely spaced seismic events [11] that generally occur within heterogeneous units [11,13]. Few studies discuss the importance of the influence that seismic resolution, a result of the source, and acquisition set up can have on imaging BSRs in the subsurface [17,18]. In addition to these two factors, Hillman et al. [13] highlight that the differences in BSR imaging can be controlled by the occurrence of gas hydrates, free gas, and the lithological distribution of the formation. That comparison of three distinct seismic datasets reasons that BSRs occur discontinuously in nature [13] and highlights the complexity of the problem. Irrespective of physical properties, processing with higher-fold data, low-frequency shadows can be detected for free gas inference, as BSRs can be better imaged and characterized having stronger reflections [19]. Chapman et al. [20] showed the relationship between a high-resolution (i.e., high-frequency) acquisition system and resulting low-amplitude BSRs. The BSR amplitude response can therefore vary irrespective of the subsurface environment.
1.1.2. Advanced Studies of the BSRs and Gas Hydrate Relationship
There are many continuing and promising attempts employed to advance our interpretations and improve the efficiency in exploring for this natural resource. Multi-attribute analysis involving principal component analysis and self-organizing maps of sets of seismic attributes improve the imaging of the BSR, which potentially aids to identifying the occurrence of gas hydrates [21]. Furthermore, instantaneous attributes, when grouped for self-organizing map clustering, better detect strong and weak BSRs, whereas AVA attributes seem to improve discontinuous BSR detection [21]. Additionally, Lee et al. [22] conducted a multi-attribute analysis using the unsupervised K-means clustering algorithm, in addition to acoustic impedance and shear impedance inversion models, to estimate the extent and distribution of a gas hydrate reservoir. Estimations without the use of well logs included well-known amplitude versus offset (AVO) equations [22]. In another AVO-based study, Bedle [23] combined rock physics modeling with seismic attribute analysis to demonstrate that far angle stack seismic data and a fluid factor attribute revealed the continuity of BSRs, which full stack data and regular seismic amplitude did poorly in recognizing. This led to the conclusion that, for the BSRs associated with the interpreted AVA Class 2n gas hydrates based on the rock physics modeling, subsurface imaging of “weak” or “unseen” BSRs can generally be improved with such a method. Our motivation extends from the observation that few studies have investigated the significance of the frequency aspect of the seismic signal in relation to the presence of gas hydrates using primarily seismic data. Herein, we explore a comprehensive approach focused on the patterns of attenuation of the seismic signal and therefore test methods that include frequency-related seismic attributes, spectral decomposition, and a direct attenuation measurement using the quality factor, Q.
1.2. Seismic Attenuation
Seismic attenuation describes the decay of energy of a propagating wave through a body of rock or medium within the subsurface. Whilst moving through the subsurface media, the wave can experience significant loss of energy due to factors of geometrical spreading, scattering, and absorption. Evidently, amplitudes associated with high-frequency incident waves will attenuate faster than amplitudes associated with low-frequency incident waves. Since gas hydrates can reduce the availability of porosity to a pore fluid, it can potentially increase the elastic moduli [24], hence, significantly stiffening the rock medium. Laboratory studies examine this rigidity of the rock medium to determine the strength of hydrate-bearing sand grain/host sediments. Ghiassian and Grozic [25] show that the strength of gas hydrate sediments increased by a factor ranging between 1.8 and 3.6 as compared to the non-hydrate tests. Using a compressive strength test triaxial apparatus, hydrate-saturated sandy sediments increase in strength with increasing pressure and temperature [26]. With a similar type of experimental set up, Madhusudhan et al. [27] showed the differences in strength gain of hydrate-bearing sediments with varying particle sizes and surface areas, inferring a potential for a significant loss in the rock’s integrity following hydrate dissociation. Together with the importance of knowing the grain size of the host sediment, this observation also compliments the potential geological hazards associated with the dissociation/escape of hydrate from the pores of a rock medium. These apparent changes in the porosity are also controlled by the factors of hydrate pore filling and compaction [28] of sediments, which induce an attenuation effect as the seismic wave propagates through one medium into the other. Seismic attenuation is therefore a crucial tool in indicating pore structure, fluid content, and lithology [29,30], and therefore plays an important role in the approach to discerning BSRs.
Although the following studies do not focus primarily on the seismic-related feature of the BSR, it is important to identify the methods that directly or indirectly measure the attenuation response associated with signals that penetrate hydrate- and/or non-hydrate-bearing sediments. Bellefluer et al. [31] improved the resolution of seismic data upon compensating for the effects of attenuation in hydrate sediments and permafrost using methods such as Q-filtering and Q compensation on 3D seismic data while comparing to quality factor (Q) results obtained from vertical seismic profiling (VSP). Priest et al. [32] created a laboratory set up with similar temperature and pressure conditions for hydrate formation using samples of hydrate-bearing sands, which were noted to have frequencies below 400 Hz. This study concluded theoretically that there should be an attenuation response in hydrate sediments using quality factor measurements derived from shear and compressional waves.
With the continuing need to find and implement geophysical workflows that allow us to detect the elusive gas hydrates in the subsurface, herein we focus on uncovering the seismic signature of gas hydrates in deep-water settings using frequency-based methods.
2. Area of Study
2.1. Geologic Setting
The Pegasus Basin is located on the eastern side of the central New Zealand midcontinent, adjacent to the transitional zone where the tectonic regime transforms from the subduction of the Pacific plate beneath the overriding Australian Plate along the Hikurangi Trough, to a strike-slip setting northeast of the South Island (Figure 1). The plate boundary runs in an SSW–NNW direction, from the strike-slip zone of the Marlborough area, across the western subducting boundary of the Pegasus Basin, in the region known as Cook Strait, along the Hikurangi Trough, which extends into the northernmost Kermadec Trench. Its geometric shape covers an area of ~75,000 km2 [33], is defined in the north by the north-east trending East Coast Basin and structural highs to south and northwest, defined by east-west trending Chatam Rise and the Hikarungi Plateau, respectively. The basin consists of 80 million years of passive margin style sedimentation as a result of rift-related thermal subsidence, which is now topped by an 8 km thick succession of siliciclastic material [34]. The basin fill can be separated into two main sedimentation stages: (1) a 6 km thick deposition of subducting-related accretionary wedge material, located on the Pacific Plate, and comprising Neogene deep-water channels, turbidites, and mass transport deposits that carried terrestrial sediments derived from the North and South Islands and from neighboring highs [35]; (2) prior to this, an accumulation of >2 km thick Late Cretaceous and Paleogene sediments sourced from the Chatam Rise, commencing at the end of ancient Gondwana subduction between 105 myr and 24 myr ago [35].
The Pegasus Basin has been a very prominent region of interest for the study of gas hydrate origin and formation. One of the earliest implications for gas hydrate presence within the region came from the interpretation of BSRs in seismic data in the shallow sedimentary layers of the subsurface [36]. Katz [36] also infers that hydrate presence can be determined by structural conditions (e.g., one case being anticlinal vs. synclinal) that give way for the upward migration of gas to the hydrate stability zone where methane hydrates are formed. This can also include faults and fractures that can act as both pathways or seals. Several decades later, further research within the region would result in the gathering of raw data to further investigate this energy resource. Methane gas concentrations from cold seeps were sampled and analyzed in three separate areas along and near the Hikurangi Trough [37]. A combination of collection methods was employed, and the analysis showed the occurrence of methane concentrations, of primarily biogenic origin, distributed along specific depths within the water column for each study area, neither of which showed methane concentrations at the sea surface [37]. In 2011, a two-leg plan by the research cruise SO-214 under the project name NEMESYS set out to collect a wide range of data that included both seismic and geo-chemical data [38]. This project also focused on several methane cold seeps along the Hikurangi Trough, including the Opouawe Bank, which revealed that its anticlinal structure guides upward fluid migration to the GHSZ [39,40]. The presence of gas hydrates is also documented in bathymetric features further seaward, beneath a Frontal Anticline and sandy sediments underlying the Hikurangi Channel [10,39]. Additionally, in situ hydrate accumulation is constrained to recent to Pleistocene-aged sediments supported by the presence of BSRs in seismic data observed within Pleistocene strata [39]. Our initial application focuses on the cross-sectional region that includes the Frontal Anticline and Hikurangi Channel. The combination of studies that provide strong evidence for regional subsurface hydrate occurrence and fluid migration makes the Pegasus Basin, a unique area of focus where a multitude of methods can be applied.
2.2. Seismic Data
This study utilizes two seismic surveys, the PEG09 and APB13 surveys—both conducted within the Pegasus Basin, for a comparative analysis of the efficiency of the applied methods. The former has been used in many studies compared to the latter, which makes it an ideal survey candidate for exploring a new method [10,21,23,39,41]. The APB13 survey is used to validate the transferability of the geophysical attenuation method to ensure it provides consistent results across both surveys. The PEG09 survey comprises of 26 multi-channel 2D seismic lines with a total land cover of ~3000 km, acquired in 2009 and 2010 by the New Zealand Ministry of Economic Development. Acquisition parameters include receivers placed at 12.5 m intervals along a 10 km streamer, with shot intervals every 37.5 m, at a sampling rate of 2 ms that provides a record length of 12 s in depth. At present, no borehole or exploratory wells exists within the basin. The APB13 survey followed, and was completed within the same area of interest, with higher-resolution recorded data. Similar to the PEG09 survey, the APB13 consists of 54 multi-channel 2D seismic profiles that cover a distance of ~4600 km. Acquisition parameters include group intervals of geophones at 12.5 m and shot spacing at 37 m. Record length extends to 10.5 s with a sampling rate of 2 ms.
3. Methodology
We have discussed a few methods that consistently include seismic data to aid in the detection of gas hydrates within the subsurface of continental margins. Some methods with which additional thermal modelling or velocity analyses were performed that used only seismic data for interpretation and/or attribute analyses, which can include machine learning application or other methods including additional thermal modelling or velocity analyses. What is often discussed that explores the relationship between the gas hydrate and the BSR, is an attenuation response influenced by the transition from the gas hydrates to free gas below. Laboratory studies have observed attenuation within gas hydrate-bearing sediment and free gas-bearing sediment to varying degrees, whereas many seismic studies have observed attenuation within the free gas zone by using frequency-dependent seismic attributes. Although certain inferences can be made from these seismic attributes, such as instantaneous frequency and reflection strength, they do not provide a direct quantitative measurement of the attenuation response via the Q-factor and are therefore non-unique. Unfortunately, not many studies explore the direct measurement of the Q-factor in seismic data comprising gas hydrates. We apply a recent attenuation method developed by Wang and Morozov [42], which extracts a statistical wavelet from seismic data and, hence, does not require any well logs (See also [43]). We first use conventional frequency attributes to show how they are not always a reliable method in imaging BSRs and hydrate systems. Next, spectral decomposition methods are employed to image the bottom-simulating reflectors with hopes of observing anomalies in the background geology within expected gas hydrate zone. The attenuation method serves to establish the exact location and spatial distribution of the gas hydrates and/or free gas and their quantitative response.
Three areas of interest are identified as zones consisting of the following: a strong continuous (SC) BSR (Region A), which includes the Frontal Anticline; a weak discontinuous (WD) BSR (Region B); and a very strong continuous (VSC) BSR (Region C), which includes a portion of the Hikurangi Channel (Figure 2). We distinguish between the SC-BSR and VSC-BSR based on the observable strength of the amplitude reflector. Additionally, the apparent difference in surrounding seismic amplitude signatures (Region A being subtler) offer potential inferences in gas hydrate-related presence. Within each region, we initially examine and interpret the time-series response along seismic Traces 1150, 4500, and 6000, which correspond to Regions A, B, and C, respectively (see Figure 3). Observable attenuation effects can only be qualitatively assessed when interpreting the seismogram, as the signals show patterns of “decay”. It is worth mentioning that regular time-amplitude waveforms, or in this case the seismic traces, following the convolution model are not capable of resolving most geological properties or anomalous features, but those other methods may do well in imaging. We will show the attenuation method used in this study can directly measure and quantitatively interpret attenuation effects.
3.1. Seismic Attribute Application: Frequency Attributes
One of the earliest applications of frequency attributes to discern gas hydrate presence was performed to interpret the Blake Ridge Diapir, located off the coast of South Carolina. The instantaneous frequency (IF) attribute revealed that low-frequency signatures (also termed low-frequency shadow zones—LFSZs) coincide with free gas regions below BSRs with a strong seismic reflection, overlain by a hydrate-bearing layer [44]. This attribute can be defined as the derivative of the instantaneous phase, which indicates time-dependent frequency information associated with the seismic trace. The instantaneous frequency can highlight the occurrence of high attenuation influenced by the free gas, if the lithological layers above the BSR exhibit strong reflections such that the velocity changes is quite significant [44,45]. It therefore aids in differentiating the gas hydrate-bearing sediments from those sediments with pore-filled free gas. Utilizing similar seismic attribute analyses, Kim et al. [45] also discusses a low instantaneous frequency response within free gas regions capped by gas hydrate-bearing sediments; however, it reveals high instantaneous frequencies when the gas hydrate exists above a non-free gas region. Additionally, since the instantaneous frequency responses do not clearly distinguish the BSRs, gas hydrate- and/or free gas-bearing sediments, in most cases, from that of the background geology, we perform a spectral decomposition to improve interpretation and analyses.
Although they provide some benefits to interpretation, we proceeded to compute two frequency-related seismic attributes to briefly analyze and discuss the disadvantages such methods may have when performing a more comprehensive characterization of gas hydrate systems. We apply the instantaneous frequency and sweetness attributes to highlight such disadvantages. It is important to reiterate that many studies have shown the benefits of seismic attributes, especially sweetness and instantaneous frequency, to assess gas hydrate and free gas presence [46,47,48], and that this study compares the differences among several methods based on the results. We use IF to resolve the trends of the BSR and indirectly observe attenuation effects in the seismic. The sweetness attribute is a division of the trace envelope by the square of the instantaneous frequency [49]. It is a useful attribute for delineating sand-confined channels [50,51,52] as well as a good indicator of hydrocarbon reservoirs correlating to bright spots [46,53]. Here, sweetness is also used to better resolve the BSR.
3.2. Spectral Decomposition Application: Continuous Wavelet Transform
Time-frequency decomposition, or spectral decomposition is a method that decomposes seismic data into its frequency and phase components, in which the frequency component measures the relative seismic amplitude within a specific frequency band. The seismic data are transformed from their time to frequency domain. There are a multitude of techniques that can perform the transformation of the recorded seismic traces from time (or depth) to frequency domain to obtain spectrally decomposed volumes. Some of these methods include continuous wavelet transform [54,55], the matching pursuit method [56], and Wigner–Ville distribution [57,58], to name a few. Although most spectral decomposition techniques are designed to detect stratigraphic features and temporal variations in bed thickness, this study utilizes the continuous wavelet transform (CWT) spectral decomposition application to garner the frequency components of the seismic data in the presence of gas hydrates. A benefit of employing this method is its capability to produce quality temporal resolution for high frequencies and quality frequency resolution for lower frequencies [59].
For this study, we ignore comparing the variations in the suite of parameters that may influence the computed results and focus on only one important parameter. Hence, for this workflow, we pay attention to how variations to the bandwidth of a window function defined by a mother (‘Morlet’) wavelet, which convolves with the time-series signal (seismic trace) and may or may not improve the detection of the bottom-simulating reflectors. The convolution solution that defines the continuous wavelet transform comprises of this window function among other parameters that scale and translate the mother wavelet [59].
Defining this “type” of wavelet acts as a quality control method, which allows us to examine a time-frequency spectrum of the outputs to the CWT. Furthermore, we compute the spectral magnitudes of time frequencies along a seismic trace within Region C, for the half-bandwidths fb = 0.26, 0.52, and 0.78. By examining the temporal and frequency resolutions that the different half-bandwidths provide, we select the best value to compute the spectral components from the 10–120 Hz range using a 5 Hz step. In order to determine what frequencies do well in resolving the geological properties associated with BSRs, we examine several spectral components of low frequencies (20 Hz and 40 Hz components) and higher frequencies (60 and 80 Hz components). It is imperative that the once the BSRs can be better delineated, the results of the attenuation may provide further insight into gas hydrate and/or free gas accumulation.
3.3. Attenuation Application: Sparse-Spike Decomposition
In attempting to gain better resolution of the seismic data, applied geophysicists and seismic interpreters pay particular attention to measurements associated with the scattering and dispersion of the seismic wave. This results in the decay of wave amplitude, which is reliant on a couple attenuation parameters [60]. These parameters include an attenuation coefficient α and seismic quality factor, Q. The quality factor, Q, measures the degree of dissipation of a material such that high Q values indicate low dissipation/attenuation and lower Q values indicate high dissipation/attenuation of signals. Seismic attenuation is therefore a crucial tool in indicating pore structure, fluid content, and lithology [29,30], and thus plays an important role in the approach to discerning BSR’s. The quality factor will therefore be the attenuation parameter observed for the application of this study.
In order to accurately interpret the attenuation response within the seismic data, we simply apply a wavelet-estimation procedure developed by Wang and Morozov [42], and then use a spectral ratio method to determine the frequency-dependent quality factor, Q. The benefit of using this method, especially in our case, is that it is a non-stationary statistical method that does not require well log information. An important assumption put forth for this method is that the largest amplitude peaks within a seismic trace are sparse enough that when estimating the wavelet, the neighboring reflections are small enough such that unnecessary noise is removed. The following steps describe the iterative process to achieve the estimated wavelet [42,43]:
- (1)
- Extract tapered sections along the seismic trace by overlapping windows of a specified length. The size of this window length should be larger than the source waveform length.
- (2)
- Within each windowed section, a number of the largest amplitude peaks are identified at time tn and amplitude value An.
- (3)
- The windowed section of a specific length centered on each picked peak is extracted from the seismic trace.
Following the extraction of the windowed section, they are then aligned and stacked together to achieve the estimated wavelet, with the right-hand side of variables including the normalization of the peak amplitude via an rms (root-mean-square) amplitude (Arms), an amplitude scaling factor for the wavelet, and a Hamming taper that has the same length of the seismic trace and a sign function. To determine the quality factor using the spectral ratio method, using pairs of the current and succeeding windowed sections, the quality factor is estimated between each pair such that:
where i represents the current windowed section, ti is the time at that moment, and the function Ai(f) represents the amplitude spectra of the estimated wavelet (refer to [42,43] for detailed methodology).
4. Results
The following results provide a holistic approach of the variety of methods applied to inferring the presence of gas hydrates within the subsurface. We explore the anomalies associated with the different types of BSRs that we defined, in their respective locations along the cross-section profiles, which can be interpreted from regular seismic amplitude data. Frequency-dependent seismic attributes of instantaneous frequency and sweetness were then applied to briefly examine where they fall short of being conclusive, and hence spectral decomposition provides a more in-depth computational analysis. The sparse-spike spectral decomposition results give both a quantitative and qualitative understanding about the direct relationship between BSRs and attenuation within gas hydrate-bearing sediment and free gas-bearing sediment.
4.1. BSR and Seismic Amplitude
We observe the negative amplitude response of the BSR along Traces 1150, 2900, and 4400 (Figure 3). Along Trace 1150 (Region A), where the BSR is at ~3500 ms, after less than 500 ms, the amplitude begins to decrease within the free gas zone and, therefore, the signal attenuates. This is also observed along Trace 4400, consisting of the very strong continuous BSR at ~4000 ms, in which the signal attenuates at ~4500 ms as it propagates through the free gas zone. On the contrary, along Trace 2900, there is no observable attenuation of the signal, but we can observe amplitude responses that are not easily discernable from those within the gas hydrate stability zone. Interestingly, the signal increases in magnitude before decreasing at around 5500 ms. In all three cases (Traces 1150, 2900, and 4400), the responses within the interval of the GHSZ are similar and provide no real indication of gas hydrate accumulation.
4.2. BSR and Frequency Attributes
The distinct, “local” SC- and VSC-BSRs are separated by a region of a WD-BSR (Figure 4a). This WD-BSR has a low IF response and, hence, blends with the lateral conformable geology. Towards the northwest (NW) in the region of the SC-BSR, IF does slightly well in imaging the trend of the BSR (observed in seismic as well). Beneath the anticline folded layer, which coincides with the trend of the BSR, there is a concentrated distribution larger IF responses in addition to the region beneath the VSC-BSR, which can also be described has having a larger discernable IF response (Figure 4b). The large distribution of the high IF values can be attributed to the accumulation of free gas beneath the anticline folded layer and the VSC-BSR. A region of very low frequencies, potentially LFSZs, is observed beneath each of these features indicating the potential accumulation of free gas. There is no noticeable difference in the IF response from that of the seismic amplitude beneath the region of the WD-BSR, such that the seismic amplitude responses coincide with that of the IF attribute. The sweetness attribute, which again is the envelope (Figure 5a) of the signal divided by the square of instantaneous frequency, improves imaging of the BSR. Although weak, the sweetness attribute reveals the trend of the WC-BSR distinct from the reflections of the background geology (i.e., low sweetness values). Larger sweetness values coincide with the SC-BSR in the northwest and the VSC-BSR in the southeast, in addition to the large concentration of sweetness beneath the folded layer of the anticline and the VSC-BSR. Again, this suggests the potential accumulation of free gas within these regions. Low-frequency shadow zones show up as larger sweetness values with this attribute.
4.3. BSR and Spectral Decomposition
The results of the time–frequency plots are examined to determine which bandwidth size of the mother wavelet would be most suitable in improving the resolution of the bottom-simulating reflectors (Figure 6). The narrower band wavelets (fb = 0.26) show greater variation along the frequency component values (see Figure 6a) and therefore better frequency resolution compared to the broader band wavelets (fb = 0.78) (see Figure 6c); however, they lack variation in the temporal domain. Although we observe better resolution temporally, the broader band wavelet results in more smoothened magnitudes for the frequency domain (Figure 6c). These smoothened magnitudes provide poor frequency variation, making this bandwidth less ideal for interpretation in frequency domain. The results for the half-bandwidth fb = 0.52 have less smoothened magnitudes, while also highlighting the variations in the temporal domain (Figure 6b). Since we are taking into consideration the frequency responses in addition to above and below the interpreted BSRs, this bandwidth seems to be a suitable candidate for generating the frequency components.
Along each frequency component profile, it is clear that the high magnitudes of the frequencies coincide with trend of the SC-BSR and the region beneath the anticline folded layer, as well as with the trend of the VSC-BSR and the regions below it (Figure 7). However, each component does not improve the detection of the WD-BSR. The larger frequency components (60 and 80 Hz) do a better job than the lower-frequency components (20 and 40 Hz) in delineating the BSR and reducing image smoothness (Figure 7a,b). Additionally, using the larger frequency components (especially the 80 Hz component), we can better interpret the presence of LFSZs beneath the VSC-BSR and the subsurface folded layer of the Frontal Anticline. The spectrally decomposed larger frequency components therefore improve both the detection of BSR presence and the LFSZs compared to the frequency attributes that only improved one of these seismic responses.
4.4. BSR and Attenuation
For the attenuation application using the sparse-spike decomposition method, we focus on comparing the results of the PEG09 Line 19 survey and the adjacent APB13 Line 40 survey (Figure 8). Note the gas–water contact can be observed in Figure 8c, as also interpreted by Crutchley et al. [18]. The three zones of interest are defined as Region A boxes d and g (Figure 8) consisting of the SC-BSR as well as the Frontal Anticline, Region B, boxes e and h (Figure 8) consisting of the WD-BSR, and Region C, boxes f and i which comprise the VSC-BSR and a portion of the Hikurangi Channel (Figure 8). The zoom in on Region A of the APB13 Line 40 survey shows a fault beneath the anticline fold, which is better interpreted to signify the higher-resolution data of this seismic survey compared to the PEG09 data.
The inverse Q (Q−1) results highlight the distribution of attenuation within the regions of interest for both the PEG09-19 and APB13-40 surveys (Figure 9). Within the region of the SC-BSR (light seismic amplitude reflector), we observe high-attenuation values that surround and coincide with the BSR for both surveys, but zero to low attenuation in the region where the BSR cannot be well delineated between the SC-BSR and the anticline folded layer (Figure 9a,b). Notice that between Traces 1800 and 2100 along the PEG19-19 survey, there is a concentration of high attenuation of Q−1 = ~0.03 within the syncline folded layers, adjacent to the anticline folds (Figure 9a). Although this attenuation is not observed in the APB13-40 survey (Figure 9b), it may suggest free gas presence migrating up-dip along the folded layer. Both surveys consist of a significant concentrated distribution of attenuation beneath and coinciding with the anticline folded layer, with APB13-40 showing more distribution of the attenuation. Additionally, a high-attenuation response situated at ~4750 ms beneath the region of the Frontal Anticline, along the interpreted fault, can further support the presence of free gas migration in this area (See Figure 9b). With careful observation, we recognize that some potential multiples in the left uppermost areas of both surveys and beneath the SC-BSR in APB13-40 are congruent with significant attenuation. It is likely that the high-amplitude artifacts contribute to the attenuation and are therefore not attribute to geology. The WD-BSR region shows zero attenuation along the BSR trend (~4250 ms) but does have a region of high-attenuation values Q−1 = ~0.03 and ~0.04 at depths between 4500 and 5000 ms along PEG09-19 (Figure 9c). There is no significant attenuation associated with the WD-BSR along APB13-40 (Figure 9d). In both surveys, the region of the VSC-BSR has the highest distribution of large attenuation values of Q−1 = ~0.04–0.05, predominantly below the BSR (Figure 9e,f). Furthermore, there is a zone of high attenuation directly beneath the sea floor along PEG09-19 cross-section but not along the APB13-40 cross-section, near the bathymetric feature of the Hikurangi Channel.
Overall, the results of each method have advantages and disadvantages in the response to BSRs and gas hydrate systems. The IF attribute may not clearly image the trend of the BSR but can infer free gas accumulation as a result of LFSZs. Sweetness shows up as large values in the LFSZs, rather than a lack thereof; hence, it may not directly infer a low-frequency shadow. It does, however, better discern BSRs, especially WD-BSRs. The high-frequency components of the spectral decomposition method have the benefit of better imaging the strong BSRs and separating them from the background geological response, whilst also identifying the LFSZs in the seismic. The attenuation method provides the quantitative measurement and response of attenuation in zones where we do expect free gas accumulation and migration, which can be used to indirectly infer the presence of gas hydrates in the overlying sediment strata.
5. Discussion
5.1. Gas Hydrate Attenuation in the Pegasus Basin
Although Traces 1150 and 4400 (See Figure 3) show patterns of signal attenuation, especially where strong BSRs are present, there are many factors, irrespective of gas hydrate accumulation and free gas presence, that can contribute to this attenuation response. These factors include, but are not limited to, poor lithological compaction, hydrocarbon reservoirs, fluid (e.g., brine) presence, and other physical rock properties [24,28].
Comprehensively, the results point to a pattern of seismic attenuation that predominantly occur within the well-known regions of accumulated free gas and not within the gas hydrate stability zone. With a more solid understanding of attenuation using the sparse-spike decomposition, the combination of the methods provides four main intuitive observations. These observations include the following: (1) low-frequency shadow zones seem to correlate with large values of attenuation; (2) there is a strong relationship between the amplitude strength of the BSR and the increase of the attenuation response; (3) the resulting interpretation of migration pathways of the free gas using the direct attenuation measurement method; and (4) for the data analyzed, the gas hydrate stability zone itself does not give rise to either impedance or attenuation anomalies that differentiate it from nearby non-hydrate zones. Additionally, since the APB13 survey is of higher resolution and may be a better candidate for accurate results, we compute and interpret the APB13-42 2D line adjacent to the PEG09-19 and APB13-40.
5.1.1. Observation 1: LFSZ and Attenuation
The LFSZs observed in seismic attribute analyses very much indicated the potential presence of gas hydrates within the subsurface due to changes difference in medium properties. As mentioned Taylor et al. [44], these low-frequency signatures can be attributed to the free gas regions below BSRs that exhibit very strong seismic reflection, capped by the hydrate layer with larger frequency responses (refer to Figure 4b). This is a result of the presence of gas-bearing sediments (mostly gas sands) that filter signal frequencies via absorption creating the LFSZs below the zone of hydrocarbon accumulation [61]. The low-frequency shadow (LFS) is described as a feature in seismic that occurs as the high-frequency components of a signal become attenuated at a shorter distance than the low-frequency components, therefore resulting in low-frequencies below the highly attenuated interval [24,62]. Hence, the LFSZs occur a few 100 ms at depth below the VSC-BSR (NW of the Hikurangi Channel) and the anticline folded layer, where we infer free gas accumulation as supported by several other studies [14,39]. However, this is not always the case since large instantaneous frequencies can occur below the BSR [45]. Nevertheless, similar analyses can be inferred for the spectral decomposition such that the larger individually computed frequencies can better infer the LFSZ due to loss of energy of the higher frequencies, when compared to the lower-frequency components. The large values of the direct attenuation measurement of the sparse-spike decomposition supports the inference that there is a free gas system with significant attenuation within the interpreted LFSZ between 4500 and 5000 ms, beneath the anticline folded layer of the APB13-40 2D line (see Figure 9) and APB13-40 2D line (see Figure 10a) and between 4000 and 5000 ms beneath the VSC-BSR regions for the PEG09-19 (Figure 9e), APB12-40 (Figure 9f), and APB13-42 (Figure 10d) 2D lines.
5.1.2. Observation 2: BSR Strength and Attenuation
We identified that the type and strength of the BSR have a direct relationship to the response of attenuation. The contrast in seismic velocity, such as the P-wave velocity, is affected by the concentration of gas that can therefore determine the strength of the reflection in the seismic data [44,63]. This can explain the difference in attenuation response for the SC-BSR and the VSC-BSR zones and the occurrence of the WD-BSR. The WD-BSR has a low-attenuation response for several 100 ms beneath, suggesting that there is no free gas accumulation directly below, but likely within the deeper highly attenuated section between 4500 and 5000 ms (See Figure 9c). The lack of the accumulation of free gas can result in the apparent weak/low BSR amplitudes [64]. Although the IF and sweetness attributes and the spectral decomposition provide no indication for free gas accumulation based on the relationships used in this study, the inverse Q (Q−1) demonstrates otherwise. The vertical separation of the high-attenuation zone from the interpreted BSR trend signifies the importance of the location and vertical distribution of the free gas to the type and extent of the BSR. We speculate that the zone of zero attenuation that separates the weak BSR and the high-attenuation zone can be caused by an upward transition from high laterally permeable sediments (marked by high attenuation) to low-permeable fine-grained sediments after findings by Bai [65] along the Hikurangi Margin. It is likely that no conduits for vertical permeability exist. The absence of this zone of high attenuation below the WD-BSR for the APB13 survey (Figure 9d) can only be explained by either a lower concentration of free gas or no free gas in this area. Another explanation can be the presence of transition zones that separates the base of the GHSZ where gas hydrates are present and the BSR, where high concentrations of hydrate can exist above if methane is being expulsed at high rates, as described by Chapman et al. [20]. However, this was a proposed layer with thickness of tens of meters, and the interpreted zone in this study is potentially on the hundreds of meters scale. However, it is possible to infer this is a transition zone where hydrate and free gas can coexist but there is not enough free gas to create significantly observed attenuation.
On the other hand, the APB13-42 line does have significant attenuation directly below the WD-BSR opposing the aforementioned analyses. However, this strong attenuation coexists with a strong chaotic seismic response observed in the seismic amplitude and can therefore be influenced by the seismic amplitude rather than free gas presence. Furthermore, it is important to note a study conducted by Holbrook [63] identified that, although the BSR was strongest at Well Site 995 for the Ocean Drilling Program (ODP) Leg 164 along Blake Ridge, VSP data showed that the concentration of free gas was larger at adjacent well Site 997 directly beneath an intersected weak but discernable seismic BSR. Plaza-Faverola et al. [39] identified that buried channel sands overlain by the present day Hikurangi Channel can accommodate a significant amount of methane hydrate and free gas. We can therefore infer that the VSC BSR and its high attenuation, although further west from the Hikurangi Channel, is caused by the large concentration of free gas in that area.
5.1.3. Observation 3: Free Gas Migration and Q−1
What is promising from the results is that we can postulate zones of migration due to the vertical pattern of the attenuation response. For a more accurate analysis, we focus on the attenuation that occurs within two main locations influenced by fluid migration: (1) the frontal anticline and (2) the buried sediments west of the Hikurangi Channel. We infer that the high attenuation below the frontal anticline is associated with the migration of methane gas via faults, fractures, and folding [66] accommodated by deformation that form the structural anticline. Dewangan [67] made similar deductions when the high attenuation, using an effective Q estimation from seismic peak frequencies, agreed with the faults cross cutting hydrate layers. The distribution of the attenuation response suggests it may be sourced from the flanks and accumulating at the crest of the folded anticline layer. This may seem contradictory to interpretations that the blanking zone (i.e., the LFSZ in the IF attribute and CWT) of the seismic amplitude may actually indicate the presence of “debatable” biogenic [10] sourced free gas in sediments directly beneath the center of the anticline [39]. The free gas may be accumulating below the crest of the anticline layer, but not accumulating further below; hence, the pattern of distribution of inverse Q (Q−1) observed in our results. One can hypothesize that the accumulated free gas, upon absorption of the seismic energy, will result in low-frequency, low-amplitude signals to image the deeper sections, creating the amplitude blanking zone without free gas as a contributor. Several studies have identified that the potential pathways to fluid migration in the region of the VSC-BSR are collocated to the largest attenuation values because of high concentrations of free gas. The mechanism behind this can be its proximity to the subducting plate, in which thermogenic gas migrates upward along the subduction zone and into the sediments below the BSR near the Hikurangi Channel [10,39].
5.1.4. Observation 4: No Direct Relationship with GHSZ
One of our main goals is to measure the nature of attenuation within the gas hydrate stability zone to provide a method that can directly identify gas hydrate presence using seismic data. However, we learned from the results of the inverse Q that the method does not directly identify any significant response within the well-known hydrate-bearing sediment interval. This is not an unexpected result, but studies that have observed the influence of gas hydrate-bearing sediments on increasing attenuation [68,69,70] have piqued a lot of interest in the hydrate community. Several mechanisms explain the reasons for the increased attenuation: one in particular identifies viscosity-related energy loss due to the crossflow of pore fluid between different medium rigidities [70]. Note that several of the following studies measured the quality factor, Q, via distinct mathematical approaches, using different data sourced from well logs, or seismic reflection data. Upon comparing with their results, note that the orders of magnitude differ, but the general assessment of the hydrate or free gas response is objectively reasonable. Dvorkin and Uden [70] used an attenuation model, and estimated high-attenuation values along a well, with the methane hydrate interval between Q−1 = 0.15 and 0.20 (Q = 6.67 and 5, respectively), opposing the observed attenuation in our Q−1 plots. Similar to the results of our study, Dewangan et al. [67] used seismic data to reveal low attenuation associated with hydrate-bearing sediments. However, their average Q values ranged > 200, making our results only qualitatively and not quantitatively comparable. Furthermore, using a logarithmic spectral ratio for prestack, a study by Sain et al. [71] measured high values of Q (~256; i.e., low attenuation) within gas hydrate intervals above the BSR and lower values of Q (120–137; i.e., high attenuation) for brine-saturated sediments below the BSR, demonstrating a case for much lower attenuation if gas was present. It is difficult to provide a conclusive reason as to why we observed no high attenuation in the Q−1 profiles. However, Matsushima [72] showed the lack of an attenuation response in hydrate-bearing sediments compared to zones of free gas with high-attenuation responses with attenuation measurements using seismic frequency ranges (i.e., 30–110 Hz). This is contrary to the study done by Priest et al. [32], which postulated that theoretically there should be an increase in attenuation in hydrate-bearing sediment within marine seismic-related frequency ranges. They do not, however, document the specific range of frequencies, adhering to frequencies that fall below 400 Hz. Therefore, the absence of the attenuation in methane hydrate sediments is potentially influenced by the frequency range of the seismic data observed here, but this may not be the only factor.
5.2. Summary of Methods
To summarize, we include a performance summary of each of the applied methods (see Table 1). Each of the methods was examined for its effectiveness as (1) a direct gas hydrate indicator, (2) a free gas indicator, (3) a way of discerning strong BSRs, and (4) a way of discerning weak BSRs.
6. Conclusions
Using a comprehensive analysis of several methods to improve the detection of bottom-simulating reflectors, including seismic frequency-related attribute analysis and spectral decomposition (via continuous wavelet transform), we found that attenuation measurements estimated from the quality factor Q provide a means to map free gas. The SSD method has the ability to estimate Q from purely seismic data, and can therefore be performed without well logs, which are only rarely available in deep-water settings. Several observations demonstrate that this SSD-based workflow can be applicable to areas of interest, primarily for discerning the presence of free gas. We observed the following: (1) low-frequency shadow zones defined in seismic attributes and spectral decomposition coincide with high attenuation, (2) there is a strong relationship with the amplitude strength of the BSR and the attenuation response, and (3) the inverse Q (Q−1) can reveal potential fluid migration pathways. For the data analyzed, the gas hydrate stability zone itself does not give rise to either impedance or attenuation anomalies that differentiate it from nearby non-hydrate zones. It is common that distinguishing the attenuation of gas hydrates with background sediments is a difficult task when using seismic data. Although several authors have identified anomalous attenuation in the gas hydrate zone itself, such is not the case for the New Zealand data presented herein. However, if the attenuation method can assist in identifying free gas distribution and accumulation, or subtler free gas that does not have a high seismic amplitude (i.e., a bright spot), the attenuation response can indirectly aid in identifying gas hydrates by identifying the free gas that is being trapped. Other regions, such as the Gulf of Mexico, Japan, and India, show strong peak leading hydrate-related amplitudes, and this method should also be tested in these regions. While hydrates are notoriously difficult to directly detect in seismic data, similar to hydrocarbons, attenuation can be used as an indirect hydrate-detection method, aiding in discerning and characterizing hydrates and/or their trapped free gas reservoirs within the subsurface.
Author Contributions
Conceptualization, R.C. and H.B.; Data curation, R.C. and H.B.; Formal analysis, R.C.; Methodology, R.C., H.B. and K.M.; Project administration, R.C. and H.B.; Software, Y.W.; Supervision, H.B.; Writing—original draft, R.C.; Writing—review and editing, R.C., H.B., K.M. and Y.W. All authors have read and agreed to the published version of the manuscript.
Funding
This research received no external funding.
Data Availability Statement
The data that support the findings of this study are publicly available on the New Zealand Petroleum and Minerals website www.nzpam.govt.nz (accessed on 9 January 2018).
Acknowledgments
We sincerely thank New Zealand Petroleum and Minerals and Origin Energy New Zealand Pty Ltd. for providing the Pegasus Basin dataset. Additionally, we express our greatest appreciation to Petrel E&P software from Schlumberger for providing the University of Oklahoma with the academic licenses for conducting this project as well as the Attribute-Assisted Seismic Processing and Interpretation (AASPI) consortium at the University of Oklahoma.
Conflicts of Interest
The authors declare no conflict of interest.
References
- Dev, A.; McMechan, G.A. Interpreting structural controls on hydrate and free-gas accumulation using well and seismic information from the Gulf of Mexico. Geophysics 2010, 75, B35–B46. [Google Scholar] [CrossRef]
- Sloan, E.D. Fundamental principles and applications of natural gas hydrates. Nat. Cell Biol. 2003, 426, 353–359. [Google Scholar] [CrossRef]
- Tishchenko, P.; Hensen, C.; Wallmann, K.; Wong, C.S. Calculation of the stability and solubility of methane hydrate in seawater. Chem. Geol. 2005, 219, 37–52. [Google Scholar] [CrossRef]
- Singh, S.C.; Minshull, T.A.; Spence, G.D. Velocity Structure of a Gas Hydrate Reflector. Science 1993, 260, 204–207. [Google Scholar] [CrossRef]
- Diaconescu, C.; Knapp, J. Gas Hydrates of the South Caspian Sea, Azerbaijan: Drilling Hazards and Sea Floor Destabilizers. In All Days; OTC-14036-MS; OTC: Houston, TX, USA, 2002. [Google Scholar]
- Faure, K.; Greinert, J.; Pecher, I.A.; Graham, I.J.; Massoth, G.J.; De Ronde, C.E.J.; Wright, I.C.; Baker, E.T.; Olson, E.J. Methane seepage and its relation to slumping and gas hydrate at the Hikurangi margin, New Zealand. N. Z. J. Geol. Geophys. 2006, 49, 503–516. [Google Scholar] [CrossRef]
- Portnov, A.; Cook, A.; Vadakkepuliyambatta, S. Diverse gas composition controls the Moby-Dick gas hydrate system in the Gulf of Mexico. Geology 2021. [Google Scholar] [CrossRef]
- Collett, T.S.; Boswell, R. Resource and hazard implications of gas hydrates in the Northern Gulf of Mexico: Results of the 2009 Joint Industry Project Leg II Drilling Expedition. Mar. Pet. Geol. 2012, 34, 1–3. [Google Scholar] [CrossRef]
- Makogon, Y.; Holditch, S.; Makogon, T. Natural gas-hydrates—A potential energy source for the 21st Century. J. Pet. Sci. Eng. 2007, 56, 14–31. [Google Scholar] [CrossRef]
- Kroeger, K.; Plaza-Faverola, A.; Barnes, P.; Pecher, I. Thermal evolution of the New Zealand Hikurangi subduction margin: Impact on natural gas generation and methane hydrate formation–A model study. Mar. Pet. Geol. 2015, 63, 97–114. [Google Scholar] [CrossRef]
- Shedd, W.; Boswell, R.; Frye, M.; Godfriaux, P.; Kramer, K. Occurrence and nature of “bottom simulating reflectors” in the northern Gulf of Mexico. Mar. Pet. Geol. 2012, 34, 31–40. [Google Scholar] [CrossRef]
- Matsumoto, R.; Ryu, B.-J.; Lee, S.-R.; Lin, S.; Wu, S.; Sain, K.; Pecher, I.; Riedel, M. Occurrence and exploration of gas hydrate in the marginal seas and continental margin of the Asia and Oceania region. Mar. Pet. Geol. 2011, 28, 1751–1767. [Google Scholar] [CrossRef]
- Hillman, J.; Cook, A.E.; Sawyer, D.E.; Küçük, H.M.; Goldberg, D.S. The character and amplitude of ‘discontinuous’ bottom-simulating reflections in marine seismic data. Earth Planet. Sci. Lett. 2017, 459, 157–169. [Google Scholar] [CrossRef] [Green Version]
- Kroeger, K.; Crutchley, G.; Hill, M.; Pecher, I. Potential for gas hydrate formation at the northwest New Zealand shelf margin-New insights from seismic reflection data and petroleum systems modelling. Mar. Pet. Geol. 2017, 83, 215–230. [Google Scholar] [CrossRef]
- Paganoni, M.; Cartwright, J.A.; Foschi, M.; Shipp, R.C.; Van Rensbergen, P. Structure II gas hydrates found below the bottom-simulating reflector. Geophys. Res. Lett. 2016, 43, 5696–5706. [Google Scholar] [CrossRef] [Green Version]
- Vadakkepuliyambatta, S.; Chand, S.; Bünz, S. The history and future trends of ocean warming-induced gas hydrate dissociation in the SW Barents Sea. Geophys. Res. Lett. 2017, 44, 835–844. [Google Scholar] [CrossRef]
- Wood, W.T.; Hart, P.E.; Hutchinson, D.R.; Dutta, N.; Snyder, F.; Coffin, R.B.; Gettrust, J.F. Gas and gas hydrate distribution around seafloor seeps in Mississippi Canyon, Northern Gulf of Mexico, using multi-resolution seismic imagery. Mar. Pet. Geol. 2008, 25, 952–959. [Google Scholar] [CrossRef]
- Crutchley, G.J.; Mountjoy, J.J.; Hillman, J.I.T.; Turco, F.; Watson, S.; Flemings, P.B.; Davy, B.; Woelz, S.; Gorman, A.R.; Bialas, J. Upward-Doming Zones of Gas Hydrate and Free Gas at the Bases of Gas Chimneys, New Zealand’s Hikurangi Margin. J. Geophys. Res. Solid Earth 2021, 126. [Google Scholar] [CrossRef]
- Alajmi, M.S.; Qadrouh, A.N.; Alotaibi, A.M. High-fold enhancement of a seismic image and detection of the low-frequency shadow below the bottom-simulating reflector. Arab. J. Geosci. 2020, 13, 1–20. [Google Scholar] [CrossRef]
- Chapman, N.R.; Gettrust, J.F.; Walia, R.; Hannay, D.; Spence, G.D.; Wood, W.T.; Hyndman, R.D. High-resolution, deep-towed, multichannel seismic survey of deep-sea gas hydrates off western Canada. Geophysics 2002, 67, 1038–1047. [Google Scholar] [CrossRef]
- Chenin, J.; Bedle, H. Multi-attribute machine learning analysis for weak BSR detection in the Pegasus Basin, Offshore New Zealand. Mar. Geophys. Res. 2020, 41, 1–20. [Google Scholar] [CrossRef]
- Lee, J.; Byun, J.; Kim, B.; Yoo, D.-G. Delineation of gas hydrate reservoirs in the Ulleung Basin using unsupervised multi-attribute clustering without well log data. J. Nat. Gas Sci. Eng. 2017, 46, 326–337. [Google Scholar] [CrossRef]
- Bedle, H. Seismic attribute enhancement of weak and discontinuous gas hydrate bottom-simulating reflectors in the Pegasus Basin, New Zealand. Interpretation 2019, 7, SG11–SG22. [Google Scholar] [CrossRef]
- Dvorkin, J.; Gutierrez, M.A.; Grana, D. Seismic Reflections of Rock Properties; Cambridge University Press: Cambridge, UK, 2014. [Google Scholar]
- Ghiassian, H.; Grozic, J.L. Strength behavior of methane hydrate bearing sand in undrained triaxial testing. Mar. Pet. Geol. 2013, 43, 310–319. [Google Scholar] [CrossRef]
- Hyodo, M.; Yoneda, J.; Yoshimoto, N.; Nakata, Y. Mechanical and dissociation properties of methane hydrate-bearing sand in deep seabed. Soils Found. 2013, 53, 299–314. [Google Scholar] [CrossRef] [Green Version]
- Madhusudhan, B.N.; Clayton, C.R.I.; Priest, J.A. The Effects of Hydrate on the Strength and Stiffness of Some Sands. J. Geophys. Res. Solid Earth 2019, 124, 65–75. [Google Scholar] [CrossRef]
- Best, A.I.; Priest, J.; Clayton, C.R.I.; Rees, E.V. The effect of methane hydrate morphology and water saturation on seismic wave attenuation in sand under shallow sub-seafloor conditions. Earth Planet. Sci. Lett. 2013, 368, 78–87. [Google Scholar] [CrossRef] [Green Version]
- Klimentos, T. Attenuation of P- and S-waves as a method of distinguishing gas and condensate from oil and water. Geophysics 1995, 60, 447–458. [Google Scholar] [CrossRef]
- Li, F.; Verma, S.; Zhou, H.; Zhao, T.; Marfurt, K.J. Seismic attenuation attributes with applications on conventional and unconventional reservoirs. Interpretation 2016, 4, SB63–SB77. [Google Scholar] [CrossRef] [Green Version]
- Bellefleur, G.; Riedel, M.; Brent, T.; Wright, F.; Dallimore, S.R. Implication of seismic attenuation for gas hydrate resource characterization, Mallik, Mackenzie Delta, Canada. J. Geophys. Res. Space Phys. 2007, 112, 10311. [Google Scholar] [CrossRef] [Green Version]
- Priest, J.A.; Best, A.I.; Clayton, C.R.I. Attenuation of seismic waves in methane gas hydrate-bearing sand. Geophys. J. Int. 2006, 164, 149–159. [Google Scholar] [CrossRef] [Green Version]
- Bland, K.J.; I Uruski, C.; Isaac, M.J. Pegasus Basin, eastern New Zealand: A stratigraphic record of subsidence and subduction, ancient and modern. N. Z. J. Geol. Geophys. 2015, 58, 319–343. [Google Scholar] [CrossRef]
- Collier, T. The Geology of Pegasus Basin Based on Outcrop Correlatives in Southern Wairarapa and Northeastern Marl-Borough, New Zealand. Master’s Thesis, Victoria University of Wellington, Auckland, New Zealand, 2015. Available online: http://hdl.handle.net/10063/4831 (accessed on 1 September 2020).
- King, S.E. The Tectonic Evolution of Pegasus Basin and the Hikurangi Trench, offshore New Zealand. Master’s Thesis, Colorado School of Mines, Golden, CO, USA, 2017. [Google Scholar]
- Katz, H.-R. Probable gas hydrate in continental slope east of the north island, New Zealand. J. Pet. Geol. 1981, 3, 315–324. [Google Scholar] [CrossRef]
- Faure, K.; Greinert, J.; von Deimling, J.S.; McGinnis, D.F.; Kipfer, R.; Linke, P. Methane seepage along the Hikurangi Margin of New Zealand: Geochemical and physical data from the water column, sea surface and atmosphere. Mar. Geol. 2010, 272, 170–188. [Google Scholar] [CrossRef]
- Jaillard, S.; Akloul, L.; Beaumont, M.; Hamdi-Roze, H.; Dubourg, C.; Odent, S.; Duros, S.; Dejucq-Rainsford, N.; Belaud-Rotureau, M.A.; Ravel, C. Array-CGH diagnosis in ovarian failure: Identification of new molecular actors for ovarian physiology. J. Ovarian Res. 2016, 9, 63. [Google Scholar] [CrossRef] [PubMed] [Green Version]
- Plaza-Faverola, A.; Klaeschen, D.; Barnes, P.; Pecher, I.; Henrys, S.; Mountjoy, J. Evolution of fluid expulsion and concentrated hydrate zones across the southern Hikurangi subduction margin, New Zealand: An analysis from depth migrated seismic data. Geochem. Geophys. Geosyst. 2012, 13. [Google Scholar] [CrossRef] [Green Version]
- Koch, S.; Schroeder, H.; Haeckel, M.; Berndt, C.; Bialas, J.; Papenberg, C.; Klaeschen, D.; Plaza-Faverola, A. Gas migration through Opouawe Bank at the Hikurangi margin offshore New Zealand. Geo-Mar. Lett. 2016, 36, 187–196. [Google Scholar] [CrossRef]
- Clairmont, R.; Bedle, H. Seismic attribute identification through waveform analysis of gas hydrates in the Pegasus Basin, offsore New Zealand. In Seg Technical Program Expanded Abstracts 2019; Society of Exploration Geophysicists: Houston, TX, USA, 2019; pp. 2064–2068. [Google Scholar]
- Wang, Y.; Morozov, I.B. A simple approach to nonstationary source waveform estimation in seismic records. Geophysics 2020, 85, V257–V268. [Google Scholar] [CrossRef]
- Wang, Y.; Morozov, I.; Marfurt, K. Non-stationary source waveform and Q estimation by sparse-pulse decomposition of seismic images. In SEG Technical Program Expanded Abstracts 2020; Society of Exploration Geophysicists: Virtual, 2020; pp. 2789–2793. [Google Scholar]
- Taylor, M.; Dillon, W.; Pecher, I. Trapping and migration of methane associated with the gas hydrate stability zone at the Blake Ridge Diapir: New insights from seismic data. Mar. Geol. 2000, 164, 79–89. [Google Scholar] [CrossRef]
- Kim, K.J.; Yi, B.Y.; Kang, N.K.; Yoo, D.G. Seismic Attribute Analysis of the Indicator for Gas Hydrate Occurrence in the Northwest Ulleung Basin, East Sea. Energy Procedia 2015, 76, 463–469. [Google Scholar] [CrossRef] [Green Version]
- Kumar, J.; Sain, K.; Arun, K.P. Seismic attributes for characterizing gas hydrates: A study from the Mahanadi offshore, India. Mar. Geophys. Res. 2018, 40, 73–86. [Google Scholar] [CrossRef]
- Riedel, M.; Collett, T.; Kumar, P.; Sathe, A.; Cook, A. Seismic imaging of a fractured gas hydrate system in the Krishna–Godavari Basin offshore India. Mar. Pet. Geol. 2010, 27, 1476–1493. [Google Scholar] [CrossRef]
- Satyavani, N.; Sain, K.; Lall, M.; Kumar, B.J.P. Seismic attribute study for gas hydrates in the Andaman Offshore India. Mar. Geophys. Res. 2008, 29, 167–175. [Google Scholar] [CrossRef]
- Radovich, B.J.; Oliveros, R.B. 3-D sequence interpretation of seismic instantaneous attributes from the Gorgon Field. Geophysics 1998, 17, 1286–1293. [Google Scholar] [CrossRef]
- Hart, B. Stratigraphically significant attributes. Geophysics 2008, 27, 320–324. [Google Scholar] [CrossRef]
- Li, Q.; Yu, S.; Wu, W.; Tong, L.; Kang, H. Detection of a deep-water channel in 3D seismic data using the sweetness attribute and seismic geomorphology: A case study from the Taranaki Basin, New Zealand. N. Z. J. Geol. Geophys. 2017, 60, 199–208. [Google Scholar] [CrossRef]
- Reilly, P.; Clairmont, R.; Bedle, H. Are bright spots always hydrocarbons? A case study in the Taranaki Basin, New Zealand. Interpretation 2020, 8, SR45–SR51. [Google Scholar] [CrossRef]
- Azeem, T.; Yanchun, W.; Khalid, P.; Xueqing, L.; Yuan, F.; Lifang, C. An application of seismic attributes analysis for mapping of gas bearing sand zones in the sawan gas field, Pakistan. Acta Geod. Geophys. 2016, 51, 723–744. [Google Scholar] [CrossRef]
- Morlet, J.; Arens, G.; Fourgeau, E.; Glard, D. Wave propagation and sampling theory—Part I: Complex signal and scattering in multilayered media. Geophysics 1982, 47, 203–221. [Google Scholar] [CrossRef] [Green Version]
- Goupillaud, P.; Grossmann, A.; Morlet, J. Cycle-octave and related transforms in seismic signal analysis. Geoexploration 1984, 23, 85–102. [Google Scholar] [CrossRef]
- Liu, J.; Marfurt, K.J. Instantaneous spectral attributes to detect channels. Geophysics 2007, 72, P23–P31. [Google Scholar] [CrossRef]
- Wigner, E. On the Quantum Correction for Thermodynamic Equilibrium. Phys. Rev. 1932, 40, 749–759. [Google Scholar] [CrossRef]
- Auger, F.; Flandrin, P.; Gonçalvès, P.; Lemoine, O. Time-Frequency Toolbox, CNRS, France; Rice University: Houston, TX, USA, 1996. [Google Scholar]
- Chakraborty, A.; Okaya, D. Frequency-time decomposition of seismic data using wavelet-based methods. Geophysics 1995, 60, 1906–1916. [Google Scholar] [CrossRef] [Green Version]
- Chopra, S.; Castagna, J.P. AVO, Investigations in Geophysics No. 16; Society of Exploration Geophysicists: Tulsa, OK, USA, 2014. [Google Scholar]
- Taner, M.T.; Koehler, F.; Sheriff, R.E. Complex seismic trace analysis. Geophysics 1979, 44, 1041–1063. [Google Scholar] [CrossRef]
- Castagna, J.P.; Sun, S.; Siegfried, R.W. Instantaneous spectral analysis: Detection of low-frequency shadows associated with hydrocarbons. Geophysics 2003, 22, 120–127. [Google Scholar] [CrossRef]
- Holbrook, W.S.; Hoskins, H.; Wood, W.T.; Stephen, R.A.; Lizarralde, D. Methane Hydrate and Free Gas on the Blake Ridge from Vertical Seismic Profiling. Science 1996, 273, 1840–1843. [Google Scholar] [CrossRef]
- Wu, S.; Wang, X.; Wong, H.K.; Zhang, G. Low-amplitude BSRs and gas hydrate concentration on the northern margin of the South China Sea. Mar. Geophys. Res. 2007, 28, 127–138. [Google Scholar] [CrossRef]
- Bai, H.; Pecher, I.; Adam, L.; Field, B. Possible link between weak bottom simulating reflections and gas hydrate systems in fractures and macropores of fine-grained sediments: Results from the Hikurangi Margin, New Zealand. Mar. Pet. Geol. 2016, 71, 225–237. [Google Scholar] [CrossRef]
- Crutchley, G.J.; Kroeger, K.F.; Pecher, I.A.; Gorman, A.R. How tectonic folding influences gas hydrate formation: New Zealand’s Hikurangi subduction margin. Geology 2018, 47, 39–42. [Google Scholar] [CrossRef]
- Dewangan, P.; Mandal, R.; Jaiswal, P.; Ramprasad, T.; Sriram, G. Estimation of seismic attenuation of gas hydrate bearing sediments from multi-channel seismic data: A case study from Krishna–Godavari offshore basin. Mar. Pet. Geol. 2014, 58, 356–367. [Google Scholar] [CrossRef]
- Guerin, G.; Goldberg, D.; Meltser, A. Characterization of in situ elastic properties of gas hydrate-bearing sediments on the Blake Ridge. J. Geophys. Res. Space Phys. 1999, 104, 17781–17795. [Google Scholar] [CrossRef]
- Guerin, G.; Goldberg, D. Sonic waveform attenuation in gas hydrate-bearing sediments from the Mallik 2L-38 research well, Mackenzie Delta, Canada. J. Geophys. Res. Space Phys. 2002, 107, EPM-1. [Google Scholar] [CrossRef]
- Dvorkin, J.; Uden, R. Seismic wave attenuation in a methane hydrate reservoir. Lead. Edge 2004, 23, 730–732. [Google Scholar] [CrossRef]
- Sain, K.; Singh, A.K.; Thakur, N.K.; Khanna, R. Seismic quality factor observations for gas-hydrate-bearing sediments on the western margin of India. Mar. Geophys. Res. 2009, 30, 137–145. [Google Scholar] [CrossRef]
- Matsushima, J. Seismic wave attenuation in methane hydrate-bearing sediments: Vertical seismic profiling data from the Nankai Trough exploratory well, offshore Tokai, central Japan. J. Geophys. Res. Space Phys. 2006, 111, 111. [Google Scholar] [CrossRef]
Figure 1.
Topographic map of New Zealand the PEG09 and APB13 surveys within the Pegasus Basin and the known structural features that surround the basin, including the Chatham Rise and the Hikurangi Trough. The cross-sections used in this study are highlighted in red (PEGO9-19), green (APB13-40), and cyan (APB13-42). (Base map Courtesy GeoMapApp).

Figure 2.
(a) Cross-sectional profile of the PEG09 Line 19 (PEG09-19) showing major identified features such. (b) An interpretation of (a) identifying the GHSZ. Three types of BSRs based on observable amplitude strength were described in this study and are pointed at by the box-arrows. These include the following: (1) a strong continuous (SC) BSR in Region A, (2) weak discontinuous (WD) BSR in Region B, and (3) very-strong continuous BSRs in Region C. To further inspect the amplitude changes, traces 1150, 2900, and 4400 (dashed vertical lines) representing zones A, B, and C, respectively, are shown in the next figure (Figure 3).

Figure 3.
The seismic amplitude response of the GHSZ and free gas zone for representative traces extracted from the zones A, B, and C shown in the previous slide. Note that there is no anomalous response of the GHSZ. In contrast, the free gas zone gives rise to a strong amplitude response.
Figure 3.
The seismic amplitude response of the GHSZ and free gas zone for representative traces extracted from the zones A, B, and C shown in the previous slide. Note that there is no anomalous response of the GHSZ. In contrast, the free gas zone gives rise to a strong amplitude response.

Figure 4.
Seismic attributes used for the attribute analyses along PEG09-19: (a) amplitude and (b) instantaneous frequency. The three types of BSRs described are indicated by the block arrows. Note the low-frequency shadow zones (LFSZ) in (b) beneath the VSC-BSR and an anticline folded layer likely due to the potential accumulation of free gas.

Figure 5.
Seismic attributes used for the attribute analyses along PEG09-19: (a) envelope and (b) sweetness. The three types of BSRs described are indicated by the block arrows. Because the instantaneous frequency is in the denominator of the sweetness attribute, the shadow zone seen in Figure 5b is now illuminated.

Figure 6.
Time–frequency panels for seismic Trace 4400 along PEG09-09 using different Morlet wavelet bandwidths fb = (a) 0.26, (b) 0.52, and (c) 0.78. For this trace, the BSR occurs approximately at a two-way travel time of 4 s.
Figure 6.
Time–frequency panels for seismic Trace 4400 along PEG09-09 using different Morlet wavelet bandwidths fb = (a) 0.26, (b) 0.52, and (c) 0.78. For this trace, the BSR occurs approximately at a two-way travel time of 4 s.

Figure 7.
CWT spectral magnitude for the (a) 20 Hz, (b) 40 Hz, (c) 60 Hz, and (d) 80 Hz frequency components along line PEG09-19. The three types of BSRs described are pointed by the box arrows. Note the low-frequency shadow zones are better interpreted using higher-frequency components in addition to the stronger seismic amplitude BSRs that exhibit larger magnitudes.

Figure 8.
Seismic amplitude profiles of for the (a) PEG09-19 and (b) APB13-40 survey lines and the different regions consisting of the three types of BSRs described in this study. The two seismic surveys are compared for the direct attenuation measurement method to determine the transferability and performance of the method when using a higher-resolution dataset (e.g., APB13 survey). Additionally, the zoom-in of (c) Region A for the APB13-40 line shows an interpreted fault beneath location of the Frontal Anticline, compared to the PEG09-19 line, where the fault is not easily discernable.

Figure 9.
Seismic amplitude co-rendered with the seismic attenuation using the inverse quality factor Q−1 for the different types of BSRs describe in the study, for each of the lines along PEG09-19 and APB13-40. We interpret the regions of high attenuation to be due to the accumulation of free gas such as in the anticlinal features seen in (a,b) and beneath the VSC-BSR near Hikurangi Channel in (e,f). We observe an overall lack of attenuation directly beneath the WD-BSR observed in (c,d) with some strong attenuation farther down beneath the WD-BSR in (c).

Figure 10.
(a) Seismic amplitude and (b–d) seismic-amplitude co-rendered with the seismic attenuation along APB13-42 using the inverse quality factor Q−1 for the different types of BSRs described in the study. As in Figure 9, we attribute the high attenuation to free gas accumulation and distribution, especially beneath the (b) anticline folded layer and the (d) VSC-BSR near the Hikurangi Channel.


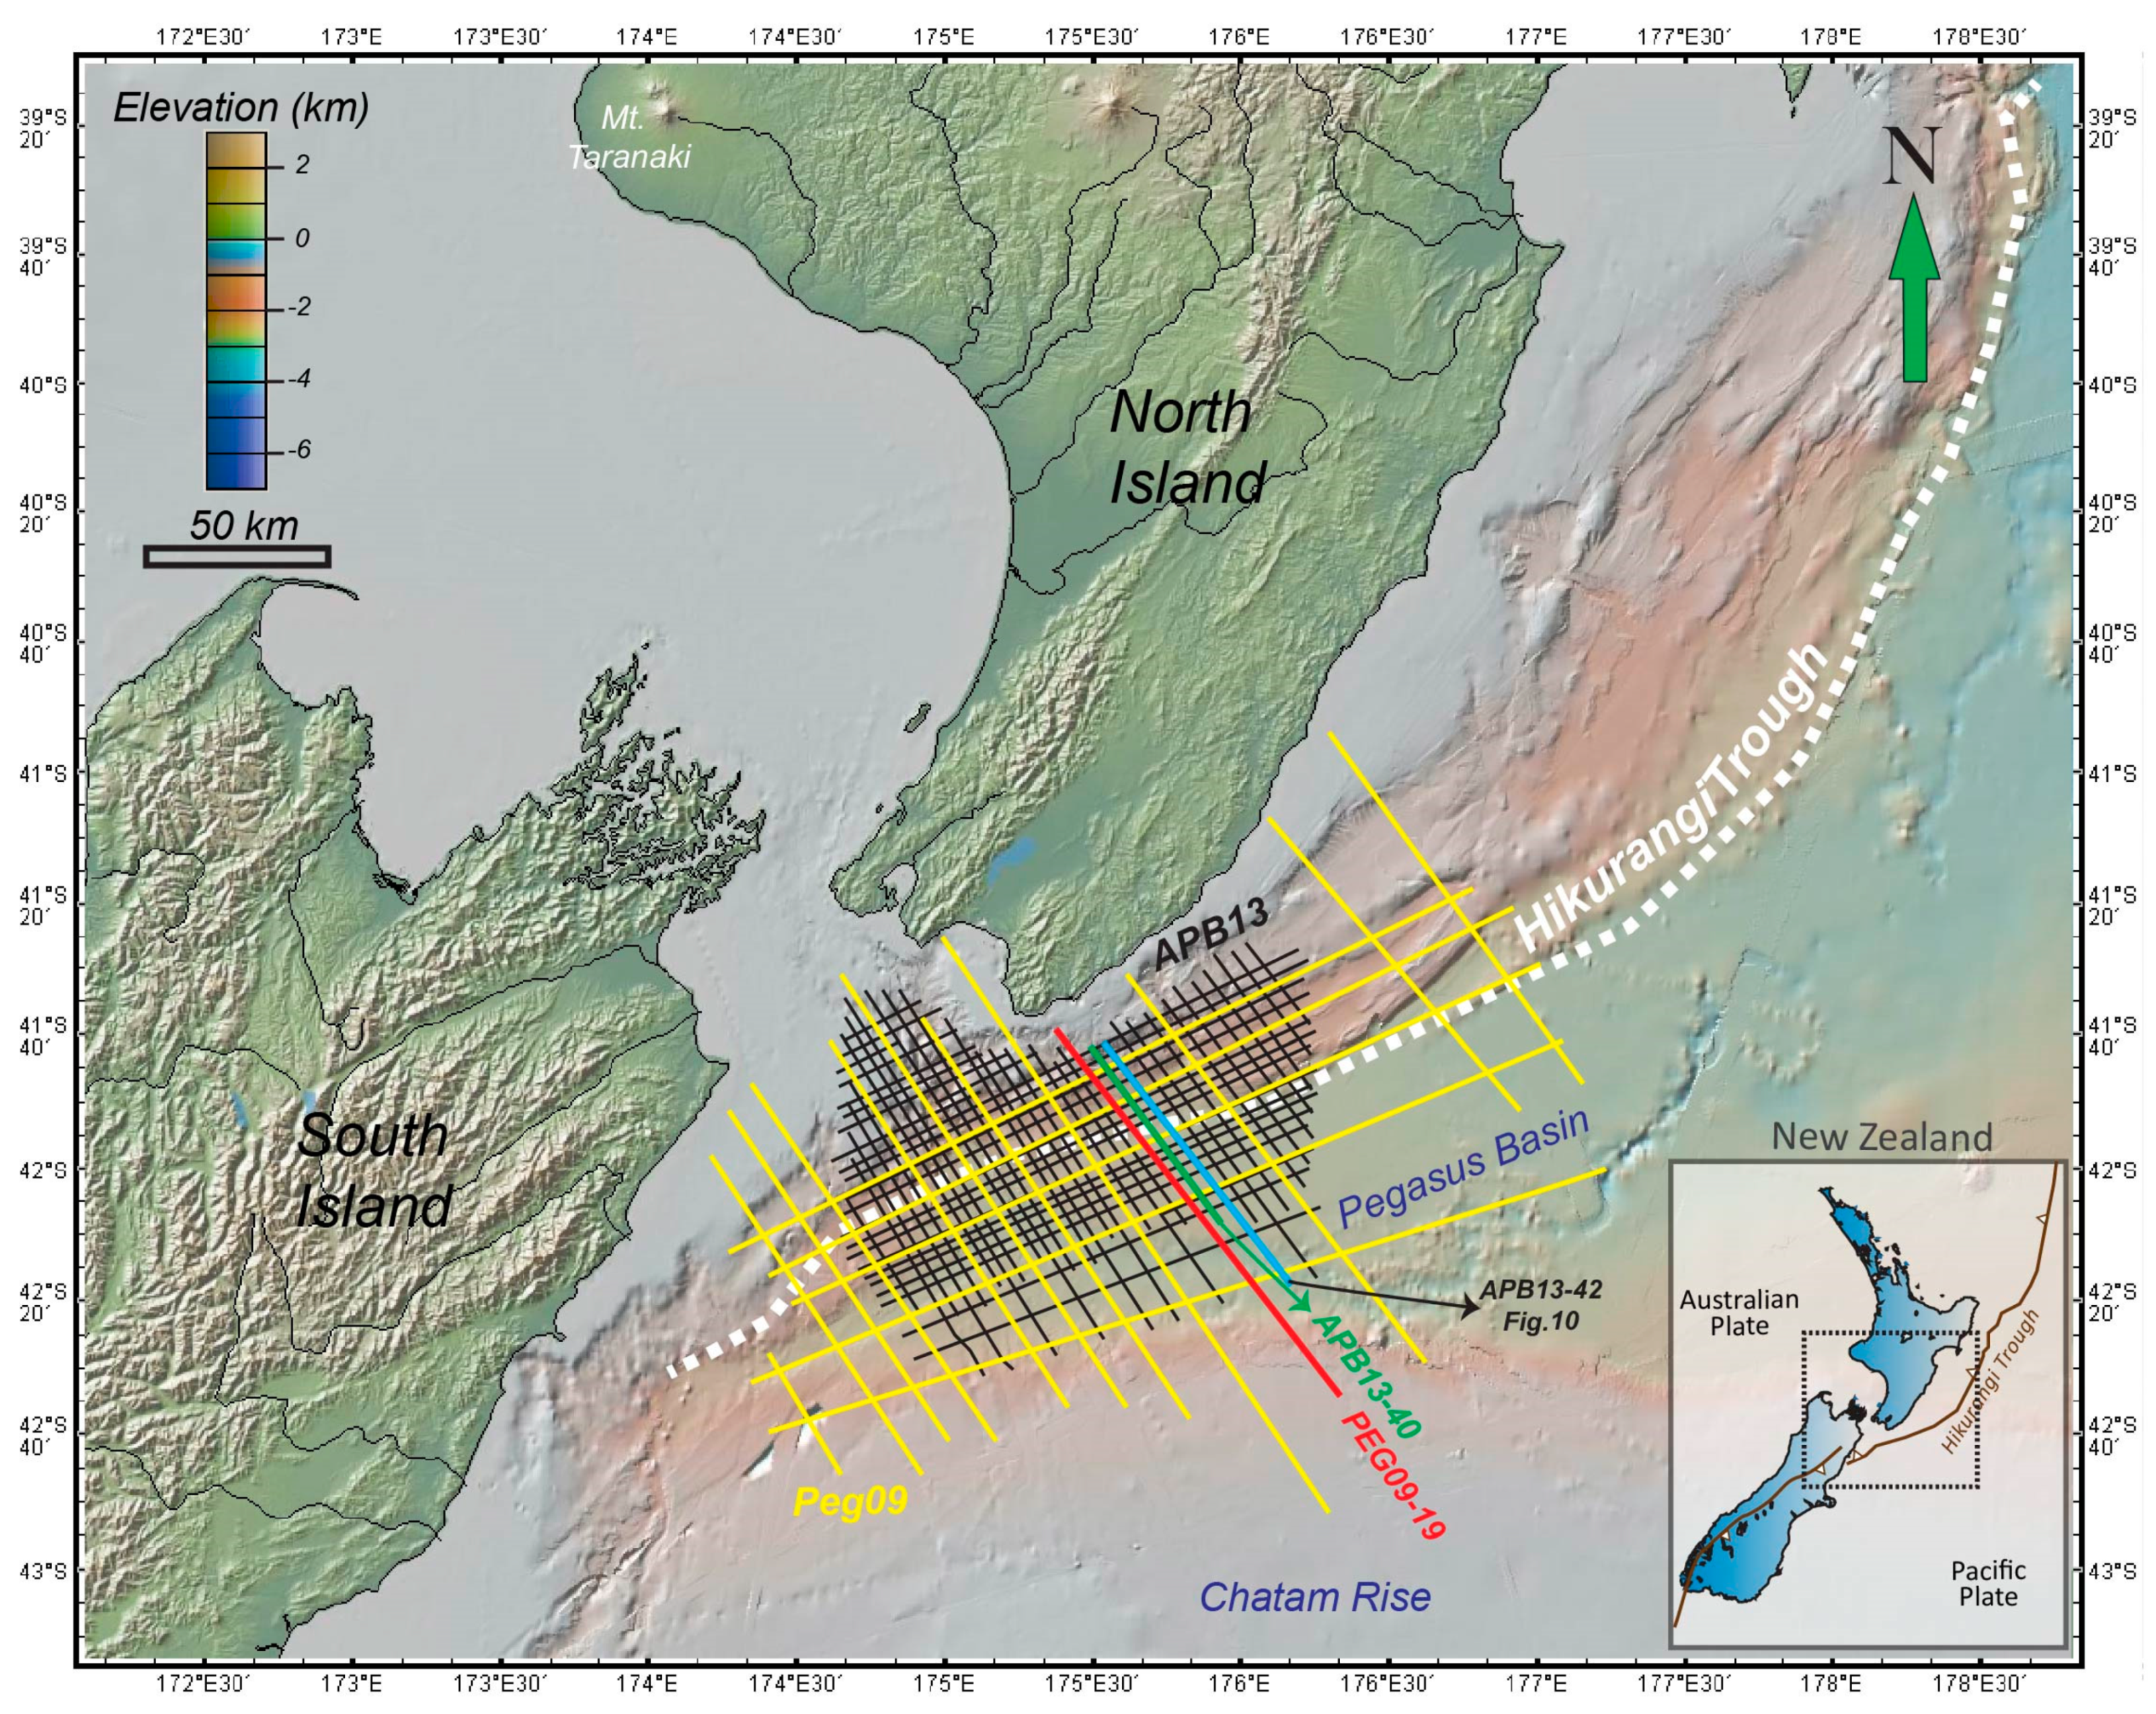
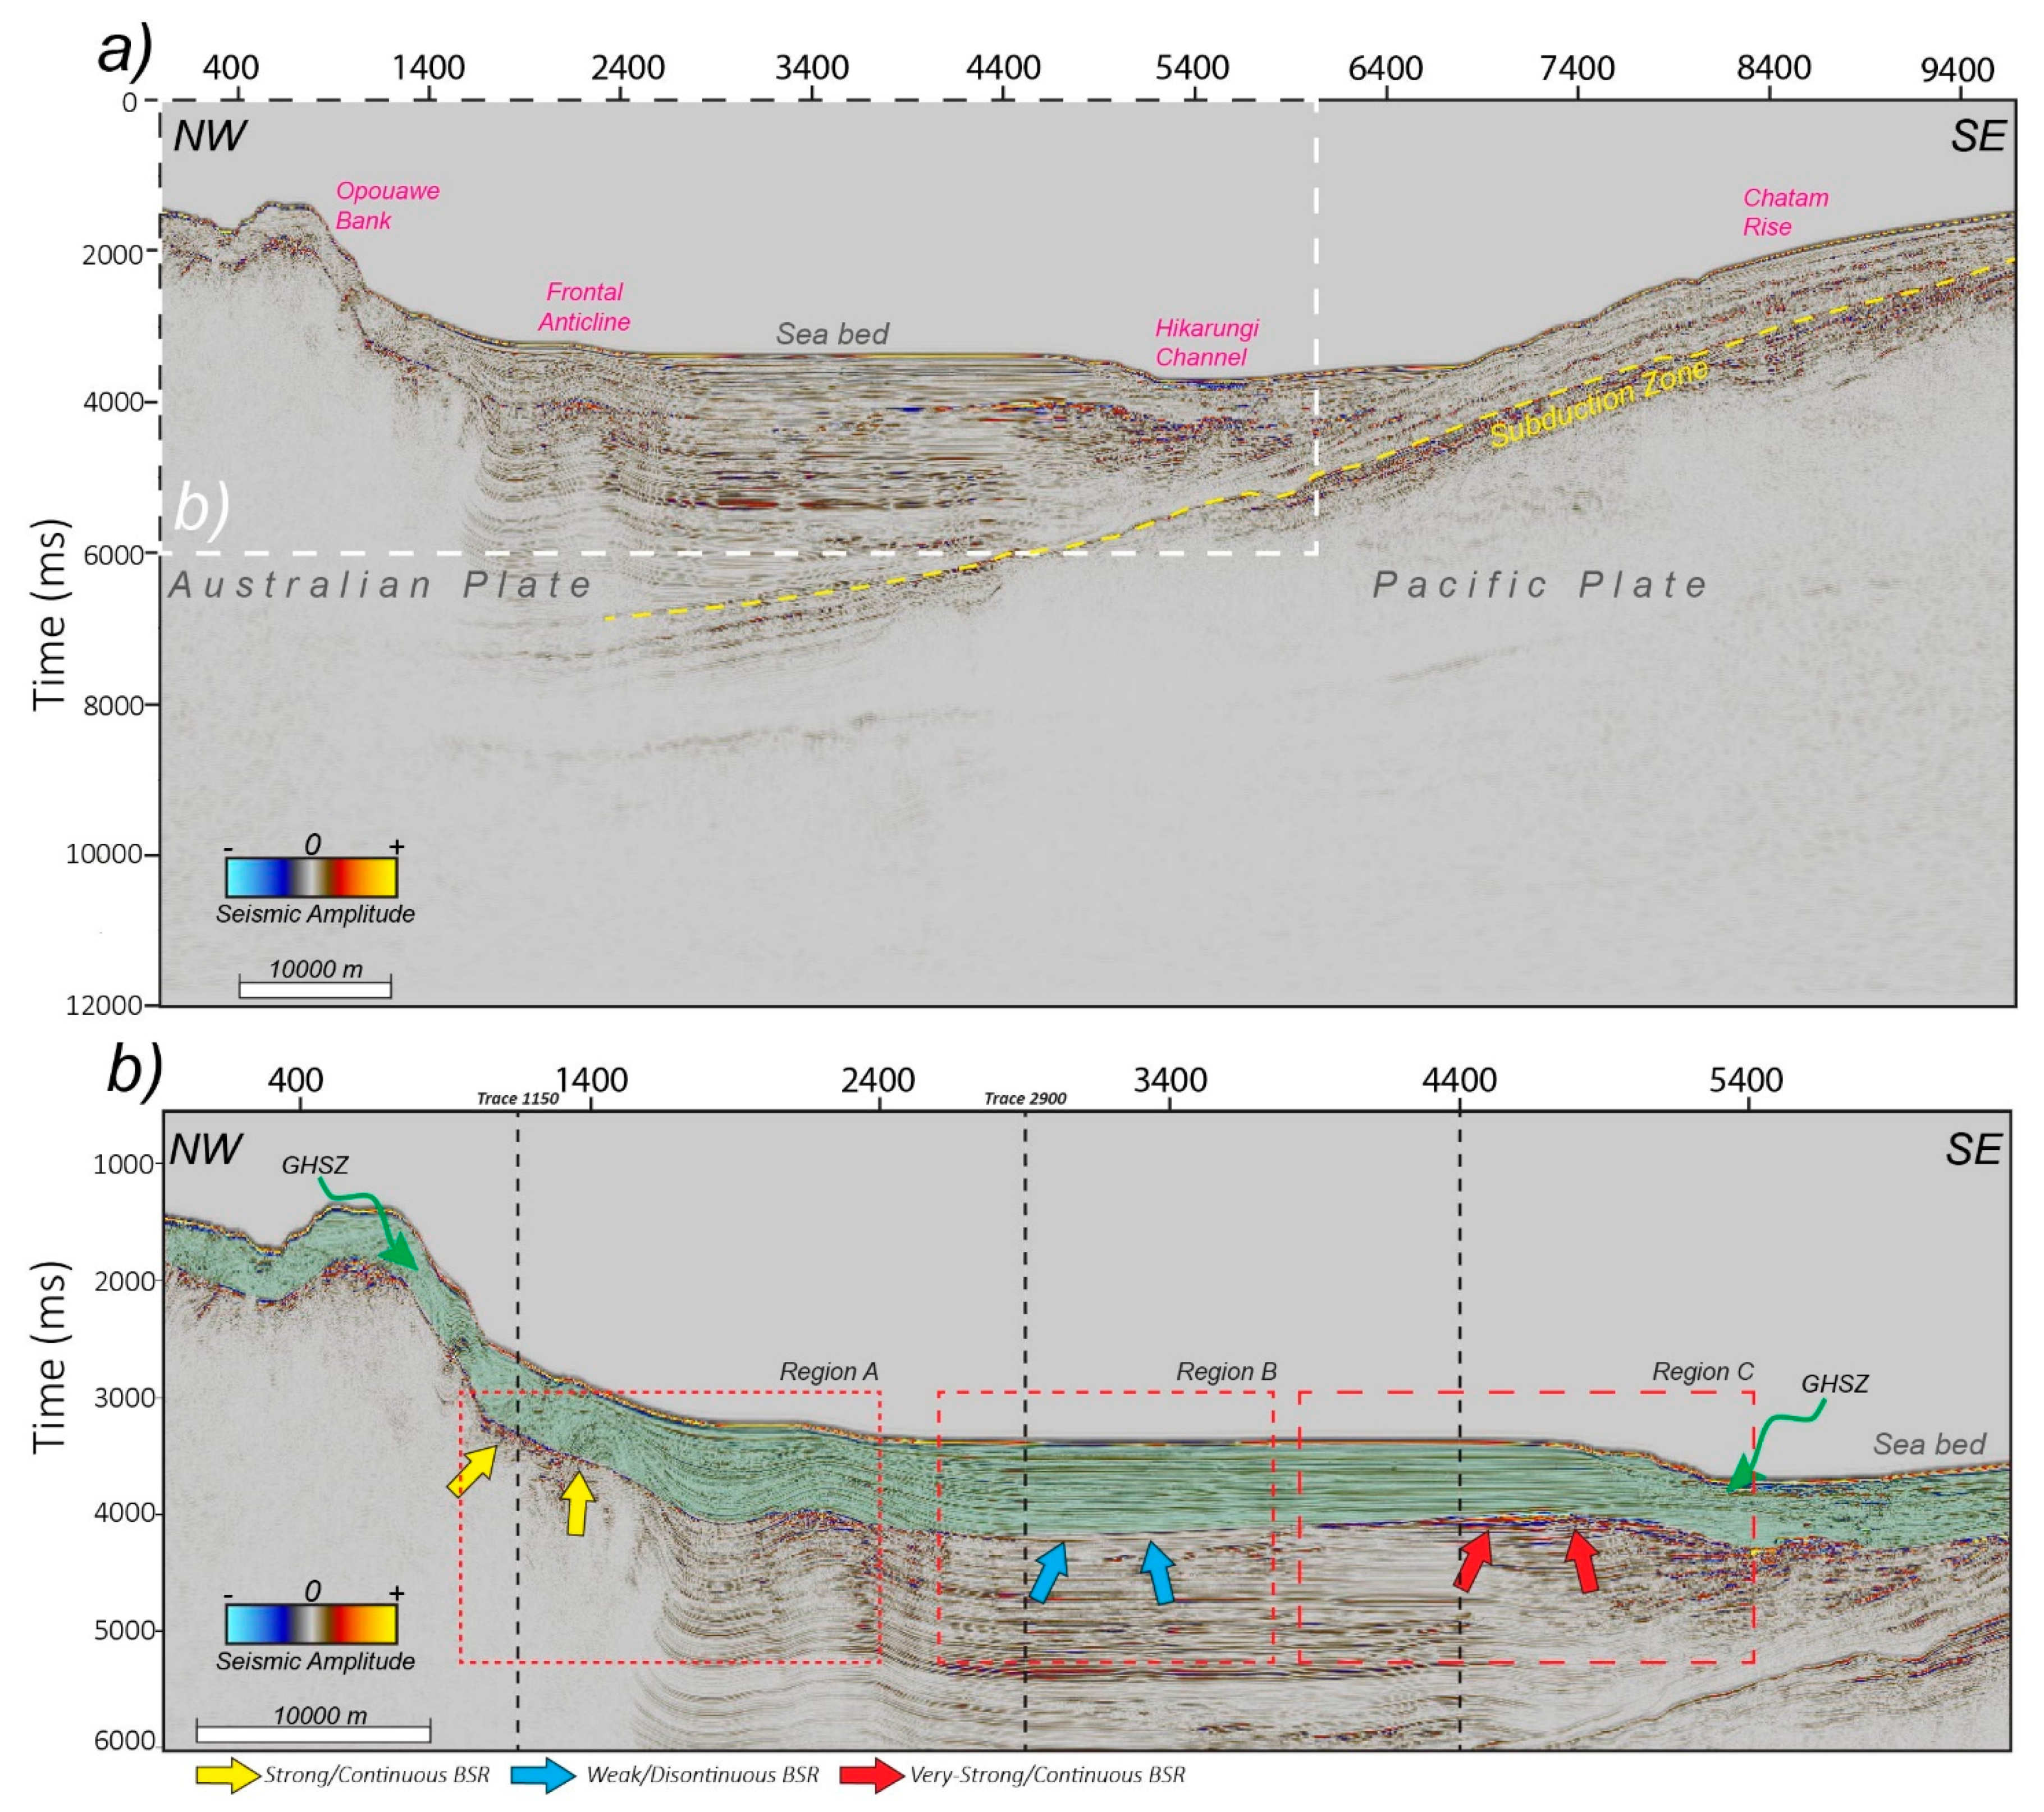
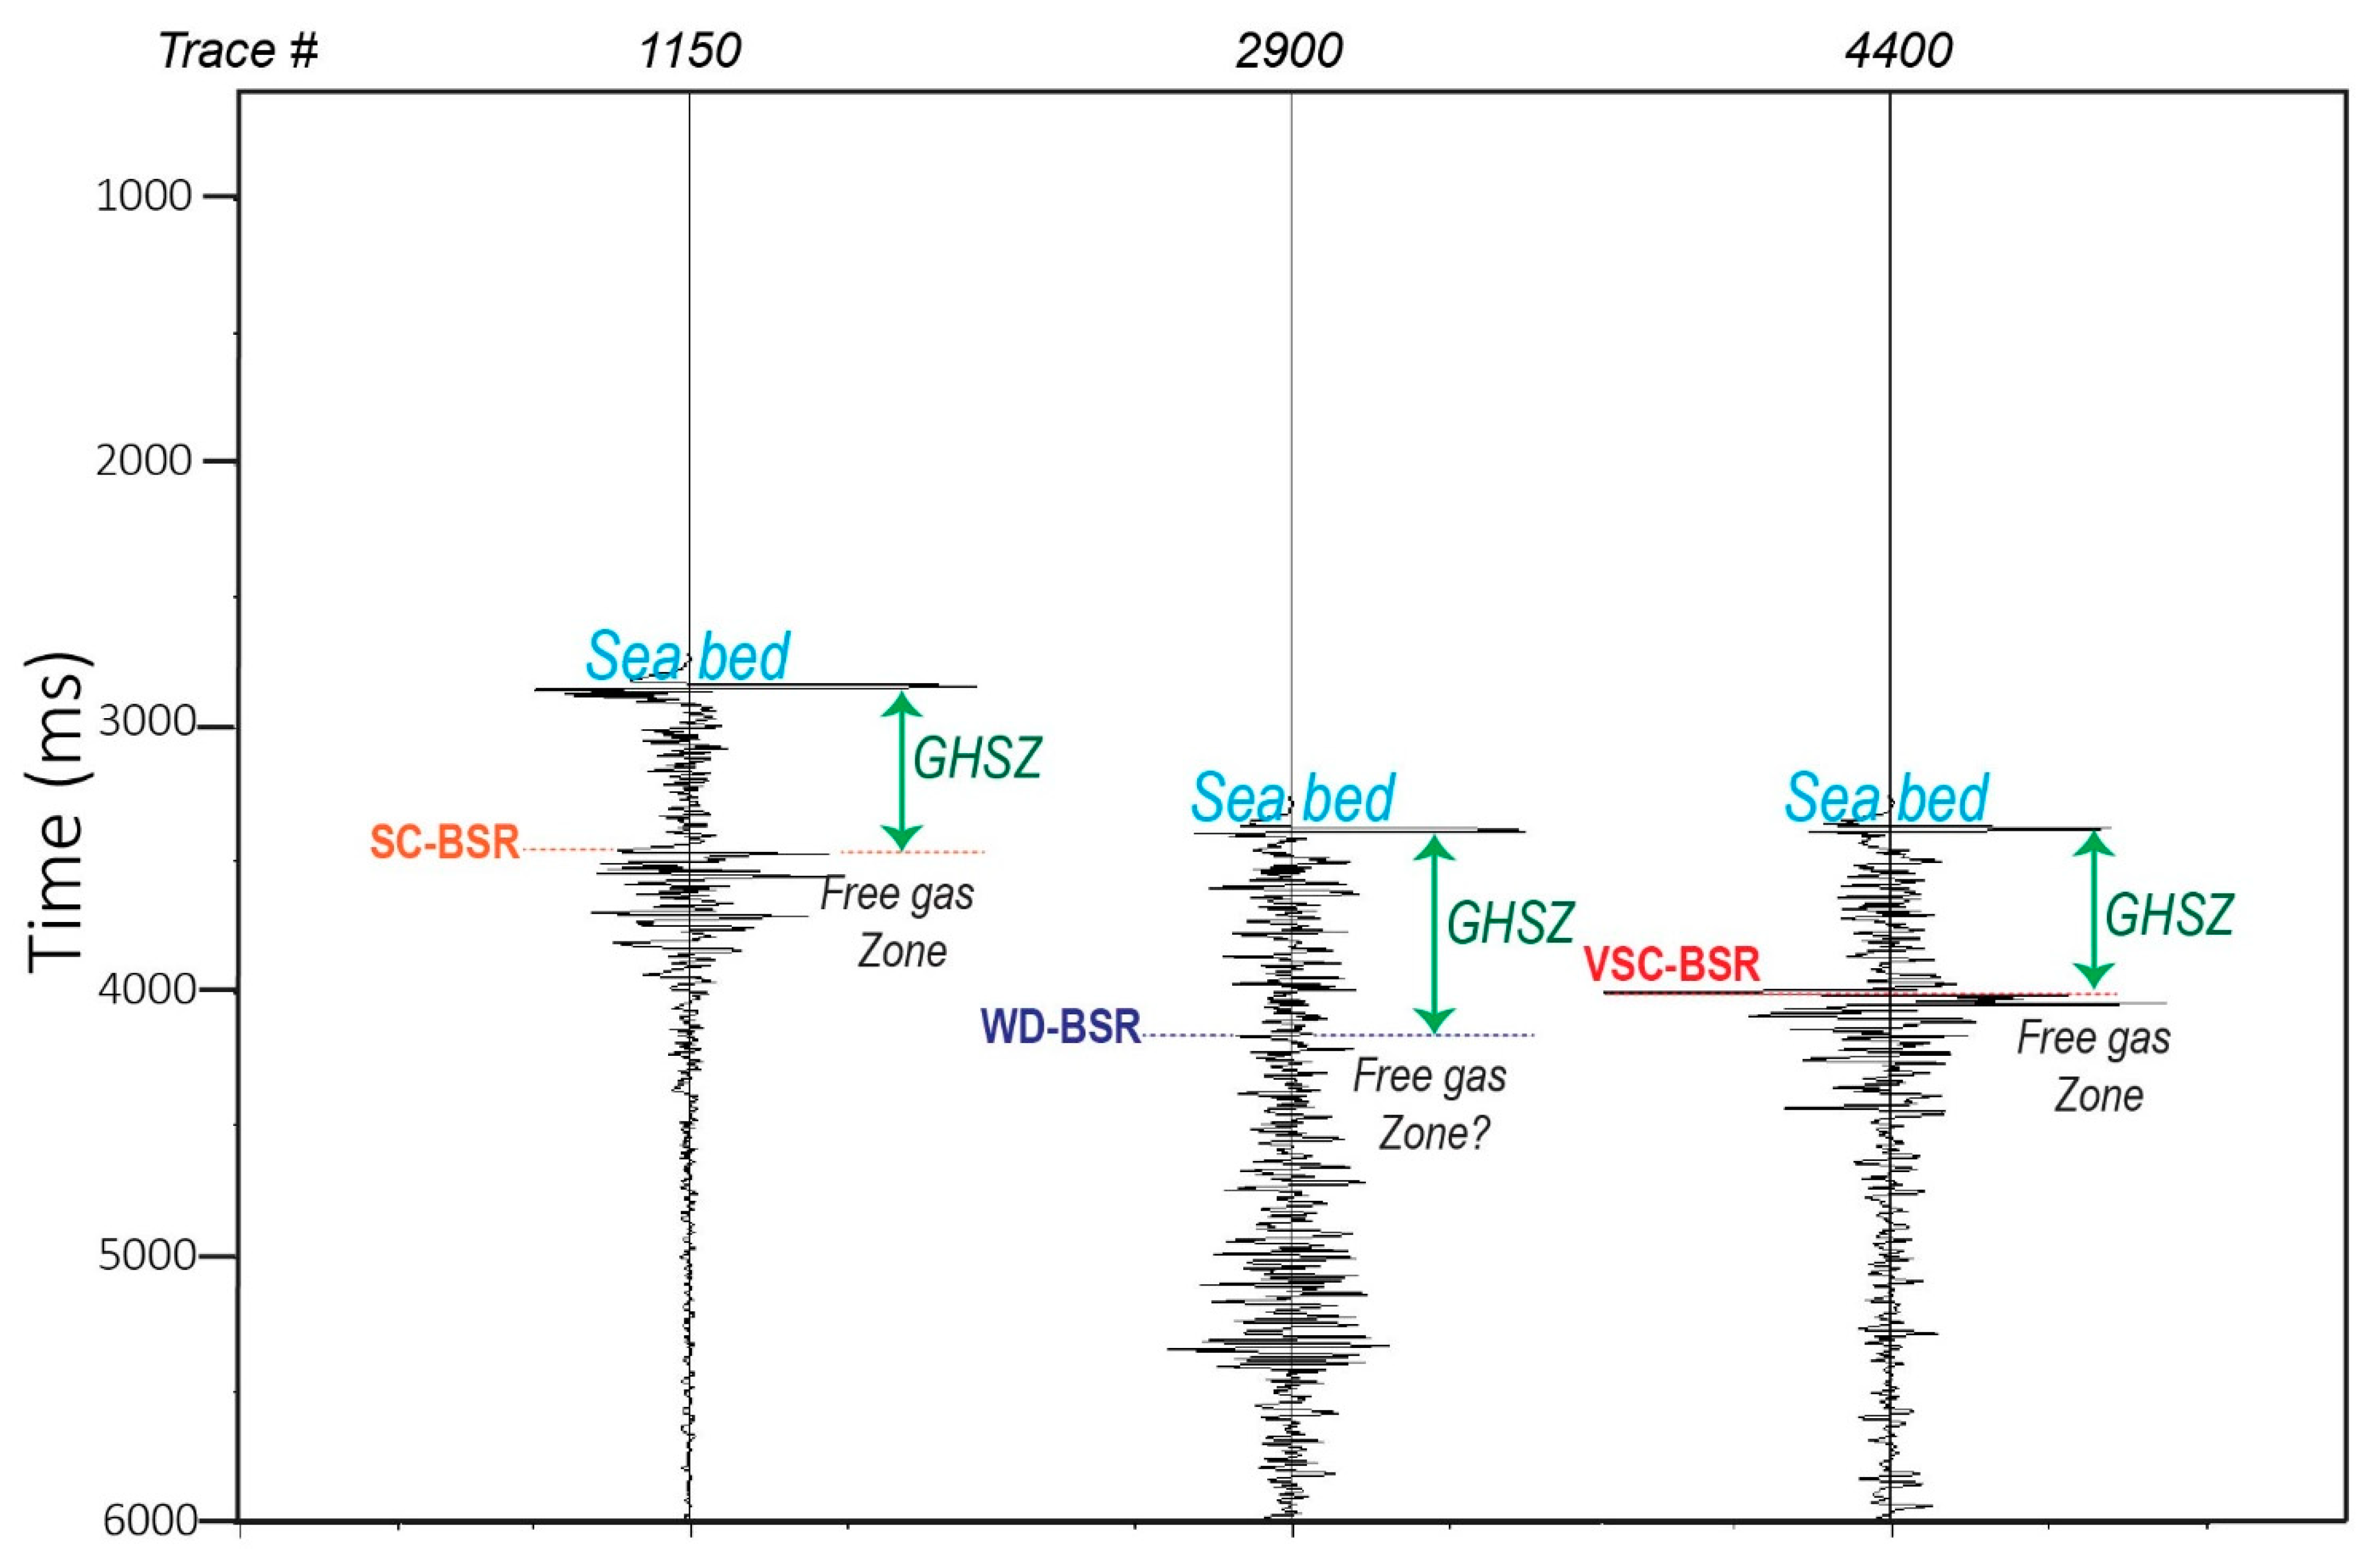
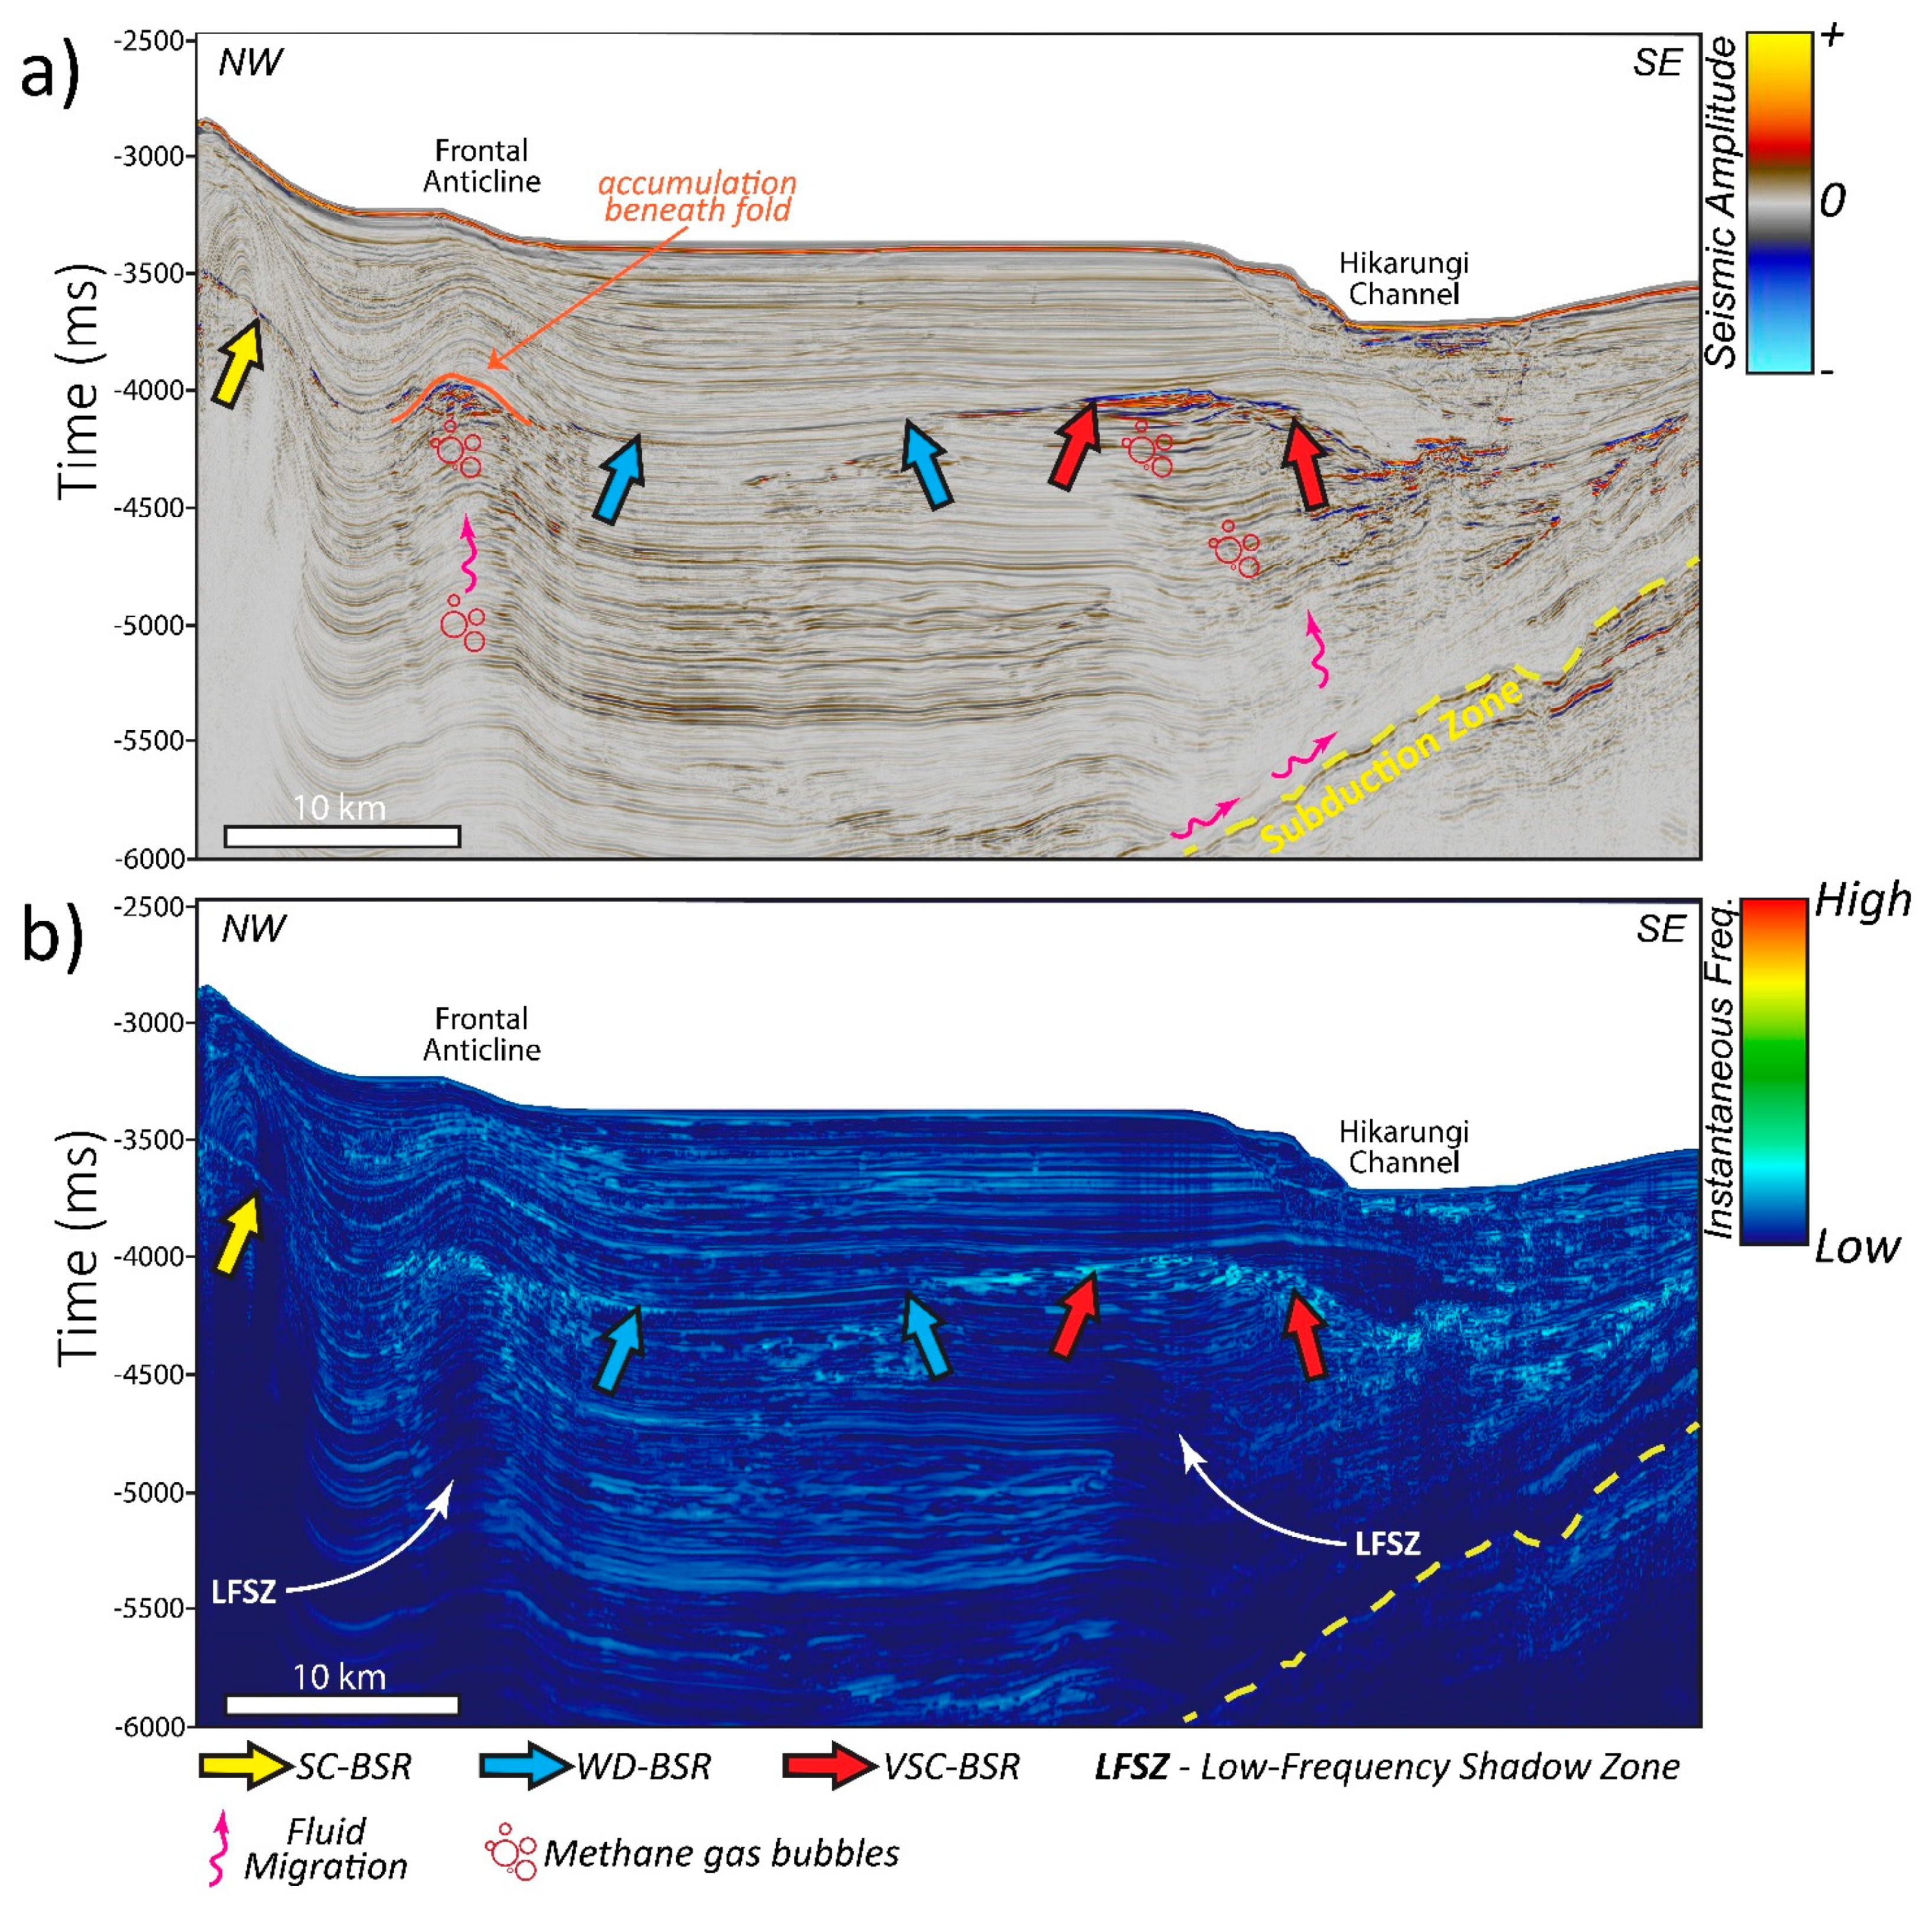
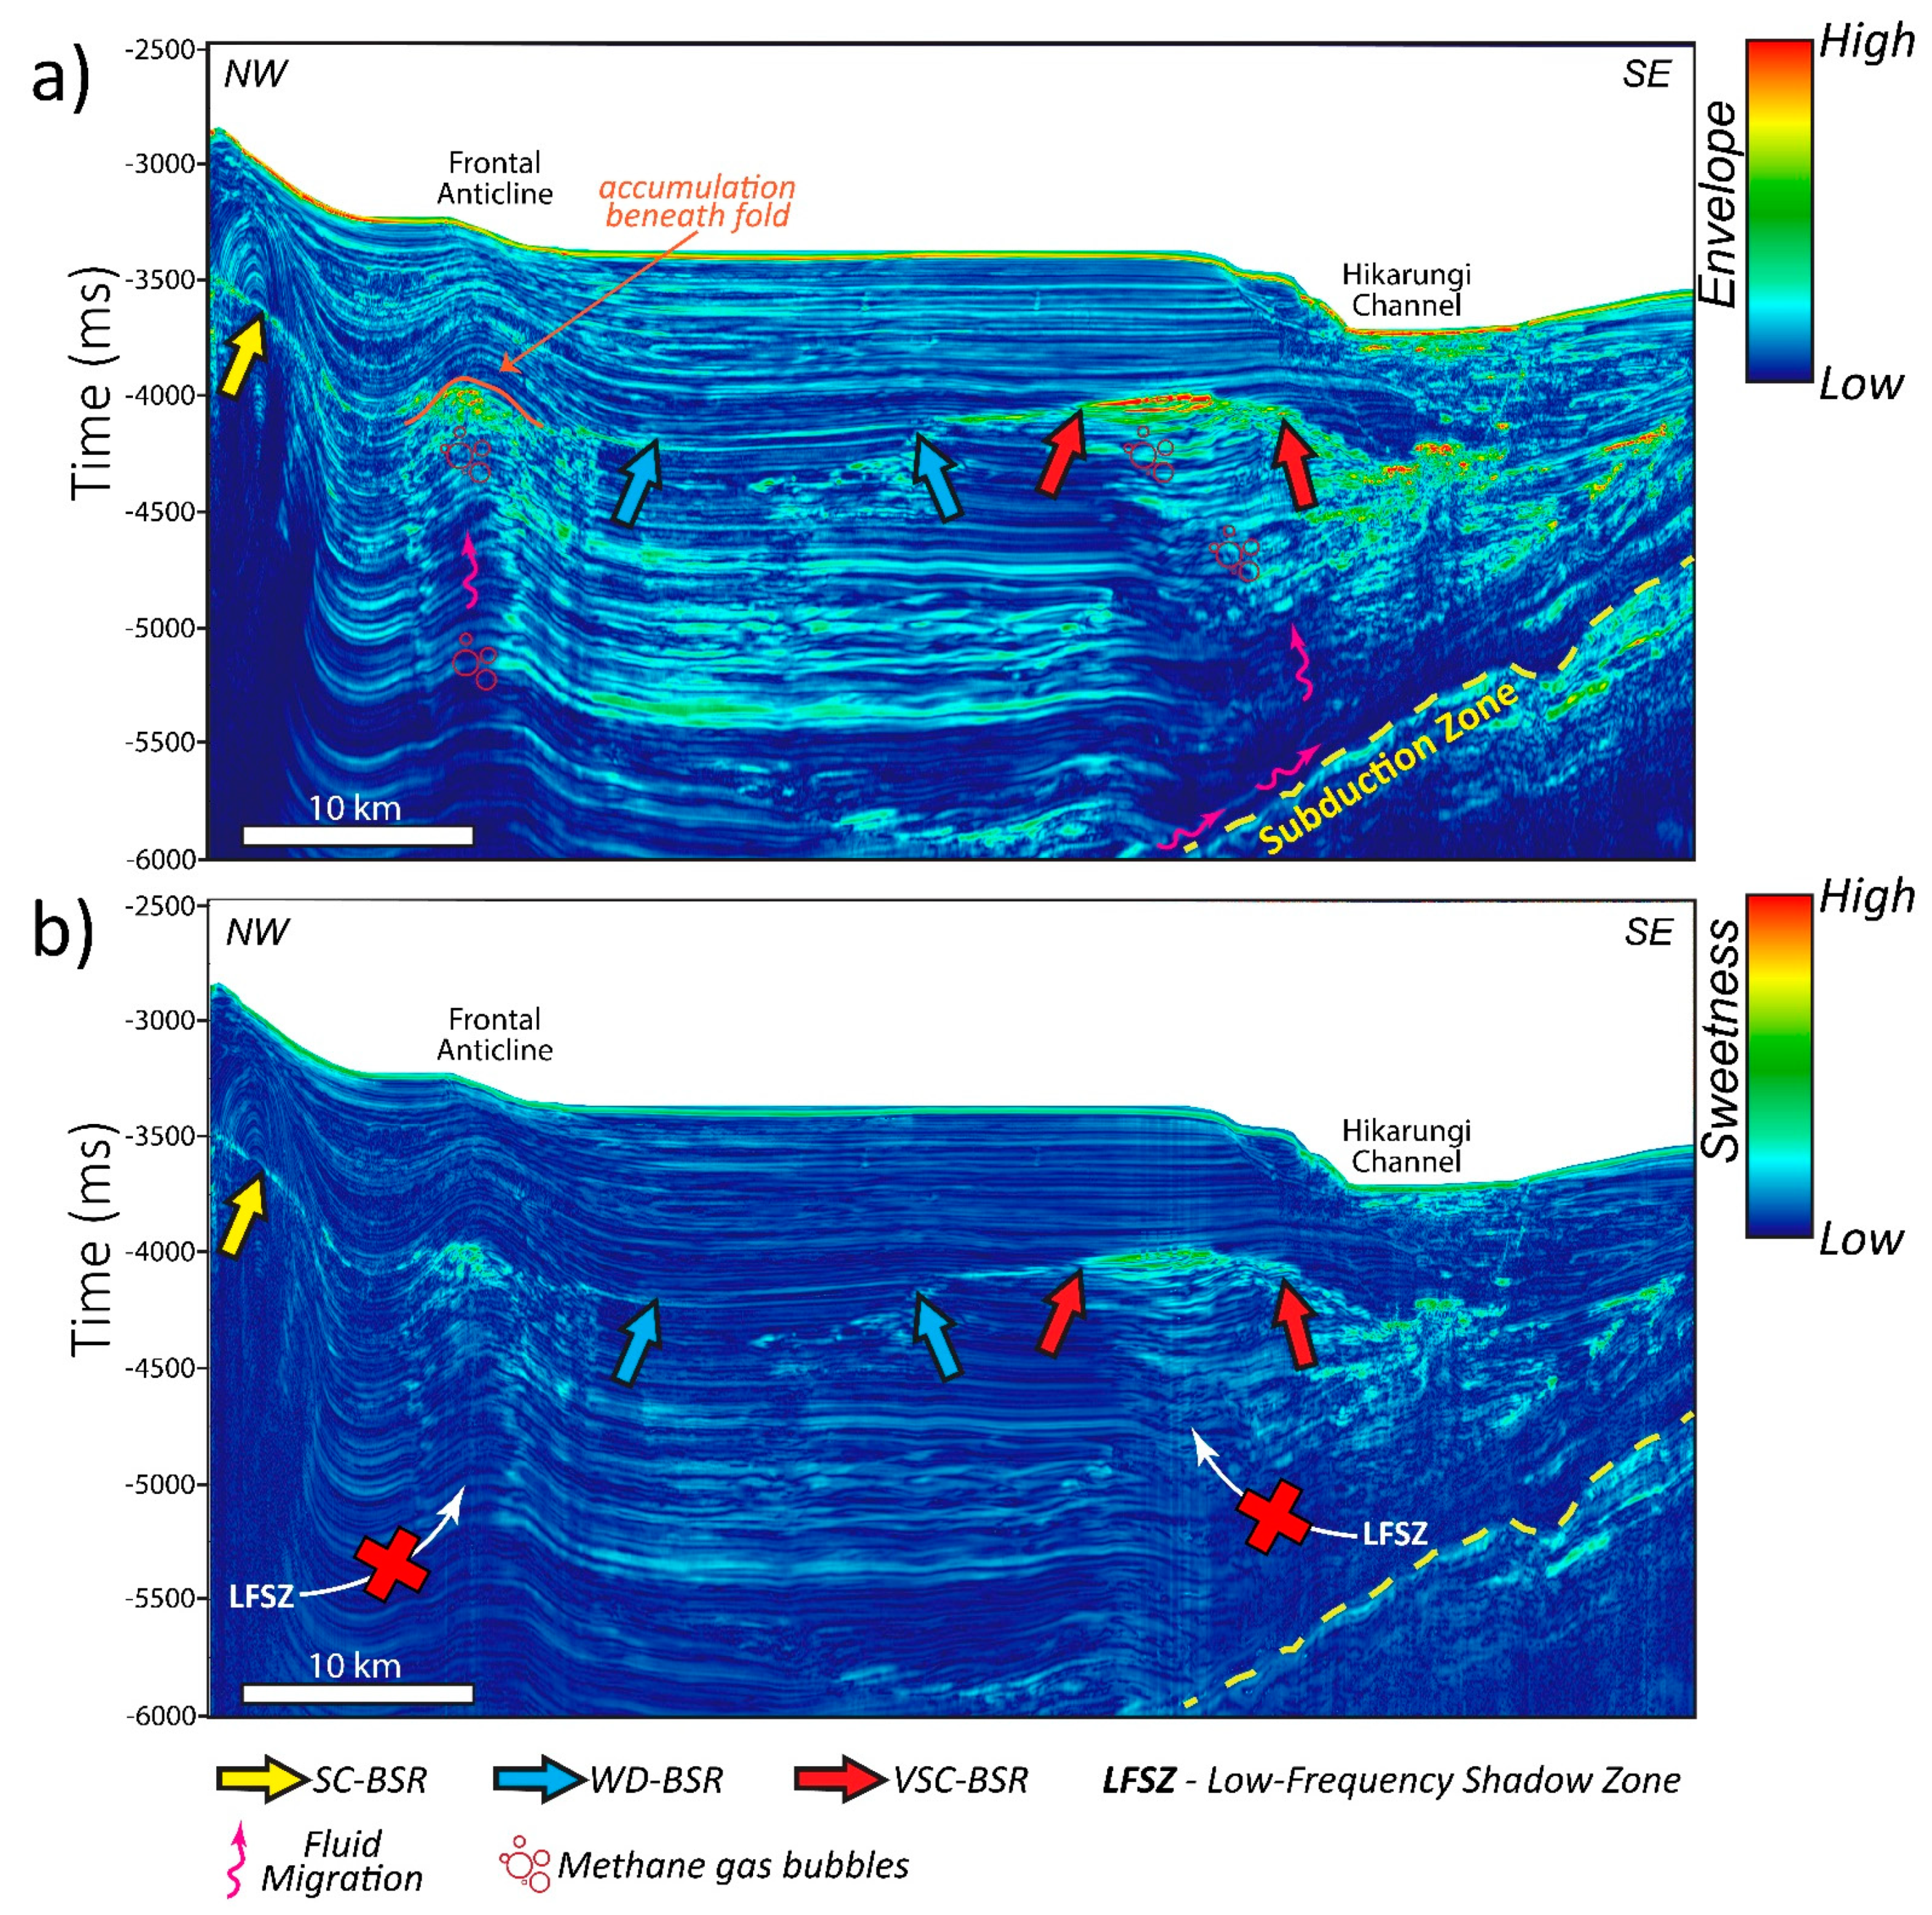
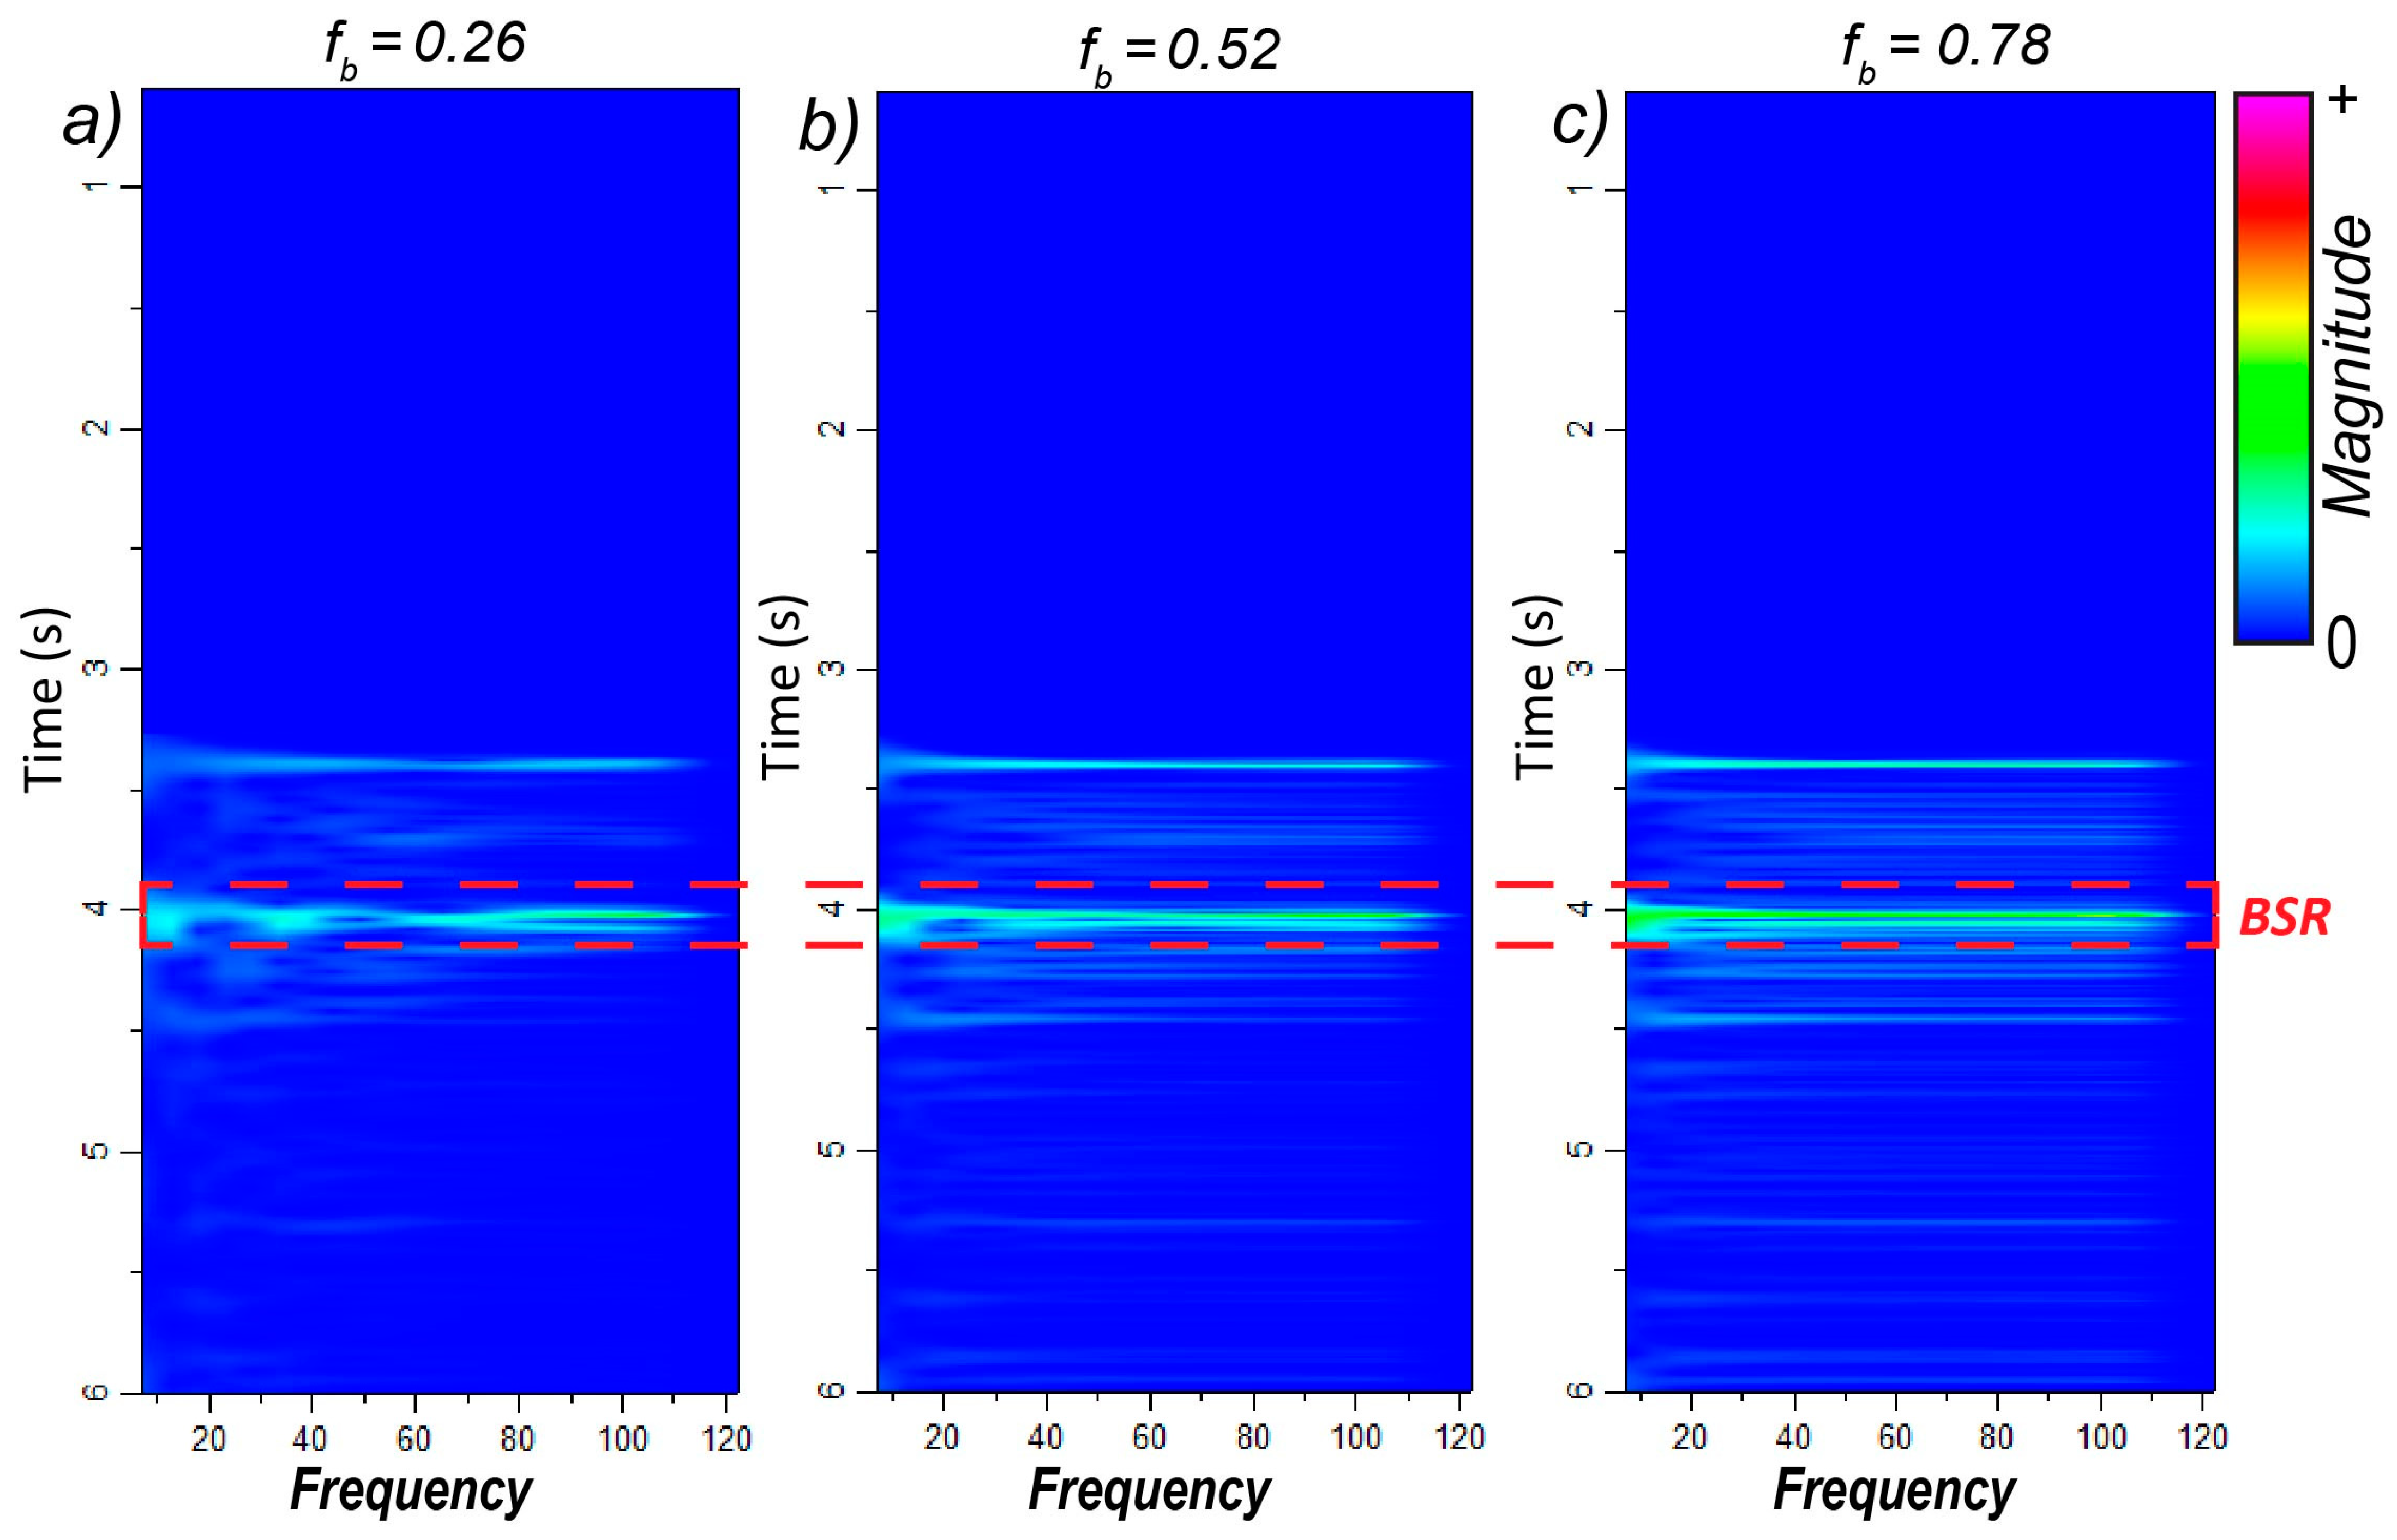
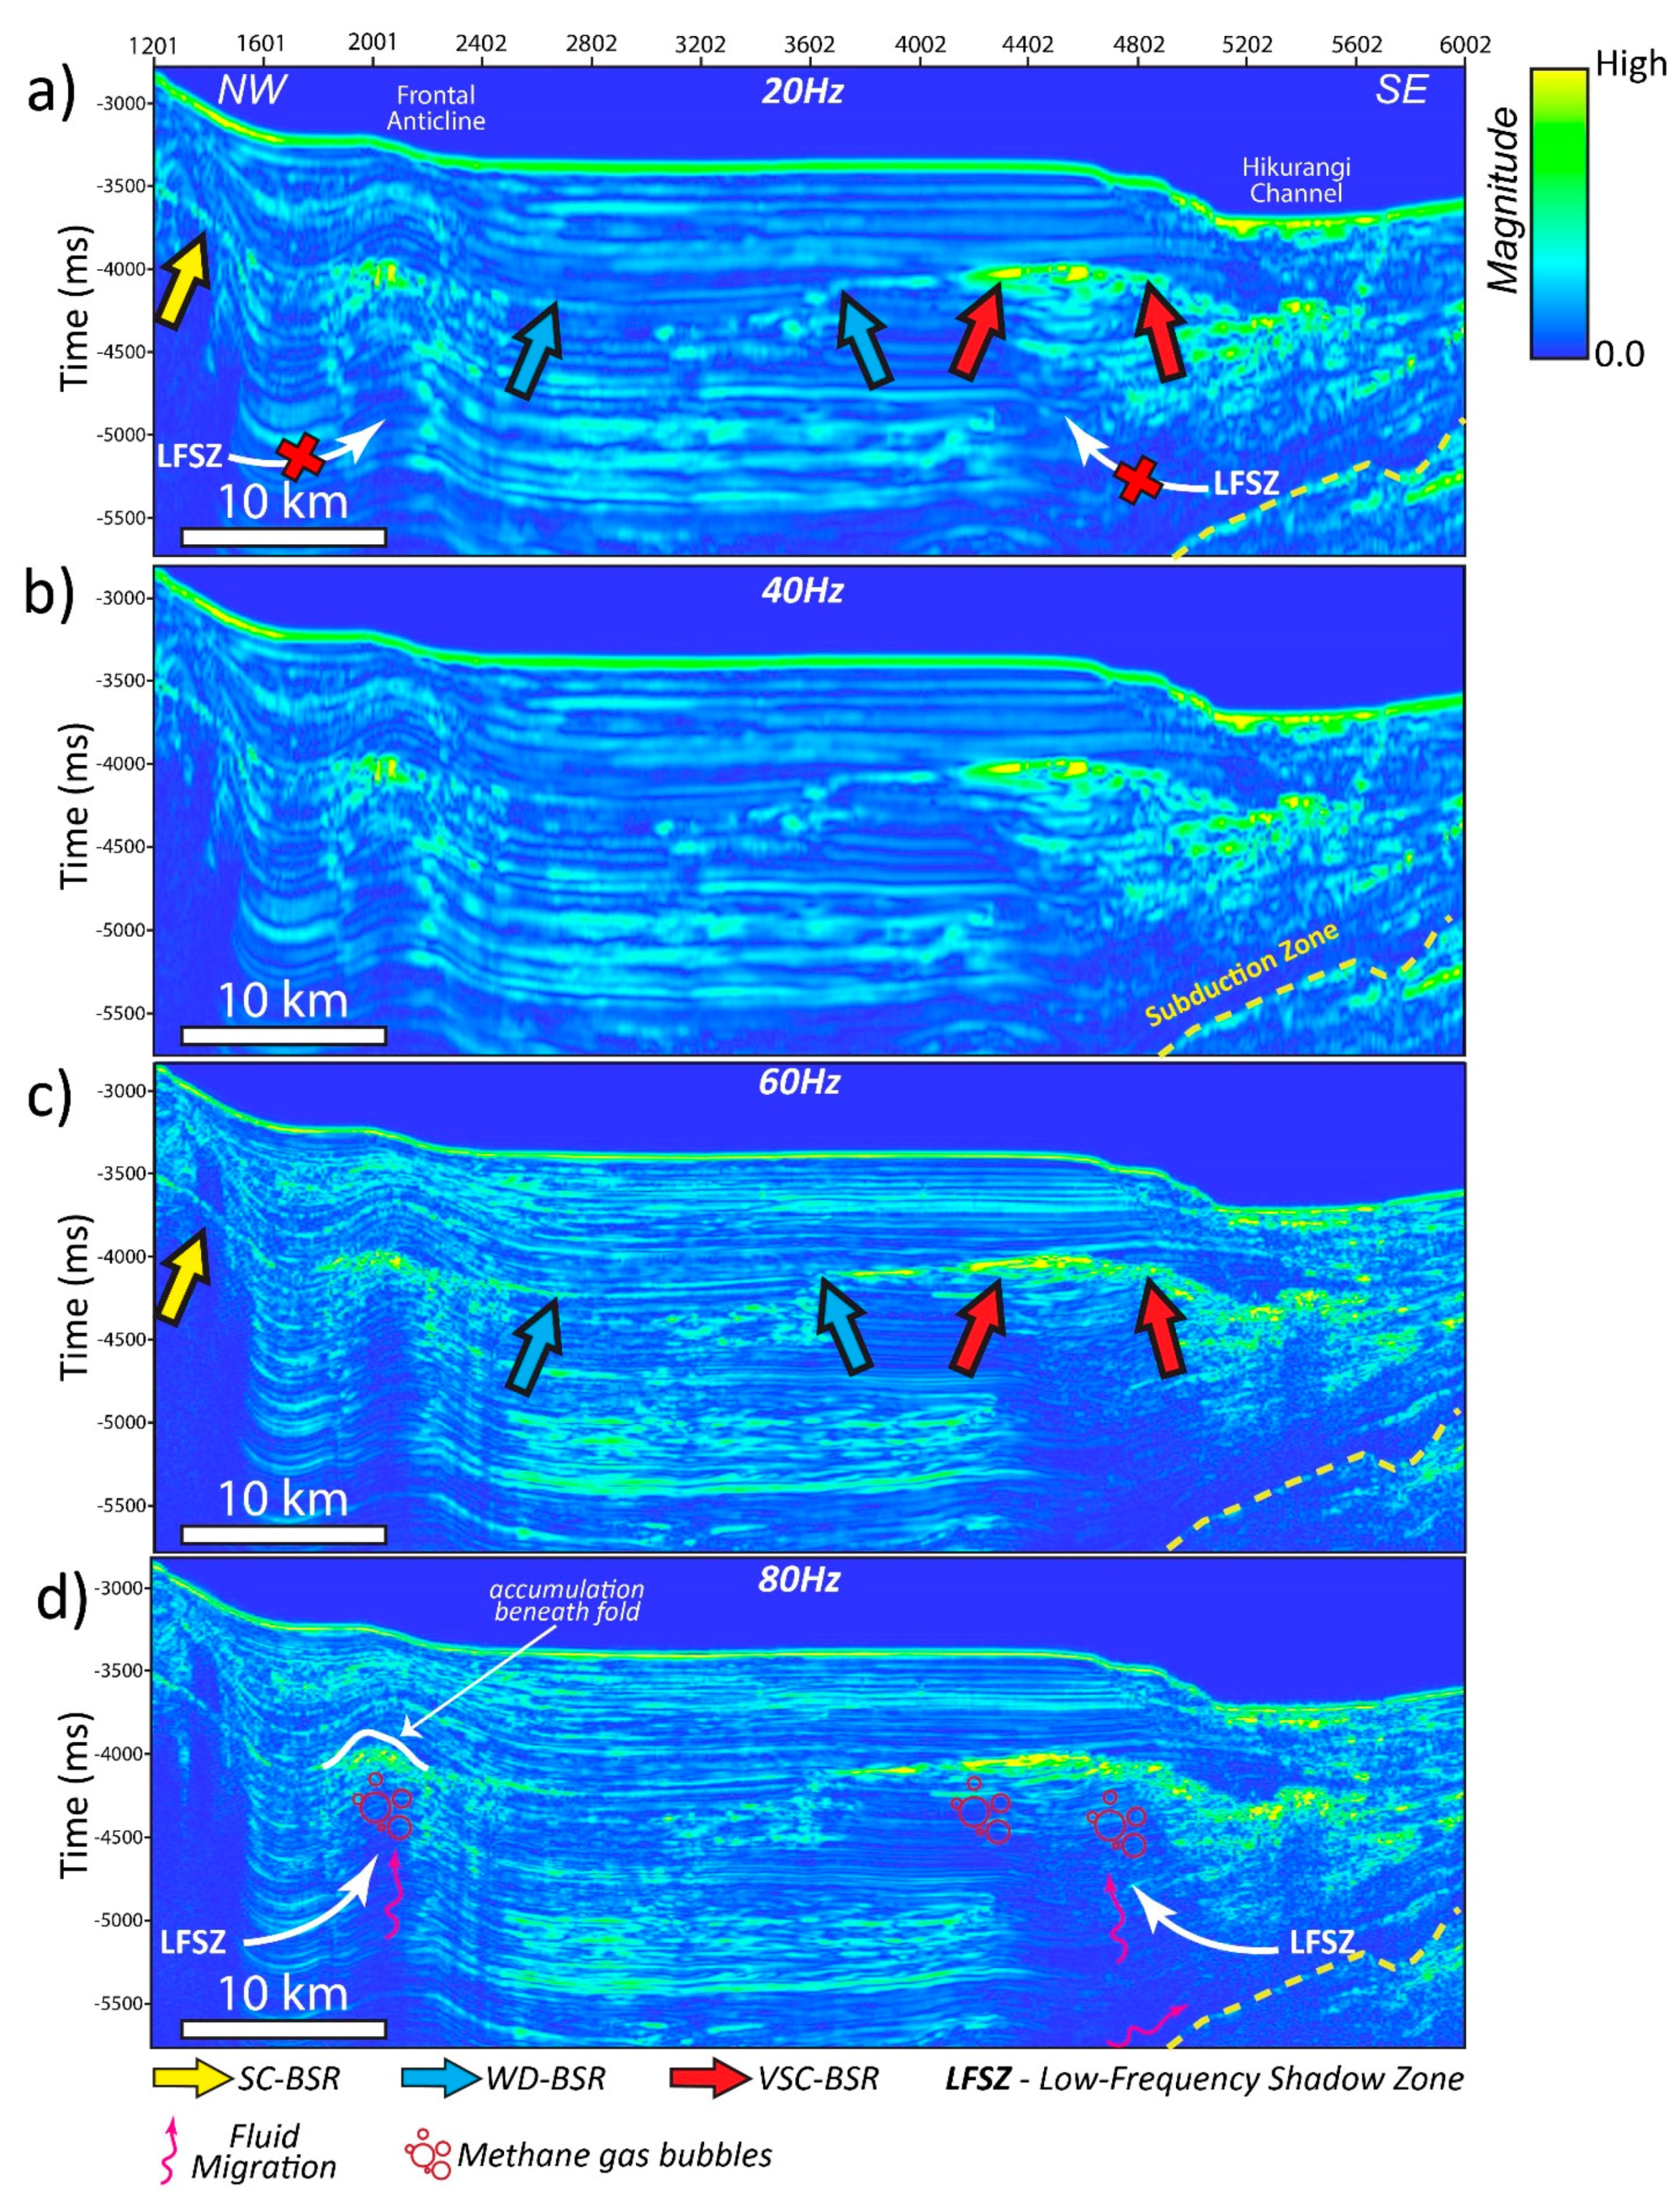
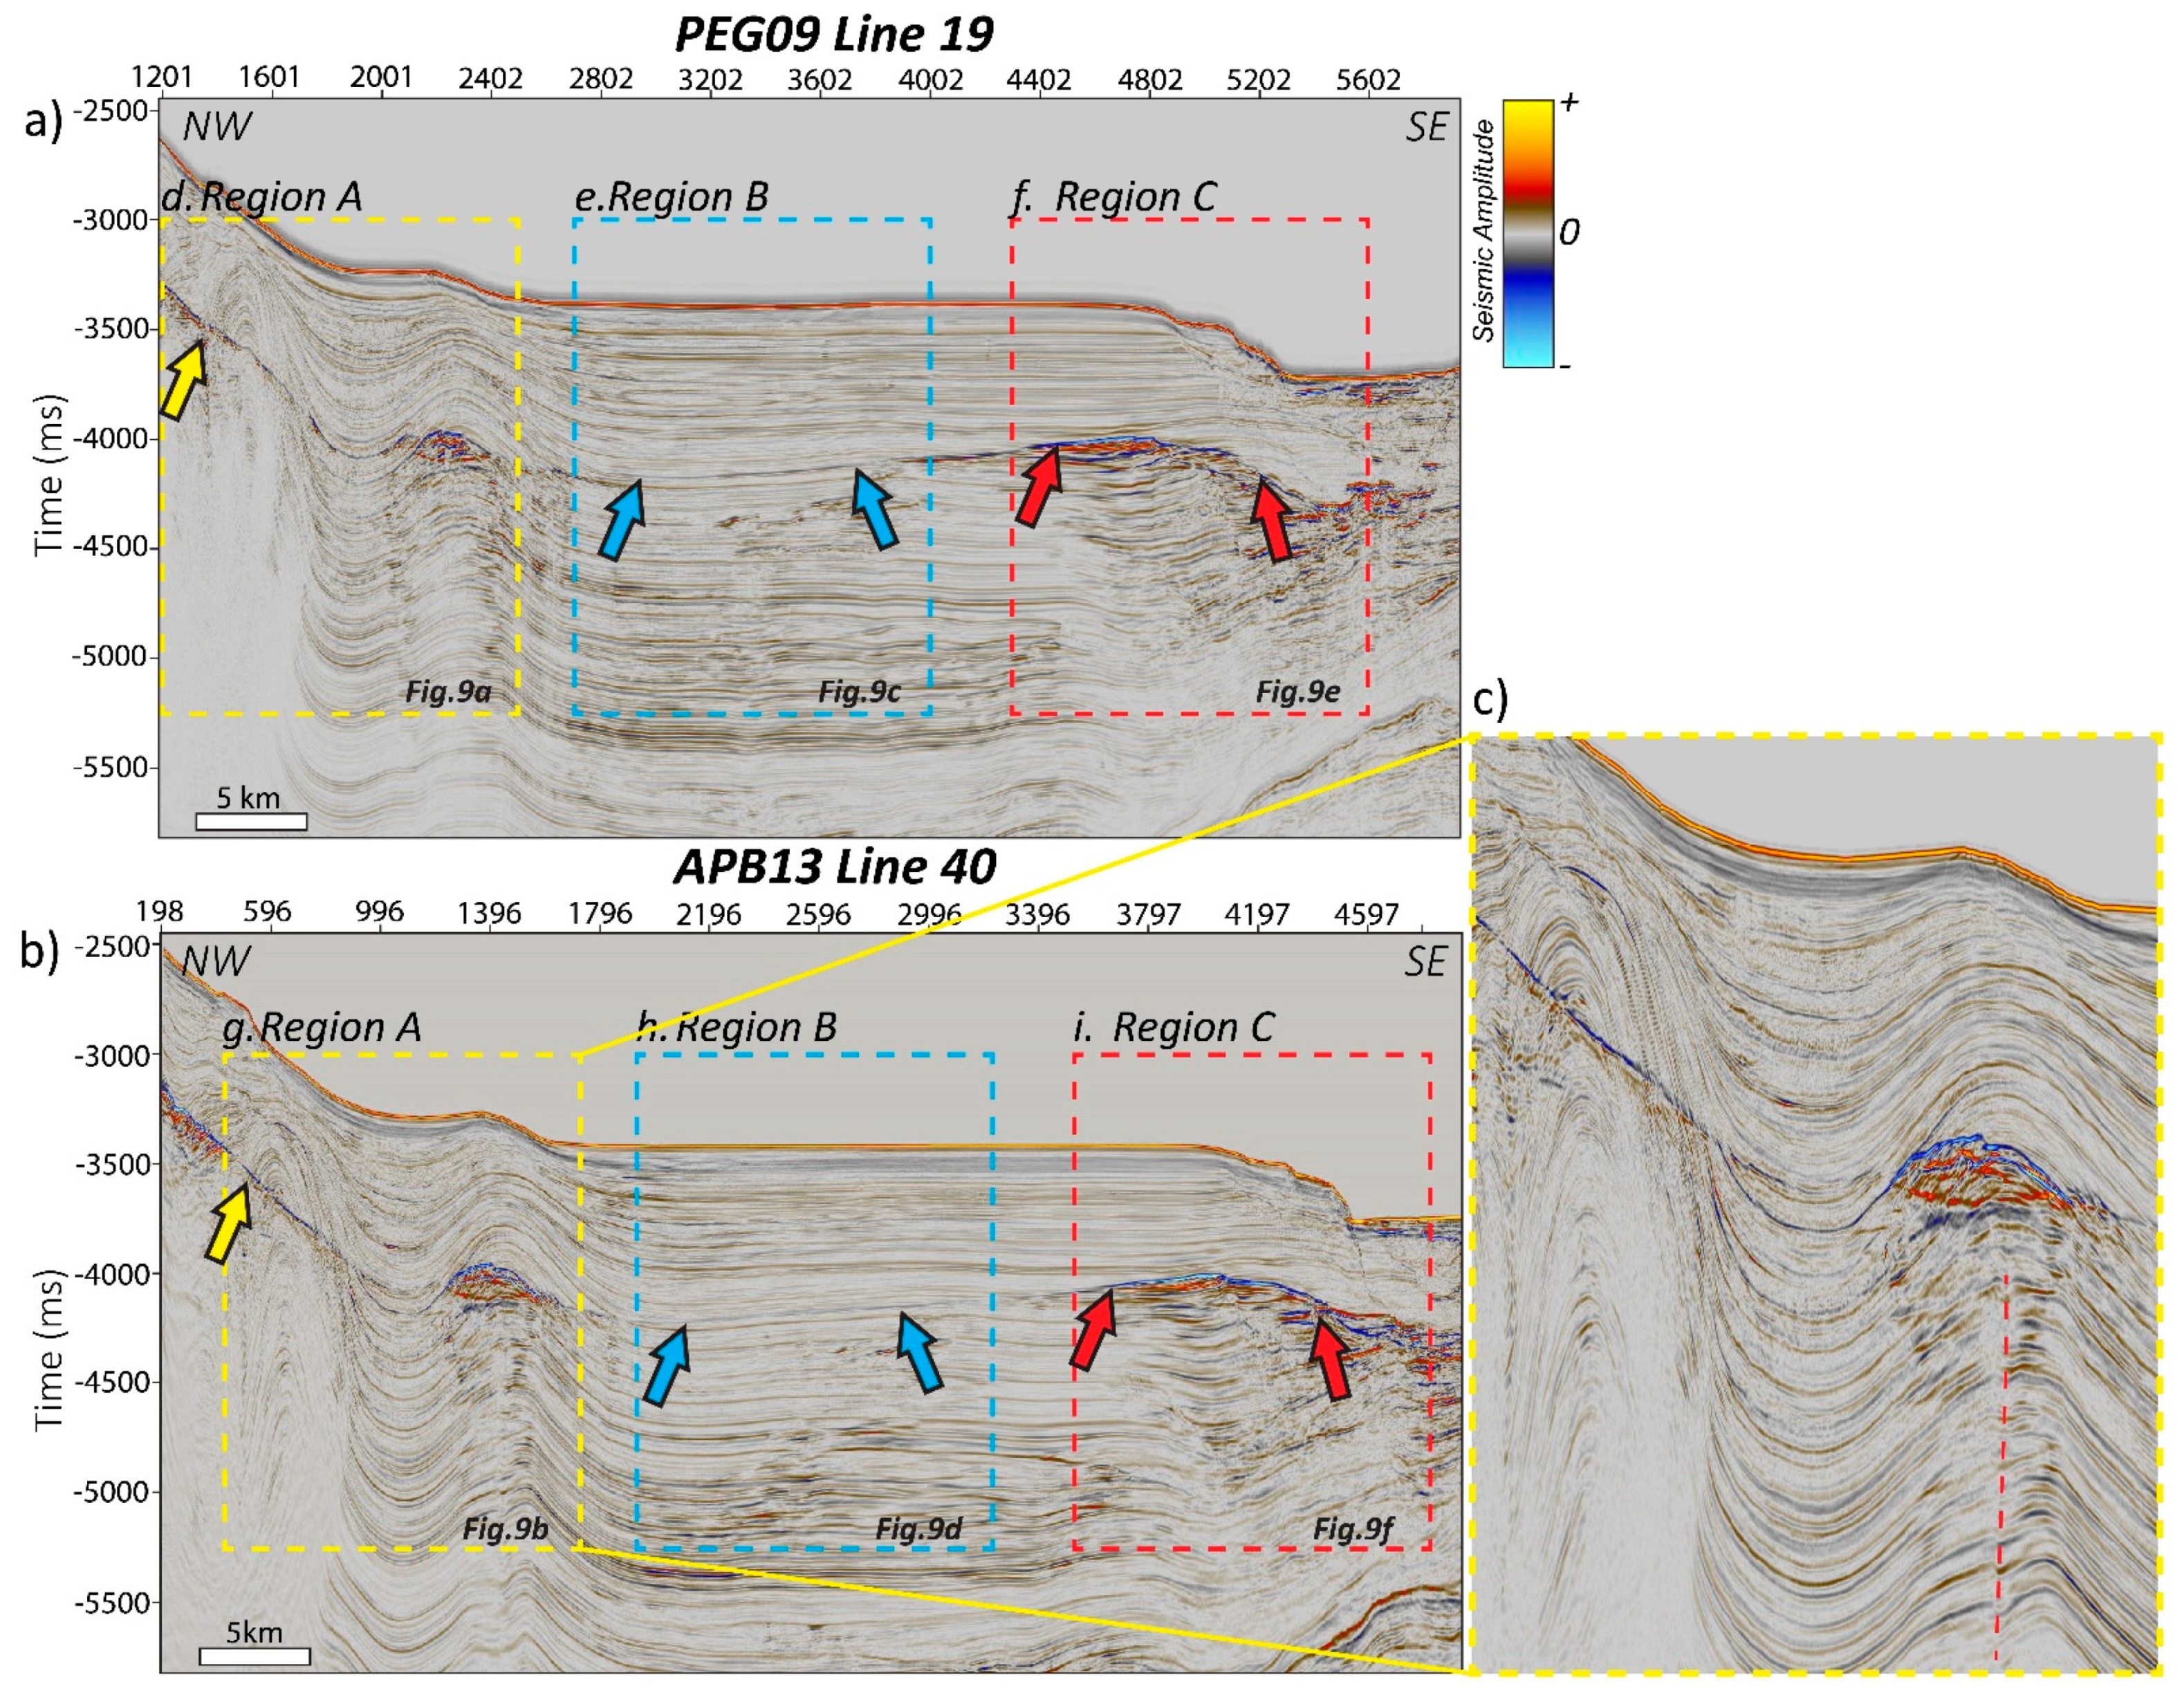
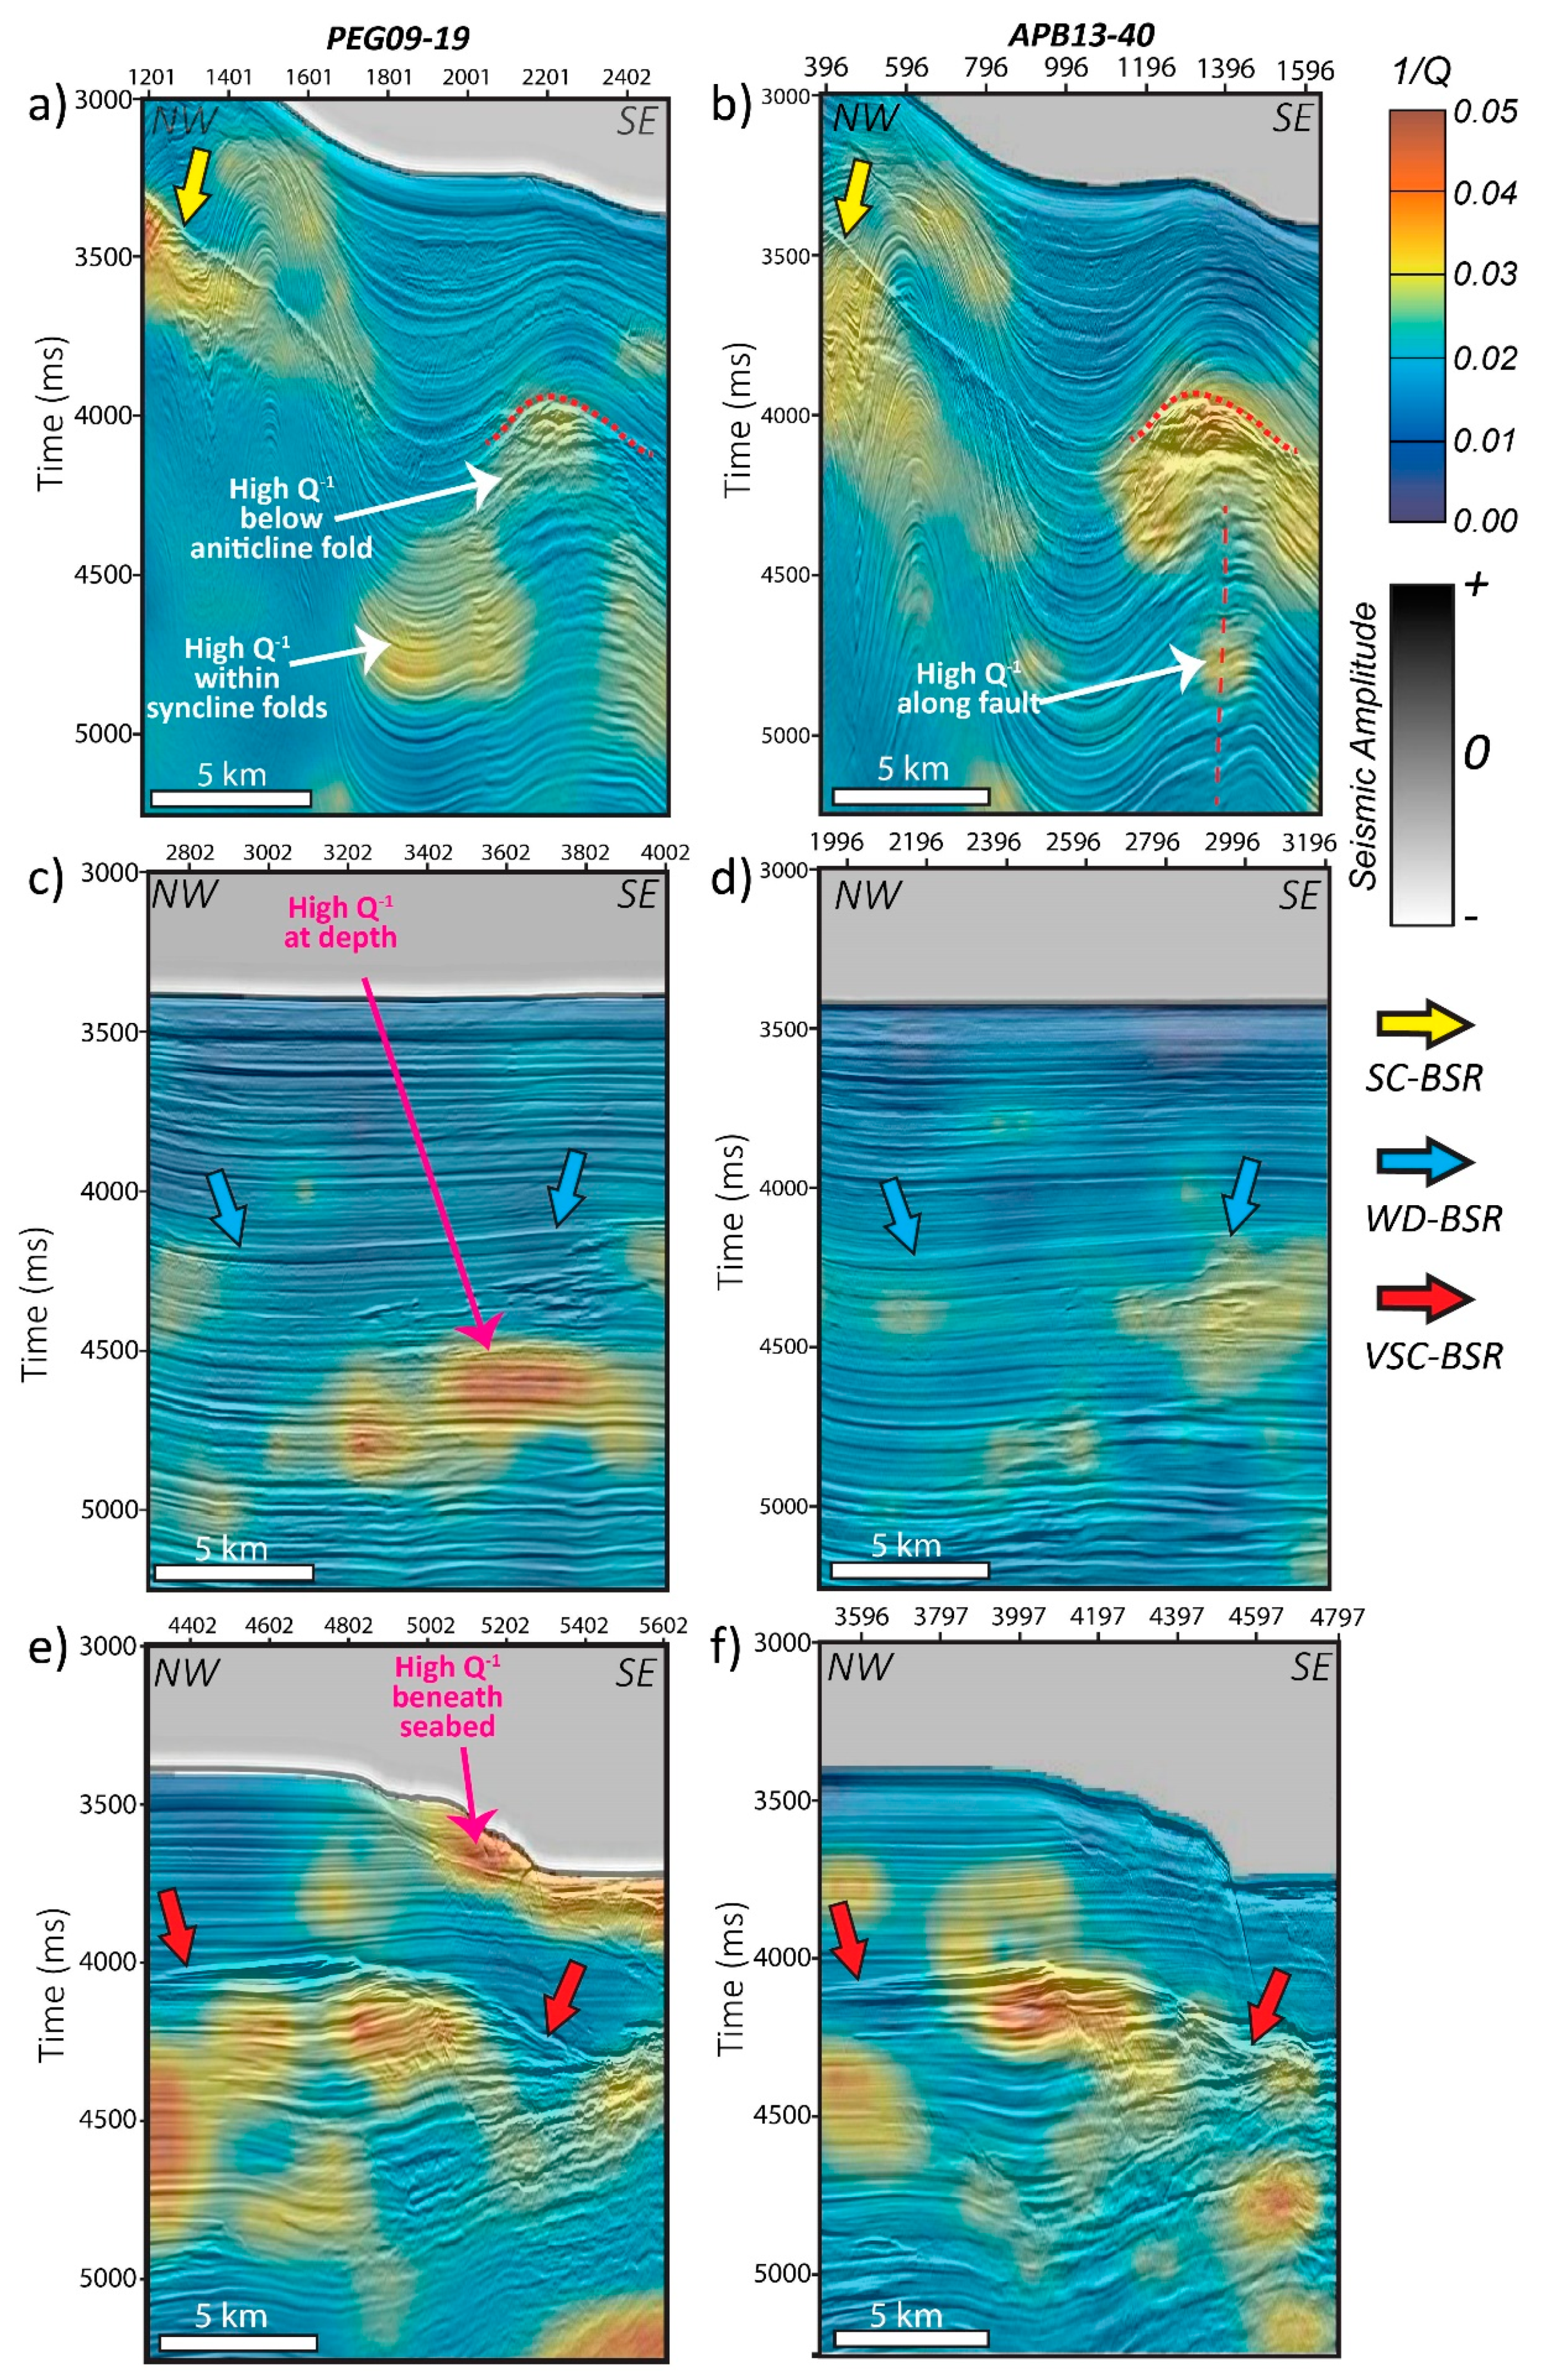
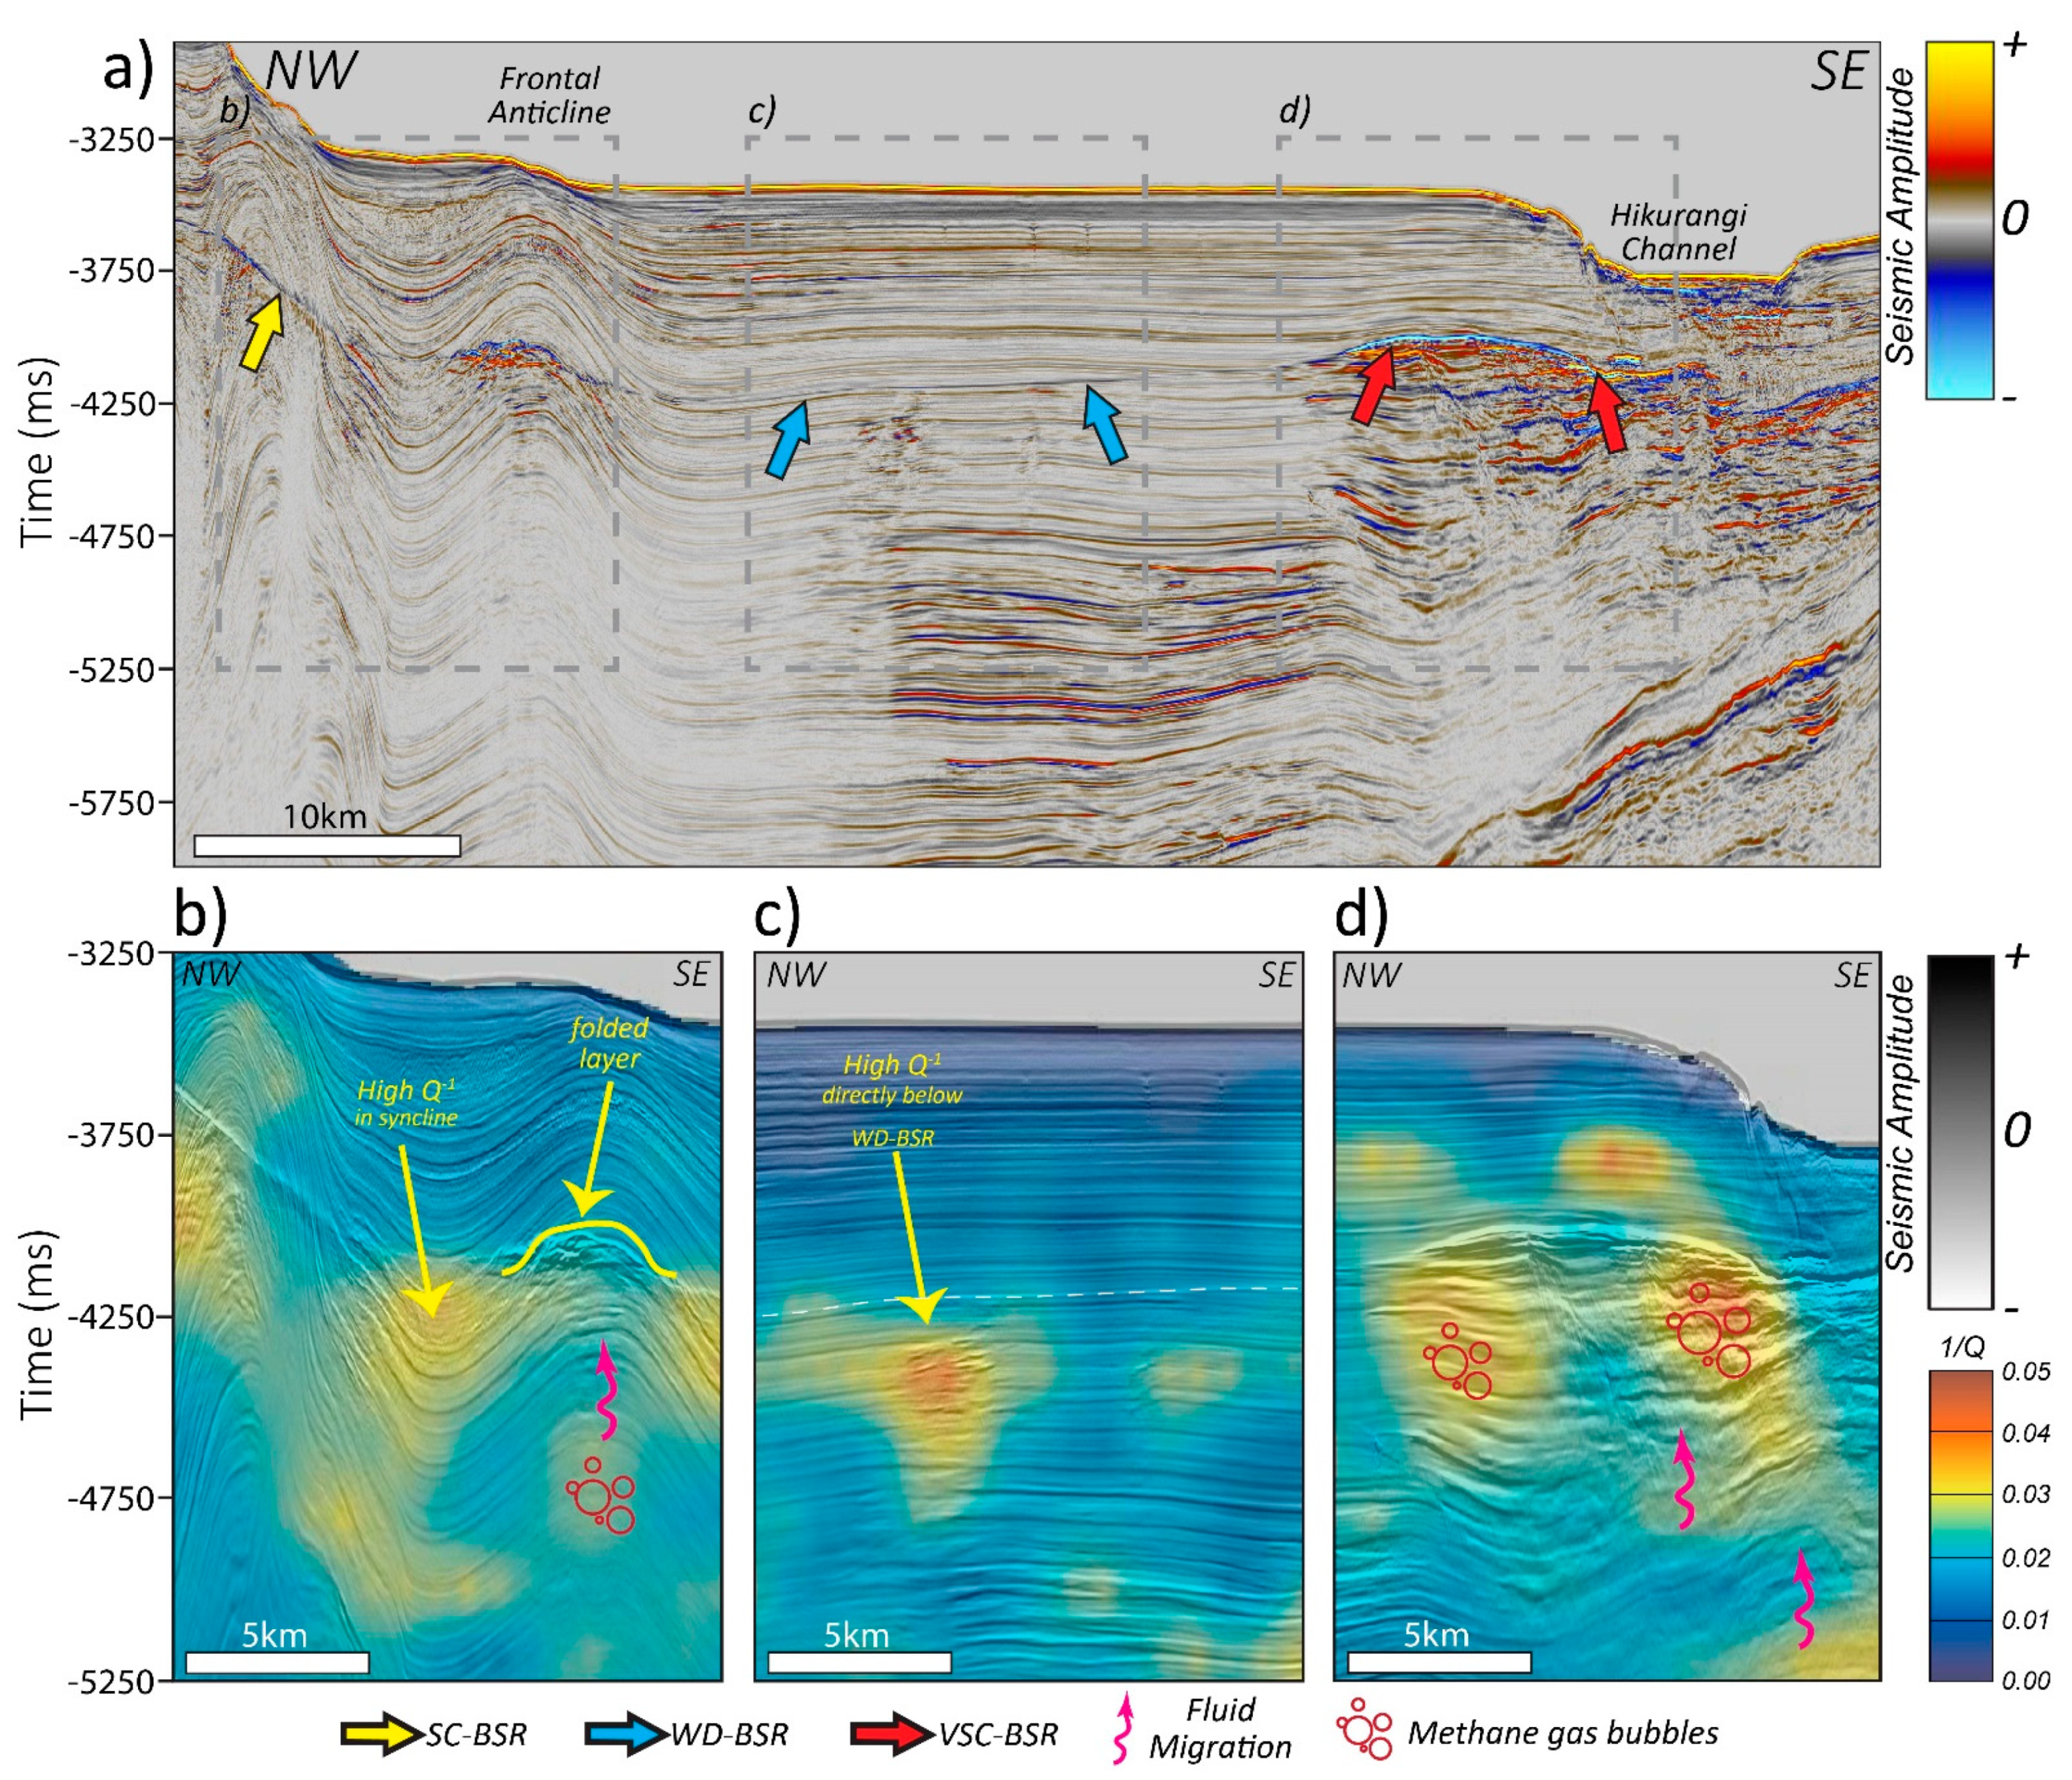
Table 1.
Performance summary of the three methods used. (X) indicates no, whereas (✓) indicates yes.
Table 1.
Performance summary of the three methods used. (X) indicates no, whereas (✓) indicates yes.
| Intended Application | Seismic Attribute | Continuous Wavelet Transform | Sparse Spike Decomposition | |
|---|---|---|---|---|
| Instantaneous Frequency | Sweetness | |||
| As Direct GH Indicator | X | X | X | Indirectly infers gas hydrate presence |
| As a free gas Indicator | ✓ (via a LFSZ) | X | ✓ (via a LFSZ) | (High Attenuation) |
| Discerning of strong BSRs | Low-Medium response. Difficult to distinguish from background geology. | High response | High Magnitude | High Attenuation |
| Discerning of weak BSRs | Weak attribute response. Difficult to distinguish from background geology. | Low Sweetness, but can somewhat be discerned. | Weak magnitudes. Difficult to distinguish from background geology. | Can potentially vary, (eg. The high attenuation associated with the weak/non BSR region along the Alaminos Canyon 2D Line) |
Publisher’s Note: MDPI stays neutral with regard to jurisdictional claims in published maps and institutional affiliations. |
© 2021 by the authors. Licensee MDPI, Basel, Switzerland. This article is an open access article distributed under the terms and conditions of the Creative Commons Attribution (CC BY) license (https://creativecommons.org/licenses/by/4.0/).
Share and Cite
MDPI and ACS Style
Clairmont, R.; Bedle, H.; Marfurt, K.; Wang, Y. Seismic Attribute Analyses and Attenuation Applications for Detecting Gas Hydrate Presence. Geosciences 2021, 11, 450. https://0-doi-org.brum.beds.ac.uk/10.3390/geosciences11110450
AMA Style
Clairmont R, Bedle H, Marfurt K, Wang Y. Seismic Attribute Analyses and Attenuation Applications for Detecting Gas Hydrate Presence. Geosciences. 2021; 11(11):450. https://0-doi-org.brum.beds.ac.uk/10.3390/geosciences11110450
Chicago/Turabian StyleClairmont, Roberto, Heather Bedle, Kurt Marfurt, and Yichuan Wang. 2021. "Seismic Attribute Analyses and Attenuation Applications for Detecting Gas Hydrate Presence" Geosciences 11, no. 11: 450. https://0-doi-org.brum.beds.ac.uk/10.3390/geosciences11110450
Note that from the first issue of 2016, this journal uses article numbers instead of page numbers. See further details here.