


Investigation of the Factors Controlling the Duration and Productivity of Aftershocks Following Strong Earthquakes in Greece
 , and
, and
Abstract
:1. Introduction
2. Data and Methods
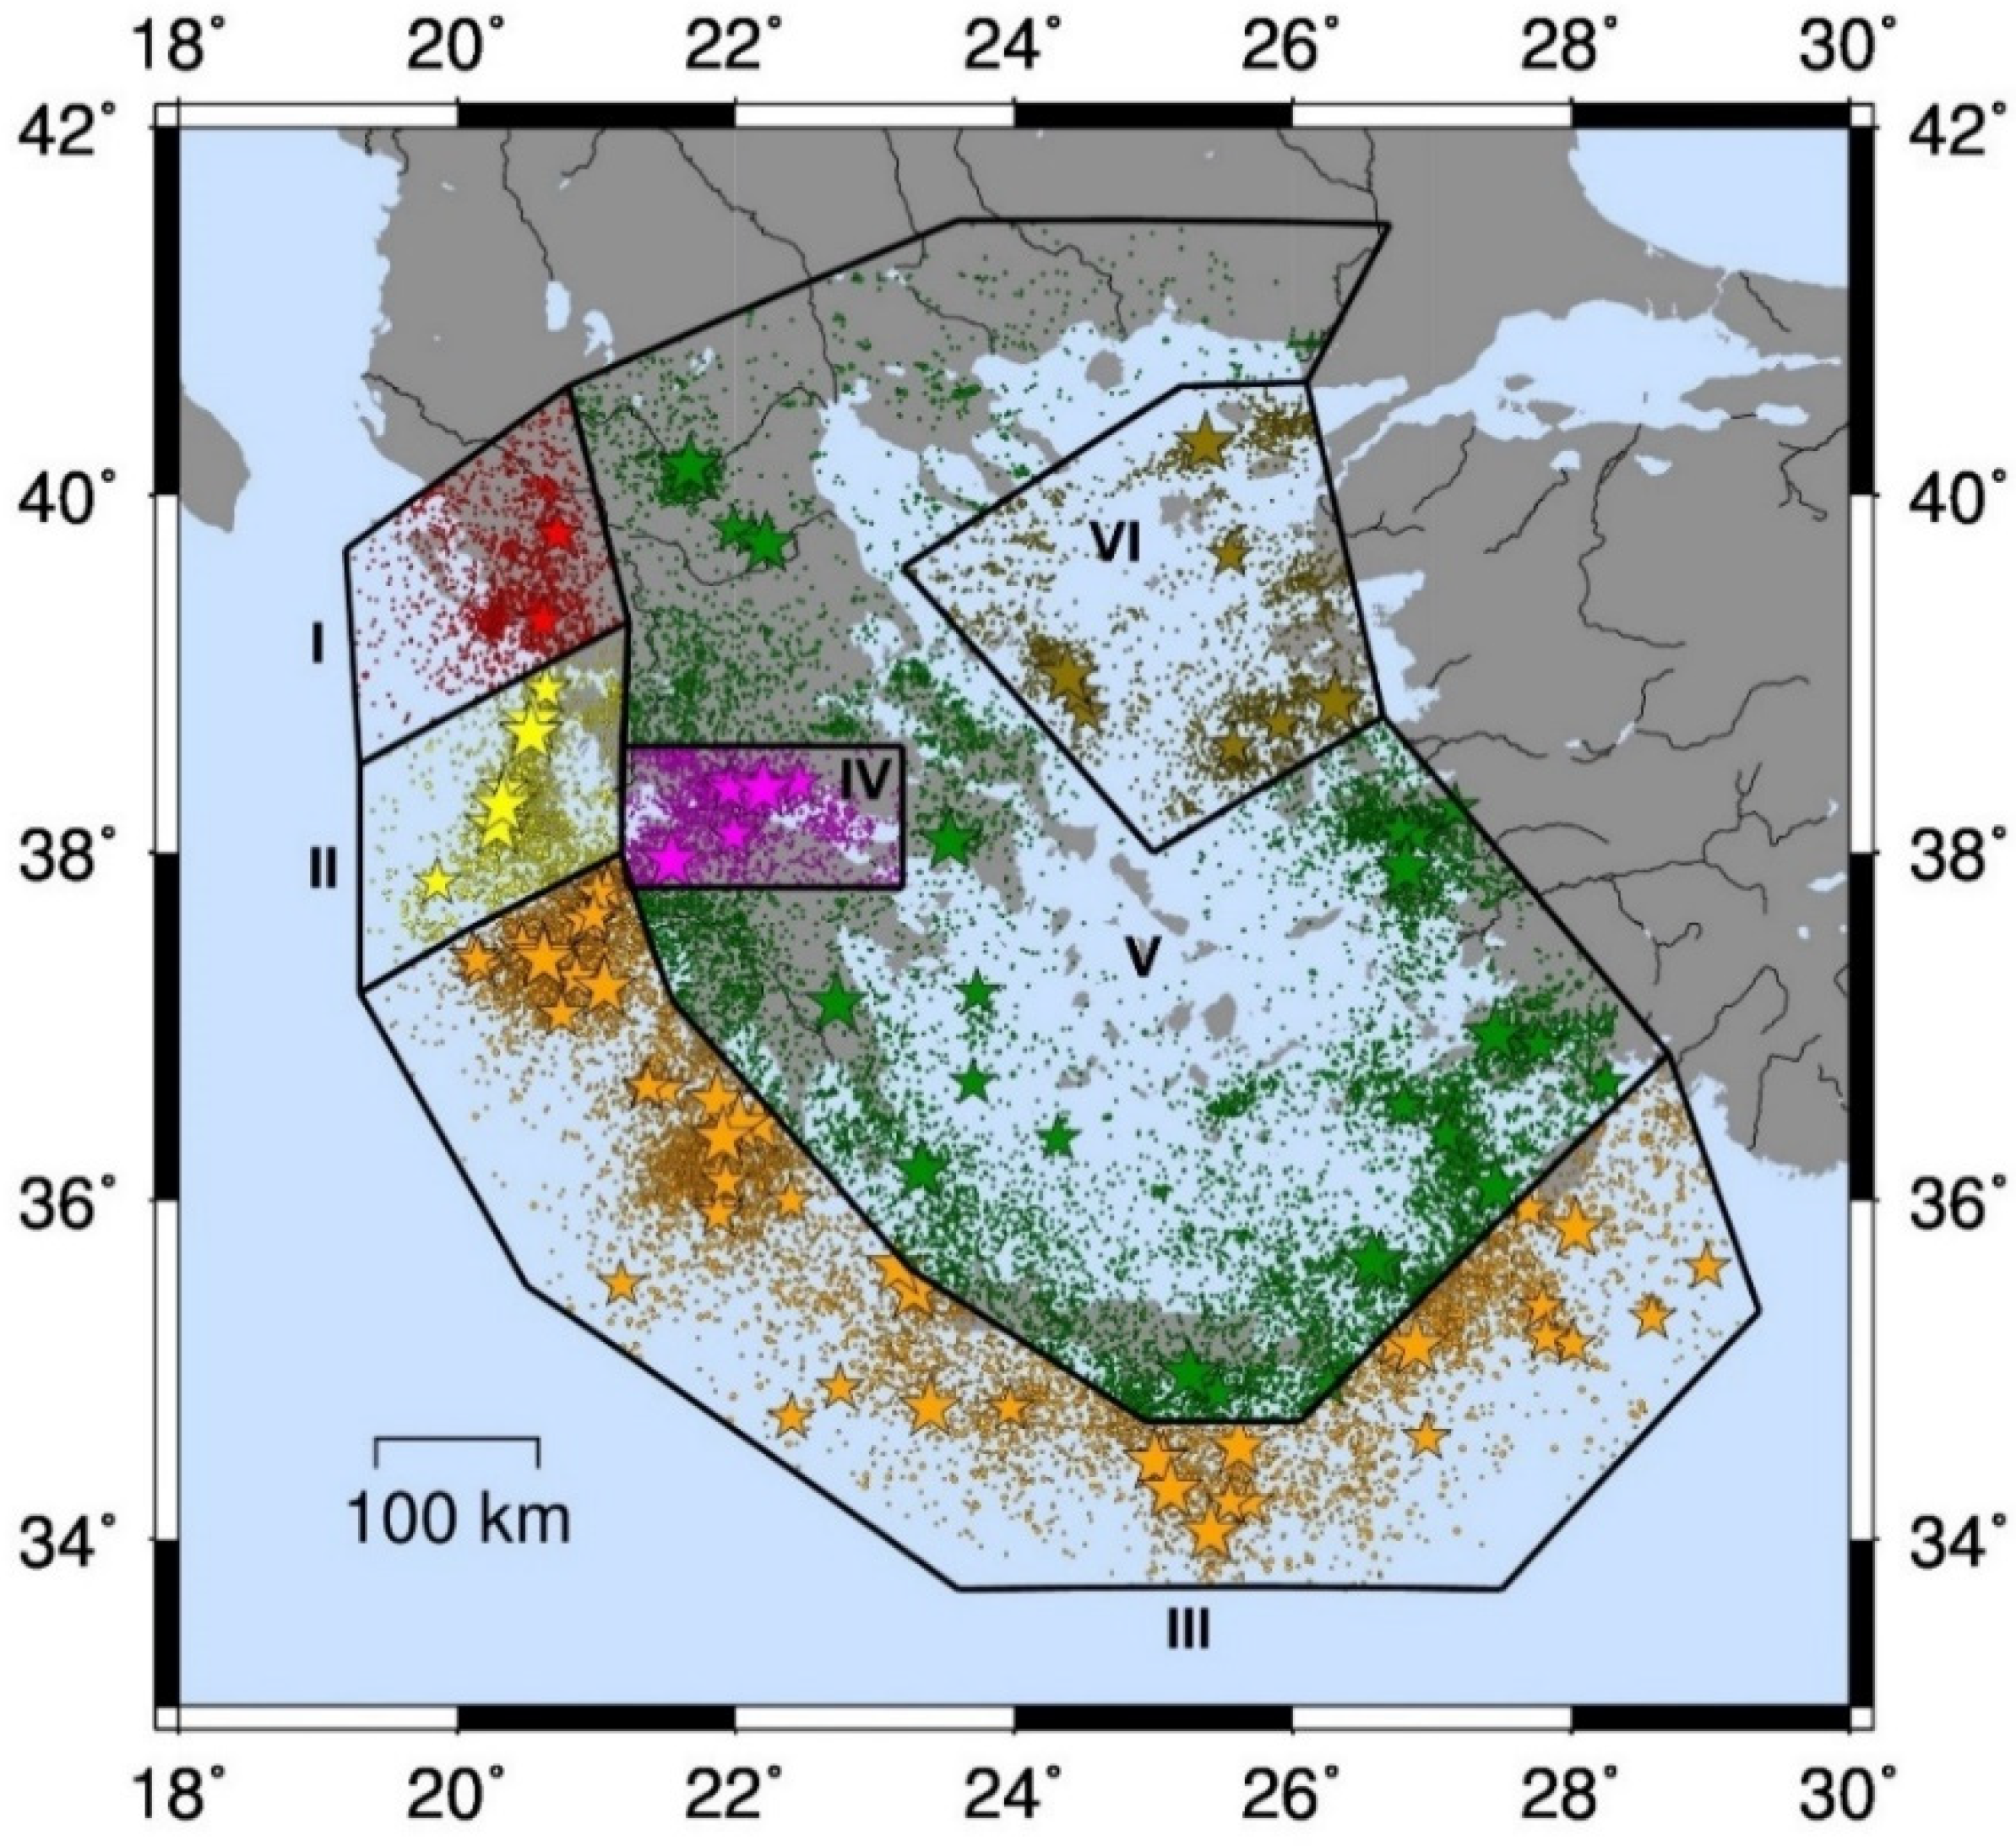
2.1. Selection of Aftershock Sequences
2.2. Modeling of the Aftershock Rates
2.3. Aftershock Duration
2.4. Aftershock Productivity
3. Results
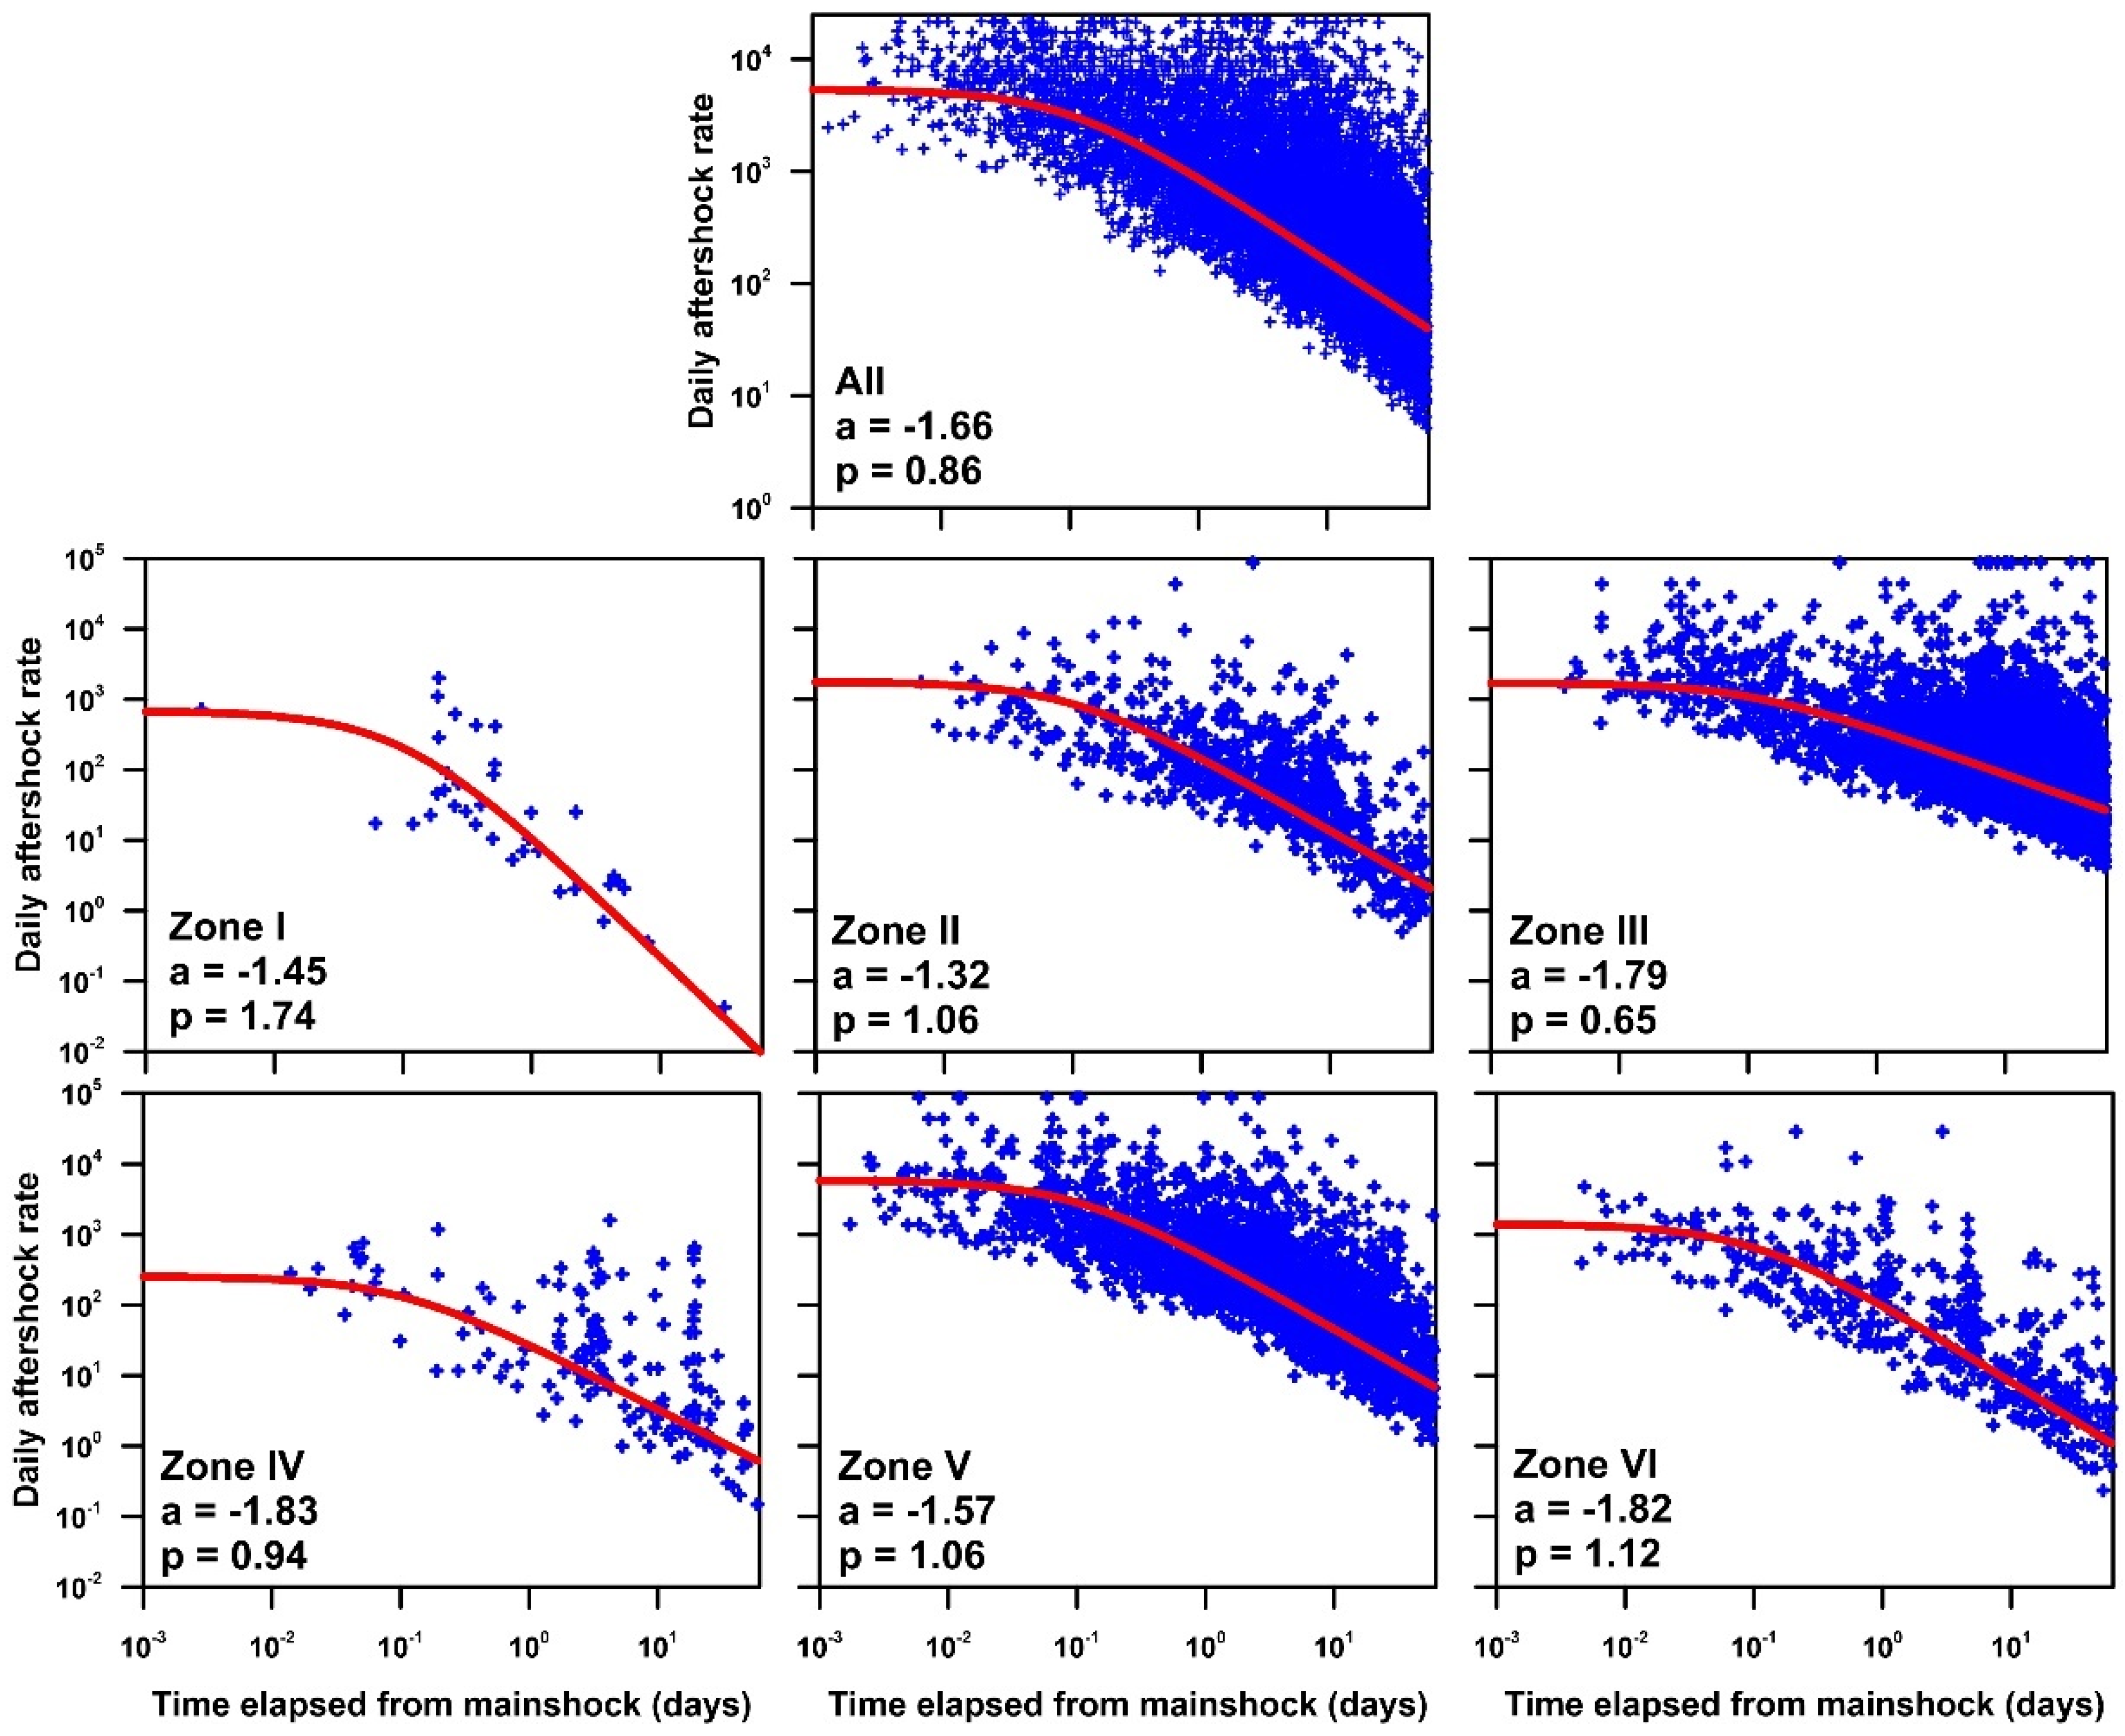
3.1. Aftershock Rates
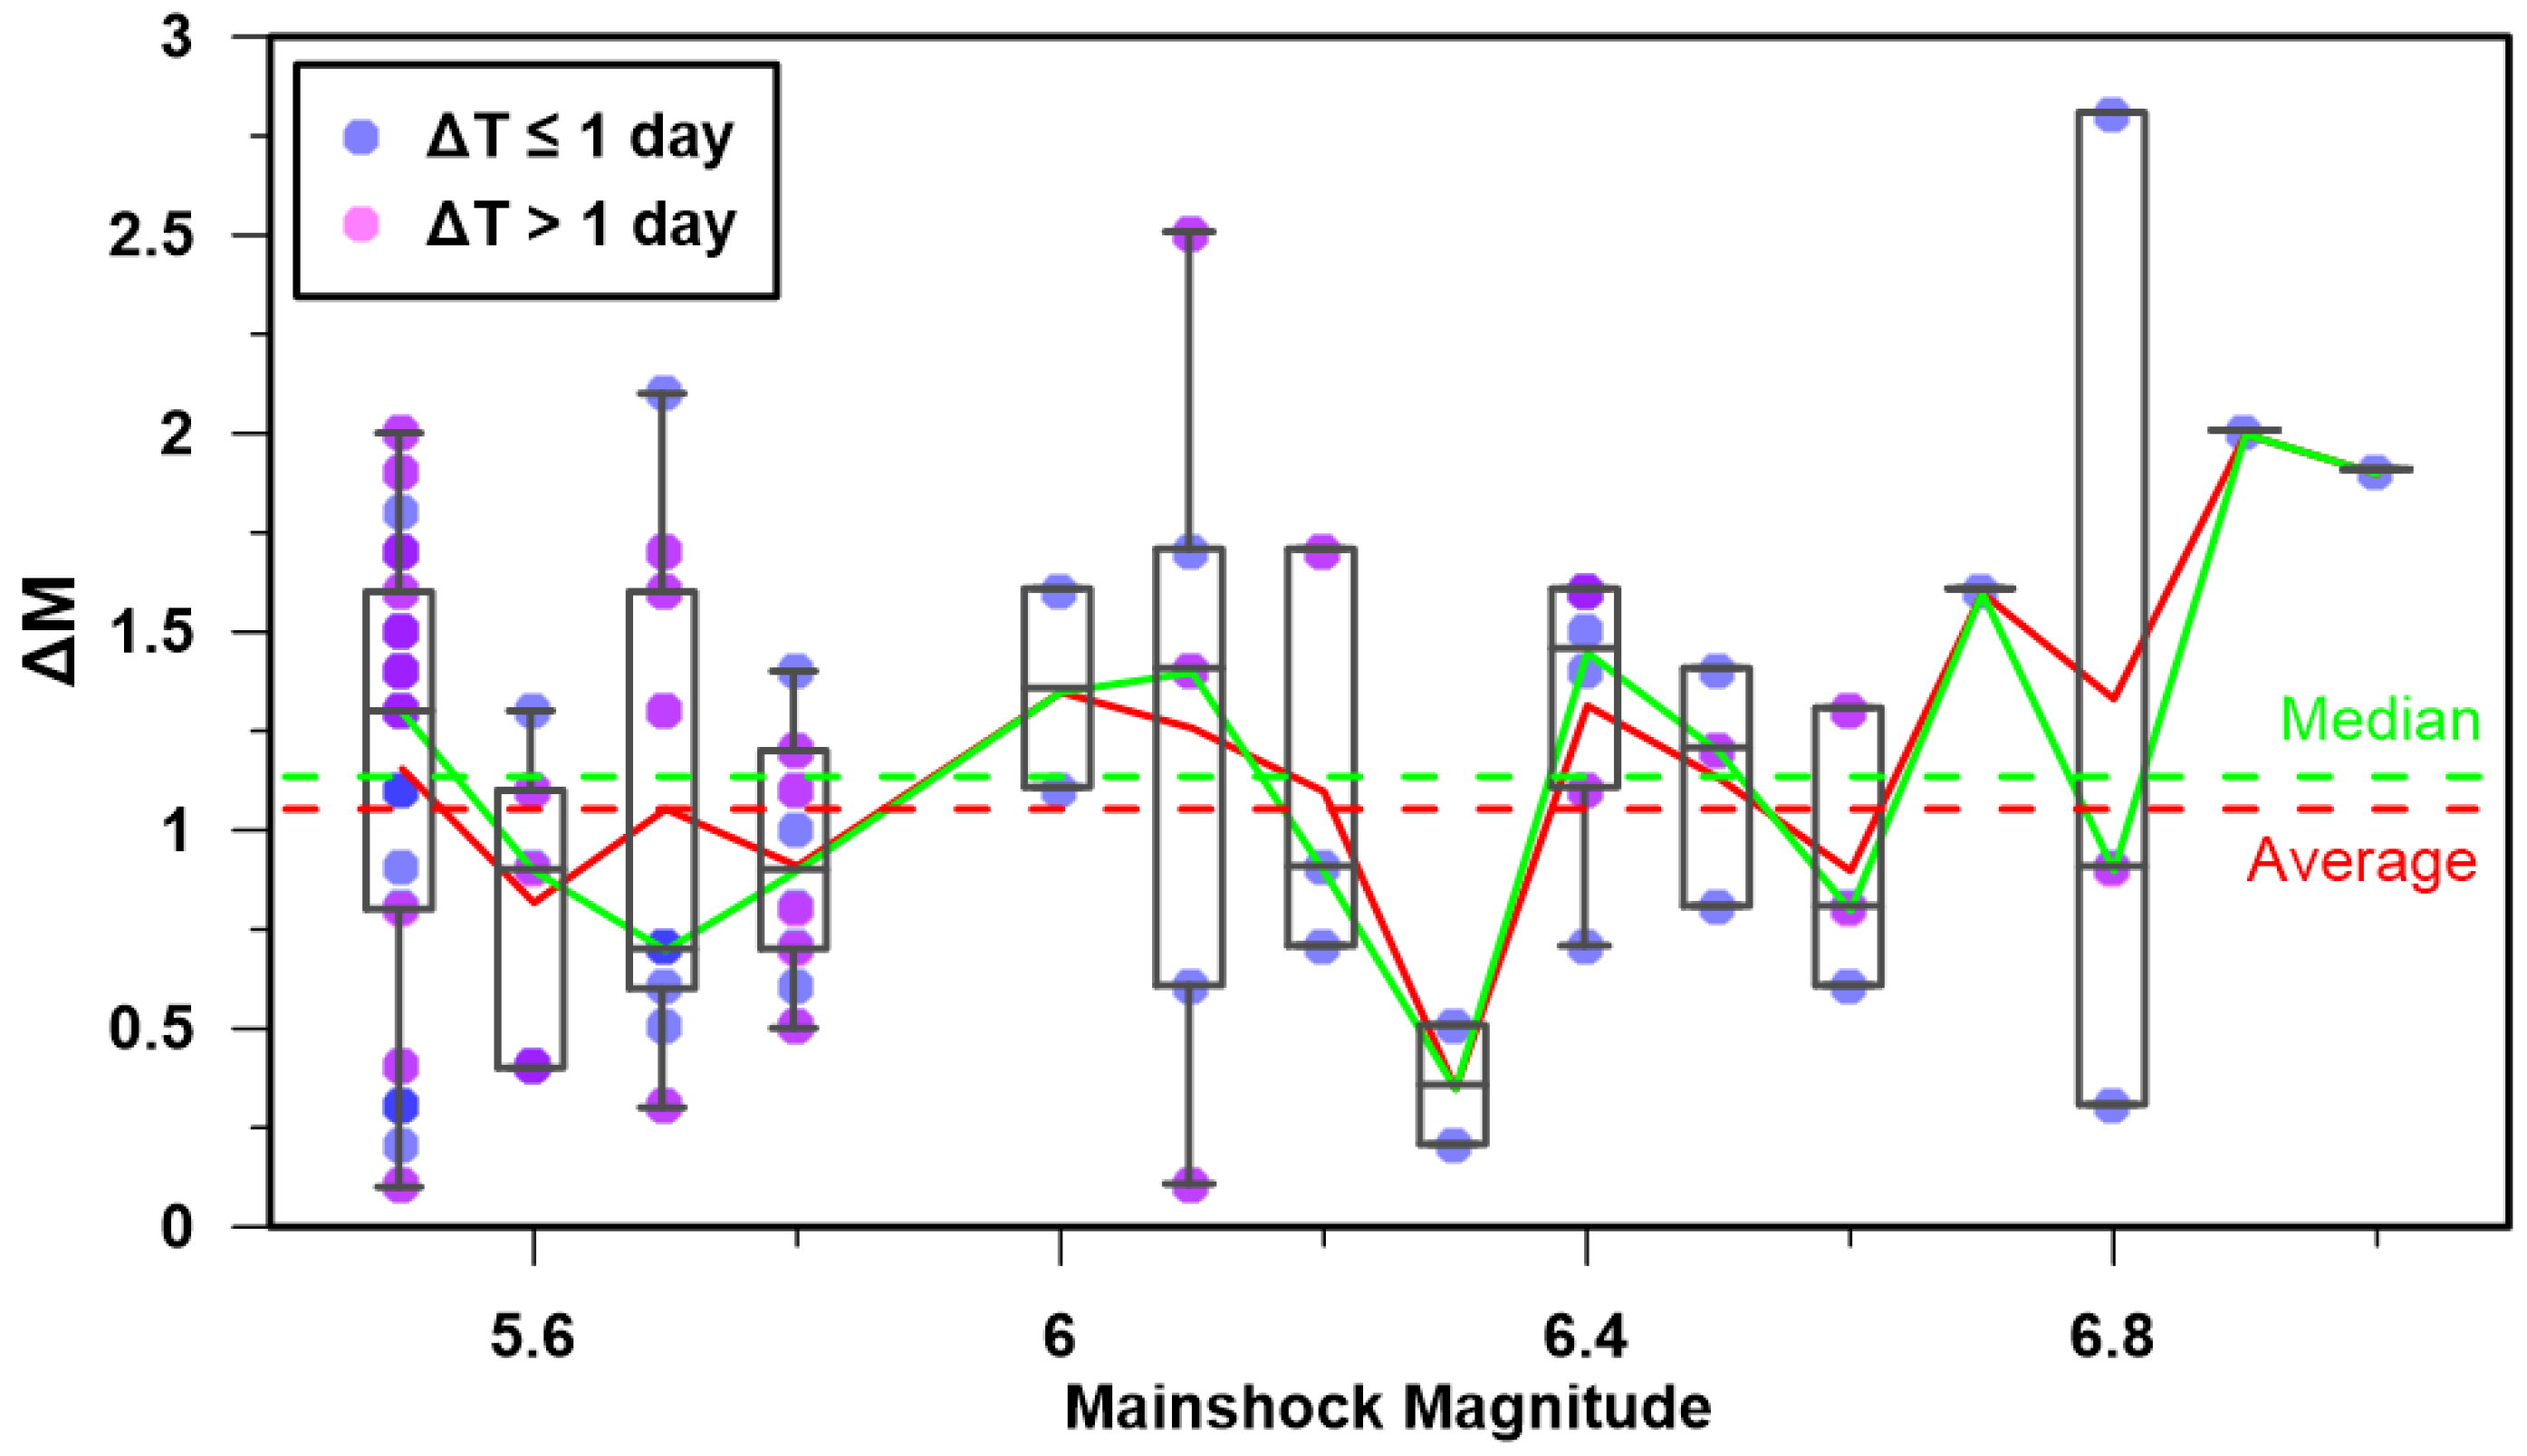
3.2. Båth’s Law
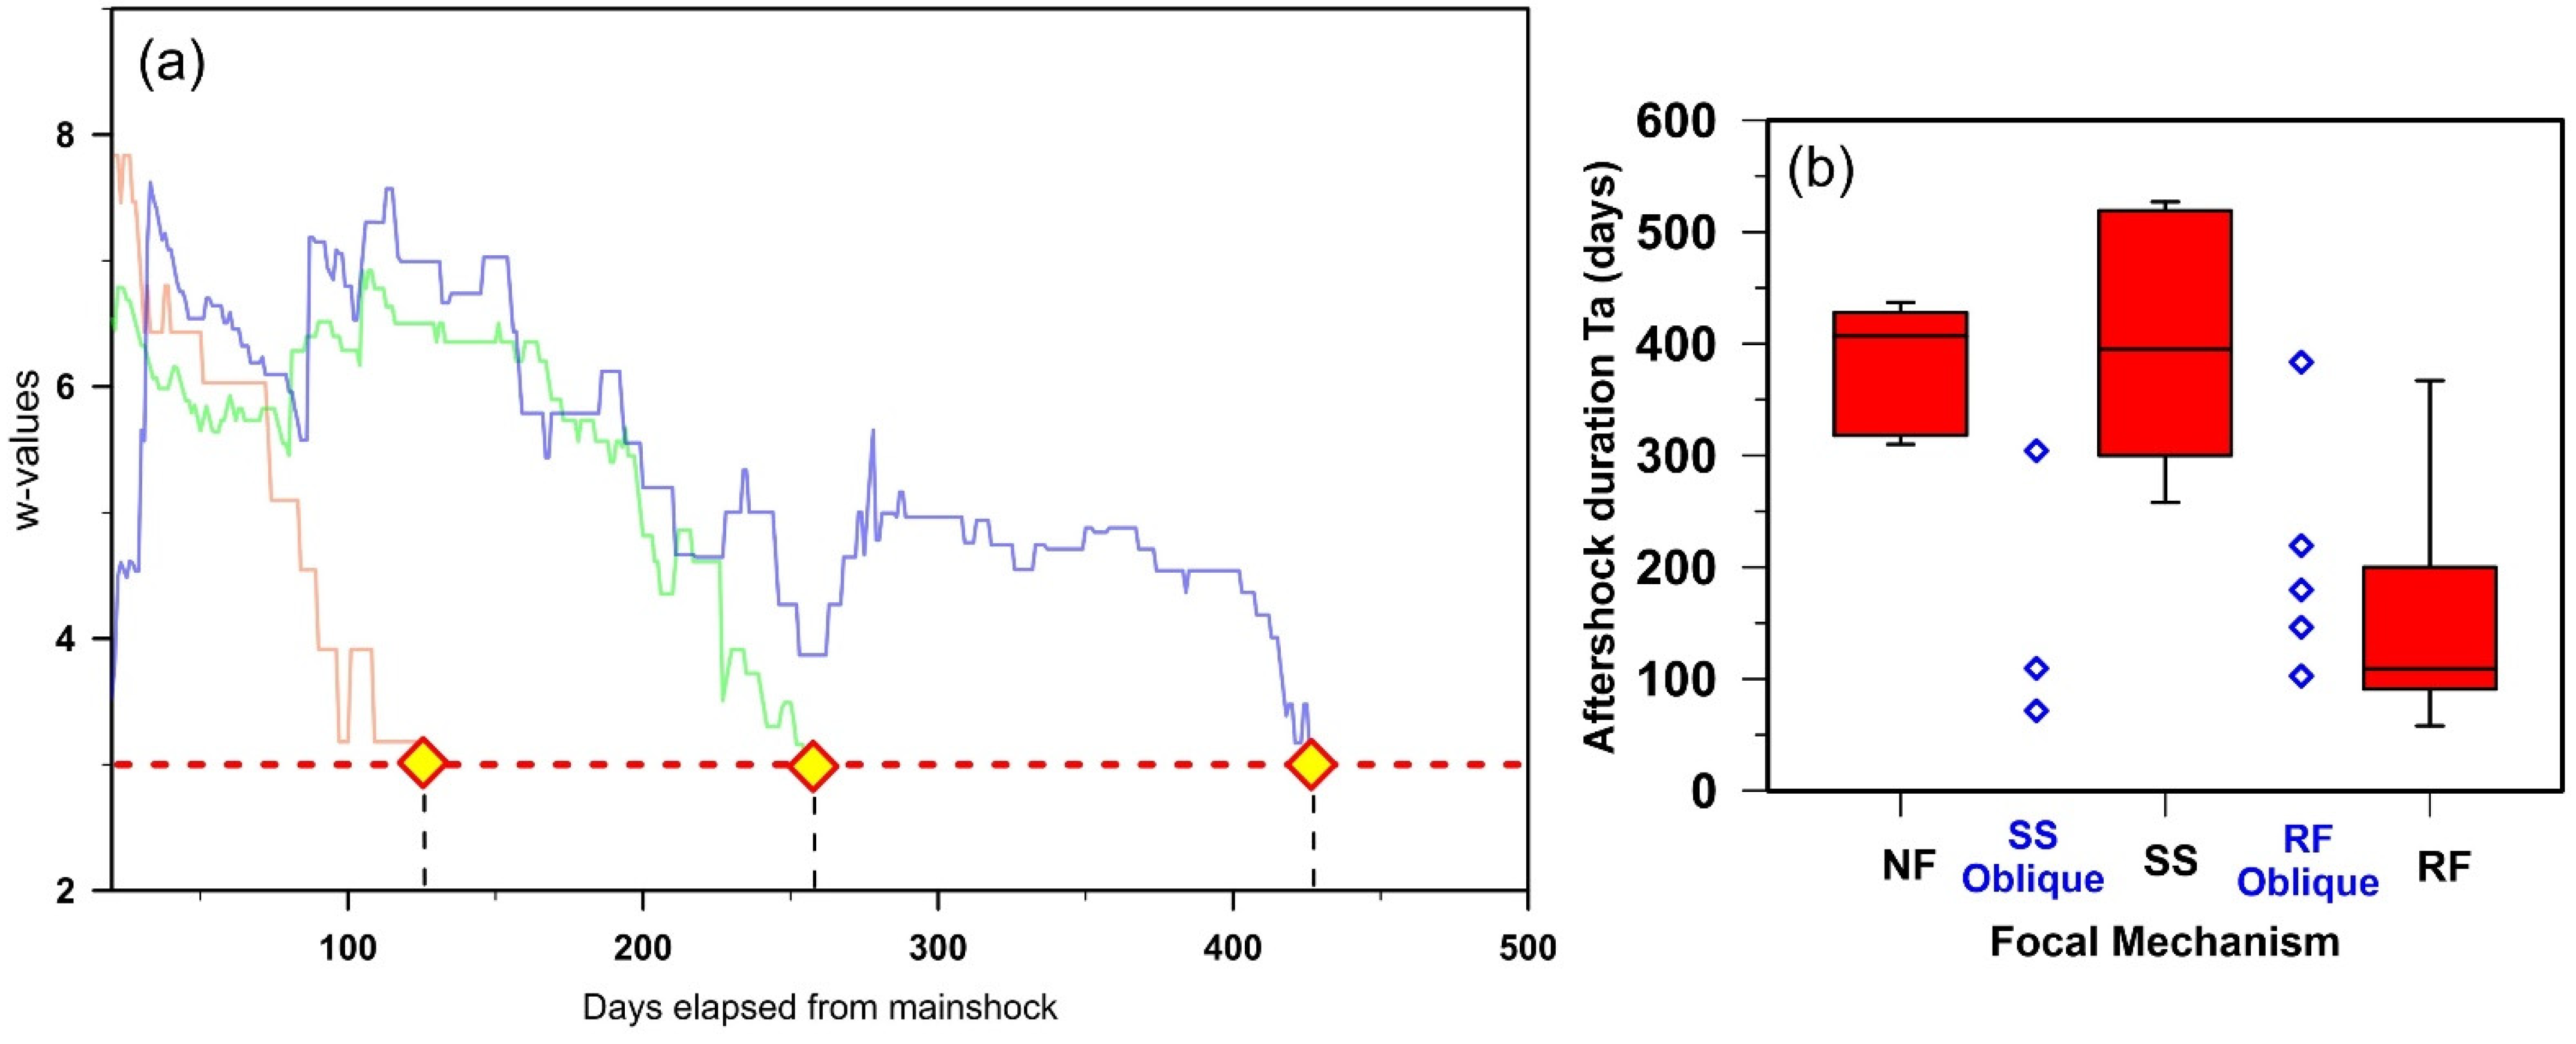
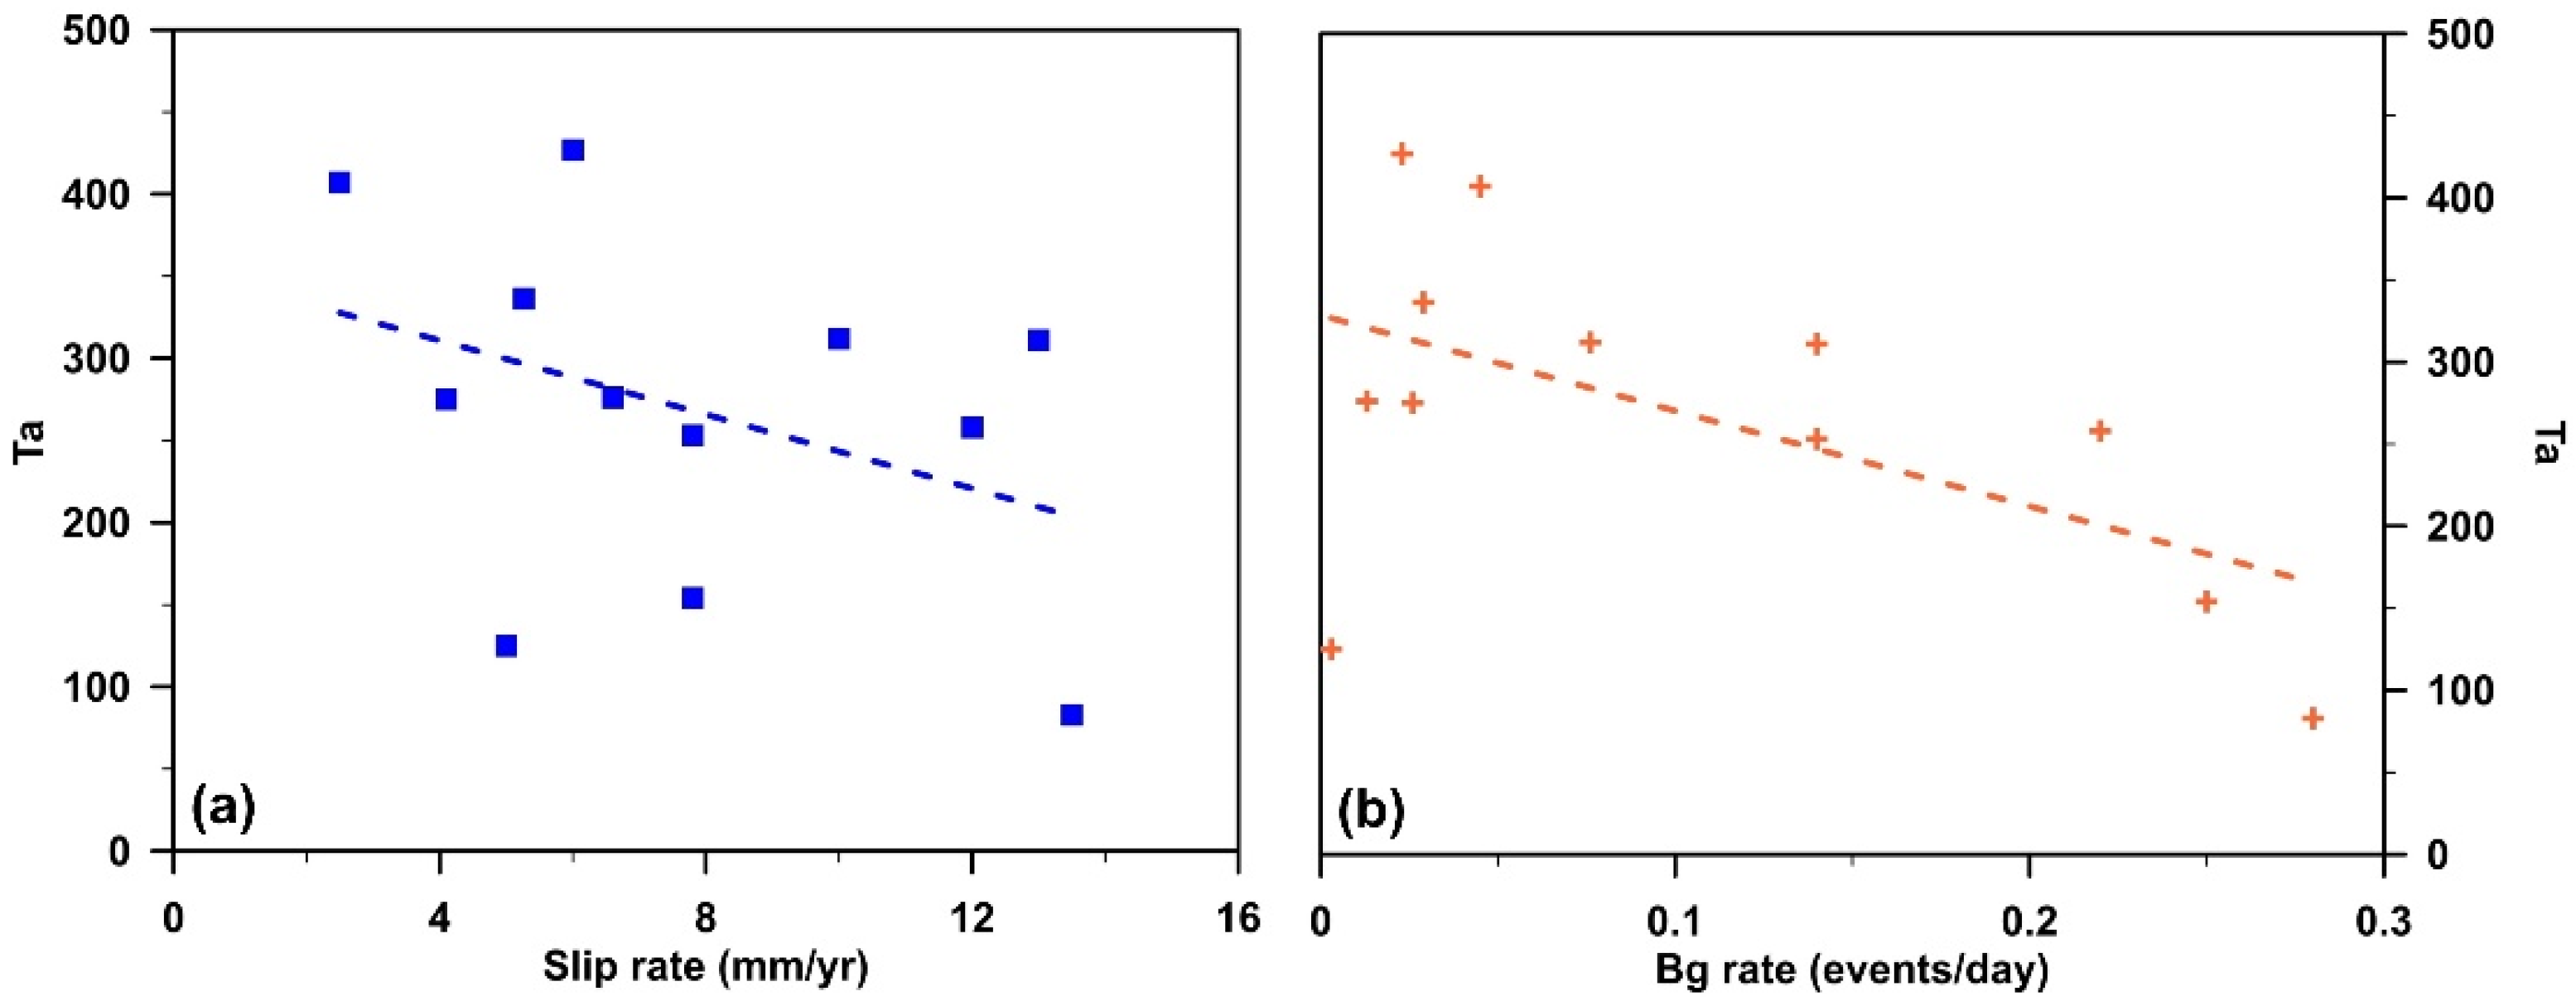
3.3. Aftershock Duration ()
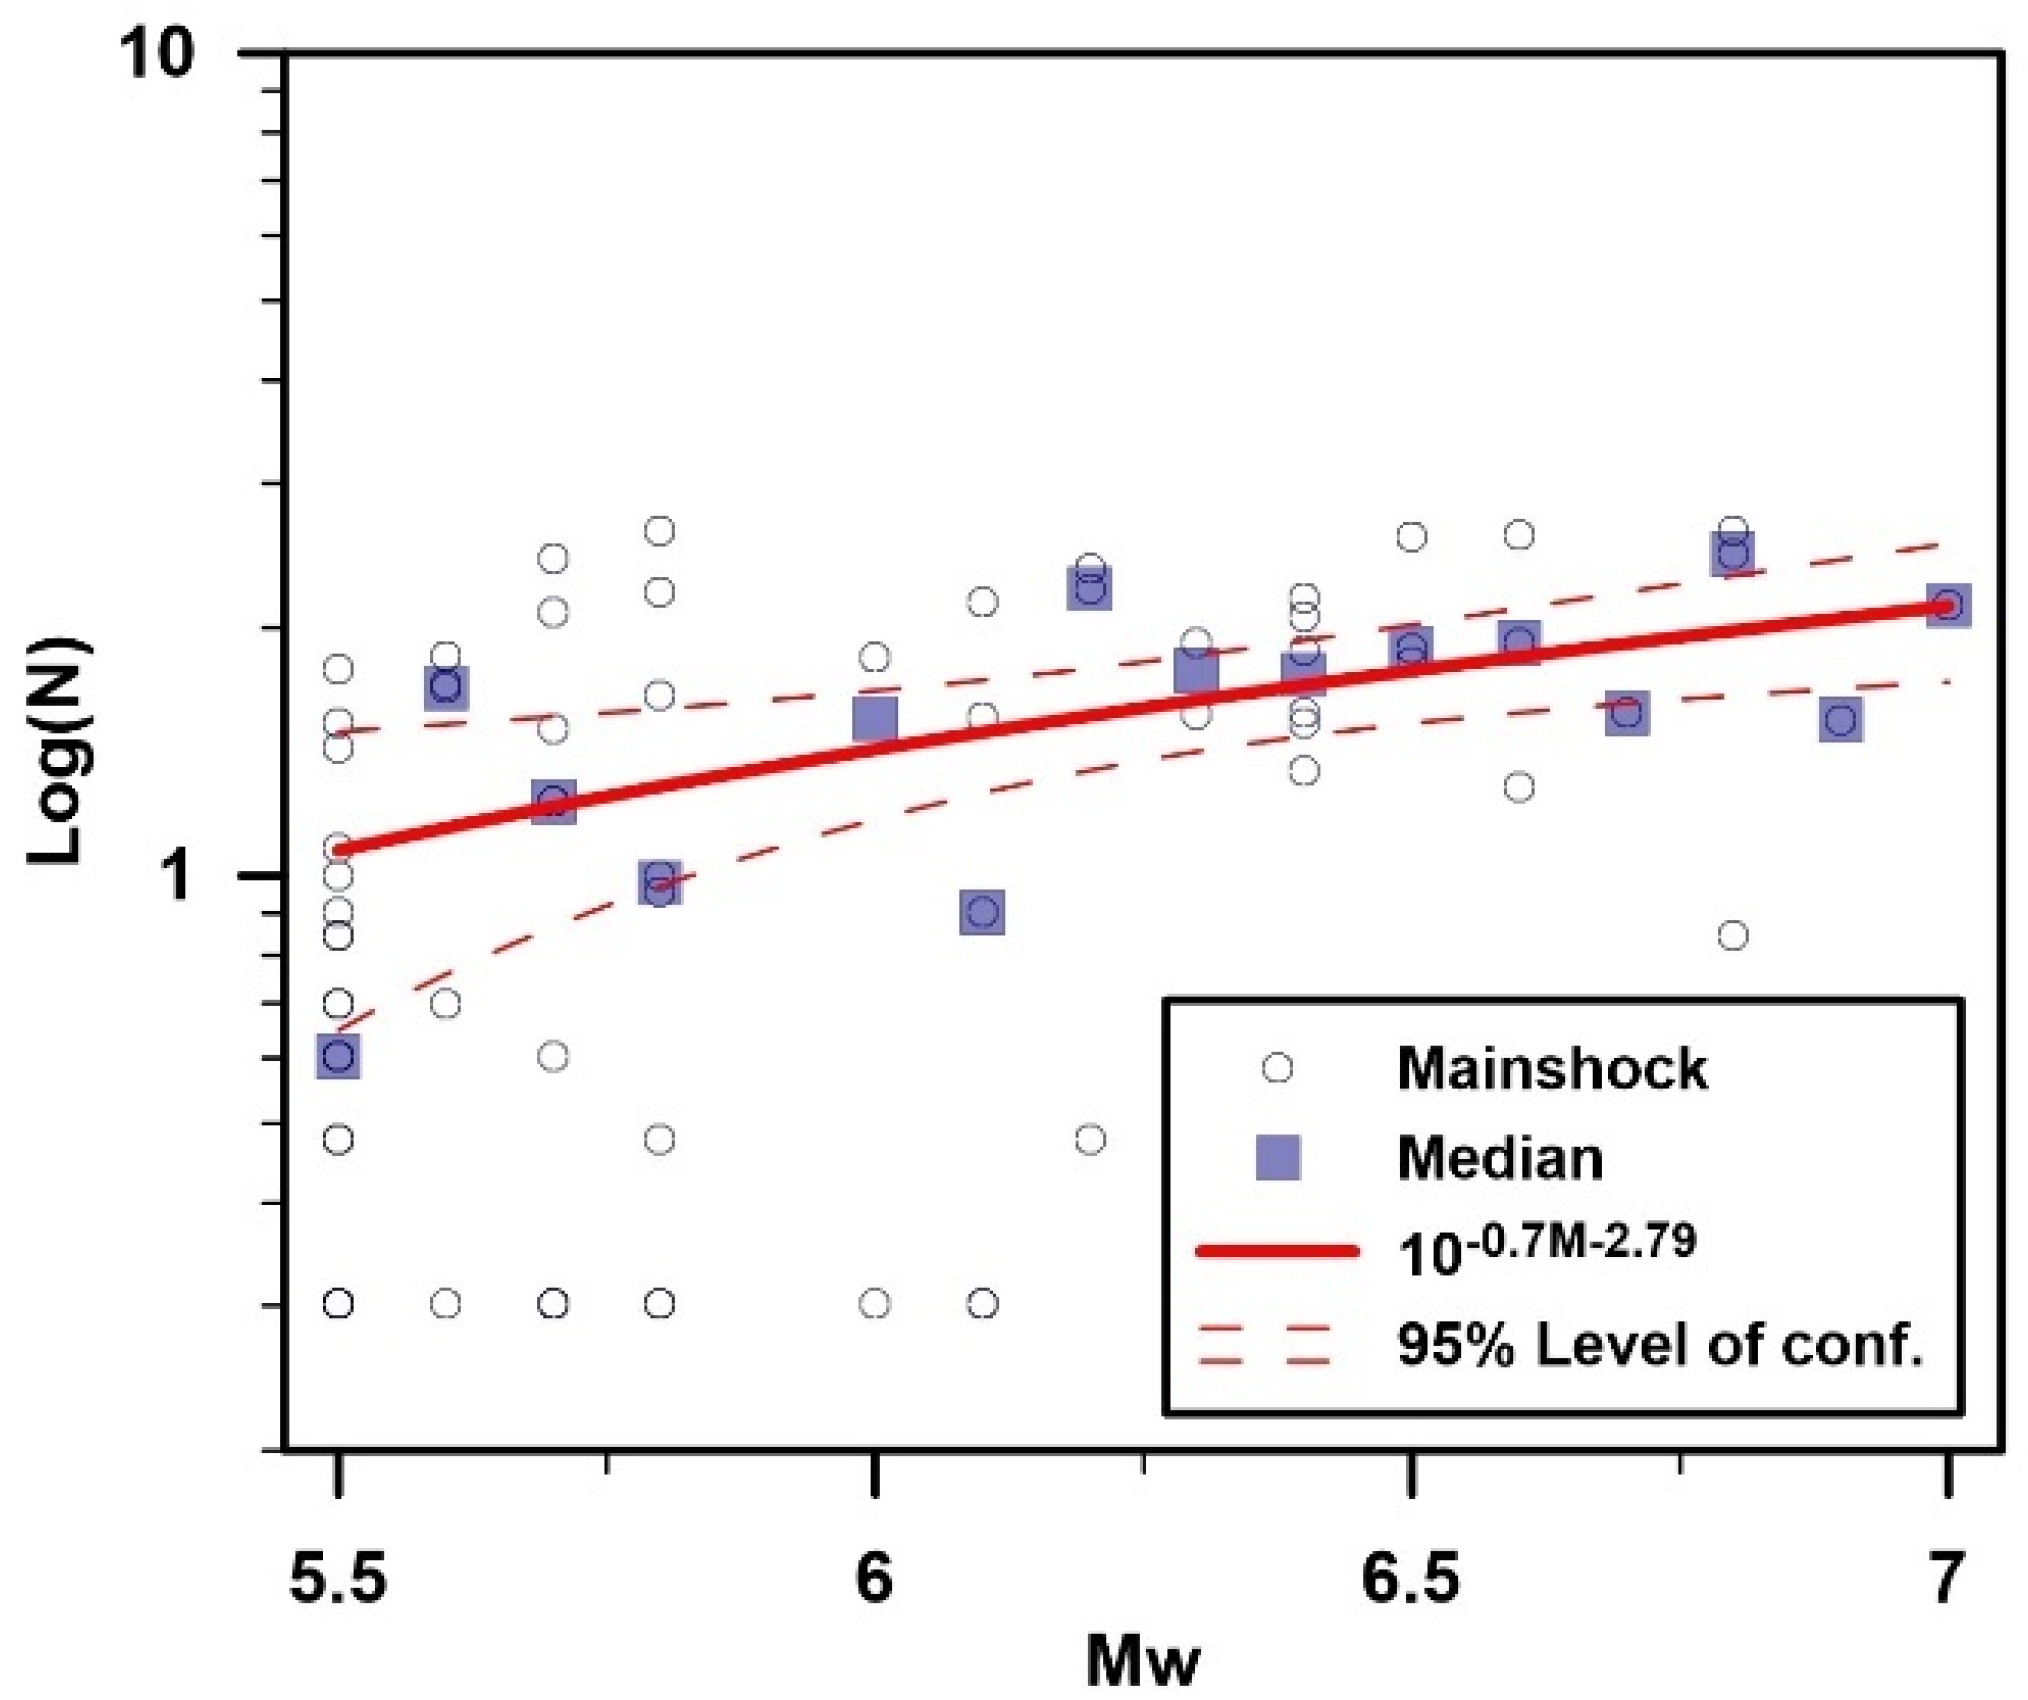
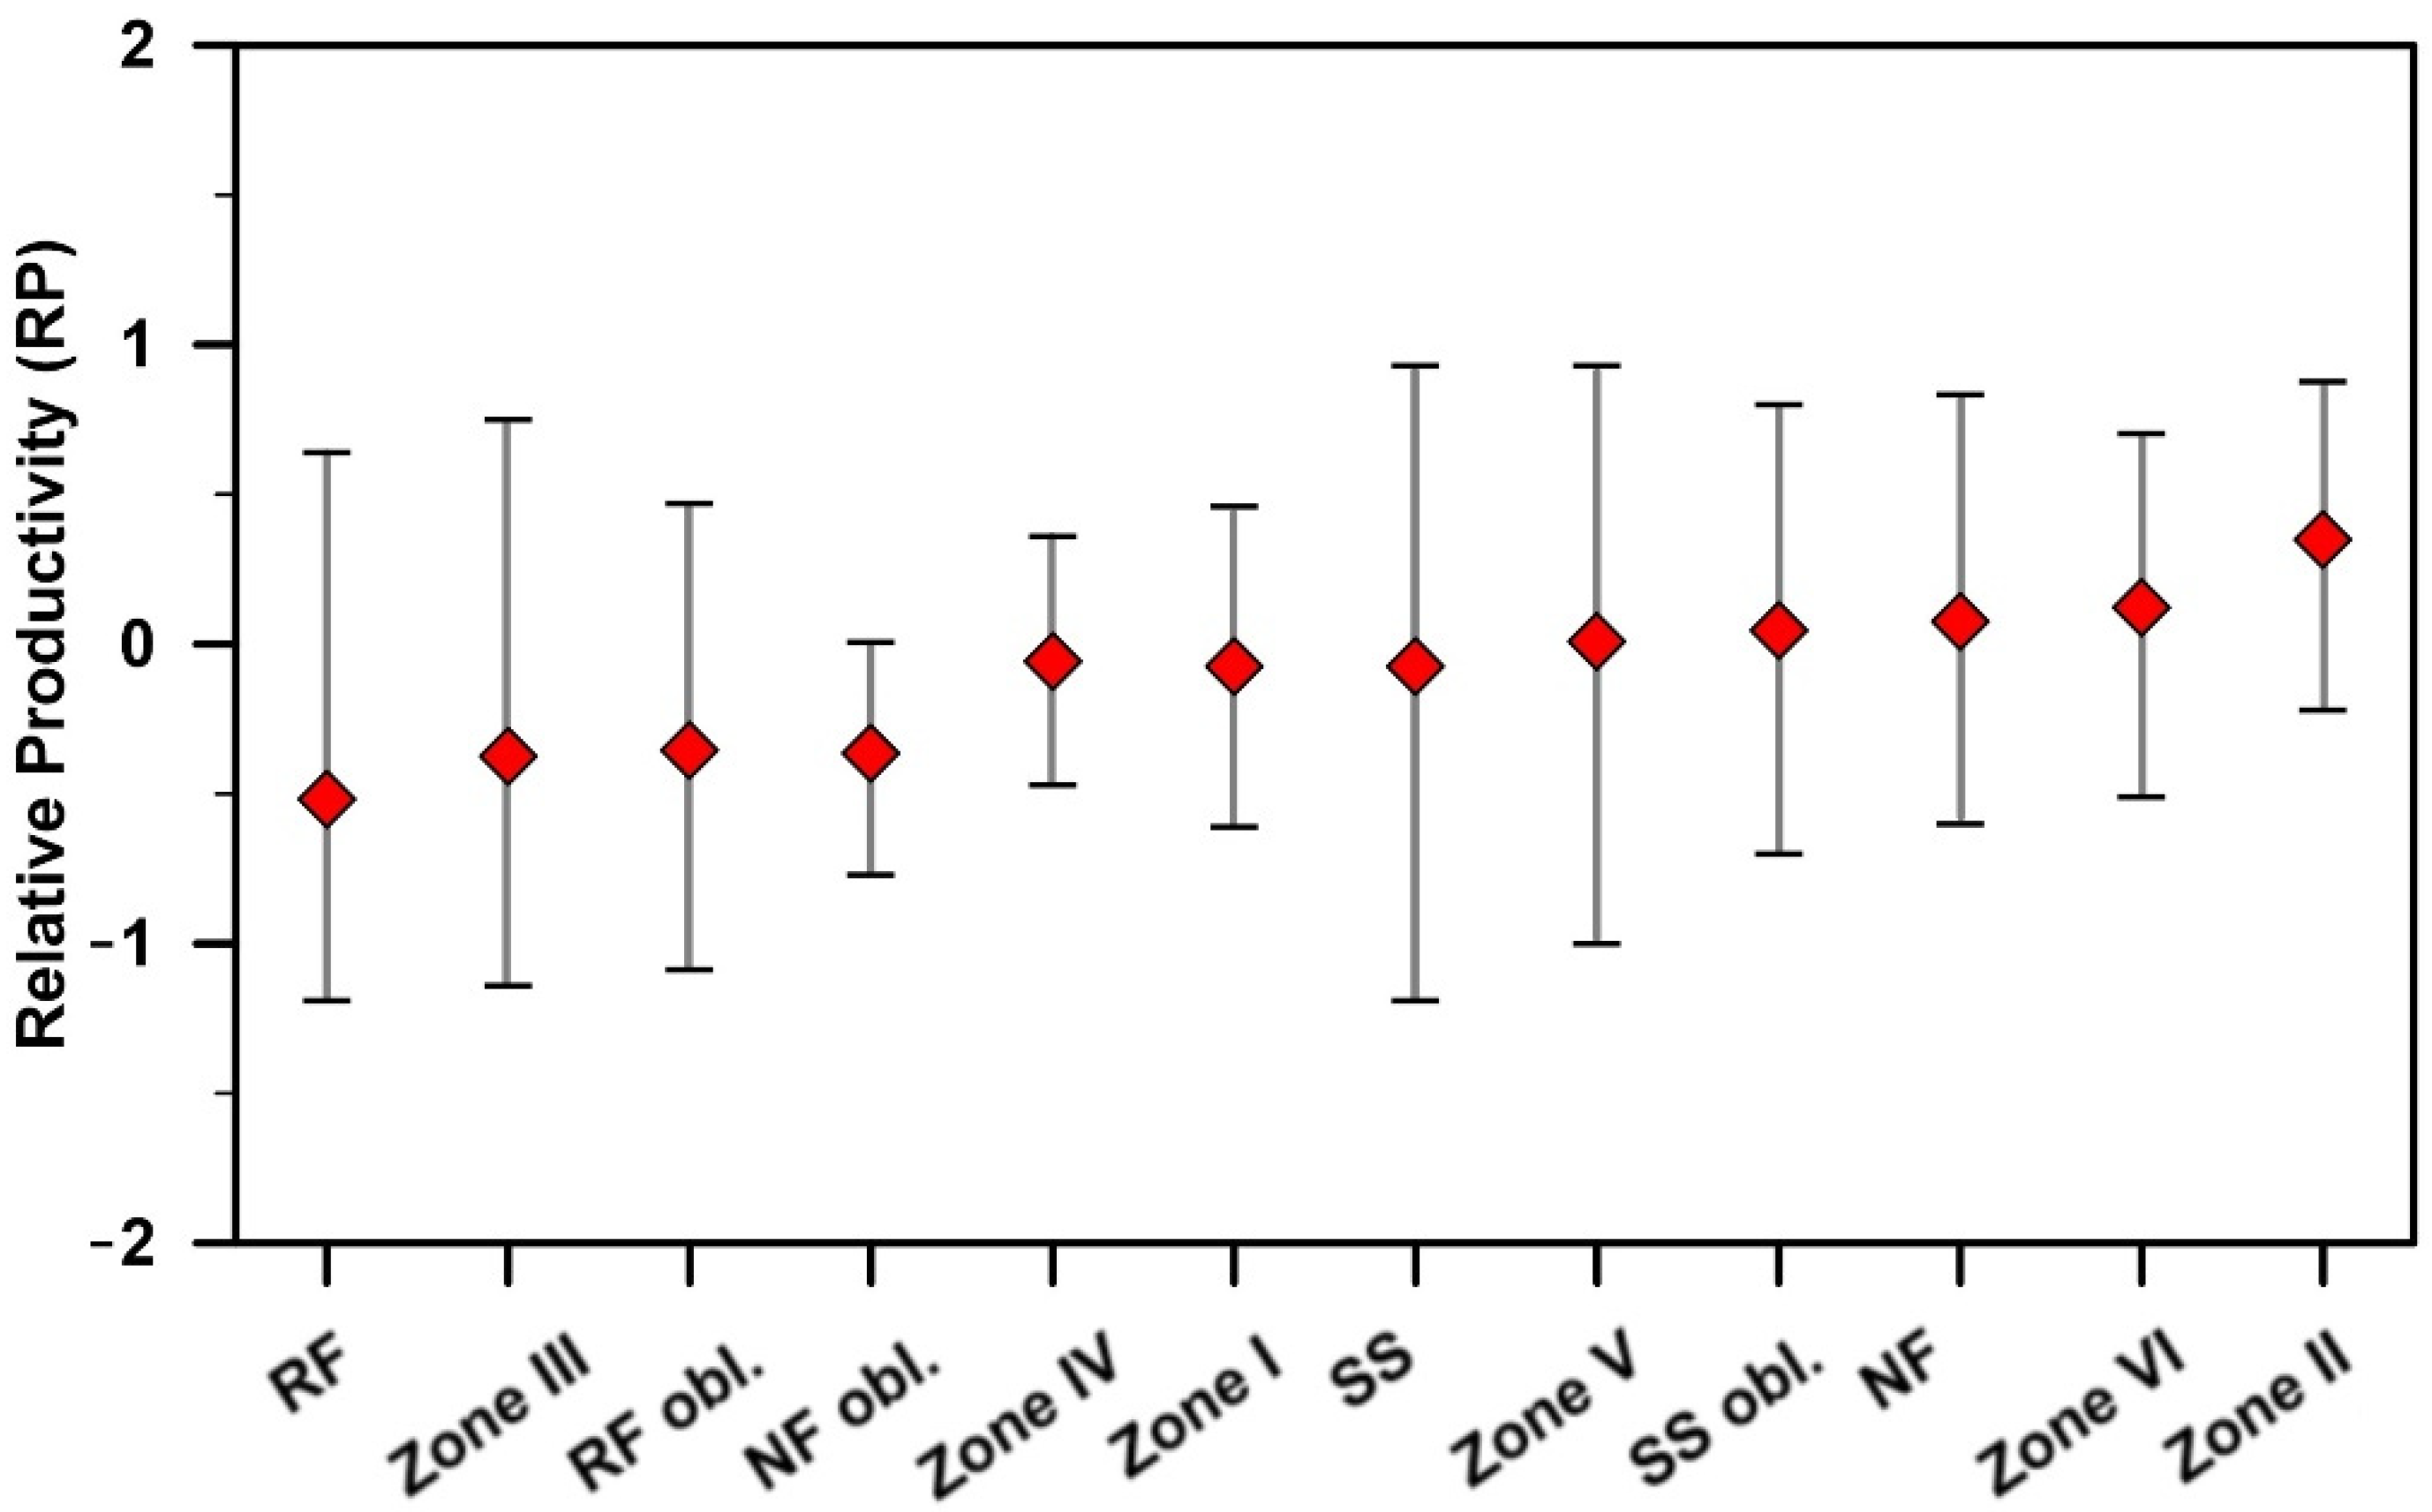
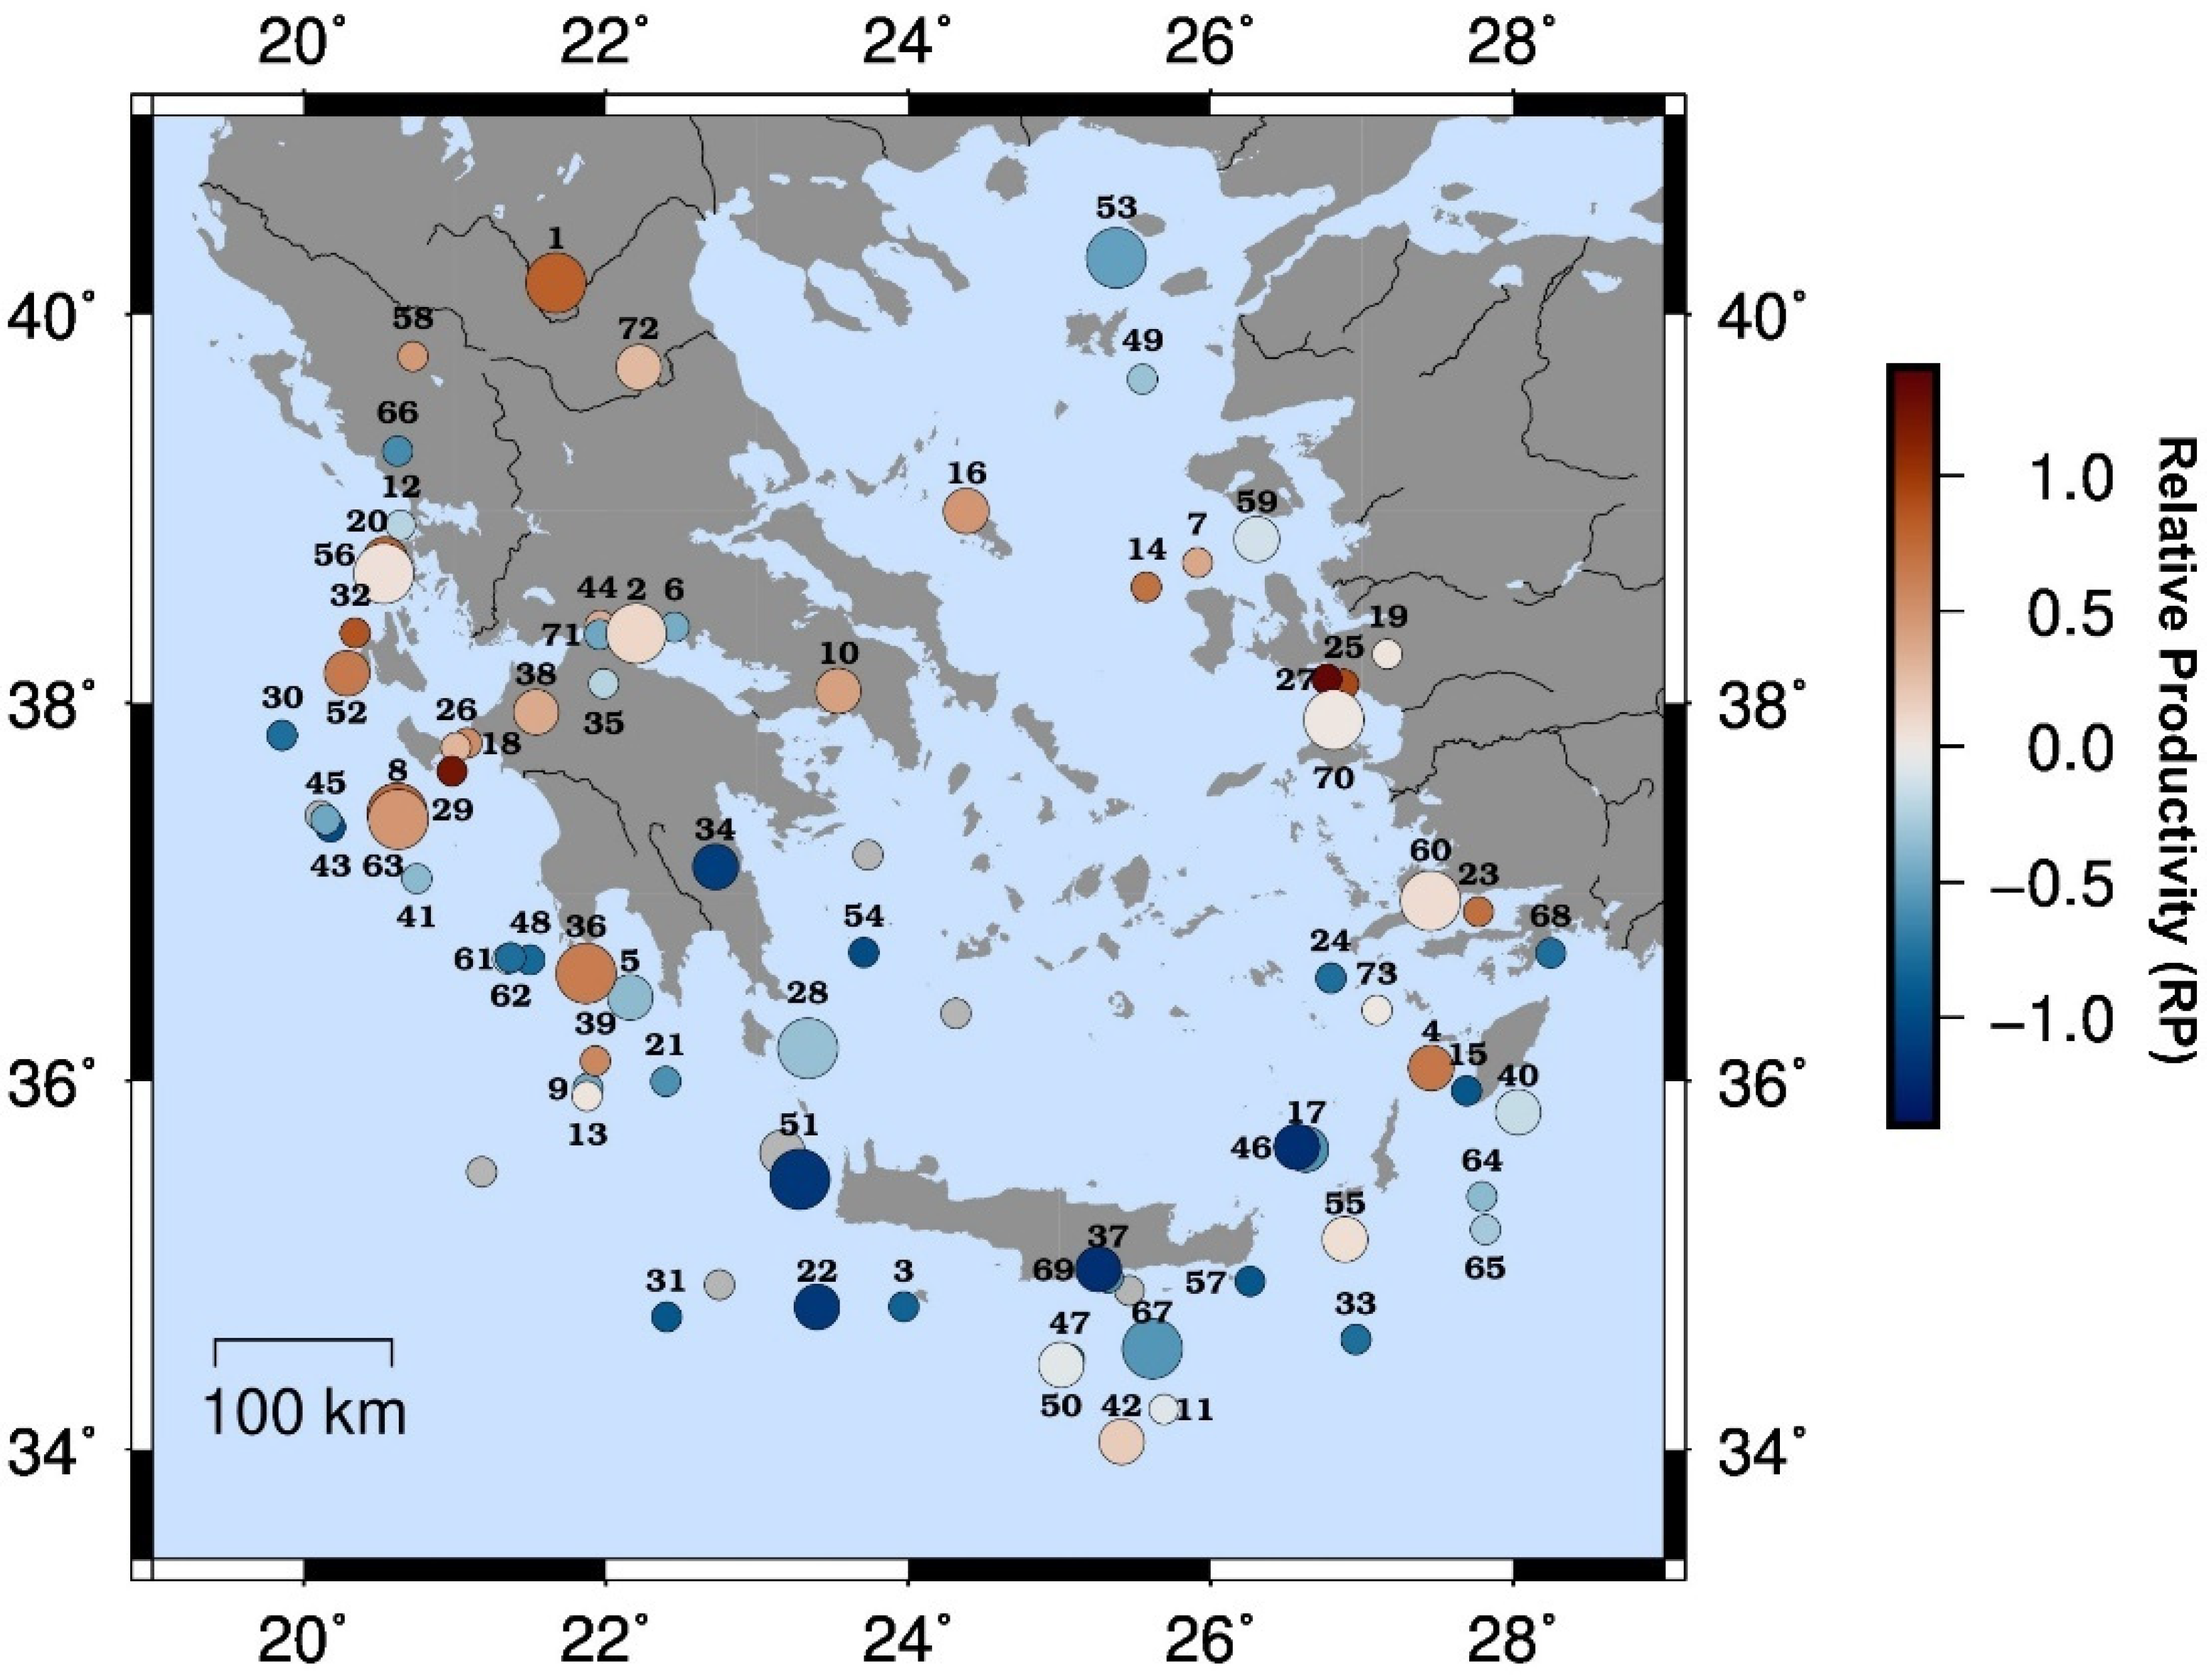
3.4. Relative Productivity (RP)
4. Discussion
5. Conclusions
Supplementary Materials
Author Contributions
Funding
Data Availability Statement
Acknowledgments
Conflicts of Interest
References
- Scholz, C.H. The Mechanics of Earthquakes and Faulting, 3rd ed.; Cambridge University Press: Oxford City, UK, 2019; ISBN 978-1-316-68147-3. [Google Scholar]
- Omori, F. On the Aftershocks of Earthquakes. J. Coll. Sci. Imp. Univ. Tokyo 1895, 7, 111–120. [Google Scholar]
- Utsu, T. A Statistical Study on the Occurrence of Aftershocks. Geophys. Mag. 1961, 30, 521–605. [Google Scholar]
- Kisslinger, C. Aftershocks and Fault-Zone Properties. In Advances in Geophysics; Elsevier: Amsterdam, The Netherlands, 1996; Volume 38, pp. 1–36. ISBN 978-0-12-018838-3. [Google Scholar]
- Reasenberg, P.A.; Jones, L.M. Earthquake Hazard after a Mainshock in California. Sci. New Ser. 1989, 243, 1173–1176. [Google Scholar] [CrossRef] [PubMed]
- Ommi, S.; Zafarani, H.; Zare, M. Aftershock Decay Rates in the Iranian Plateau. Pure Appl. Geophys. 2016, 173, 2305–2324. [Google Scholar] [CrossRef]
- Gutenberg, B.; Richter, C.F. Frequency of Earthquakes in California. Bull. Seismol. Soc. Am. 1944, 34, 185–188. [Google Scholar] [CrossRef]
- Schorlemmer, D.; Wiemer, S.; Wyss, M. Variations in Earthquake-Size Distribution across Different Stress Regimes. Nature 2005, 437, 539–542. [Google Scholar] [CrossRef] [PubMed]
- Scholz, C.H. On the Stress Dependence of the Earthquake b Value. Geophys. Res. Lett. 2015, 42, 1399–1402. [Google Scholar] [CrossRef]
- Zheng, Y.; Zhou, S. The Spatiotemporal Variation of the B-Value and Its Tectonic Implications in North China. Earthq. Sci. 2014, 27, 301–310. [Google Scholar] [CrossRef]
- Hatzidimitriou, P.; Papazachos, B.; Karakaisis, G. Quantitative Seismicity of the Aegean and Surrounding Area. In Proceedings of the XXIV Gen. Assembly of E.S.C., Athens, Greece, 19–24 September 1994; pp. 155–164. [Google Scholar]
- Papazachos, C. An Alternative Method for a Reliable Estimation of Seismicity with an Application in Greece and the Surrounding Area. Bull. Seismol. Soc. Am. 1999, 89, 111–119. [Google Scholar] [CrossRef]
- Vamvakaris, D.A.; Papazachos, C.B.; Papaioannou, C.A.; Scordilis, E.M.; Karakaisis, G.F. A Detailed Seismic Zonation Model for Shallow Earthquakes in the Broader Aegean Area. Nat. Hazards Earth Syst. Sci. 2016, 16, 55–84. [Google Scholar] [CrossRef]
- Båth, M. Lateral Inhomogeneities of the Upper Mantle. Tectonophysics 1965, 2, 483–514. [Google Scholar] [CrossRef]
- Vere-Jones, D. A Note on the Statistical Interpretation of Båth’s Law. Bull. Seismol. Soc. Am. 1969, 59, 1535–1541. [Google Scholar] [CrossRef]
- Lombardi, A.M. Probabilistic Interpretation of «Bath’s Law». Ann. Geophys. 2002, 45, 455–472. [Google Scholar] [CrossRef]
- Console, R.; Lombardi, A.M.; Murru, M.; Rhoades, D. Båth’s Law and the Self-Similarity of Earthquakes: BÅTH’S LAW. J. Geophys. Res. Solid Earth 2003, 108, 2128. [Google Scholar] [CrossRef]
- Drakatos, G.; Latoussakis, J. A Catalog of Aftershock Sequences in Greece (1971–1997): Their Spatial and Temporal Characteristics. J. Seismol. 2001, 5, 137–145. [Google Scholar] [CrossRef]
- Wells, D.L.; Coppersmith, K.J. New Empirical Relationships among Magnitude, Rupture Length, Rupture Width, Rupture Area, and Surface Displacement. Bull. Seismol. Soc. Am. 1994, 84, 974–1002. [Google Scholar]
- Page, M.T.; van der Elst, N.; Hardebeck, J.; Felzer, K.; Michael, A.J. Three Ingredients for Improved Global Aftershock Forecasts: Tectonic Region, Time-Dependent Catalog Incompleteness, and Intersequence Variability. Bull. Seismol. Soc. Am. 2016, 106, 2290–2301. [Google Scholar] [CrossRef]
- Kagan, Y.Y. Aftershock Zone Scaling. Bull. Seismol. Soc. Am. 2002, 92, 641–655. [Google Scholar] [CrossRef]
- Álvarez-Gómez, J.A. FMC—Earthquake Focal Mechanisms Data Management, Cluster and Classification. SoftwareX 2019, 9, 299–307. [Google Scholar] [CrossRef]
- Hardebeck, J.L.; Llenos, A.L.; Michael, A.J.; Page, M.T.; van der Elst, N. Updated California Aftershock Parameters. Seismol. Res. Lett. 2019, 90, 262–270. [Google Scholar] [CrossRef]
- McKenzie, D. Some Remarks on the Development of Sedimentary Basins. Earth Planet. Sci. Lett. 1978, 40, 25–32. [Google Scholar] [CrossRef]
- King, G.; Sturdy, D.; Whitney, J. The Landscape Geometry and Active Tectonics of Northwest Greece. Geol. Soc. Am. Bull. 1993, 105, 137–161. [Google Scholar] [CrossRef]
- Scordilis, E.M.; Karakaisis, G.F.; Karacostas, B.G.; Panagiotopoulos, D.G.; Comninakis, P.E.; Papazachos, B.C. Evidence for Transform Faulting in the Ionian Sea: The Cephalonia Island Earthquake Sequence of 1983. Pure Appl. Geophys. 1985, 123, 388–397. [Google Scholar] [CrossRef]
- Papadimitriou, P. Etude de La Structure Du Manteau Superieur de l’ Europe et Modelisation Des Ondes de Volume Engendrees Par Des Seismes Egeens. Ph.D. Thesis, University of Paris, Paris, France, 1988. [Google Scholar]
- Kiratzi, A.A.; Langston, C.A. Moment Tensor Inversion of the 1983 January 17 Kefallinia Event of Ionian Islands (Greece). Geophys. J. Int. 1991, 105, 529–535. [Google Scholar] [CrossRef]
- Sakkas, V.; Kapetanidis, V.; Kaviris, G.; Spingos, I.; Mavroulis, S.; Diakakis, M.; Alexopoulos, J.D.; Kazantzidou-Firtinidou, D.; Kassaras, I.; Dilalos, S.; et al. Seismological and Ground Deformation Study of the Ionian Islands (W. Greece) during 2014–2018, a Period of Intense Seismic Activity. Appl. Sci. 2022, 12, 2331. [Google Scholar] [CrossRef]
- Kiratzi, A.; Aktar, M.; Svigkas, N. The 10 June 2012 MW 6.0 Earthquake Sequence in the Easternmost End of the Hellenic Arc. Bull. Geol. Soc. Greece 2013, 47, 1138. [Google Scholar] [CrossRef]
- Kapetanidis, V.; Deschamps, A.; Papadimitriou, P.; Matrullo, E.; Karakonstantis, A.; Bozionelos, G.; Kaviris, G.; Serpetsidaki, A.; Lyon-Caen, H.; Voulgaris, N.; et al. The 2013 Earthquake Swarm in Helike, Greece: Seismic Activity at the Root of Old Normal Faults. Geophys. J. Int. 2015, 202, 2044–2073. [Google Scholar] [CrossRef]
- Mesimeri, M.; Karakostas, V.; Papadimitriou, E.; Tsaklidis, G.; Jacobs, K. Relocation of Recent Seismicity and Seismotectonic Properties in the Gulf of Corinth (Greece). Geophys. J. Int. 2018, 212, 1123–1142. [Google Scholar] [CrossRef]
- Kourouklas, C.; Mangira, O.; Console, R.; Papadimitriou, E.; Karakostas, V.; Murru, M. Short-Term Clustering Modeling of Seismicity in Eastern Aegean Sea (Greece): A Retrospective Forecast Test of the 2017 Mw = 6.4 Lesvos, 2017 Mw = 6.6 Kos and 2020 Mw = 7.0 Samos Earthquake Sequences. Acta Geophys. 2021, 69, 1085–1099. [Google Scholar] [CrossRef]
- Mountrakis, D.; Tranos, M.; Papazachos, C.; Thomaidou, E.; Karagianni, E.; Vamvakaris, D.A. Neotectonic and Seismological Data Concerning Major Active Faults, and the Stress Regimes of Northern Greece. In Development of the Eastern Mediterranean Region; Geological Society of London: London, UK, 2006; Volume 260, pp. 649–670. ISBN 978-1-86239-198-7. [Google Scholar]
- Dieterich, J. A Constitutive Law for Rate of Earthquake Production and Its Application to Earthquake Clustering. J. Geophys. Res. Solid Earth 1994, 99, 2601–2618. [Google Scholar] [CrossRef]
- Dieterich, J.H. Modeling of Rock Friction: 1. Experimental Results and Constitutive Equations. J. Geophys. Res. 1979, 84, 2161. [Google Scholar] [CrossRef]
- Hainzl, S.; Christophersen, A.; Rhoades, D.; Harte, D. Statistical Estimation of the Duration of Aftershock Sequences. Geophys. J. Int. 2016, 205, 1180–1189. [Google Scholar] [CrossRef]
- Sebastiani, G.; Govoni, A.; Pizzino, L. Aftershock Patterns in Recent Central Apennines Sequences. J. Geophys. Res. Solid Earth 2019, 124, 3881–3897. [Google Scholar] [CrossRef]
- Wiemer, S. Minimum Magnitude of Completeness in Earthquake Catalogs: Examples from Alaska, the Western United States, and Japan. Bull. Seismol. Soc. Am. 2000, 90, 859–869. [Google Scholar] [CrossRef]
- Lehmann, E.L. Elements of Large-Sample Theory; Springer Texts in Statistics; Springer: New York, NY, USA, 1999; ISBN 978-0-387-98595-4. [Google Scholar]
- Helmstetter, A. Is Earthquake Triggering Driven by Small Earthquakes? Phys. Rev. Lett. 2003, 91, 058501. [Google Scholar] [CrossRef] [PubMed]
- Felzer, K.R. A Common Origin for Aftershocks, Foreshocks, and Multiplets. Bull. Seismol. Soc. Am. 2004, 94, 88–98. [Google Scholar] [CrossRef]
- Dascher-Cousineau, K.; Brodsky, E.E.; Lay, T.; Goebel, T.H.W. What Controls Variations in Aftershock Productivity? J. Geophys. Res. Solid Earth 2020, 125, e2019JB018111. [Google Scholar] [CrossRef]
- Aki, K. Maximum Likelihood Estimate of b in the Formula LogN a—BM and Its Confidence Limits. Earthq. Res. Inst. Univ. Tokyo 1965, 43, 237–239. [Google Scholar]
- Drakopoulos, J. Characteristic Parameters of Fore- and Aftershock Sequences in the Area of Greece. Ph.D. Thesis, University of Athens, Athens, Greece, 1968. [Google Scholar]
- Tahir, M.; Grasso, J.-R.; Amorèse, D. The Largest Aftershock: How Strong, How Far Away, How Delayed?: BÅTH’S LAW. Geophys. Res. Lett. 2012, 39, L04301. [Google Scholar] [CrossRef]
- Toda, S.; Stein, R.S. Why Aftershock Duration Matters for Probabilistic Seismic Hazard Assessment. Bull. Seismol. Soc. Am. 2018, 108, 1414–1426. [Google Scholar] [CrossRef]
- Ziv, A. Does Aftershock Duration Scale with Mainshock Size? Geophys. Res. Lett. 2006, 33, L17317. [Google Scholar] [CrossRef]
- Godano, C.; Tramelli, A. How Long Is an Aftershock Sequence? Pure Appl. Geophys. 2016, 173, 2295–2304. [Google Scholar] [CrossRef]
- Karakostas, V.G.; Papadimitriou, E.E.; Tranos, M.D.; Papazachos, C.B. Active Seismotectonic Structures in the Area of Chios Island, North Aegean Sea, Revealed from Microseismicity and Fault Plane Solutions. Bull. Geol. Soc. Greece 2010, 43, 2064–2074. [Google Scholar] [CrossRef]
- Bountzis, P.; Papadimitriou, E.; Tsaklidis, G. Identification and Temporal Characteristics of Earthquake Clusters in Selected Areas in Greece. Appl. Sci. 2022, 12, 1908. [Google Scholar] [CrossRef]
- Karakostas, V.; Kostoglou, A.; Chorozoglou, D.; Papadimitriou, E. Relocation of the 2018 Zakynthos, Greece, Aftershock Sequence: Spatiotemporal Analysis Deciphering Mechanism Diversity and Aftershock Statistics. Acta Geophys. 2020, 68, 1263–1294. [Google Scholar] [CrossRef]
- Reilinger, R.; McClusky, S.; Vernant, P.; Lawrence, S.; Ergintav, S.; Cakmak, R.; Ozener, H.; Kadirov, F.; Guliev, I.; Stepanyan, R.; et al. GPS Constraints on Continental Deformation in the Africa-Arabia-Eurasia Continental Collision Zone and Implications for the Dynamics of Plate Interactions. J. Geophys. Res. Solid Earth 2006, 111, B05411. [Google Scholar] [CrossRef]
- Jenny, S.; Goes, S.; Giardini, D.; Kahle, H.-G. Earthquake Recurrence Parameters from Seismic and Geodetic Strain Rates in the Eastern Mediterranean. Geophys. J. Int. 2004, 157, 1331–1347. [Google Scholar] [CrossRef]
- Howell, A.; Palamartchouk, K.; Papanikolaou, X.; Paradissis, D.; Raptakis, C.; Copley, A.; England, P.; Jackson, J. The 2008 Methoni Earthquake Sequence: The Relationship between the Earthquake Cycle on the Subduction Interface and Coastal Uplift in SW Greece. Geophys. J. Int. 2017, 208, 1592–1610. [Google Scholar] [CrossRef]
- Papadimitriou, E.; Gospodinov, D.; Karakostas, V.; Astiopoulos, A. Evolution of the Vigorous 2006 Swarm in Zakynthos (Greece) and Probabilities for Strong Aftershocks Occurrence. J. Seismol. 2013, 17, 735–752. [Google Scholar] [CrossRef]
- Bocchini, G.M.; Novikova, T.; Papadopoulos, G.A.; Agalos, A.; Mouzakiotis, E.; Karastathis, V.; Voulgaris, N. Tsunami Potential of Moderate Earthquakes: The July 1, 2009 Earthquake (Mw 6.45) and Its Associated Local Tsunami in the Hellenic Arc. Pure Appl. Geophys. 2020, 177, 1315–1333. [Google Scholar] [CrossRef]
- Kiratzi, A.A. The 16 April 2015 MW6.1 Earthquake Sequence near Kasos Island at the Eastern Hellenic Subduction Zone. Bull. Geol. Soc. Greece 2016, 50, 1163. [Google Scholar] [CrossRef]
- Karakostas, V.G.; Papadimitriou, E.E.; Karakaisis, G.F.; Papazachos, C.B.; Scordilis, E.M.; Vargemezis, G.; Aidona, E. The 2001 Skyros, Northern Aegean, Greece, Earthquake Sequence: Off—Fault Aftershocks, Tectonic Implications, and Seismicity Triggering. Geophys. Res. Lett. 2003, 30, 12-1–12-14. [Google Scholar] [CrossRef]
- Kiratzi, A.; Tsakiroudi, E.; Benetatos, C.; Karakaisis, G. The 24 May 2014 (Mw6.8) Earthquake (North Aegean Trough): Spatiotemporal Evolution, Source and Slip Model from Teleseismic Data. Phys. Chem. Earth Parts ABC 2016, 95, 85–100. [Google Scholar] [CrossRef]
- Papadimitriou, P.; Kassaras, I.; Kaviris, G.; Tselentis, G.-A.; Voulgaris, N.; Lekkas, E.; Chouliaras, G.; Evangelidis, C.; Pavlou, K.; Kapetanidis, V.; et al. The 12th June 2017 Mw = 6.3 Lesvos Earthquake from Detailed Seismological Observations. J. Geodyn. 2018, 115, 23–42. [Google Scholar] [CrossRef]
- Karakostas, V.; Ilieva, M.; Kostoglou, A.; Tondaś, D.; Papadimitriou, E.; Mesimeri, M.; Koca, B. The 2017 Kos Sequence: Aftershocks Relocation and Coseismic Rupture Process Constrained from Joint Inversion of Seismological and Geodetic Observations. Tectonophysics 2022, 833, 229352. [Google Scholar] [CrossRef]
- Karakostas, V.; Tan, O.; Kostoglou, A.; Papadimitriou, E.; Bonatis, P. Seismotectonic Implications of the 2020 Samos, Greece, Mw 7.0 Mainshock Based on High-Resolution Aftershock Relocation and Source Slip Model. Acta Geophys. 2021, 69, 979–996. [Google Scholar] [CrossRef]
- Hatzfeld, D.; Karakostas, V.; Ziazia, M.; Selvaggi, G.; Leborgne, S.; Berge, C.; Guiguet, R.; Paul, A.; Voidomatis, P.; Diagnourtas, D.; et al. The Kozani-Grevena (Greece) Earthquake of 13 May 1995 Revisited from a Detailed Seismological Study. Bull. Seismol. Soc. Am. 1997, 87, 463–473. [Google Scholar] [CrossRef]
- Pavlou, K.; Kaviris, G.; Chousianitis, K.; Drakatos, G.; Kouskouna, V.; Makropoulos, K. Seismic Hazard Assessment in Polyphyto Dam Area (NW Greece) and Its Relation with the Earthquake of 13 May 1995 (Ms = 6.5, NW Greece). Nat. Hazards Earth Syst. Sci. 2013, 13, 141–149. [Google Scholar] [CrossRef]
- Kaviris, G.; Millas, C.; Spingos, I.; Kapetanidis, V.; Fountoulakis, I.; Papadimitriou, P.; Voulgaris, N.; Makropoulos, K. Observations of Shear-Wave Splitting Parameters in the Western Gulf of Corinth Focusing on the 2014 Mw = 5.0 Earthquake. Phys. Earth Planet. Inter. 2018, 282, 60–76. [Google Scholar] [CrossRef]
- Michas, G.; Kapetanidis, V.; Kaviris, G.; Vallianatos, F. Earthquake Diffusion Variations in the Western Gulf of Corinth (Greece). Pure Appl. Geophys. 2021, 178, 2855–2870. [Google Scholar] [CrossRef]
- Hainzl, S.; Zakharova, O.; Marsan, D. Impact of Aseismic Transients on the Estimation of Aftershock Productivity Parameters. Bull. Seismol. Soc. Am. 2013, 103, 1723–1732. [Google Scholar] [CrossRef]
- Amezawa, Y.; Maeda, T.; Kosuga, M. Migration Diffusivity as a Controlling Factor in the Duration of Earthquake Swarms. Earth Planets Space 2021, 73, 148. [Google Scholar] [CrossRef]
- Gomberg, J.; Bodin, P. The Productivity of Cascadia Aftershock Sequences. Bull. Seismol. Soc. Am. 2021, 111, 1494–1507. [Google Scholar] [CrossRef]
- Wetzler, N.; Brodsky, E.E.; Lay, T. Regional and Stress Drop Effects on Aftershock Productivity of Large Megathrust Earthquakes: Megathrust Aftershock Productivity. Geophys. Res. Lett. 2016, 43, 12012–12020. [Google Scholar] [CrossRef] [Green Version]
- Valerio, E.; Tizzani, P.; Carminati, E.; Doglioni, C. Longer Aftershocks Duration in Extensional Tectonic Settings. Sci. Rep. 2017, 7, 16403. [Google Scholar] [CrossRef]
- Doglioni, C.; Carminati, E.; Petricca, P.; Riguzzi, F. Normal Fault Earthquakes or Graviquakes. Sci. Rep. 2015, 5, 12110. [Google Scholar] [CrossRef] [PubMed]
- Bignami, C.; Valerio, E.; Carminati, E.; Doglioni, C.; Petricca, P.; Tizzani, P.; Lanari, R. Are Normal Fault Earthquakes Due to Elastic Rebound or Gravitational Collapse? Ann. Geophys. 2020, 63, 1–15. [Google Scholar] [CrossRef]
- Page, M.T.; van der Elst, N.J. Aftershocks Preferentially Occur in Previously Active Areas. Seism. Rec. 2022, 2, 100–106. [Google Scholar] [CrossRef]
- Laigle, M.; Sachpazi, M.; Hirn, A. Variation of Seismic Coupling with Slab Detachment and Upper Plate Structure along the Western Hellenic Subduction Zone. Tectonophysics 2004, 391, 85–95. [Google Scholar] [CrossRef]
- Briole, P.; Ganas, A.; Elias, P.; Dimitrov, D. The GPS Velocity Field of the Aegean. New Observations, Contribution of the Earthquakes, Crustal Blocks Model. Geophys. J. Int. 2021, 226, 468–492. [Google Scholar] [CrossRef]
- Hainzl, S.; Sippl, C.; Schurr, B. Linear Relationship between Aftershock Productivity and Seismic Coupling in the Northern Chile Subduction Zone. J. Geophys. Res. Solid Earth 2019, 124, 8726–8738. [Google Scholar] [CrossRef]
- Chouliaras, G.; Stavrakakis, G.N. Seismic Source Parameters from a New Dial-up Seismological Network in Greece. Pure Appl. Geophys. 1997, 150, 91–111. [Google Scholar] [CrossRef]
- Margaris, B.N. Source Spectral Scaling and Stress Release Estimates Using Strong-Motion Records in Greece. Bull. Seismol. Soc. Am. 2002, 92, 1040–1059. [Google Scholar] [CrossRef]
- Bernard, P.; Briole, P.; Meyer, B.; Lyon-Caen, H.; Cattin, R.; Hatzfeld, D.; Lachet, C.; Lebrun, B.; Deschamps, A.; Courboulex, F.; et al. The Ms = 6.2, 15 June 1995 Aigion Earthquake (Greece): Evidence for Low Angle Normal Faulting in the Corinth Rift. J. Seismol. 1997, 1, 131–150. [Google Scholar] [CrossRef]


| No | Year | Month | Day | Lat (°) | Lon (°) | FM | |
|---|---|---|---|---|---|---|---|
| 1 | 1995 | 5 | 13 | 40.160 | 21.670 | 6.5 | N |
| 2 | 1995 | 6 | 15 | 38.362 | 22.200 | 6.5 | N |
| 3 | 1995 | 12 | 7 | 34.780 | 23.970 | 5.6 | R |
| 4 | 1996 | 7 | 20 | 36.070 | 27.459 | 6.2 | N |
| 5 | 1997 | 10 | 13 | 36.446 | 22.160 | 6.4 | R |
| 6 | 1997 | 11 | 5 | 38.395 | 22.452 | 5.6 | N-SS |
| 7 | 1997 | 11 | 14 | 38.729 | 25.913 | 5.8 | SS-N |
| 8 | 1997 | 11 | 18 | 37.422 | 20.619 | 6.6 | R |
| 9 | 1998 | 4 | 29 | 35.961 | 21.880 | 5.5 | R-SS |
| 10 | 1999 | 9 | 7 | 38.062 | 23.537 | 6 | N |
| 11 | 2000 | 4 | 5 | 34.220 | 25.690 | 5.5 | R |
| 12 | 2000 | 5 | 24 | 35.918 | 21.875 | 5.7 | SS |
| 13 | 2000 | 5 | 26 | 38.922 | 20.640 | 5.5 | R |
| 14 | 2001 | 6 | 10 | 38.603 | 25.574 | 5.6 | SS |
| 15 | 2001 | 6 | 23 | 35.947 | 27.693 | 5.7 | SS |
| 16 | 2001 | 7 | 26 | 38.995 | 24.382 | 6.4 | SS |
| 17 | 2002 | 1 | 22 | 35.634 | 26.628 | 6.1 | N |
| 18 | 2002 | 12 | 2 | 37.790 | 21.081 | 5.6 | SS-N |
| 19 | 2003 | 4 | 10 | 38.255 | 27.169 | 5.7 | SS-N |
| 20 | 2003 | 8 | 14 | 38.744 | 20.539 | 6.2 | SS-N |
| 21 | 2003 | 10 | 17 | 35.998 | 22.396 | 5.5 | R |
| 22 | 2004 | 3 | 17 | 34.779 | 23.397 | 6 | SS |
| 23 | 2004 | 8 | 4 | 36.902 | 27.772 | 5.5 | N |
| 24 | 2004 | 10 | 7 | 36.55 | 26.796 | 5.5 | R-SS |
| 25 | 2005 | 10 | 17 | 38.097 | 26.881 | 5.8 | SS |
| 26 | 2005 | 10 | 18 | 37.768 | 21.007 | 5.7 | R |
| 27 | 2005 | 10 | 20 | 38.124 | 26.768 | 5.8 | SS |
| 28 | 2006 | 1 | 8 | 36.174 | 23.334 | 6.7 | R-SS |
| 29 | 2006 | 3 | 14 | 37.831 | 19.857 | 5.5 | R-SS |
| 30 | 2006 | 4 | 12 | 37.643 | 20.981 | 5.7 | SS |
| 31 | 2007 | 1 | 18 | 34.724 | 22.402 | 5.7 | R |
| 32 | 2007 | 3 | 25 | 38.364 | 20.340 | 5.7 | SS-R |
| 33 | 2007 | 5 | 21 | 34.602 | 26.961 | 5.5 | R |
| 34 | 2008 | 1 | 6 | 37.139 | 22.726 | 6.2 | R-SS |
| 35 | 2008 | 2 | 4 | 38.101 | 21.985 | 5.5 | N |
| 36 | 2008 | 2 | 14 | 36.575 | 21.868 | 6.8 | R |
| 37 | 2008 | 3 | 28 | 34.938 | 25.322 | 5.5 | R |
| 38 | 2008 | 6 | 8 | 37.952 | 21.537 | 6.4 | SS |
| 39 | 2008 | 6 | 21 | 36.108 | 21.929 | 5.6 | R |
| 40 | 2008 | 7 | 15 | 35.832 | 28.034 | 6.4 | SS-N |
| 41 | 2009 | 2 | 16 | 37.077 | 20.749 | 5.5 | R-SS |
| 42 | 2009 | 7 | 1 | 34.042 | 25.411 | 6.4 | R |
| 43 | 2009 | 11 | 3 | 37.349 | 20.176 | 5.8 | R |
| 44 | 2010 | 1 | 18 | 38.404 | 21.961 | 5.5 | N |
| 45 | 2010 | 8 | 22 | 37.389 | 20.145 | 5.5 | R |
| 46 | 2011 | 4 | 1 | 35.646 | 26.569 | 6.1 | SS |
| 47 | 2011 | 11 | 23 | 34.493 | 25.067 | 5.5 | N-SS |
| 48 | 2012 | 4 | 16 | 36.646 | 21.497 | 5.8 | R |
| 49 | 2013 | 1 | 8 | 39.670 | 25.55 | 5.8 | SS |
| 50 | 2013 | 6 | 15 | 34.464 | 25.011 | 6.3 | R |
| 51 | 2013 | 10 | 12 | 35.471 | 23.281 | 6.8 | R |
| 52 | 2014 | 1 | 26 | 38.154 | 20.287 | 6.1 | SS |
| 53 | 2014 | 5 | 24 | 40.286 | 25.375 | 6.9 | SS |
| 54 | 2014 | 8 | 29 | 36.685 | 23.706 | 5.8 | SS |
| 55 | 2015 | 4 | 16 | 35.146 | 26.888 | 6.1 | R-SS |
| 56 | 2015 | 11 | 17 | 38.673 | 20.53 | 6.5 | SS-R |
| 57 | 2016 | 5 | 25 | 34.918 | 26.261 | 5.7 | N |
| 58 | 2016 | 10 | 15 | 39.786 | 20.723 | 5.5 | R |
| 59 | 2017 | 6 | 12 | 38.849 | 26.305 | 6.4 | N |
| 60 | 2017 | 7 | 20 | 36.959 | 27.453 | 6.6 | N |
| 61 | 2018 | 6 | 25 | 36.651 | 21.35 | 5.5 | SS |
| 62 | 2018 | 9 | 27 | 36.659 | 21.369 | 5.5 | SS-N |
| 63 | 2018 | 10 | 25 | 37.39 | 20.625 | 6.8 | R-SS |
| 64 | 2020 | 1 | 30 | 35.377 | 27.795 | 5.5 | N |
| 65 | 2020 | 1 | 30 | 35.198 | 27.819 | 5.8 | N-SS |
| 66 | 2020 | 3 | 21 | 39.304 | 20.621 | 5.7 | R |
| 67 | 2020 | 5 | 2 | 34.551 | 25.614 | 6.6 | R |
| 68 | 2020 | 6 | 28 | 36.683 | 28.249 | 5.5 | SS-R |
| 69 | 2020 | 9 | 18 | 34.984 | 25.256 | 6.1 | R |
| 70 | 2020 | 10 | 30 | 37.911 | 26.814 | 7 | N |
| 71 | 2021 | 2 | 17 | 38.357 | 21.957 | 5.5 | N |
| 72 | 2021 | 3 | 3 | 39.732 | 22.218 | 6.3 | N |
| 73 | 2021 | 6 | 21 | 36.379 | 27.101 | 5.5 | N-SS |
Publisher’s Note: MDPI stays neutral with regard to jurisdictional claims in published maps and institutional affiliations. |
© 2022 by the authors. Licensee MDPI, Basel, Switzerland. This article is an open access article distributed under the terms and conditions of the Creative Commons Attribution (CC BY) license (https://creativecommons.org/licenses/by/4.0/).
Share and Cite
Bonatis, P.; Karakostas, V.G.; Papadimitriou, E.E.; Kaviris, G. Investigation of the Factors Controlling the Duration and Productivity of Aftershocks Following Strong Earthquakes in Greece. Geosciences 2022, 12, 328. https://0-doi-org.brum.beds.ac.uk/10.3390/geosciences12090328
Bonatis P, Karakostas VG, Papadimitriou EE, Kaviris G. Investigation of the Factors Controlling the Duration and Productivity of Aftershocks Following Strong Earthquakes in Greece. Geosciences. 2022; 12(9):328. https://0-doi-org.brum.beds.ac.uk/10.3390/geosciences12090328
Chicago/Turabian StyleBonatis, Pavlos, Vasileios G. Karakostas, Eleftheria E. Papadimitriou, and George Kaviris. 2022. "Investigation of the Factors Controlling the Duration and Productivity of Aftershocks Following Strong Earthquakes in Greece" Geosciences 12, no. 9: 328. https://0-doi-org.brum.beds.ac.uk/10.3390/geosciences12090328