

Why Engineers Should Not Attempt to Quantify GSI


Norman B. Keevil Institute of Mining Engineering, University of British Columbia, Vancouver, BC V6T 1Z4, Canada
*
Author to whom correspondence should be addressed.
Geosciences 2022, 12(11), 417; https://0-doi-org.brum.beds.ac.uk/10.3390/geosciences12110417
Submission received: 15 October 2022
/
Revised: 7 November 2022
/
Accepted: 8 November 2022
/
Published: 11 November 2022
(This article belongs to the Collection New Advances in Geotechnical Engineering)
Abstract
:In the past decade, there has been an increasing trend of digitalizing rock engineering processes. However, this process has not been accompanied by a critical analysis of the very same empirical methods that many complex numerical and digital methods are founded upon. As engineers, we are taught to use and trust numbers. Indeed, we would not be able to define the factor of the safety of a structure without numbers. However, what happens when those numbers are nothing but numerical descriptions of qualitative assessments? In this paper we present a critical review of the many attempts presented in the literature to quantify GSI (geological strength index). To the authors’ knowledge, this paper represents the first time that all the different GSI tables and quantification methods that have been proposed over the past two decades are collated and compared critically. In our critique, we argue against the paradigm whereby the quantification process adds the experience factor for inexperienced engineers. Furthermore, we discuss the limitations of the notion that GSI quantification methods could transform subjectivity into objectivity since the parameters under considerations are not quantitative measurements. Relying on empirically defined quantitative equivalences raises important questions, particularly when these quantitative equivalences are being used to define so-called accurate rock mass classification input for design purposes.
1. Introduction
In the past decade, there has been an increasing trend of digitalizing rock engineering processes [1]. However, this process has not been accompanied by a critical analysis of the very same empirical methods that many complex numerical and digital methods are founded upon. As engineers, we use and trust numbers. However, what happens when [2] “those numbers are nothing but numerical descriptions of qualitative assessments?” There is no doubt that the geological nature of the materials we use in our design creates a condition by which we need to trust our observations, experiences, and engineering judgements. However, only a very limited set of these processes are truly objective and the design approach is inevitably impacted by human factors and a cognitive resistance to changes. Elmo et al. [2] defined this cognitive resistance rock engineering fragility, adding that engineering judgment is not immune to biases.
It is important to recognize the role that the quantification process plays in the context of discerning knowns from unknowns. As engineers, we learn that different forms of uncertainty exist at different stages of the design process. It is important that we do not attempt to quantify qualitative methods just to convince ourselves that by doing so we can change unknowns into knowns. More importantly, a quantification process neither creates experience for inexperienced engineers, nor can it transform subjectivity into objectivity when the parameters under considerations are not measurements of a physical property.
In this paper, we present a critical review of the many attempts presented in the literature to quantify GSI (geological strength index [3,4]) and we argue against the paradigm whereby these quantification processes are justified on the basis of adding objectivity to inherently subjective interpretations. To the authors’ knowledge, this paper represents the first time that all the different GSI tables and quantification methods that have been proposed over the past two decades are collated and compared critically. It is important to emphasize that our critique does not concern the use of the original GSI table, rather the idea that a quantification of GSI creates an advantage for the engineers using it. Nonetheless, engineers should be aware of the limitations concerning the use of GSI to analyze rock mass behavior [5,6].
We believe that, to rely on empirically defined quantitative equivalences, raises important questions, particularly when these quantitative equivalences are being used to define so called accurate rock mass classification input for design purposes. Any quantification process inevitably leads to the belief that rock engineering design is governed by a unique set of objective and deterministic rules. Indeed, GSI quantification attempts and the process of homogenization of rock mass properties by means of continuum numerical methods are mutually interconnected.
The motivation behind this paper can be described by one critical question: Is it really necessary to quantify GSI, or does the search for a quantified GSI just reflect the belief that we can reasonably approximate jointed rock masses to isotropic equivalent continuum media, and that we can actually transform qualitative geological assessments into measurements?
1.1. Important Definitions
Engineering is not immune to the power of language. Therefore, before proceeding further with our discussion, it is important to review how specific terminology can create a different perception in the mind of an audience [2]. As discussed in [7], the use of specific terminology can create a sort of scientific advantage when presenting engineering problems. Examples of commonly misused terminology and their definitions are provided below:
- Quantity. A quantity in the physical sciences is often a property that has both a numerical magnitude and a unit. Key features of quantities include additivity and continuity. An example of a quantity is length (e.g., the width of a table is 20 (numerical magnitude) centimeters (unit)). This quantity is additive and continuous [8]. In contrast, empirical classifications used in rock engineering (e.g., RQD [9], RMR [10,11], Q-system [12], and GSI [3,4,13]) contain a numerical magnitude, but they remain dimensionless properties that are not additive (e.g., it would be meaningless to say that adding a GSI of 50 and a GSI of 30 would yield a GSI of 80) or continuous (ratings used in classification schemes are ordinal measurements, in which the measurement represents an ordered relationship among the variable’s observations). While dimensionless quantities can be found in other fields and includes countable numbers, ratios, proportions, angles, and physical constants, contrary to rock mass classification schemes, these dimensionless quantities are not dependent on experience.
- To quantify. To quantify is to express or measure the quantity. It is not synonymous with assigning a number to a description because that number does not always represent a quantity. As discussed later in the paper, attempts to quantify GSI rely upon parameters that are themselves not a quantity, and therefore it is not possible to quantify them. As a result, there cannot exist a quantified GSI or quantified GSI chart. Methods proposed to quantify the GSI chart misuse both the term quantity and the related action of quantifying. What rock engineers are attempting to do is just to assign numbers to geological descriptions. This is no different than arbitrarily assigning numbers to colors. In the remainder of the paper, we elect to use the expressions quantification of GSI or quantified GSI solely for the purpose of referring to published work on this subject; however, we recommend that the terms quantification and quantified be abandoned when referring to GSI.
- Scales of Measurements. According to [14], there exist four different levels of measurements (Table 1). Each scale is strictly limited to specific statistical operations. For instance, only interval and ratio scales allow for the calculation of means and standard deviations, whereas nominal and ordinal measurements are limited to medians and percentiles [15]. This aspect is ignored by many, and examples of probabilistic analysis are often proposed in the rock engineering literature despite the ordinal nature of many of the parameters—like GSI—used in design practice.
- Accuracy and precision. Accuracy is the difference between a measurement and its true value, while precision represents how close independent measures are to each other and is largely affected by random errors [16]. An accurate GSI (or any other rock mass classification value) does not exist because there is no true value for it, only an interpreted value. Precise GSI estimates would only exist if multiple independent assessments are close to one another. The quantification of the original GSI approach produces a condition by which we have witnessed engineers who are not familiar with geological problems referring to GSI values with decimal precision, which is clearly not acceptable.
- Equation, equivalency, and correlation. This argument will be further discussed in Section 2, but the use of what Feenberg [17] calls accidental functions is all too common in rock engineering practice. Accidental functions are mathematical expressions linked to personal interpretations, which may lead to extending their use outside of the limited scope and range of conditions for which they were defined. Correlations between rock mass classification systems provide a good example of accidental functions [2]. Furthermore, equations representing a physical law/relating physical quantities would need to be dimensionally consistent/homogeneous. Either equations presented for rock mass classification/characterization problems represent a physical law, and therefore they must be dimensionally homogeneous, or they do not represent a physical property, in which case we should stop treating them like mathematical equations and instead emphasize that they just represent a non-universal, but site-specific relationship between a given set of mostly qualitative variables. In this paper, we will purposely use the term equivalency in lieu of equation when referring to empirical correlations between GSI and other classification systems to avoid an impression of mathematical validity.
2. Evolution of GSI and Different Variations
The origins and subsequent updates of GSI have been well-documented by several authors [1,13,18,19] and are briefly summarized here to emphasize its key points. The concept of GSI was first introduced by Hoek in 1994 to replace RMR76 and the Q-system for estimating the m and s parameters used in the Hoek-Brown failure criterion [20] because the relationship between RMR76 and the m and s parameters would begin to break down for severely fractured and weak rock masses (i.e., RMR76 ≤ 25) and the Q-system already includes a parameter for the in-situ stress level (SRF). GSI was created as a classification system that [quote] “would not include RQD, would place greater emphasis on basic geological observations of rock mass characteristics, reflect the material, its structure and its geological history and would be developed specifically for the estimation of rock mass properties rather than for tunnel reinforcement and support” [19]. Furthermore, “the GSI classification is a careful engineering geology description of the rock mass which is essentially qualitative” [19].
The GSI chart that many engineers are familiar with was introduced in 1997, with subsequent updates throughout the years. These are provided in Appendix A. There are currently eight different GSI charts available, five for jointed rock masses and three for other types of rock masses [18,21,22,23,24,25,26]. However, there is no formal consensus on which chart to use, although the one introduced in 2000 [24] seems to be the most commonly used. Equivalencies between GSI, RMR, and Q introduced by Hoek [3] are listed in Table 2. These equivalencies could be considered the first attempt to a quantified version of GSI; indeed, later attempts share similar parameters for structural conditions and jointing conditions (see Table 3). Interestingly, no mention is made in the literature about the reasonable deduction that the validity of the correlations listed in Table 2 would lead to the incorrect statement that “RMR76 is equal to RMR89—5”.
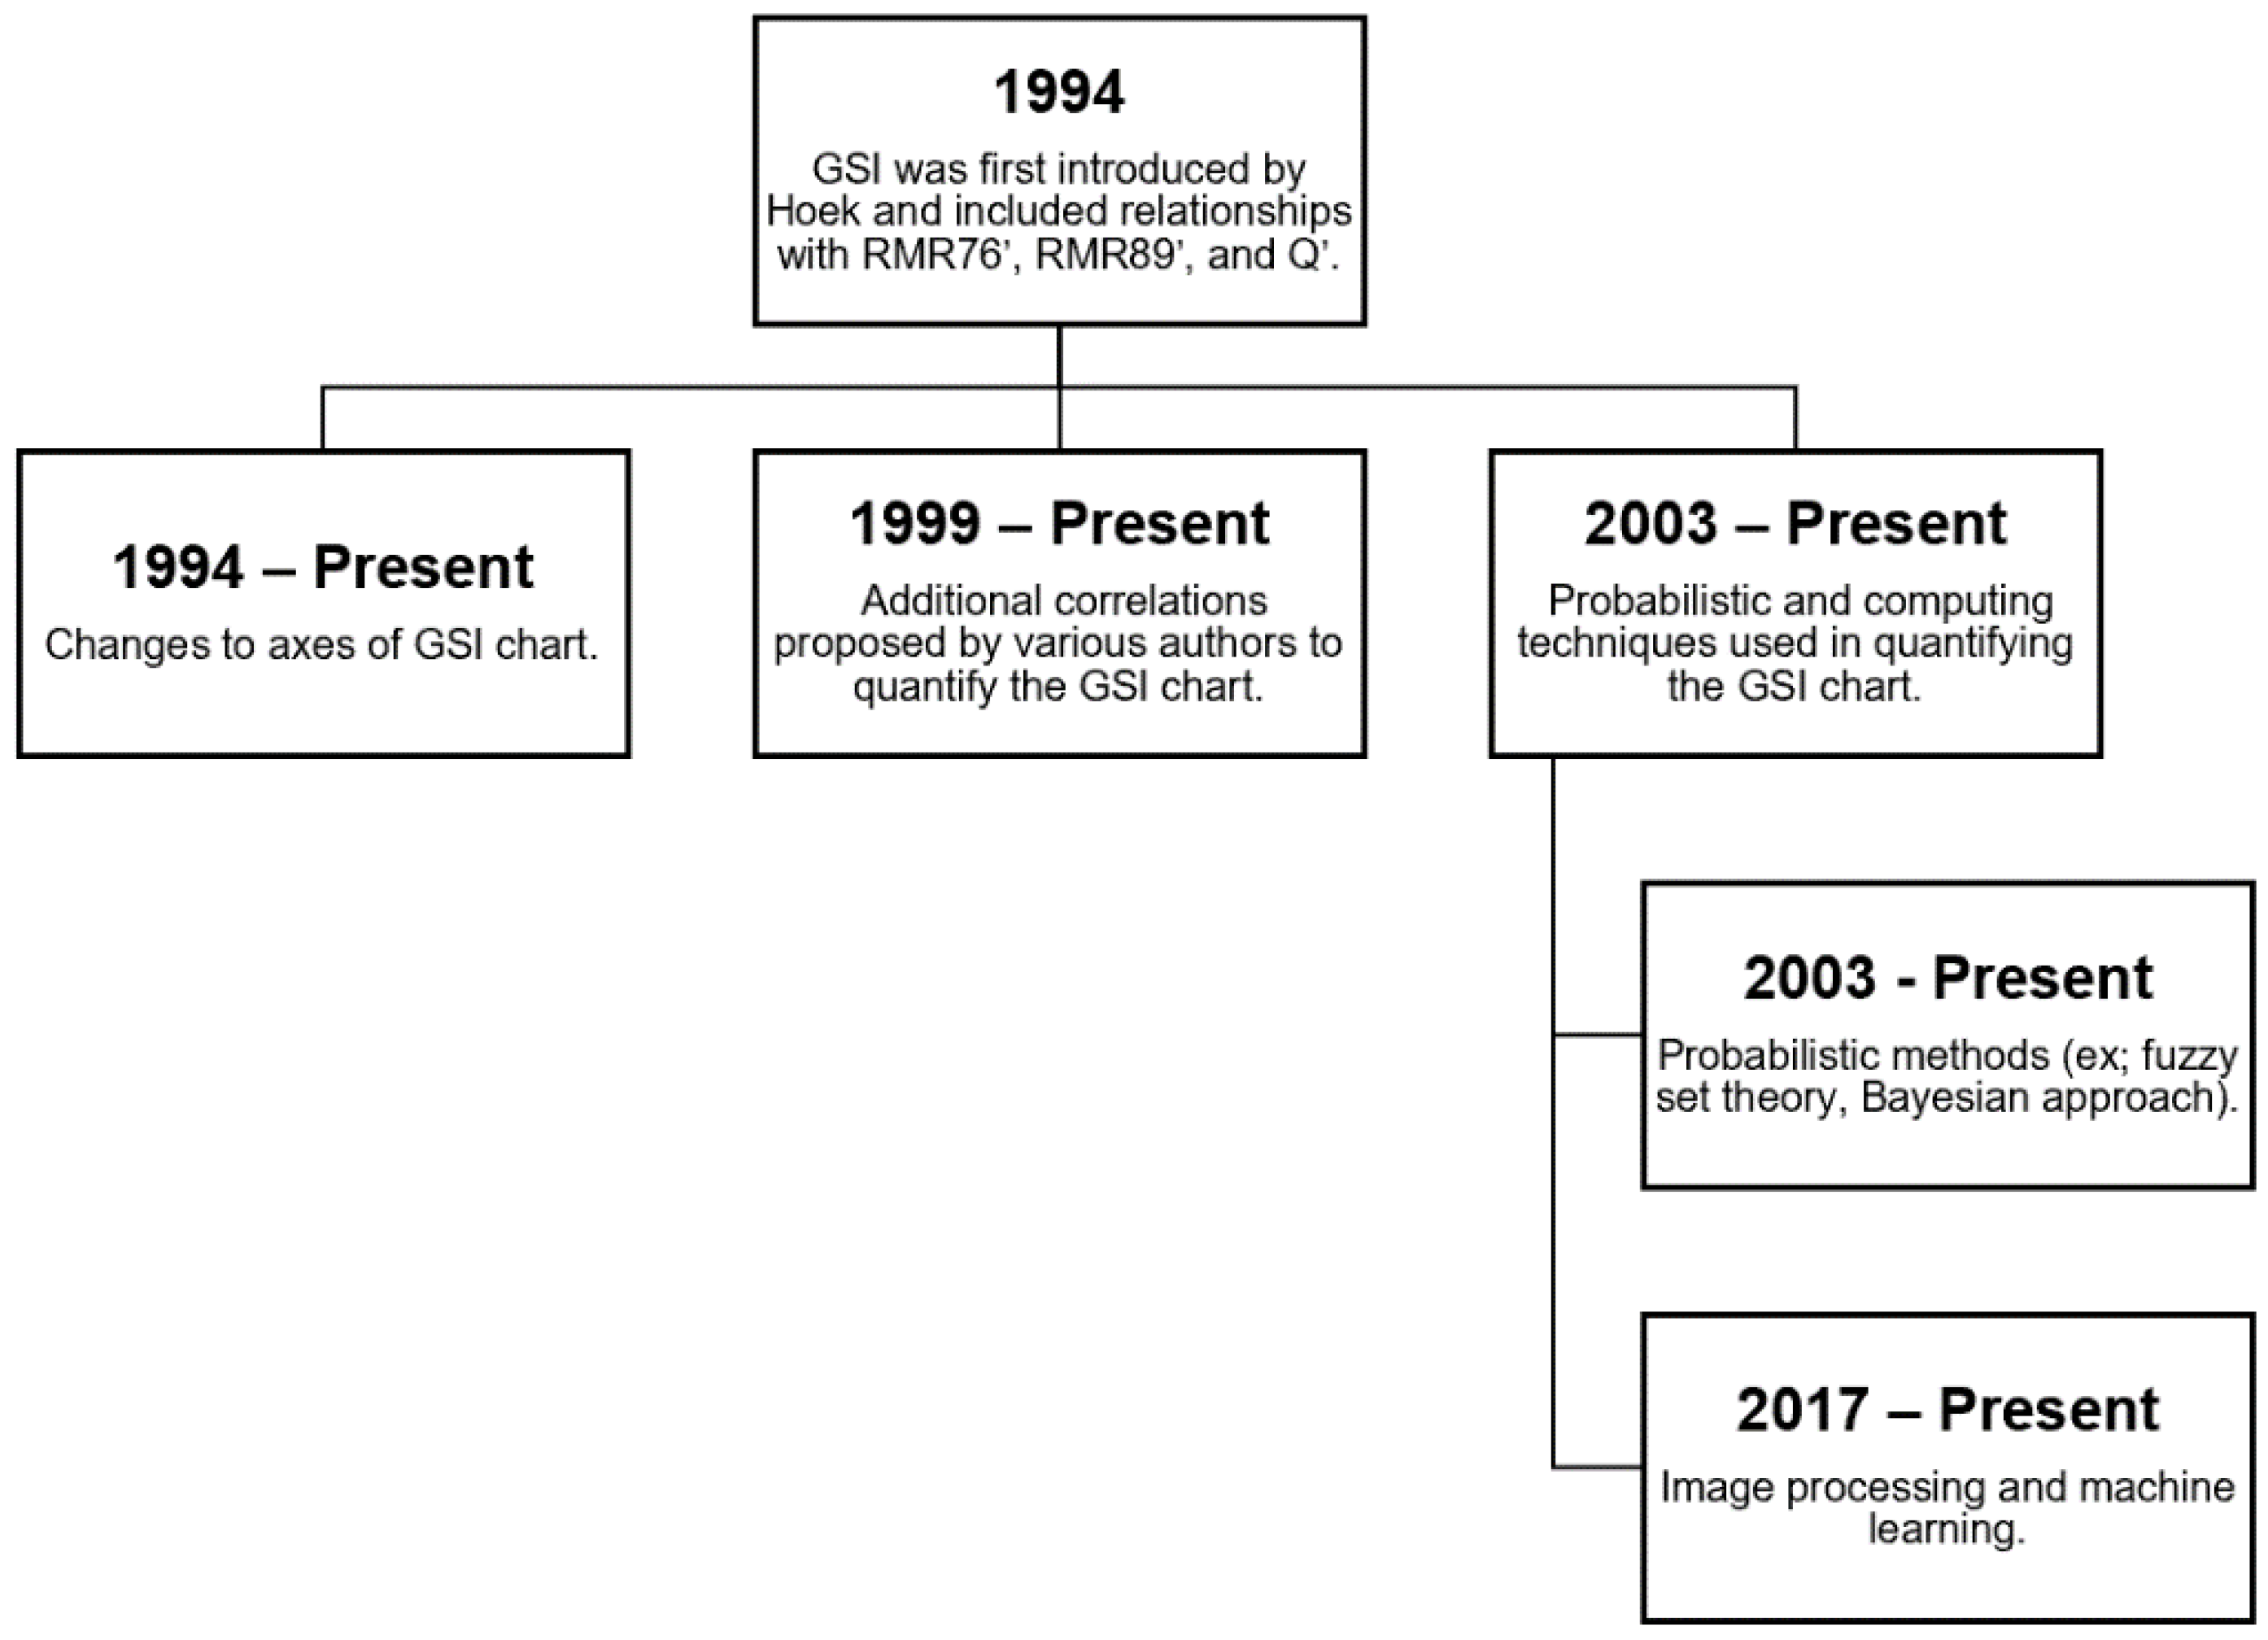
Since the introduction of GSI in 1994 rock engineers have been focused on finding a better quantification of the GSI chart, with the apparent objective of making the system more objective and less dependent on experience. Initially, the quantification attempts consisted of finding new correlations between GSI and various rock mass characterization and classification parameters but have recently expanded to include using probabilistic and computing methods (Figure 1).
Table 3 and Table 4 provide a summary of GSI correlations and quantified GSI charts available in the literature. The proposed quantified GSI charts in Table 4 can be found in Appendix A. Note that the majority of these correlations combine qualitative parameters from other widely used classification systems like RMR, Q, and RMi [27]. There are at least six additional quantification attempts [28,29,30,31,32,33] using probabilistic and/or computer-based methods (including machine learning), for a total of at least 23 different quantifications of the GSI chart.
Attempts to quantify GSI create a situation analogue to the allegory proposed in Forscher [34]—chaos in the brickyard—concerning the confusion of introducing many different correlations that consider diverse parameters to estimate a GSI value, without any of these correlations having a clear advantage over the others. Under the assumption that all the correlations listed in Table 3 are acceptable, then a condition of chaos ensues since none of the correlations can be compared to each other in mathematical terms without resulting in contradictory results. Furthermore, it would be contentious to assume every correlation to be valid if they are used independently of each other, since one would expect those different correlations to ultimately yield comparable results when determining the GSI of the same rock mass. Either they do yield equivalent results, which would reinforce the idea of those systems not actually improving the original GSI table, or they do yield different results, which would expose the GSI system itself and any design methods based on GSI to biased conclusions. Finally, arguing that differences in GSI estimation provided by the different systems would actually help constrain a range of possible GSI values would contradict the motivation behind the quantification attempts, since the original GSI table is already set up to offer a range of possible GSI values for a given combination of geological structures and jointing conditions. The only way to solve these contradictions would be to somehow invoke the validity of one—and only one—of the correlations listed in Table 3, or to accept that it is not necessary to quantify the original GSI chart.
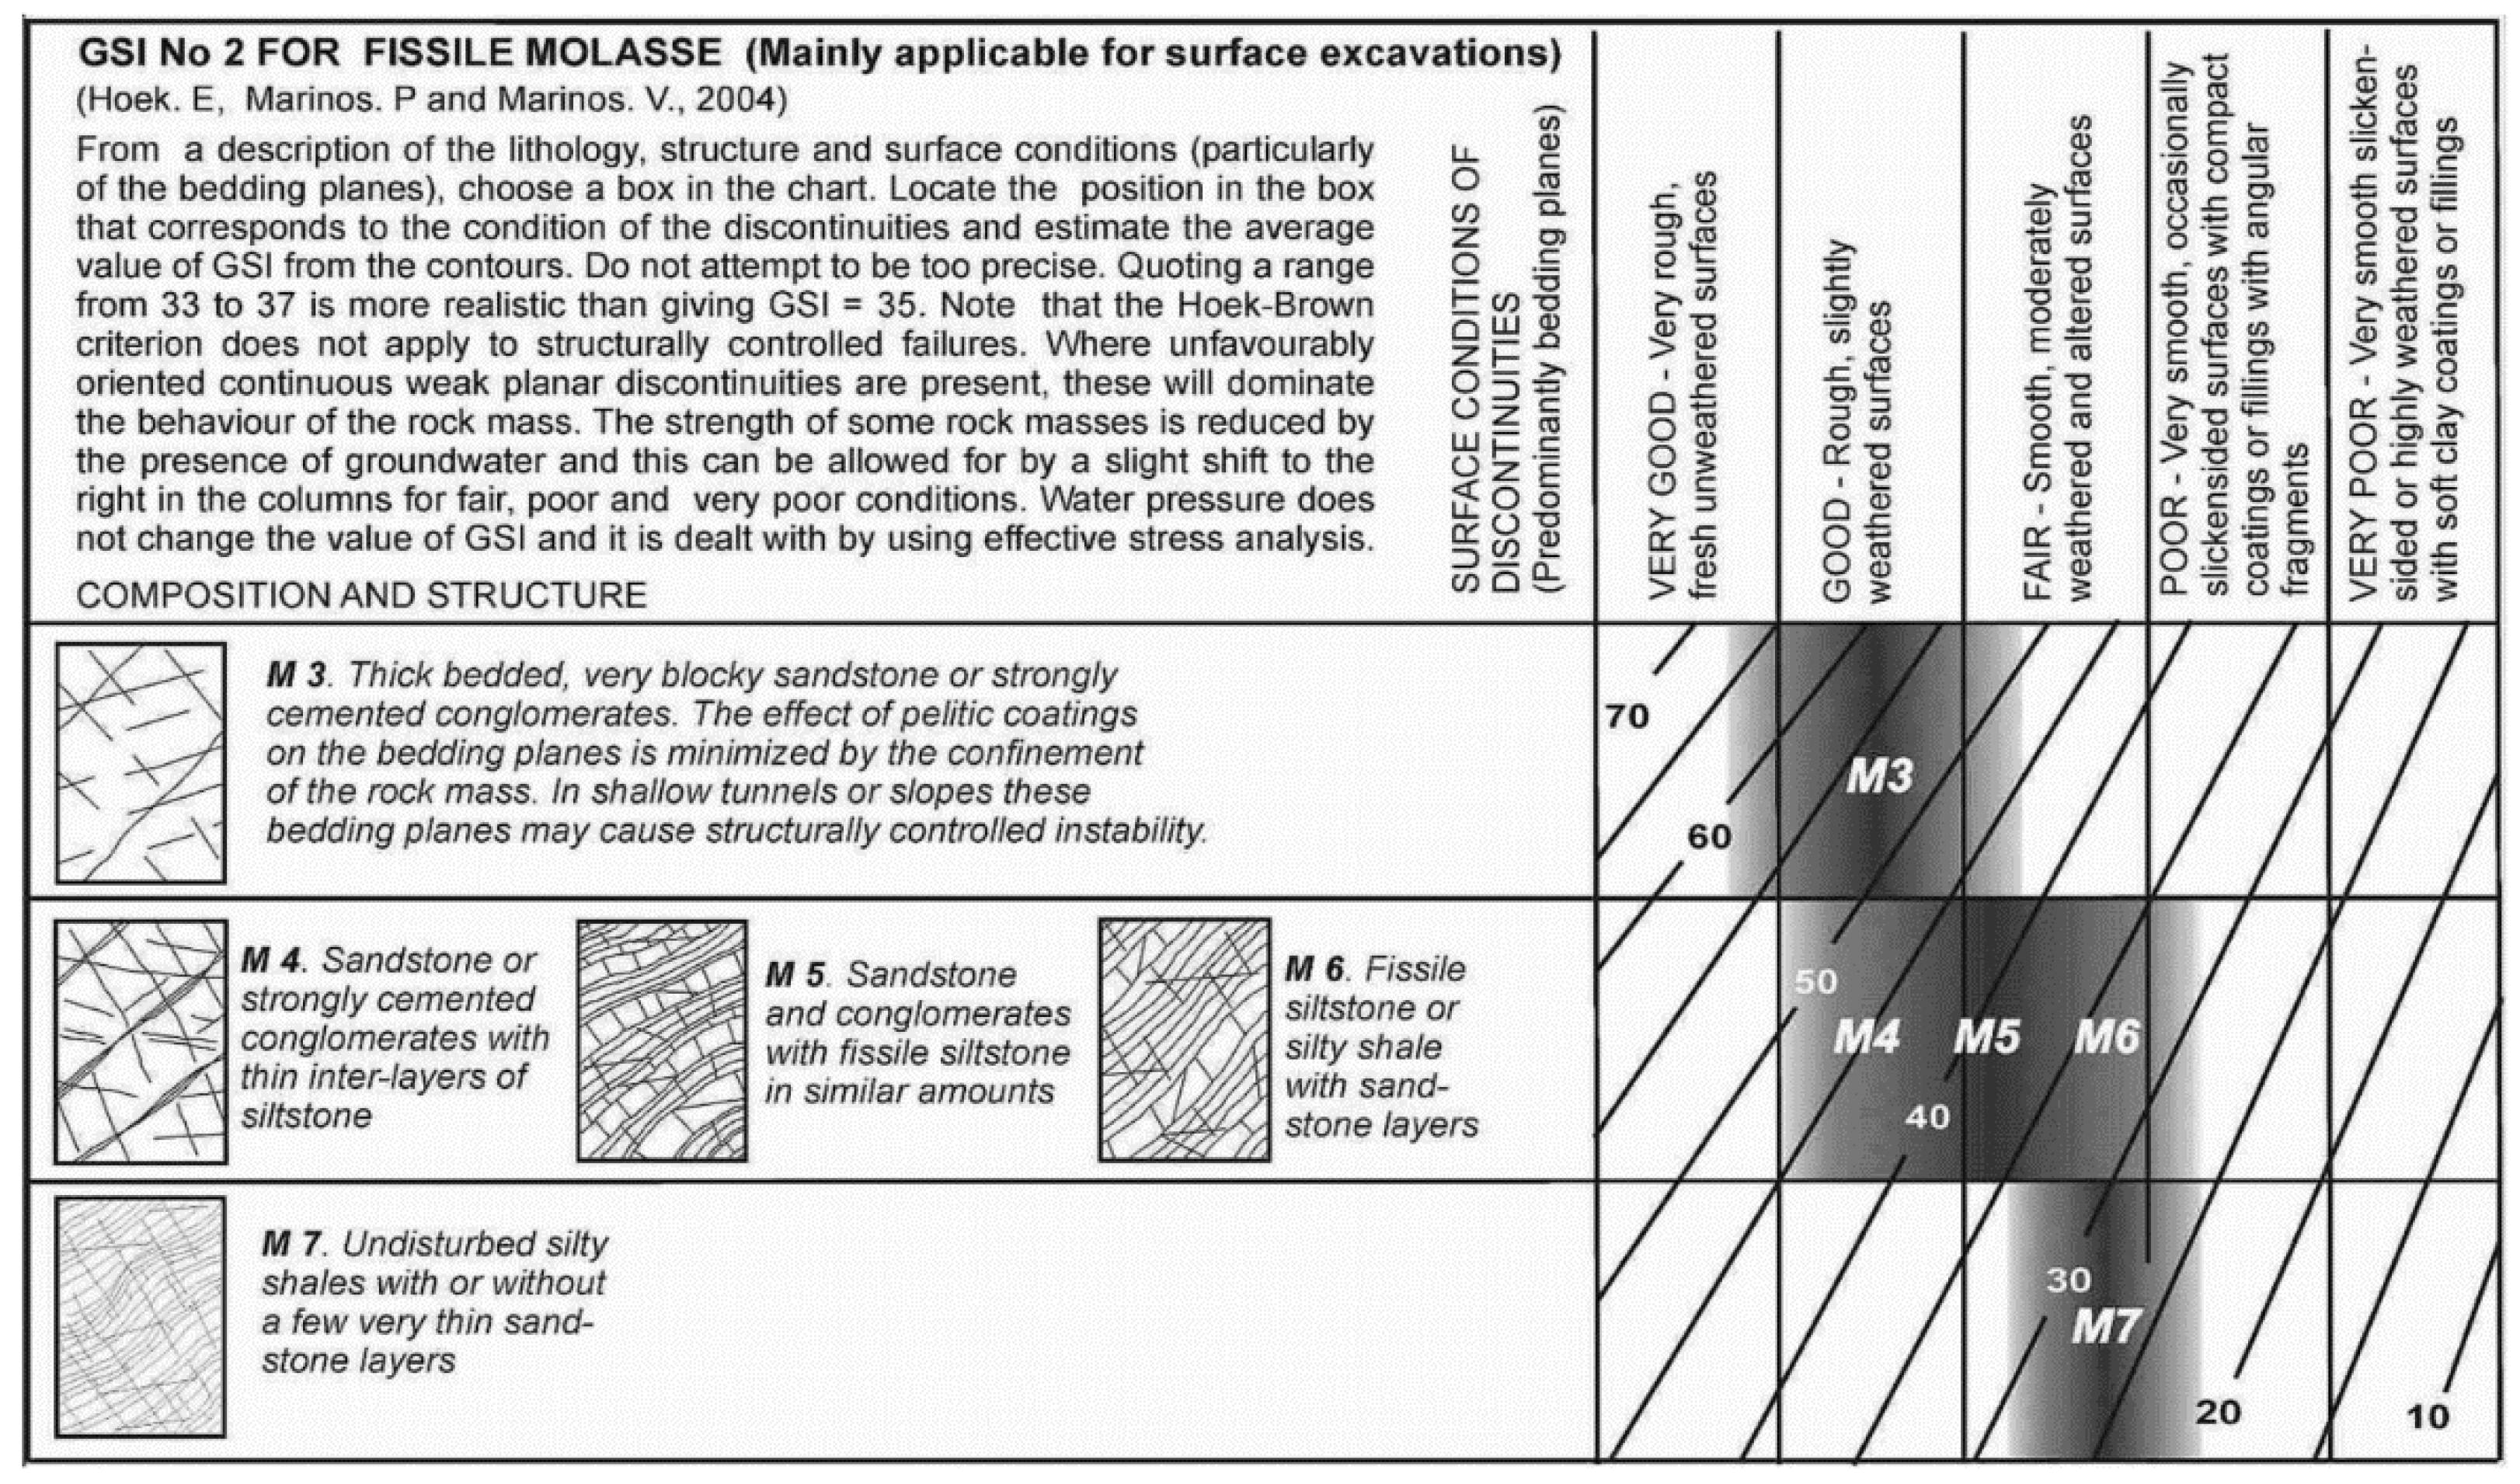
While the limitations of the original qualitative GSI charts are well known, the limitations of the various quantified GSI charts have been less frequently discussed. One main limitation is that the quantified GSI charts are not applicable or do not work well in specific scenarios. For example, it was stated in [35] that “there are situations that may render the quantified approach difficult to be applied; for example, in rock masses that are disintegrated, foliated, or sheared.” The same authors also added that “the descriptive approach still provides the only means for strength and deformation parameter estimation”, and “[…] at the feasibility investigation stage where quantitative data are not available, the descriptive approach is still applicable”.
These limitations were later reiterated in the following statement in [36]: “for massive or tectonically disturbed rock masses in which the structural fabric has been destroyed” the “original qualitative method based on a careful visual observation of the rock structure and the use of GSI charts purposely published is still the most suitable and recommended approach.”
Building from this, another commonly mentioned limitation is that these quantified GSI charts are not a substitute for the original qualitative approach, as noted in [35,37] and more recently in [38], where they stated that “the addition of quantitative scales to the GSI chart should not limit the use for which it was originally designed—the estimation of GSI values from direct visual observations of the rock conditions in the field”.

Table 3.
Proposed GSI quantifications (correlations).
| [35,39] |
where are the large-scale waviness and small-scale smoothness, respectively, from RMi; is the joint alteration rating from Q, and s is the joint spacing of the joint set |
| [40] |
| Improved parameter originally proposed by [35,39] Where is the block volume calculated from joint spacings and angles without the consideration of the joint persistence and is the joint persistence factor and is defined as With representing a joint set in the rock mass |
| [37] |
Where is the block volume (determined with several methods outlined in [27]), is the joint size and continuity factor in RMi [27], is the joint roughness factor in RMi (similar to the factor in [12] Q), and is the joint alteration factor in RMi (similar to the factor in [12] Q) |
| [38] |
| [36] |
| for Jv ≤ 100 for RQD/Jn ≤ 100 Where , , , , and are the ratings for length (persistence), aperture, roughness, infilling, and weathering for the surface conditions of discontinuities in the RMR89 chart, respectively; is the volumetric joint count; and is the spacing of the discontinuities |
| [41] |
Where is the mean true spacing for the ith discontinuity set and NDS is the number of sets present in the rock mass |
| [42] |
| [43] |
| [44] |
| for RMR2011 proposed by [45] for RMRVALE proposed by [46] for RMRSantos proposed by [47] with a W2 weathering grade for RMRSantos proposed by [47] with a W3 weathering grade for RMRSantos proposed by [47] with a W4 weathering grade for RMR14 proposed by [48] |
| [31] |
Where is the structure rating and is the joint condition digital imaging rating |
| [49] |
Where , , and are the ratings corresponding to roughness, weathering, and infilling from JCond89, respectively |
Table 4.
Proposed GSI quantifications (charts).
| Authors | Proposed Quantified GSI Chart |
|---|---|
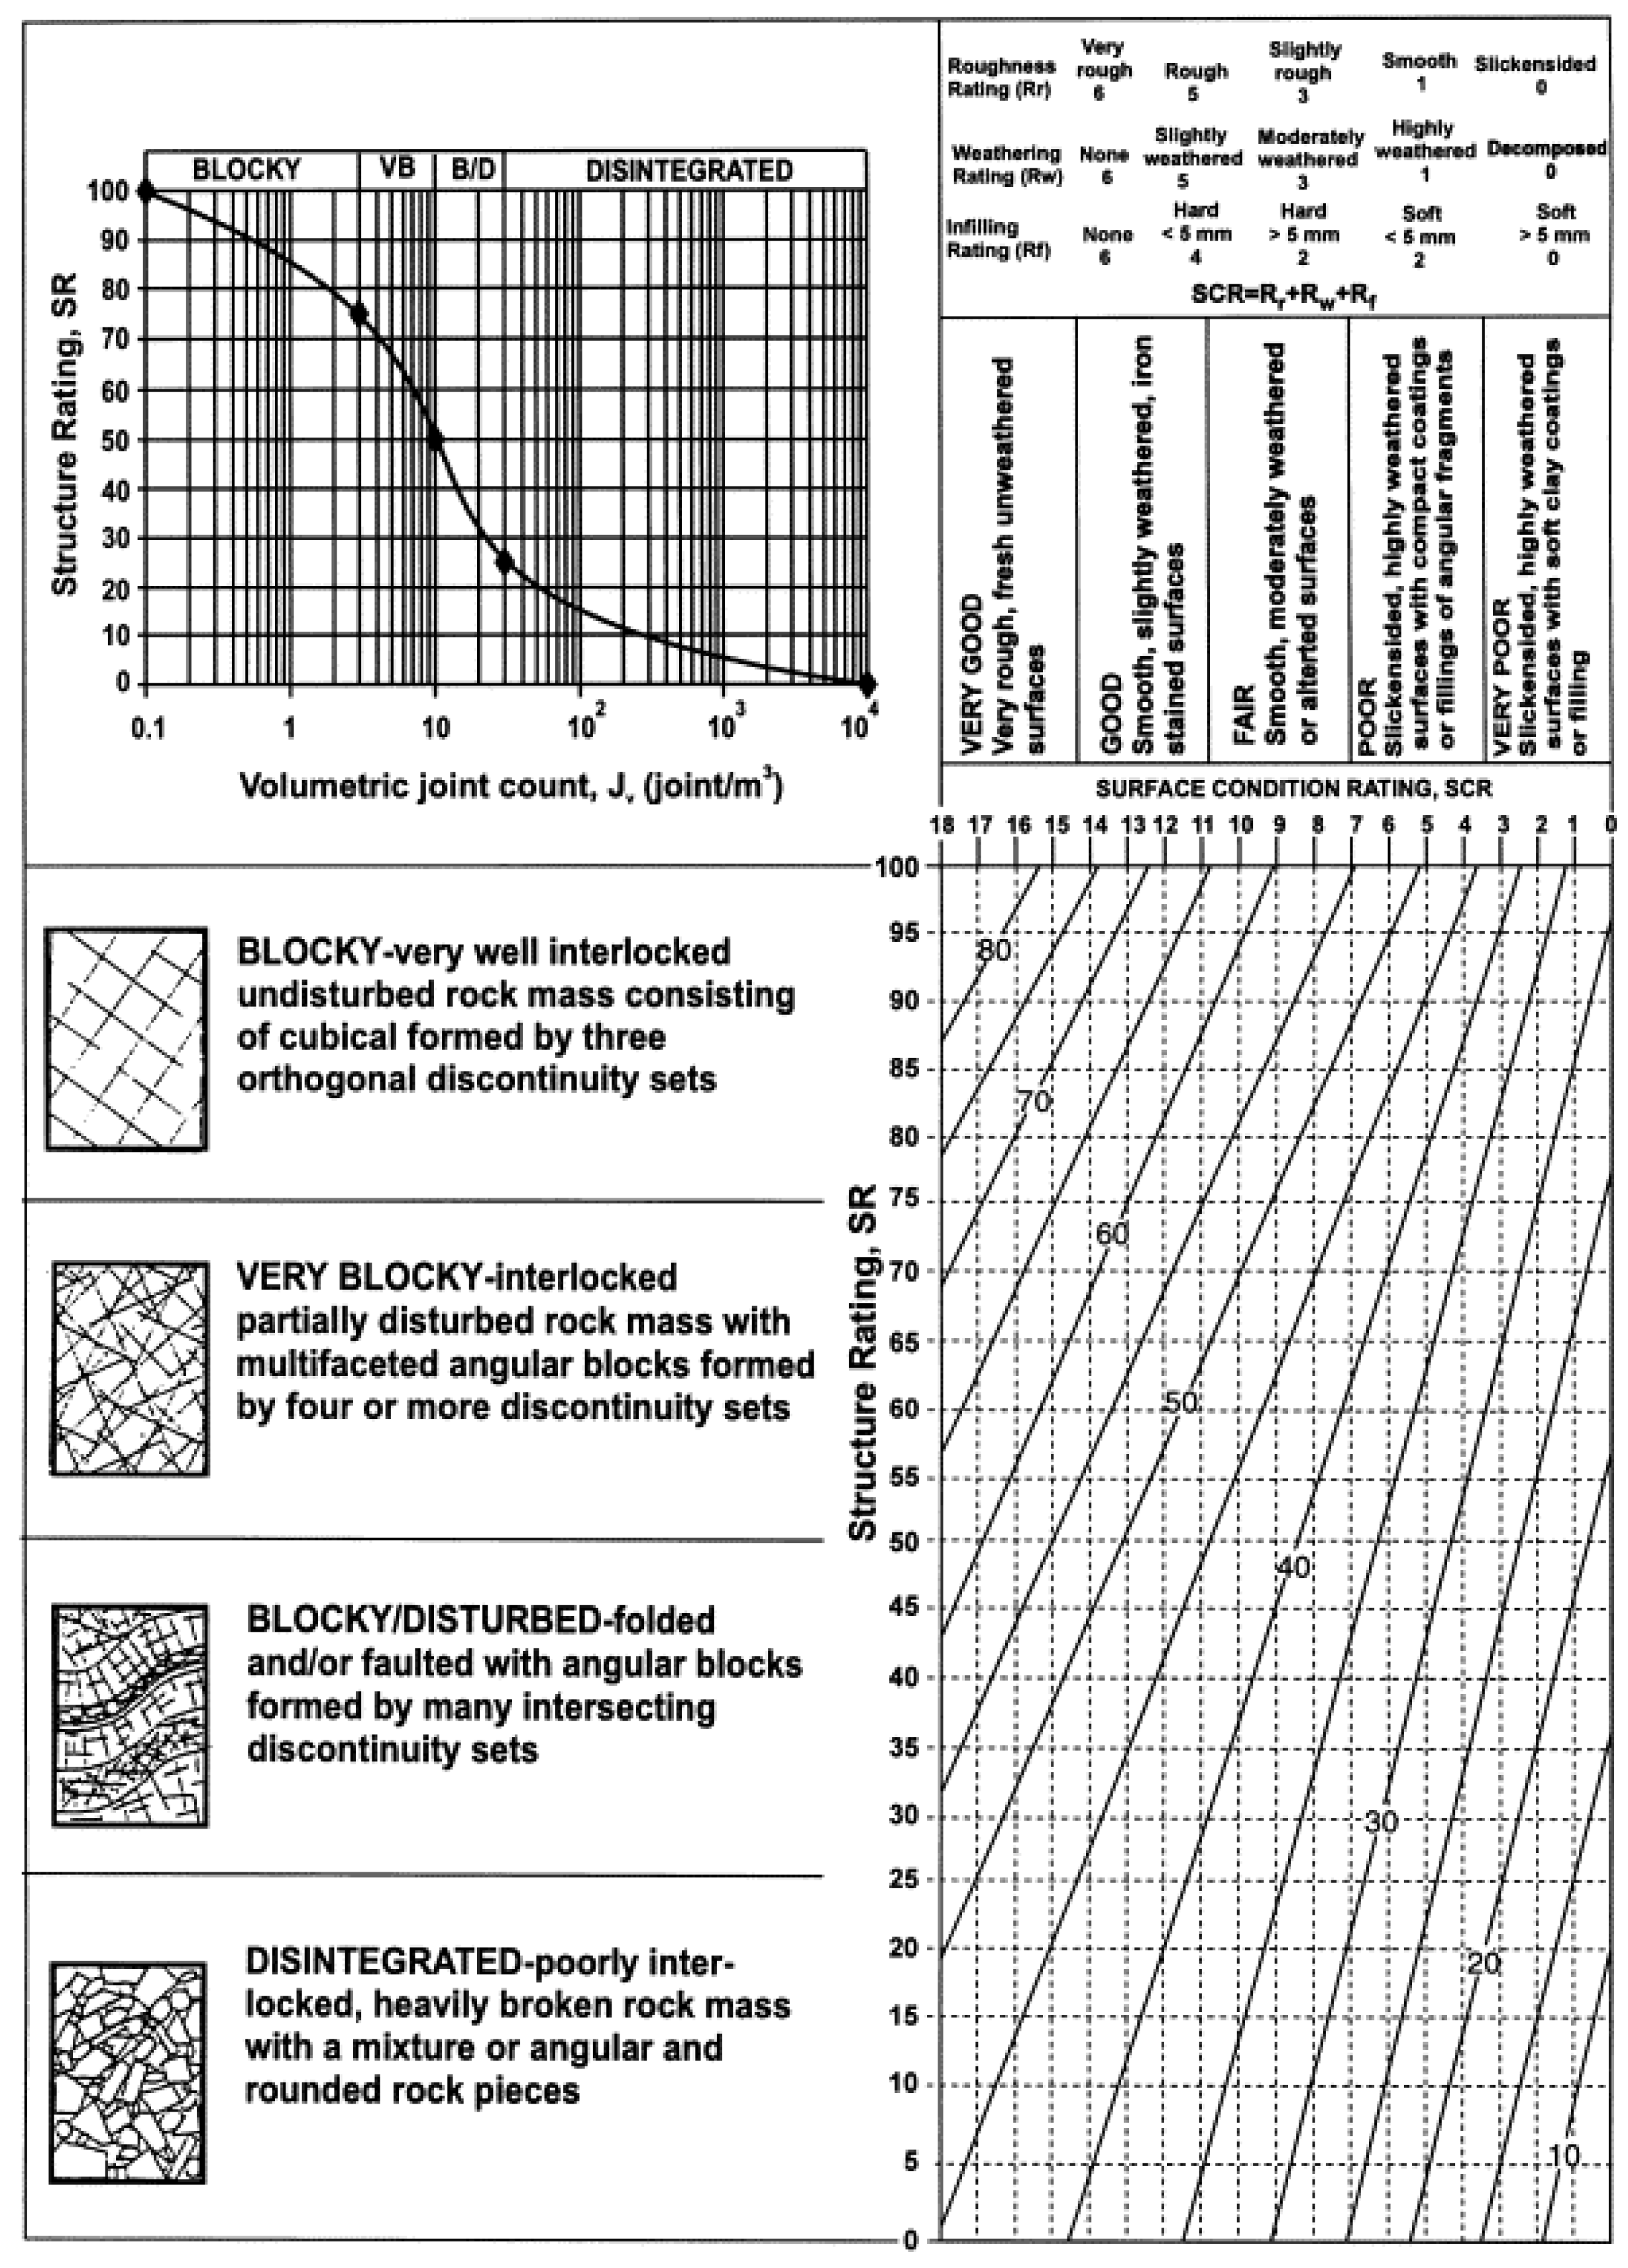
| [50] | Quantified GSI chart based on SCR (summation of RMR89 roughness, weathering, and infilling ratings) and SR (based on volumetric joint count) |
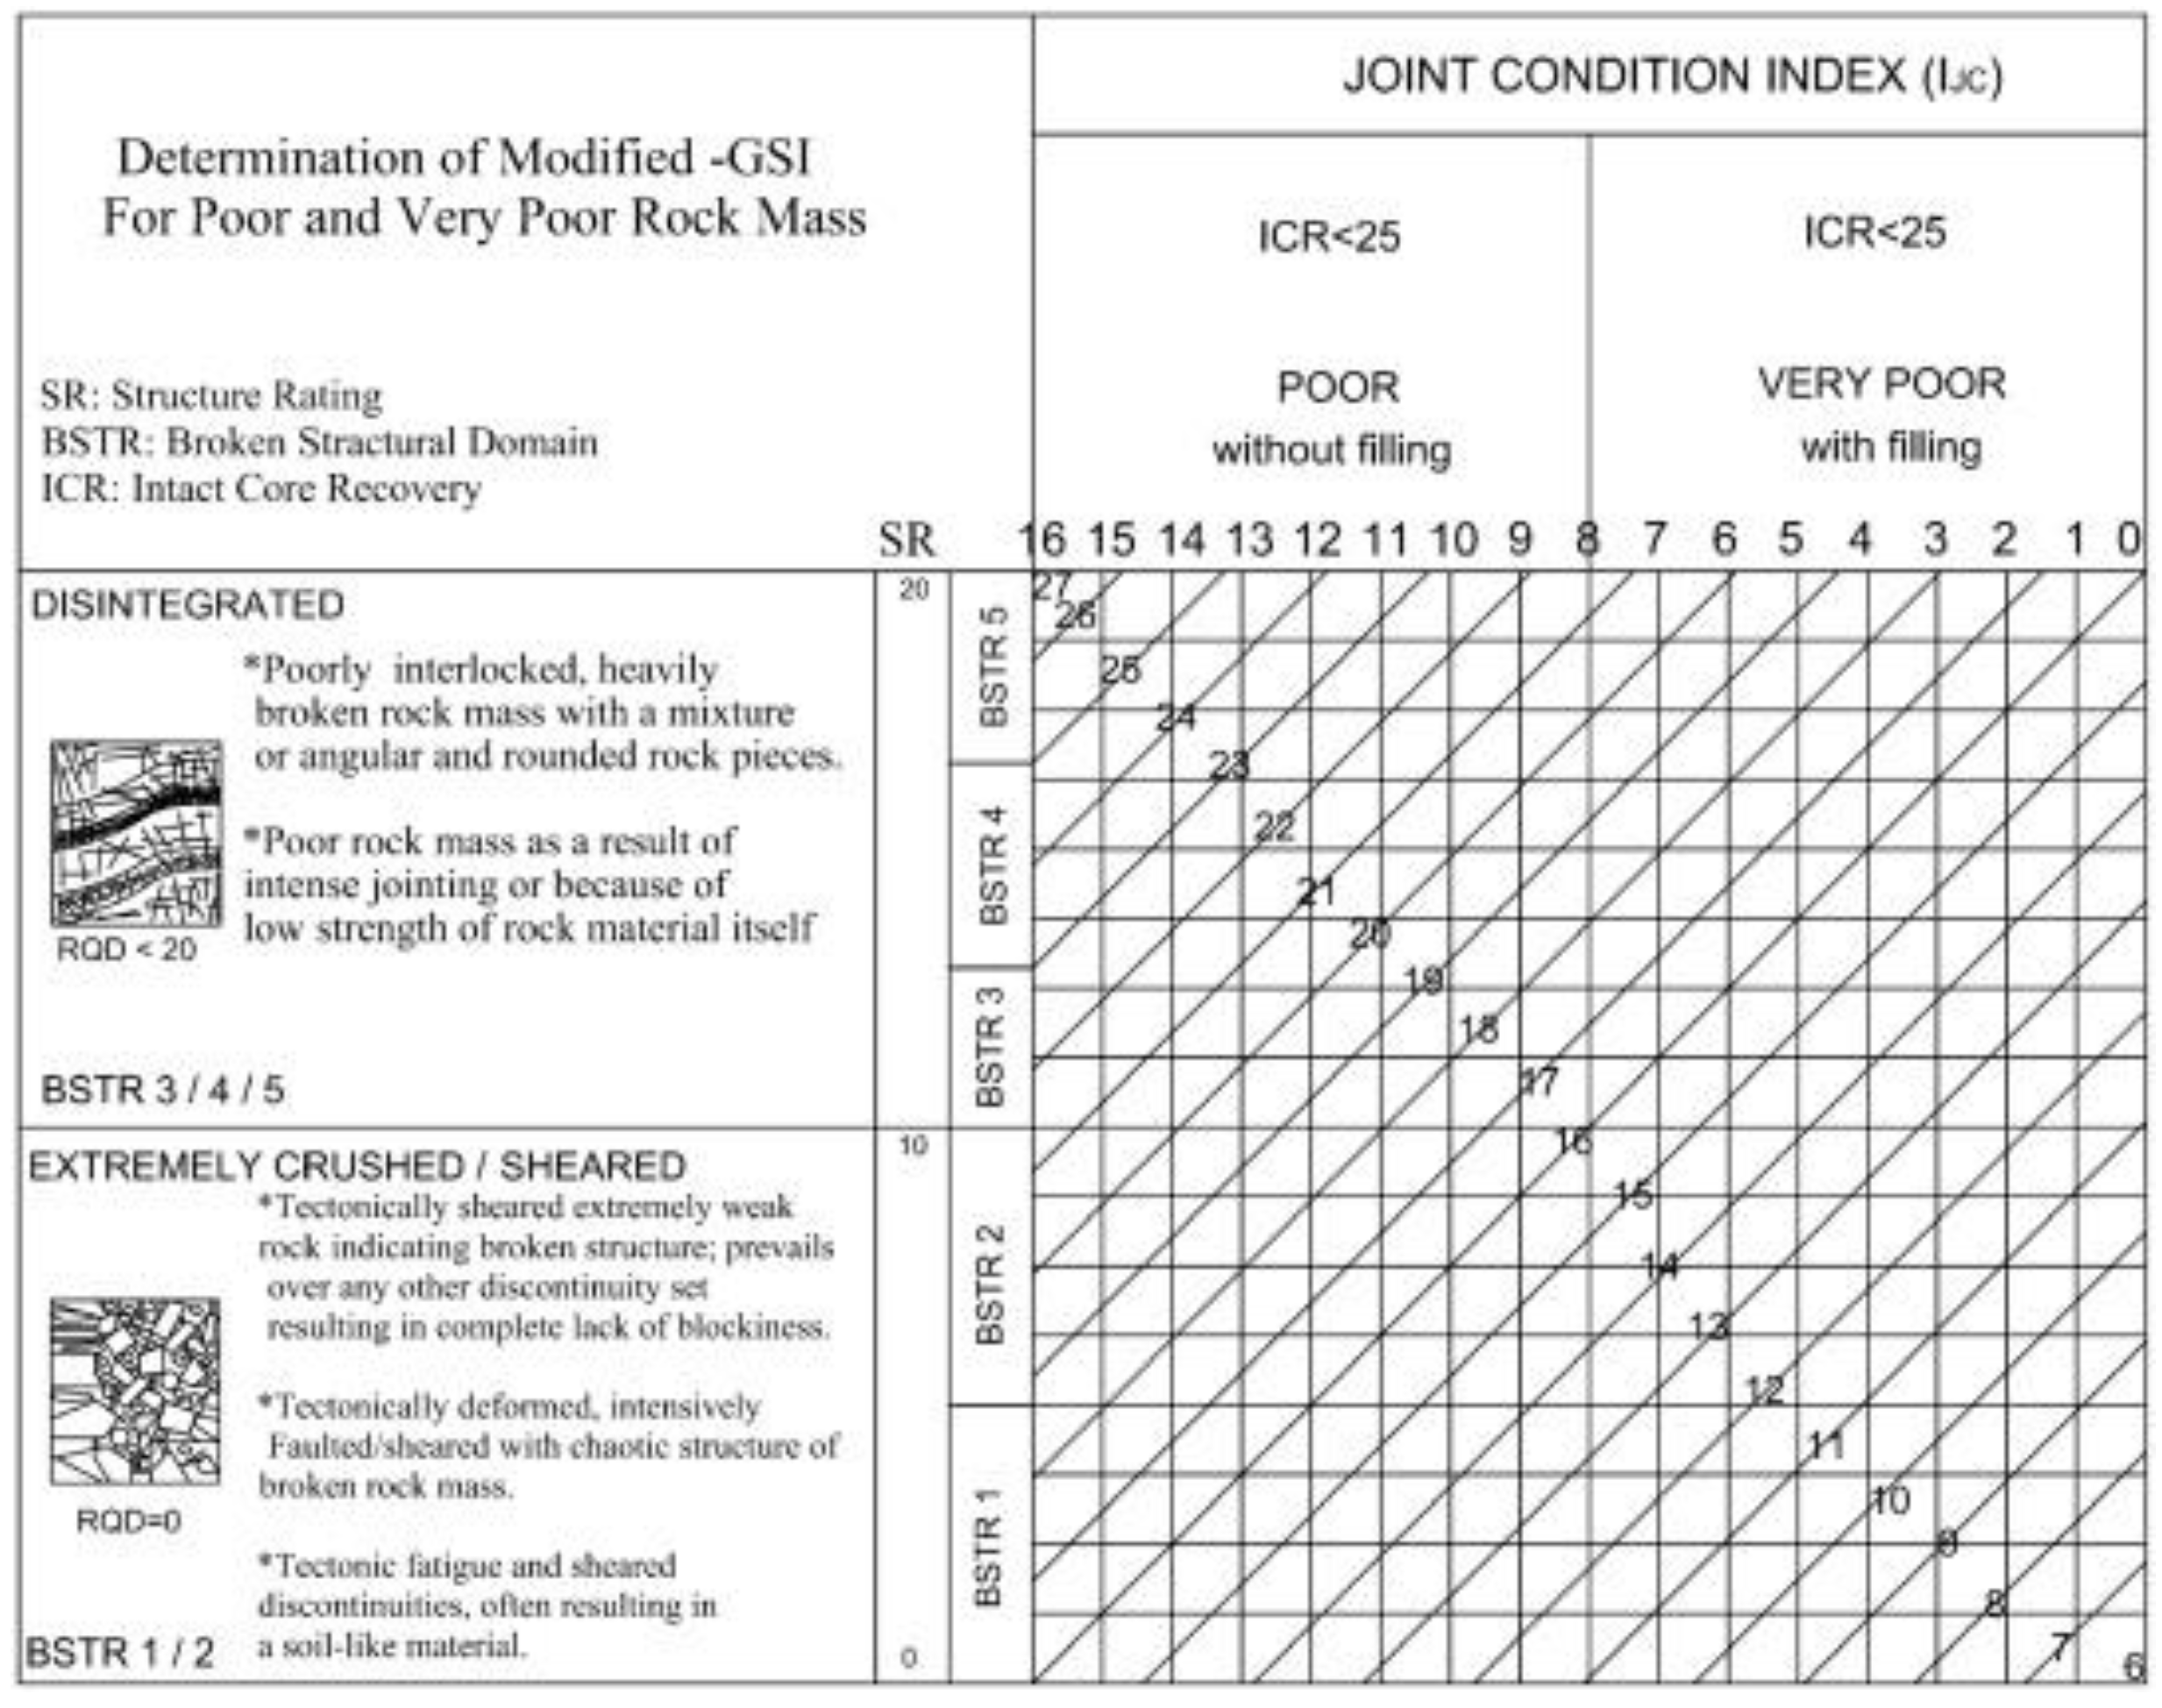
| [51] | Quantified GSI chart for very poor and poor rock masses |
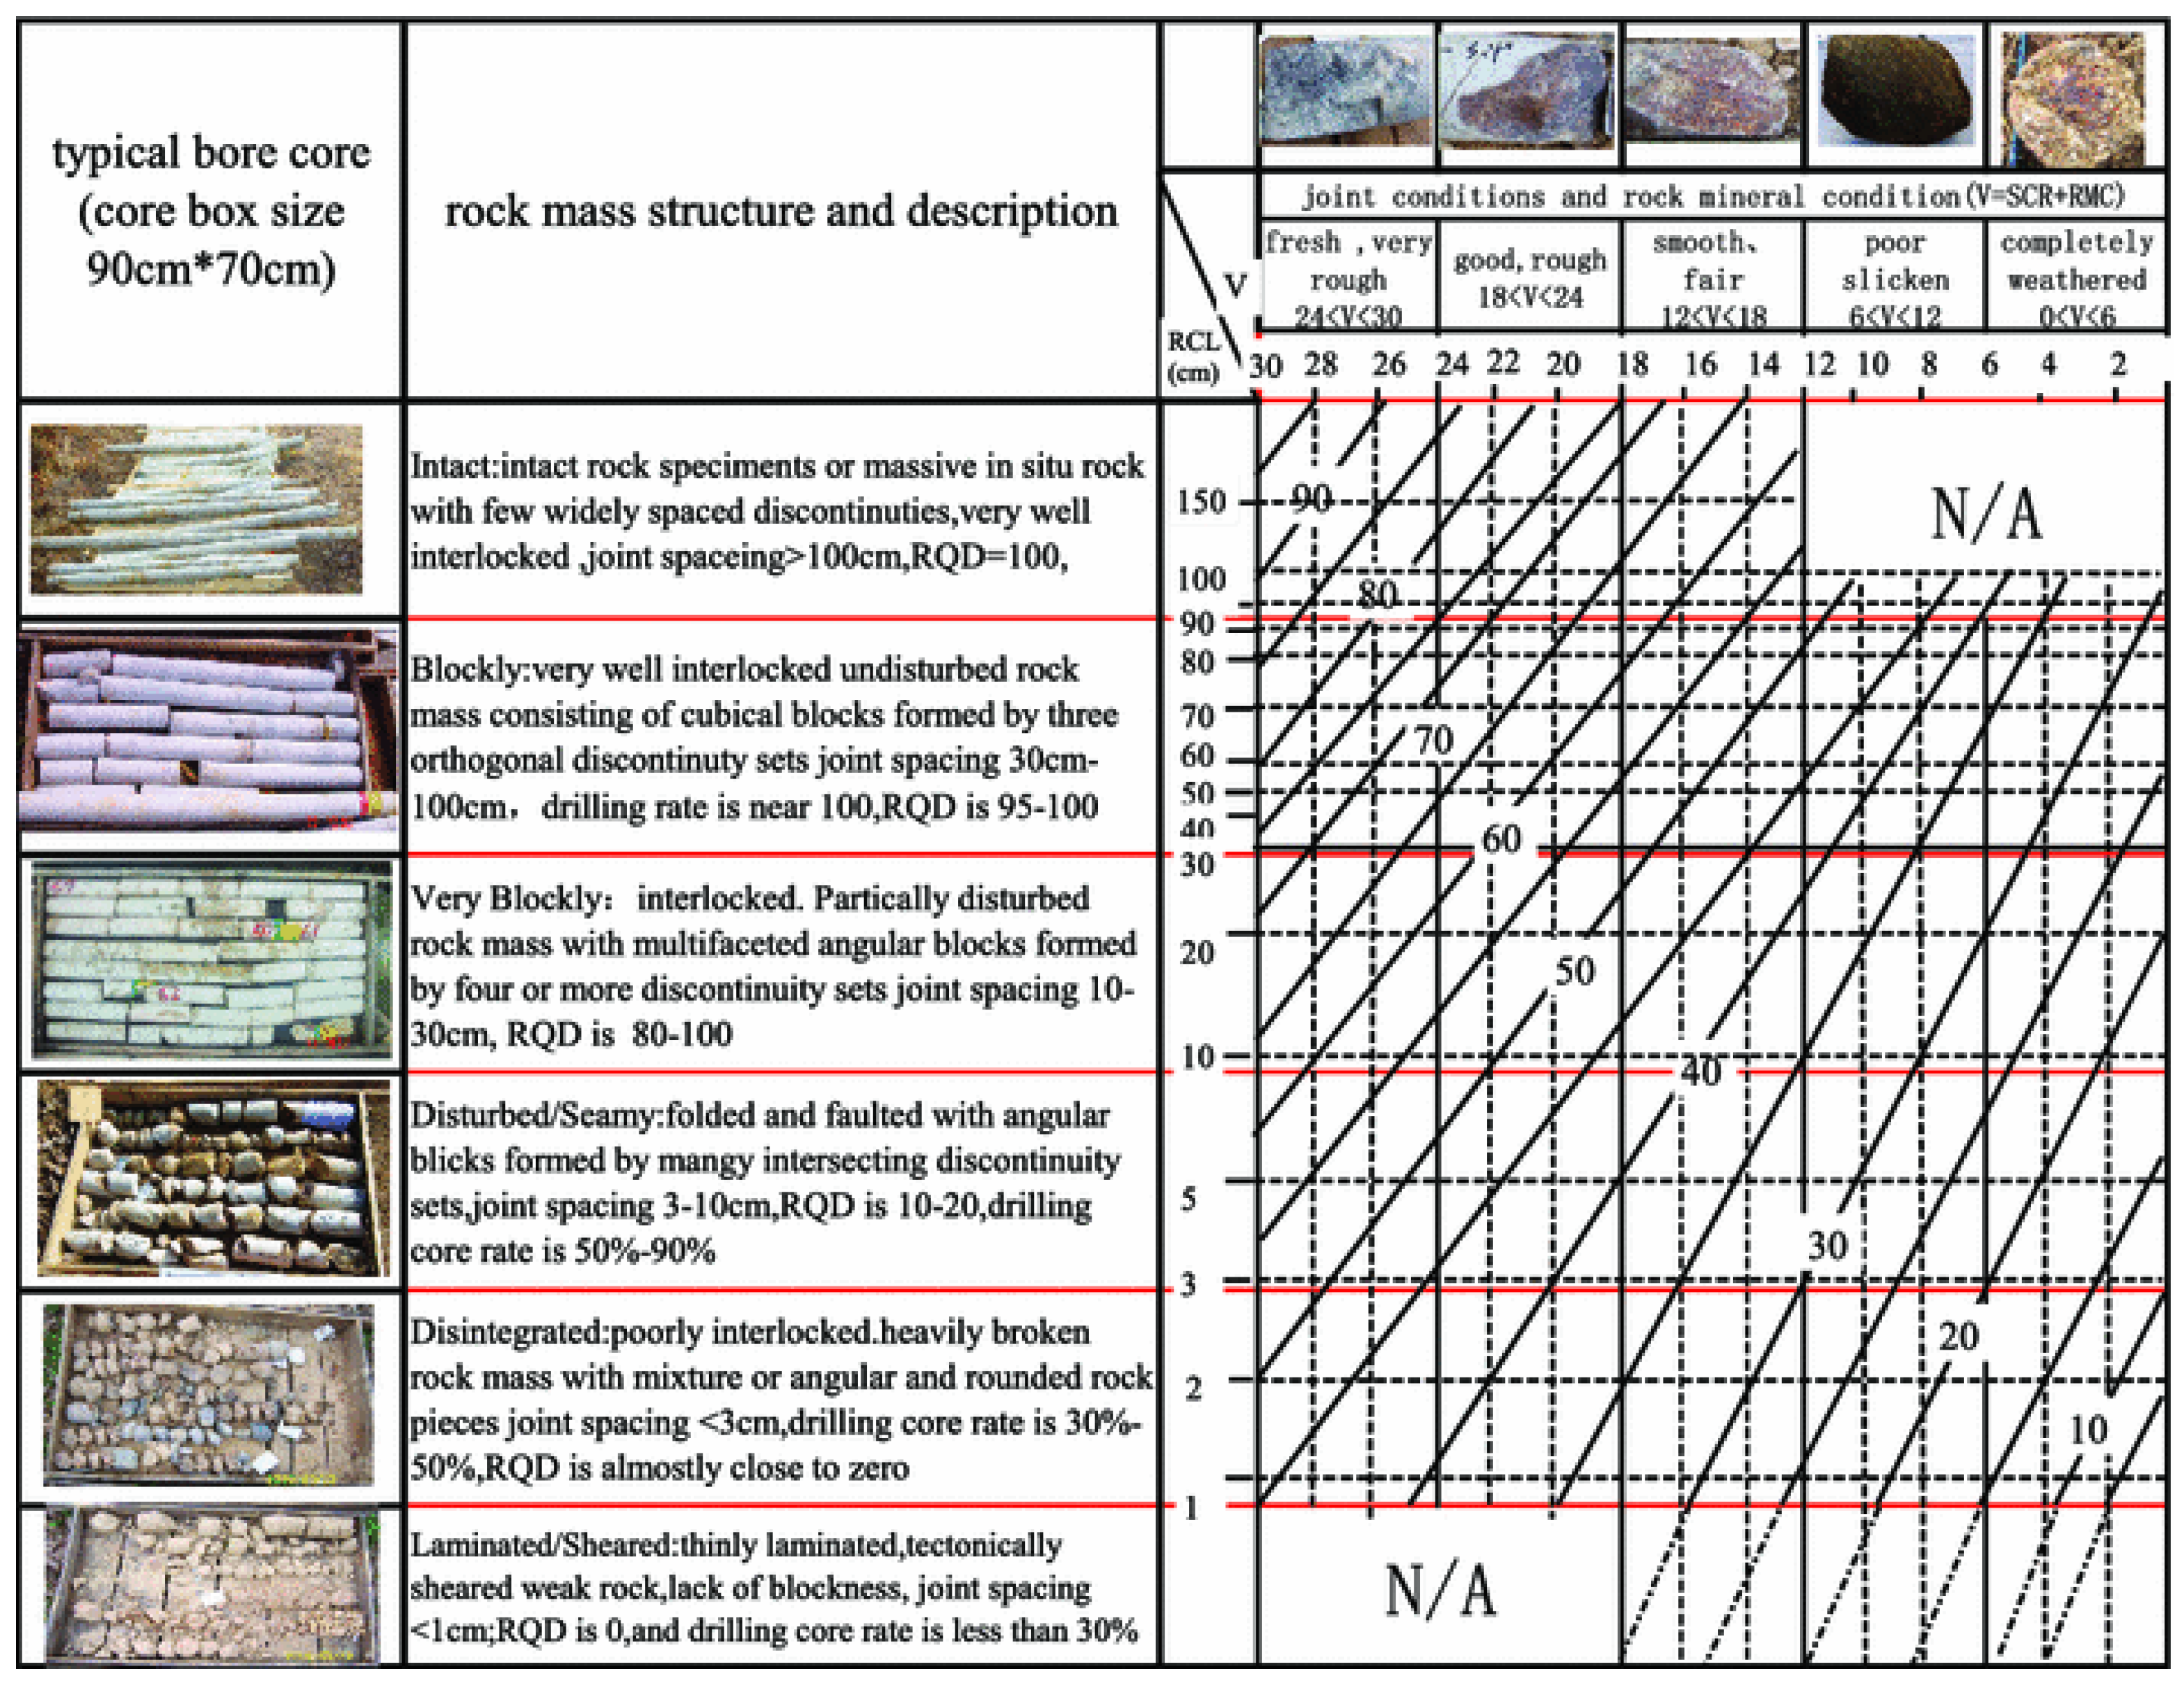
| [52] | Quantified GSI chart for granite based on the rock core length (RCL) to assess the structure of the rock mass and the rock mineral condition (RMC) and surface condition rating (SCR) to assess the joint condition |
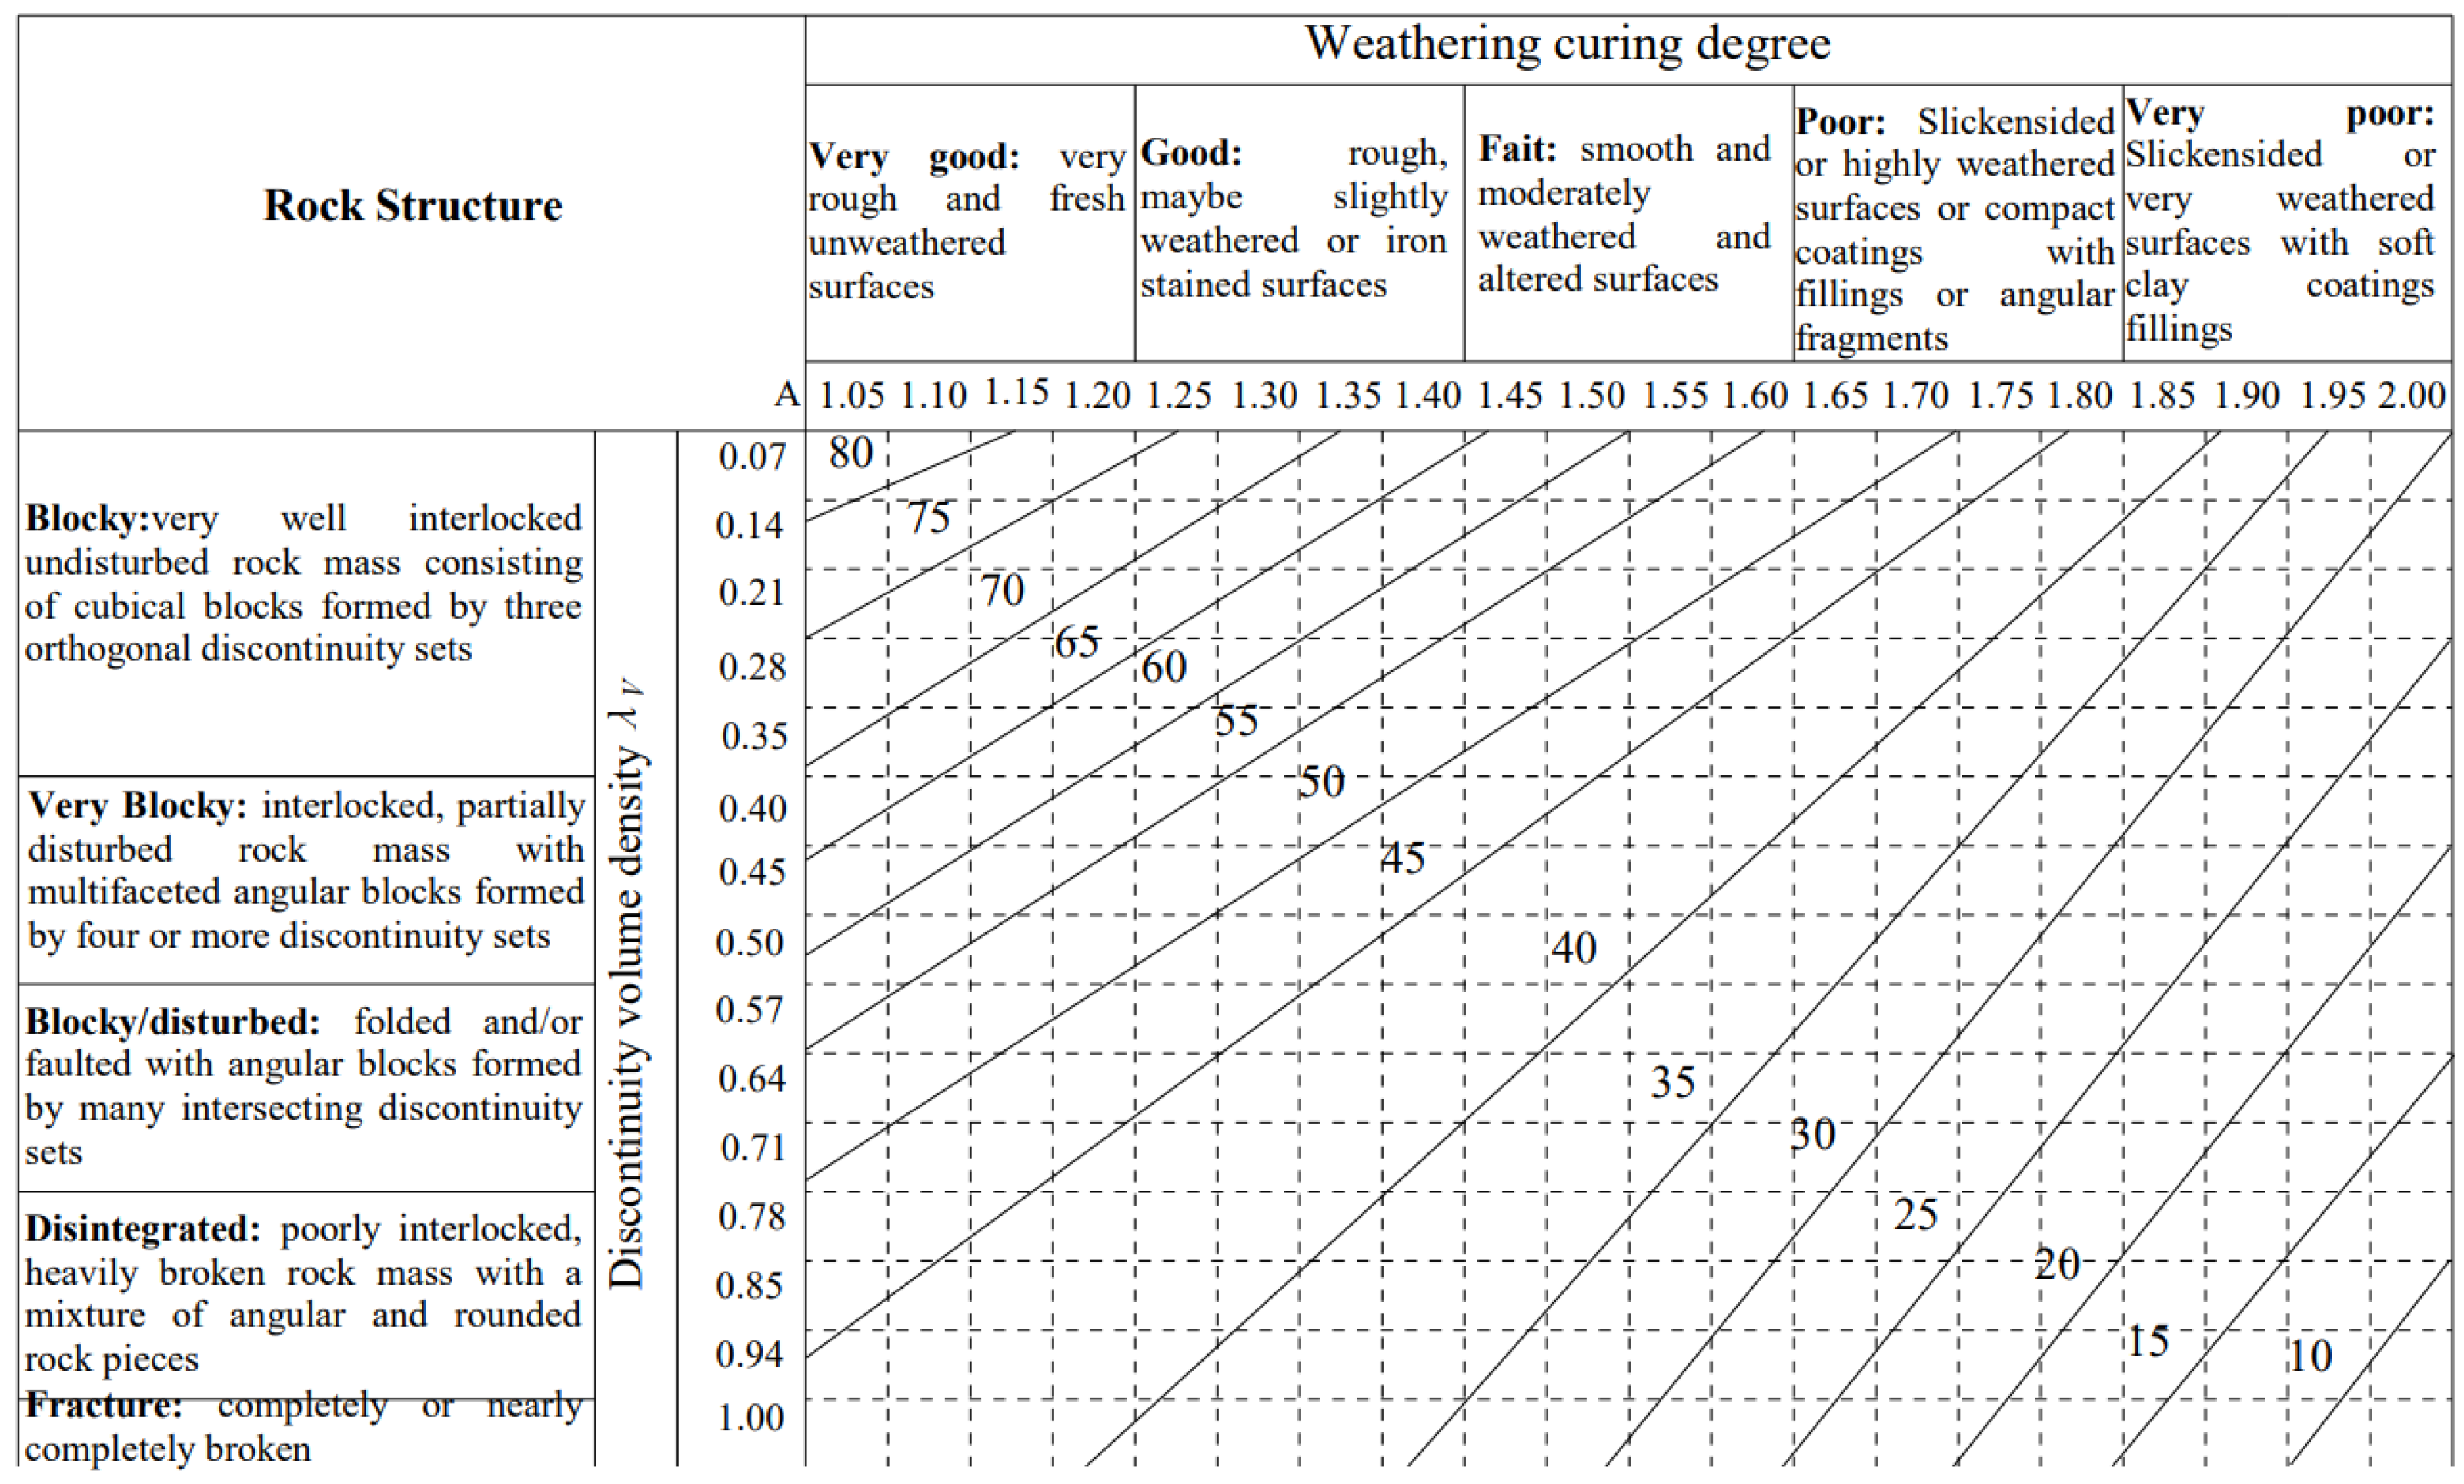
| [53] | Quantified GSI chart based on the discontinuity volume density and weathering curing degree |
| [54] | Quantified GSI chart based on basic quality index (BQ) and structure condition rating (SCR) |
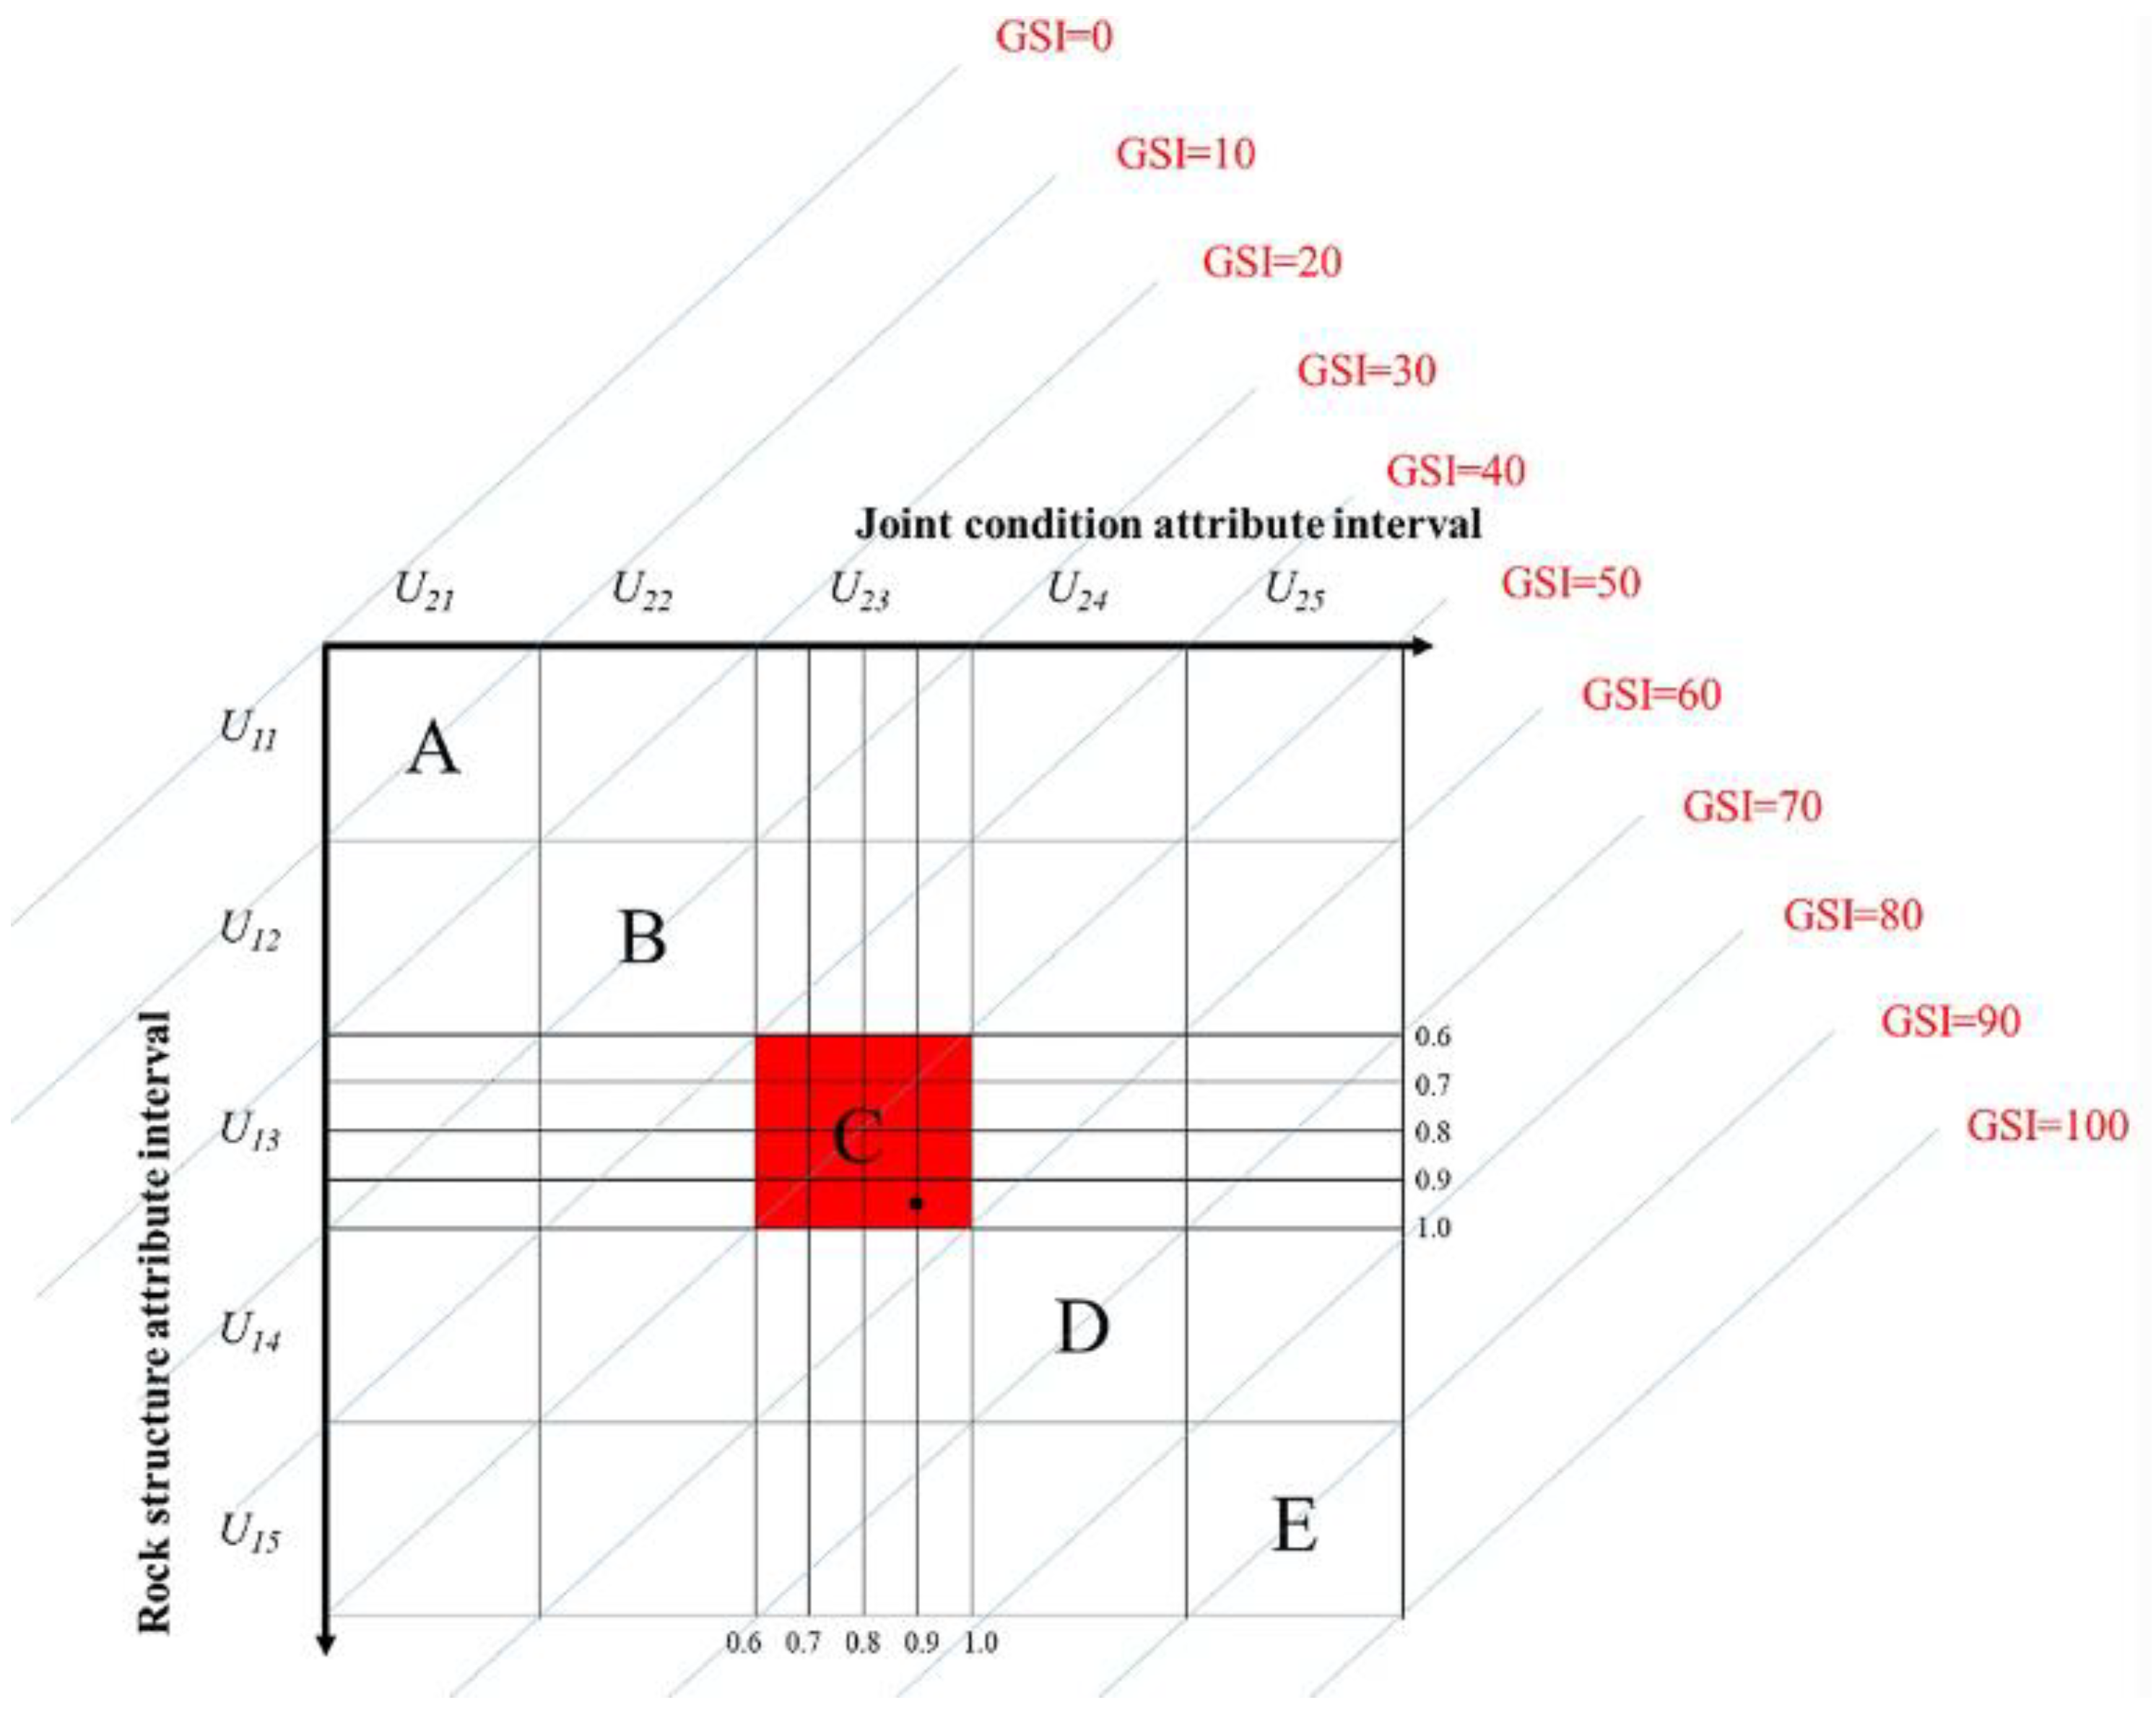
| [55] | Quantified GSI chart based on attribute mathematics theory |
3. General Limitations of the Quantified GSI Charts
3.1. The Problem with Using Arbitrary Measurement Scales
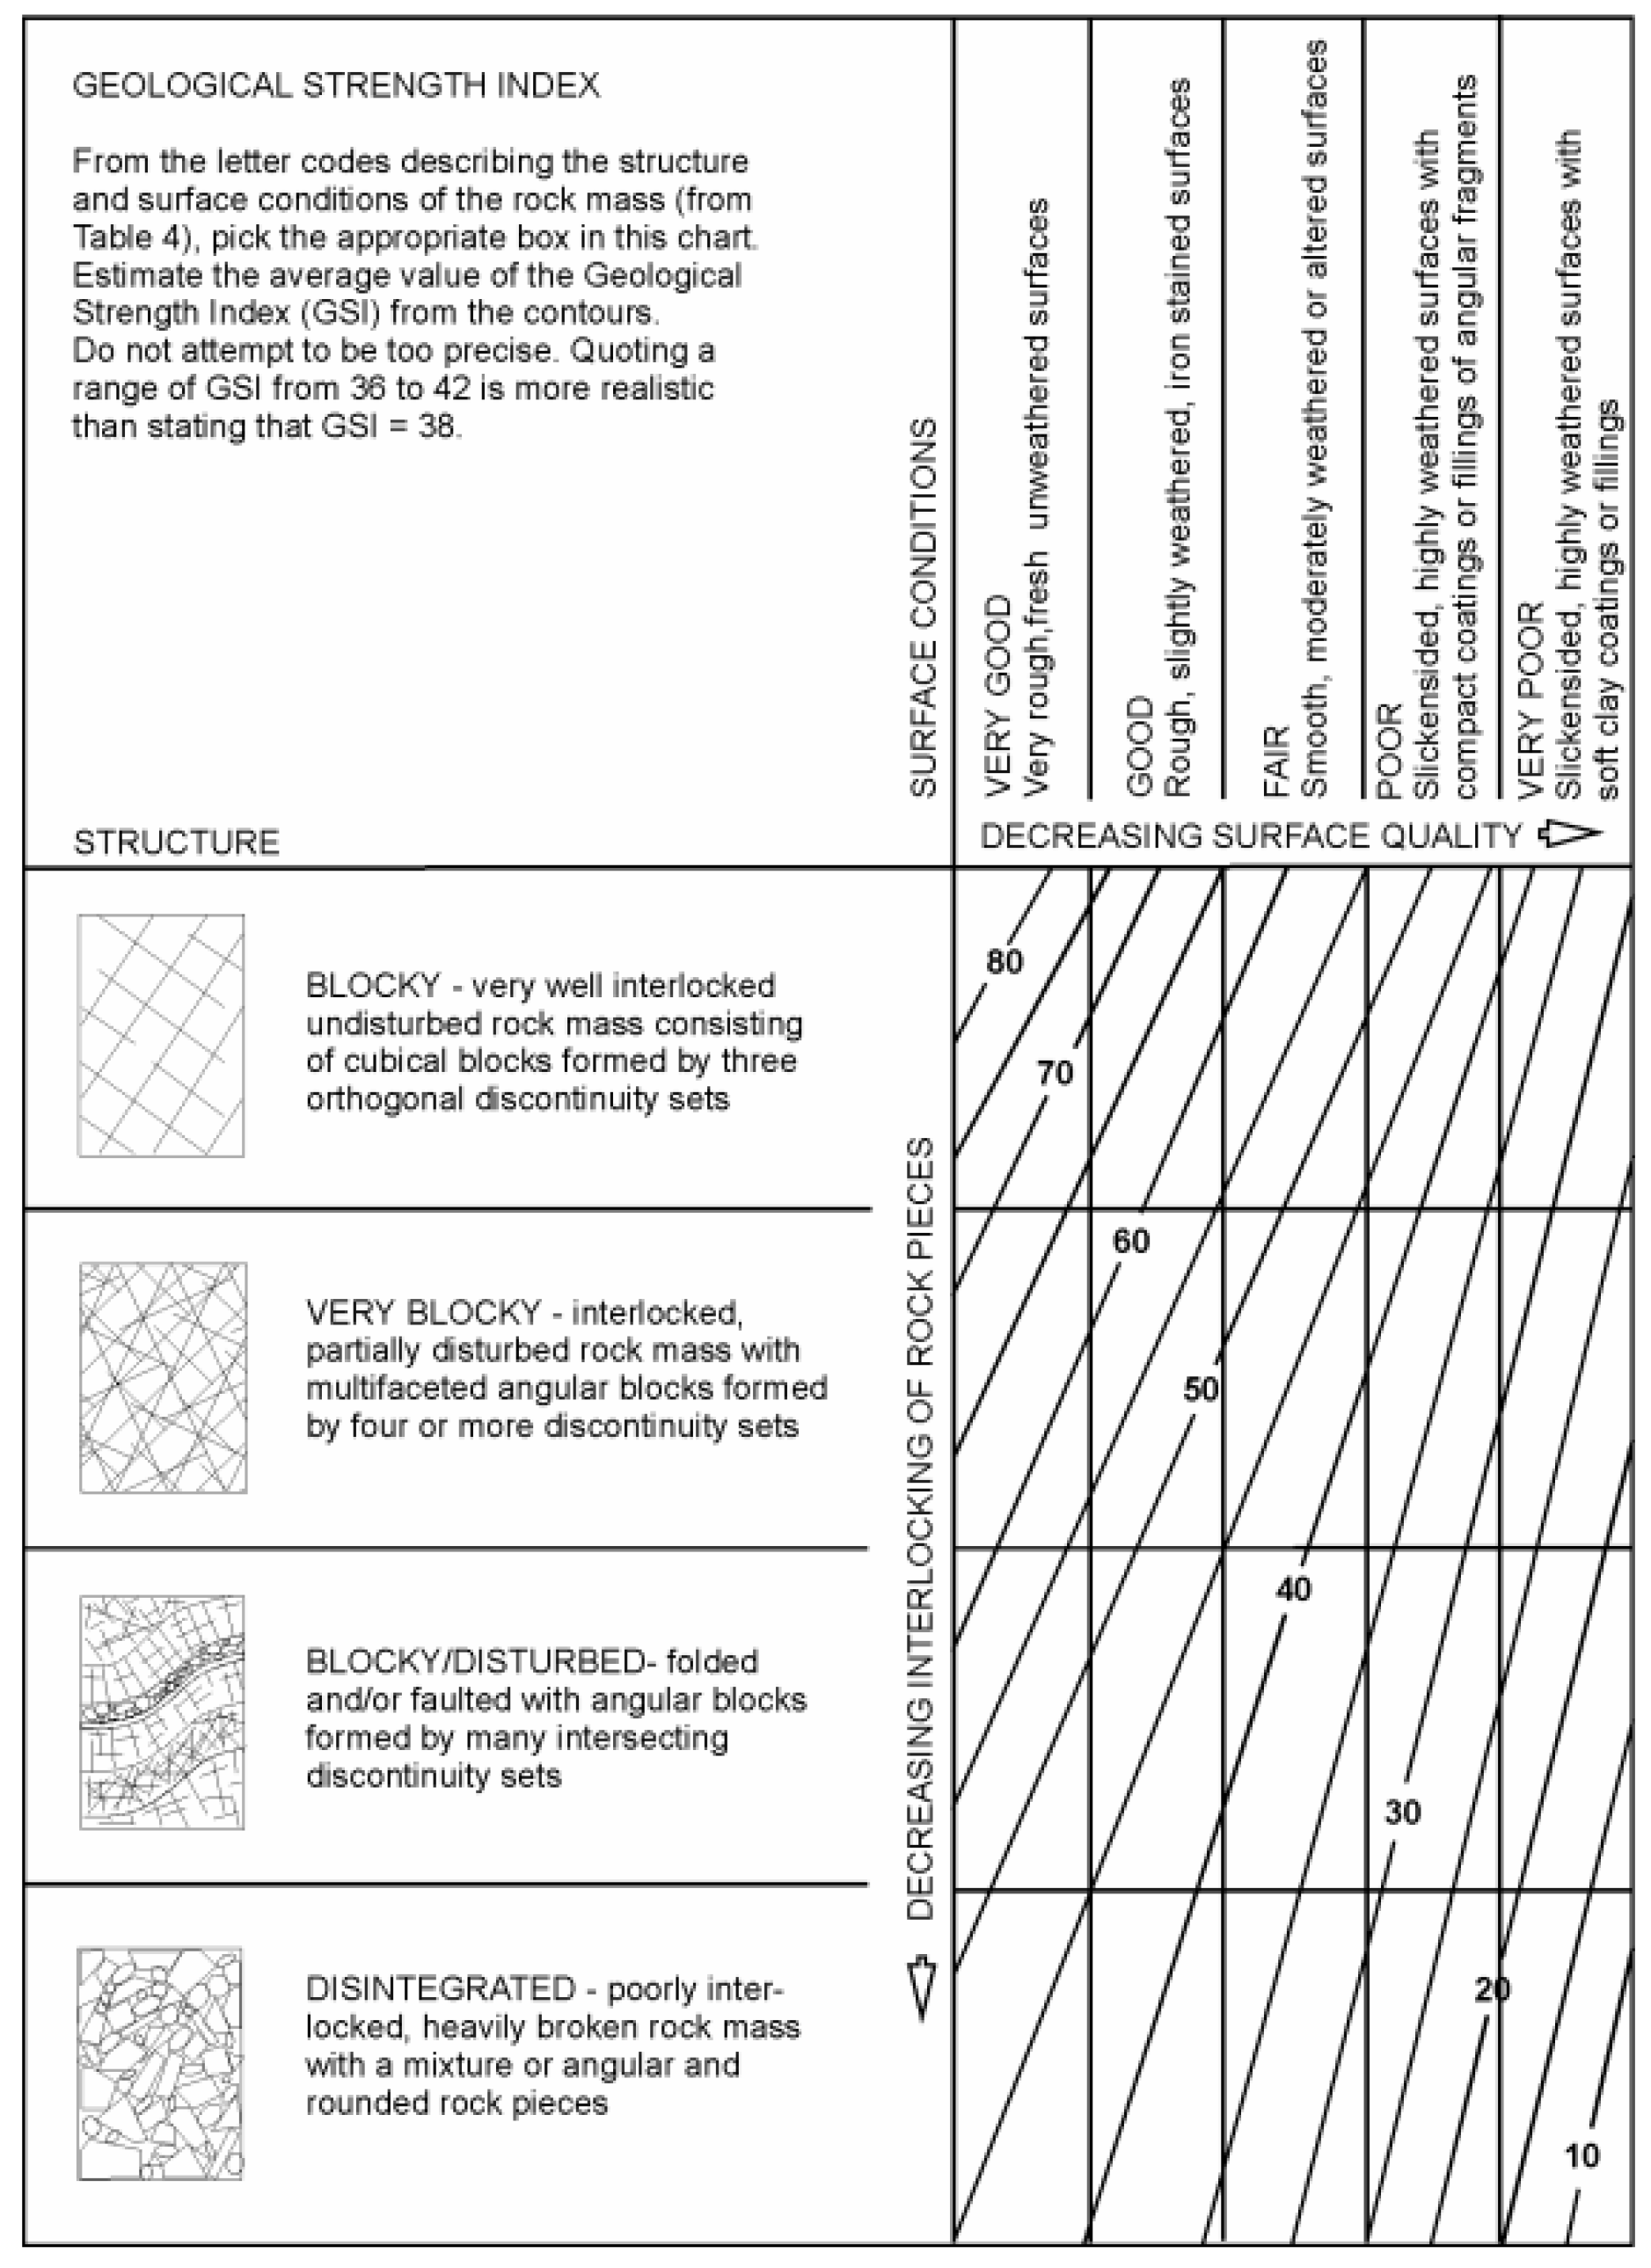
The original GSI table for jointed rock masses considers two qualitative variables, namely the interlocking of rock pieces (vertical axis) and surface quality (horizontal axis), grouped into six and five categories, respectively. The categories for interlocking of rock pieces indicate the number of interlocking joint sets (e.g., three intersecting joint sets for the blocky condition), while the categories for surface quality focus on the surface aspect of the joint surfaces (e.g., smooth or rough) and the degree of weathering. All these categories are nominal in the form of qualitative assessments (see Table 1). Different combinations of these nominal categories then yield an ordinal, qualitative value of GSI.
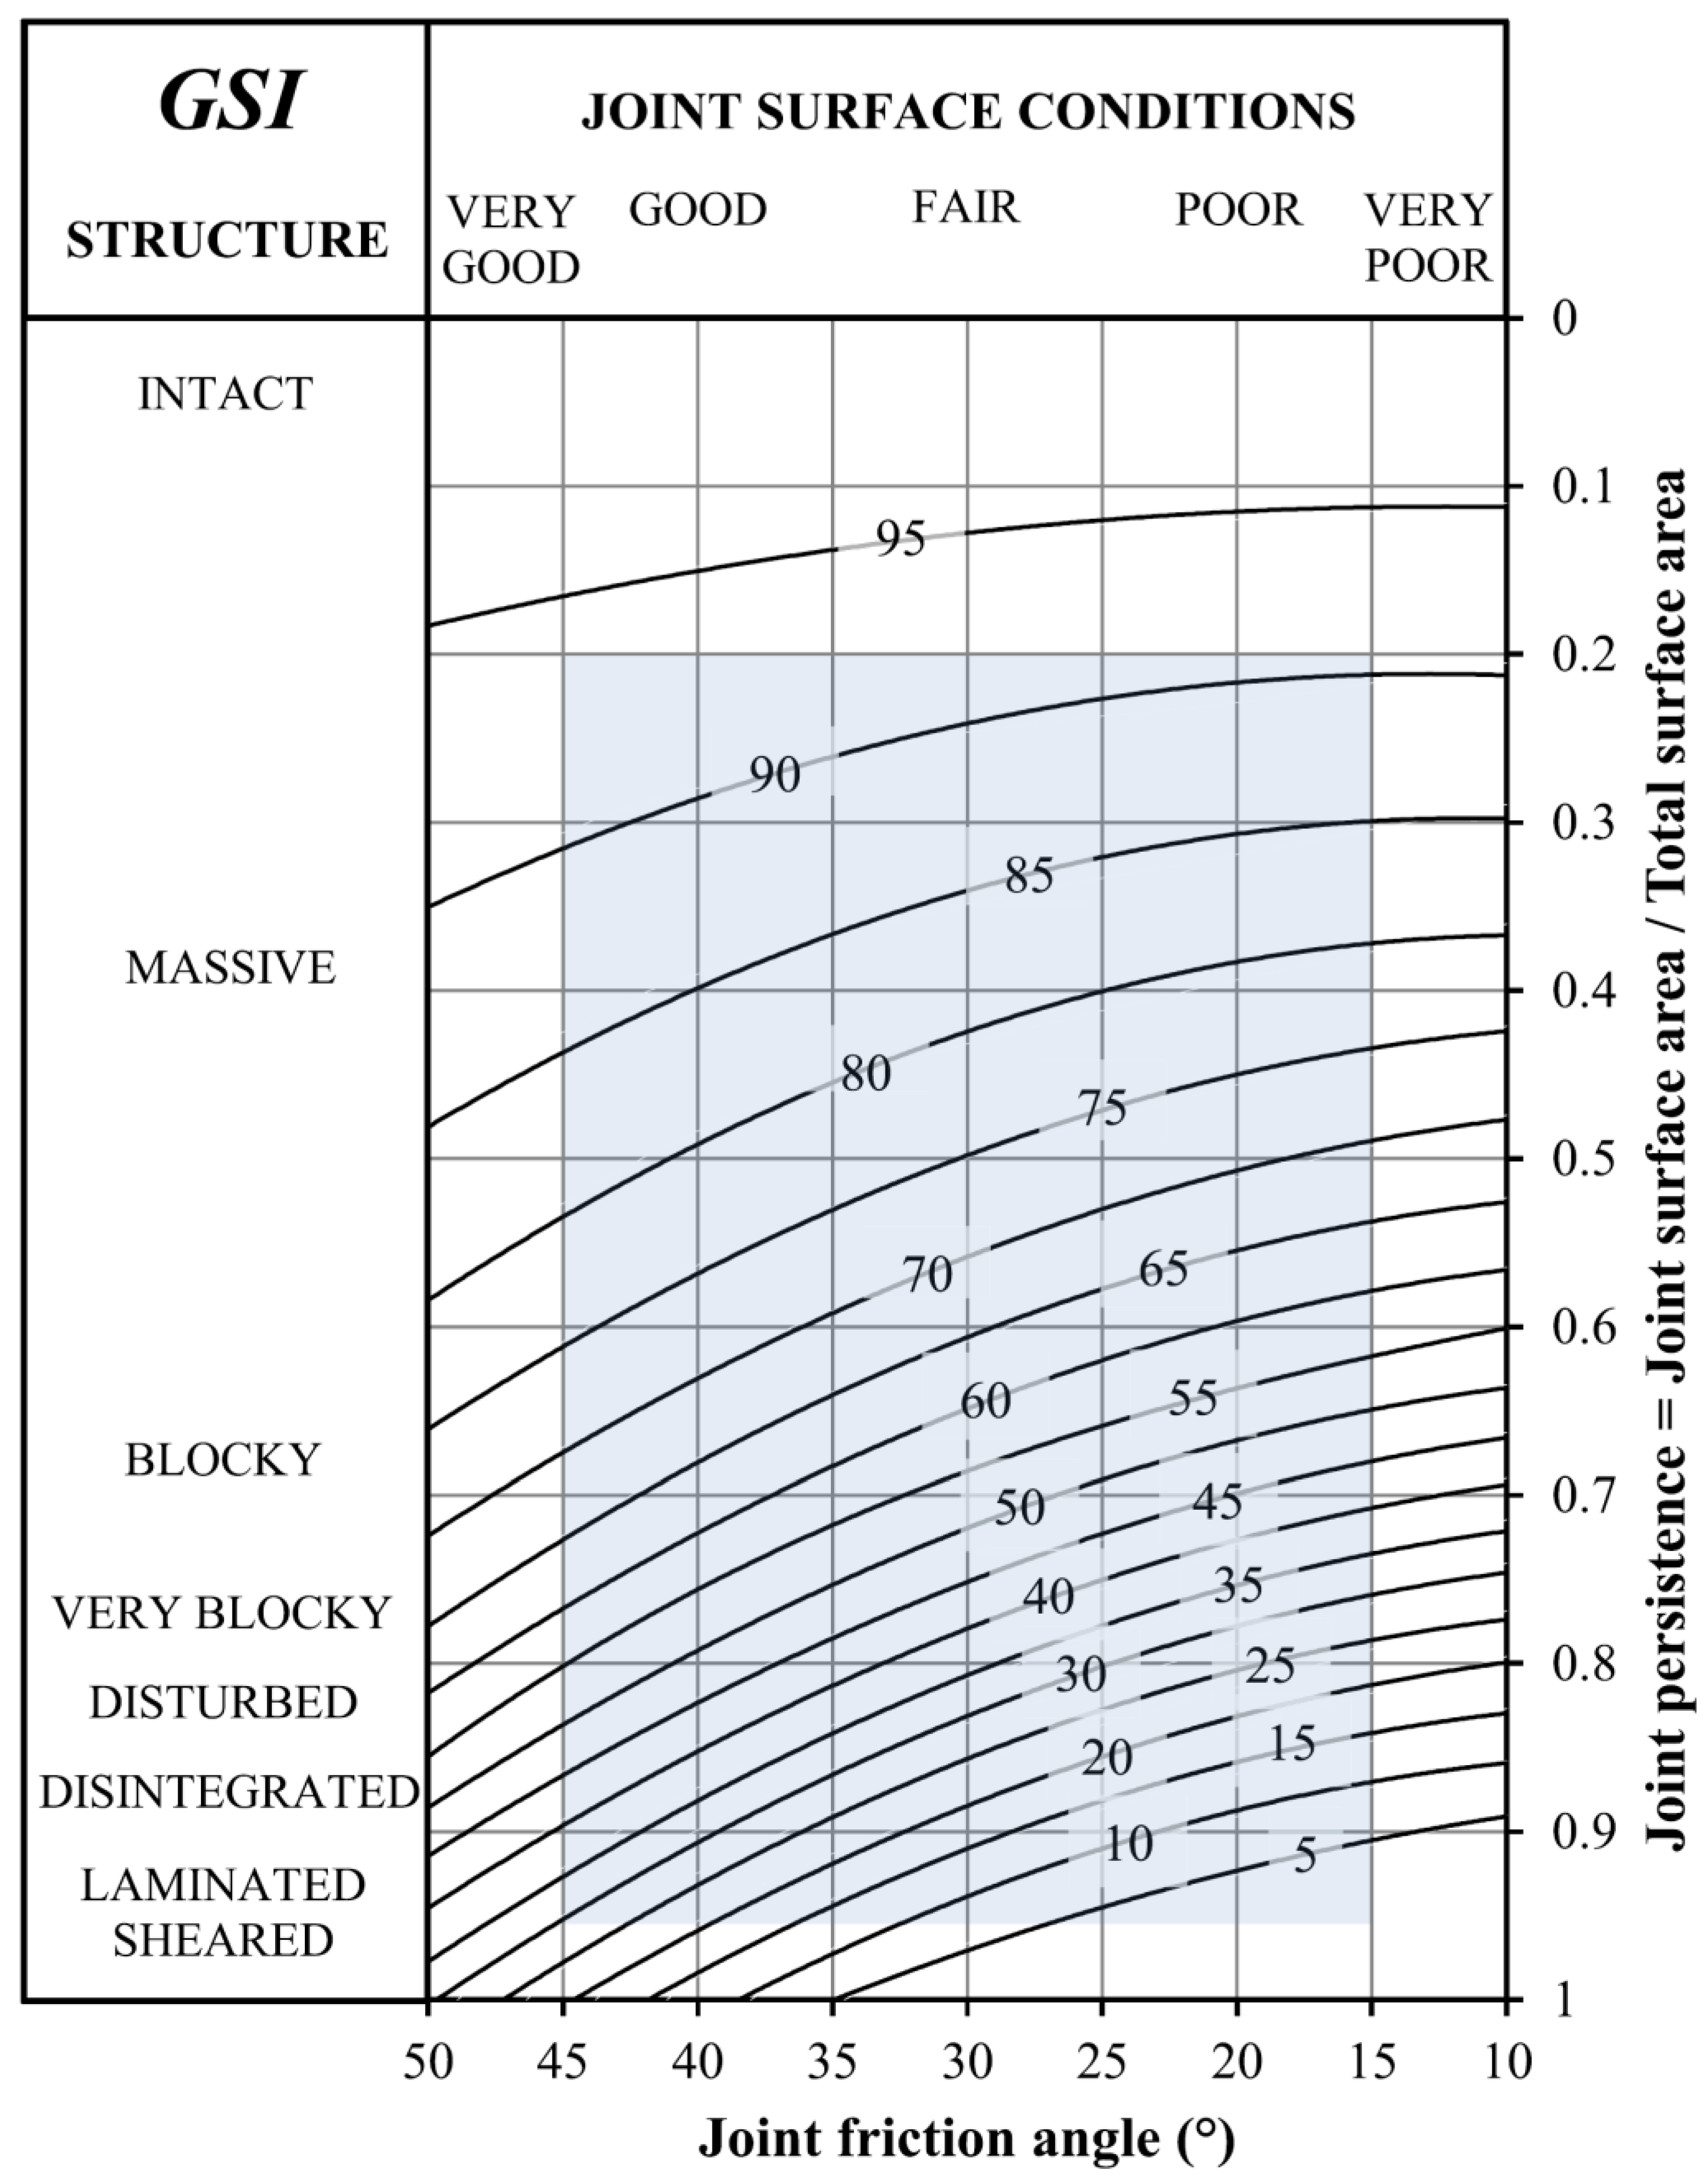
In their attempts to quantify GSI, the majority of the authors have focused on replacing the nominal qualities on the vertical axis (interlocking of rock pieces) with ratio measurements (e.g., fracture spacing, block volume). In one instance [41], the authors have proposed to use multiple vertical axes, including ordinal (RQD/Jn) and ratio scales (volumetric fracture intensity), which creates the false illusion of bias-free nominal scales. Note that even RQD cannot be considered to be a true ratio measurement due its biased definition (see Section 3.2). The horizontal axis has remained a nominal quality in all the quantification attempts except in [56], but we argue against the practicality of actually measuring friction angles in the field.
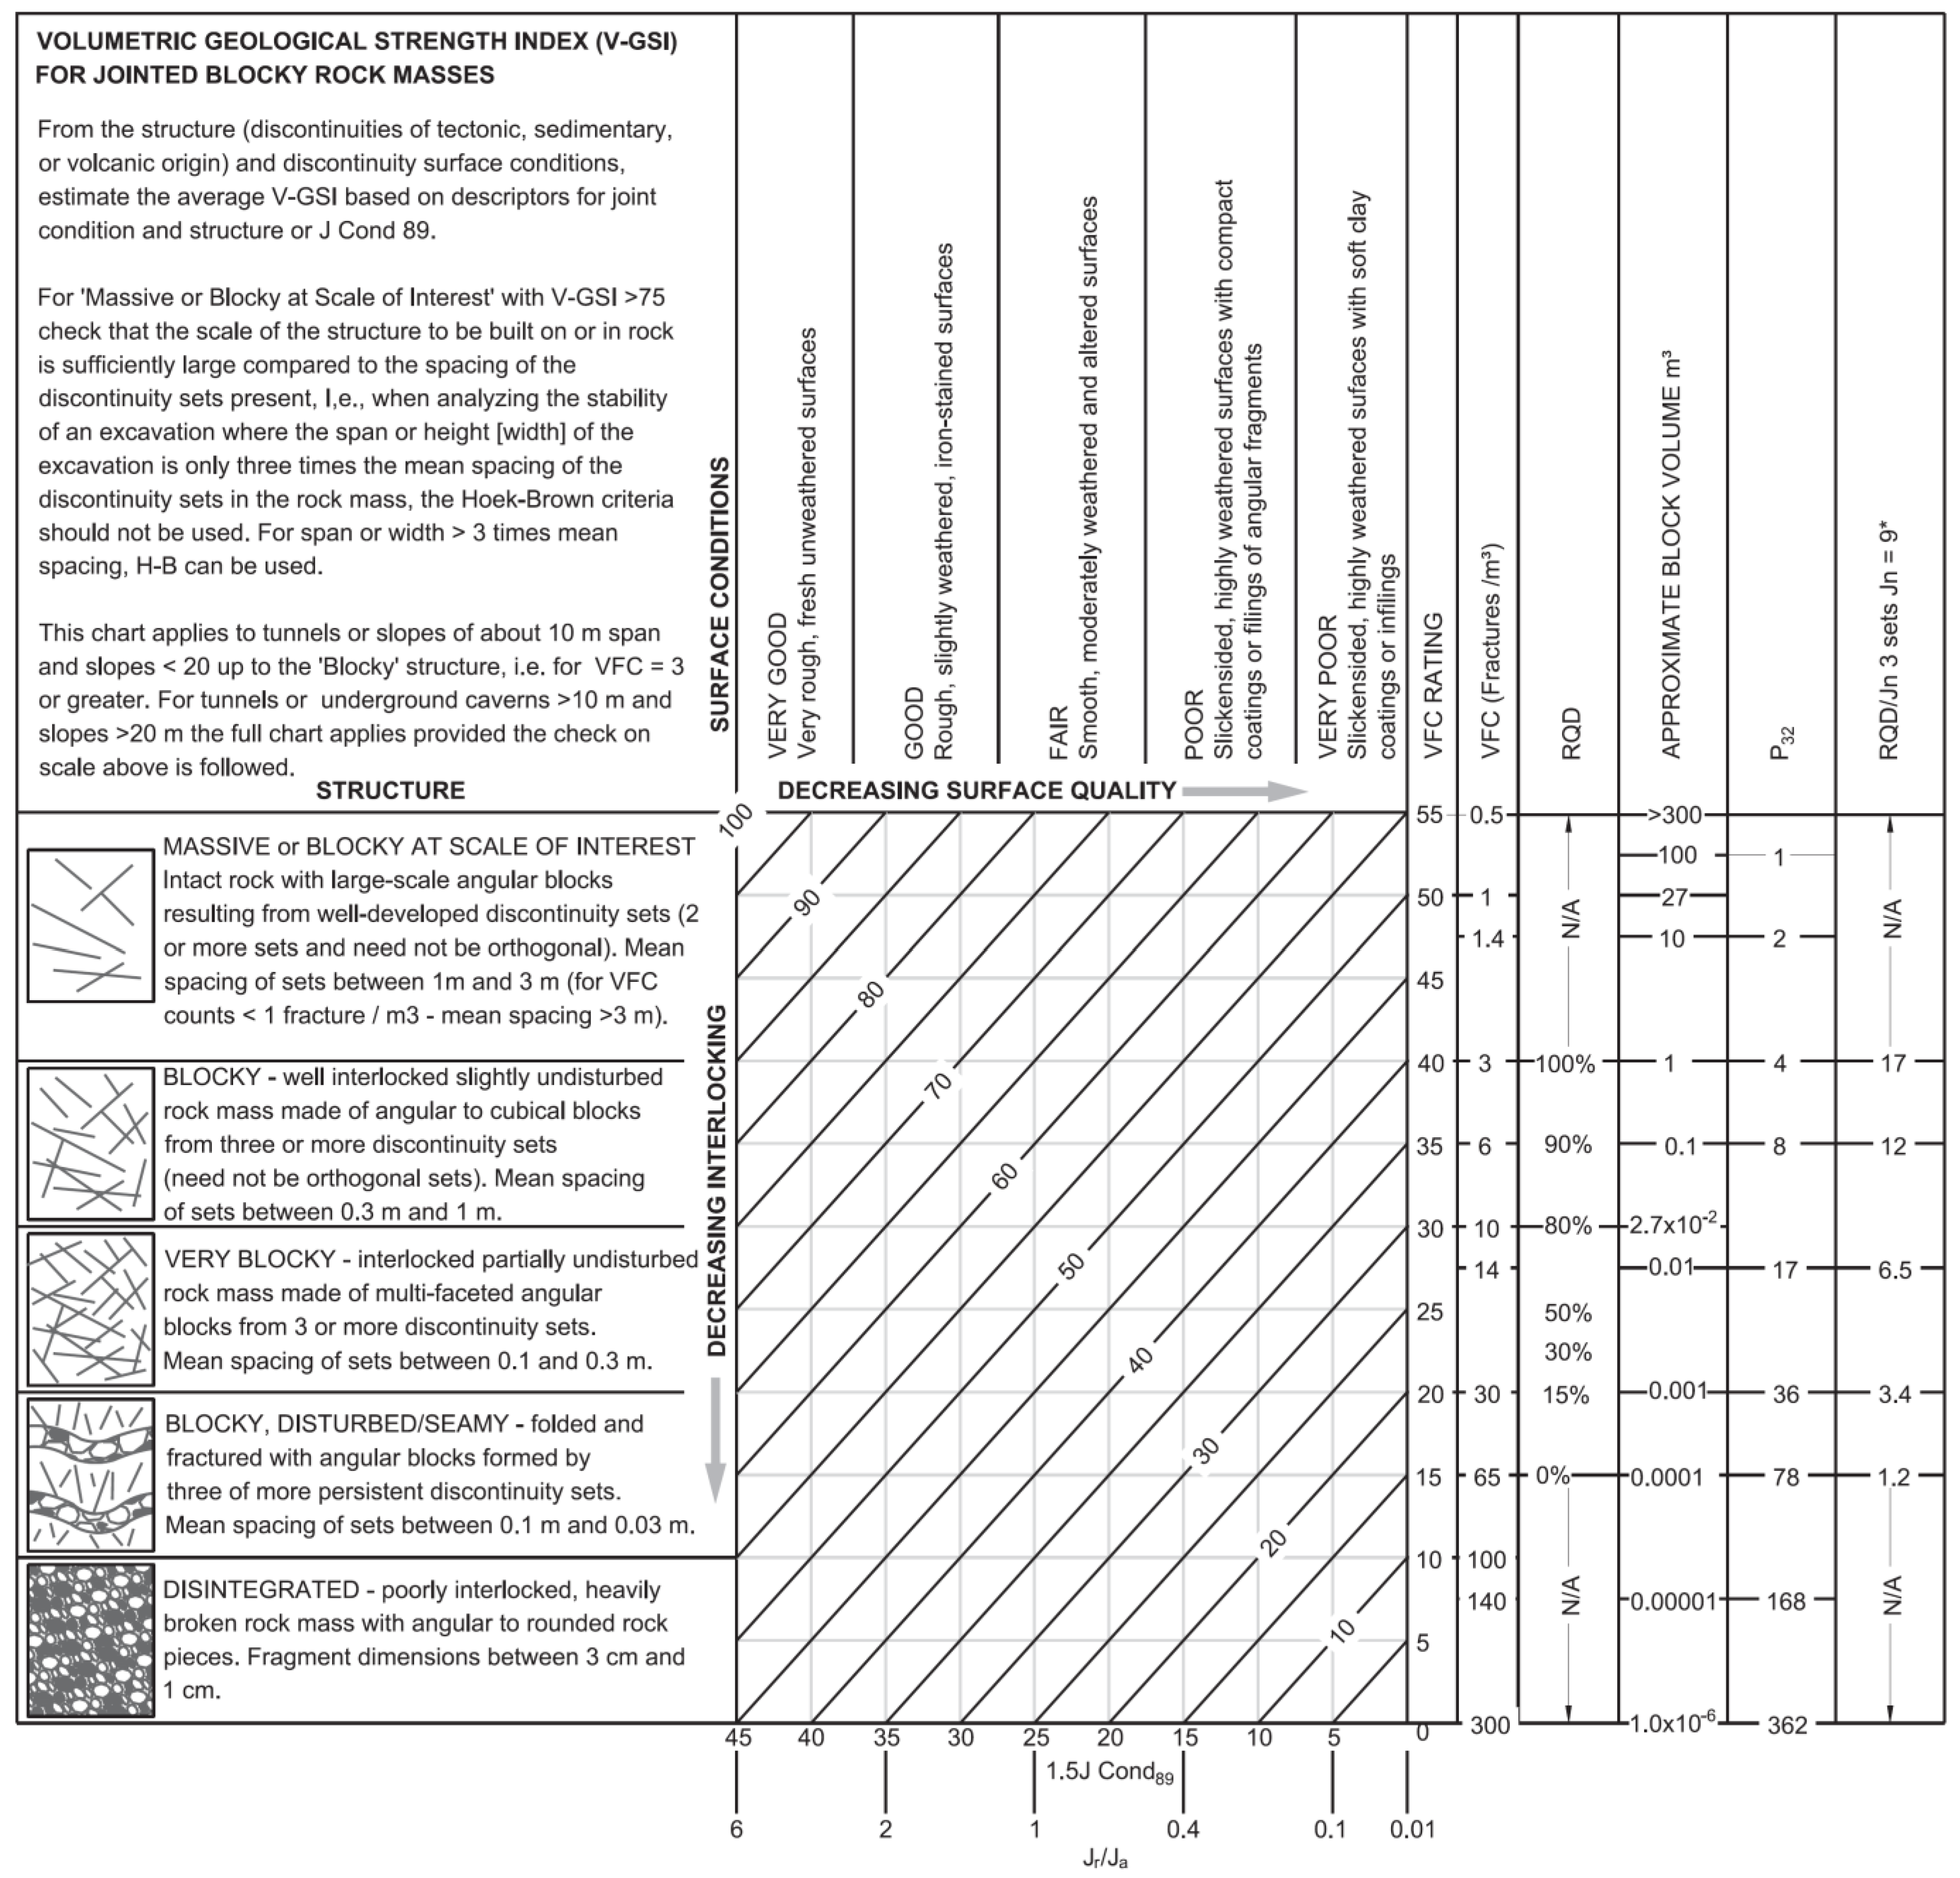
The V-GSI approach [41] also implies a relationship between volumetric fracture count (VFC) and volumetric intensity (P32) that yields the same and rather small average fracture area (1.2 m2 to 1.3 m2) across the different spectrum of structural rock mass conditions (massive, blocky, very blocky, and disintegrated conditions). This result would require further examination since it does suggest that network connectivity and block forming potential are both independent of the fracture size.
On these premises, we can conclude that none of the quantification attempts has succeeded in transforming GSI into a true ratio measurement. Interestingly, transforming the vertical and horizontal categories into ratio measurements would not solve the problem, since GSI itself does not meet the definition of quantity (see Section 1.1) and therefore it cannot be measured. Using ratio measurements to replace the vertical and horizontal axes in the GSI table may help engineers to confirm a range of GSI; however, quantified GSI values have been found to agree with more conventional observations [37,38], and therefore we argue that the quantification methods do not provide a significant or intrinsic benefit (this concept is discussed further in Section 3.4).
3.2. Using RQD to Quantify GSI
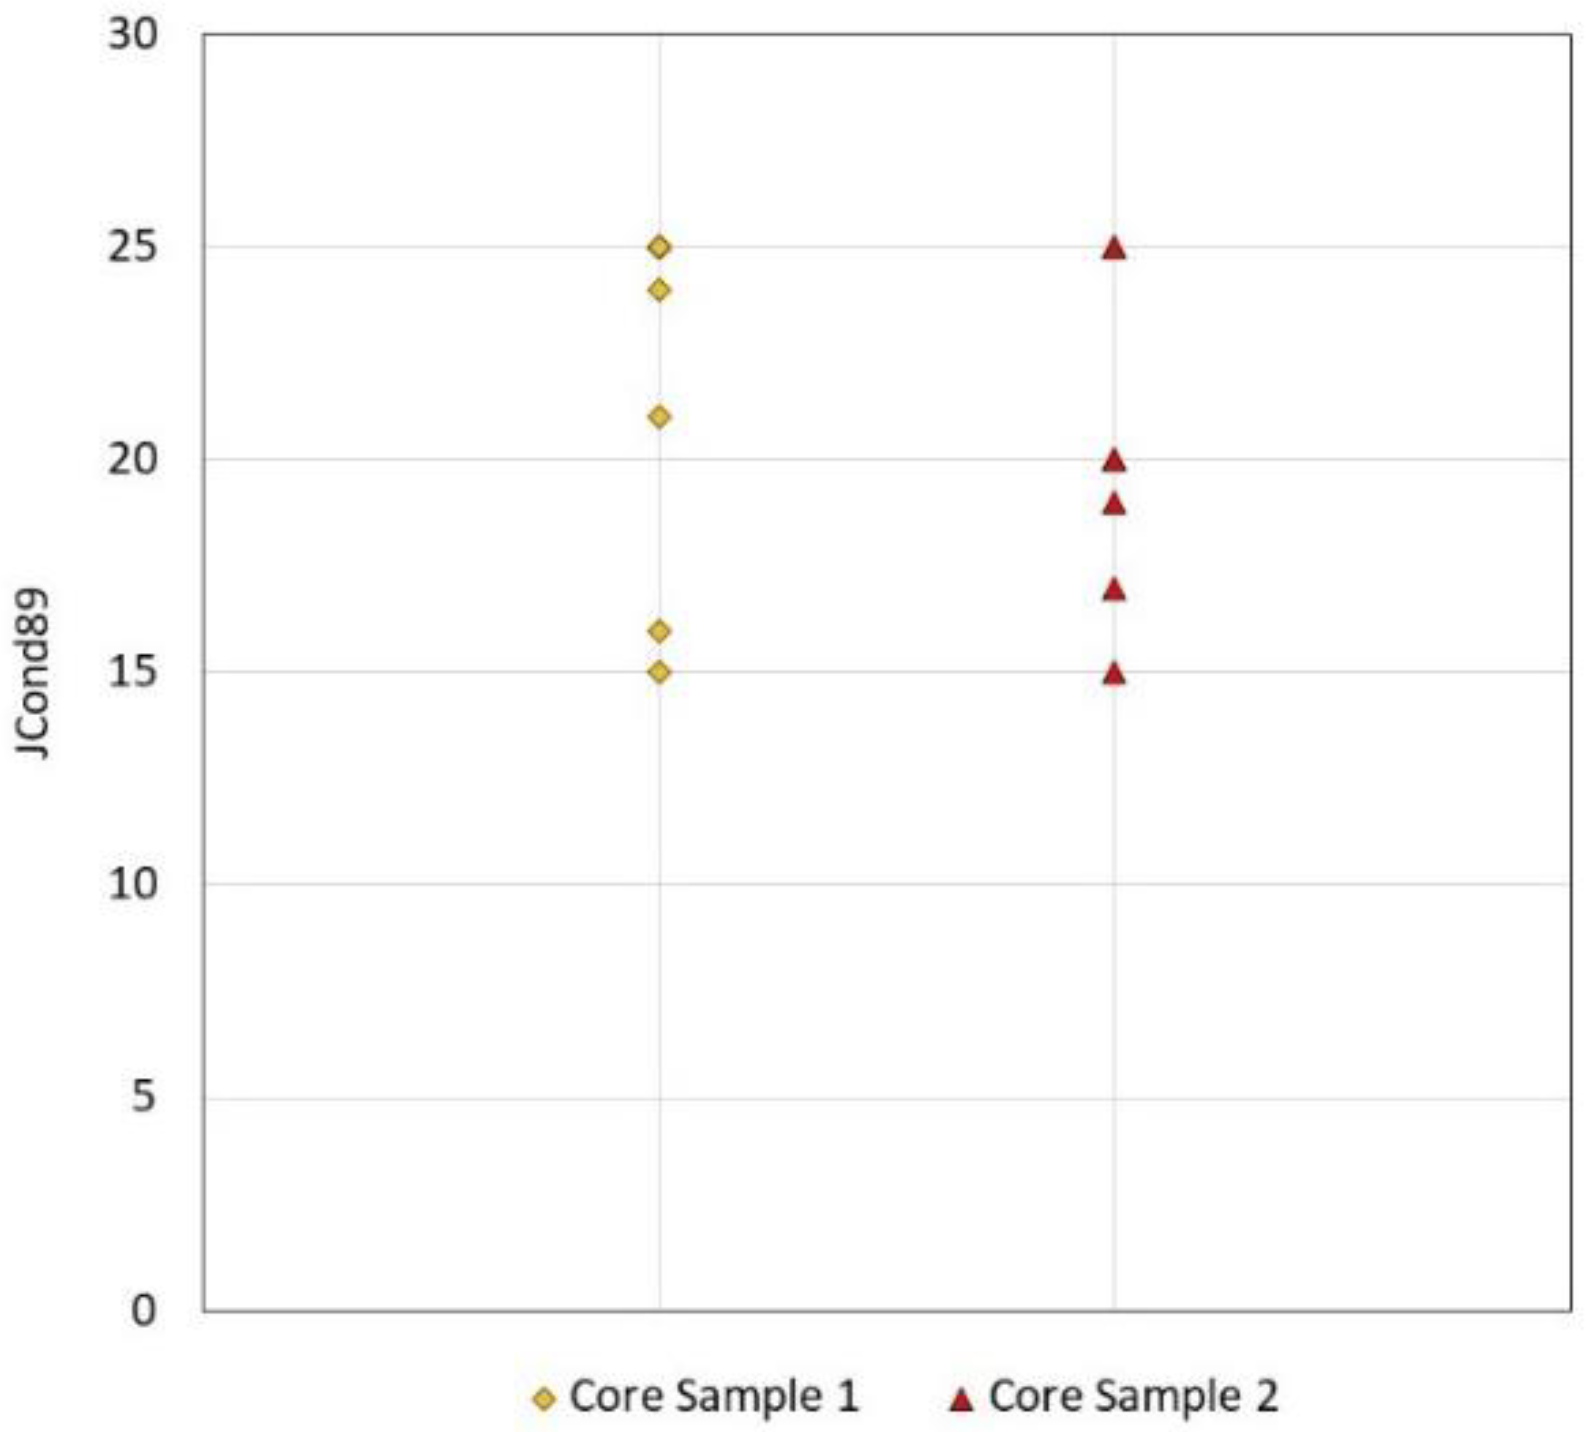
One important limitation includes the use of RQD to quantify the rock mass structure and the use of parameters that are either qualitative (e.g., joint conditions factors from RMR or RMi [10,11,27]) or non-directly measurable in the field (e.g., persistence factor joint condition ratings [56]). The joint condition ratings in JCond89, Q, and RMi represent numbers assigned to a qualitative description and thus their use does not justify placing a layer of objectivity upon the derived GSI value. The subjectivity of JCond89 is demonstrated in Figure 2, which shows that the JCond89 ratings calculated by a group of experienced rock engineering professionals for the same core intervals ranged from 15 to 25.
The limitation imposed by the use of RQD produces further interesting arguments, since the authors have actually raised specific limitations of RQD, for example in [41], it was reported that “scale limitations are potentially further exacerbated if RQD is used and its bias and anisotropy are not well understood”.
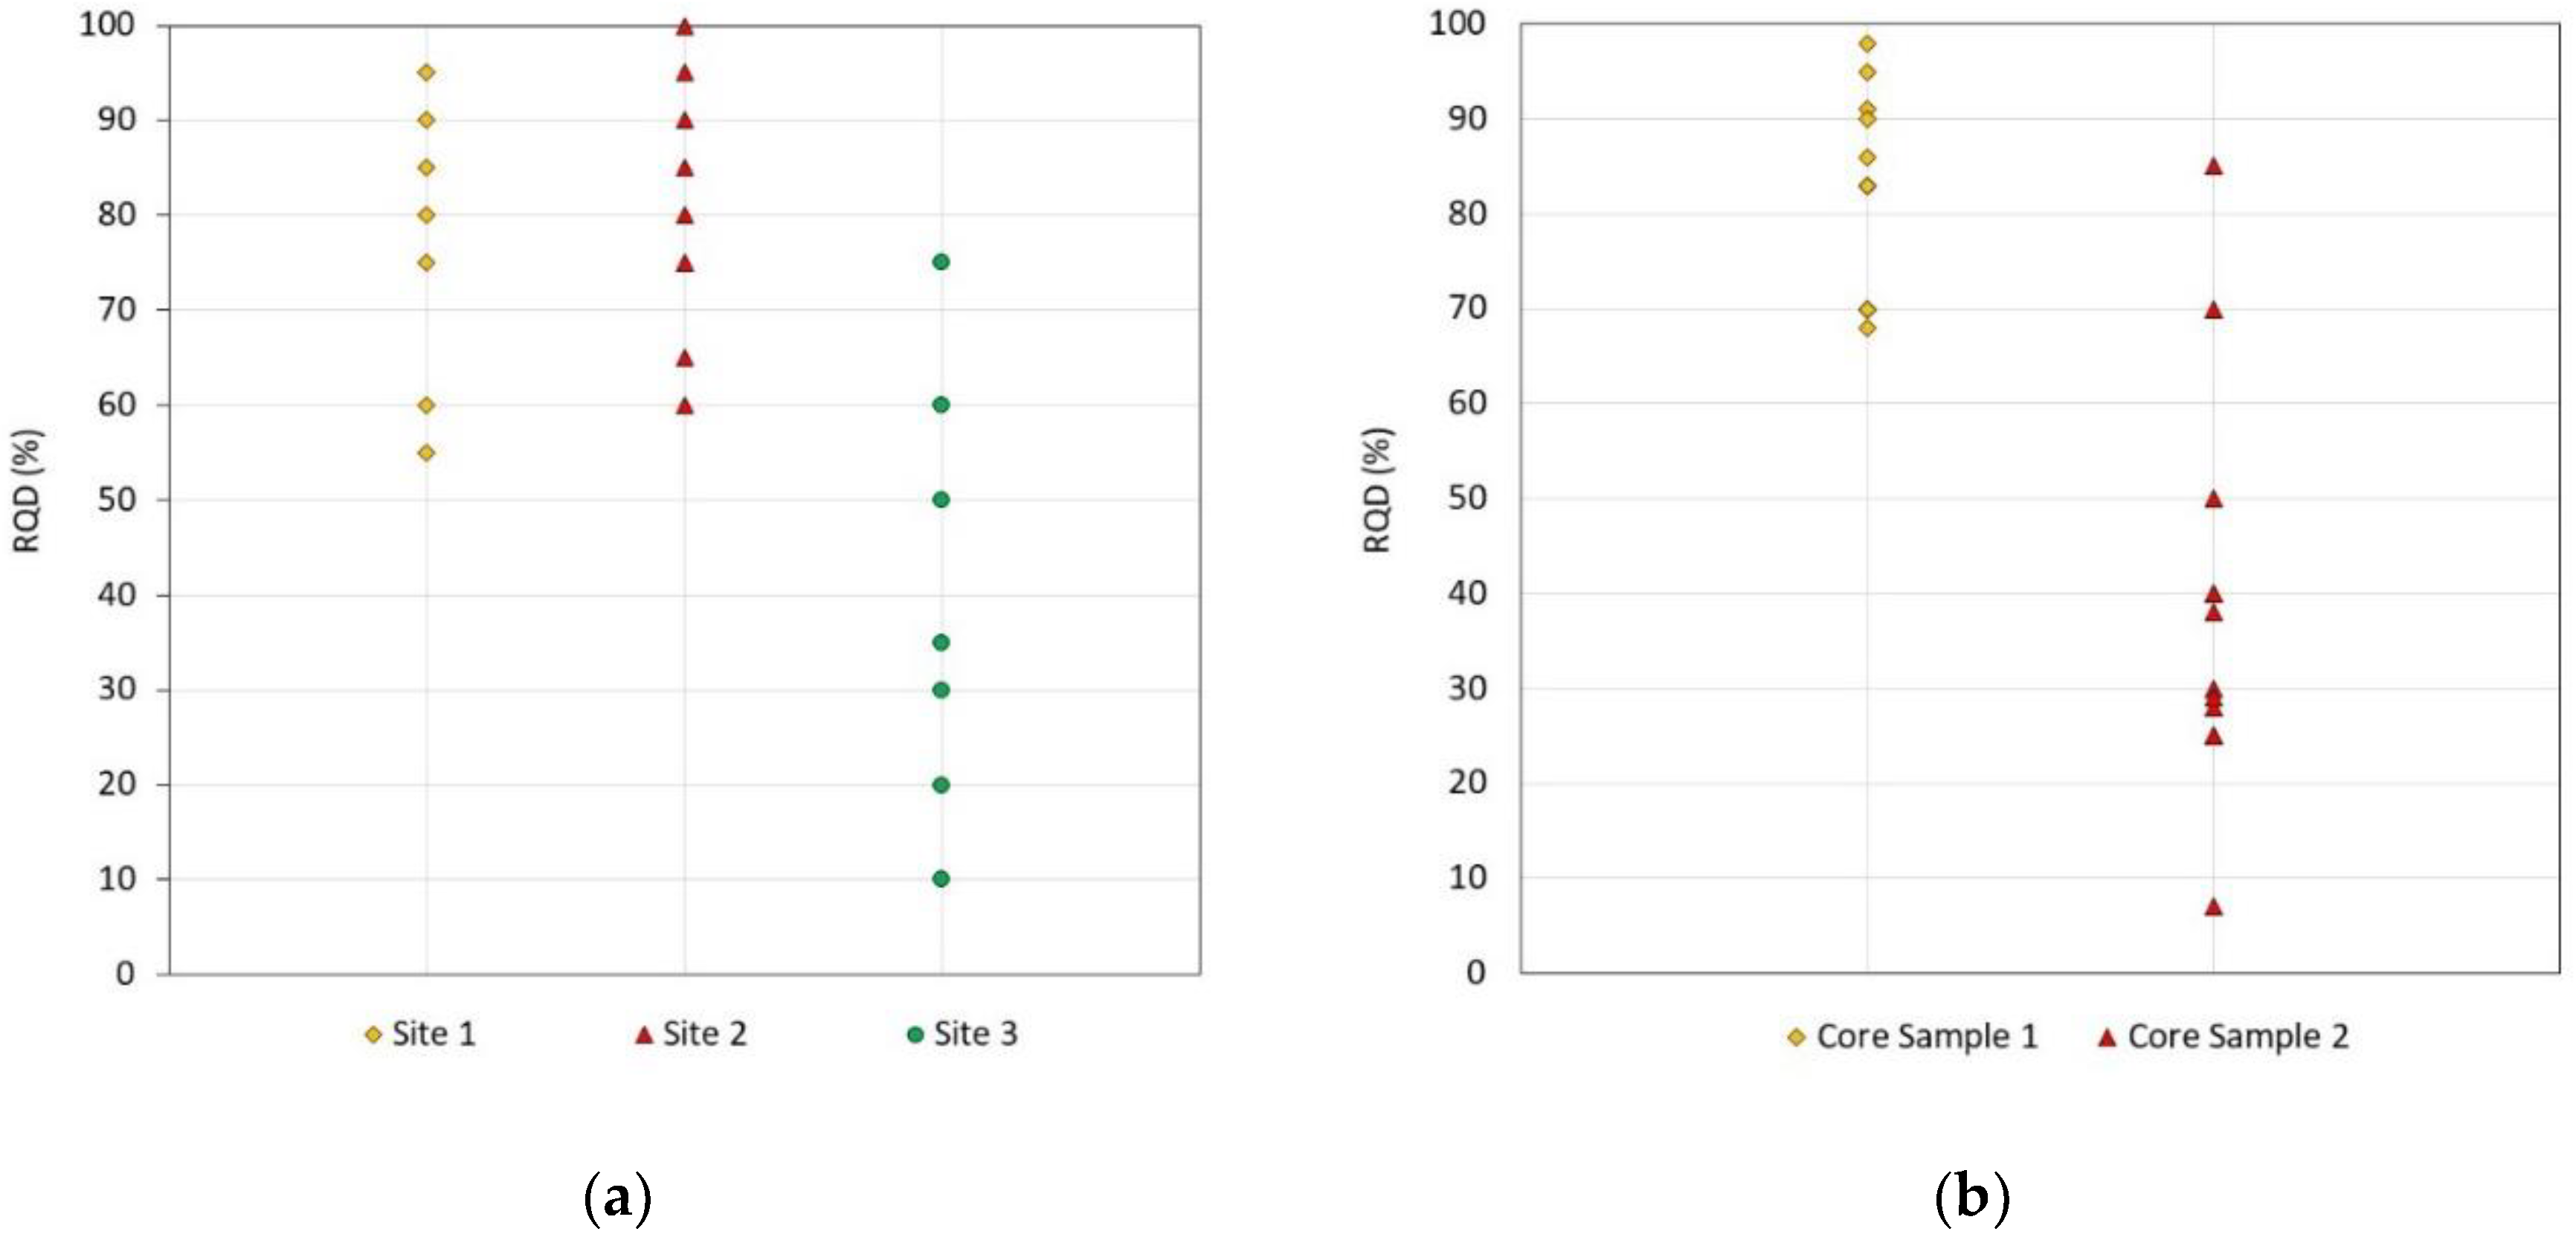
At the same time, we need to consider whether RQD is still relevant in todays rock engineering [1,57]. The popularity of RQD and its use in the industry is somehow in contrast with its limitations. For instance, engineers tend to overlook its subjectivity, which manifests when differentiating between natural and mechanical fractures, as well as determining if the core meets the hard and soundness requirement [58]. This subjectivity can be attributed to human factors, cognitive biases [59], and the confusion created by the existence of many different companies’ specific core logging manuals. [57] noted that rock engineering practitioners in the UK and most of Europe ignore the hard and sound requirement when determining RQD, while those in other locations take it into account. The subjectivity of RQD and its associated lack of precision is demonstrated in [57], where the range of RQD calculated by different professionals for three outcrops varied by as much as 70 points (Figure 3a). A similar study was performed by the authors of this paper, and our results show that the RQD values varied significantly for the same core (by up to 78 points, as shown in Figure 3b).
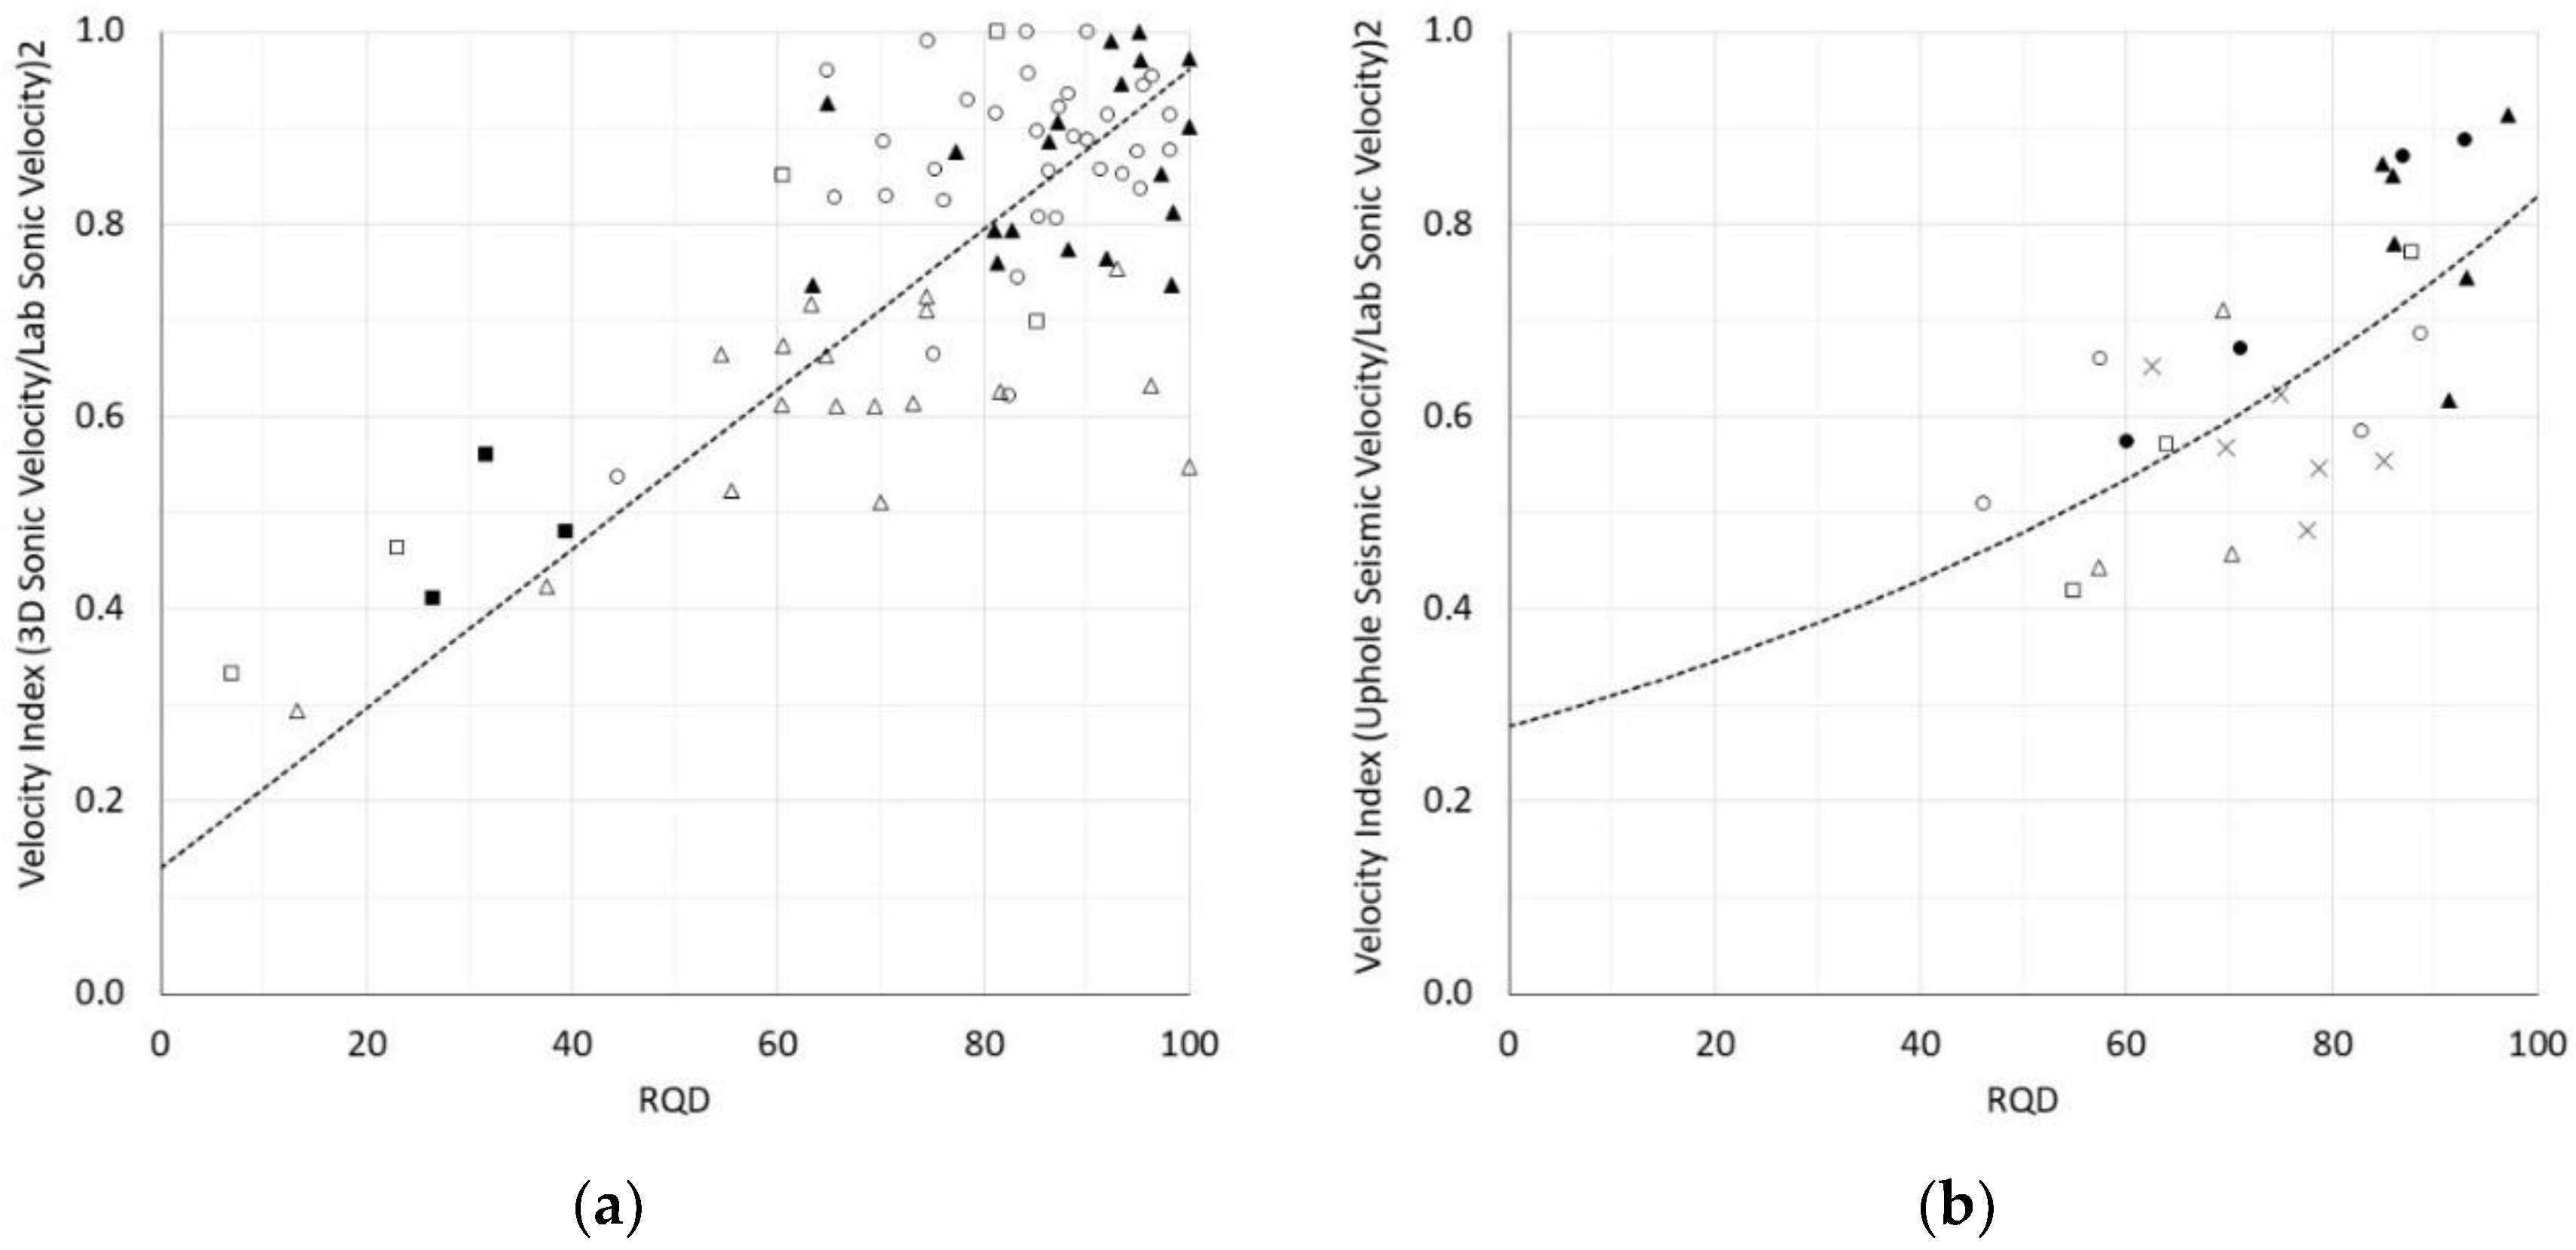
There remains another fundamental problem with RQD, that is, its reliance on an arbitrary 10 cm threshold. Figure 4 shows the correlations proposed in [9] to claim the superiority of the 10 cm threshold over a 15 cm threshold. These charts are not accompanied by details about lithology (only generic rock types are provided, but not directly linked to a legend), nor are there indications of whether the data below represent average RQDs along the boreholes. Furthermore, the two charts use correlations for different parameters (see y-axes on both charts) as validation tools, and to reduce data scatter the correlation for the 10 cm threshold, they ignore six of the eleven sites included in the database for the 15 cm threshold.
These comments lead to the rather provocative question of whether the arguments in favor of using the 10 cm threshold lack a proper scientific validation. Invoking its continuous use over the years is not sufficient to invest scientific validity upon RQD. On the contrary, it further raises the question of why the rock engineering community accepts RQD’s many limitations, but at the same they subject researchers proposing new methods (whether empirical or numerical) to stricter validation criteria. This discussion reinforces the claim by [2] that many empirical rock engineering methods suffer from the absence of scientific replication. While RQD does hold a fundamental part in the historical development of rock engineering, we should not be afraid to move away from it and substitute it with parameters—like fracture frequency [58] and connectivity parameters [2]—that are quantitative measurements and not qualitative assessments.
3.3. GSI Quantification Does Not Improve Precision
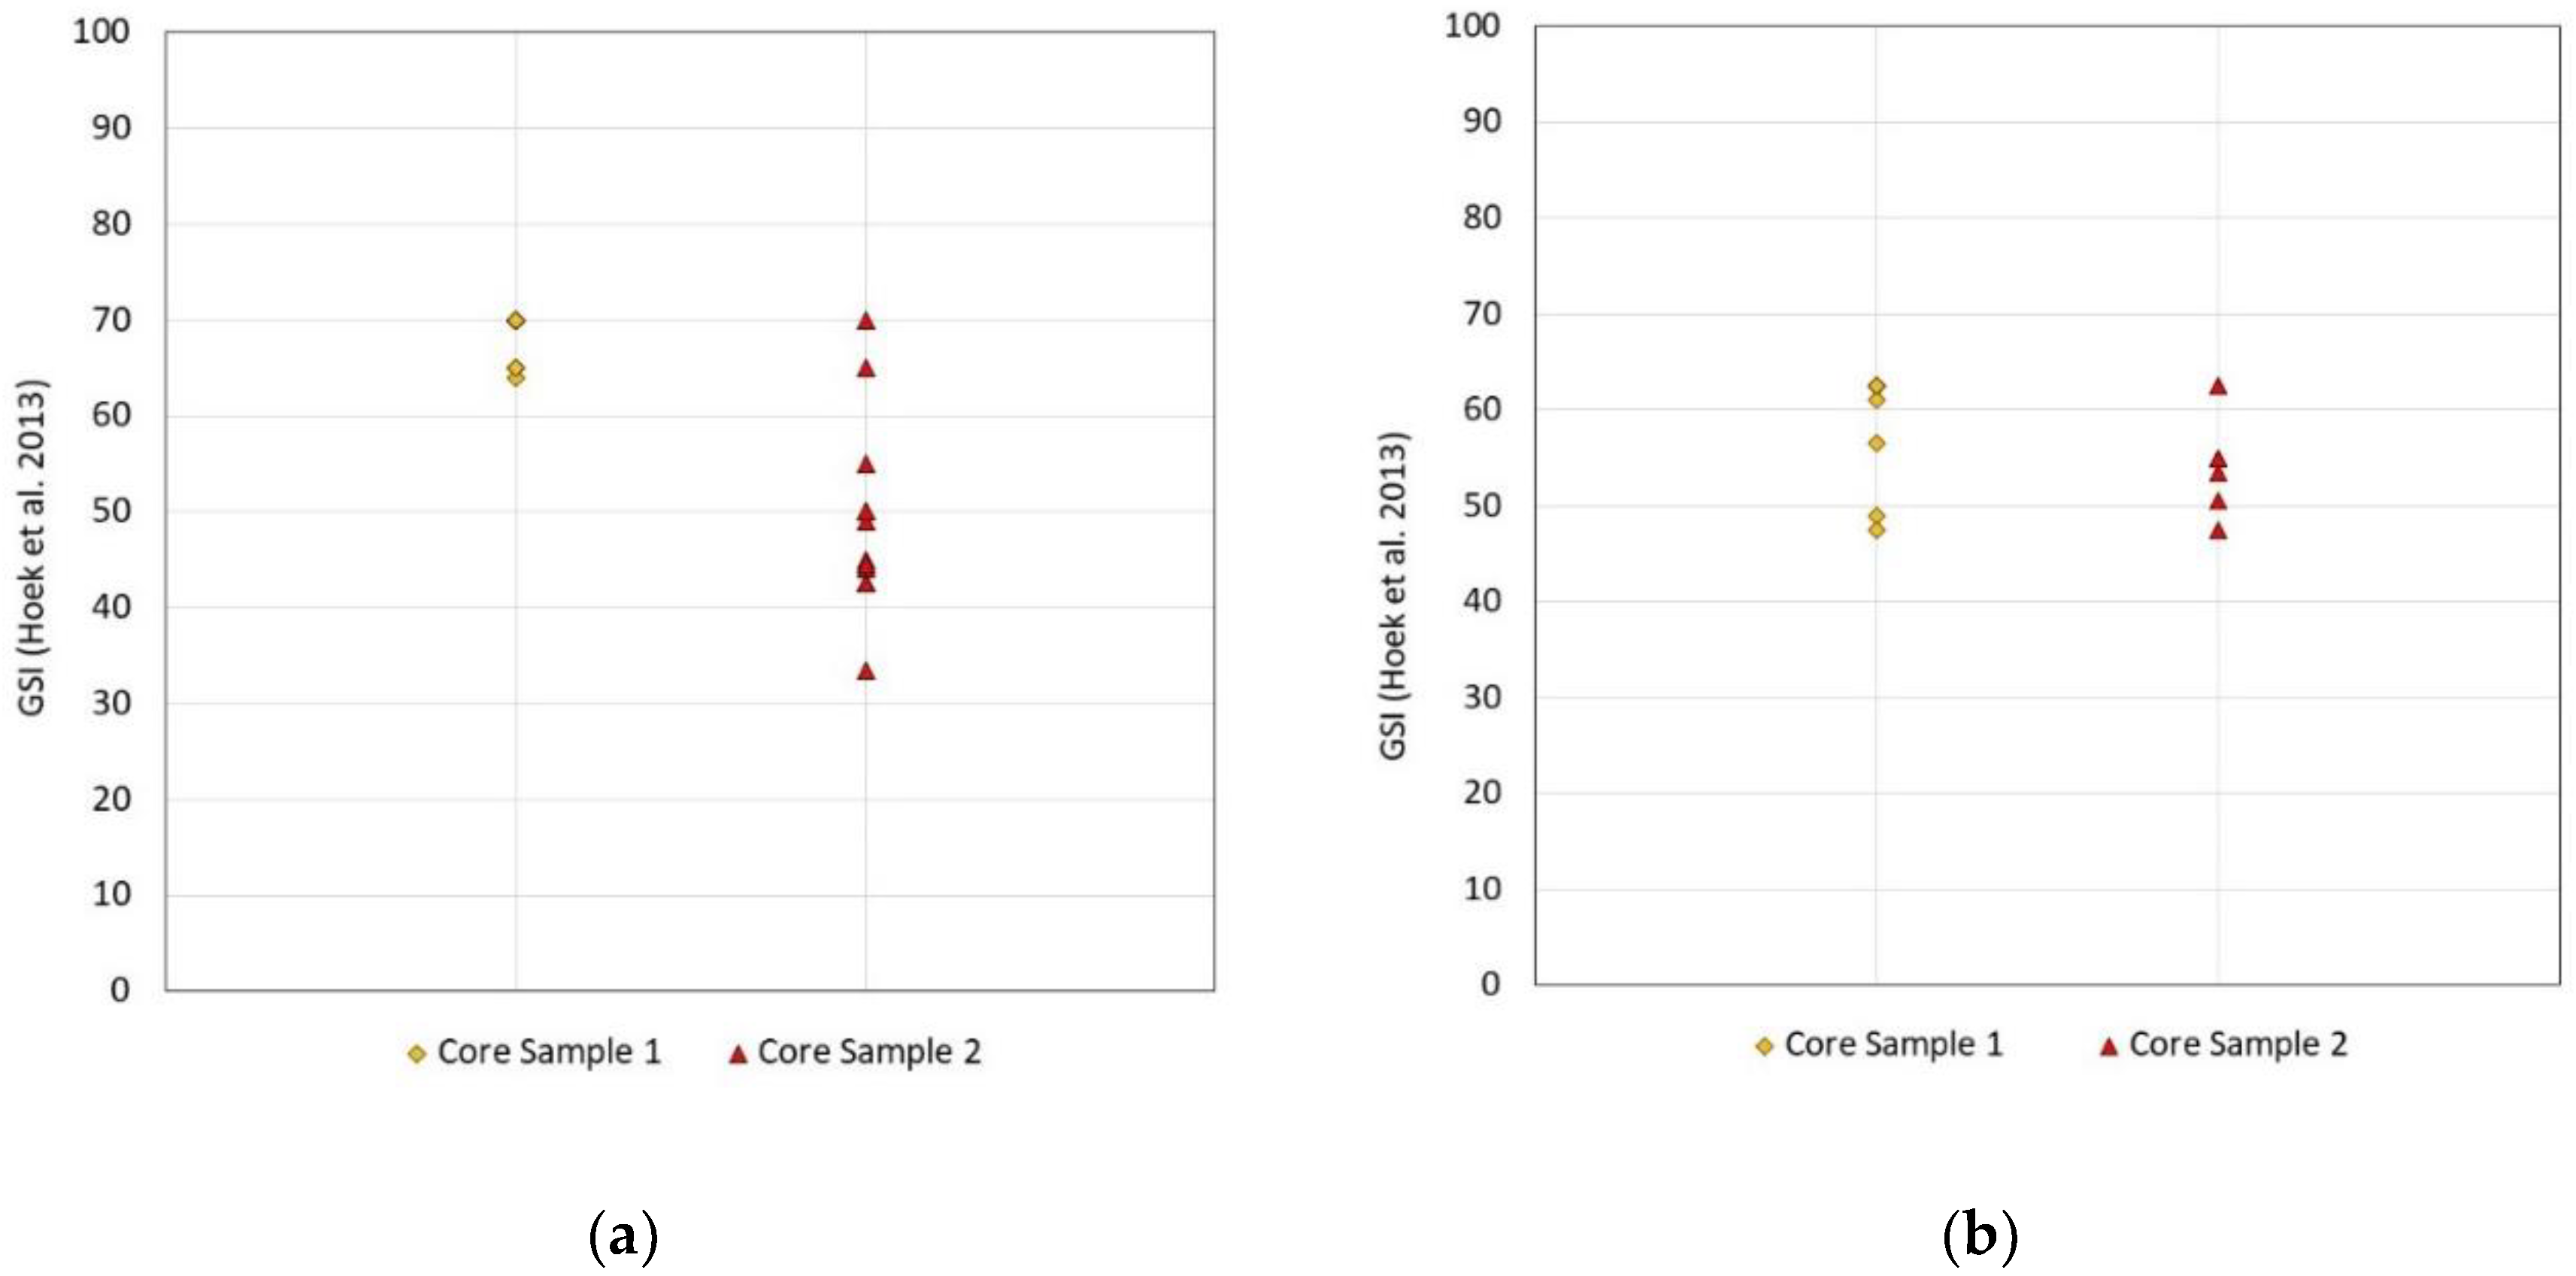
The subjectivity associated with the parameters used in quantifying the axes of the GSI chart actually results in a lack of precision (when assessing those parameters) and therefore imprecisely quantified GSI values. Figure 2 and Figure 3 indeed showed a significant scatter in the RQD and JCond89 measurements. The scatter in parameters used as quantification tools will inevitably result in scattered GSI estimations. This is demonstrated in Figure 5 using the GSI quantification method proposed in [38] and the data included in Figure 3. The results show significant scatter—and accordingly a lack of precision—when using RQD and JCond89 to determine GSI, with the exception of core sample 1 in Figure 5a. However, the smaller scatter is only artificial due to the RQD cutoff of 80% used in the formulation [38] of the GSI quantification method.
The fact that GSI quantification methods cannot provide more precise estimates was further demonstrated in [60], who indicated that the median GSI value between different quantification attempts ranged from 49 to 64 for their Monte Carlo simulations. Using different quantification approaches, [37,38] showed that quantified GSI values and GSI estimated using the original chart values fell within ±10 of each other. In general terms, most quantification methods showed that quantified GSI values fell within ±5 of the GSI from the qualitative chart. On these premises, it becomes apparent that the search for quantification is linked more to a resistance of accepting a degree of variability for rock mass quality, rather than the possibility of precisely measuring GSI.
While several authors state that their quantification reduces GSI’s dependency on experience, many of the parameters used in quantifying the GSI chart are not independent of experience and are therefore subjective. An interesting recurrent theme is that despite emphasizing the need for a quantified GSI chart in order to reduce subjectivity, increase precision, and reduce the dependency on experience, the authors often do not demonstrate this in their respective papers. Published papers generally only include GSI values determined from the author(s) of the paper; however, in order to examine the precision of the proposed quantification method, GSI values estimated by engineers with different degrees of experience examining the same rock mass should be considered.
3.4. GSI Quantification and Practicality of Data Collection
Another main limitation of the quantified GSI charts is their lack of practicality. Many of the parameters used in the quantifications are often not collected or collected differently than what is specified in the quantification papers. For example, several quantified GSI charts use the RMR89 joint condition rating or some of its parameters; however, mining and consulting companies may only collect data for RMR76. For those that do collect data for RMR89, they may determine JCond89 differently, using either the overall descriptive ratings (Table A in RMR89 [11]) or by adding the ratings of individual parameters (Table E in RMR89 [11]). Additionally, many companies do not collect geotechnical data for RMi, thus making it difficult to implement the quantification processes which depend on it. Another layer of complication is that the companies that do collect the relevant data may not collect it in the same way outlined in the quantification papers, making it difficult to reliably implement these quantifications in the field and in the office. Some of the quantifications are also difficult to apply in the field, making them impractical for field use and deviating from the original intent of GSI, which is simple to be applied in the field [19]. Their complexity makes it especially difficult for junior engineers to use, and it is well known that junior engineers are often the ones tasked with collecting data in the field.
3.5. GSI Quantification Methods and Geology
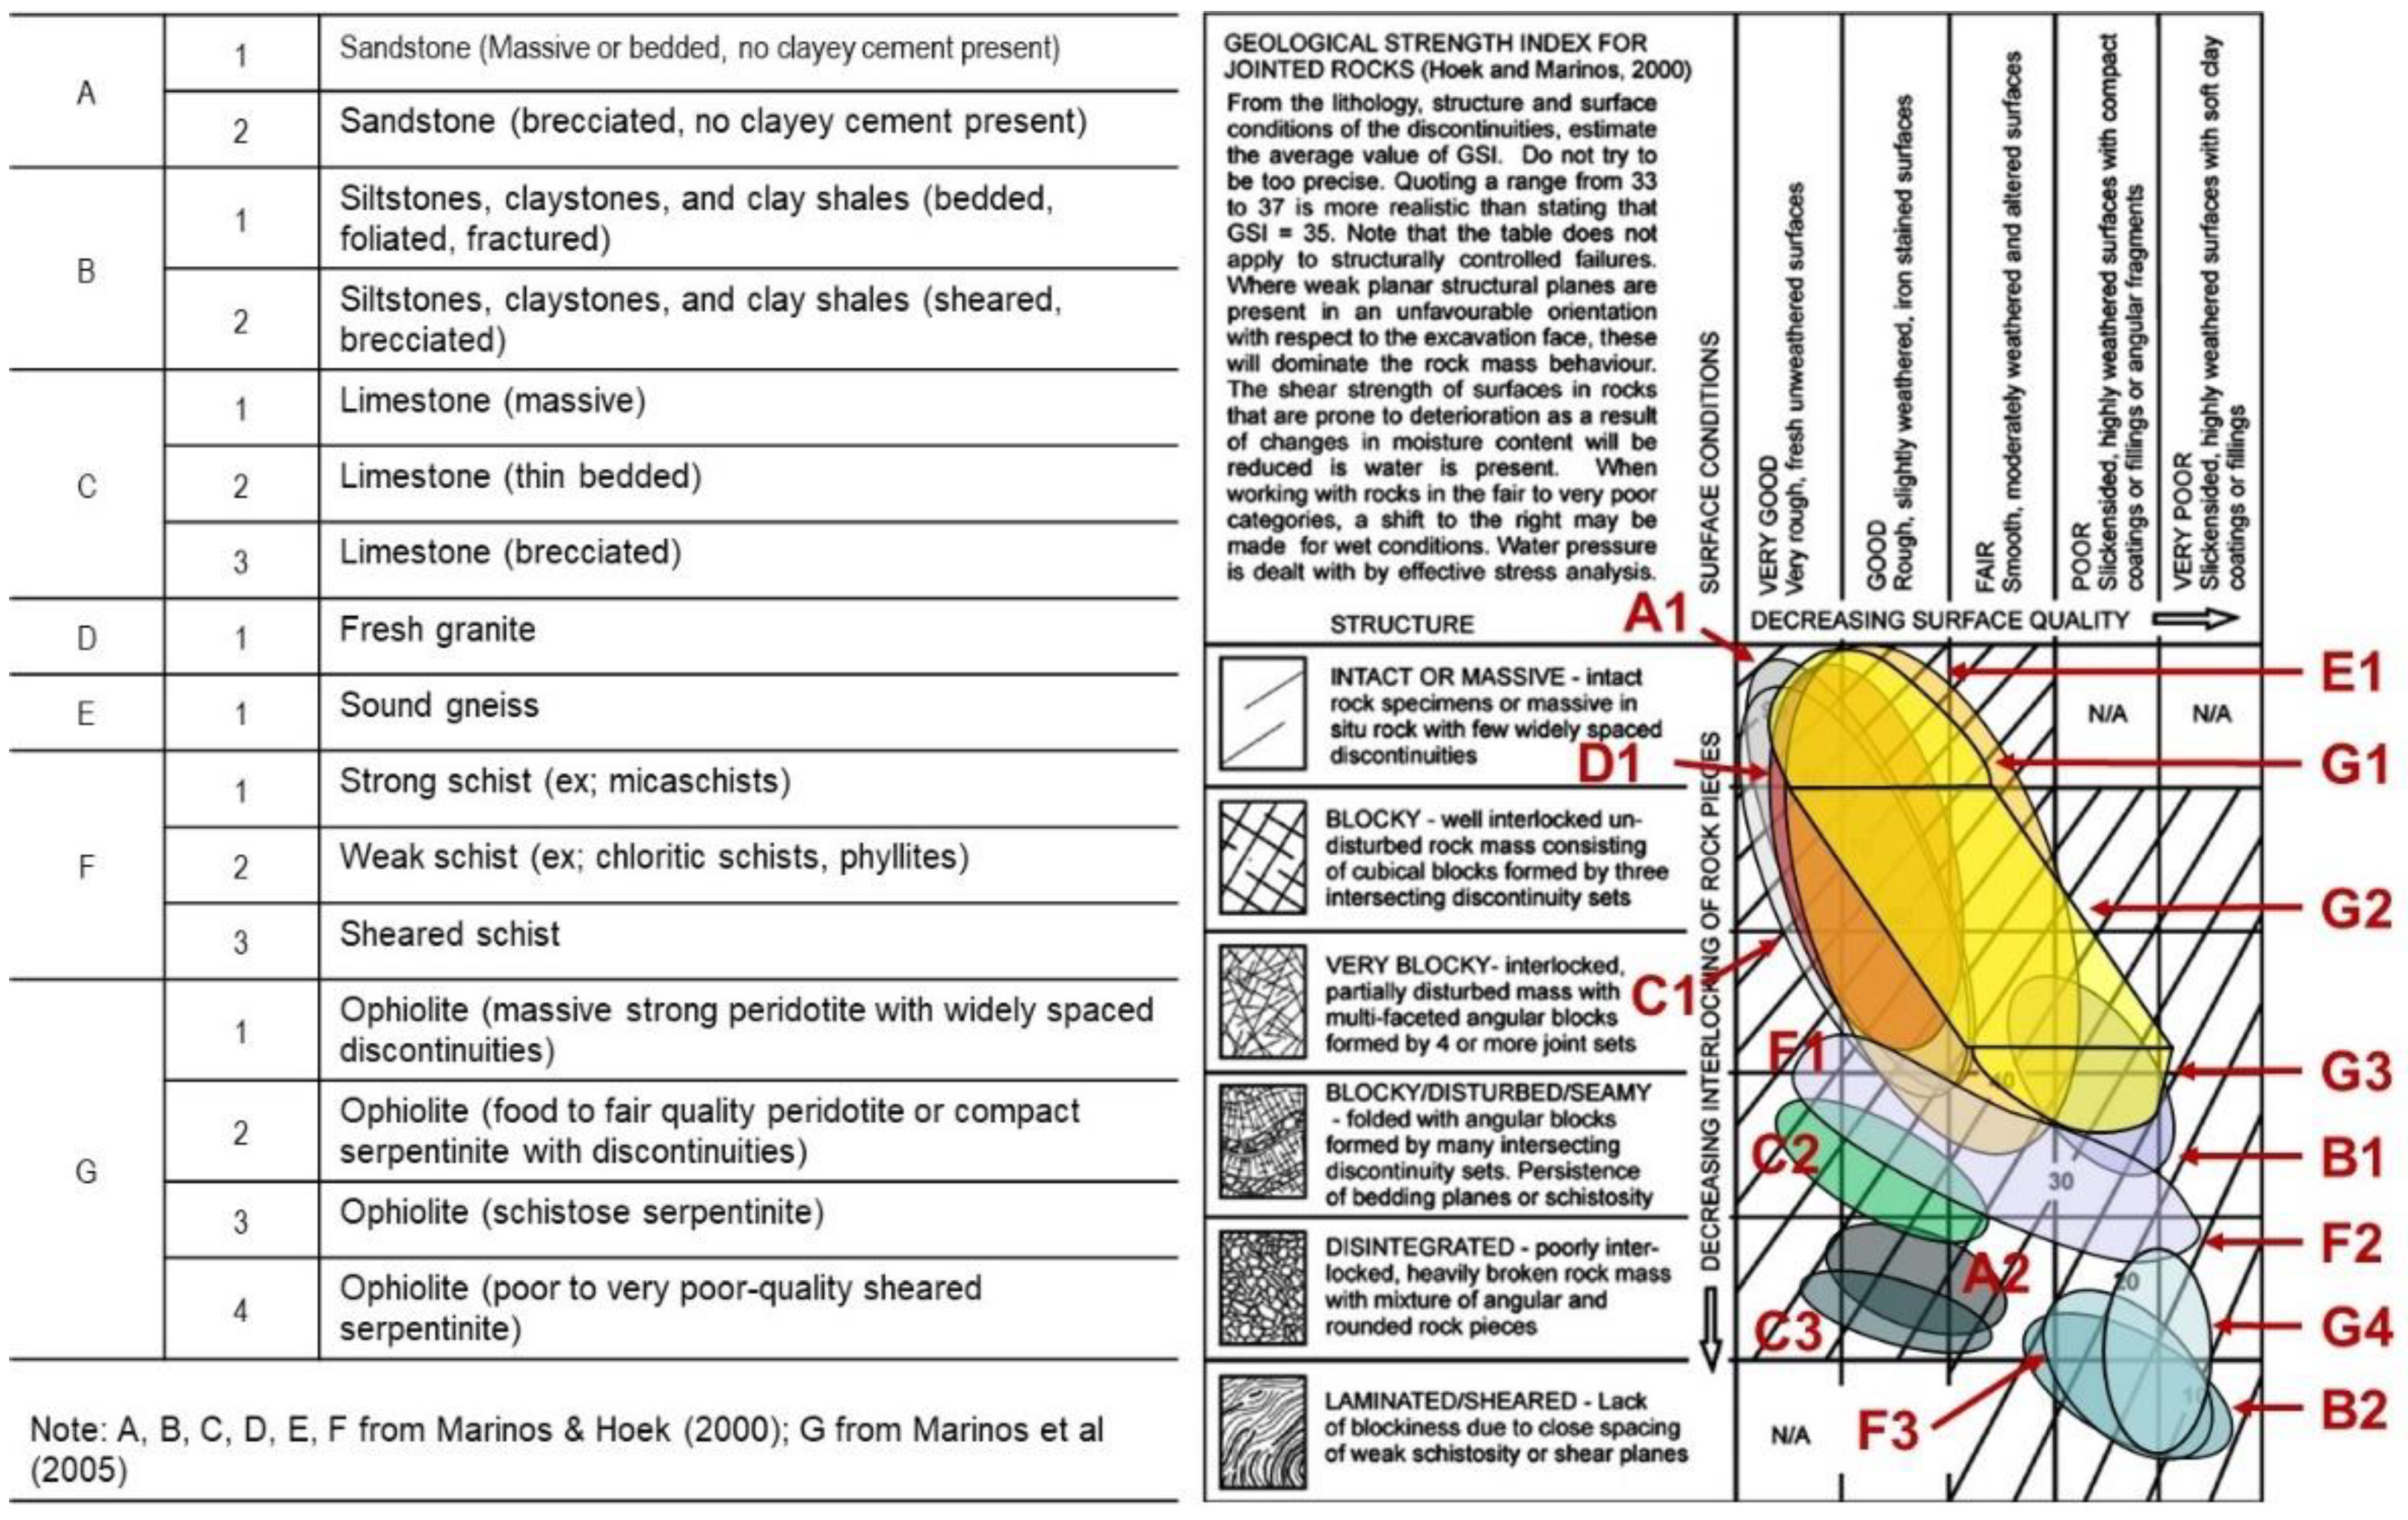
All of the quantification methods proposed in the literature build upon the original GSI table [21], and contrary to expectations, do not truly reflect the role of geology. Figure 6 superimposes rock types from actual field studies [61] to the original qualitative GSI table, revealing a geological trend that is opposite to the commonly accepted GSI contour lines.
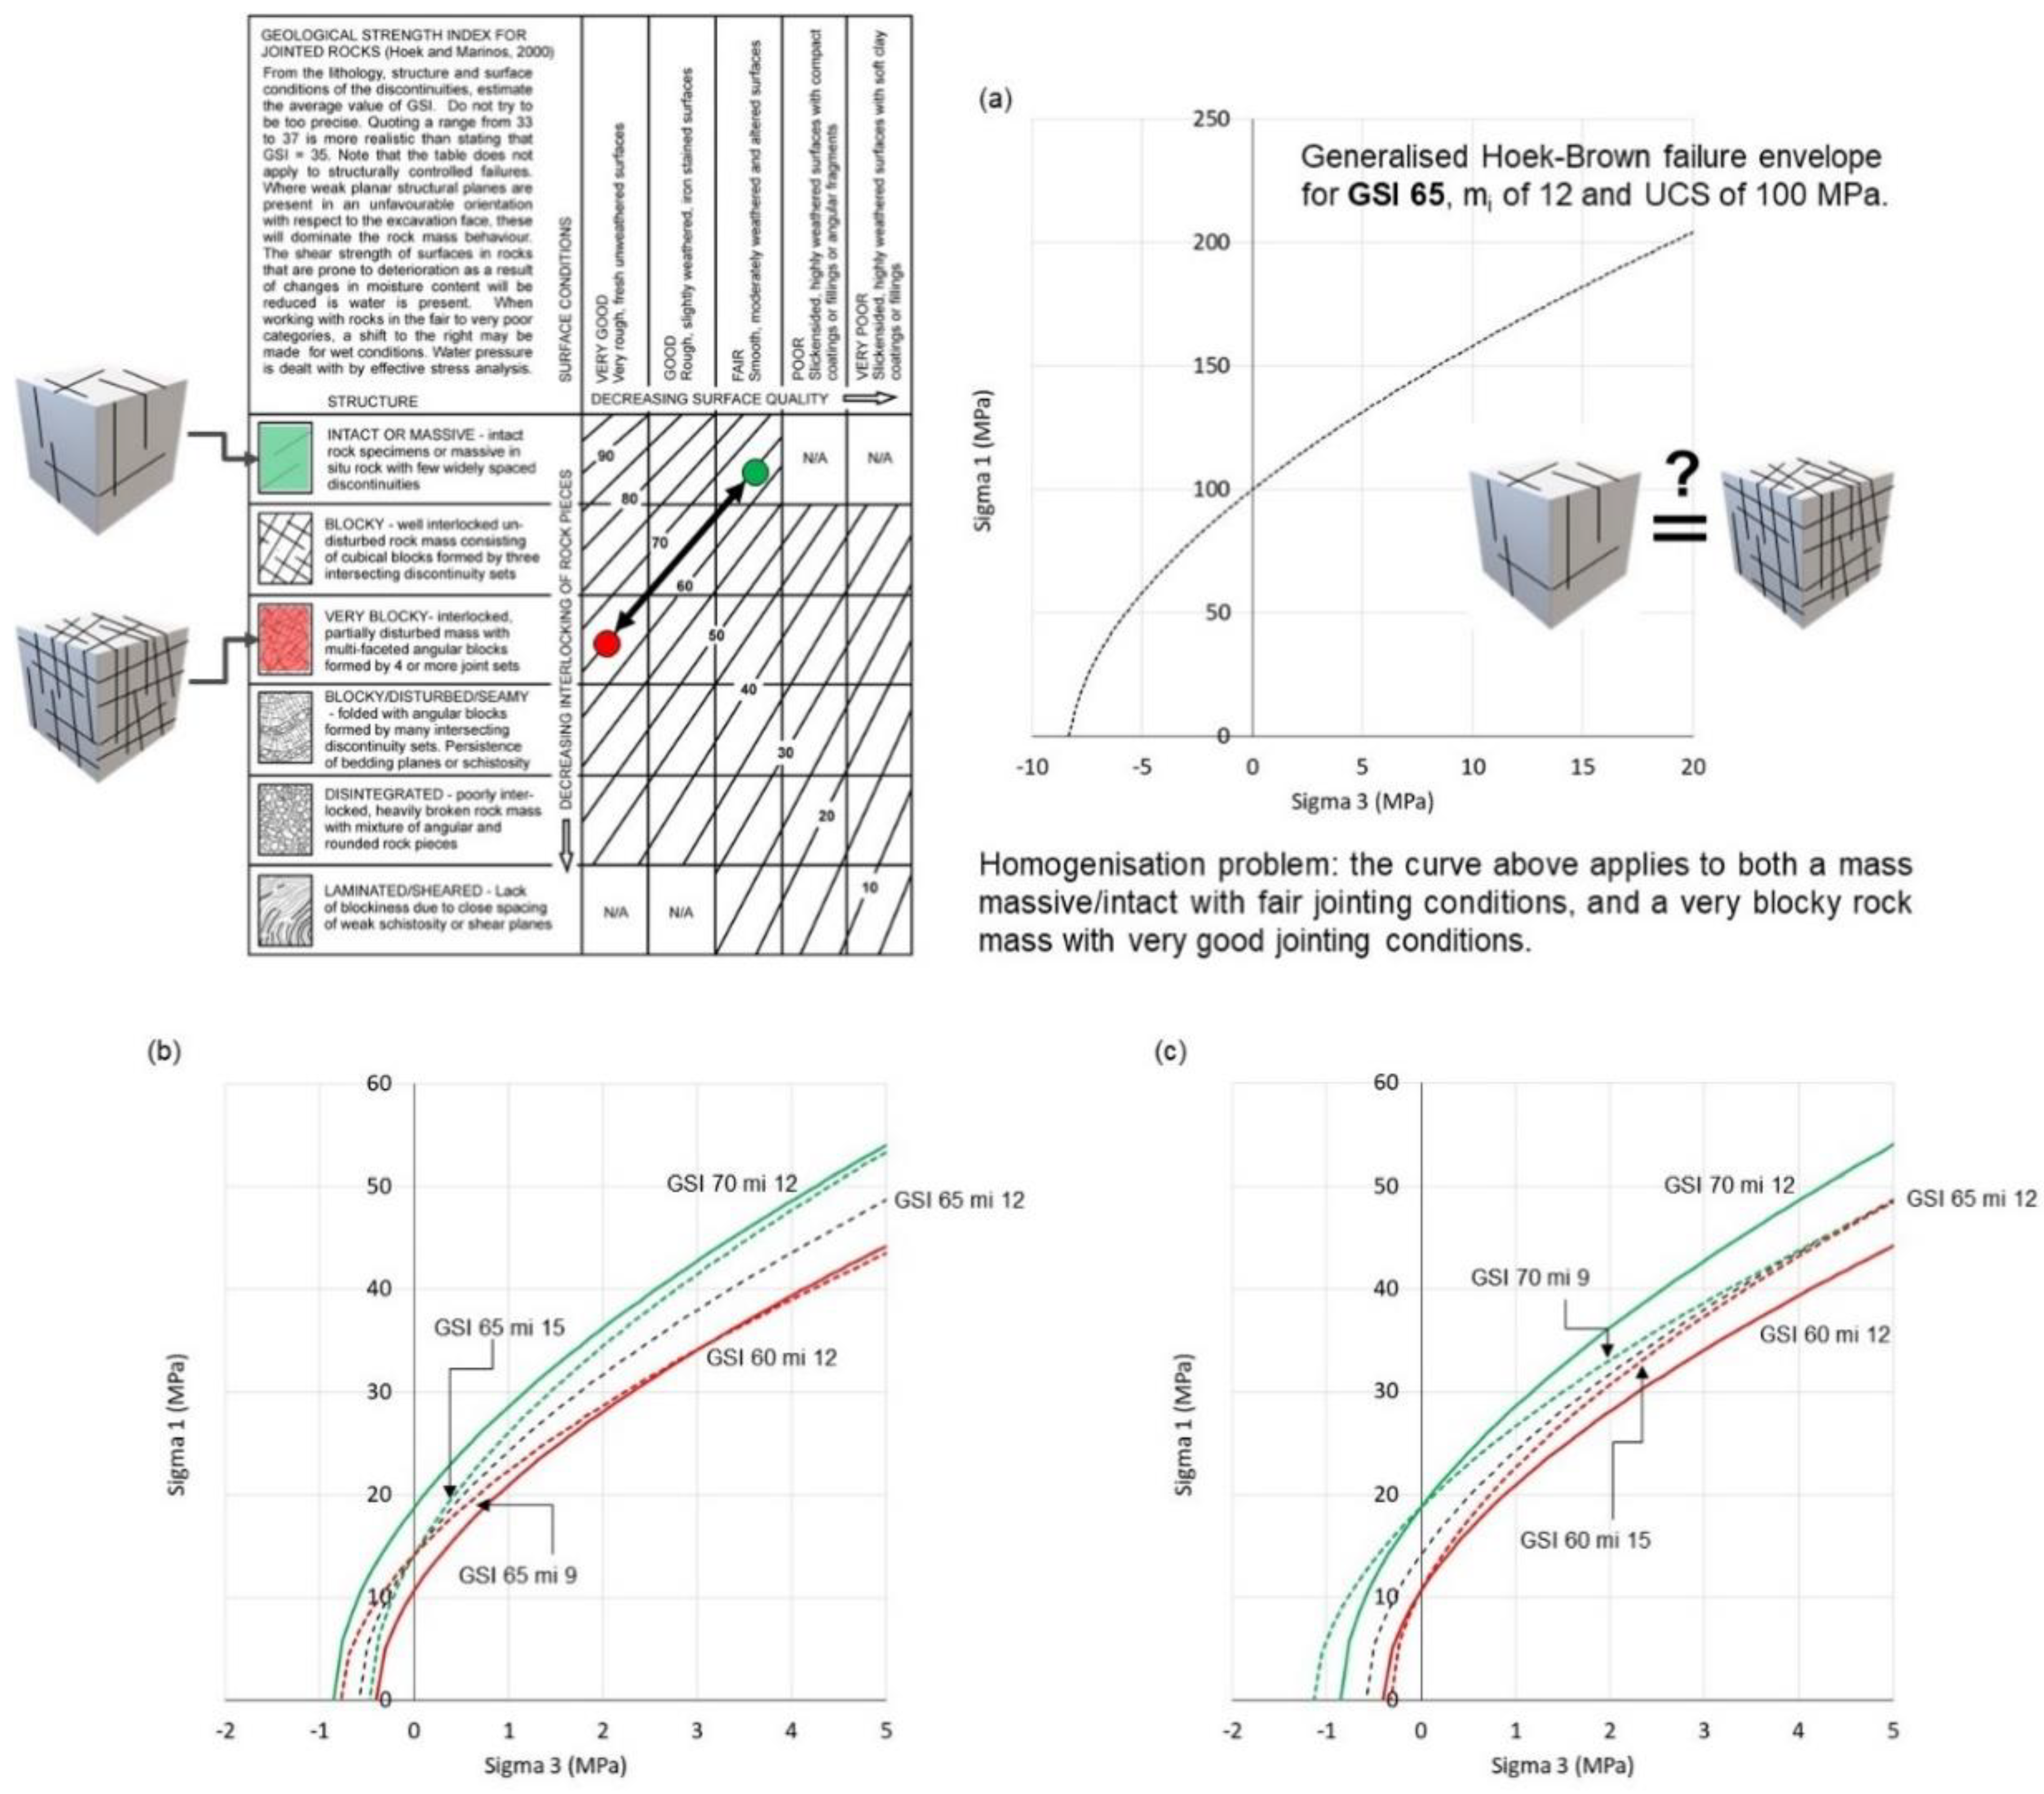
The structure of all the various GSI tables, whether qualitative or quantitative versions, creates a condition of irreversibility [2,59], whereby stating a GSI rating isolated from a detailed geological description creates a condition by which the same Hoek-Brown failure envelope can be potentially attributed to rather different rock mass conditions (Figure 7a). This problem has far reaching implications, since it implies the same failure mechanism that controls the behavior of both massive and very blocky rock mass conditions.
Similarly, we argue that the objective of the rock mass strength characterization, through the use of the GSI table, should not be used to accurately determine a unique failure envelope, but rather to constrain a range of possible outcomes. In this context, the original GSI table is already sufficiently precise to within ± 5. Additionally, we should not forget that GSI is just one of the many parameters that are required as input in design calculations. Considering the non-deterministic nature of many additional known and unknown design parameters (e.g., stress conditions and loading directions), claiming “bias free” and “objectivity” as the reason to quantify GSI becomes a distraction for engineers to truly account for variability in their design. For instance, in Figure 7b, for sigma three values greater than 2 MPa the combination of GSI = 60 ± 5 and mi of 12 yield comparable results to GSI = 65 and mi of 12±3. For sigma three less than 1 MPa, Figure 7c, the curves for GSI = 60 ± 5 and mi of 12 frame a potential rock mass behavior equivalent to that of the curves derived for GSI = 60 and mi of 15 (minimum), and GS = 70 and mi of 9 (maximum).
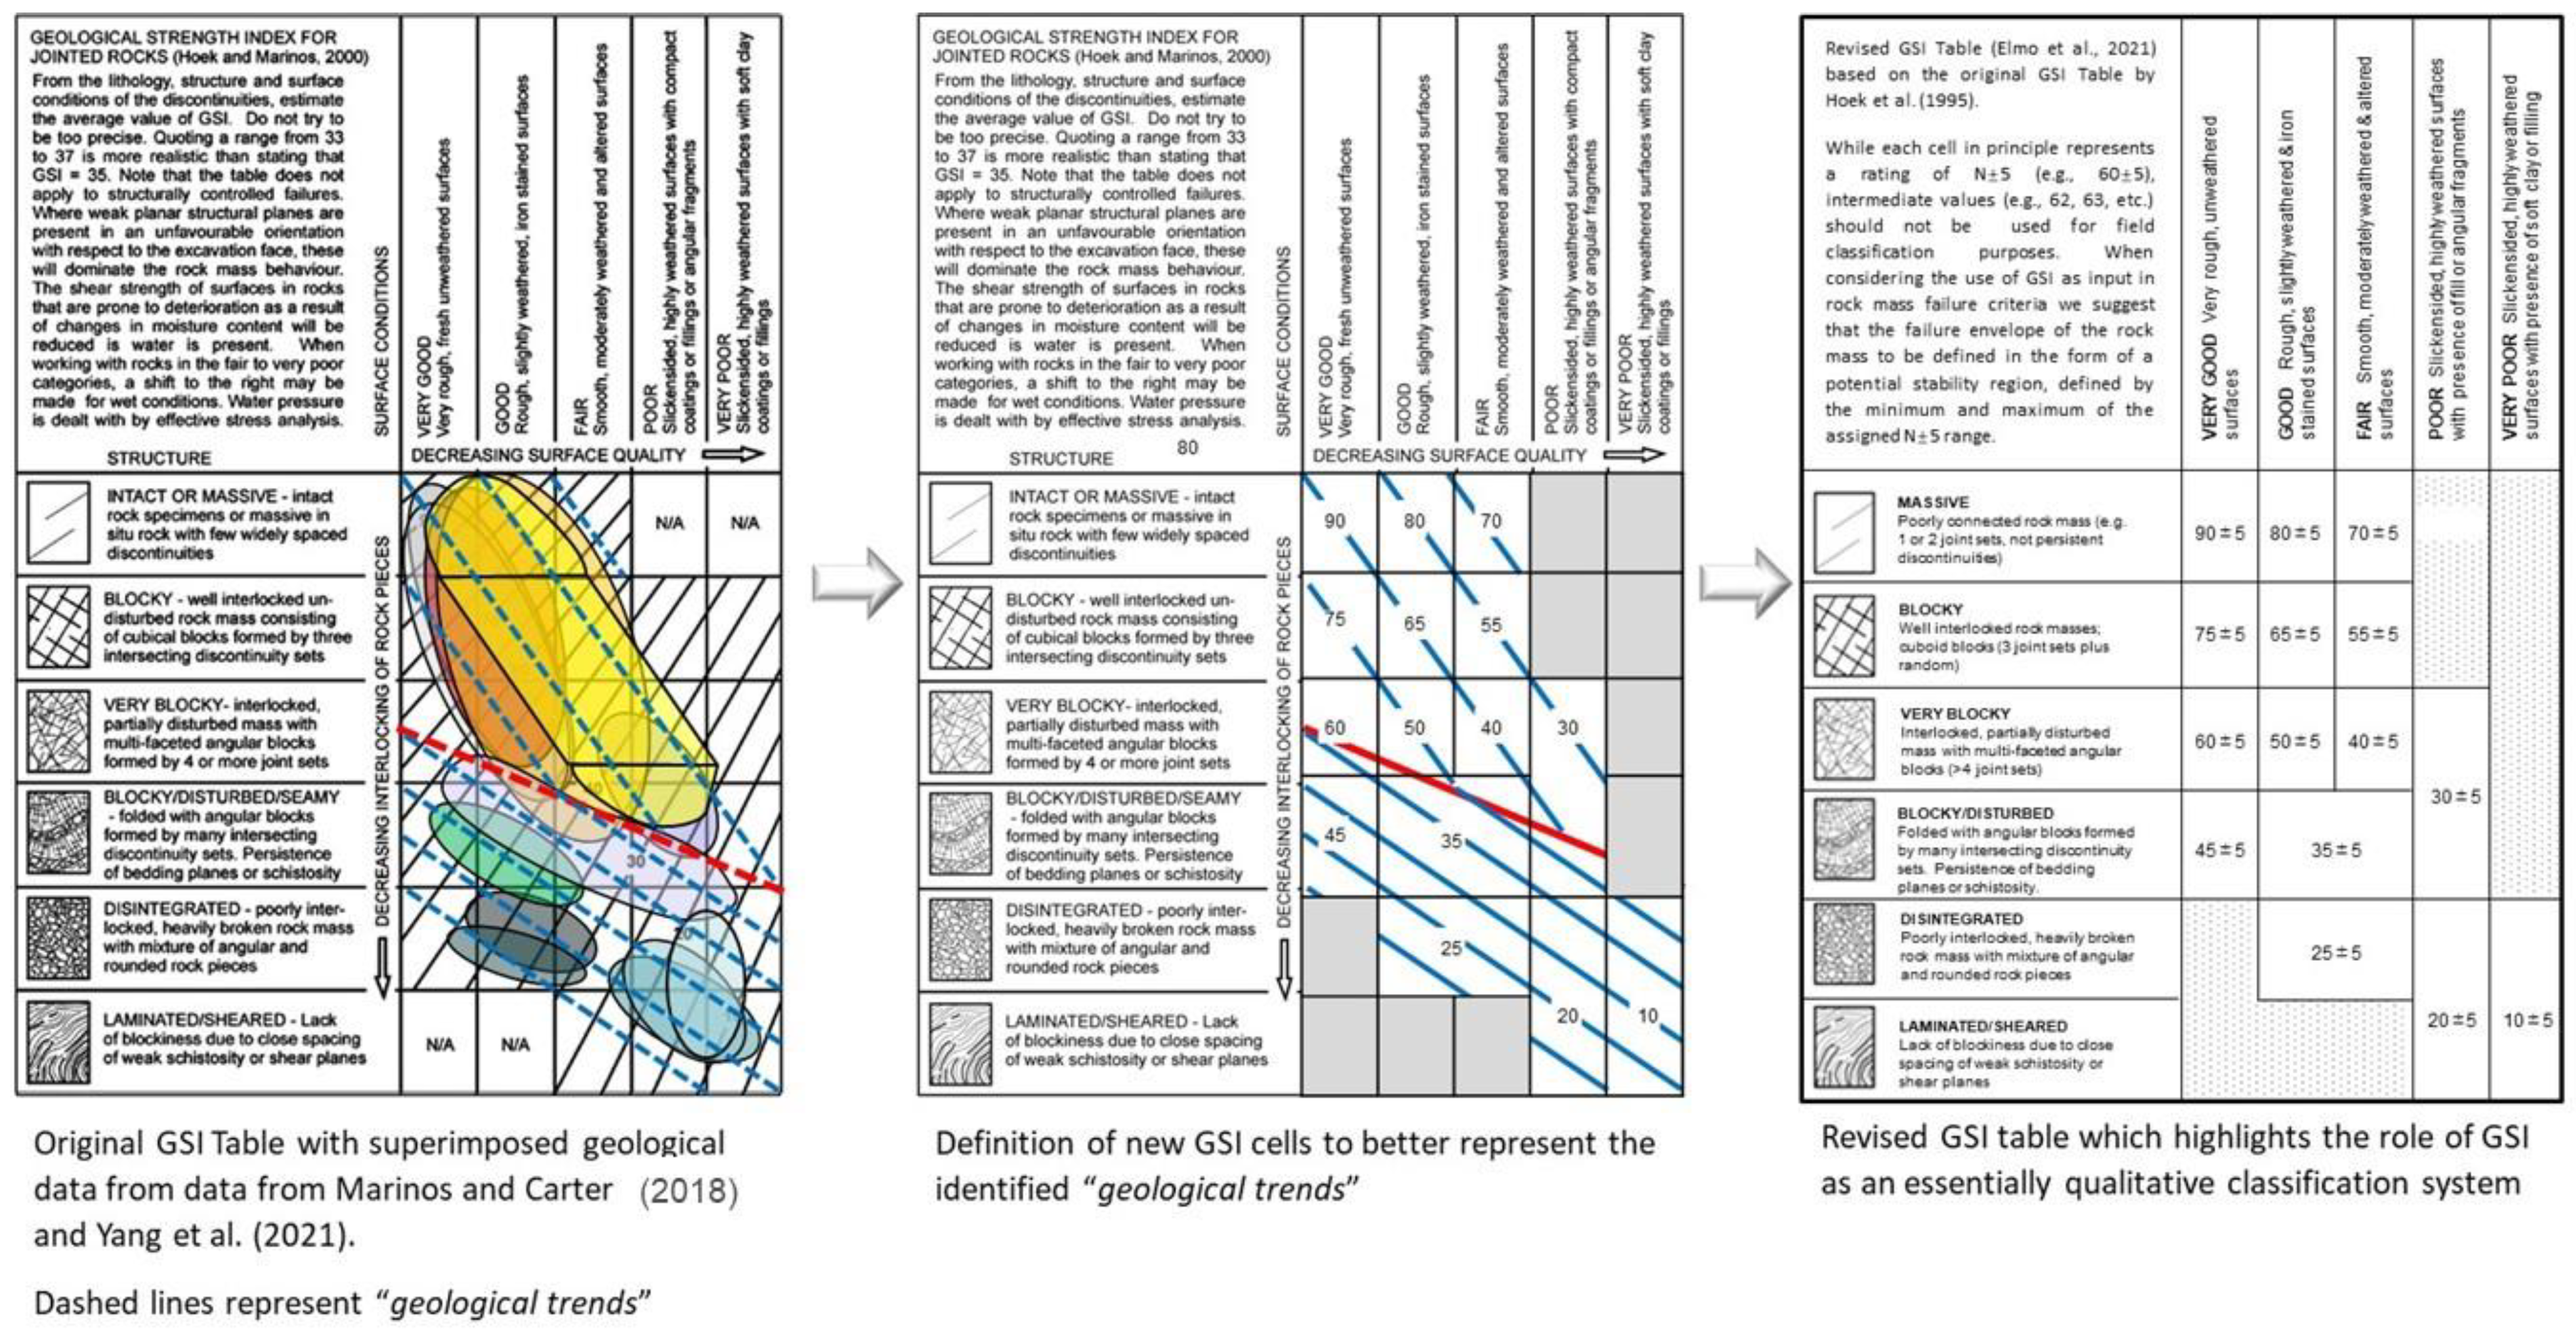
The contour lines in the various GSI tables should not be mistakenly interpreted as boundaries between accurate measurements. Accepting rock mass variability (e.g., GSI ± 5) does not suppose a lack of certainty in the design process. To address this issue, [2] proposed a modification to the original GSI table (Figure 8) that actually departs from the quantification trend and seeks to reconcile the use of the GSI system with the true objective of rock mass classification systems, which is to classify rock masses based on their qualities and therefore surrender the idea of rock masses as materials whose mechanical behavior can be accurately quantified using a unique failure curve. The implication of using a GSI range is that analyses of rock mass behavior should be carried out in the form of a risk approach, placing more emphasis on understanding failure mechanisms. The empirical nature of the failure criteria used in design analysis (e.g., Hoek-Brown), and the variability and subjectivity of the many inputs required (e.g., GSI, mi) contrast with the idea of a universal equation that can uniquely provide an accurate measurement of the mechanical response of a rock mass.
4. Machine Learning
In recent years, rock engineers have begun to apply machine learning to rock engineering applications. One application is in using machine learning (ML) to automate and quantify the GSI chart, as shown in [29,30,31,32]. However, this practice has several limitations. Scale effects when using images of outcrops for training an ML model are often ignored, despite its importance in determining GSI [1]. More broadly, the use of ML does not remove subjectivity or increase precision, as discussed in [1,59]. If the ML model is trained on a dataset where GSI values of outcrop images were determined by engineers using a qualitative chart, as in the case of [30], then the model will propagate the biases and subjectivity associated with those GSI values rather than removing them. Using a quantified GSI chart to determine GSI values for the training set also does not remove subjectivity as the parameters used in the quantifications are still subjective (as discussed in the previous section). While ML algorithms are a powerful tool that can uncover new patterns among a dataset and efficiently automate certain tasks, they are not capable of removing subjectivity. The fact that engineers may rely on any of the different correlations listed in Table 3 to code functions in ML algorithms should raise important concerns regarding the sterilization of qualitative geological data from the design process.
5. Recommendations
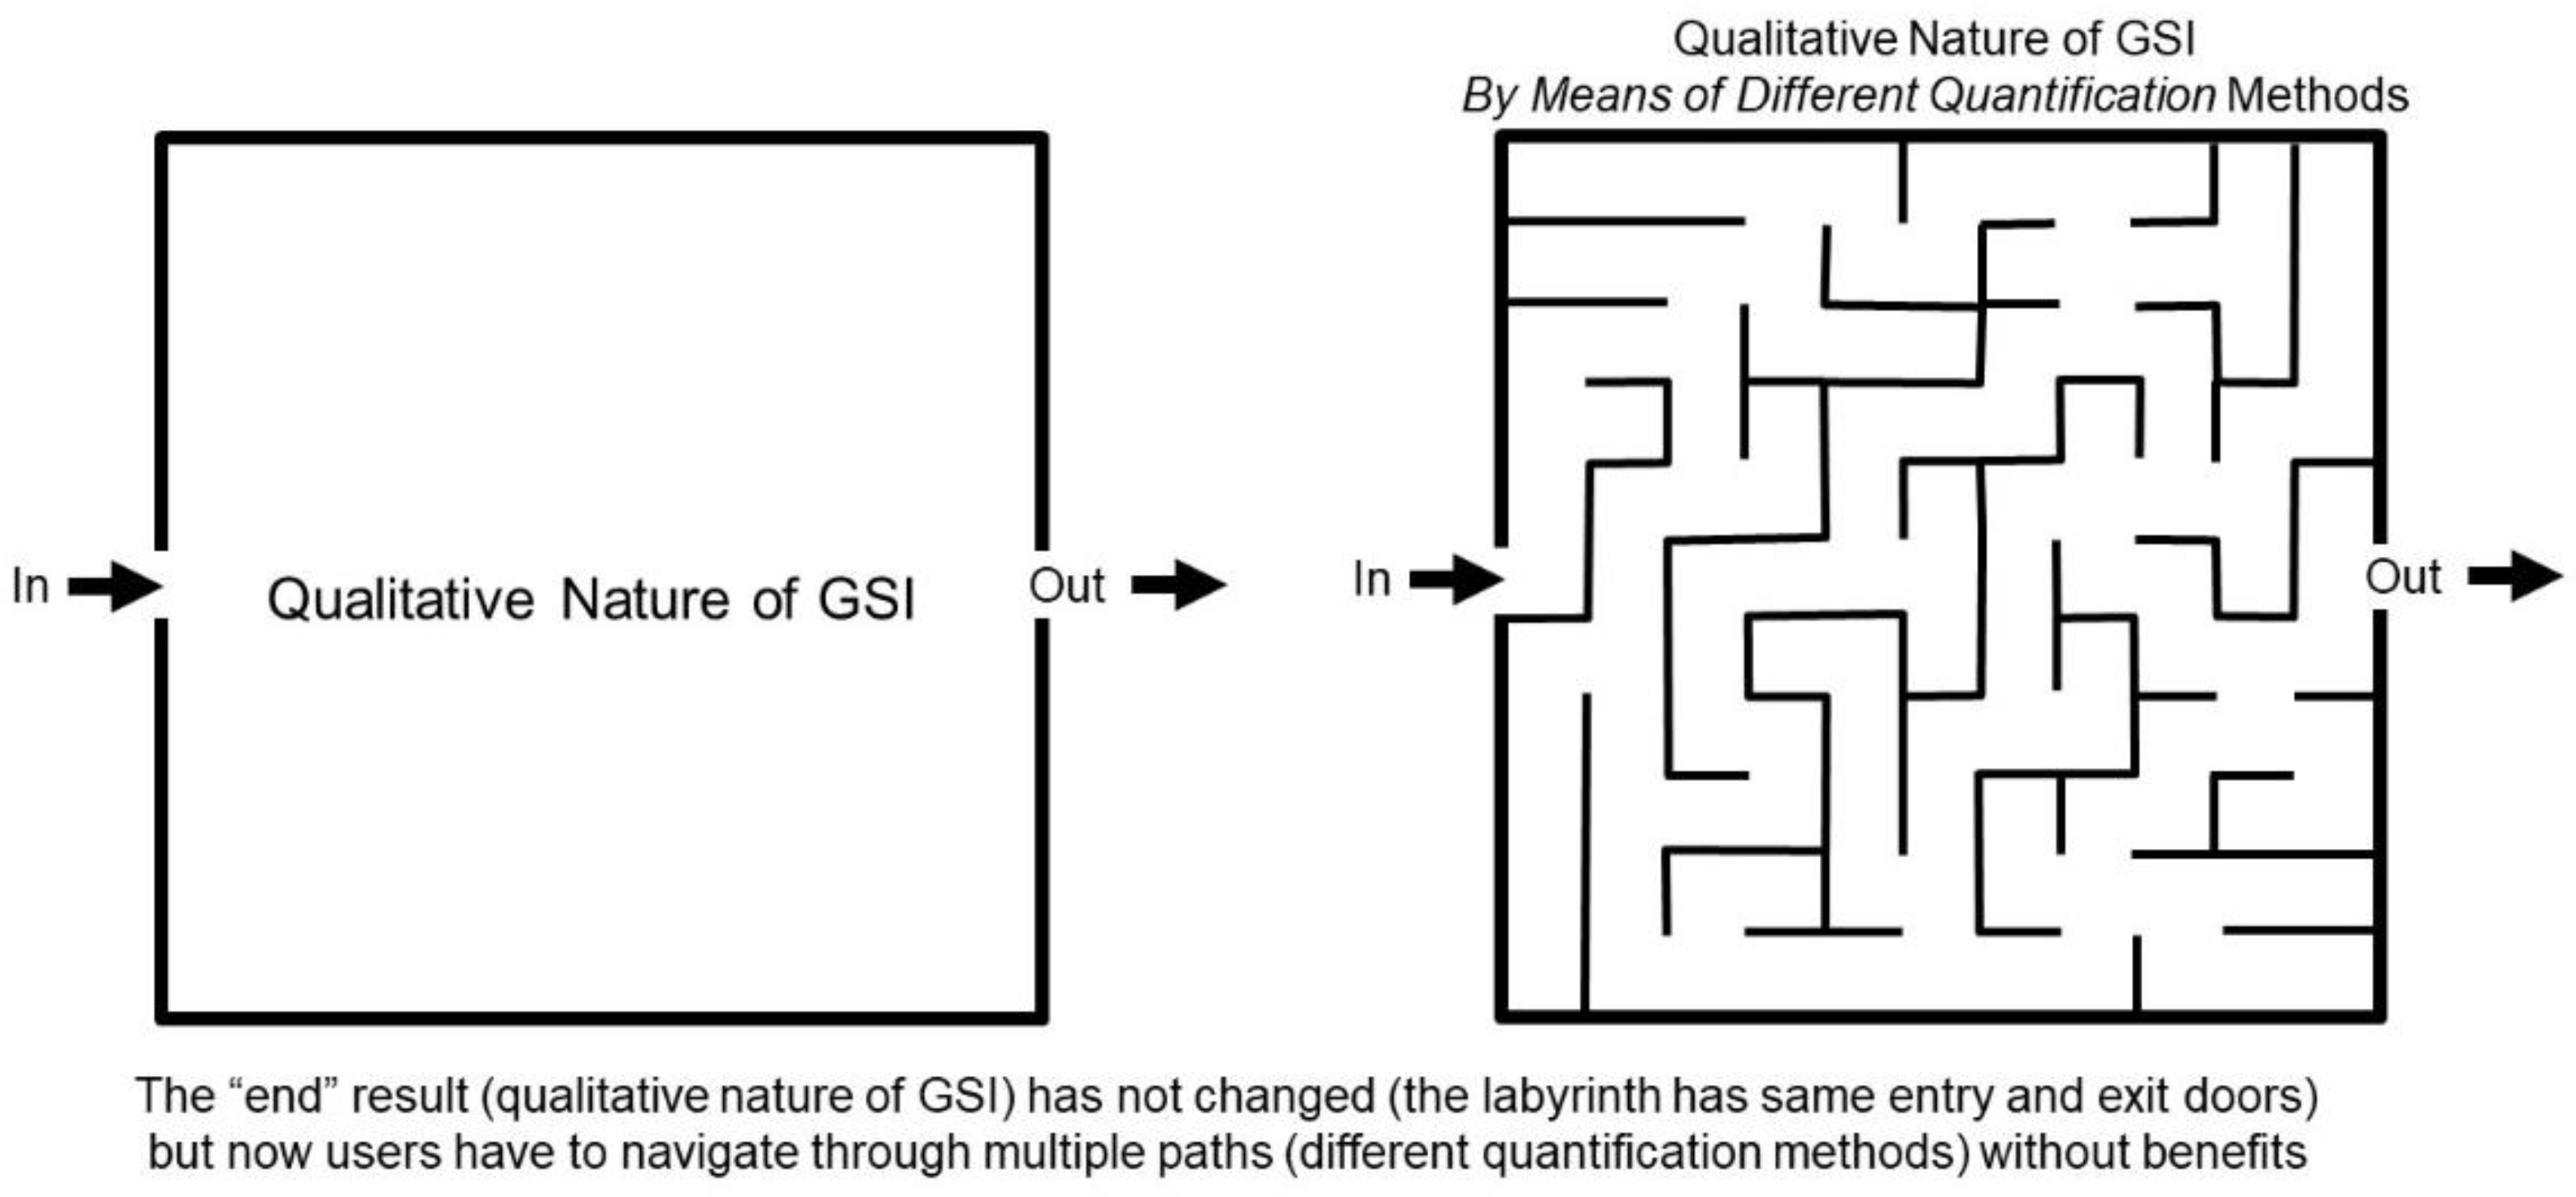
This paper offered a critical review of various methods presented in the literature to quantify GSI. Over the past two decades, more than 20 different methods have been proposed, and yet none of the proposed quantification methods appear to have replaced the original GSI chart. That is not unexpected considering that the process of quantification cannot change the qualitative nature of GSI. It seems that, over time, we have created unnecessary processes that have given rise to a labyrinth of formulae and tables to solve a problem that did not require a solution (Figure 9).
Given the arguments articulated throughout the paper to discuss the limitations and impracticality of quantifying the original GSI table, the following recommendations can be made:
- There is no need to quantify the original GSI table. If required for design purposes, engineers should use the original qualitative GSI table—while being aware of its limitations—since there is no apparent advantage in terms of design analysis of using any of the proposed quantification methods. On the contrary, the quantification of qualitative assessments creates a false conviction that rock engineering design is governed by a universal set of deterministic parameters and rules. None of the proposed GSI quantification methods can be defined as being bias-free since they all largely rely upon qualitative information that is impacted by subjective interpretation (engineering judgment does not necessarily provide an objective perspective).
- Using a qualitative approach to GSI would force engineers and geologists to pay more attention to data collection methods and geological descriptions. At the same time, emphasizing the qualitative nature of the rock mass classification system would require engineers to accept that they should be used and determined independently from each other.
- When first introduced in 1994, it was postulated that GSI was equivalent to RMR76. By now, proposing different methods to quantify GSI, we are claiming that the correlations listed in Table 3 have somehow superseded the original equivalency between GSI and RMR76, and therefore it would not be possible to compare GSI ratings estimated using the different methods among them or with historical GSI data. Indeed, if the new correlations were to provide estimates of GSI that do not differ from those derived using the original GSI table, there would not be a clear incentive for engineers to use any of the proposed quantification methods. From a mechanistic perspective, it is not clear how the same rock mass quality rating (GSI) can be defined by the contribution of a diverse number of different parameters (see Table 3 and Appendix A).
- There is a need to develop classification systems that are more objective and better suited for integrating with ML. In this context, the use of connectivity parameters [2,62,63] offer a quantitative avenue to rock mass characterization. Connectivity parameters use the relationships between the average number of intersections per fracture, average fracture length per unit area (2D problems) or average fracture area per unit volume (3D problems), and number of fractures (per unit area or per unit volume). The advantage of using connectivity parameters rather than classification systems is the ability of the former to better differentiate whether rock mass behavior may occur as a stress-driven damage accumulation process, or a combination of stress-driven failure and sliding along existing fractures (concept of rock bridge potential in [2]), by using numerical models to compare the connectivity of natural fracture networks before and after failure.
- At the same time, we need to understand the limitations of ML, which should not be considered a tool to reduce or remove subjectivity, nor should it be used as a tool that, in the context of rock engineering design, could provide more precise or accurate predictions. There is no such thing as ML objectivity unless the data used in the ML analysis is exclusively quantitative and free of human factors.
- Paying closer attention to the words used in engineering standards and documents and ensuring that the correct terminology is used. As described by [7], there is an apparent advantage of using terminology and methods that have an underlying scientific tone when presenting and explaining engineering problems.
6. Conclusions
We understand that adopting fundamental changes may be challenging, and we accept that revisions as those herein proposed about redundant GSI quantification methods could attract criticism. However, if not questioned, practices established over time risk becoming empirical habits. There also remains the hazard of assigning an a priori validity to empirical methods based on personal experience without attempting any form of scientific reproducibility. We would like to conclude this paper by referring to the industry standard paradox proposed by [2], “The purpose of industry standards is to act in ways that regular and predictable engineering decisions can be made. However, the same regularity and predictability become natural enemy of changes since engineers—like most humans—tend to perceive changes as a loss”. This aspect is a demonstration of the concerns expressed in [2,64] that research may yield a diminishing return if we continue seeking answers in the same research areas that have yielded answers before without offering a true major breakthrough. Accordingly, rather than proposing new GSI quantification methods, we believe that research efforts should focus on introducing new characterization and quantification methods that are better integrated with advancements in digital collection methods.
Author Contributions
Conceptualization, B.Y. and D.E.; methodology, B.Y. and D.E.; formal analysis, B.Y. and D.E.; investigation, B.Y.; data curation, B.Y.; writing—original draft preparation, B.Y. and D.E.; writing—review and editing, B.Y. and D.E.; visualization, B.Y. and D.E.; supervision, D.E. All authors have read and agreed to the published version of the manuscript.
Funding
The authors would like to acknowledge the financial support of: Natural Sciences and Engineering Research Council of Canada (NSERC CGS-M/NSERC PGS-D), NSERC Grant LJGQ GR000440; Mitacs Grant POEH/GR022346, and Geoscience BC.
Data Availability Statement
Not applicable.
Conflicts of Interest
The authors declare no conflict of interest.
Appendix A
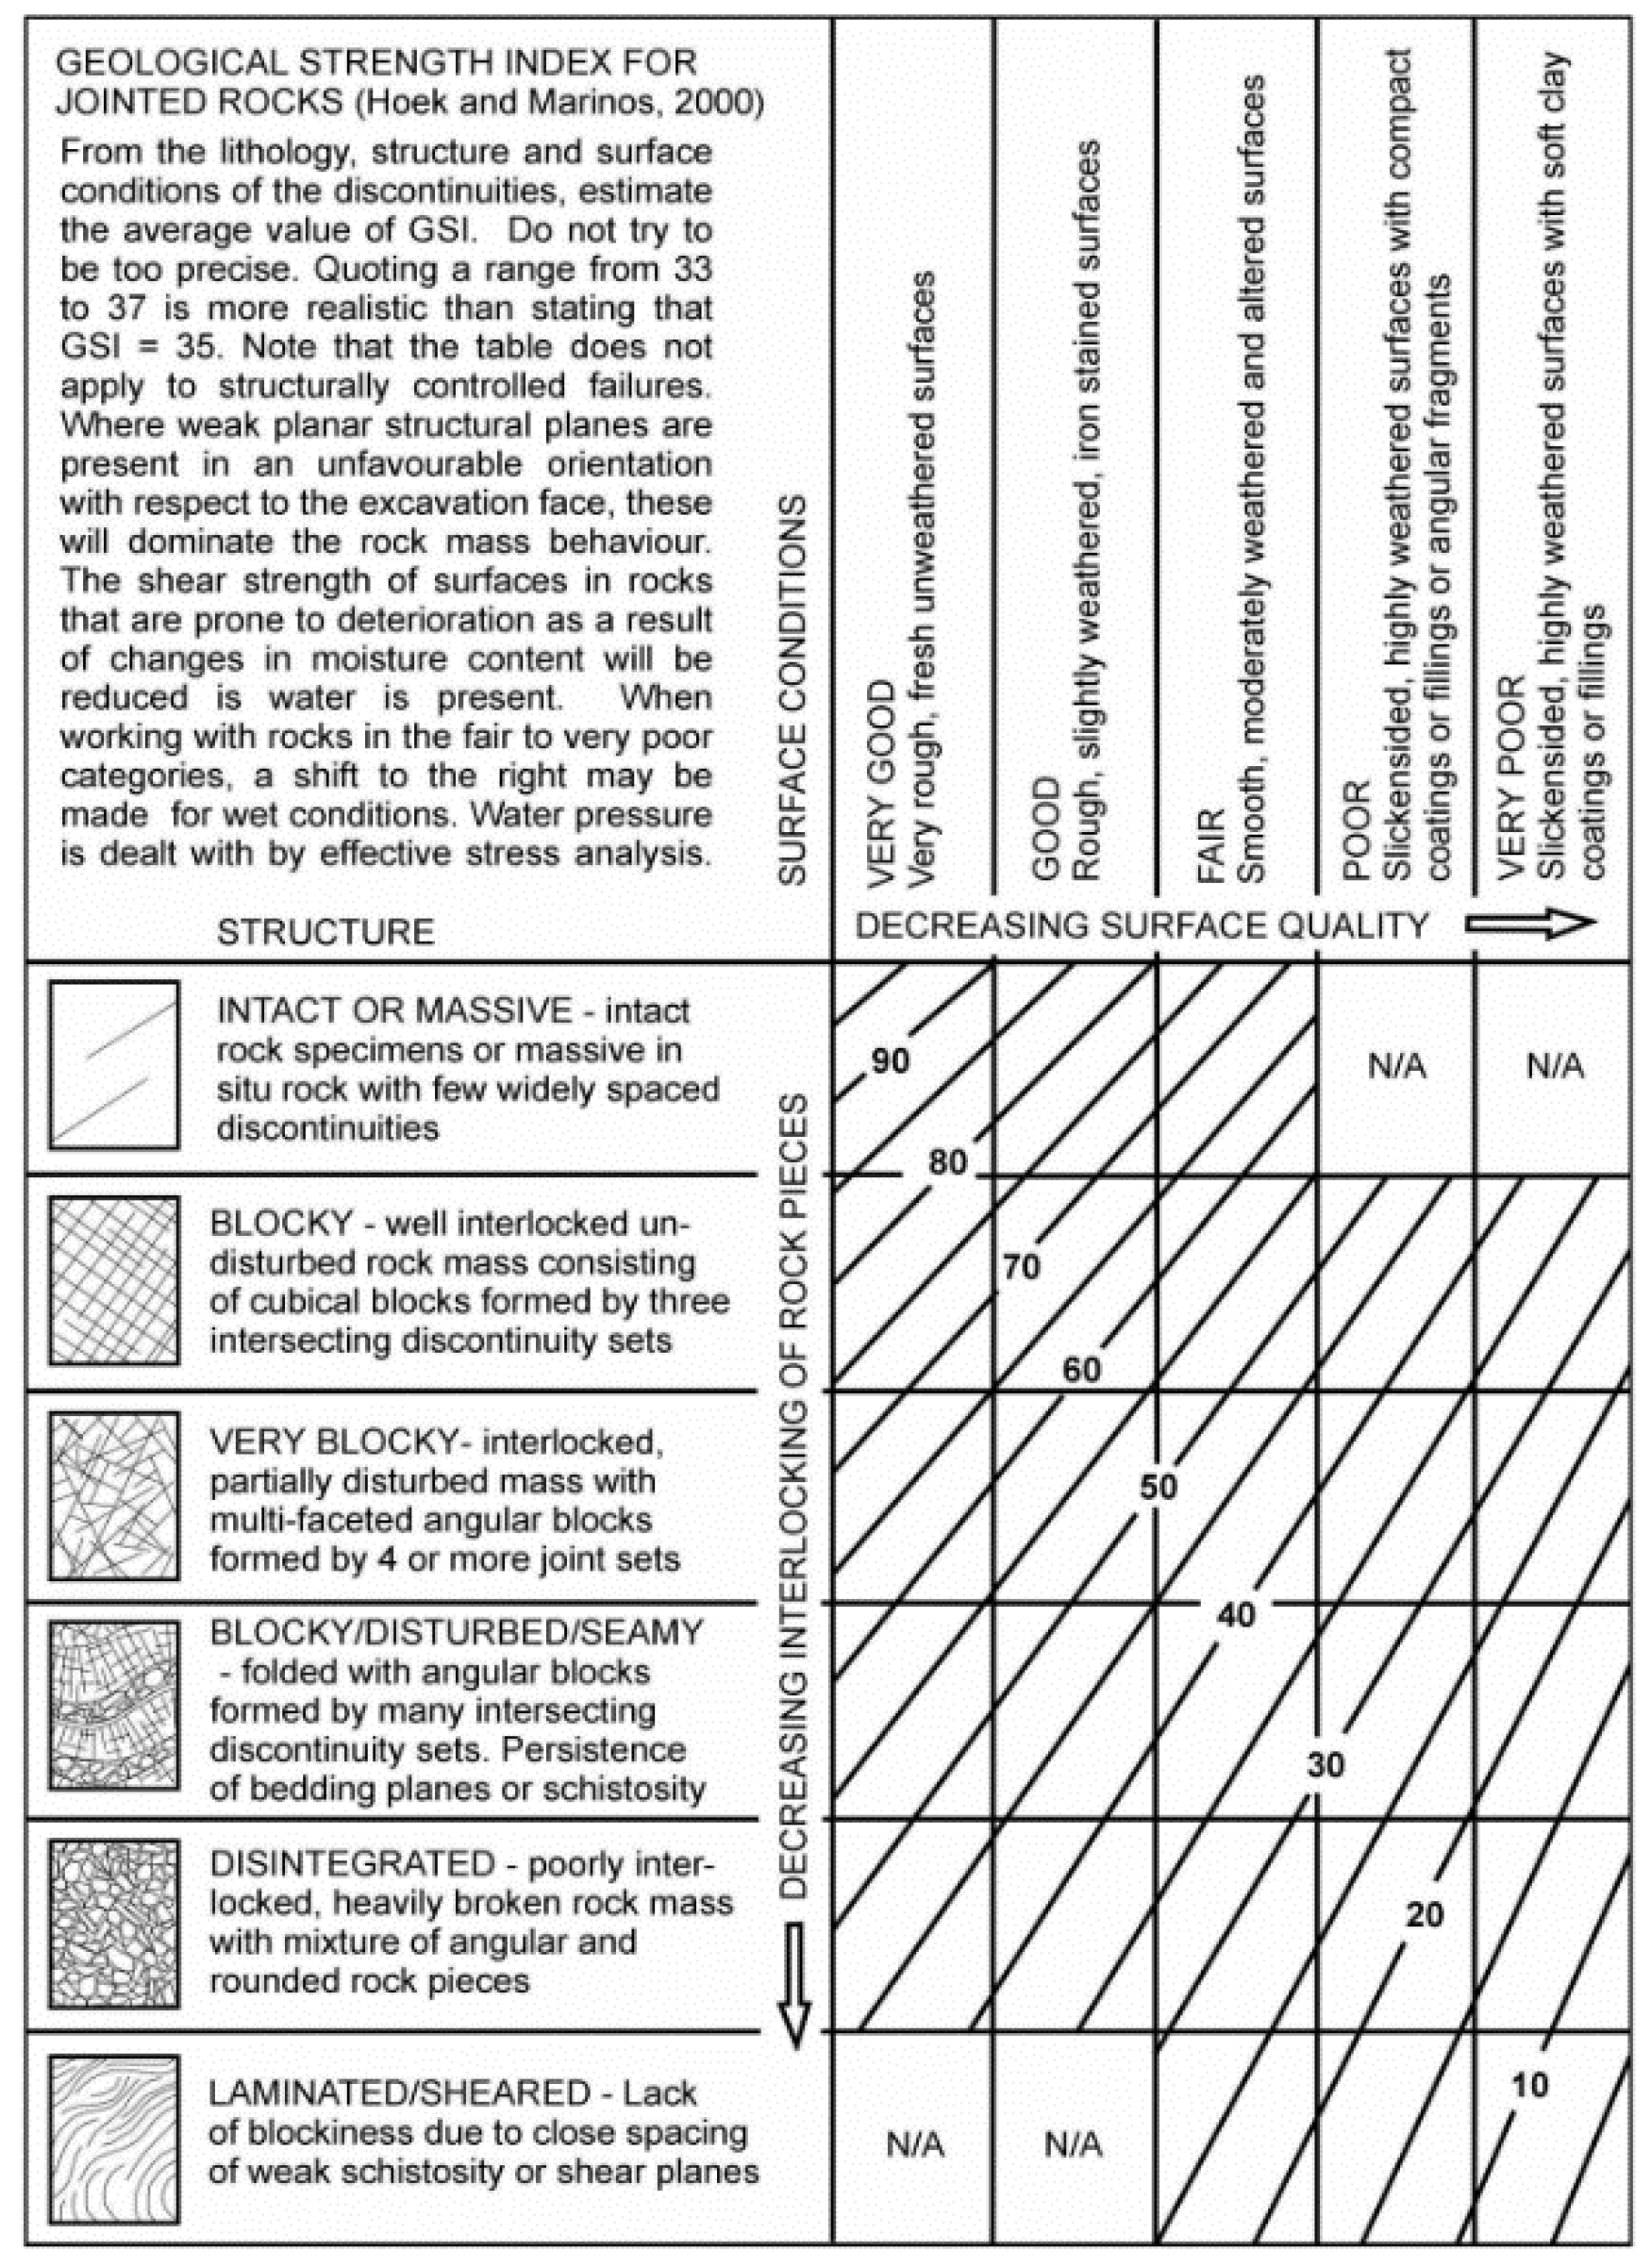
Figure A1.
GSI chart for jointed rock masses [21].
Figure A1.
GSI chart for jointed rock masses [21].

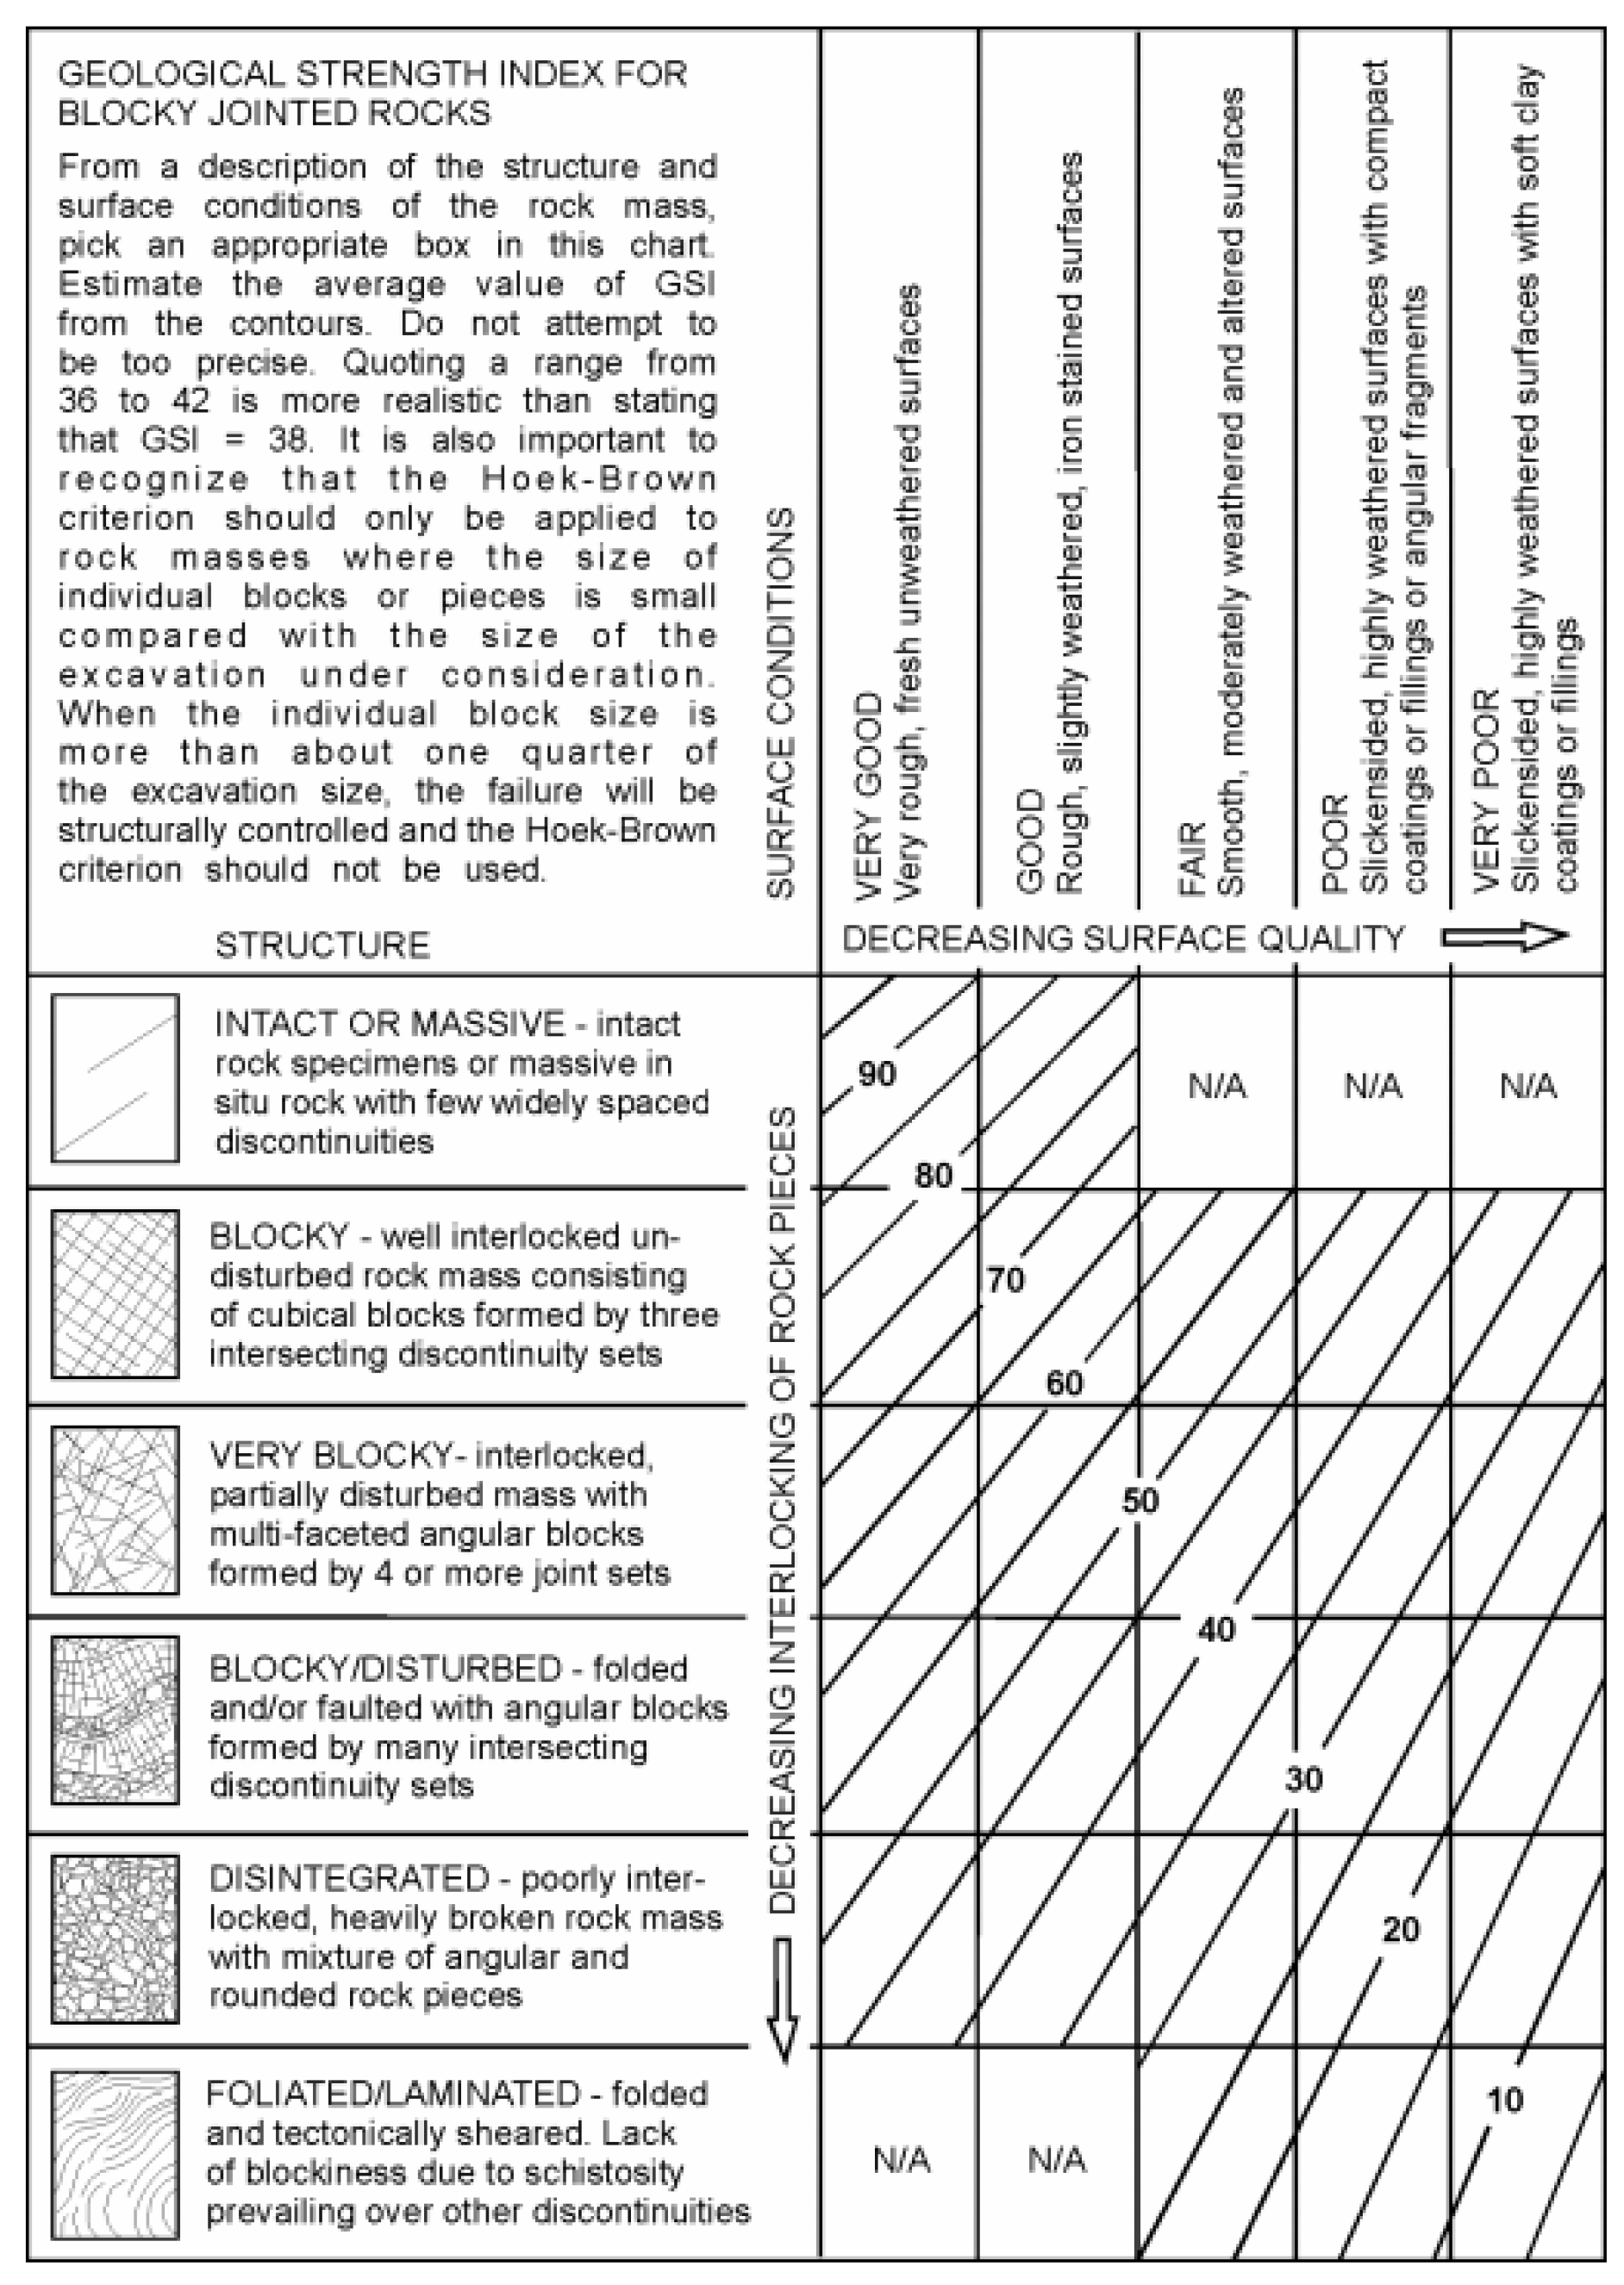
Figure A2.
GSI chart for jointed rock masses [22].
Figure A2.
GSI chart for jointed rock masses [22].

Figure A3.
GSI chart for jointed rock masses [23].
Figure A3.
GSI chart for jointed rock masses [23].

Figure A4.
GSI chart for jointed rock masses [24].
Figure A4.
GSI chart for jointed rock masses [24].

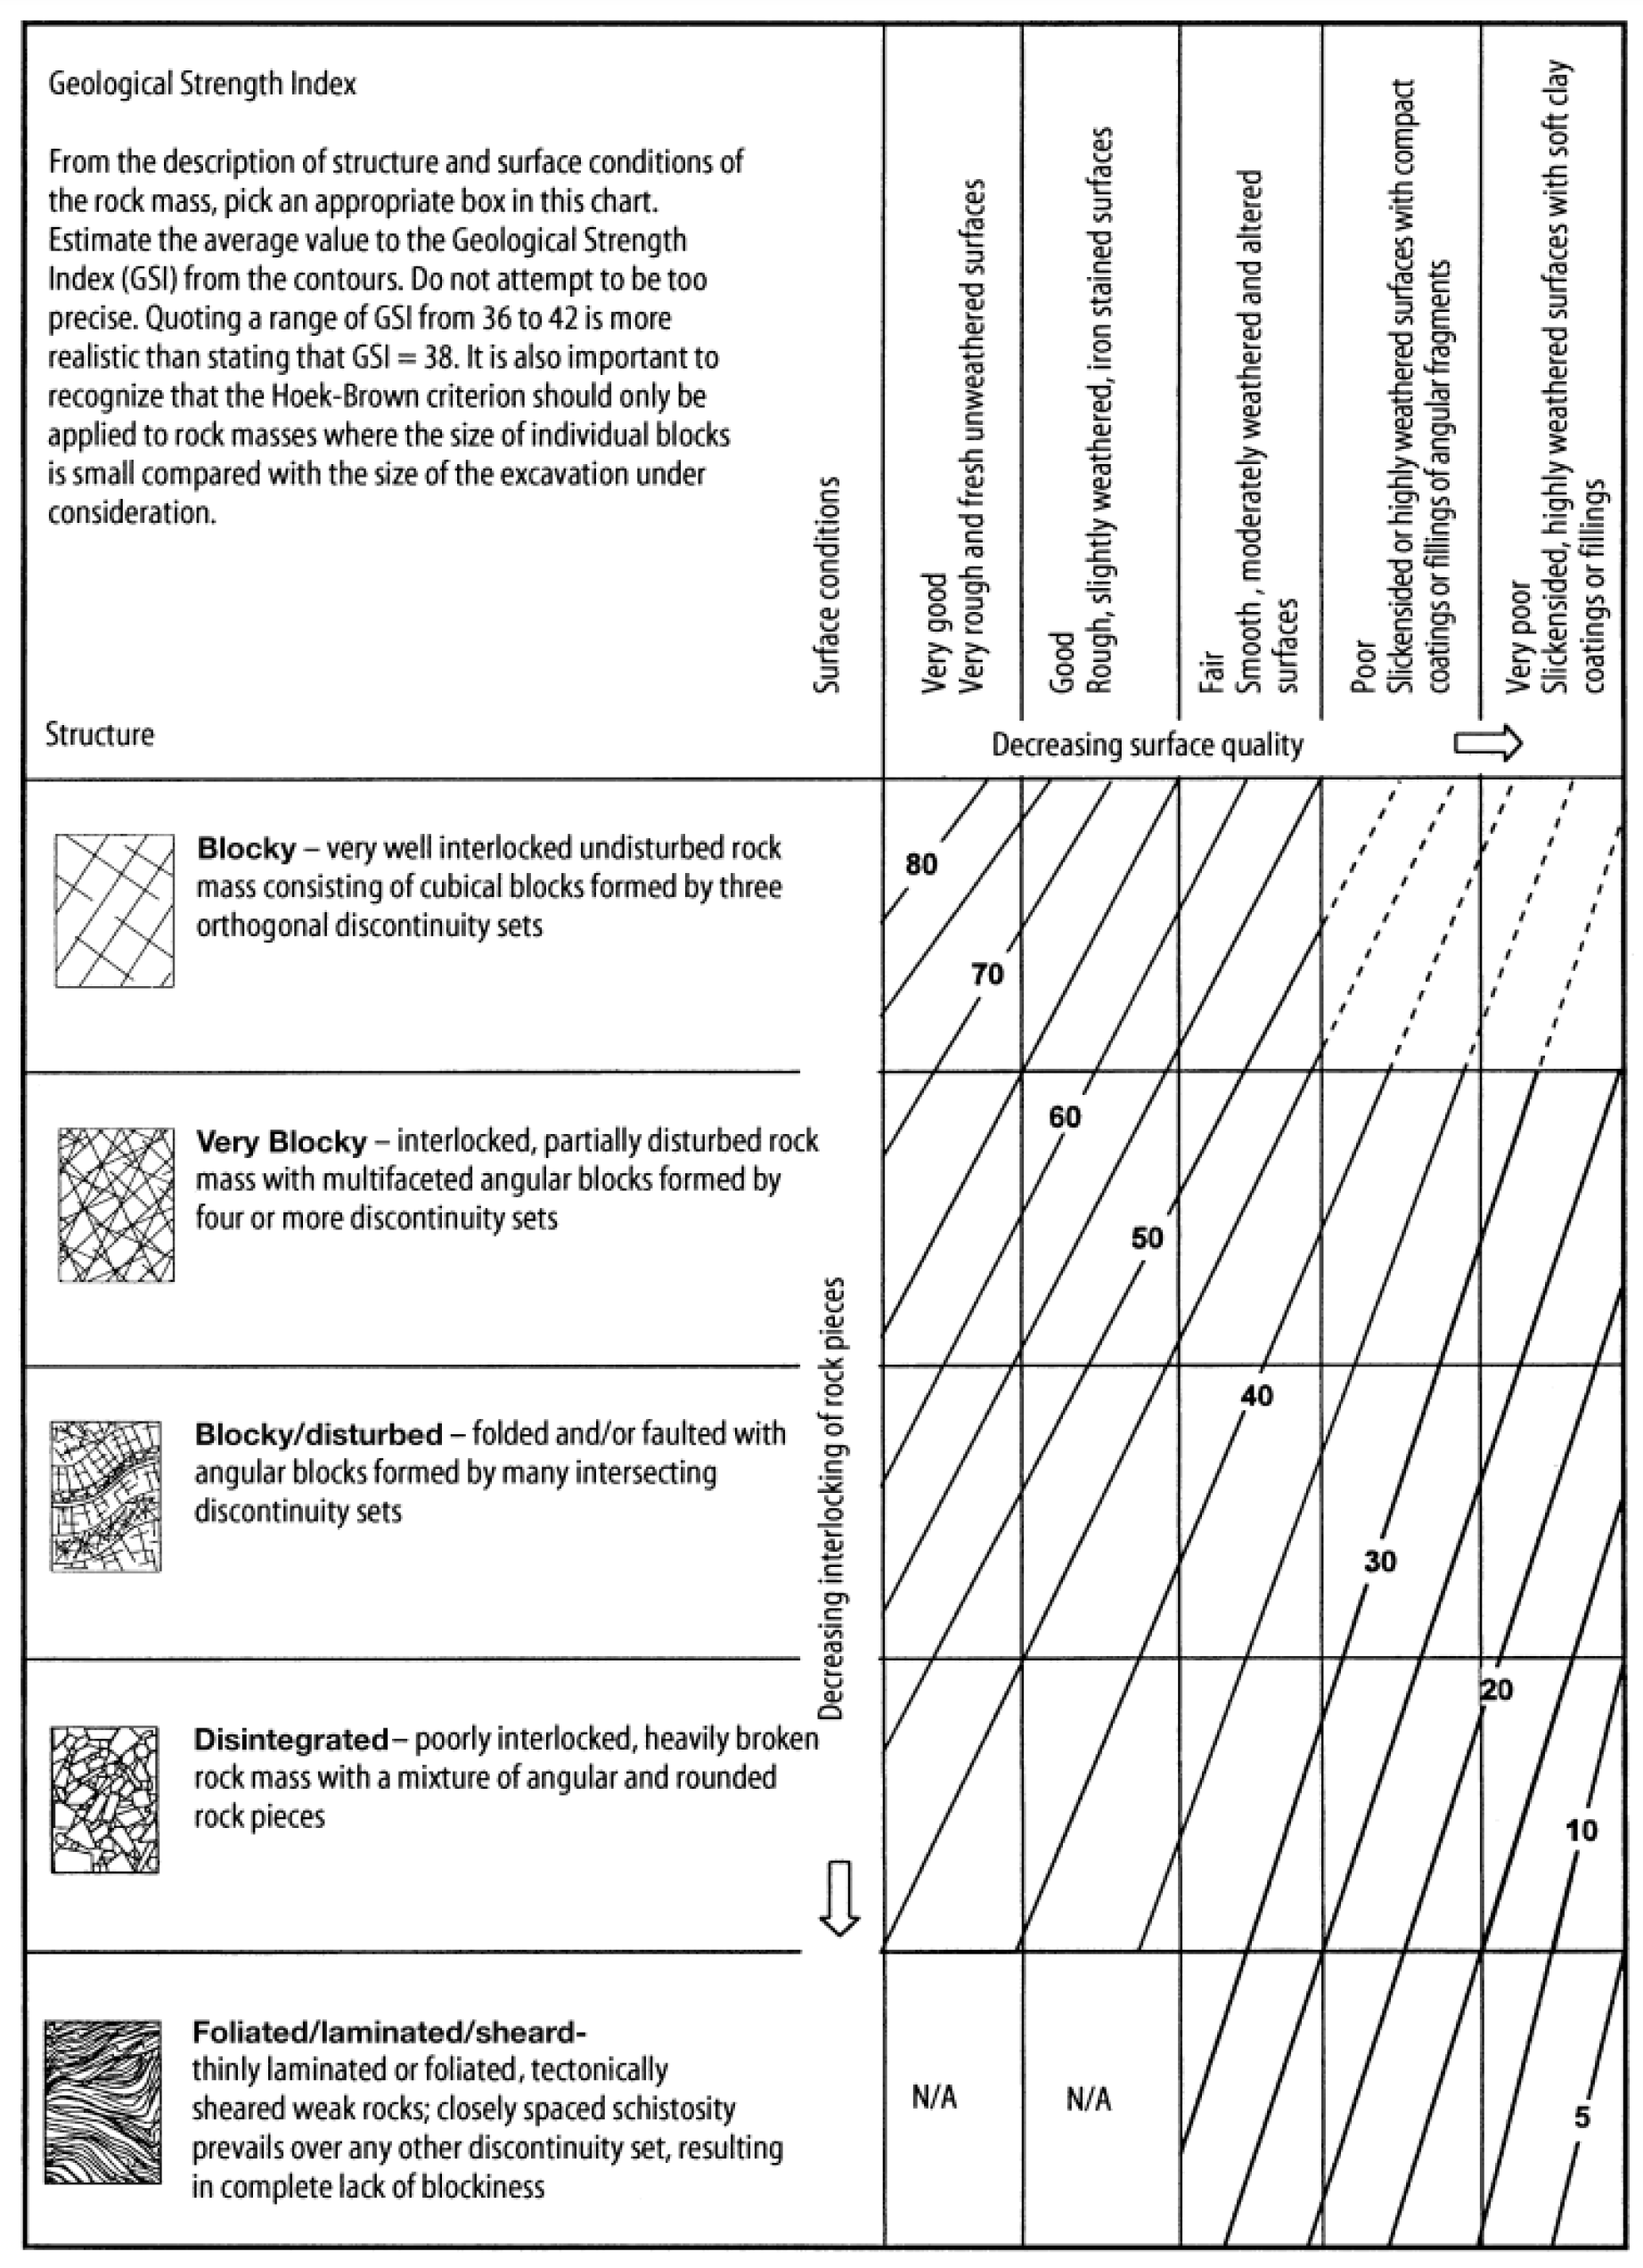
Figure A5.
GSI chart for jointed rock masses [25].
Figure A5.
GSI chart for jointed rock masses [25].

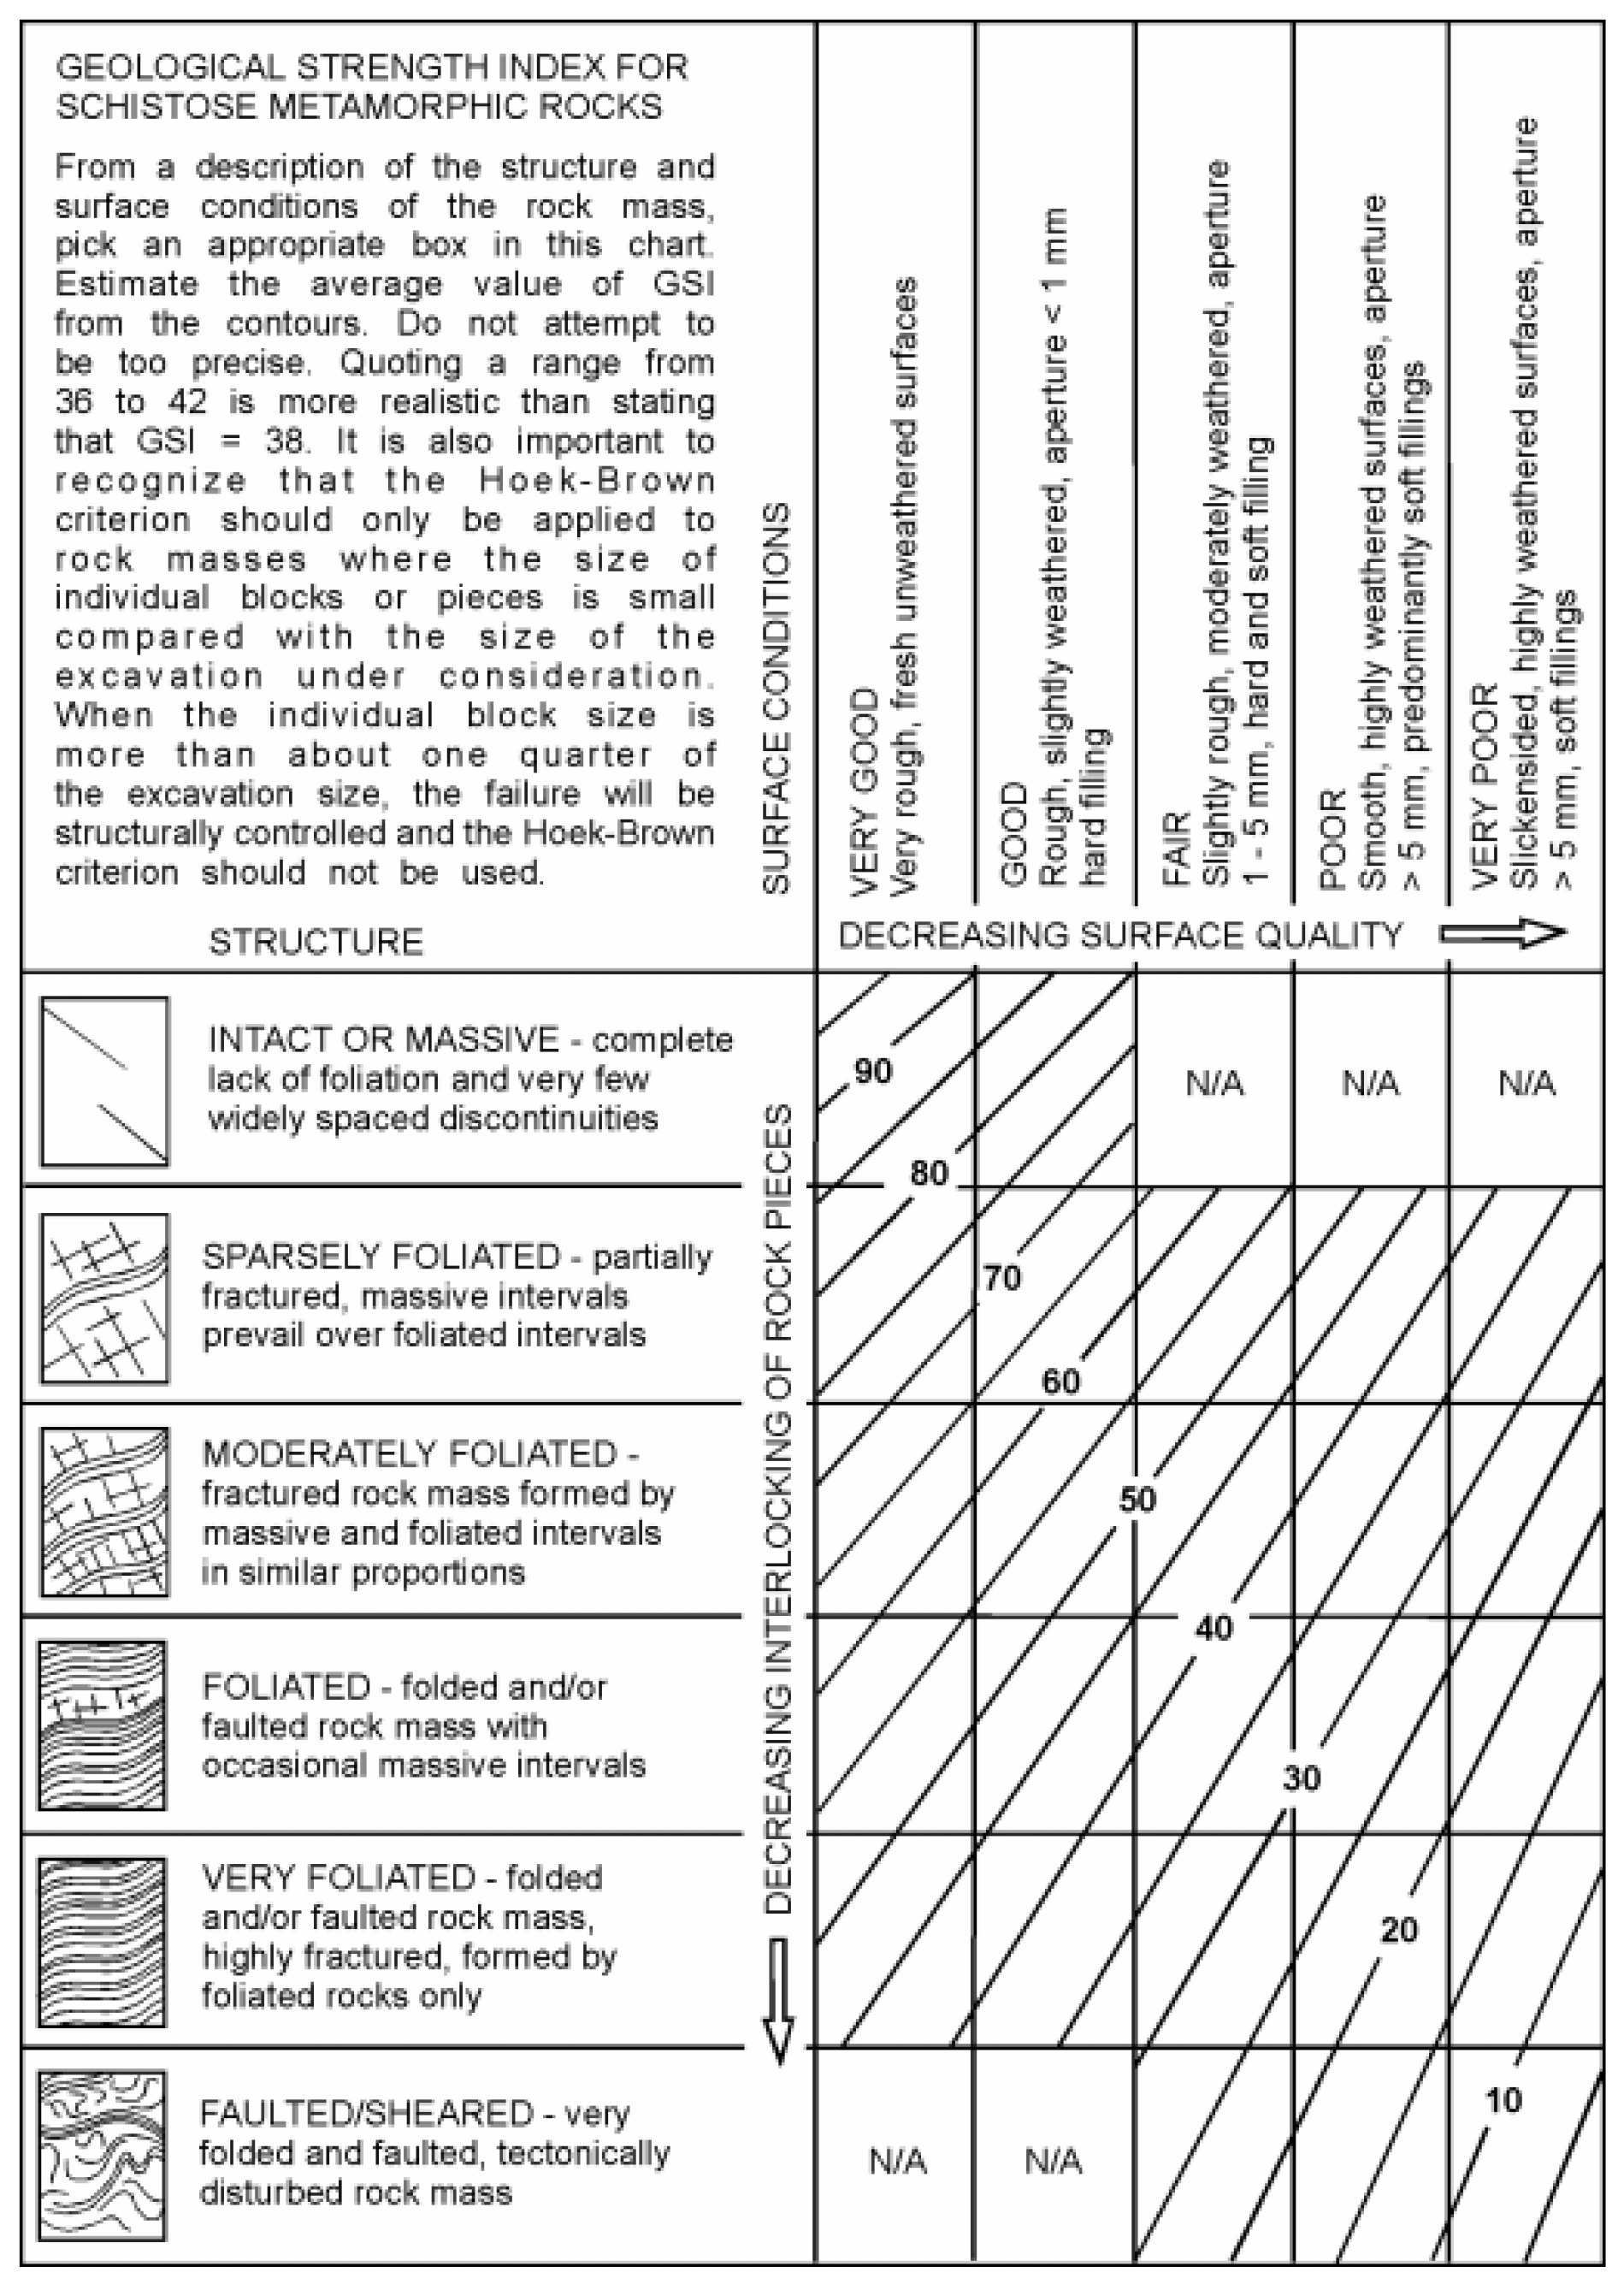
Figure A6.
GSI chart for other rock masses [25].
Figure A6.
GSI chart for other rock masses [25].

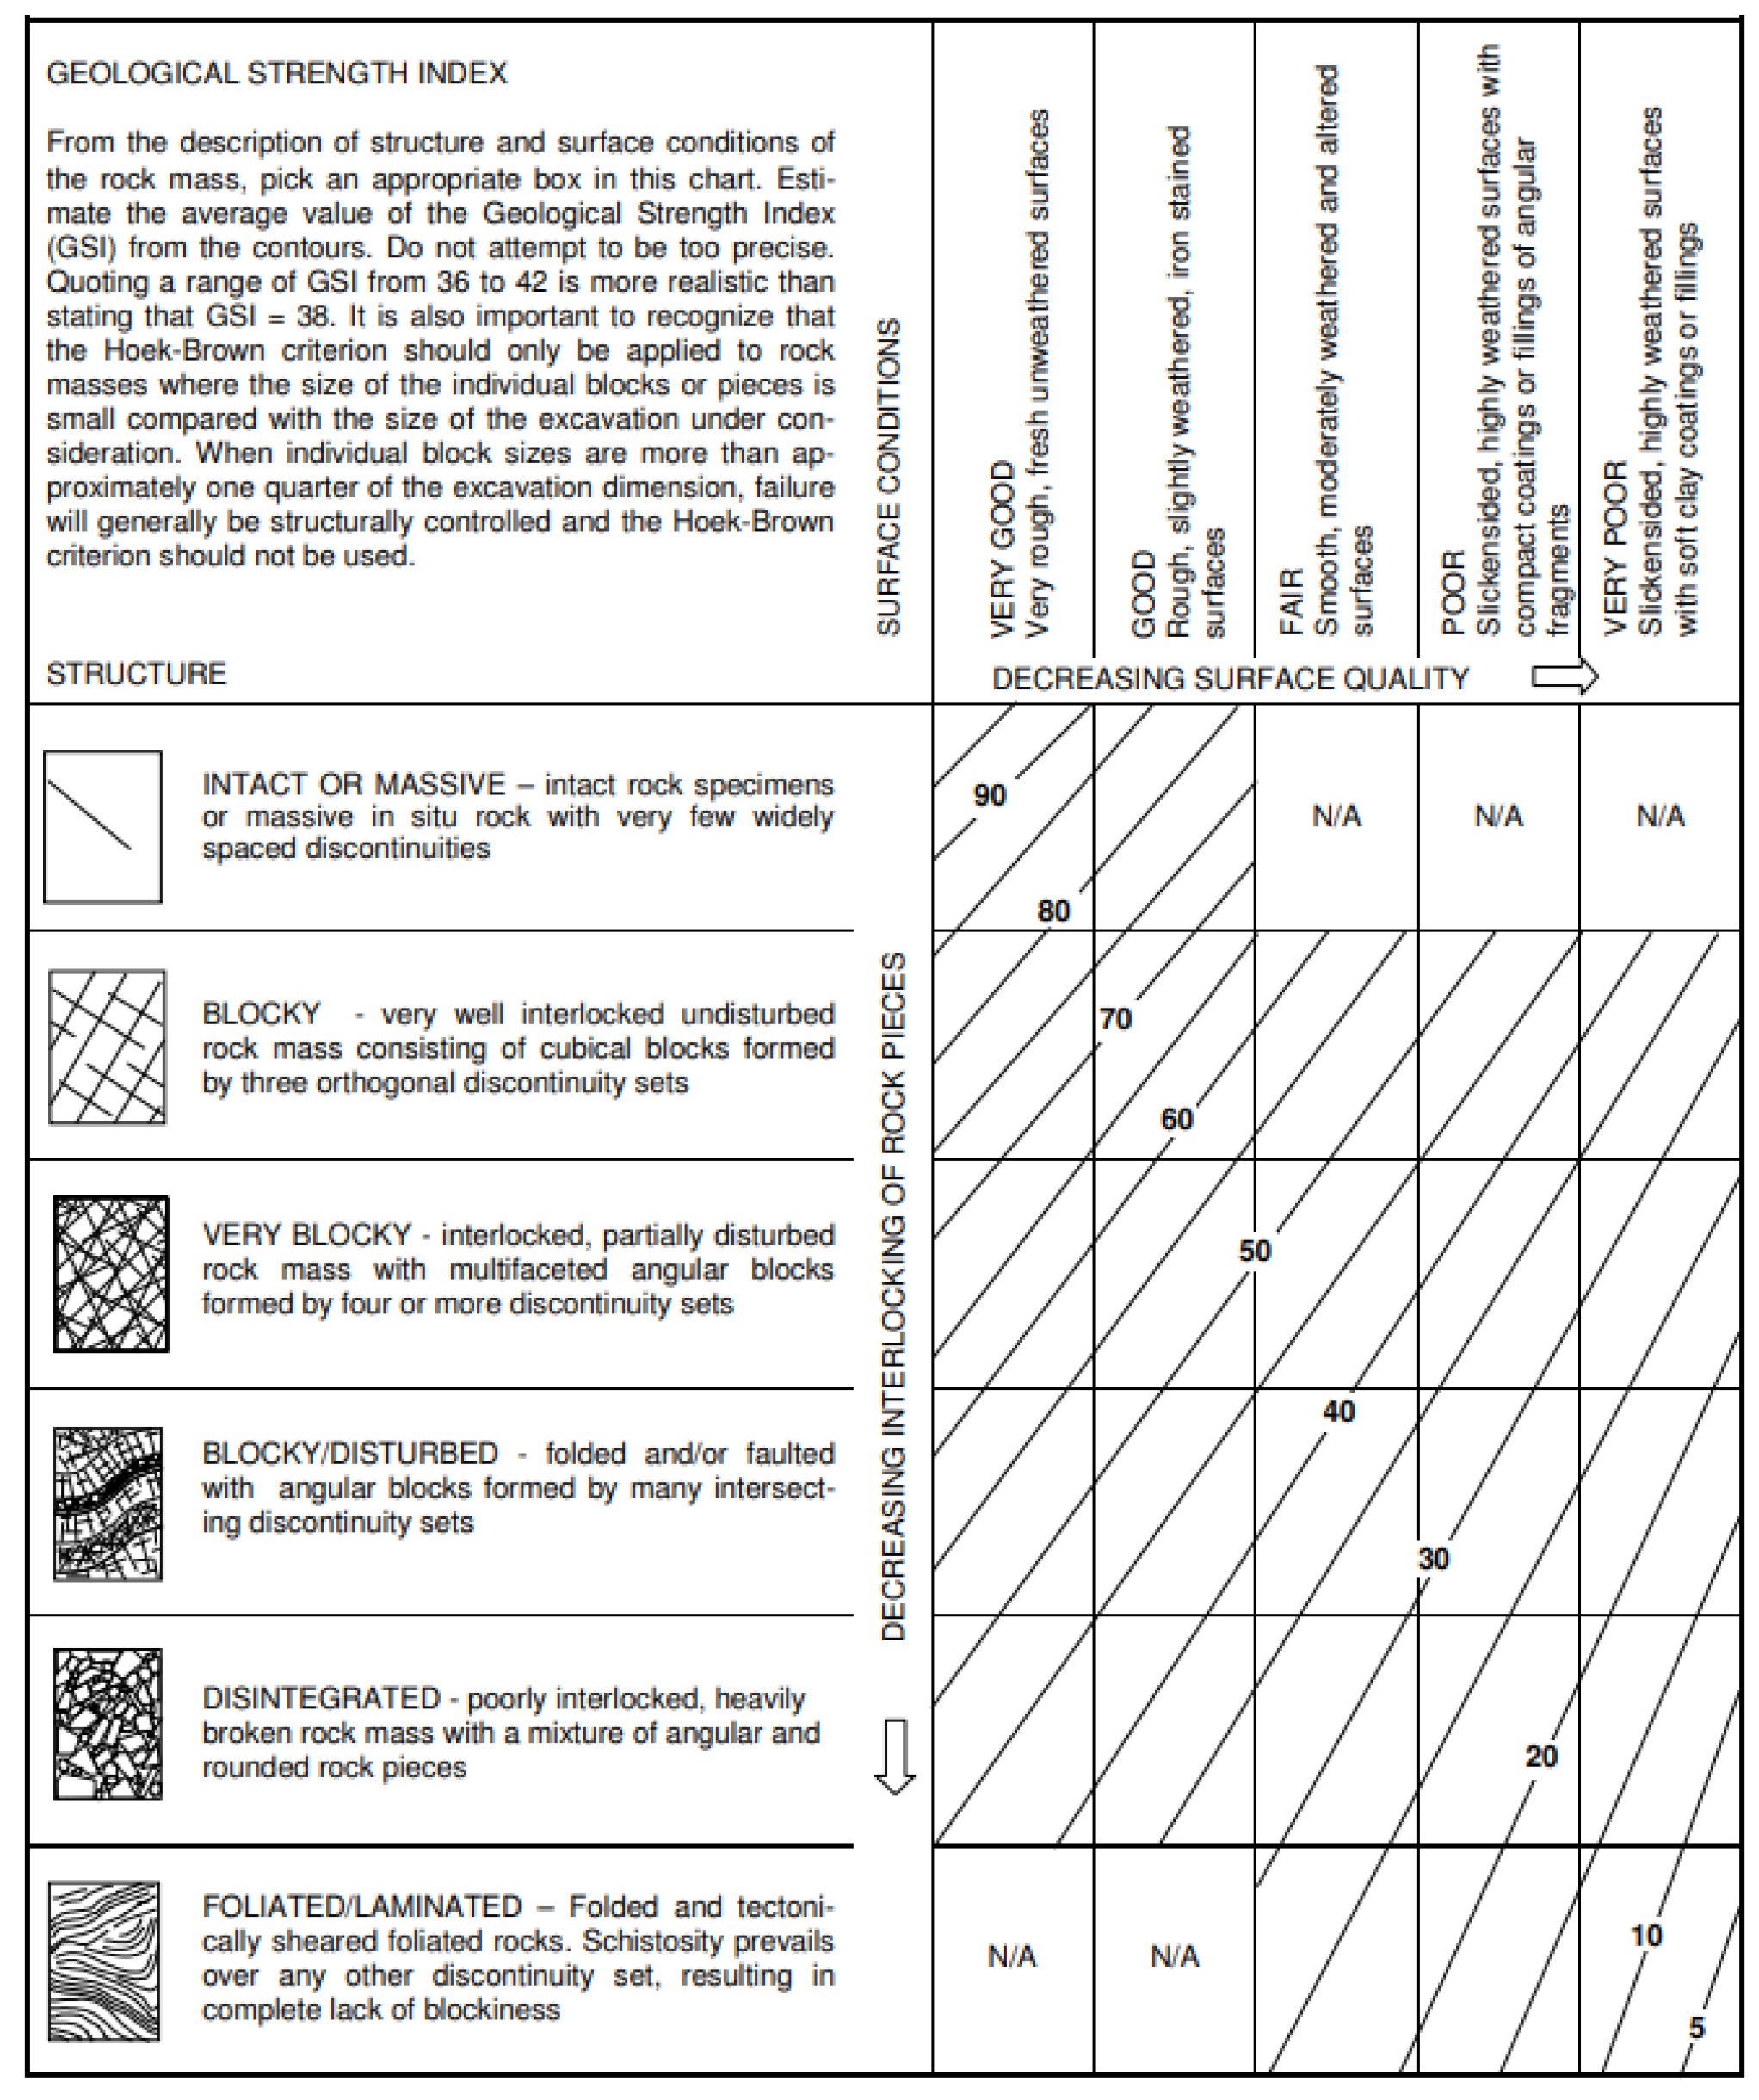
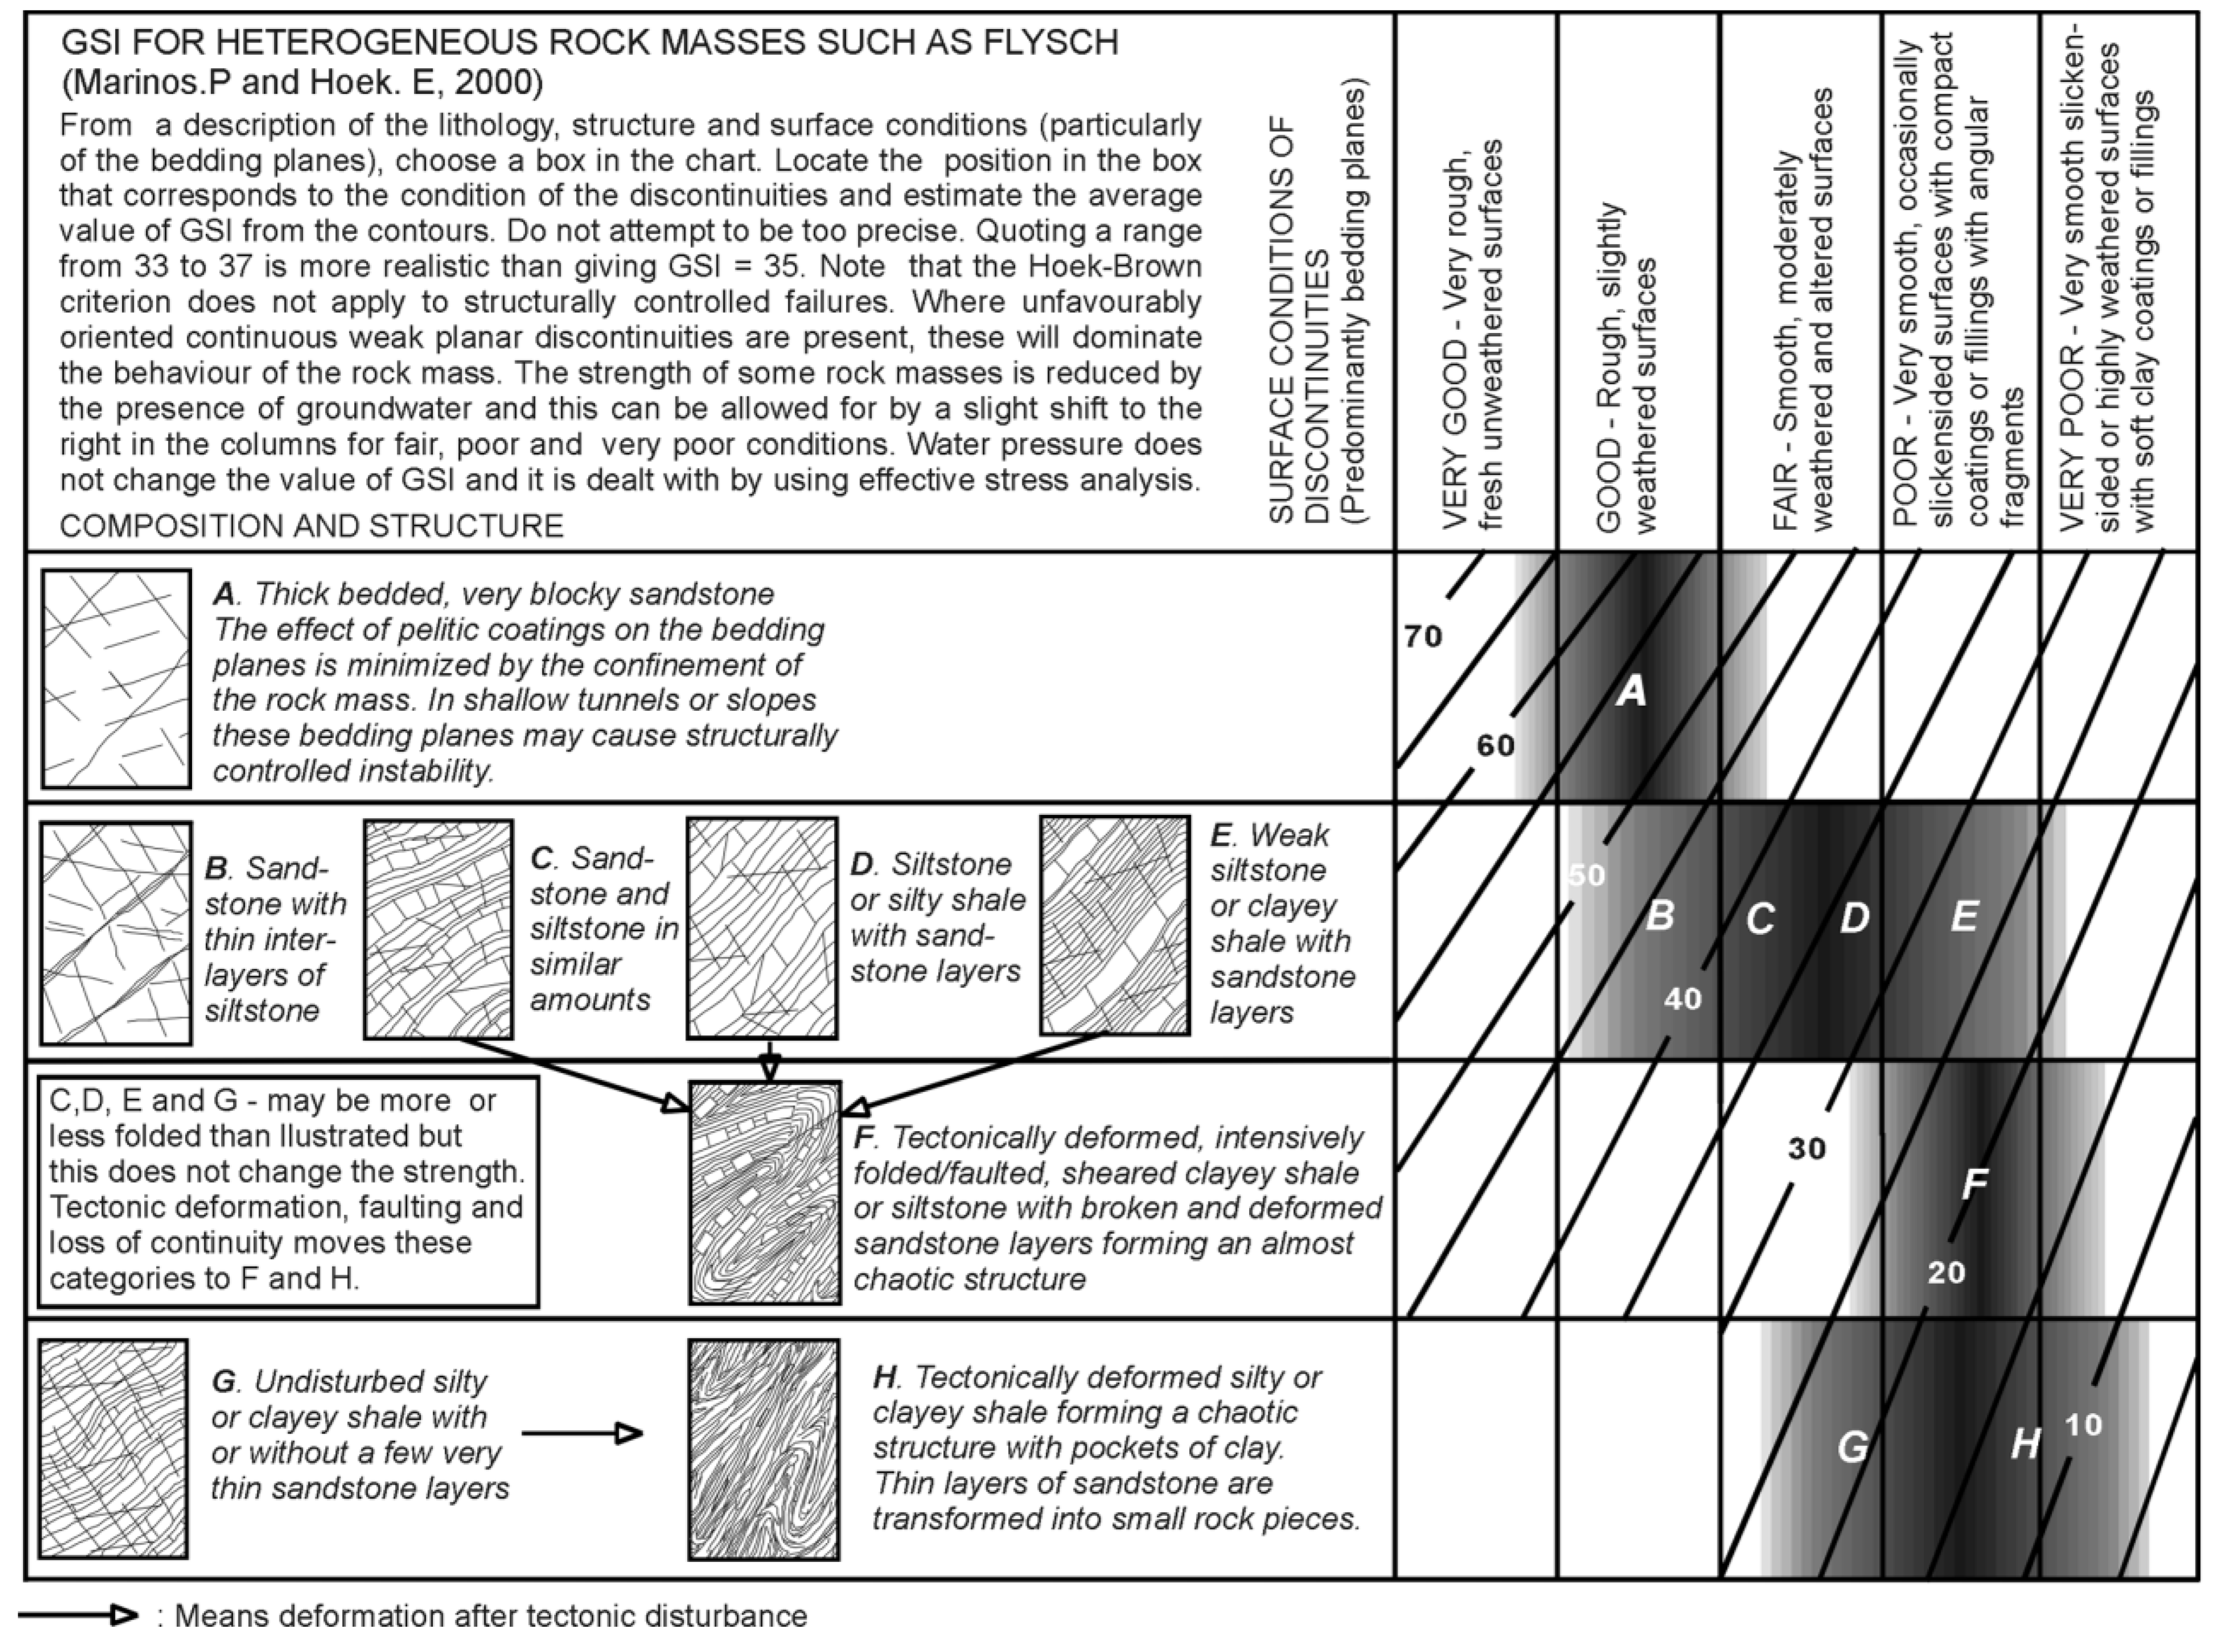
Figure A7.
GSI chart for other rock masses [18].
Figure A7.
GSI chart for other rock masses [18].

Figure A8.
GSI chart for other rock masses [26].
Figure A8.
GSI chart for other rock masses [26].

Figure A9.
Quantified GSI chart [51].
Figure A9.
Quantified GSI chart [51].

Figure A10.
Quantified GSI chart [52].
Figure A10.
Quantified GSI chart [52].

Figure A11.
Quantified GSI chart [53].
Figure A11.
Quantified GSI chart [53].

Figure A12.
Quantified GSI chart [54].
Figure A12.
Quantified GSI chart [54].

Figure A13.
Quantified GSI chart [55].
Figure A13.
Quantified GSI chart [55].

Figure A14.
Quantified GSI chart [56].
Figure A14.
Quantified GSI chart [56].

Figure A15.
Quantified GSI chart [57].
Figure A15.
Quantified GSI chart [57].

Figure A16.
Quantified GSI chart [41].
Figure A16.
Quantified GSI chart [41].

References
- Yang, B.; Mitelman, A.; Elmo, D.; Stead, D. Why the future of rock mass classification systems requires revisiting its empirical past. Q. J. Rock Eng. Hydrogeol. 2021, 55, qjegh2021-039. [Google Scholar]
- Elmo, D.; Mitelman, A.; Yang, B. An examination of rock engineering knowledge through a philosophical lens. Geosciences 2022, 12, 174. [Google Scholar] [CrossRef]
- Hoek, E. Strength of rock and rock masses. ISRM News J. 1994, 2, 4–16. Available online: https://www.scirp.org/(S(351jmbntvnsjt1aadkposzje))/reference/ReferencesPapers.aspx?ReferenceID=2026007 (accessed on 26 September 2022).
- Hoek, E.; Kaiser, P.K.; Bawden, W.F. Support of Underground Excavations in Hard Rock. 1995. Available online: ==https://www.mirarco.org/wp-content/uploads/Books/Support_of_Underground_Excavations_in_Hard_Rock.pdf (accessed on 26 September 2022).
- Kaiser, P.K. Mueller Award: From common to best practices in underground rock engineering. In Rock Mechanics for Natural Resources and Infrastructure Development; Da Fontoura, S.A., Rocca, R.J., Pavón Mendoza, J.F., Eds.; Taylor & Francis Group: Abingdon, UK, 2019; pp. 141–179. [Google Scholar]
- Barton, N. Continuum or discontinuum: GSI or JRC. Invited keynote lecture. In Proceedings of the Geotechnical Challenges in Mining, Tunnelling and Underground Structures (ICGCMTU2021), Online, 20–21 December 2021. [Google Scholar]
- Bruce, R.V. The launching of Modern American Science 1846–1876; Knopf: New York, NY, USA, 1987. [Google Scholar]
- Hölder, O. Die Axiome der Quantität und die Lehre vom Mass. Ber. Über Verh. Königlich Sachs. Ges. Wiss. Leipz. Math.-Physicke Kl. 1901, 53, 1–64. [Google Scholar]
- Deere, D.U.; Merritt, A.H.; Coon, R.F. Engineering Classification of In-Situ Rock; Air Force Weapons Laboratory: Albuquerque, NM, USA, 1969. [Google Scholar]
- Bieniawski, Z.T. Engineering classification of jointed rock masses. Trans. S. Afr. Inst. Civ. Eng. 1973, 15, 335–344. [Google Scholar]
- Bieniawski, Z.T. Engineering Rock Mass Classifications—A Complete Manual for Engineers and Geologists in Mining, Civil and Petroleum Engineering; Wiley: New York, NY, USA, 1989. [Google Scholar]
- Barton, N.R.; Lien, R.; Lunde, J. Engineering classification of rock masses for the design of tunnel support. Rock Mech. 1974, 6, 189–239. [Google Scholar] [CrossRef]
- Hoek, E.; Brown, E.T. The Hoek-Brown failure criterion and GSI—2018 edition. J. Rock Mech. Geotech. Eng. 2018, 11, 445–463. [Google Scholar] [CrossRef]
- Stevens, S.S. On the theory of scales of measurement. Science 1946, 103, 677–680. [Google Scholar] [CrossRef]
- Harrison, J.P. Rock engineering design and the evolution of Eurocode 7. In Proceedings of the EG50 2017—Engineering Geology 50 Conference, Portsmouth, UK, 5–7 July 2017. [Google Scholar]
- Pérez-Díaz, L.; Alcalde, J.; Bond, C.E. Handling uncertainty in the geosciences: Identification, mitigation and communication. Solid Earth 2020, 11, 889–897. [Google Scholar] [CrossRef]
- Feenberg, A. The concept of function in critical theory of technology. In Philosophy of Technology after the Empirical Turn, Philosophy of Engineering and Technology; Franssen, M., Vermaas, P., Kroes, P., Meijers, A., Eds.; Springer: Cham, Switzerland, 2016; Volume 23, pp. 283–303. [Google Scholar]
- Marinos, P.; Hoek, E. GSI: A geologically friendly tool for rock mass strength estimation. In Proceedings of the ISRM International Symposium, Melbourne, Australia, 19–26 November 2000; Available online: https://static.rocscience.cloud/assets/resources/learning/hoek/2000-GSI-A-Geologically-Friendly-Tool-for-Rock-Mass-Strength-Estimation.pdf (accessed on 26 September 2022).
- Marinos, V.; Marinos, P.; Hoek, E. The geological strength index: Applications and limitations. Bull. Eng. Geol. Environ. 2005, 64, 55–65. Available online: https://static.rocscience.cloud/assets/resources/learning/hoek/2005-The-GSI-Applications-and-Limitations.pdf (accessed on 26 September 2022). [CrossRef]
- Hoek, E.; Brown, E.T. Empirical strength criterion for rock masses. J. Geotech. Eng. Div. 1980, 106, 1013–1035. [Google Scholar] [CrossRef]
- Hoek, E.; Brown, E.T. Practical estimates of rock mass strength. Int. J. Rock Mech. Min. Sci. 1997, 34, 1165–1186. [Google Scholar] [CrossRef]
- Hoek, E.; Marinos, P.; Benissi, M. Applicability of the geological strength index (GSI) classification for very weak and sheared rock masses—the case of the Athens Schist Formation. Bull. Eng. Geol. Environ. 1998, 57, 151–160. [Google Scholar] [CrossRef]
- Hoek, E. Tunnel support in weak rock. Keynote address. In Proceedings of the Symposium of Sedimentary Rock Engineering, Taipei, Taiwan, 20–22 November 1998; Available online: https://static.rocscience.cloud/assets/resources/learning/hoek/1998-Tunnel-Support-in-Weak-Rock.pdf (accessed on 26 September 2022).
- Hoek, E.; Marinos, P. Predicting tunnel squeezing problems in weak heterogeneous rock masses. Tunn. Tunn. Int. 2000, 32, 45–51. [Google Scholar]
- Hoek, E.; Karzulovic, A. Rock mass properties for surface mines. In Slope Stability in Surface Mining; Hustralid, W.A., McCarter, M.K., van Zyl, D.J.A., Eds.; Society for Mining, Metallurgical and Exploration (SME): Littleton, CO, USA, 2000; Available online: https://static.rocscience.cloud/assets/resources/learning/hoek/Rock-Mass-Properties-for-Surface-Mines-2000.pdf (accessed on 26 September 2022).
- Hoek, E.; Marinos, P.G.; Marinos, V.P. Characterisation and engineering properties of tectonically undisturbed but lithologically varied sedimentary rock masses. Int. J. Rock Mech. Min. Sci. 2005, 42, 277–285. [Google Scholar] [CrossRef]
- Palmstrom, A. RMi—A Rock Mass Characterization System for Rock Engineering Purposes. Ph.D. Thesis, University of Oslo, Oslo, Norway, 1995. [Google Scholar]
- Sonmez, H.; Gokceoglu, C.; Ulusay, R. An application of fuzzy sets to the geological strength index (GSI) system used in rock engineering. Eng. Appl. Artif. Intell. 2003, 16, 251–269. [Google Scholar] [CrossRef]
- Hong, K.; Han, E.; Kang, K. Determination of geological strength index of jointed rock mass based on image processing. J. Rock Mech. Geotech. Eng. 2017, 9, 702–708. [Google Scholar] [CrossRef]
- Bozkir, A.S.; Nefeslioglu, H.A.; Kartal, O.; Sezer, E.; Gokceoglu, C. Geological strength index prediction by vision and machine learning methods. In Proceedings of the ISRM International Symposium—EUROCK 2020, Physical event not held, June 2020. [Google Scholar]
- Yang, S.; Liu, S.; Zhang, N.; Li, G.; Zhang, J. A fully automatic-image-based approach to quantifying the geological strength index of underground rock mass. Int. J. Rock Mech. Min. Sci. 2021, 140, 104585. [Google Scholar] [CrossRef]
- Zeni, M.A.; Peroni, R.D.L.; Santos, F.A.G.D. Semiautomatic determination of the geological strength index using SfM and ANN techniques. Int. J. Geomech. 2021, 21, 04021245. [Google Scholar] [CrossRef]
- Singh, J.; Pradhan, S.P.; Singh, M. Characterization of a fractured rock mass using geological strength index (GSI): A discrete fracture network (DFN) and machine learning (ML) approach. In Proceedings of the EGU General Assembly 2022, Vienna, Austria, 23–27 May 2022. [Google Scholar] [CrossRef]
- Forscher, B. Chaos in the brickyard. Science 1963, 142, 339. [Google Scholar] [CrossRef]
- Cai, M.; Kaiser, P.K.; Uno, H.; Tasaka, Y. Estimation of rock mass formation modulus and strength of jointed hard rock masses using the GSI system. Int. J. Rock Mech. Min. Sci. 2004, 41, 3–19. [Google Scholar] [CrossRef]
- Morelli, G.L. Alternative quantification of the geological strength index chart for jointed rocks. Geotech. Geol. Eng. 2017, 35, 2803–2816. [Google Scholar] [CrossRef]
- Russo, G. A new rational method for calculating the GSI. Tunn. Undergr. Space Technol. 2009, 24, 103–111. [Google Scholar] [CrossRef]
- Hoek, E.; Carter, T.G.; Diederichs, M.S. Quantification of the geological strength index chart. In Proceedings of the 47th US Rock Mechanics/Geomechanics Symposium, American Rock Mechanics Association, San Francisco, CA, USA, 23–26 June 2013. [Google Scholar]
- Cai, M.; Kaiser, P.K. Visualization of rock mass classification systems. Geotech. Geol. Eng. 2006, 24, 1089–1102. [Google Scholar] [CrossRef]
- Kim, B.H.; Cai, M.; Kaiser, P.K.; Yang, H.S. Estimation of block sizes for rock masses with non-persistent joints. Rock Mech. Rock Eng. 2007, 40, 169–192. [Google Scholar] [CrossRef]
- Schlotfeldt, P.; Carter, T.G. A new and unified approach to improved scalability and volumetric fracture intensity quantification for GSI and rockmass strength and deformability estimation. Int. J. Rock Mech. Min. Sci. 2018, 110, 48–67. [Google Scholar] [CrossRef]
- Winn, K.; Wong, L.N.Y. Quantitative GSI determination of Singapore’s sedimentary rock mass by applying four different approaches. Geotech. Geol. Eng. 2019, 37, 2103–2119. [Google Scholar] [CrossRef]
- Zhang, Q.; Huang, X.; Zhu, H.; Li, J. Quantitative assessments of the correlations between rock mass rating (RMR) an geological strength index (GSI). Tunn. Undergr. Space Technol. 2019, 83, 73–81. [Google Scholar] [CrossRef]
- Campos, L.A.; Filho, F.A.F.; Costa, T.A.V.; Marques, E.A.G. New GSI correlations with different RMR adjustments for an eastern mine of the Quadrilatero Ferrifero. J. South Am. Earth Sci. 2020, 102, 102647. [Google Scholar] [CrossRef]
- Bieniaski, Z.T. Misconceptions in the applications of rock mass classifications and their corrections. In Proceedings of the Seminar on Advanced Geotechnical Characterization for Tunnel Design, Madrid, Spain, 29 June 2011. [Google Scholar]
- BVP. Mapeamento Litoestrutural e Geomecânico da Mina do Tamanduá VALE (Relatório Técnico Nº VL 707.07-09-E-CA-RT-03-034-01”. 2008.
- Santos, Y.L.O.P.; Chaves, S.S.; Paredes, J.P.; Zenobio, A.A. Proposta de Índice de Ajuste (dw) Utilizando o arau de Intemperismo no uistema RMR (rock mass rating) de Classificação do gaciço sochoso. In Proceedings of the Anais VII Congresso Brasileiro de Mina a Céu Aberto e Mina Subterrânea, Belo Horizonte, Brazil, 10–12 July 2012. [Google Scholar]
- Celada, B.; Tardaguila, I.; Rodriguez, A.; Varona, P.; Bieniawski, Z.T. Actualización y mejora del RMR. Ingeopres 2014, 234, 18–22. [Google Scholar]
- Xia, K.; Chen, C.; Wang, T.; Pang, H.; Liu, X. Quantification of the GSI and D values in the Hoek-Brown criterion using the rock quality designation (RQD) and discontinuity surface condition rating (SCR). Bull. Eng. Geol. Environ. 2022, 81, 1–21. [Google Scholar] [CrossRef]
- Sonmez, H.; Ulusay, R. Modifications to the geological strength index (GSI) and their applicability to stability of slopes. Int. J. Rock Mech. Min. Sci. 1999, 36, 743–760. [Google Scholar] [CrossRef]
- Osgoui, R.R.; Ulusay, R.; Unal, E. An assistant tool for the geological strength index to better characterize poor and very poor rock masses. Technical note. Int. J. Rock Mech. Min. Sci. 2010, 47, 690–697. [Google Scholar] [CrossRef]
- Lin, D.; Sun, Y.; Zhang, W.; Yuan, R.; He, W.; Wang, B.; Shang, Y. Modifications to the GSI for granite in drilling. Bull. Eng. Geol. Environ. 2014, 73, 1245–1258. [Google Scholar] [CrossRef]
- Xiaohu, H.; Changming, W.; Tianzuo, W.; Zhiming, Z. Quantification of geological strength index based on discontinuity volume density of rock masses. Int. J. Heat Technol. 2015, 33, 255–261. [Google Scholar]
- Feng, W.; Dong, S.; Wang, Q.; Yi, X.; Liu, Z.; Bai, H. Improving the Hoek-Brown criterion based on the disturbance factor and geological strength index quantification. Int. J. Rock Mech. Min. Sci. 2018, 108, 96–104. [Google Scholar] [CrossRef]
- Li, L.; Yang, G.; Liu, H.; Song, S.; Fan, H. A quantitative model for the geological strength index based on attribute mathematics and its application. Bull. Eng. Geol. Environ. 2021, 80, 6897–6911. [Google Scholar] [CrossRef]
- Renani, H.R.; Martin, C.D.; Cai, M. An analytical model for strength of jointed rock masses. Tunn. Undergr. Space Technol. 2019, 94, 103159. [Google Scholar] [CrossRef]
- Pells, P.J.; Bieniawski, Z.T.; Hencher, S.R.; Pells, S.E. Rock quality designation (RQD): Time to rest in peace. Can. Geotech. J. 2017, 54, 825–834. [Google Scholar] [CrossRef] [Green Version]
- Yang, B.; Elmo, D.; Stead, D. Questioning the use of RQD in rock engineering and its implications for rock engineering design. In Proceedings of the 54th US Rock Mechanics/Geomechanics Symposium, American Rock Mechanics Association, Golden, CO, USA, 28 June–1 July 2020. [Google Scholar]
- Elmo, D.; Stead, D. The role of behavioural factors and cognitive biases in rock engineering. Rock Mech. Rock Eng. 2021, 54, 2109–2128. [Google Scholar] [CrossRef]
- Morelli, G.L. Variability of the GSI index estimated from different quantitative methods. Geotech. Geol. Eng. 2015, 33, 983–995. [Google Scholar] [CrossRef]
- Marinos, V.; Carter, T.G. Maintaining geological reality in application of GSI for design of engineering structures in rock. Eng. Geol. 2018, 239, 282–297. [Google Scholar] [CrossRef]
- Xu, C.; Dowd, P.A.; Fowell, R.J. A connectivity index for discrete fracture networks. Math. Geol. 2006, 38, 611–634. [Google Scholar] [CrossRef]
- Alghalandis, Y.F.; Dowd, P.A.; Xu, C. Connectivity field: A measure for characterising fracture networks. Math. Geosci. 2015, 47, 63–83. [Google Scholar] [CrossRef]
- Smith, N. The Chronicle of Higher Education—Review Section. 2021.
Figure 1.
Evolution of GSI and its quantification.

Figure 2.
JCond89 ratings determined by a group of experienced rock engineering professionals for two core samples (Core Sample 1 includes nine observations, Core Sample 2 includes eight observations, with some of them overlapping).
Figure 2.
JCond89 ratings determined by a group of experienced rock engineering professionals for two core samples (Core Sample 1 includes nine observations, Core Sample 2 includes eight observations, with some of them overlapping).

Figure 3.
RQD values determined by different rock engineering professions for (a) three different outcrops [58] and (b) two core samples.
Figure 3.
RQD values determined by different rock engineering professions for (a) three different outcrops [58] and (b) two core samples.

Figure 4.
RQD vs. velocity index graphs for (a) a threshold of 15 cm (assumed linear correlation with R2 of 0.46) and (b) a threshold of 10 cm (assumed power correlation with R2 of 0.46) (after [9]).
Figure 4.
RQD vs. velocity index graphs for (a) a threshold of 15 cm (assumed linear correlation with R2 of 0.46) and (b) a threshold of 10 cm (assumed power correlation with R2 of 0.46) (after [9]).

Figure 5.
GSI values calculated using the [38] quantification method. (a) GSI estimated using the RQD values from Figure 3a and assuming JCond89 rating of 20 (12 and 13 observation points for Sample 1 and Sample 2, respectively); (b) GSI estimated using the JCond89 values from Figure 2 and assuming RQD of 50% (nine and eight observation points for Sample 1 and Sample 2, respectively).


Figure 7.
Irreversibility bias associated with a lack of detailed geological description. (a) The same rock mass behavior could be linked to both a massive/intact with fair jointing conditions and very blocky with very good jointing conditions. (b,c) show the combined impact of GSI and mi on the modelled rock mass response, highlining the impossible task to define a unique failure envelope for naturally variable rock masses.

Figure 8.
Proposed qualitative revision of the GSI table (1997) [21] to better account for geology and the irreversibility bias (modified from [2,61]).

Figure 9.
The allegory of the unnecessary labyrinth to explain the chaos created by adding a variety of quantification methods for something like GSI that is and will always remain a qualitative assessment.
Figure 9.
The allegory of the unnecessary labyrinth to explain the chaos created by adding a variety of quantification methods for something like GSI that is and will always remain a qualitative assessment.

| Nominal Words, letters and alpha numeric symbols are used to classify data. | Ordinal The measurement represents an ordered relationship among the variable’s observations. | Interval Distances along a measurement scale (intervals) used to classify, order and compare measurements. | Ratio Interval measurement for which zero is permitted. |
| Example: weathering classes used in core logging, hardness field identification. | Example: several parameters used in rock mass classification systems. | Example: fracture length, fracture aperture. | Example: tensile strength, rock compressive strength. |
| Qualitative Assessment | Quantitative Measurement | ||
| Permissible statistics | |||
| Number of cases; Mode | |||
| Median; Percentile | |||
| Mean; Standard Deviation | |||
| Coefficient of Variation | |||
Table 2.
Equivalencies between GSI, RMR and Q proposed in [3].
Table 2.
Equivalencies between GSI, RMR and Q proposed in [3].
| GSI = RMR76′ for RMR76′ > 18 |
| GSI = RMR89′—5 for RMR89′ > 23 |
| GSI = 9lnQ + 44 for RMR76′ ≤ 18 or RMR89′ ≤ 23 |
Publisher’s Note: MDPI stays neutral with regard to jurisdictional claims in published maps and institutional affiliations. |
© 2022 by the authors. Licensee MDPI, Basel, Switzerland. This article is an open access article distributed under the terms and conditions of the Creative Commons Attribution (CC BY) license (https://creativecommons.org/licenses/by/4.0/).
Share and Cite
MDPI and ACS Style
Yang, B.; Elmo, D. Why Engineers Should Not Attempt to Quantify GSI. Geosciences 2022, 12, 417. https://0-doi-org.brum.beds.ac.uk/10.3390/geosciences12110417
AMA Style
Yang B, Elmo D. Why Engineers Should Not Attempt to Quantify GSI. Geosciences. 2022; 12(11):417. https://0-doi-org.brum.beds.ac.uk/10.3390/geosciences12110417
Chicago/Turabian StyleYang, Beverly, and Davide Elmo. 2022. "Why Engineers Should Not Attempt to Quantify GSI" Geosciences 12, no. 11: 417. https://0-doi-org.brum.beds.ac.uk/10.3390/geosciences12110417
Note that from the first issue of 2016, this journal uses article numbers instead of page numbers. See further details here.