Article

Combined Use of C- and X-Band SAR Data for Subsidence Monitoring in an Urban Area

1
Department of Earth Sciences, University of Firenze, Via La Pira 4, 50121 Firenze, Italy
2
Istituto per il Rilevamento Elettromagnetico dell’Ambiente, IREA-CNR, via Diocleziano 328, 80124 Napoli, Italy
3
Istituto di Metodologie per l’Analisi Ambientale, IMAA-CNR, Contrada Santa Loja-Zona Industriale, Tito Scalo, 85050 Tito, Italy
*
Author to whom correspondence should be addressed.
Submission received: 3 February 2017 / Revised: 29 March 2017 / Accepted: 29 March 2017 / Published: 1 April 2017
(This article belongs to the Special Issue Observing Geohazards from Space)

Abstract

:
In this study, we present the detection and characterization of ground displacements in the urban area of Pisa (Central Italy) using Interferometric Synthetic Aperture Radar (InSAR) products. Thirty RADARSAT-2 and twenty-nine COSMO-SkyMed images have been analyzed with the Small BAseline Subset (SBAS) algorithm, in order to quantify the ground subsidence and its temporal evolution in the three-year time interval from 2011 to 2014. A borehole database was reclassified in stratigraphical and geotechnical homogeneous units, providing the geological background needed for the local scale analysis of the recorded displacements. Moreover, the interferometric outputs were compared with the last 30 years’ urban evolution of selected parts of the city. Two deformation patterns were recorded by the InSAR data: very slow vertical movements within the defined stability threshold (±2.5 mm/yr) and areas with subsidence rates down to −5 to −7 mm/yr, associated with high peak velocities (−15 to −20 mm/yr) registered by single buildings or small groups of buildings. Some of these structures are used to demonstrate that the high subsidence rates are related to the recent urbanization, which is the trigger for the accelerated consolidation process of highly compressible layers. Finally, this urban area was a valuable test site for demonstrating the different results of the C- and X-band data processing, in terms of the density of points and the quality of the time series of deformation.

Graphical Abstract

1. Introduction

Subsidence is a broad term usually referring to the ground lowering induced by natural or anthropic factors. Among the anthropic causes, rapid urbanization is considered as one of the most important accelerating factors for the consolidation process, especially where unconsolidated alluvial deposits, peat-rich layers, and reclamation areas are present [1,2,3,4,5,6].
The analysis of Synthetic Aperture Radar (SAR) images with Advanced Differential Interferometry (A-DInSAR) techniques is a useful tool for monitoring different ground movements, including landslides, tectonic and volcanic activity, and subsidence [6,7,8,9]. The various analysis algorithms that have been developed in the last two decades allow reaching the millimeter accuracy, in addition to a regional-scale coverage of data at a reasonable cost [10]. These advantages have been exploited to monitor the ground subsidence of urban areas in many nations around the world, including Italy [11,12,13,14,15,16], China [4,5,17,18,19], Spain [20,21,22,23], Greece [24,25,26], the United States of America [27,28,29], Vietnam [30,31], Indonesia [32,33], and Portugal [34,35].
In this study, C-band RADARSAT-2 (RSAT) and X-band COSMO-SkyMed (CSK) data have been processed with the Small BAseline Subset (SBAS) approach, to provide the deformation maps of the urban area of Pisa (Central Italy) in the time interval 2011–2014. The area of interest has been characterized by exploiting the potential of the two satellites, at a regional scale for RADARSAT-2 and at a building scale for COSMO-SkyMed. New deformation-affected areas and trend changes in the time series of deformation of selected buildings have been examined, to demonstrate the existing relation between recorded displacements, local geological setting, and urban development.

2. Geological and Hydrogeological Setting

The Arno coastal plain, which is 450 km2 wide, is a densely-populated area with several industrial activities and diffuse cultural heritages. The city of Pisa occupies a central position in this coastal plain, which represents the southern inshore portion of the Viareggio basin, a subsiding half-graben [36,37]; this tectonically formed basin was progressively infilled by marine and alluvial sediments after the Last Glacial Maximum (LGM) [36,37]. The Quaternary sea level fluctuations produced an incised valley perpendicular to the present shoreline, with a maximum depth of 40 m [38,39,40]. After the eustatic sea level rise post LGM, estuarine and coastal plain sedimentation took place, filling almost half of the valley [37]. The last 20–25 m of the infilling sequence is composed of transgressive Holocene sediments, deposited after the phase of the decelerated sea level rise [41].
At its base, this succession has a level of clays and silty clays, locally known as “pancone”, continuously widespread in the plain to the border of the coastal beach ridges system. This level, deposited in a lagoonal environment, is characterized by the presence of layers rich in organic matter [42]. Above the pancone, a fluvio-deltaic sequence, 10–15 m thick, is found; it is composed of clay and silt with sporadic sand and silty sand bodies that reflect the coastal progradation of the modern Arno delta [37].
The stratigraphic structure of the Holocene succession leads to the presence of geotechnically-weak layers in the first 20 m of the underground beneath the city [43], producing a preferential predisposing factor for ground subsidence and the structural failure of buildings, as testified by the most famous cultural heritage of the city, the Leaning Tower [44].
From a hydrogeological point of view, a phreatic aquifer composed of sandy and silty-sand layers within the clayey sequence is found. This water reservoir is not usually used for water extraction because of its low transmissivity and quality, and its high vulnerability to contamination [45]. The phreatic surface level is almost the same across the northern part of the city and in the city center, while the minimum depth (2 m below sea level) is registered in the southern part of the International Airport Galileo Galilei (Figure 1). The maximum level is found in the Ospedaletto district, reaching 1.5 m above sea level [45]. The most important water resource for the city of Pisa is located at a higher depth, ranging from 50 to 100 m below the surface, and it is composed of a confined aquifer made up of Pleistocene gravels and sands, 10–20 m thick [46,47]. This aquifer, generally characterized by water of a low quality, is mainly used for gardening, irrigation, and industry, while only a few pumping wells are exploited for drinking water [46].

3. Available Data

3.1. Interferometric Data

The two SAR datasets exploited for this study are analyzed with the advanced DInSAR technique, referred to as the SBAS approach [48,49,50,51,52,53], to retrieve the deformation time series in the temporal range between 2011 and 2014. The data processing of the SAR images has been performed by using the full Resolution SBAS-DInSAR processing chain, developed and owned by CNR-IREA (National Research Council-Institute for Electromagnetic Sensing of the Environment, Napoli, Italy). The key feature of this algorithm’s chain is the selection of the SAR images that will be used to generate the interferograms; this is done by choosing only those data pairs characterized by short temporal and perpendicular baselines [48]. This procedure allows for a minimization of the noise effects, intended as decorrelation phenomena [52], thus maximizing the number of coherent pixels in the generated interferograms. Independent acquisition datasets, separated by large baselines, are properly linked by applying the Singular Value Decomposition (SVD) method, to retrieve deformation time series and velocity maps. The SBAS algorithm is also capable of producing results at two different scales [49]: a regional-scale, for investigating diffused deformation phenomena at a medium spatial resolution (the cell resolution ranges from 100 × 100 m to 30 × 30 m) [51]; and a local scale, which exploits the full resolution interferograms (benefiting from the high-resolution capability of the SAR satellite system) for generating products ideally suited for building analysis [53,54]. The regional-scale product is used to estimate the low pass signal components, typical of the atmospheric artifacts and related to deformations over large areas [48]. Conversely, the local-scale output is exploited to investigate the high frequencies, typical of localized displacements [49,51,53].
The COSMO-SkyMed X-band (λ = 3.1 cm) dataset is comprised of 29 ascending acquisitions collected between the 26 September 2012 and the 11 May 2014. The data have been acquired in Stripmap mode with HH polarization. The CSK scenes are characterized by an incidence angle at mid-range of around 30° and by a spatial resolution of 3 m in both range and azimuth directions. The 29 CSK scenes have been firstly converted from the raw data L0 format into the Level1 SLC (Single Look Complex) format, and a quality assessment has also been applied to these images. Then, they have been co-registered with respect to the 11 July 2013 master image, chosen as reference geometry. The CSK dataset is characterized by a large spatial baseline distribution, since the orbital tube exceeds 2000 m and an average perpendicular baseline of 380 m, as well as by a quite dense temporal sequence, with an average sampling of 21 days (Figure 2a). The CSK images have been coupled, by applying the Delaunay triangulation method [55], into 88 interferometric pairs, characterized by maximum spatial and temporal baseline values of about 800m and 500 days, respectively. Following the interferogram generation step, the PhU (Phase Unwrapping) operation at the regional scale has been carried out by applying the method described in [55] and selecting the pixels that have a coherence, estimated in a box of 10 × 10 pixels, in the range and azimuth directions of greater than 0.35 in at least 30% of the interferograms [55]. The final selection of the pixels correctly unwrapped has been carried out by considering pixels with a temporal coherence value [52] greater than 0.7.
The RADARSAT-2 C-band (λ = 5.6 cm) dataset is composed of 30 ascending orbit images acquired in Standard 3 (S3) beam mode (one of eight standard beam modes of the sensor, covering a nominal stripmap swath of 108 km and acquired with a range bandwidth of 11.56 MHz) and with HH polarization, covering the time interval 27 October 2011–26 April 2014. The RSAT scenes are characterized by a mid-range incidence angle of around 30° and a spatial resolution of 12 × 5 m in the slant range and azimuth directions, respectively. The 30 RSAT images, in the Level1 SLC format, have been properly co-registered with respect to a common geometry (master image); the 14 November 2012 acquisition has been selected for this purpose. The RSAT dataset is characterized by a good spatial baseline distribution, with an orbital tube around 700 m and an average perpendicular baseline of 120 m, in addition to a temporal sequence with an average sampling of 31 days (Figure 2b). The RSAT images have been coupled into 87 interferometric pairs, characterized by maximum spatial and temporal baseline values of about 300 m and 900 days, respectively. Following the interferogram generation step, the PhU operation at the regional scale has been carried out by selecting the pixels that have a coherence, estimated in a box of 4 × 20 pixels, in the range and azimuth directions of greater than 0.35 in at least the 30% of the interferograms [55]. The final selection of the pixels correctly unwrapped has been carried out by considering pixels with a temporal coherence value [52] greater than 0.7.
The results of the data processing of both satellite datasets show a very high coverage for the urban area of Pisa, with a lack of measurement points in only some areas, near the city limits, which are largely covered by crop fields (Figure 3). The two datasets show a marked difference in terms of the density of points; in fact, the density of the measurement points within the area of interest (33 km2) is 910 points/km2 for RSAT and 11,027 points/km2 for CSK. This great increase in the number of points between the C- and X-band is consistent with the results obtained from other test sites using CSK data [14,15,51,56,57]. The higher number of measurement points—i.e., coherent points—is achieved thanks to the lower revisit time and higher spatial resolution of the X-band sensors. Moreover, the shorter wavelength allows an increase in the sensitivity to LOS (Line of Sight) displacements, together with a higher capability of detecting very low displacement rates [14,15,51,56,57]. The derived displacements are projected along the line ideally joining the sensor and ground target (LOS), mainly considering vertical (up-down) and East-West movements [58,59]. Each coherent point is associated with a displacement value expressed in millimeters per year and a sign depending on the movement; positive if an uplift is registered (blue color in the deformation map), and negative if ground subsidence is affecting the point (red color in the deformation map).

3.2. Stratigraphical Information and Borehole Classification System

For better understanding the recorded displacements, detailed stratigraphical information about the subsurface setting is needed. This information has been extracted from the Pisa Province borehole database, that includes both the lithological descriptions and geotechnical parameters obtained from laboratory tests. Ninety-two boreholes in the urban area of Pisa were selected according to the unique restriction of being deeper than 10–15 m, in order to intercept at least the upper limit of the pancone deposit. For homogenizing the subsurface information from a geotechnical point of view, a classification system was applied. This classification, proposed by Sarti et al. [43] and recently modified by Solari et al. [6,60], is composed of five facies associations. A detailed discussion on the characteristics of each class can be found in Solari et al. [6,60]. Accordingly, we will summarize the class descriptions, focusing on the geotechnical implications.
Unit 1 consists of the pancone very soft clay and silt clay level. The thickness of this unit varies from 3 to 12 m and can be found at a depth of 8 to 20 m, depending on the position in the plain. From a geotechnical point of view, it is considered as a highly compressible level, with a high water content that is sometimes close to the liquid limit. These characteristics strongly depend on the brackish sedimentation environment in which the unit was formed, which also favored the development of thin organic layers that further decrease the general resistance of this unit.
Unit 2 consists of dark soft clay and silty clay with a high organic matter content and occasional peat layers. It is typically found on top of Unit 1, with a thickness ranging from 2 to 6 m. This level has similar characteristics to the previous one, with a low strength and high compressibility, sometimes improved by the presence of less organic layers with a higher consistency.
Unit 3 consists of a rhythmical alternation of clayey silt, sandy silt, and silty sand, with a discontinuous distribution in the plain; where found, it lays at 2–6 m below surface, with a thickness smaller than 4 m. The geotechnical parameters, such as the water content and plasticity index, show a high variability, reflecting the chaotic structure of this sequence in which the fine sand percentage fluctuates. This unit is characterized by better mechanical properties than the previous two; however, it must be considered a potentially compressible layer because of its degree of saturation. In fact, if saturated conditions occur, even these fine-grained sands and silts can produce a high loss in volume.
Unit 4 consists of stiff clay with a very low organic matter content and high consistency due to a subaerial depositional setting of the sediments that produced resistant pedogenetic surfaces. Unit 4 is the uppermost level in the sequence and has a thickness of 5–6 m. This unit has the highest consistency and shear strength among all of the clayey layers.
Unit 5 consists of fluvial channel fine to coarse sand, with a high variability in the thickness (1–10 m) and vertical position within the stratigraphical sequence (lenticular bodies can be found at the contact with the pancone level). In terms of its mechanical behavior, it is considered as the unit with the lowest settlement potential.
The potential settlements in the area are produced not only by the presence of Unit 1 alone, but are related to the simultaneous presence of more compressible layers. The worst-case scenario consists of this bottom-up stratigraphy: Units 1 and 2, overlapped by Unit 4, and partially replaced by a saturated Unit 3 level. This sequence, common in the area, is considered as the most susceptible to settlements [6].

4. Results and Discussion

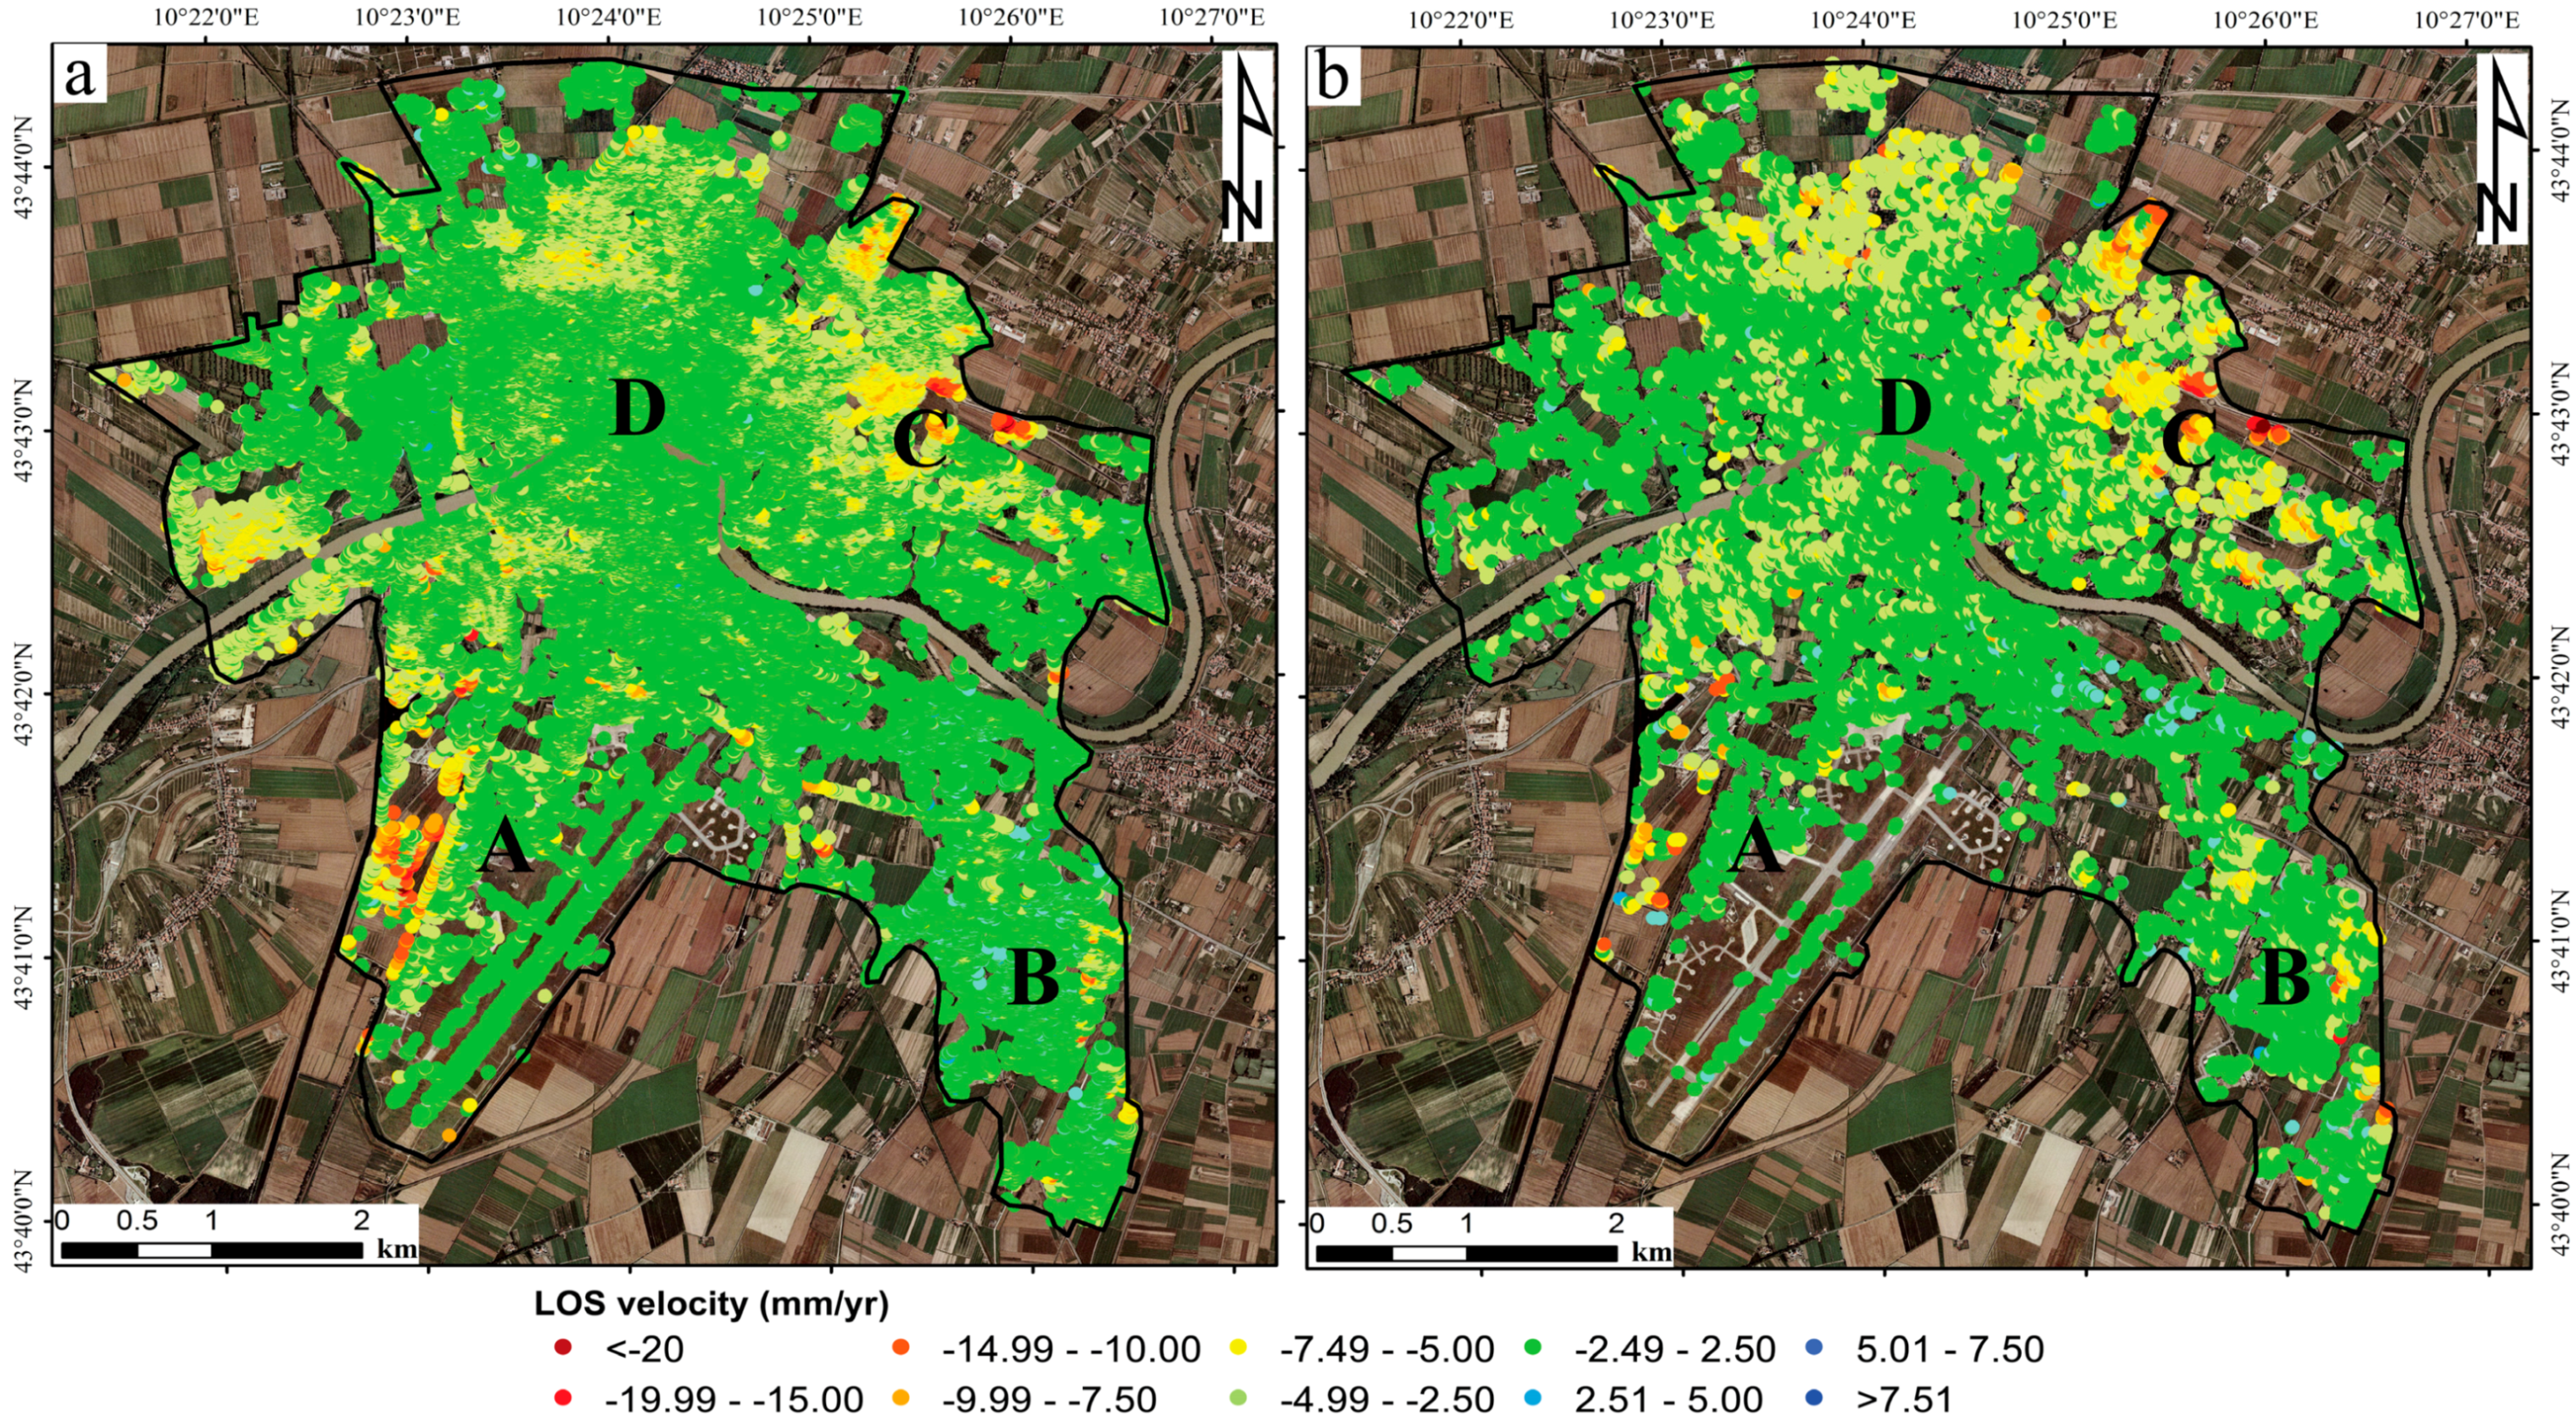
4.1. Regional Scale Analysis

The analysis of the two A-DInSAR datasets shows that the urban area of Pisa is not characterized by the presence of regional scale deformation patterns, such as large subsidence bowls related to water overexploitation (Figure 3). This type of large scale deformation has been observed in other sectors of the Tuscany region, such as the urban area of Pistoia, where a water overexploitation-related subsidence was recorded [61], or the geothermal area of Larderello, where a large subsidence bowl, produced by geothermal activity, has been detected [62]. The general trend of ground subsidence increases in the northern part of Pisa, where the city has developed outside of the historic center walls. In this portion of the city, a general lowering of 3.5–5 mm/yr is documented. On the other hand, the highest subsidence rates are only recorded in localized areas, corresponding to a single building or groups of buildings. The presence of these areas with high localized subsidence rates, coupled with phreatic surface reconstruction, which do not show any area of intense groundwater level lowering (Figure 1), suggests the exclusion of water overexploitation as a triggering factor for the measured displacements. Moreover, a possible role played by the second aquifer compaction was further excluded because of its high depth (>50 m below surface).
A stability threshold of ±2.5 mm/yr, which is an estimation of the accuracy of the measurements [54], has been defined on the basis of the standard deviation of the calculated velocity values of each point of the two datasets. This stability range is also coherent with various literature examples in the field of C- and X-band Interferometric Synthetic Aperture Radar (InSAR) data analysis, i.e., [12,14,16,19]. Using this threshold, two areas have been identified as stable: the Galileo Galilei International Airport (Figure 3 point A) and the historic city center, where the greatest part of the Pisa cultural heritage is present (Figure 3, point D). The airport structures and the runaways are stable in the investigated time-period, showing mean subsidence rates of −0.3 mm/yr for RSAT and −0.8 mm/yr for CSK, respectively. Within the area delimited by the ancient city walls, the LOS velocities are very low, with average values of −1.4 mm/yr and −1.2 mm/yr for RSAT and CSK, respectively. As previously mentioned, the northeastern portion of the city shows a general subsidence of 3.5–5 mm/yr in both InSAR datasets, with high localized subsidence rates. For example, in the northern part of the La Fontina district (Figure 1), ground lowering of −13 mm/yr for RSAT and −12 mm/yr for CSK datasets have been recorded by commercial buildings. In the San Cataldo district (Figure 1 and Figure 3-point C), the peak subsidence rates measured are in agreement with those of a university residence for students, with mean values of −13 mm/yr for both sensors. In the Cisanello district (Figure 1 and Figure 3-point C), peak velocities of −12 mm/yr for both sensors have been recorded by a group of residential buildings. Another area where localized high subsidence rates have been recorded is the commercial district recently built outside of the western border of the International airport (Figure 1 and Figure 3-point A); values of −28 mm/yr for CSK data have been detected. The RSAT data show a very low density of points in this area; for this reason, displacement information cannot be derived. In the Ospedaletto industrial and commercial district (Figure 1 and Figure 3-point B), the greatest part of the buildings is within the defined stability threshold (±2.5 mm/yr), but the peak velocities can also be identified, with values of −12 mm/yr for the RSAT dataset and −14 mm/yr for the CSK dataset.

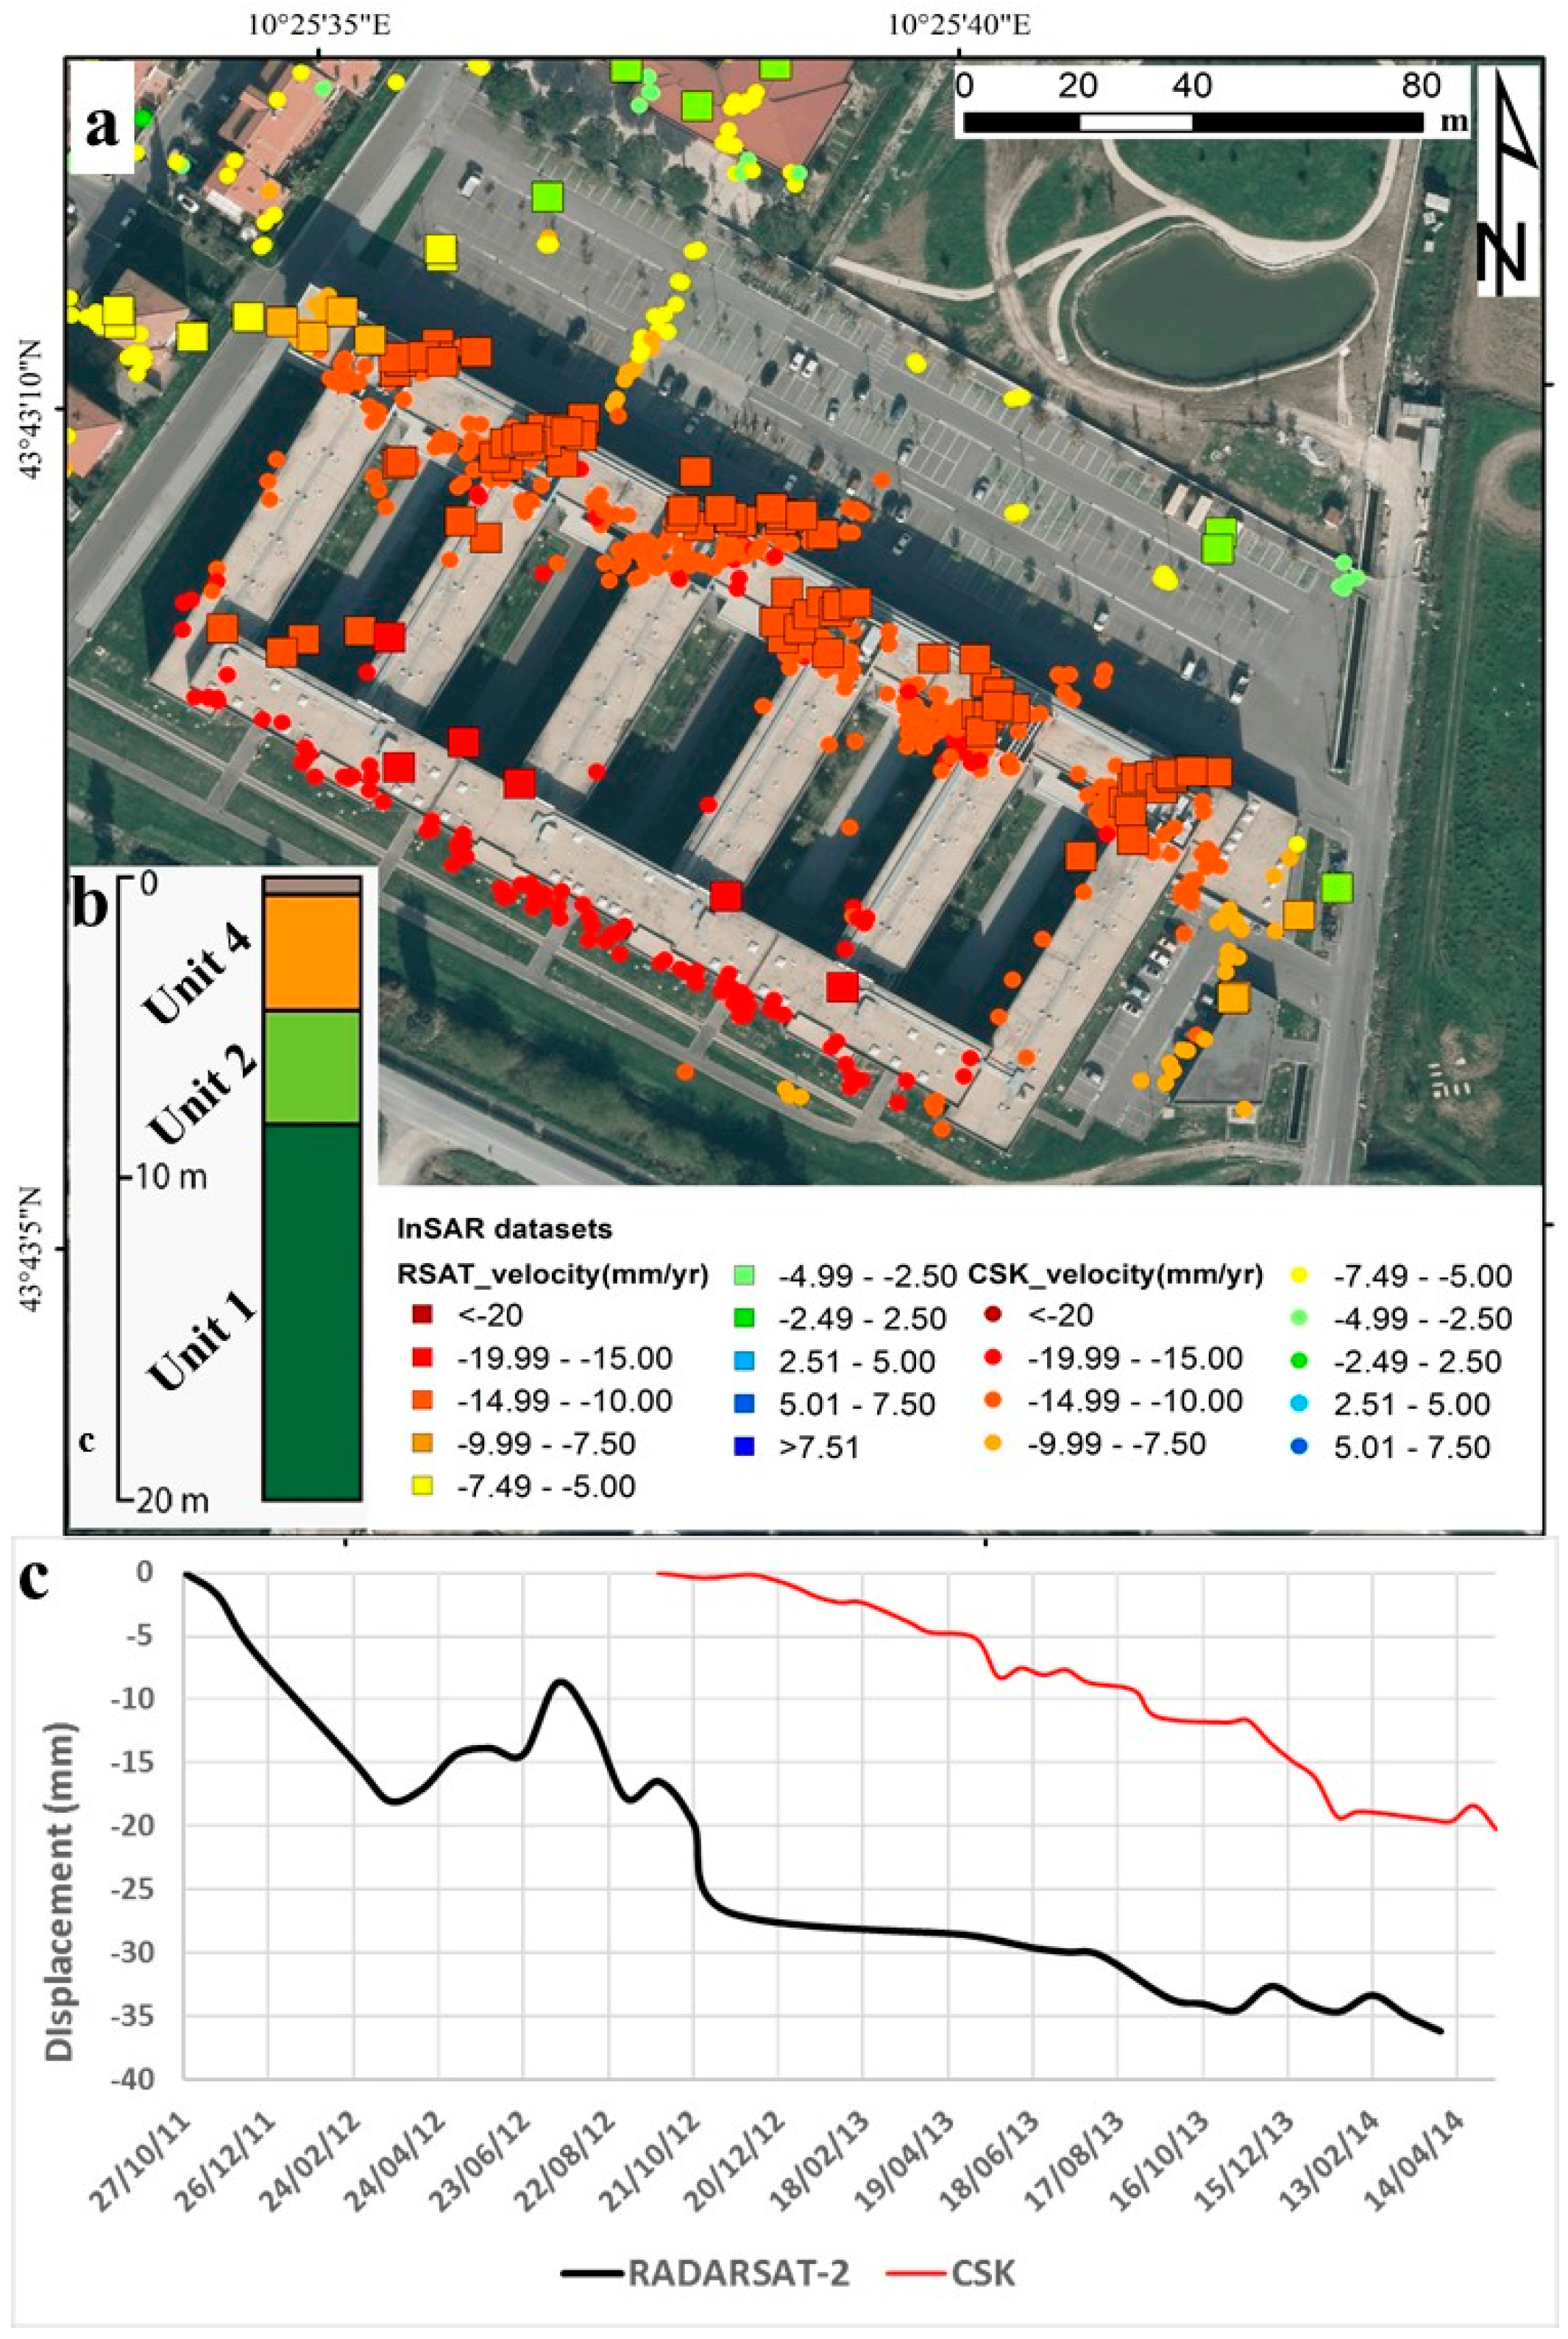
4.2. Local and Building Scale Analysis

4.2.1. Movement Detection of Recently Built Buildings

The exploited datasets have allowed us to map active deformation areas, with subsidence rates higher than 10 mm/yr affecting the buildings which have been built in the last 10 years. Examples of these deformations can be found in the San Cataldo district and in the commercial area near the International Airport, where shopping malls and shipyards are present (Figure 3 points A, C).
In particular, the I Praticelli complex, a residential structure for students inaugurated in 2008, is one valuable example of a recently built building that displays high deformation rates (Figure 4a). Both SAR datasets registered similar subsidence rates; the RADARSAT-2 data ranged between −11 and −18 mm/yr with a mean value of −13.3 mm/yr for the entire complex, whereas the COSMO-SkyMed data ranged between −6 and −17 mm/yr with a mean value of −12.3 mm/yr (Figure 4b). It is interesting to note that the maximum subsidence rates for both datasets are registered in the southern part of the complex; this can be related to foundation problems or very localized variations of the geotechnical characteristics of the compressible levels that cannot be defined with the available subsurface data. This case study also shows the different performances of C- and X-band data in urban areas; in fact, the X-band data have a density of points for this single structure that is six times larger than the C-band data, passing from 75 to 500 points. Only three boreholes, localized at a mean distance of 200 m from the I Praticelli complex, are available for the geological reconstruction of the subsurface; this is reasonable considering that no significant stratigraphical variations can occur in this distance thanks to the almost homogeneous distribution of the main units. The upper limit of the most compressible succession (lagoonal clay and organic clay, Units 1 and 2) lies at a variable depth, from 4 to 5 m below the surface. This sequence, which has a total thickness of 20–25 m, is overlaid by a thin consolidated clay level (Unit 4). As mentioned by Solari et al. [6], this type of sequence is the most susceptible to settlement.
The registered settlements are directly related to the natural evolution of the consolidation process, as defined by Terzaghi and Peck [63]. The end of this time-dependent process is highly modified by the layers’ thickness, hydraulic conductivity, and drainage conditions, as well as by the time and magnitude of the load imposition. Accordingly, the high deformation rates registered by this building are therefore related to a triggering anthropogenic factor (the recently applied load) and to a geological predisposing factor, i.e., the presence of shallow highly compressible levels (Units 1 and 2). Moreover, foundation design problems cannot be excluded.

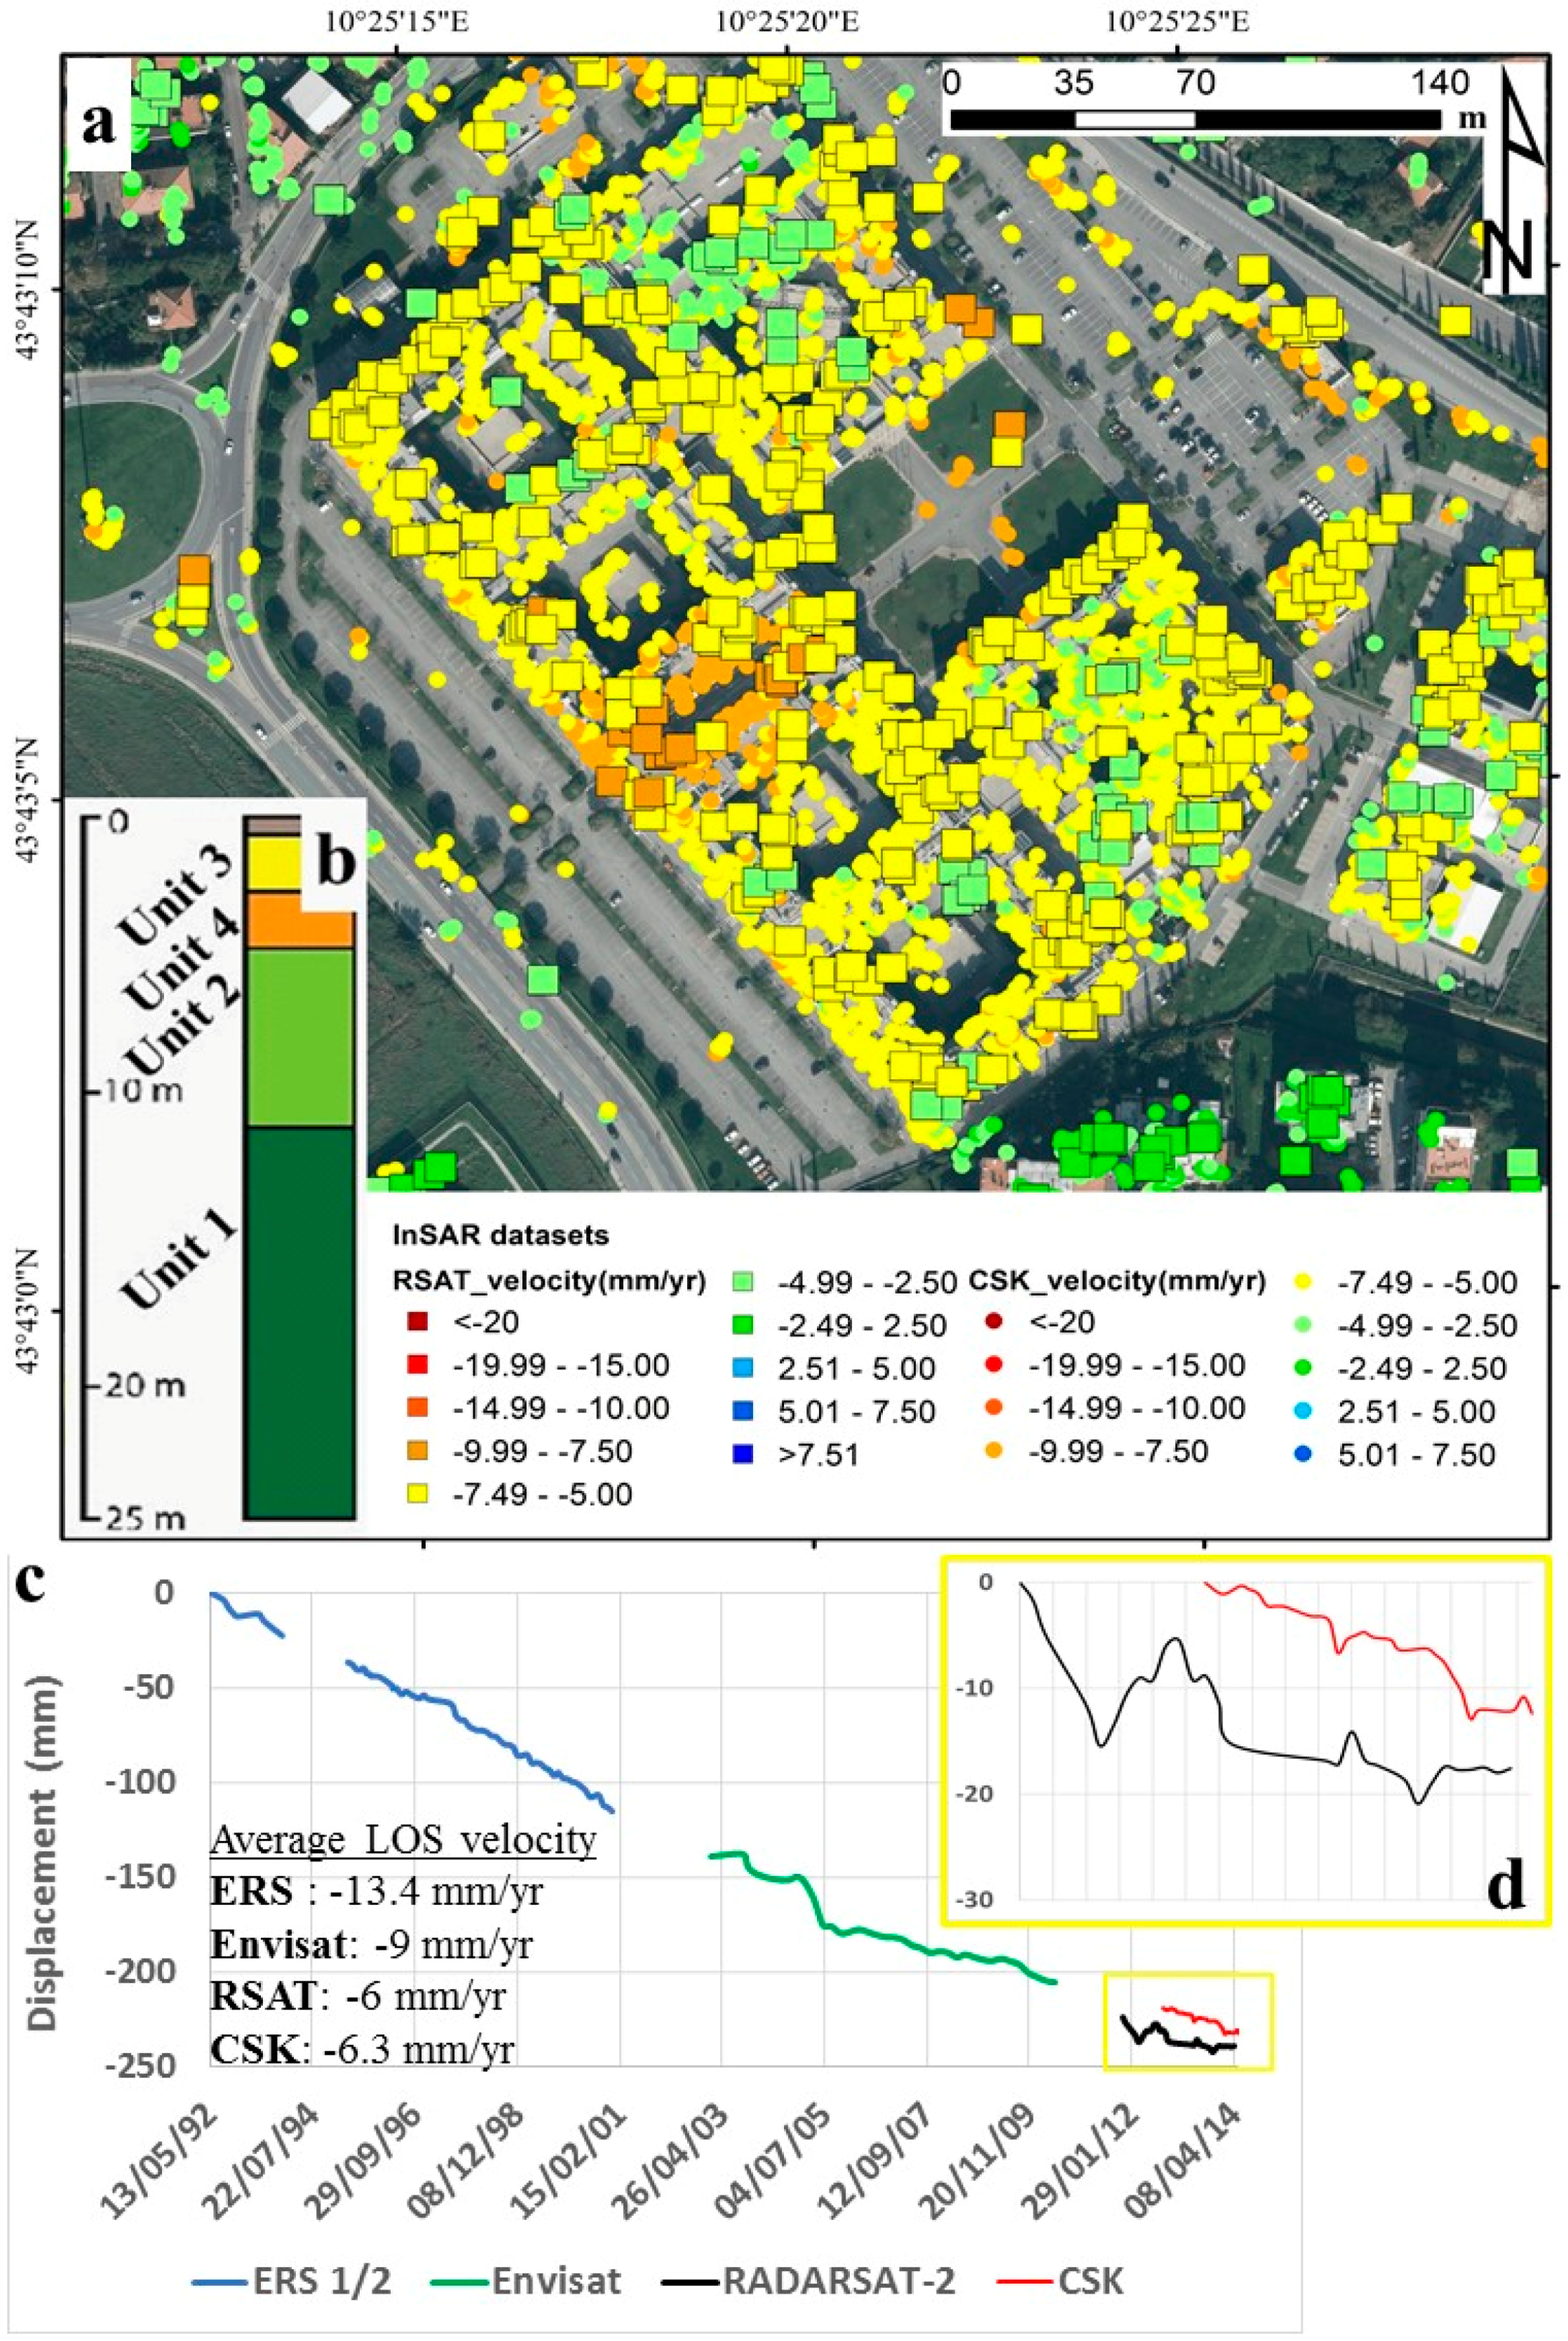
4.2.2. Buildings with Trend Changes

The RADARSAT-2 and COSMO-SkyMed datasets have been exploited to detect possible trend changes in the temporal deformation patterns registered by buildings, in the San Cataldo and Ospedaletto districts (Figure 1), built in the eighties—early nineties. A complete time series from 1992 is available for some of these buildings, thanks to the exploitation of data from the ERS 1/2 and Envisat archives, already analyzed by Solari et al. [6].
An example of integration between historical SAR datasets and the new C- and X-band data is the analysis of the displacement rates recorded in correspondence of the CNR building complex. This three-floor construction, built at the end of the eighties, occupies a total area of 30,000 m2. A high subsidence rate was recorded for the ERS 1/2 and Envisat C-band datasets, with a maximum magnitude of −13.4 mm/yr in the period covered by the ERS 1/2 data (1992–2000) [6]. A decrease in magnitude of the mean LOS velocity was then registered, up to the value of −9 mm/yr for the period 2003–2010, covered by the Envisat data [6]. The RADARSAT-2 data confirms this decreasing subsidence rate, recording a mean magnitude of −6 mm/yr with a maximum of −8.7 mm/yr in the central part of the complex (Figure 5a). A similar trend, with a comparable magnitude (mean velocity of about −6 mm/yr) and spatial distribution to the highest velocity values, is recorded by the COSMO-SkyMed data (Figure 5a).
The stratigraphical sequence below the analyzed building, with the presence of the Unit 1 and 2 compressible layers at a mean depth of 5m and with the only resistant Unit 4 level partially substituted by a saturated silty level (Unit 3), is again highly prone to ground settlements (Figure 5b). According to this setting, the deformation rates registered in the first part of the time series are directly related to compaction, due to the applied load of the highly compressible layers present in the sub-surface of the city (Figure 5c). The decrease of LOS velocity recorded by the CNR building represents the natural evolution of the consolidation process that slows down over time [63]. As observed by Peduto et al. [64], a decrease in the registered velocities can be related to external anthropic factors, such as restoration works to the foundation of buildings. Moreover, a deeper analysis can be performed to characterize the building settlements in further detail, through the implementation of specific indexes of structural health for each building (see for example [65,66]).
In the Ospedaletto commercial district, a different behavior of the structures has been observed in the monitored period. Several deformations, that reach velocities higher than −10 mm/yr, have been detected by ERS 1/2 and Envisat InSAR data, covering the period 1992–2010 [6]. All of the eastern part of this area has been subjected to recent urban expansion, with the construction of numerous commercial buildings since the end of the 1990s. Many of the structures built in the first part of this period, which recorded the above mentioned high deformation rates, appear now as stable or near to the defined stability threshold (±2.5 mm/yr).
One example of this behavior is building A (Figure 6a); as shown by the proposed time series (Figure 6c), the average subsidence rates drastically decrease from 12.3 mm/yr for the period covered by the Envisat data (2003–2010), to 1.4 mm/yr in the RADARSAT-2 analysis and 1.0 mm/yr for the COSMO-SkyMed dataset. A stratigraphical explanation for this behavior must be considered: the most compressible sequence has its upper boundary deeper than in the previous example, passing from 5 to 10 m below surface. This ground evidence implies that the compressible sequence is less influenced by the stress increment produced by the commercial building loads, generating a lower compaction of the compressible strata. On the other hand, if we consider structures which have been built very recently, the recorded subsidence rates reach 15 mm/yr, as shown in Figure 6a by building B.

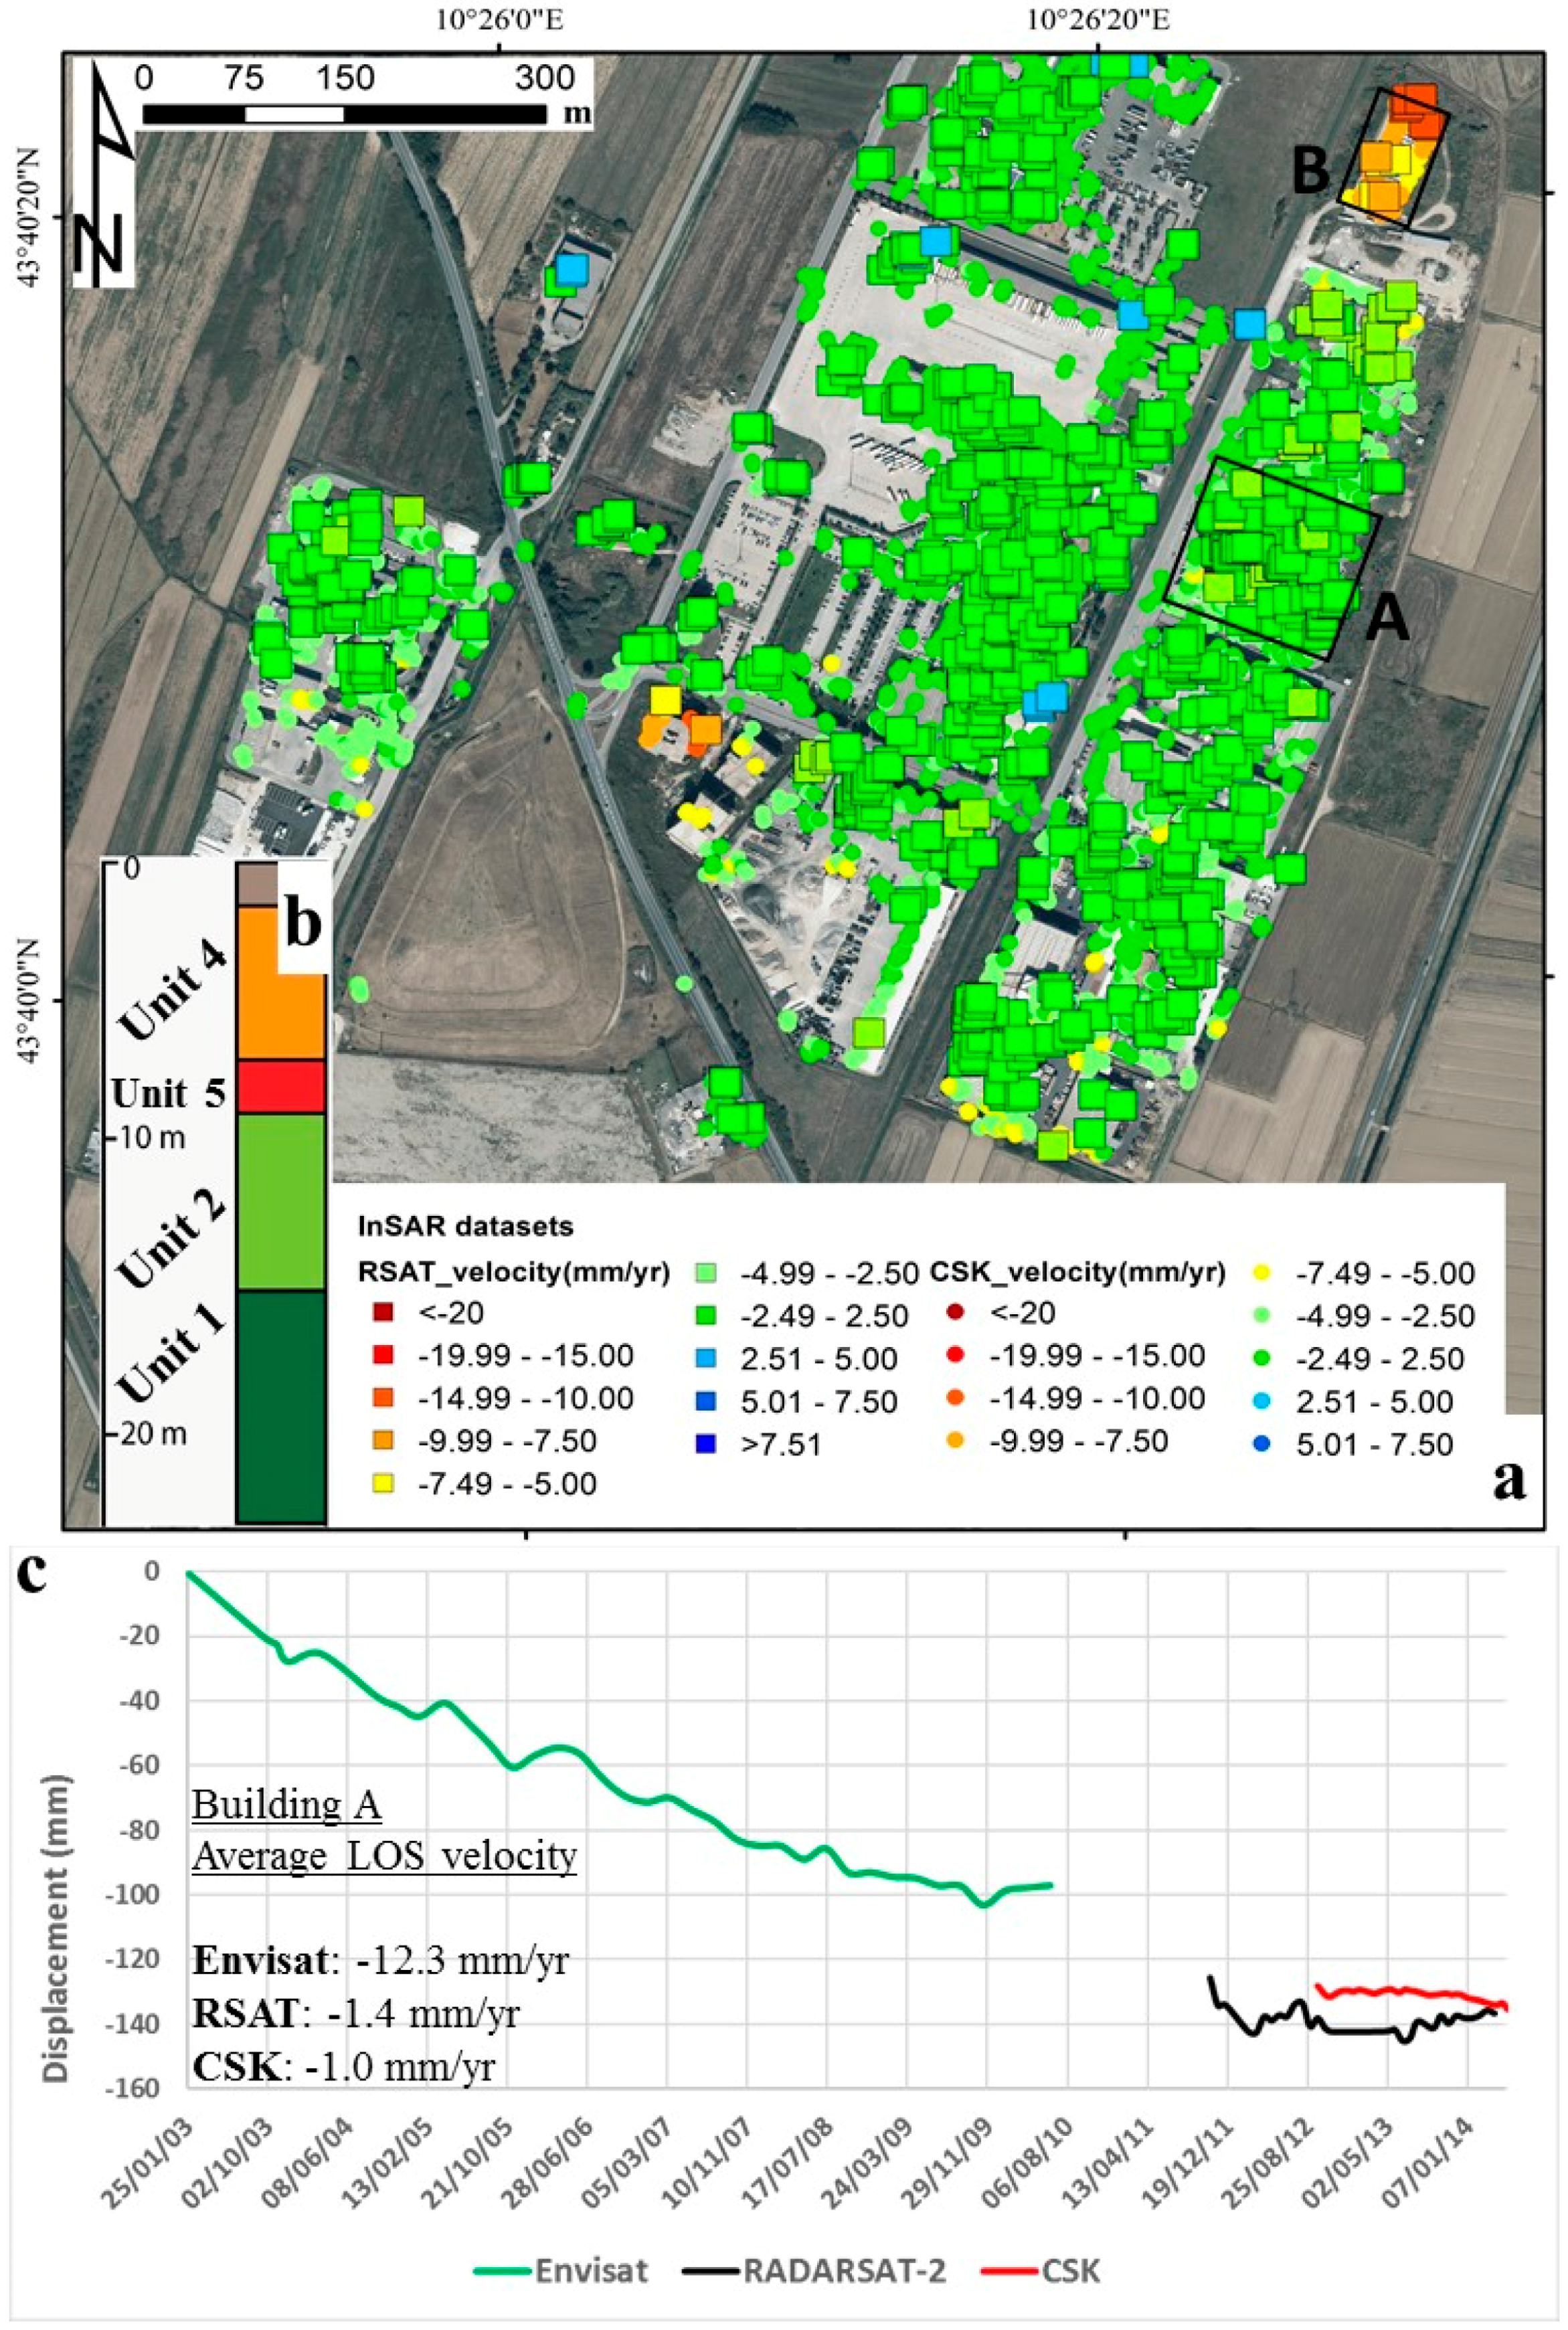
4.2.3. Relation between InSAR Displacements and Urbanization

For a smaller scale use of the displacement information retrieved for the single buildings, the LOS velocities have been averaged in the area occupied by 500 different structures of selected districts, in which the highest peak velocities and subsidence rates have been recorded (San Cataldo, Cisanello, La Fontina and Ospedaletto districts, see Figure 1).
In Figure 7a, the C- and X-band InSAR-derived LOS velocity values are plotted versus the age of construction of the selected buildings (Pre 1978, 1978–1988, 1988–2000, Post 2000). Four temporal classes have been defined on the basis of multi-temporal ortophotographical information. The most recent class does not present any ERS 1/2 data because the end of the acquisition period of the sensor (December 2000), that from 2001, even if still operational, does not provide reliable acquisitions because it has been operating without gyroscopes. As expected, the data show an increase in the mean LOS velocity values starting from the oldest temporal class (Figure 7b). The RSAT and CSK data show a general lower dispersion of the points for the three oldest classes (see variance values in Figure 7b); this is related not only to the general decrease in the LOS velocities of the two central classes (1978–1988 and 1988–2000), but also to the higher density of measurement points for each building. In fact, the higher redundancy of points in these two datasets allows for the minimization of the effects of anomalous velocity values within the building perimeter. The high variance (Figure 7b) of the points constituting the Post 2000 class is mainly related to the presence of outliers characterized by high subsidence rates; these points correspond to the peak velocities recorded in the analyzed districts for the studied time-periods. These evidences are coherent with the InSAR-derived deformations obtained in the city of Florence (located 80km eastern than Pisa) by Pratesi et al. [66,67], where a similar stratigraphical context and urban evolution in the last 30 years is present. As demonstrated by the I Praticelli complex example, these high subsidence rates are directly correlated to compaction, due to the recently applied load, of the highly compressible levels present in the stratigraphic setting of the city at a shallow depth. Moreover, the general decrease in the mean velocities and variance values in the two central classes demonstrate that the subsidence in the urban area is slowing down. This is testified, for example, by the CNR complex in the San Cataldo district and by many structures in the commercial area of Ospedaletto.
Considering the statistical parameters, the dispersion of the oldest class (Pre 1978) points suggests the presence of a natural subsidence, with values ranging from −2.5 to 5 mm/yr; this is more evident if only the RSAT and CSK are considered (Figure 7a). In this class, points with a displacement magnitude above 5 mm/yr are outliers related to buildings affected by the ongoing consolidation process due to geological (clayey levels with high organic matter content) or constructive (bad foundation design) characteristics.

5. Conclusions

In this paper, A-DInSAR data from different sensors operating in C- and X-band have been exploited, to describe the temporal and spatial evolution of the land subsidence in the urban area of Pisa. The ground movements were related to a predisposing factor (presence of highly compressible layers of clays and organic clays at shallow depth), and to a triggering factor (recent urbanization of part of the city).
The C-band RADARSAT-2 and the X-band COSMO-SkyMed data, analyzed with the SBAS algorithm, show that the highest deformation registered in the investigated time-period (2011–2014) affects single buildings in the recent urban expansion areas of the city. These buildings recorded subsidence rates higher than −15 mm/yr. Considering this localized subsidence, a building-scale analysis was carried out. In the San Cataldo and Ospedaletto districts, three examples have been provided to display the different behaviors of the selected buildings. In these areas, a widespread compressible sequence was detected, mainly composed of organic rich clay and silty clay classified in two geotechnical units (Unit 1 and 2). This sequence supports the development of an accelerated consolidation process in the case of a load application; this is the case of the I Praticelli complex, a recent structure that registered subsidence rates of up to 20 mm/yr. The CNR building and the commercial structures of the Ospedaletto district show, when also exploiting older C-band data (ERS 1/2 and Envisat), the slow-down in the subsidence phenomena during the analyzed period. Finally, using the averaged LOS velocities extracted from several buildings in four selected districts, the correlation between registered subsidence rates and the age of construction of buildings was confirmed and strengthened, highlighting the role of urbanization as a triggering factor for the registered rapid subsidence.
This work has also shown the potential of DInSAR information extracted from sensors of different bands in urban areas, providing data at both a regional and building scale, with a high density of points.

Acknowledgments

The RADARSAT-2 and COSMO-SkyMed data were obtained from the COSMO-SkyMed/RADARSAT-2 Initiative, a collaboration between the Italian Space Agency (ASI) and the Canadian Space Agency (CSA). Project #5235. RADARSAT- 2 Data and Products © MacDonald, Dettwiler and Associate Ltd. (2014)—All right reserved. RADARSAT is an official trademark of the Canadian Space Agency. COSMO-SkyMed products ASI-Agenzia Spaziale Italiana-(2014).

Author Contributions

Lorenzo Solari wrote the paper and analyzed the data. Andrea Ciampalini developed the project and helped in the geological and interferometric data interpretation. Federico Raspini and Silvia Bianchini helped in the data analysis. Michele Manunta supervised the satellite data selection, processing and analysis. Ivana Zinno and Manuela Bonano processed the RADARSAT-2 and COSMO-SkyMed SAR data and provided the SBAS results. Sandro Moretti and Nicola Casagli contributed to improve the quality of the manuscript and reviewed the paper.

Conflicts of Interest

The authors declare no conflict of interest.

References

  1. Dong, S.; Samsonov, S.; Yin, H.; Ye, S.; Cao, Y. Time-series analysis of subsidence associated with rapid urbanization in Shanghai, China measured with SBAS InSAR method. Environ. Earth Sci. 2014, 72, 677–691. [Google Scholar] [CrossRef]
  2. Floris, M.; Bozzano, F.; Strappaveccia, C.; Baiocchi, V.; Prestininzi, A. Qualitative and quantitative evaluation of the influence of anthropic pressure on subsidence in a sedimentary basin near Rome. Environ. Earth Sci. 2014, 72, 4223–4236. [Google Scholar] [CrossRef]
  3. Polcari, M.; Albano, M.; Saroli, M.; Tolomei, C.; Lancia, M.; Moro, M.; Stramondo, S. Subsidence Detected by Multi-Pass Differential SAR Interferometry in the Cassino Plain (Central Italy): Joint Effect of Geological and Anthropogenic Factors? Remote Sens. 2014, 6, 9676–9690. [Google Scholar] [CrossRef]
  4. Chen, B.; Gong, H.; Li, X.; Lei, K.; Ke, Y.; Duan, G.; Zhou, C. Spatial correlation between land subsidence and urbanization in Beijing, China. Nat. Hazards 2015, 75, 2637–2652. [Google Scholar] [CrossRef]
  5. Yin, J.; Yu, D.; Yin, Z.; Wang, J.; Xu, S. Modelling the anthropogenic impacts on fluvial flood risks in a coastal mega-city: A scenario-based case study in Shanghai, China. Landsc. Urban Plan. 2015, 136, 144–155. [Google Scholar] [CrossRef]
  6. Solari, L.; Ciampalini, A.; Raspini, F.; Bianchini, S.; Moretti, S. PSInSAR analysis in the Pisa Urban Area (Italy): A case study of subsidence related to stratigraphical factors and urbanization. Remote Sens. 2016, 8, 120. [Google Scholar] [CrossRef]
  7. Joyce, K.E.; Belliss, S.E.; Samsonov, S.V.; McNeill, S.J.; Glassey, P.J. A review of the status of satellite remote sensing and image processing techniques for mapping natural hazards and disasters. Prog. Phys. Geogr. 2009, 33, 183–207. [Google Scholar] [CrossRef]
  8. Sansosti, E.; Casu, F.; Manzo, M.; Lanari, R. Space-borne radar interferometry techniques for the generation of deformation time series: An advanced tool for Earth’s surface displacement analysis. Geophys. Res. Lett. 2010, 37. [Google Scholar] [CrossRef]
  9. Mohammed, O.I.; Saeidi, V.; Pradhan, B.; Yusuf, Y.A. Advanced differential interferometry synthetic aperture radar techniques for deformation monitoring: A review on sensors and recent research development. Geocarto Int. 2014, 29, 536–553. [Google Scholar] [CrossRef]
  10. Crosetto, M.; Monserrat, O.; Cuevas-González, M.; Devanthéry, N.; Crippa, B. Persistent scatterer interferometry: A review. ISPRS J Photogramm. Remote Sens. 2016, 115, 78–89. [Google Scholar] [CrossRef]
  11. Raspini, F.; Cigna, F.; Moretti, S. Multi-temporal mapping of land subsidence at basin scale exploiting Persistent Scatterer Interferometry: Case study of Gioia Tauro plain (Italy). J. Maps 2012, 8, 514–524. [Google Scholar] [CrossRef]
  12. Tosi, L.; Teatini, P.; Strozzi, T. Natural versus anthropogenic subsidence of Venice. Sci. Rep. 2013, 3, 2710. [Google Scholar] [CrossRef] [PubMed]
  13. Del Ventisette, C.; Solari, L.; Raspini, F.; Ciampalini, A.; Di Traglia, F.; Moscatelli, M.; Pagliaroli, A.; Moretti, S. Use of PSInSAR data to map highly compressible soil layers. Geol. Acta 2015, 13, 309–323. [Google Scholar]
  14. Bianchini, S.; Moretti, S. Analysis of recent ground subsidence in the Sibari plain (Italy) by means of satellite SAR interferometry-based methods. Int. J. Remote Sens. 2015, 36, 4550–4569. [Google Scholar] [CrossRef]
  15. Scifoni, S.; Bonano, M.; Marsella, M.; Sonnessa, A.; Tagliafierro, V.; Manunta, M.; Lanari, R.; Ojha, C.; Sciotti, M. On the joint exploitation of long-term DInSAR time series and geological information for the investigation of ground settlements in the town of Roma (Italy). Remote Sens. Environ. 2016, 182, 113–127. [Google Scholar] [CrossRef]
  16. Peduto, D.; Cascini, L.; Arena, L.; Ferlisi, S.; Fornaro, G.; Reale, D. A general framework and related procedures for multiscale analyses of DInSAR data in subsiding urban areas. ISPRS J. Photogramm. Remote Sens. 2015, 105, 186–210. [Google Scholar] [CrossRef]
  17. Perissin, D.; Wang, T. Time-series InSAR applications over urban areas in China. IEEE J-STARS 2011, 4, 92–100. [Google Scholar] [CrossRef]
  18. Qu, F.; Zhang, Q.; Lu, Z.; Zhao, C.; Yang, C.; Zhang, J. Land subsidence and ground fissures in Xi’an, China 2005–2012 revealed by multi-band InSAR time-series analysis. Remote Sens. Environ. 2014, 155, 366–376. [Google Scholar] [CrossRef]
  19. Pepe, A.; Bonano, M.; Zhao, Q.; Yang, T.; Wang, H. The Use of C-/X-Band Time-Gapped SAR Data and Geotechnical Models for the Study of Shanghai’s Ocean-Reclaimed Lands through the SBAS-DInSAR Technique. Remote Sens. 2016, 8, 911. [Google Scholar] [CrossRef]
  20. Tomás, R.; Márquez, Y.; Lopez-Sanchez, J.M.; Delgado, J.; Blanco, P.; Mallorquí, J.J.; Martínez, M.; Herrera, G.; Mulas, J. Mapping ground subsidence induced by aquifer overexploitation using advanced Differential SAR Interferometry: Vega Media of the Segura River (SE Spain) case study. Remote Sens. Environ. 2005, 98, 269–283. [Google Scholar] [CrossRef]
  21. Herrera, G.; Tomás, R.; Monells, D.; Centolanza, G.; Mallorquí, J.J.; Vicente, F.; Navarro, V.D.; Lopez-Sanchez, J.M.; Sanabria, M.; Cano, M.; et al. Analysis of subsidence using TerraSAR-X data: Murcia case study. Eng. Geol. 2010, 116, 284–295. [Google Scholar] [CrossRef]
  22. Tomás, R.; Romero, R.; Mulas, J.; Marturià, J.J.; Mallorquí, J.J.; López-Sánchez, J.M.; Herrera, G.; Gutiérrez, F.; González, P.J.; Fernández, J.; et al. Radar interferometry techniques for the study of ground subsidence phenomena: A review of practical issues through cases in Spain. Environ. Earth Sci. 2014, 71, 163–181. [Google Scholar] [CrossRef]
  23. Notti, D.; Mateos, R.M.; Monserrat, O.; Devanthéry, N.; Peinado, T.; Roldán, F.J.; Fernández-Chacón, F.; Galve, J.P.; Lamas, F.; Azañón, J.M. Lithological control of land subsidence induced by groundwater withdrawal in new urban areas (Granada Basin, SE Spain). Multiband DInSAR monitoring. Hydrol. Process. 2016, 30, 2317–2331. [Google Scholar] [CrossRef]
  24. Raspini, F.; Loupasakis, C.; Rozos, D.; Moretti, S. Advanced interpretation of land subsidence by validating multi-interferometric SAR data: The case study of the Anthemountas basin (Northern Greece). Nat. Hazards Earth Syst. 2013, 13, 2425–2440. [Google Scholar] [CrossRef]
  25. Raspini, F.; Loupasakis, C.; Rozos, D.; Adam, N.; Moretti, S. Ground subsidence phenomena in the Delta municipality region (Northern Greece): Geotechnical modeling and validation with Persistent Scatterer Interferometry. Int. J. Appl. Earth Obs. Geoinf. 2014, 28, 78–89. [Google Scholar] [CrossRef]
  26. Nikos, S.; Ioannis, P.; Constantinos, L.; Paraskevas, T.; Anastasia, K.; Charalambos, K. Land subsidence rebound detected via multi-temporal InSAR and ground truth data in Kalochori and Sindos regions, Northern Greece. Eng. Geol. 2016, 209, 175–186. [Google Scholar] [CrossRef]
  27. Dixon, T.H.; Amelung, F.; Ferretti, A.; Novali, F.; Rocca, F.; Dokka, R.; Sella, G.; Kim, S.W.; Wdowinski, S.; Withman, D. Space geodesy: Subsidence and flooding in New Orleans. Nature 2006, 441, 587–588. [Google Scholar] [CrossRef] [PubMed]
  28. Amelung, F.; Galloway, D.L.; Bell, J.W.; Zebker, H.A.; Laczniak, R.J. Sensing the ups and downs of Las Vegas: InSAR reveals structural control of land subsidence and aquifer-system deformation. Geology 1999, 27, 483–486. [Google Scholar] [CrossRef]
  29. Samsonov, S.V.; Tiampo, K.F.; Feng, W. Fast subsidence in downtown of Seattle observed with satellite radar. Remote Sens. Appl. Soc. Environ. 2016, 4, 179–187. [Google Scholar] [CrossRef]
  30. Dang, V.K.; Doubre, C.; Weber, C.; Gourmelen, N.; Masson, F. Recent land subsidence caused by the rapid urban development in the Hanoi region (Vietnam) using ALOS InSAR data. Nat. Hazards Earth Syst. Sci. 2014, 14, 657–674. [Google Scholar] [CrossRef]
  31. Le, T.S.; Chang, C.P.; Nguyen, X.T.; Yhokha, A. TerraSAR-X Data for High-Precision Land Subsidence Monitoring: A Case Study in the Historical Centre of Hanoi, Vietnam. Remote Sens. 2016, 8, 338. [Google Scholar] [CrossRef]
  32. Abidin, H.Z.; Gumilar, I.; Andreas, H.; Murdohardono, D.; Fukuda, Y. On causes and impacts of land subsidence in Bandung Basin, Indonesia. Environ. Earth Sci. 2013, 68, 1545–1553. [Google Scholar] [CrossRef]
  33. Chaussard, E.; Amelung, F.; Abidin, H.; Hong, S.H. Sinking cities in Indonesia: ALOS PALSAR detects rapid subsidence due to groundwater and gas extraction. Remote Sens. Environ. 2013, 128, 150–161. [Google Scholar] [CrossRef]
  34. Heleno, S.I.; Oliveira, L.G.; Henriques, M.J.; Falcão, A.P.; Lima, J.N.; Cooksley, G.; Ferretti, A.; Fonseca, A.M.; Lobo-Ferreira, J.P.; Fonseca, J.F. Persistent scatterers interferometry detects and measures ground subsidence in Lisbon. Remote Sens. Environ. 2011, 115, 2152–2167. [Google Scholar] [CrossRef]
  35. Catalão, J.; Nico, G.; Lollino, P.; Conde, V.; Lorusso, G.; Silva, C. Integration of InSAR Analysis and Numerical Modeling for the Assessment of Ground Subsidence in the City of Lisbon, Portugal. IEEE J-STARS 2016, 9, 1663–1673. [Google Scholar] [CrossRef]
  36. Pascucci, V. Neogene evolution of the Viareggio basin, Northern Tuscany (Italy). GeoActa 2005, 4, 123–138. [Google Scholar]
  37. Amorosi, A.; Rossi, V.; Sarti, G.; Mattei, R. Coalescent valley fills from the late Quaternary record of Tuscany (Italy). Quat. Int. 2013, 288, 129–138. [Google Scholar] [CrossRef]
  38. Aguzzi, M.; Amorosi, A.; Colalongo, M.L.; Ricci Lucchi, M.; Rossi, V.; Sarti, G.; Vaiani, S.C. Late Quaternary climatic evolution of the Arno coastal plain (Western Tuscany, Italy) from subsurface data. Sediment. Geol. 2007, 202, 211–229. [Google Scholar] [CrossRef]
  39. Amorosi, A.; Sarti, G.; Rossi, V.; Fontana, V. Anatomy and sequence stratigraphy of the late Quaternary Arno valley fill (Tuscany, Italy). Adv. Appl. Seq. Stratigr. Italy 2008, 1, 55–66. [Google Scholar]
  40. Amorosi, A.; Ricci Lucchi, M.; Rossi, V.; Sarti, G. Climate change signature of small-scale parasequences from Lateglacial–Holocene transgressive deposits of the Arno valley fill. Palaeogeogr. Palaeoclimatol. Palaeoecol. 2009, 273, 142–152. [Google Scholar] [CrossRef]
  41. Lambeck, K.; Antonioli, F.; Anzidei, M.; Ferranti, L.; Leoni, G.; Scicchitano, G.; Silenzi, S. Sea level change along the Italian coast during the Holocene and projections for the future. Quat. Int. 2011, 232, 250–257. [Google Scholar] [CrossRef]
  42. Rossi, V.; Amorosi, A.; Sarti, G.; Potenza, M. Influence of inherited topography on the Holocene sedimentary evolution of coastal systems: An example from Arno coastal plain (Tuscany, Italy). Geomorphology 2011, 135, 117–128. [Google Scholar] [CrossRef]
  43. Sarti, G.; Rossi, V.; Amorosi, A. Influence of Holocene stratigraphic architecture on ground surface settlements: A case study from the City of Pisa (Tuscany, Italy). Sediment. Geol. 2012, 281, 75–87. [Google Scholar] [CrossRef]
  44. Burland, J.; Jamiolkowski, M.B.; Viggiani, C. Leaning Tower of Pisa: Behaviour after stabilization operations. Int. J. Geoeng. Case Hist. 2009, 1, 156–169. [Google Scholar]
  45. Relazione Generale e Allegati Tecnici del Piano Strutturale del Comune di Pisa; Comune di Pisa: Pisa, Italy, 1997; Available online: http://www.comune.pisa.it/doc/sit-pisa/nuovo_prg/relaz.htm (accessed on 27 October 2016).
  46. Grassi, S.; Cortecci, G. Hydrogeology and geochemistry of the multilayered confined aquifer of the Pisa plain (Tuscany–central Italy). Appl. Geochem. 2005, 20, 41–54. [Google Scholar] [CrossRef]
  47. Butteri, M.; Doveri, M.; Giannecchini, R.; Gattai, P. Hydrogeologic-hydrogeochemical multidisciplinary study of the confined gravelly aquifer in the coastal Pisan Plain between the Arno River and Scolmatore Canal (Tuscany). Mem. Descr. Carta Geol. d’It. 2010, XC, 51–66. [Google Scholar]
  48. Berardino, P.; Fornaro, G.; Lanari, R.; Sansosti, E. A new algorithm for surface deformation monitoring based on small baseline differential SAR interferograms. IEEE Trans. Geosci. Remote Sens. 2002, 40, 2375–2383. [Google Scholar] [CrossRef]
  49. Lanari, R.; Mora, O.; Manunta, M.; Mallorquí, J.J.; Berardino, P.; Sansosti, E. A small-baseline approach for investigating deformations on full-resolution differential SAR interferograms. IEEE Trans. Geosci. Remote Sens. 2004, 42, 1377–1386. [Google Scholar] [CrossRef]
  50. Casu, F.; Elefante, S.; Imperatore, P.; Zinno, I.; Manunta, M.; De Luca, C.; Lanari, R. SBAS-DInSAR Parallel Processing for Deformation Time-Series Computation. IEEE J-STARS 2014, 7, 3285–3296. [Google Scholar] [CrossRef]
  51. Bonano, M.; Manunta, M.; Pepe, A.; Paglia, L.; Lanari, R. From previous C-band to new X-band SAR systems: Assessment of the DInSAR mapping improvement for deformation time-series retrieval in urban areas. IEEE Trans. Geosci. Remote Sens. 2013, 51, 1973–1984. [Google Scholar] [CrossRef]
  52. Zebker, H.A.; Villasenor, J. Decorrelation in interferometric radar echoes. IEEE Trans. Geosci. Remote Sens. 1992, 30, 950–959. [Google Scholar] [CrossRef]
  53. Manunta, M.; Marsella, M.; Zeni, G.; Sciotti, M.; Atzori, S.; Lanari, R. Two-scale surface deformation analysis using the SBAS-DInSAR technique: A case study of the city of Rome, Italy. Int. J. Remote Sens. 2008, 29, 1665–1684. [Google Scholar] [CrossRef]
  54. Arangio, S.; Calò, F.; Di Mauro, M.; Bonano, M.; Marsella, M.; Manunta, M. An application of the SBAS-DInSAR technique for the assessment of structural damage in the city of Rome. Struct. Infrastruct. Eng. 2013, 10, 1469–1483. [Google Scholar] [CrossRef]
  55. Pepe, A.; Lanari, R. On the extension of the minimum cost flow algorithm for phase unwrapping of multitemporal differential SAR interferograms. IEEE Trans. Geosci. Remote Sens. 2006, 44, 2374–2383. [Google Scholar] [CrossRef]
  56. Calò, F.; Ardizzone, F.; Castaldo, R.; Lollino, P.; Tizzani, P.; Guzzetti, F.; Lanari, R.; Angeli, M.; Pontoni, F.; Manunta, M. Enhanced landslide investigations through advanced DInSAR techniques: The Ivancich case study, Assisi, Italy. Remote Sens. Environ. 2014, 142, 69–82. [Google Scholar] [CrossRef]
  57. Bovenga, F.; Wasowski, J.; Nitti, D.O.; Nutricato, R.; Chiaradia, M.T. Using COSMO/SkyMed X-band and ENVISAT C-band SAR interferometry for landslides analysis. Remote Sens. Environ. 2012, 119, 272–285. [Google Scholar] [CrossRef]
  58. Ciampalini, A.; Raspini, F.; Frodella, W.; Bardi, F.; Bianchini, S.; Moretti, S. The effectiveness of high-resolution LiDAR data combined with PSInSAR data in landslide study. Landslides 2016, 13, 399–410. [Google Scholar] [CrossRef]
  59. Franceschetti, G.; Lanari, R. Synthetic Aperture Radar Processing; CRC Press: Boca Raton, FL, USA, 1999. [Google Scholar]
  60. Solari, L.; Ciampalini, A.; Bianchini, S.; Moretti, S. PSInSAR analysis in urban areas: A case study in the Arno coastal plain (Italy). Rend. Online Della Soc. Geol. Ital. 2016, 41, 255–258. [Google Scholar] [CrossRef]
  61. Canuti, P.; Casagli, N.; Farina, P.; Marks, F.; Ferretti, A.; Menduni, G. Land subsidence in the Arno River Basin studied through SAR interferometry. In Proceedings of the 7th International Symposium on Land Subsidence, Shanghai, China, 23–28 October 2005; Volume 1, pp. 407–416. [Google Scholar]
  62. Rosi, A.; Tofani, V.; Agostini, A.; Tanteri, L.; Stefanelli, C.T.; Catani, F.; Casagli, N. Subsidence mapping at regional scale using persistent scatters interferometry (PSI): The case of Tuscany region (Italy). Int. J. Appl. Earth Obs. Geoinf. 2016, 52, 328–337. [Google Scholar] [CrossRef]
  63. Terzaghi, K.; Peck, R.B. Soil Mechanics in Engineering Practice; John Wiley & Sons: Hoboken, NJ, USA, 1967. [Google Scholar]
  64. Peduto, D.; Nicodemo, G.; Maccabiani, J.; Ferlisi, S. Multi-scale analysis of settlement-induced building damage using damage surveys and DInSAR data: A case study in The Netherlands. Eng. Geol. 2017, 218, 117–133. [Google Scholar] [CrossRef]
  65. Bianchini, S.; Pratesi, F.; Nolesini, T.; Casagli, N. Building deformation assessment by means of persistent scatterer interferometry analysis on a landslide-affected area: The Volterra (Italy) case study. Remote Sens. 2015, 7, 4678–4701. [Google Scholar] [CrossRef]
  66. Pratesi, F.; Tapete, D.; Terenzi, G.; Del Ventisette, C.; Moretti, S. Rating health and stability of engineering structures via classification indexes of InSAR Persistent Scatterers. Int. J. Appl. Earth Obs. Geoinf. 2015, 40, 81–90. [Google Scholar] [CrossRef]
  67. Pratesi, F.; Tapete, D.; Del Ventisette, C.; Moretti, S. Mapping interactions between geology, subsurface resource exploitation and urban development in transforming cities using InSAR Persistent Scatterers: Two decades of change in Florence, Italy. Appl. Geogr. 2016, 77, 20–37. [Google Scholar] [CrossRef]
Figure 1. Geographical framework of the area of interest and the phreatic surface in the urban area of Pisa (from [45]). The black line represents the urban area. The contour map is overlaid on a 2010 digital orthophoto.
Geosciences 07 00021 g001
Figure 2. Synthetic Aperture Radar (SAR) data representation in the temporal/perpendicular baseline plane for the COSMO-SkyMed (a) and RADARSAT-2 (b) datasets. Each black triangle represents a SAR acquisition, with the code-name of the image, and the arcs that are the interferometric pairs selected for the Small BAseline Subset (SBAS) processing.
Geosciences 07 00021 g002
Figure 3. Registered Line of Sight (LOS) velocities between 2011 and 2014. (a) COSMO-SkyMed data; (b) RADARSAT-2 data. Deformation maps are overlaid on a 2000 digital orthophoto. The black line encloses the investigated area. (A) Galileo Galilei International Airport; (B) Ospedaletto district; (C) Cisanello–San Cataldo–La Fontina district; (D) inner city area.
Geosciences 07 00021 g003
Figure 4. (a) LOS displacements affecting the analyzed building. The displacement map is overlaid on a 2013 digital orthophoto; (b) Geological reconstruction of the stratigraphical asset, the classification is the one proposed by Sarti et al. [43]; (c) RADARSAT-2 and COSMO-SkyMed average time series for the “I Praticelli” complex.
Geosciences 07 00021 g004
Figure 5. (a) LOS displacements affecting the National Research Council (CNR) complex. The displacement map is overlaid on a 2013 digital orthophoto; (b) Geological reconstruction of the stratigraphical asset, the classification is the one proposed by Sarti et al. [43]; (c) ERS 1/2, Envisat, RADARSAT-2 and COSMO-SkyMed average time series for the analyzed building. The ERS 1/2 and Envisat time series have been modified after Solari et al. [6]. The RADARSAT-2 and COSMO-SkyMed time series are shifted by a constant value for a better visualization; (d) RADARSAT-2 and COSMO-SkyMed average time series for the investigated period. The y axis units refer to the displacement in millimeters.
Geosciences 07 00021 g005
Figure 6. (a) LOS displacements affecting the Ospedaletto district. The displacement map is overlaid on a 2013 digital orthophoto; (b) Geological reconstruction of the stratigraphical asset, the classification is the one proposed by Sarti et al. [43]; (c) Envisat, RADARSAT-2 and COSMO-SkyMed average time series for the analyzed building. The Envisat time series have been modified after Solari et al. [6]. The RADARSAT-2 and COSMO-SkyMed time series are shifted by a constant value for a better visualization.
Geosciences 07 00021 g006
Figure 7. (a) Age of construction of the selected buildings compared to the mean LOS velocity of the DInSAR data; (b) Mean, variance and standard deviation values for each class and each sensor. The ERS 1/2 and Envisat series are modified from Solari et al. [6]. The vertical black line represents the defined stability threshold (ST).
Geosciences 07 00021 g007

