Characterization of Vegetation Physiognomic Types Using Bidirectional Reflectance Data


Department of Informatics, Tokyo University of Information Sciences, 4-1 Onaridai, Wakaba-ku, Chiba 265-8501, Japan
*
Author to whom correspondence should be addressed.
Geosciences 2018, 8(11), 394; https://0-doi-org.brum.beds.ac.uk/10.3390/geosciences8110394
Submission received: 6 September 2018
/
Revised: 18 October 2018
/
Accepted: 26 October 2018
/
Published: 29 October 2018
Abstract
:This paper presents an assessment of the bidirectional reflectance features for the classification and characterization of vegetation physiognomic types at a national scale. The bidirectional reflectance data at multiple illumination and viewing geometries were generated by simulating the Moderate Resolution Imaging Spectroradiometer (MODIS) Bidirectional Reflectance Distribution Function (BRDF) model parameters with Ross-Thick Li-Sparse-Reciprocal (RT-LSR) kernel weights. This research dealt with the classification and characterization of six vegetation physiognomic types—evergreen coniferous forest, evergreen broadleaf forest, deciduous coniferous forest, deciduous broadleaf forest, shrubs, and herbaceous—which are distributed all over the country. The supervised classification approach was used by employing four machine learning classifiers—k-Nearest Neighbors (KNN), Random Forests (RF), Support Vector Machines (SVM), and Multilayer Perceptron Neural Networks (NN)—with the support of ground truth data. The confusion matrix, overall accuracy, and kappa coefficient were calculated through a 10-fold cross-validation approach, and were also used as the metrics for quantitative evaluation. Among the classifiers tested, the accuracy metrics did not vary much with the classifiers; however, the Random Forests (RF; Overall accuracy = 0.76, Kappa coefficient = 0.72) and Support Vector Machines (SVM; Overall accuracy = 0.76, Kappa coefficient = 0.71) classifiers performed slightly better than other classifiers. The bidirectional reflectance spectra did not only vary with the vegetation physiognomic types, it also showed a pronounced difference between the backward and forward scattering directions. Thus, the bidirectional reflectance data provides additional features for improving the classification and characterization of vegetation physiognomic types at the broad scale.
1. Introduction
Vegetation has been threatened by changes in species composition and the shifting of zones under the influence of climate change worldwide [1,2,3]. The mapping and characterization of vegetation physiognomic types (growth forms: tree, shrub, herbaceous; leaf characteristics: needle-leaved or broadleaved; and phenology: evergreen or deciduous [4]) is useful for a better understanding of vegetation dynamics.
The supervised classification of remotely sensed data is a common technique for identifying vegetation characteristics and monitoring changes on a timely basis. A number of supervised classifiers, such as maximum likelihood [5], decision trees [6,7], Support Vector Machines (SVM) [8], Random Forest (RF) [9,10,11], and Multilayer Perceptron Neural Networks (NN) [12,13,14], have been employed for this purpose.
The Ross-Thick Li-Sparse-Reciprocal (RT-LSR) model is a common Bidirectional Reflectance Distribution Function (BRDF) algorithm that combines the radiative transfer and geometric optical model in a semi-empirical fashion [15,16,17,18,19,20]. In the RT-LSR model, the bidirectional reflectance (R) for a given sun zenith angle (SZA), view zenith angle (VZA), and relative azimuth angle (RAA) is described by Equation (1):
In Equation (1), are the kernels for volumetric scattering and geometric scattering, respectively. The are trigonometric functions of SZA (), VZA (), and RAA (). Crown relative height and relative shape parameters are also included in the . The is a constant called isotropic scattering, which describes the reflectance under nadir solar illumination and nadir viewing condition; whereas the are the kernel weights for volumetric and geometric scatterings, respectively. The Moderate Resolution Imaging Spectroradiometer (MODIS) BRDF/Albedo Model Parameters product (MCD43A1) delivers the BRDF parameters () in seven spectral bands at 500-m spatial resolution on an eight-day cycle by fitting daily atmospherically corrected surface reflectance data with the RT-LSR model [20]. Using the BRDF parameters () and associated RT-LSR model kernel weights, bidirectional reflectance (R) at any illumination and viewing geometry can be generated. The MODIS BRDF/Albedo products provide high quality BRDF parameters [21,22,23,24,25].
The classification of vegetation physiognomic types using satellite remote sensing data over a large region is a challenging field. For example, extant maps such as MODIS Land Cover Type Product (MCD12Q1, [26]) and Global Land Cover by National Mapping Organizations (GLCNMO, [27]), from which the vegetation physiognomic information can be obtained, have not correctly classified the vegetation physiognomic types over a region as large and diverse as all of Japan [28,29]. With a focus on ground truth data and mapping at the national scale, more accurate vegetation physiognomic maps have been produced in Japan [28,29]. The importance of input features and the size of ground truth data for the classification of vegetation physiognomic types have also been emphasized [30]. In our previous research [29], nadir BRDF-adjusted reflectance indicated a slightly better classification of vegetation physiognomic types than the conventional surface reflectance. The objective of this research was to further assess the potential of bidirectional reflectance data at multiple illumination and viewing geometries for improving the classification and characterization of vegetation physiognomic types at moderate spatial resolution.
2. Materials and Methods
2.1. Processing of Satellite Data
The MODIS BRDF/Albedo parameters product (MCD43A1), available from the United States Geological Survey (USGS) on an eight-day cycle at 500-m resolution, were processed for the year 2016. The BRDF model parameters () of six spectral bands (red, near-infrared, blue, green, mid-infrared, and short-wave infrared) were utilized. Bidirectional reflectance data, at different illumination and viewing geometries (Table 1), were derived by simulating the BRDF model parameters with the RT-LSR kernel weights. Using all of the stacks of images available for Japan, the bidirectional reflectance data for each spectral band were composited by calculating eleven percentile values (0, 10, 20, 30, 40, 50, 60, 70, 80, 90, 100) pixel by pixel following the methodology described by Sharma et al. [30]. In this manner, a total of 264 bidirectional reflectance features were prepared from the MCD43A1 product (Table 1).
For the purpose of comparing the bidirectional reflectance, the surface reflectance product (MOD09A1/MOY09A1), which provides an estimate of the surface spectral reflectance as it would be measured at the ground level in the absence of atmospheric scattering or absorption, was also processed in a manner similar to the MCD43A1 product, and the annual minimum and maximum value composites for each spectral bands were generated.
2.2. Preparation of Ground Truth Data
This research deals with the classification and characterization of six vegetation physiognomic types: evergreen coniferous forest (ECF), evergreen broadleaf forest (EBF), deciduous coniferous forest (DCF), deciduous broadleaf forest (DBF), shrubs (Sh), and herbaceous (Hb). Ground truth data prepared in previous research studies [28,29,30] were further strengthened with reference to Google Earth imagery and used for this research. This research utilizes a total of 410 ground truth points for each class, which were located all over Japan.
2.3. Machine Learning and Cross-Validation
Four machine learning classifiers that were described for the classification of vegetation physiognomic types in the previous research [30]: k-Nearest Neighbors (KNN), Random Forests (RF), Support Vector Machines (SVM), and Multilayer Perceptron Neural Networks (NN), were employed for the evaluation of bidirectional reflectance features in this research.
The performance was evaluated by a 10-fold cross-validation method, following the method described by Sharma et al. [30]. In this method, given features were shuffled, and then grouped into 10 folds. Machine learning was carried out only on nine folds, whereas the remaining fold was used for validation. The features were standardized by removing the mean and scaling to unit variance. Best scoring features were scored based on an analysis of variance test. Then, for each set of best features, a machine learning model established with the learning folds was used to predict the physiognomic classes with the validation fold. Predictions were collected from cross-validation loops and the validation metrics—the confusion matrix, overall accuracy, and kappa coefficient—were calculated for each set of best features. The hyperparameters of the classifier were tuned by repeated hit and trial method with reference to the validation metrics. The optimum number of important features that yielded the highest kappa coefficient with the lowest number of input features were recorded. The same procedure was repeated for each machine learning classifier.
We also compared the spectral profiles of the vegetation physiognomic types regarding the surface and bidirectional reflectance features. For this comparison, the spectral profiles were extracted from both surface and bidirectional reflectance features using the median values of all of the ground truth points that were prepared in the research.
3. Results and Discussion
3.1. Cross-Validation Results
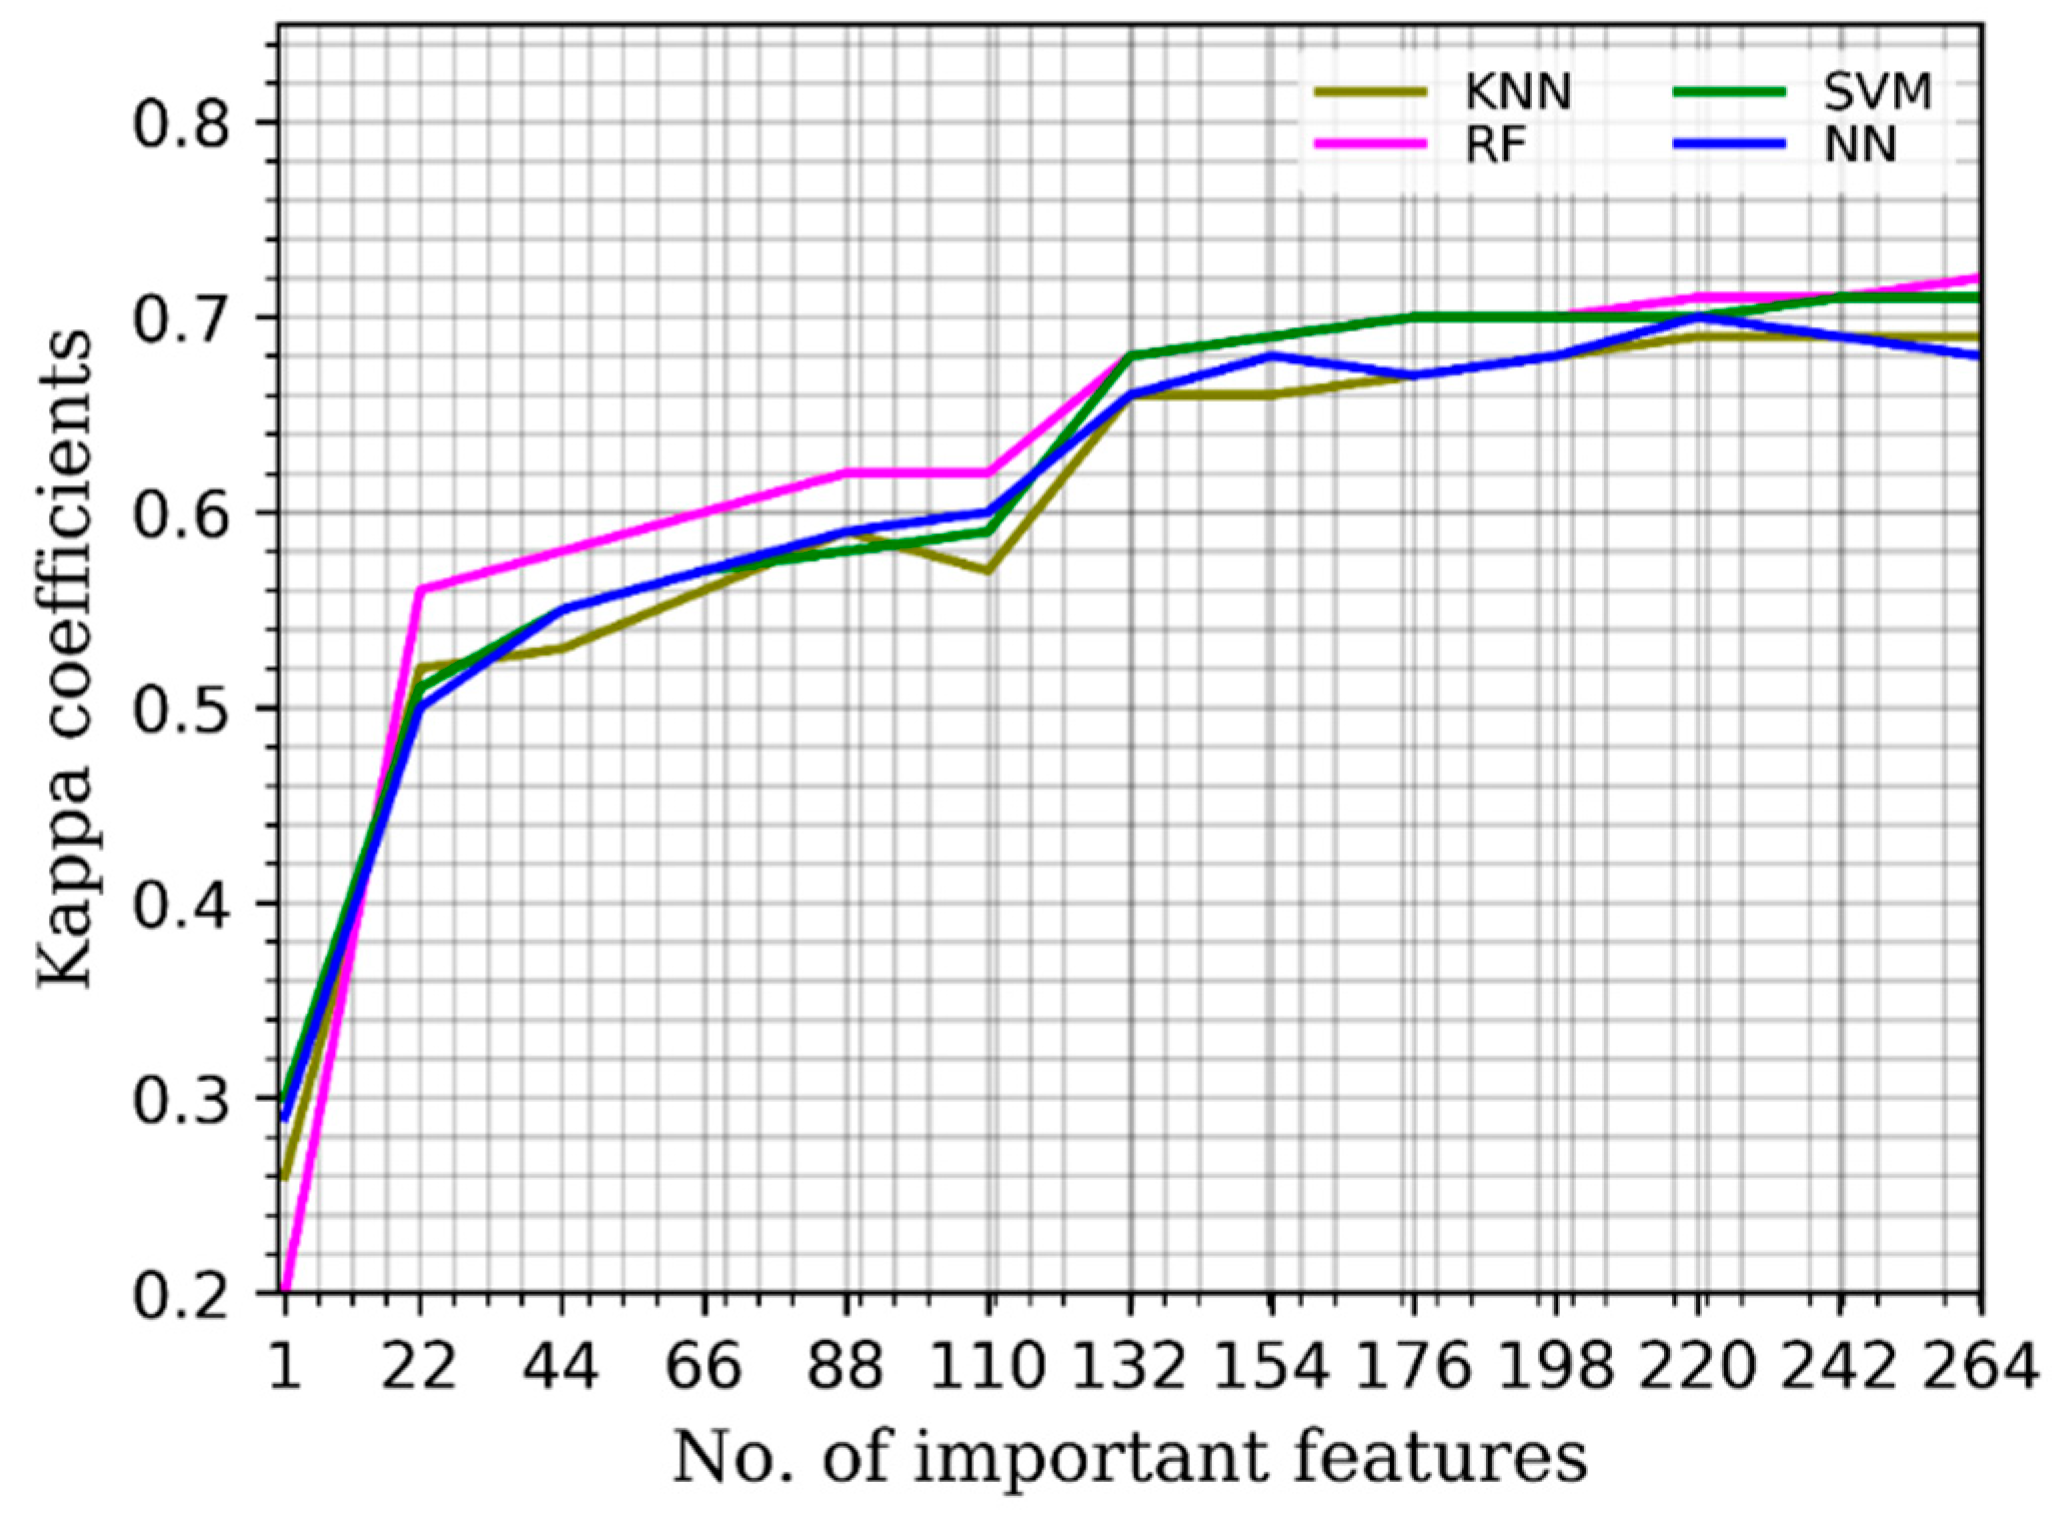
The variation of the kappa coefficient by increasing the important number of features obtained from the cross-validation method is shown in Figure 1. The kappa coefficients increased by increasing the number of important features up to a point, after which they started to saturate for all of the classifiers.
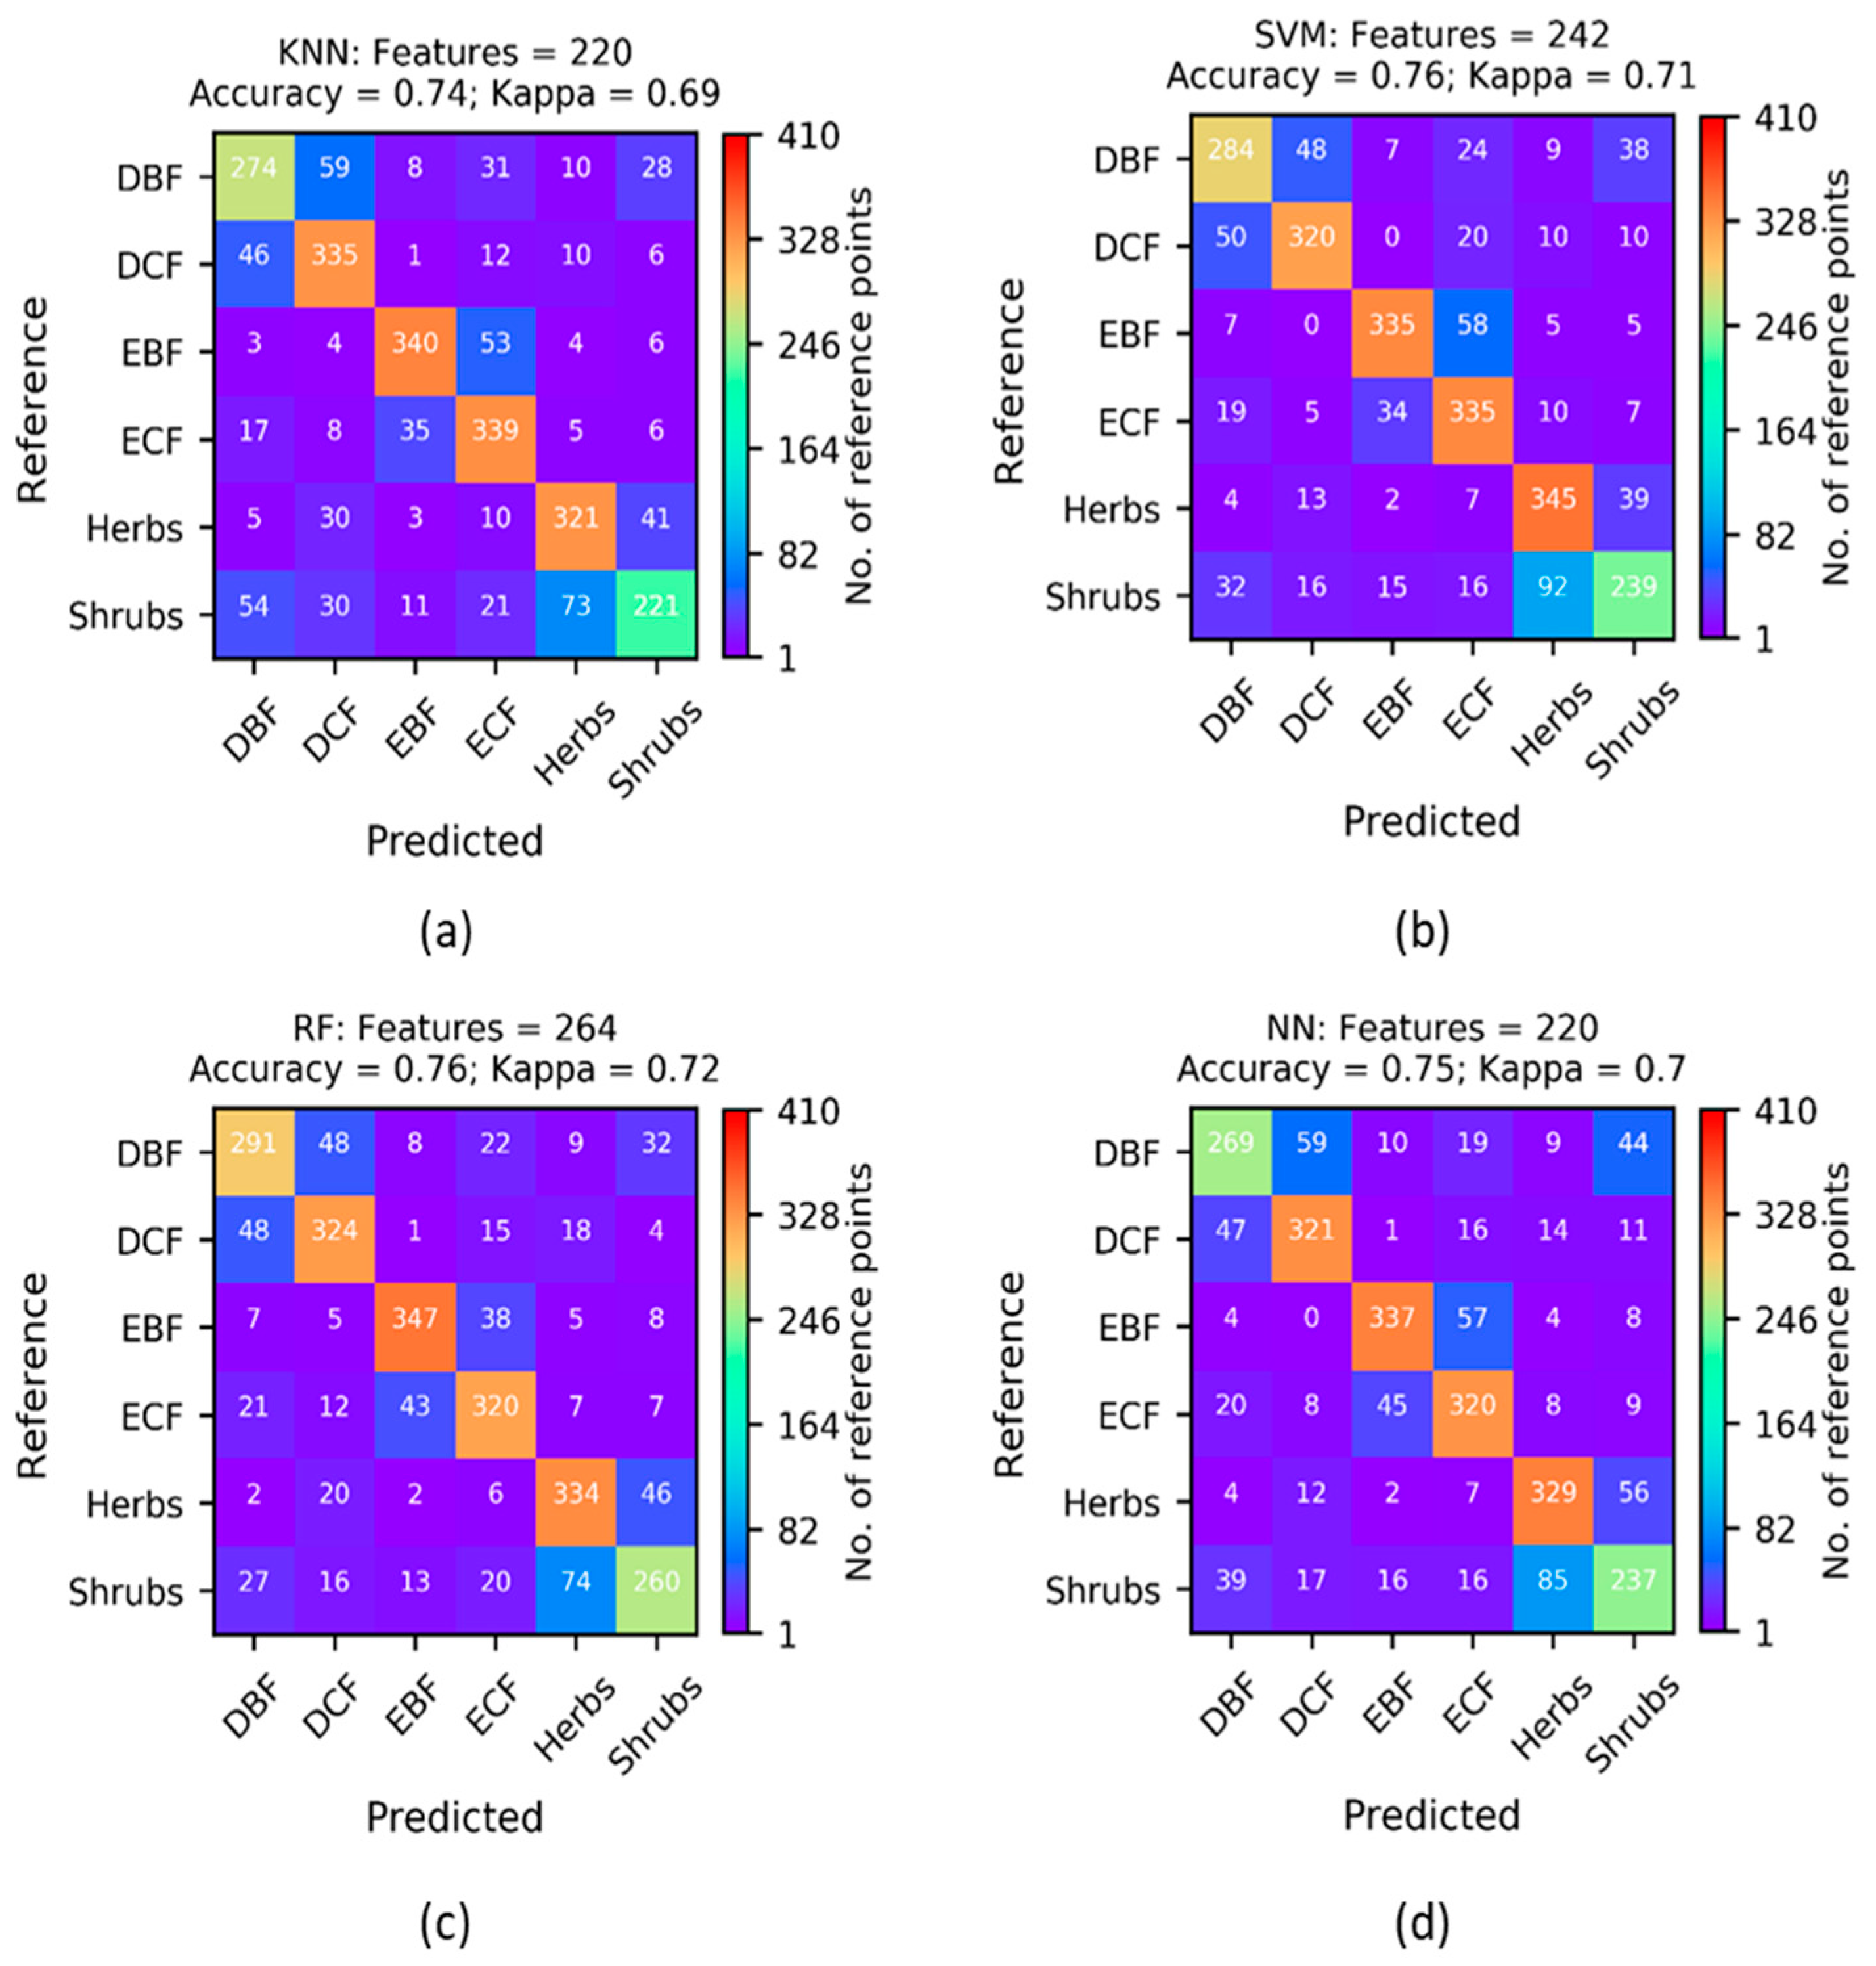
The confusion matrices that were computed are plotted in Figure 2. These matrices were computed based on a 10-fold cross-validation method using the optimum set of features. Among the classifiers used, the Random Forests (RF; Overall accuracy = 0.76, Kappa coefficient = 0.72) and Support Vector Machines (SVM; Overall accuracy = 0.76, Kappa coefficient = 0.71) performed slightly better than others. Nevertheless, accuracy metrics obtained from the bidirectional reflectance did not vary much with the classifiers, which was similar to the surface reflectance [30].
3.2. Comparison of the Spectral Profiles
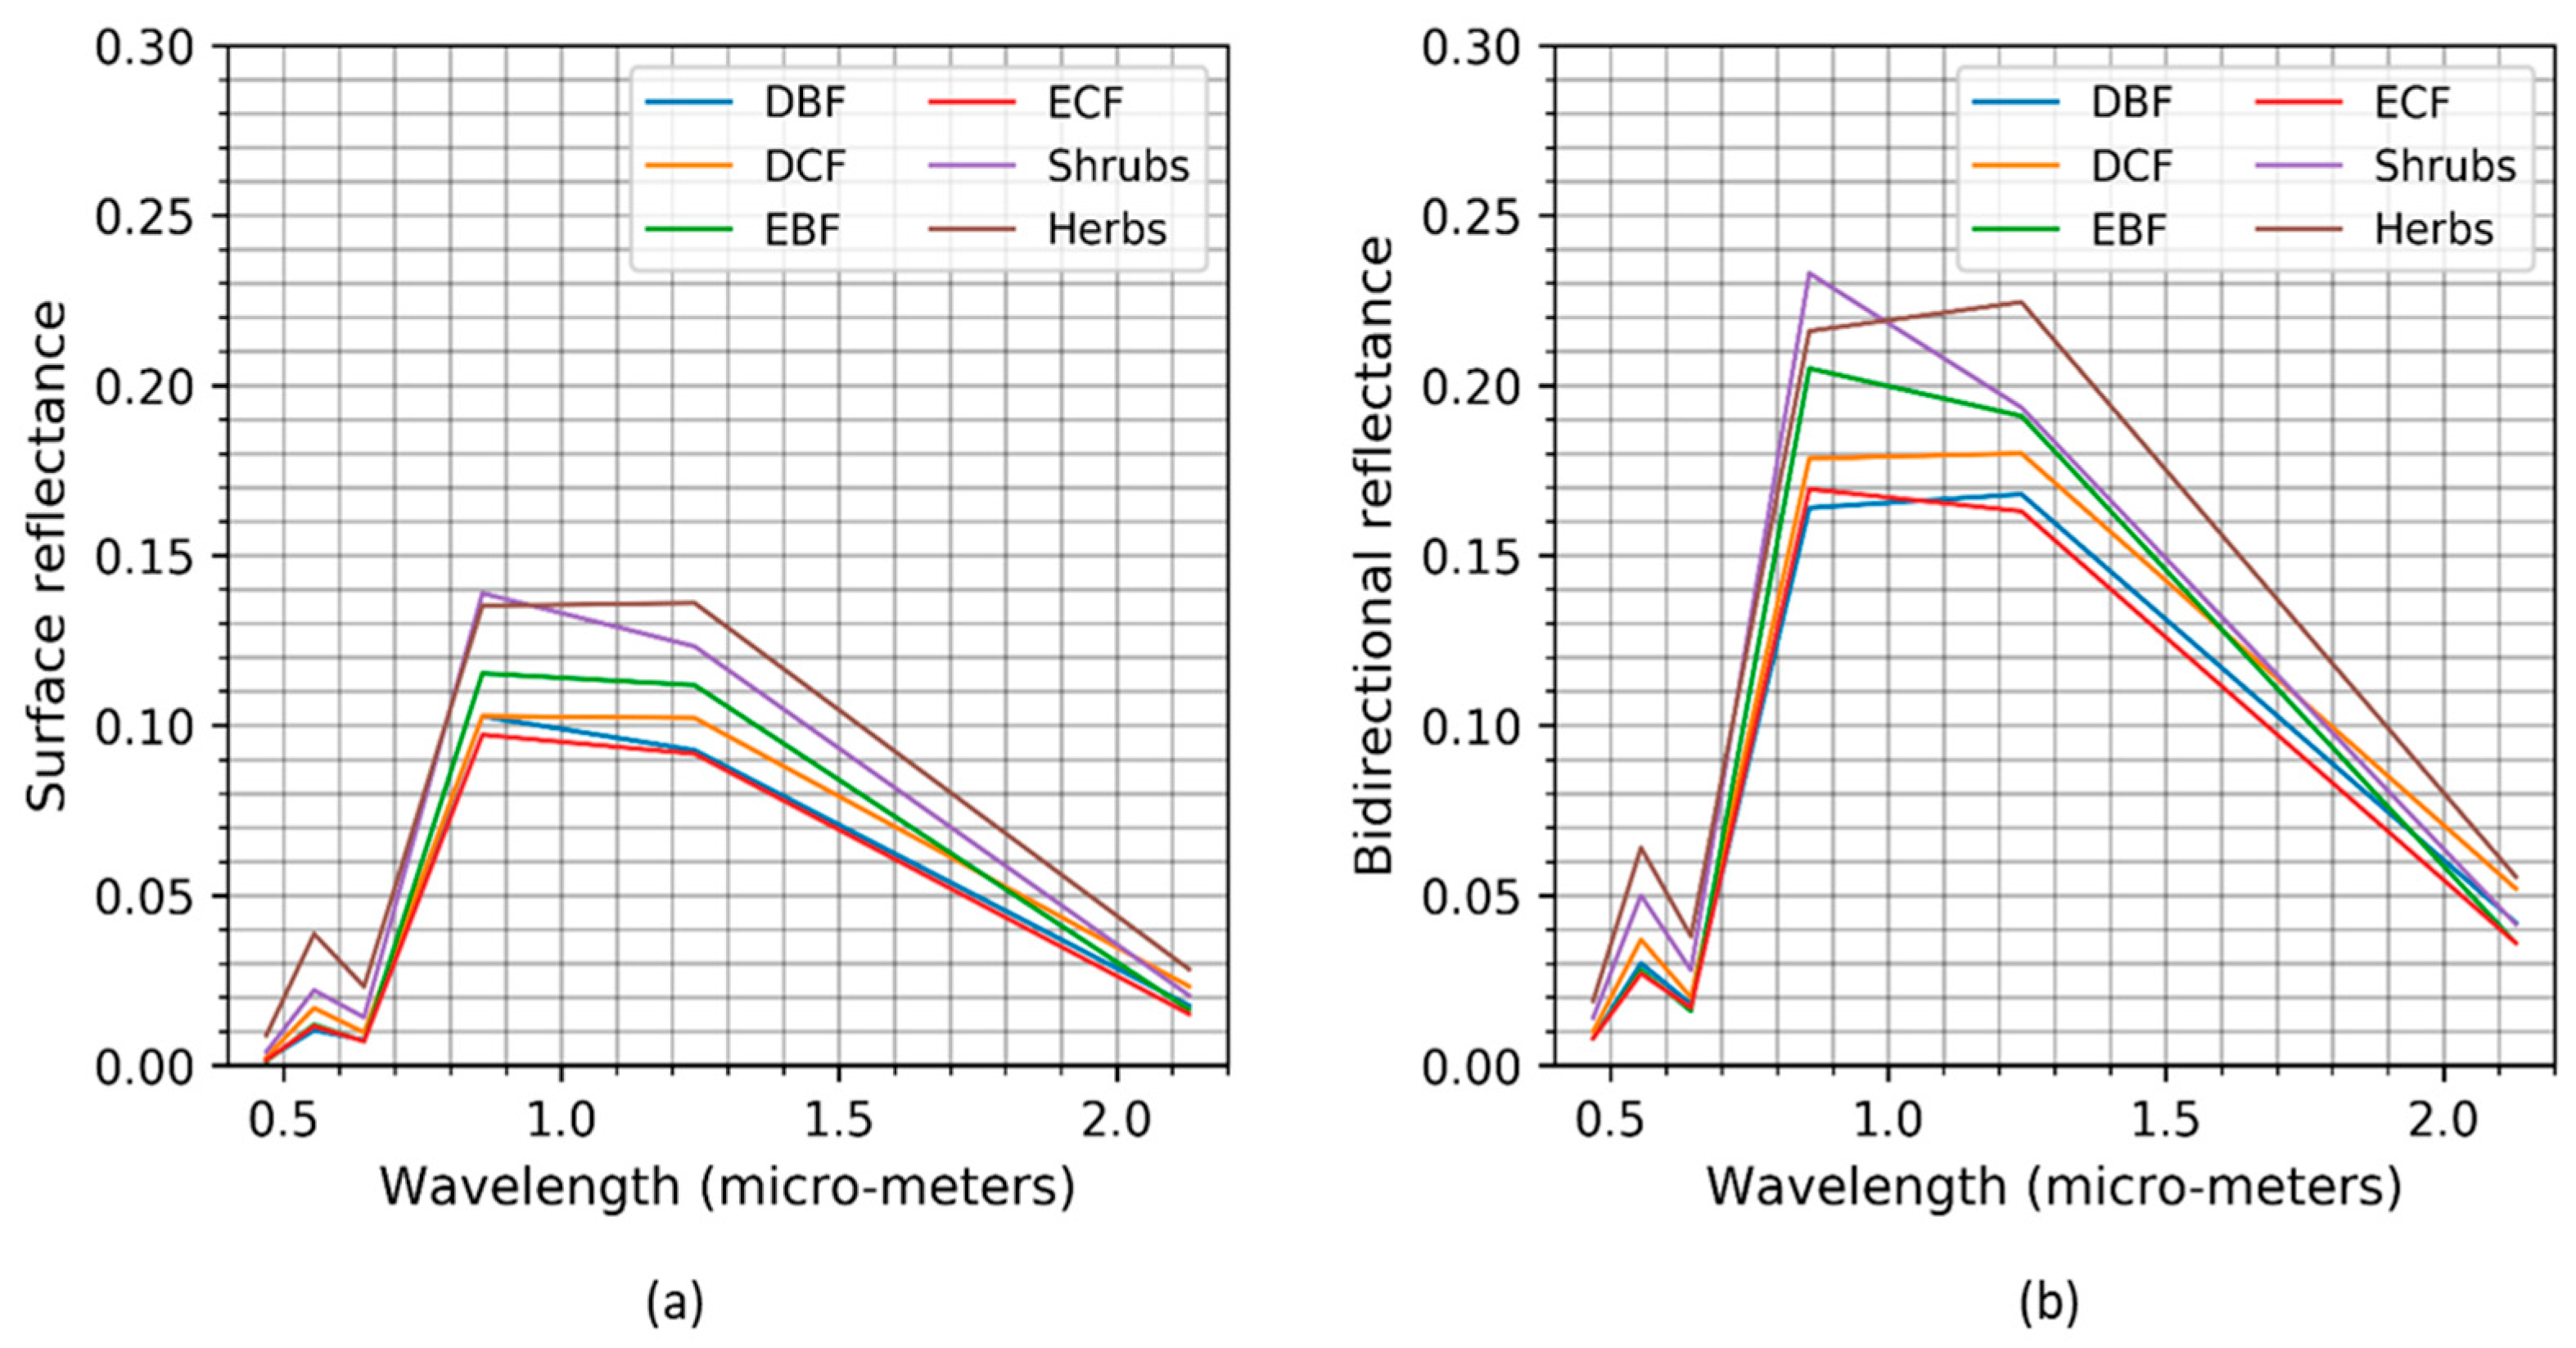
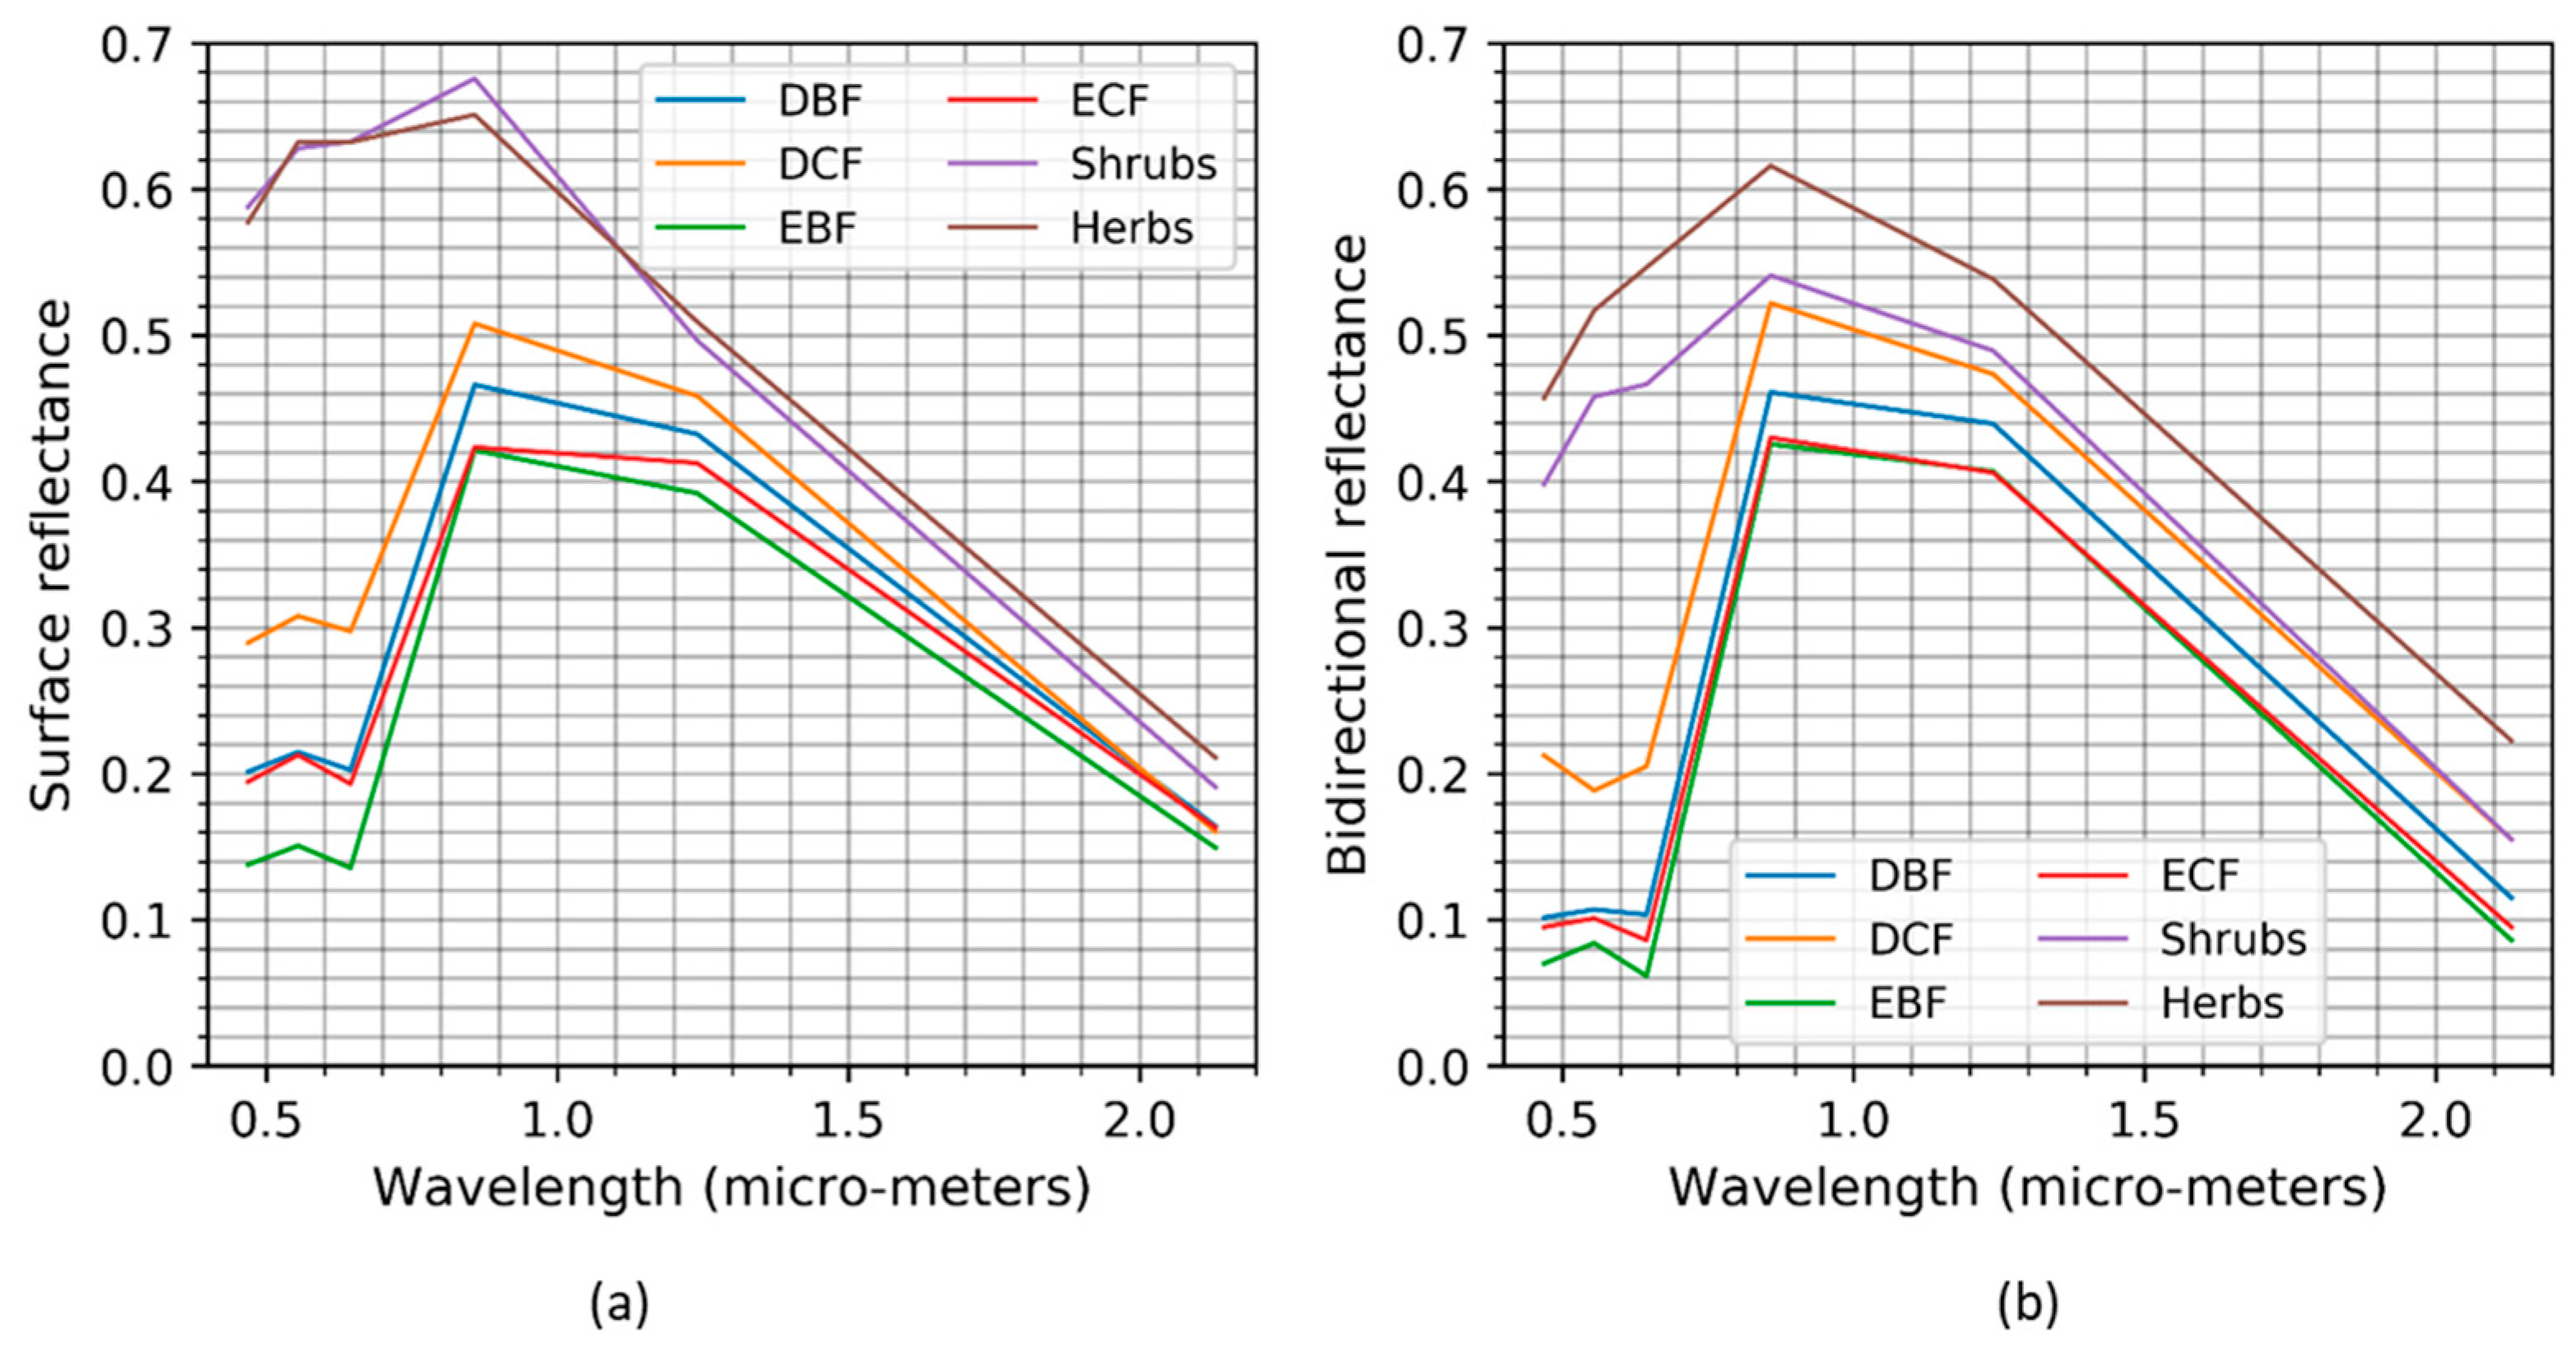
Figure 3 and Figure 4 show the spectral profiles using annual minimum and maximum value composite images, respectively. There is a substantial difference in the magnitude of the reflectance values in all of the spectral regions between the surface and bidirectional reflectance products. The annual minimum values of the surface reflectance are lower than the corresponding isotropic reflectance (Figure 3), whereas the annual maximum values of the surface reflectance are higher than the corresponding isotropic reflectance (Figure 4). The isotropic reflectance (SZA = 0°, VZA = 0°, RAA = 0°) has indicated a better discrimination of the vegetation physiognomic types in the near infrared and shortwave infrared region than the surface reflectance. Therefore, the bidirectional reflectance features may be more sensitive to the vegetation physiognomic types.
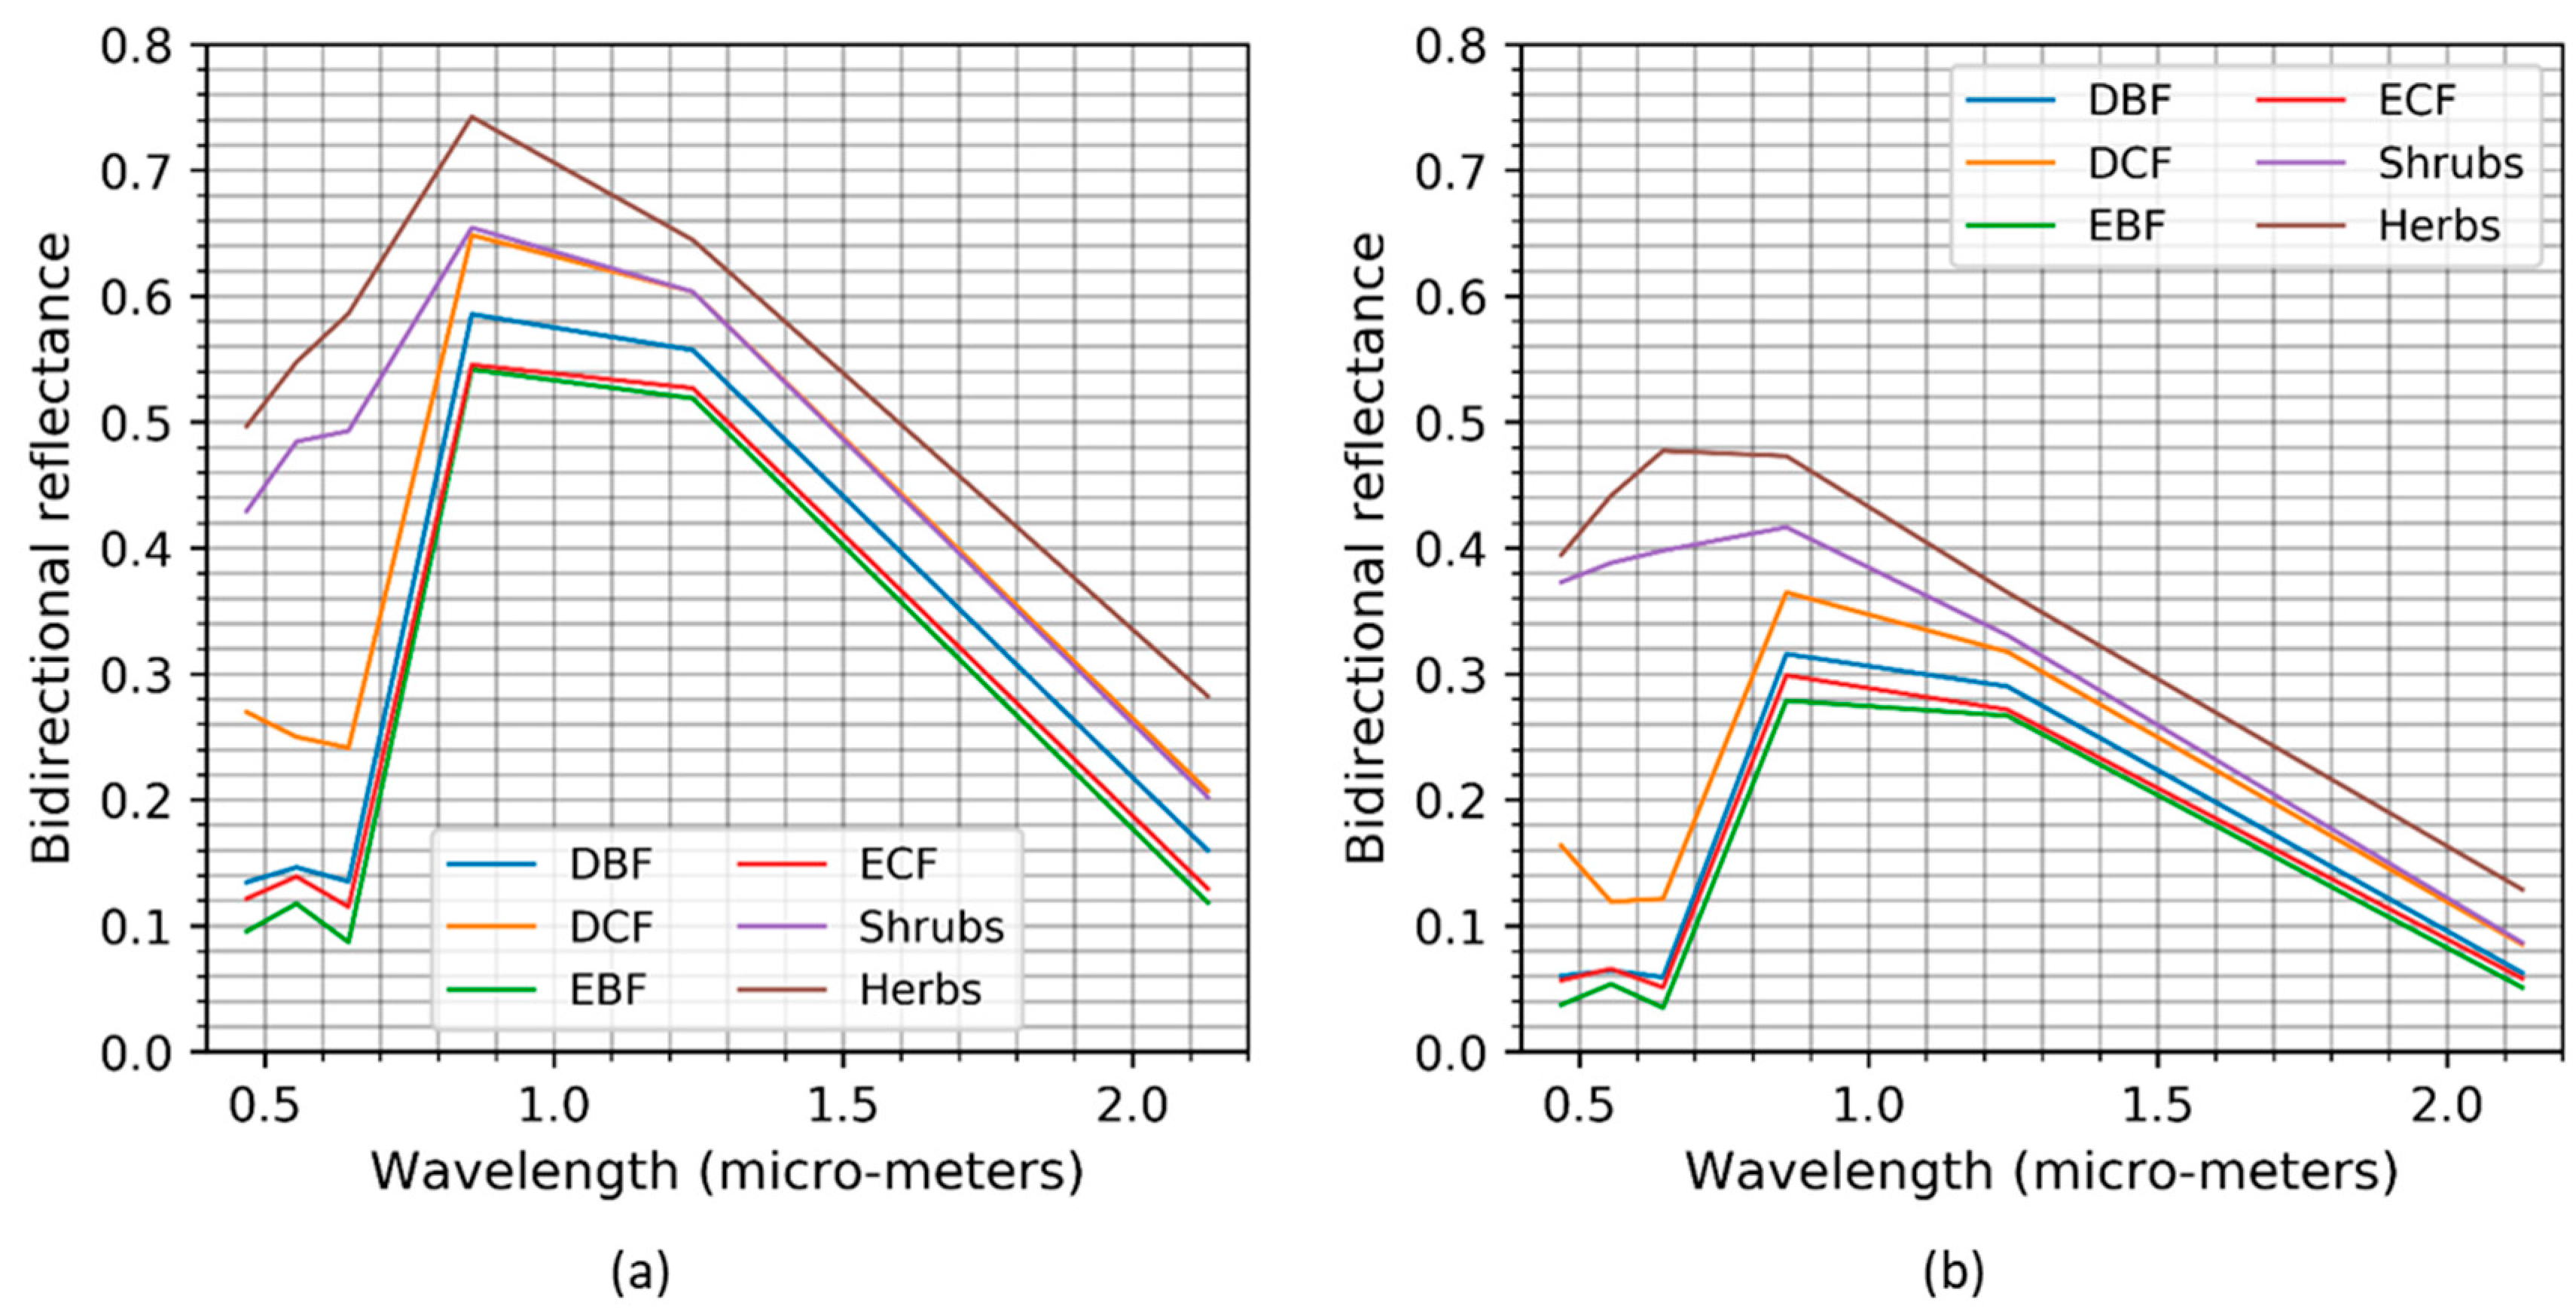
Figure 5 shows the spectral profiles in the backward and forward scattering directions. The herbs, shrubs, and deciduous conifer forests showed higher backward scattering in the red region than the deciduous broadleaf, evergreen broadleaf, and evergreen conifer forests. It may be because the exposure of ground surface is more pronounced in the case of short and deciduous vegetation (herbs, shrubs, and deciduous forests) while viewing from the off-nadir directions. Moreover, the forward reflectance data are much lower than the backward reflectance, which was possibly due to the presence of shadows in the forward direction. Thus, the analyses with the spectral profiles indicated that bidirectional reflectance data provides additional features for improving the classification and characterization of vegetation physiognomic types.
The vegetation exhibits anisotropic reflectance, i.e., the reflectivity varies with respect to the direction of observation [31,32]. Researchers have described the effects of viewing geometry and illumination conditions on images [33] and vegetation indices [34]. The multi-angular remote sensing has shown promises for characterization of forests [35] and biomes [36], as well as the retrieval of canopy structural [37,38,39,40] and chemical characteristics [41,42]. Therefore, the mapping and characterization of vegetation physiognomic types using the bidirectional reflectance data is an interesting topic for research.
4. Conclusions
In this research, we analyzed the variation of the spectral profiles between the surface and bidirectional reflectance data, and assessed the potential of bidirectional reflectance features at multiple illumination and viewing geometries for improving the classification and characterization of vegetation physiognomic types. The results of this research indicated that bidirectional reflectance provides effective information for the classification and characterization of vegetation physiognomic types. Our hope is that the mapping and monitoring of vegetation changes with bidirectional reflectance data, especially at higher spatial resolution in the future, will contribute greatly to land planning, nature conservation, and global biodiversity strategies. This research dealt with the physiognomic characteristics of the vegetation only; however, exploring the effects of leaf and vegetation structure (proportion of leaves/needles to woody parts, plant density, diversity, variation in plant height, edges, etc.) on the bidirectional reflectance and classification of vegetation types is an important subject of future research.
Author Contributions
R.C.S. conceptualized the research, performed the analyses, and wrote the manuscript. K.H. revised the manuscript. All authors contributed and approved final manuscript before submission.
Funding
This research was supported by JSPS (Japan Society for the Promotion of Science) grant-in-aid for scientific research (No. P17F17109).
Acknowledgments
The MODIS data product was retrieved from the online Data Pool, courtesy of the NASA Land Processes Distributed Active Archive Center (LP DAAC), USGS/Earth Resources Observation and Science (EROS) Center, Sioux Falls, South Dakota, https://lpdaac.usgs.gov/data_access/data_pool.
Conflicts of Interest
The authors declare no conflict of interest.
References
- Ohba, H. The flora of Japan and the implication of global climatic change. J. Plant Res. 1994, 107, 85–89. [Google Scholar] [CrossRef]
- Gehrig-Fasel, J.; Guisan, A.; Zimmermann, N.E. Tree line shifts in the Swiss Alps: Climate change or land abandonment? J. Veg. Sci. 2007, 18, 571–582. [Google Scholar] [CrossRef]
- Seim, A.; Treydte, K.; Trouet, V.; Frank, D.; Fonti, P.; Tegel, W.; Panayotov, M.; Fernández-Donado, L.; Krusic, P.; Büntgen, U. Climate sensitivity of Mediterranean pine growth reveals distinct east-west dipole: East-west dipole in climate sensitivity of Mediterranean pines. Int. J. Clim. 2015, 35, 2503–2513. [Google Scholar] [CrossRef]
- Beard, J.S. The Physiognomic Approach. In Classification of Plant Communities; Whittaker, R.H., Ed.; Springer: Dordrecht, The Netherlands, 1978; pp. 33–64. ISBN 978-94-009-9183-5. [Google Scholar]
- Stuart, N.; Barratt, T.; Place, C. Classifying the Neotropical savannas of Belize using remote sensing and ground survey. J. Biogeogr. 2006, 33, 476–490. [Google Scholar] [CrossRef]
- Wang, Z.; Wang, Q.; Zhao, L.; Wu, X.; Yue, G.; Zou, D.; Nan, Z.; Liu, G.; Pang, Q.; Fang, H.; et al. Mapping the vegetation distribution of the permafrost zone on the Qinghai-Tibet Plateau. J. Mt. Sci. 2016, 13, 1035–1046. [Google Scholar] [CrossRef]
- Betbeder, J.; Rapinel, S.; Corpetti, T.; Pottier, E.; Corgne, S.; Hubert-Moy, L. Multitemporal classification of TerraSAR-X data for wetland vegetation mapping. J. Appl. Remote Sens. 2014, 8, 083648. [Google Scholar] [CrossRef]
- Schwieder, M.; Leitão, P.J.; da Cunha Bustamante, M.M.; Ferreira, L.G.; Rabe, A.; Hostert, P. Mapping Brazilian savanna vegetation gradients with Landsat time series. Int. J. Appl. Earth Obs. Geoinf. 2016, 52, 361–370. [Google Scholar] [CrossRef]
- Vanselow, K.; Samimi, C. Predictive Mapping of Dwarf Shrub Vegetation in an Arid High Mountain Ecosystem Using Remote Sensing and Random Forests. Remote Sens. 2014, 6, 6709–6726. [Google Scholar] [CrossRef] [Green Version]
- Torbick, N.; Ledoux, L.; Salas, W.; Zhao, M. Regional Mapping of Plantation Extent Using Multisensor Imagery. Remote Sens. 2016, 8, 236. [Google Scholar] [CrossRef]
- Fu, B.; Wang, Y.; Campbell, A.; Li, Y.; Zhang, B.; Yin, S.; Xing, Z.; Jin, X. Comparison of object-based and pixel-based Random Forest algorithm for wetland vegetation mapping using high spatial resolution GF-1 and SAR data. Ecol. Indic. 2017, 73, 105–117. [Google Scholar] [CrossRef]
- Carpenter, G.A.; Gopal, S.; Macomber, S.; Martens, S.; Woodcock, C.E. A neural network method for mixture estimation for vegetation mapping. Remote Sens. Environ. 1999, 70, 138–152. [Google Scholar] [CrossRef]
- Zhang, C.; Xie, Z. Combining object-based texture measures with a neural network for vegetation mapping in the Everglades from hyperspectral imagery. Remote Sens. Environ. 2012, 124, 310–320. [Google Scholar] [CrossRef]
- Antropov, O.; Rauste, Y.; Astola, H.; Praks, J.; Häme, T.; Hallikainen, M.T. Land cover and soil type mapping from spaceborne PolSAR data at L-band with probabilistic neural network. IEEE Trans. Geosci. Remote Sens. 2014, 52, 5256–5270. [Google Scholar] [CrossRef]
- Ross, I. The Radiation Regime and Architecture of Plant Stands; Tasks for Vegetation Sciences; Dr. W. Junk Publishers: The Hague, The Netherlands; Kluwer Boston: Boston, MA, USA, 1981; ISBN 978-90-6193-607-7. [Google Scholar]
- Roujean, J.-L.; Leroy, M.; Deschamps, P.-Y. A bidirectional reflectance model of the Earth’s surface for the correction of remote sensing data. J. Geophys. Res. 1992, 97, 20455. [Google Scholar] [CrossRef]
- Li, X.; Strahler, A.H. Geometric-optical bidirectional reflectance modeling of the discrete crown vegetation canopy: Effect of crown shape and mutual shadowing. IEEE Trans. Geosci. Remote Sens. 1992, 30, 276–292. [Google Scholar] [CrossRef]
- Wanner, W.; Li, X.; Strahler, A.H. On the derivation of kernels for kernel-driven models of bidirectional reflectance. J. Geophys. Res. 1995, 100, 21077. [Google Scholar] [CrossRef]
- Lucht, W.; Schaaf, C.B.; Strahler, A.H. An algorithm for the retrieval of albedo from space using semiempirical BRDF models. IEEE Trans. Geosci. Remote Sens. 2000, 38, 977–998. [Google Scholar] [CrossRef]
- Schaaf, C.B.; Gao, F.; Strahler, A.H.; Lucht, W.; Li, X.; Tsang, T.; Strugnell, N.C.; Zhang, X.; Jin, Y.; Muller, J.-P.; et al. First operational BRDF, albedo nadir reflectance products from MODIS. Remote Sens. Environ. 2002, 83, 135–148. [Google Scholar] [CrossRef] [Green Version]
- Liang, S.; Fang, H.; Chen, M.; Shuey, C.J.; Walthall, C.; Daughtry, C.; Morisette, J.; Schaaf, C.; Strahler, A. Validating MODIS land surface reflectance and albedo products: Methods and preliminary results. Remote Sens. Environ. 2002, 83, 149–162. [Google Scholar] [CrossRef]
- Jin, Y. Consistency of MODIS surface bidirectional reflectance distribution function and albedo retrievals: 2. Validation. J. Geophys. Res. 2003, 108. [Google Scholar] [CrossRef] [Green Version]
- Samain, O.; Roujean, J.; Geiger, B. Use of a Kalman filter for the retrieval of surface BRDF coefficients with a time-evolving model based on the ECOCLIMAP land cover classification. Remote Sens. Environ. 2008, 112, 1337–1346. [Google Scholar] [CrossRef]
- Liu, J.; Schaaf, C.; Strahler, A.; Jiao, Z.; Shuai, Y.; Zhang, Q.; Roman, M.; Augustine, J.A.; Dutton, E.G. Validation of Moderate Resolution Imaging Spectroradiometer (MODIS) albedo retrieval algorithm: Dependence of albedo on solar zenith angle. J. Geophys. Res. 2009, 114. [Google Scholar] [CrossRef] [Green Version]
- Román, M.O.; Gatebe, C.K.; Schaaf, C.B.; Poudyal, R.; Wang, Z.; King, M.D. Variability in surface BRDF at different spatial scales (30 m–500 m) over a mixed agricultural landscape as retrieved from airborne and satellite spectral measurements. Remote Sens. Environ. 2011, 115, 2184–2203. [Google Scholar] [CrossRef]
- Friedl, M.A.; Sulla-Menashe, D.; Tan, B.; Schneider, A.; Ramankutty, N.; Sibley, A.; Huang, X. MODIS Collection 5 global land cover: Algorithm refinements and characterization of new datasets. Remote Sens. Environ. 2010, 114, 168–182. [Google Scholar] [CrossRef]
- Kobayashi, T.; Tateishi, R.; Alsaaideh, B.; Sharma, R.C.; Wakaizumi, T.; Miyamoto, D.; Bai, X.; Long, B.D.; Gegentana, G.; Maitiniyazi, A.; et al. Production of Global Land Cover Data—GLCNMO2013. J. Geogr. Geol. 2017, 9, 1. [Google Scholar] [CrossRef]
- Sharma, R.C.; Hara, K.; Hirayama, H.; Harada, I.; Hasegawa, D.; Tomita, M.; Geol Park, J.; Asanuma, I.; Short, K.M.; Hara, M.; et al. Production of Multi-Features Driven Nationwide Vegetation Physiognomic Map and Comparison to MODIS Land Cover Type Product. Adv. Remote Sens. 2017, 6, 54–65. [Google Scholar] [CrossRef]
- Sharma, R.C.; Hara, K.; Hirayama, H. Improvement of Countrywide Vegetation Mapping over Japan and Comparison to Existing Maps. Adv. Remote Sens. 2018, 07, 163–170. [Google Scholar] [CrossRef]
- Sharma, R.C.; Hara, K.; Hirayama, H. A Machine Learning and Cross-Validation Approach for the Discrimination of Vegetation Physiognomic Types Using Satellite Based Multispectral and Multitemporal Data. Scientifica 2017, 2017, 1–8. [Google Scholar] [CrossRef] [PubMed] [Green Version]
- Kimes, D.S.; Newcomb, W.W.; Nelson, R.F.; Schutt, J.B. Directional Reflectance Distributions of a Hardwood and Pine Forest Canopy. IEEE Trans. Geosci. Remote Sens. 1986, GE-24, 281–293. [Google Scholar] [CrossRef]
- Sandmeier, S.R.; Deering, D.W. A new approach to derive canopy structure information for boreal forests using spectral BRDF data. In IEEE 1999 International Geoscience and Remote Sensing Symposium. IGARSS’99 (Cat. No.99CH36293); IEEE: Hamburg, Germany, 1999; Volume 1, pp. 410–412. [Google Scholar]
- Verrelst, J.; Schaepman, M.E.; Koetz, B.; Kneubühler, M. Angular sensitivity analysis of vegetation indices derived from CHRIS/PROBA data. Remote Sens. Environ. 2008, 112, 2341–2353. [Google Scholar] [CrossRef]
- Matasci, G.; Longbotham, N.; Pacifici, F.; Kanevski, M.; Tuia, D. Understanding angular effects in VHR imagery and their significance for urban land-cover model portability: A study of two multi-angle in-track image sequences. ISPRS J. Photogramm. Remote Sens. 2015, 107, 99–111. [Google Scholar] [CrossRef] [Green Version]
- Rautiainen, M.; Lang, M.; Mõttus, M.; Kuusk, A.; Nilson, T.; Kuusk, J.; Lükk, T. Multi-angular reflectance properties of a hemiboreal forest: An analysis using CHRIS PROBA data. Remote Sens. Environ. 2008, 112, 2627–2642. [Google Scholar] [CrossRef]
- Bacour, C.; Bréon, F.-M. Variability of biome reflectance directional signatures as seen by POLDER. Remote Sens. Environ. 2005, 98, 80–95. [Google Scholar] [CrossRef]
- Lacaze, R. Retrieval of vegetation clumping index using hot spot signatures measured by POLDER instrument. Remote Sens. Environ. 2002, 79, 84–95. [Google Scholar] [CrossRef] [Green Version]
- Chen, J.M.; Menges, C.H.; Leblanc, S.G. Global mapping of foliage clumping index using multi-angular satellite data. Remote Sens. Environ. 2005, 97, 447–457. [Google Scholar] [CrossRef]
- Pocewicz, A.; Vierling, L.A.; Lentile, L.B.; Smith, R. View angle effects on relationships between MISR vegetation indices and leaf area index in a recently burned ponderosa pine forest. Remote Sens. Environ. 2007, 107, 322–333. [Google Scholar] [CrossRef]
- Sharma, R.C.; Kajiwara, K.; Honda, Y. Automated extraction of canopy shadow fraction using unmanned helicopter-based color vegetation indices. Trees 2013, 27, 675–684. [Google Scholar] [CrossRef]
- Song, X.; Feng, W.; He, L.; Xu, D.; Zhang, H.-Y.; Li, X.; Wang, Z.-J.; Coburn, C.A.; Wang, C.-Y.; Guo, T.-C. Examining view angle effects on leaf N estimation in wheat using field reflectance spectroscopy. ISPRS J. Photogramm. Remote Sens. 2016, 122, 57–67. [Google Scholar] [CrossRef]
- Liu, X.; Liu, L. Influence of the canopy BRDF characteristics and illumination conditions on the retrieval of solar-induced chlorophyll fluorescence. Int. J. Remote Sens. 2018, 39, 1782–1799. [Google Scholar] [CrossRef]
Figure 1.
Variation of the kappa coefficients with increasing number of important features using four different classifiers (k-Nearest Neighbors (KNN), Random Forests (RF), Support Vector Machines (SVM), and Multilayer Perceptron Neural Networks (NN).
Figure 1.
Variation of the kappa coefficients with increasing number of important features using four different classifiers (k-Nearest Neighbors (KNN), Random Forests (RF), Support Vector Machines (SVM), and Multilayer Perceptron Neural Networks (NN).

Figure 2.
Confusion matrices computed with the optimum set of features using four different classifiers: (a) k-Nearest Neighbors (KNN), (b) Support Vector Machines (SVM), (c) Random Forests (RF), and (d) Multilayer Perceptron Neural Networks (NN). Abbreviations: evergreen coniferous forest (ECF), evergreen broadleaf forest (EBF), deciduous coniferous forest (DCF), deciduous broadleaf forest (DBF), shrubs (Sh), and herbaceous (Hb).

Figure 3.
Spectral profiles using annual minimum values: (a) MOD09A1/MOY09A1 product-based surface reflectance, (b) MCD43A1 product-based isotropic (SZA = 0°, VZA = 0°, RAA = 0°) reflectance.
Figure 3.
Spectral profiles using annual minimum values: (a) MOD09A1/MOY09A1 product-based surface reflectance, (b) MCD43A1 product-based isotropic (SZA = 0°, VZA = 0°, RAA = 0°) reflectance.

Figure 4.
Spectral profiles using annual maximum values: (a) MOD09A1/MOY09A1 product-based surface reflectance, (b) MCD43A1 product-based isotropic (SZA = 0°, VZA = 0°, RAA = 0°) reflectance.
Figure 4.
Spectral profiles using annual maximum values: (a) MOD09A1/MOY09A1 product-based surface reflectance, (b) MCD43A1 product-based isotropic (SZA = 0°, VZA = 0°, RAA = 0°) reflectance.

Figure 5.
Additional spectral profiles using bidirectional reflectance data: (a) annual maximum values of the backward scattering (SZA = 45°, VZA = 45°, RAA = 0°), (b) annual maximum values of the forward scattering (SZA = 45°, VZA = 45°, RAA = 180°).
Figure 5.
Additional spectral profiles using bidirectional reflectance data: (a) annual maximum values of the backward scattering (SZA = 45°, VZA = 45°, RAA = 0°), (b) annual maximum values of the forward scattering (SZA = 45°, VZA = 45°, RAA = 180°).


Table 1.
Description of the bidirectional reflectance features prepared in the research. RAA: relative azimuth angle, SZA: sun zenith angle, VZA: view zenith angle.
Table 1.
Description of the bidirectional reflectance features prepared in the research. RAA: relative azimuth angle, SZA: sun zenith angle, VZA: view zenith angle.
| Spectral | Angular (SZA, VZA, RAA) | Temporal |
|---|---|---|
| 6 | ➀ 0°, 0°, 0° | 11 |
| ➁ 45°, 0°, 0° | ||
| ➂ 45°, 45°, 0° | ||
| ➃ 45°, 45°, 180° | ||
| Total features = 6 × 4 × 11 = 264 | ||
© 2018 by the authors. Licensee MDPI, Basel, Switzerland. This article is an open access article distributed under the terms and conditions of the Creative Commons Attribution (CC BY) license (http://creativecommons.org/licenses/by/4.0/).
Share and Cite
MDPI and ACS Style
Sharma, R.C.; Hara, K. Characterization of Vegetation Physiognomic Types Using Bidirectional Reflectance Data. Geosciences 2018, 8, 394. https://0-doi-org.brum.beds.ac.uk/10.3390/geosciences8110394
AMA Style
Sharma RC, Hara K. Characterization of Vegetation Physiognomic Types Using Bidirectional Reflectance Data. Geosciences. 2018; 8(11):394. https://0-doi-org.brum.beds.ac.uk/10.3390/geosciences8110394
Chicago/Turabian StyleSharma, Ram C., and Keitarou Hara. 2018. "Characterization of Vegetation Physiognomic Types Using Bidirectional Reflectance Data" Geosciences 8, no. 11: 394. https://0-doi-org.brum.beds.ac.uk/10.3390/geosciences8110394
Note that from the first issue of 2016, this journal uses article numbers instead of page numbers. See further details here.