Formation and Accumulation of Pore Methane Hydrates in Permafrost: Experimental Modeling

1
Skolkovo Institute of Science and Technology (Skoltech), 3, Nobel st., Innovation Center Skolkovo, Moscow 121205, Russia
2
Department of Geology, Lomonosov Moscow State University (MSU), GSP-1, Leninskie Gory, Moscow 119991, Russia
*
Author to whom correspondence should be addressed.
Geosciences 2018, 8(12), 467; https://0-doi-org.brum.beds.ac.uk/10.3390/geosciences8120467
Submission received: 22 October 2018
/
Revised: 1 December 2018
/
Accepted: 7 December 2018
/
Published: 10 December 2018
(This article belongs to the Special Issue Gas and Gas Hydrate in Permafrost)
Abstract
:Favorable thermobaric conditions of hydrate formation and the significant accumulation of methane, ice, and actual data on the presence of gas hydrates in permafrost suggest the possibility of their formation in the pore space of frozen soils at negative temperatures. In addition, today there are several geological models that involve the formation of gas hydrate accumulations in permafrost. To confirm the literature data, the formation of gas hydrates in permafrost saturated with methane has been studied experimentally using natural artificially frozen in the laboratory sand and silt samples, on a specially designed system at temperatures from 0 to −8 °C. The experimental results confirm that pore methane hydrates can form in gas-bearing frozen soils. The kinetics of gas hydrate accumulation in frozen soils was investigated in terms of dependence on the temperature, excess pressure, initial ice content, salinity, and type of soil. The process of hydrate formation in soil samples in time with falling temperature from +2 °C to −8 °C slows down. The fraction of pore ice converted to hydrate increased as the gas pressure exceeded the equilibrium. The optimal ice saturation values (45−65%) at which hydrate accumulation in the porous media is highest were found. The hydrate accumulation is slower in finer-grained sediments and saline soils. The several geological models are presented to substantiate the processes of natural hydrate formation in permafrost at negative temperatures.
1. Introduction
Gas hydrates are metastable ice-like solid compounds that form from water and gas under certain thermobaric conditions [1,2,3,4] and can exist naturally at both positive and negative temperatures in marine bottom sediments and in permafrost.
Gas hydrates can form in permafrost as it stores large amounts of natural gas and provides conditions for hydrate formation. The occurrence of gas in permafrost has been largely reported from oil and gas fields in West Siberia since the 1970s [5,6,7]. Under the conditions of long-period ground temperature variations and long-term cooling of the lithosphere at the equilibrium pressure, gas in permafrost falls in the zone of hydrate stability (GHSZ) and partially converts to hydrate [2,5,6,8,9].
Perennial freezing may lead to cryogenic concentration (expulsion of gas during the crystallization of water) of fluids and expulsion of gas which becomes accumulated in porous reservoirs sealed by low-permeable rocks [9,10,11]. Further freezing of gas pockets may lead to pressure excess above the equilibrium and to conversion of gas to hydrate. Gas hydrate formation is also possible upon freezing of gas-saturated closed sublake taliks in permafrost [2,12,13,14].
In addition to cryogenic concentration, the above-equilibrium pressure required for the formation of pore gas hydrates in permafrost may result from loading by ice during glaciations or by water during transgression of the Arctic seas [15]. The existence of an ice cover upon permafrost extends the zone of hydrate stability, both upward to the ground surface and downward to beneath the permafrost.
Gas hydrates can exist either within or below the permafrost, at low positive or negative temperatures, respectively. Subpermafrost gas hydrates have been better studied to date. They are known from the Mackenzie Delta, Canada (Mallik methane hydrate reservoir) [16,17], Prudhoe Bay in northern Alaska [18], tundra in the southern Qilian Mountains (Qinghai Province) and Mohe region in northernmost China, from Tibet, etc. [19,20,21]. The first reports of permafrost-hosted gas hydrates in Russia were from northern West Siberia, the Markha gas field (1963), and from the Messoyakha gas-condensate field put into operation in 1969 [2,22]; clathrate gas in the Messoyakha field makes up at least 5% [6,23,24,25].
There is almost no explicit evidence of natural gas hydrates in permafrost. The reason is that they share much physical similarity with ice and are hard to identify and study with conventional geophysical methods (mainly seismic reflection profiling), while special drilling and coring of hydrate-bearing permafrost has been limited [26]. Recovery of hydrate-bearing cores was reported from northern territories of Canada (Mackenzie Delta, Taglu gas field) [27] and from the Olenek mouth in northern Central Siberia [28].
Relict gas hydrates in permafrost were found within 150–200 m depths. They formed under favorable conditions in the past and have survived till nowadays due to self-preservation (anomalous preservation) at negative temperatures [26,29,30,31,32].
In general, the formation of gas hydrates has an influence on temperature patterns, mechanic strength and permeability of permafrost [33,34,35].
The possibility of gas hydrate formation in freezing and frozen rocks was shown in References [2,36,37]. Nevertheless, the mechanisms of their formation at negative temperatures remain poorly understood. In this respect, special experimental research is required to shed light on the kinetics of gas hydrate accumulation in freezing and frozen rocks, as well as on its different controls.
Most of the existing publications focus on ice-to-hydrate conversion in free space, while pore hydrates in rocks at negative temperatures have been the subject of few experimental studies. The available results show that conversion of pore ice to hydrate is quite rapid at <0 °C [32,38,39,40,41,42].
We consider the accumulation of pore gas hydrates in frozen sediments as controlled by different factors on the basis of experimental results.
2. Materials and Methods
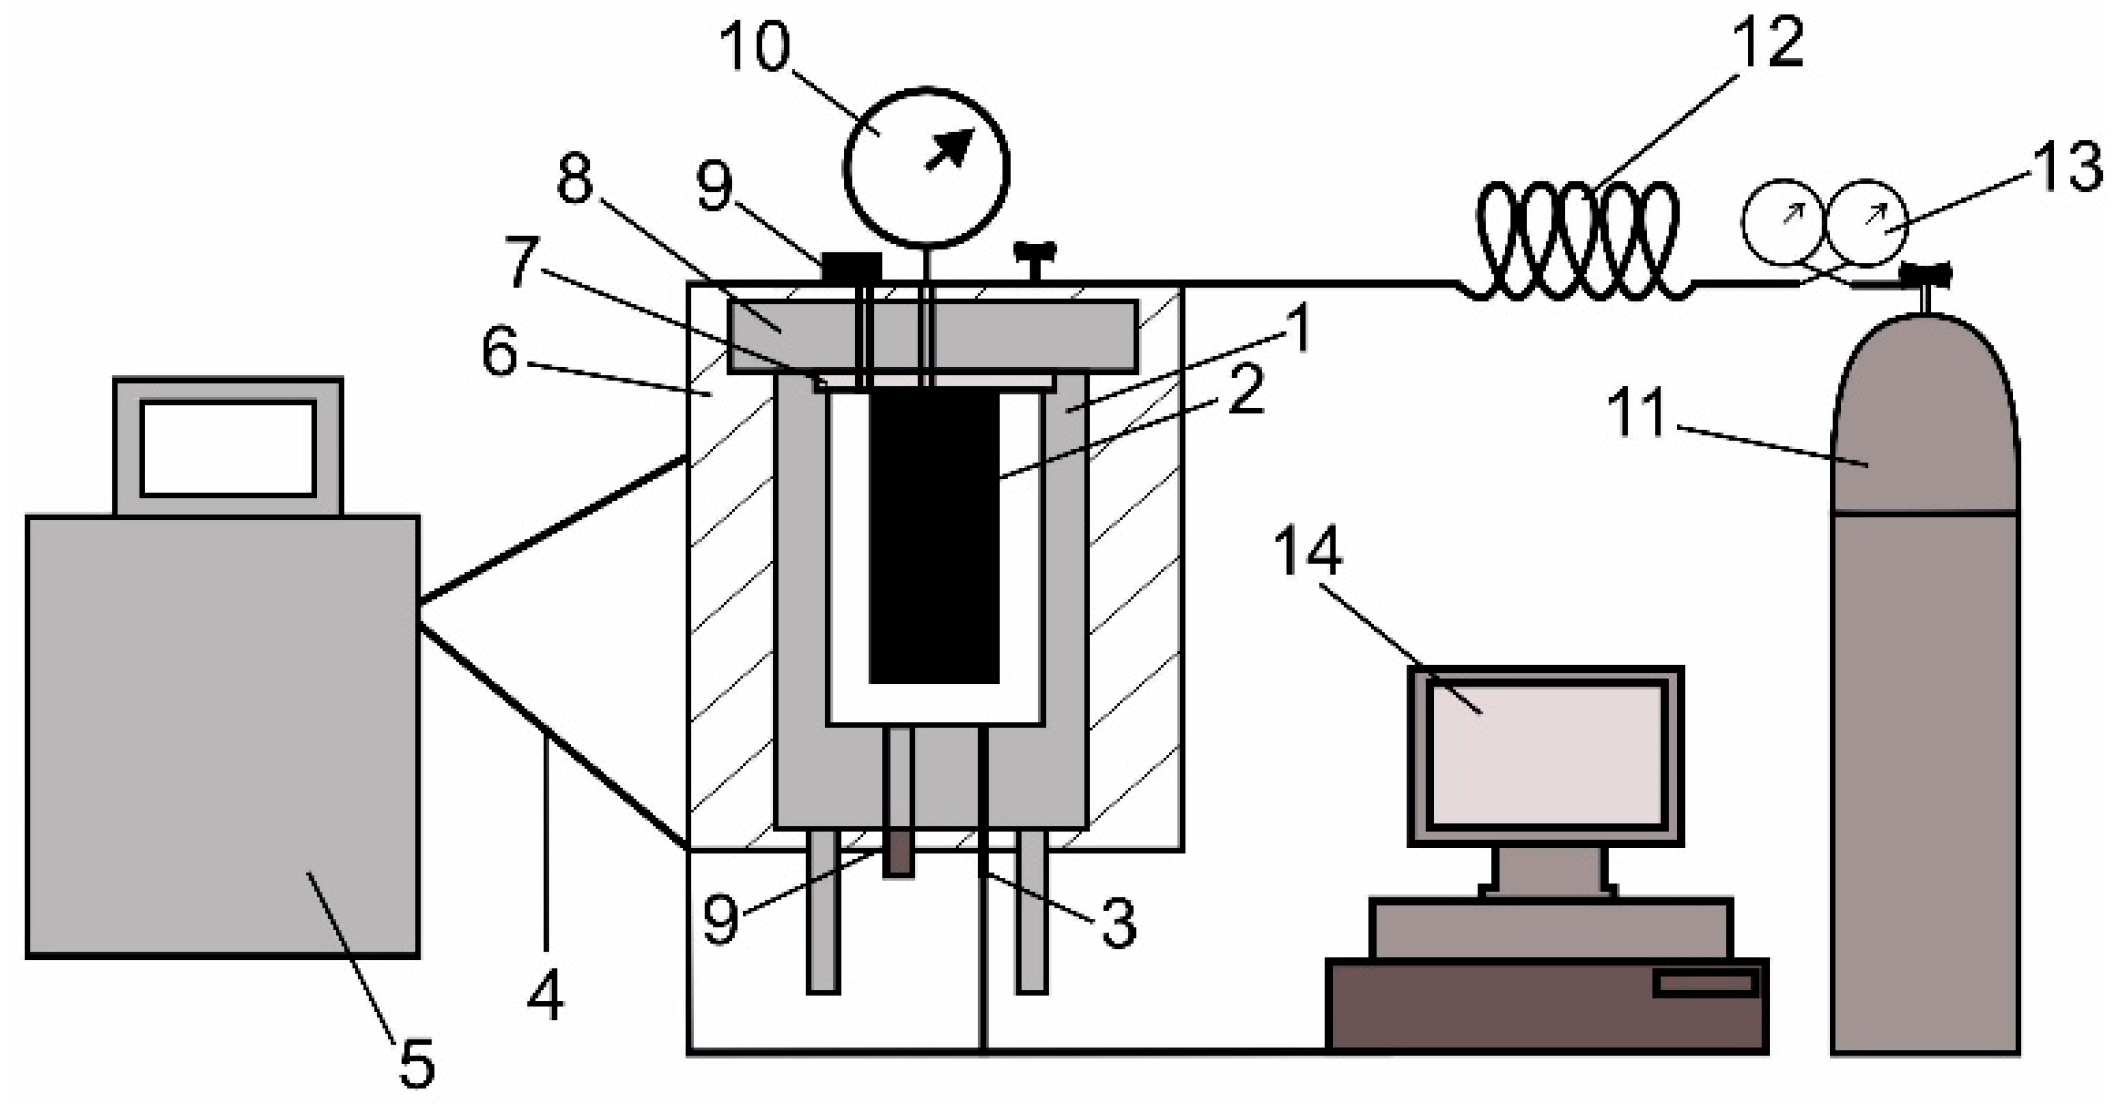
The processes of pore hydrate formation in freezing and frozen sediments was modeled in a laboratory on a specially designed system (working volume ~420 cm3) consisting of a pressure cell which accommodates a metal container with samples; a refrigerated circulator for maintaining the required temperature in the pressure cell; an analog-digital converter (ADC); a PC for recording data on pressure and temperature changes in the samples (Figure 1) [41,42]. The temperature regime was maintained to an accuracy of 0.05 °C by circulation of liquid (antifreeze Siberia G12) from the HAAKE Phoenix C40P refrigerated bath along the “thermal coat” around the pressure cell. Temperature and pressure in the cell were accurate to 0.05 °C and 0.005 MPa, respectively.
Samples prepared from air-dry soils with prespecified water contents were placed into the pressure cell which was tightly sealed, vacuumed and filled with hydrate-forming gas. To achieve the initial water content, soil was mixed with distilled water and left for 30 min at room temperature. Thus, prepared wet soil was compacted layer-by-layer in a cylindrical container (10 cm high and 4.6 cm in diameter) and placed into the pressure cell [42,43].
The pressure cell with the samples was frozen to −8 °C and then saturated with cold gas to a pressure below hydrate formation (1‒1.5 MPa). After that, the constant negative temperature of the experiment was established in the range of −2‒8 °C.
Then, the cold gas pressure increased to the initial pressure (above equilibrium) in the experiment (4‒6 MPa), corresponding to the pressure in the permafrost at depths of more than 300 m specific to a number of the north regions of Western Siberia. Pure methane (99.98% CH4) was used as a hydrate-forming gas. After the pressure had been set up, the temperature in the cell was maintained constant at <0 °C. Monitoring of pressure and temperature in the sample was carried out during the entire experiment.
The samples used for modeling were natural sand and silt (Table 1). The constituent minerals were identified by X-Ray diffractometry; the particle size distribution (Table 2) and physical properties of the samples were determined following the standard procedures [44,45,46]. The properties of sand samples varied from: 12 to 15% water content (W); 1.79 to 1.82 g/cm3 density; 39 to 41% porosity; and 56 to 63% ice saturation (Si). The respective ranges for silt were: 14 to 29% water content; 1.37 to 1.75 g/cm3 density; 39 to 60% porosity; and 57 to 85% ice saturation. The freezing temperatures were −0.1 °C for sand 1 and sand 2; −0.2 °C for silt 1; −0.9 °C for saline silt 2, and −1.4 °C for silt 3.
The phase transition parameters in gas saturated soil samples can be inferred from pressure and temperature variations in the test cell [43,48,49,50]. This data was used to calculate the parameters at any time during the experiment. Pressure-volume-temperature (PVT) analysis was applied to estimate the rate of pore hydrate accumulation directly in the pressure cell at constant temperatures due to pressure change. For this, the consumption of methane (Δ) was calculated as
where —pressure at a point in time τi (MPa), —reduced volume of the pressure chamber (cm3), —methane molar mass (16 g/mol), —universal gas constant (N·m/K·mol), —temperature at a point in time τi (K), and —compressibility factor which was calculated by equation of state for methane [51]. Slight changes in during the same experiment were neglected.
Based on the consumption of methane during hydrate formation, the weight of pore gas hydrate (Mh, g) was calculated assuming a hydrate number of 5.9 for CH4 as
The volume content of hydrate (H, %) at each point in time was found as
where Ms is the weight of soil sample (g); is the sample density (g/cm3); is the crystallographic density of an empty square lattice (without gas molecules by analogy with the pure ice structure); and for CH4 was assumed to be 0.794 g/cm3 [34].
Hydrate saturation or percentage of pore space filled with hydrate (Sh, %) is inferred from the volume content of hydrate as
where n is the sample porosity (u.f.) as
where —solid particles density (g/cm3) and —dry unit weight (g/cm3) [45].
Ice saturation or percentage of pore space filled with ice (Si, %) as
The fraction of water converted to hydrate or the hydrate coefficient (Kh, u.f.) is given by
where is the percentage of water converted to hydrate (% of dry sample weight) calculated assuming a hydrate number of 5.9 for CH4 and W is the total amount of moisture (initial water content, %).
3. Results and Discussion
3.1. Mechanism and Kinetics of Pore Hydrate Formation at Negative Temperatures
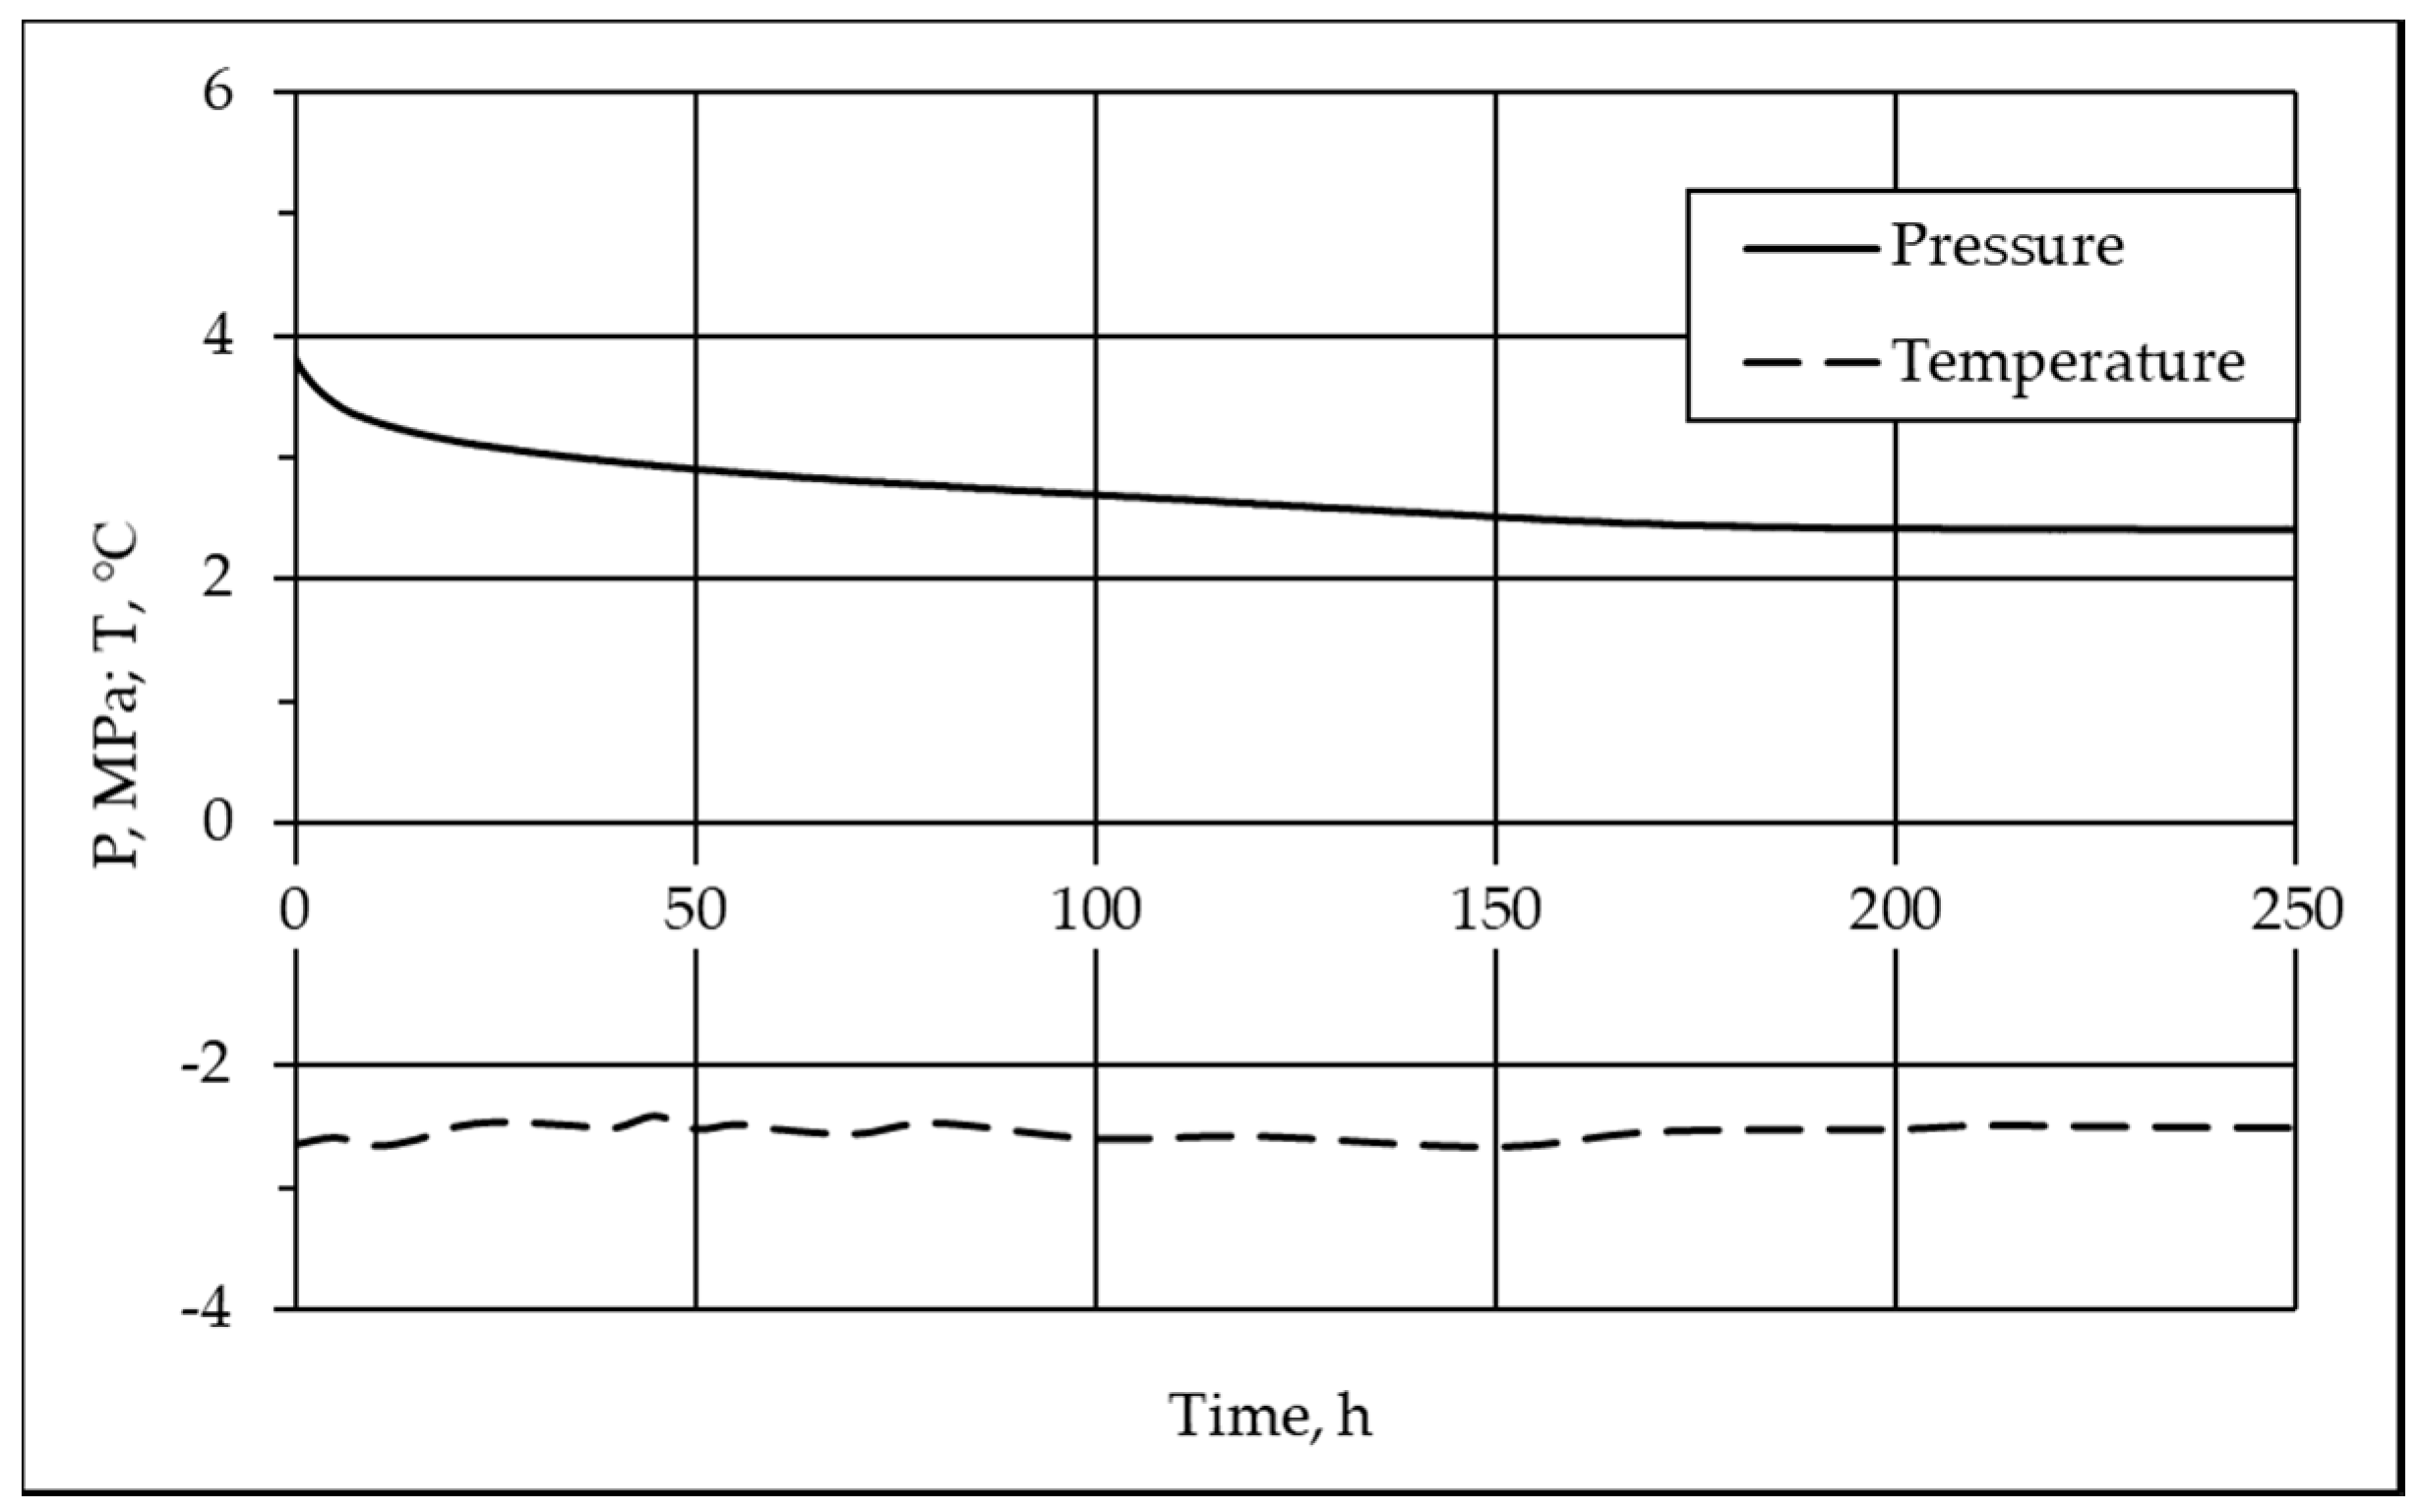
Figure 2 shows a typical curve of time-dependent change in pressure during methane hydrate formation at a constant negative temperature (−2.5 °C) in silt 2 with the initial water content (W = 20%).
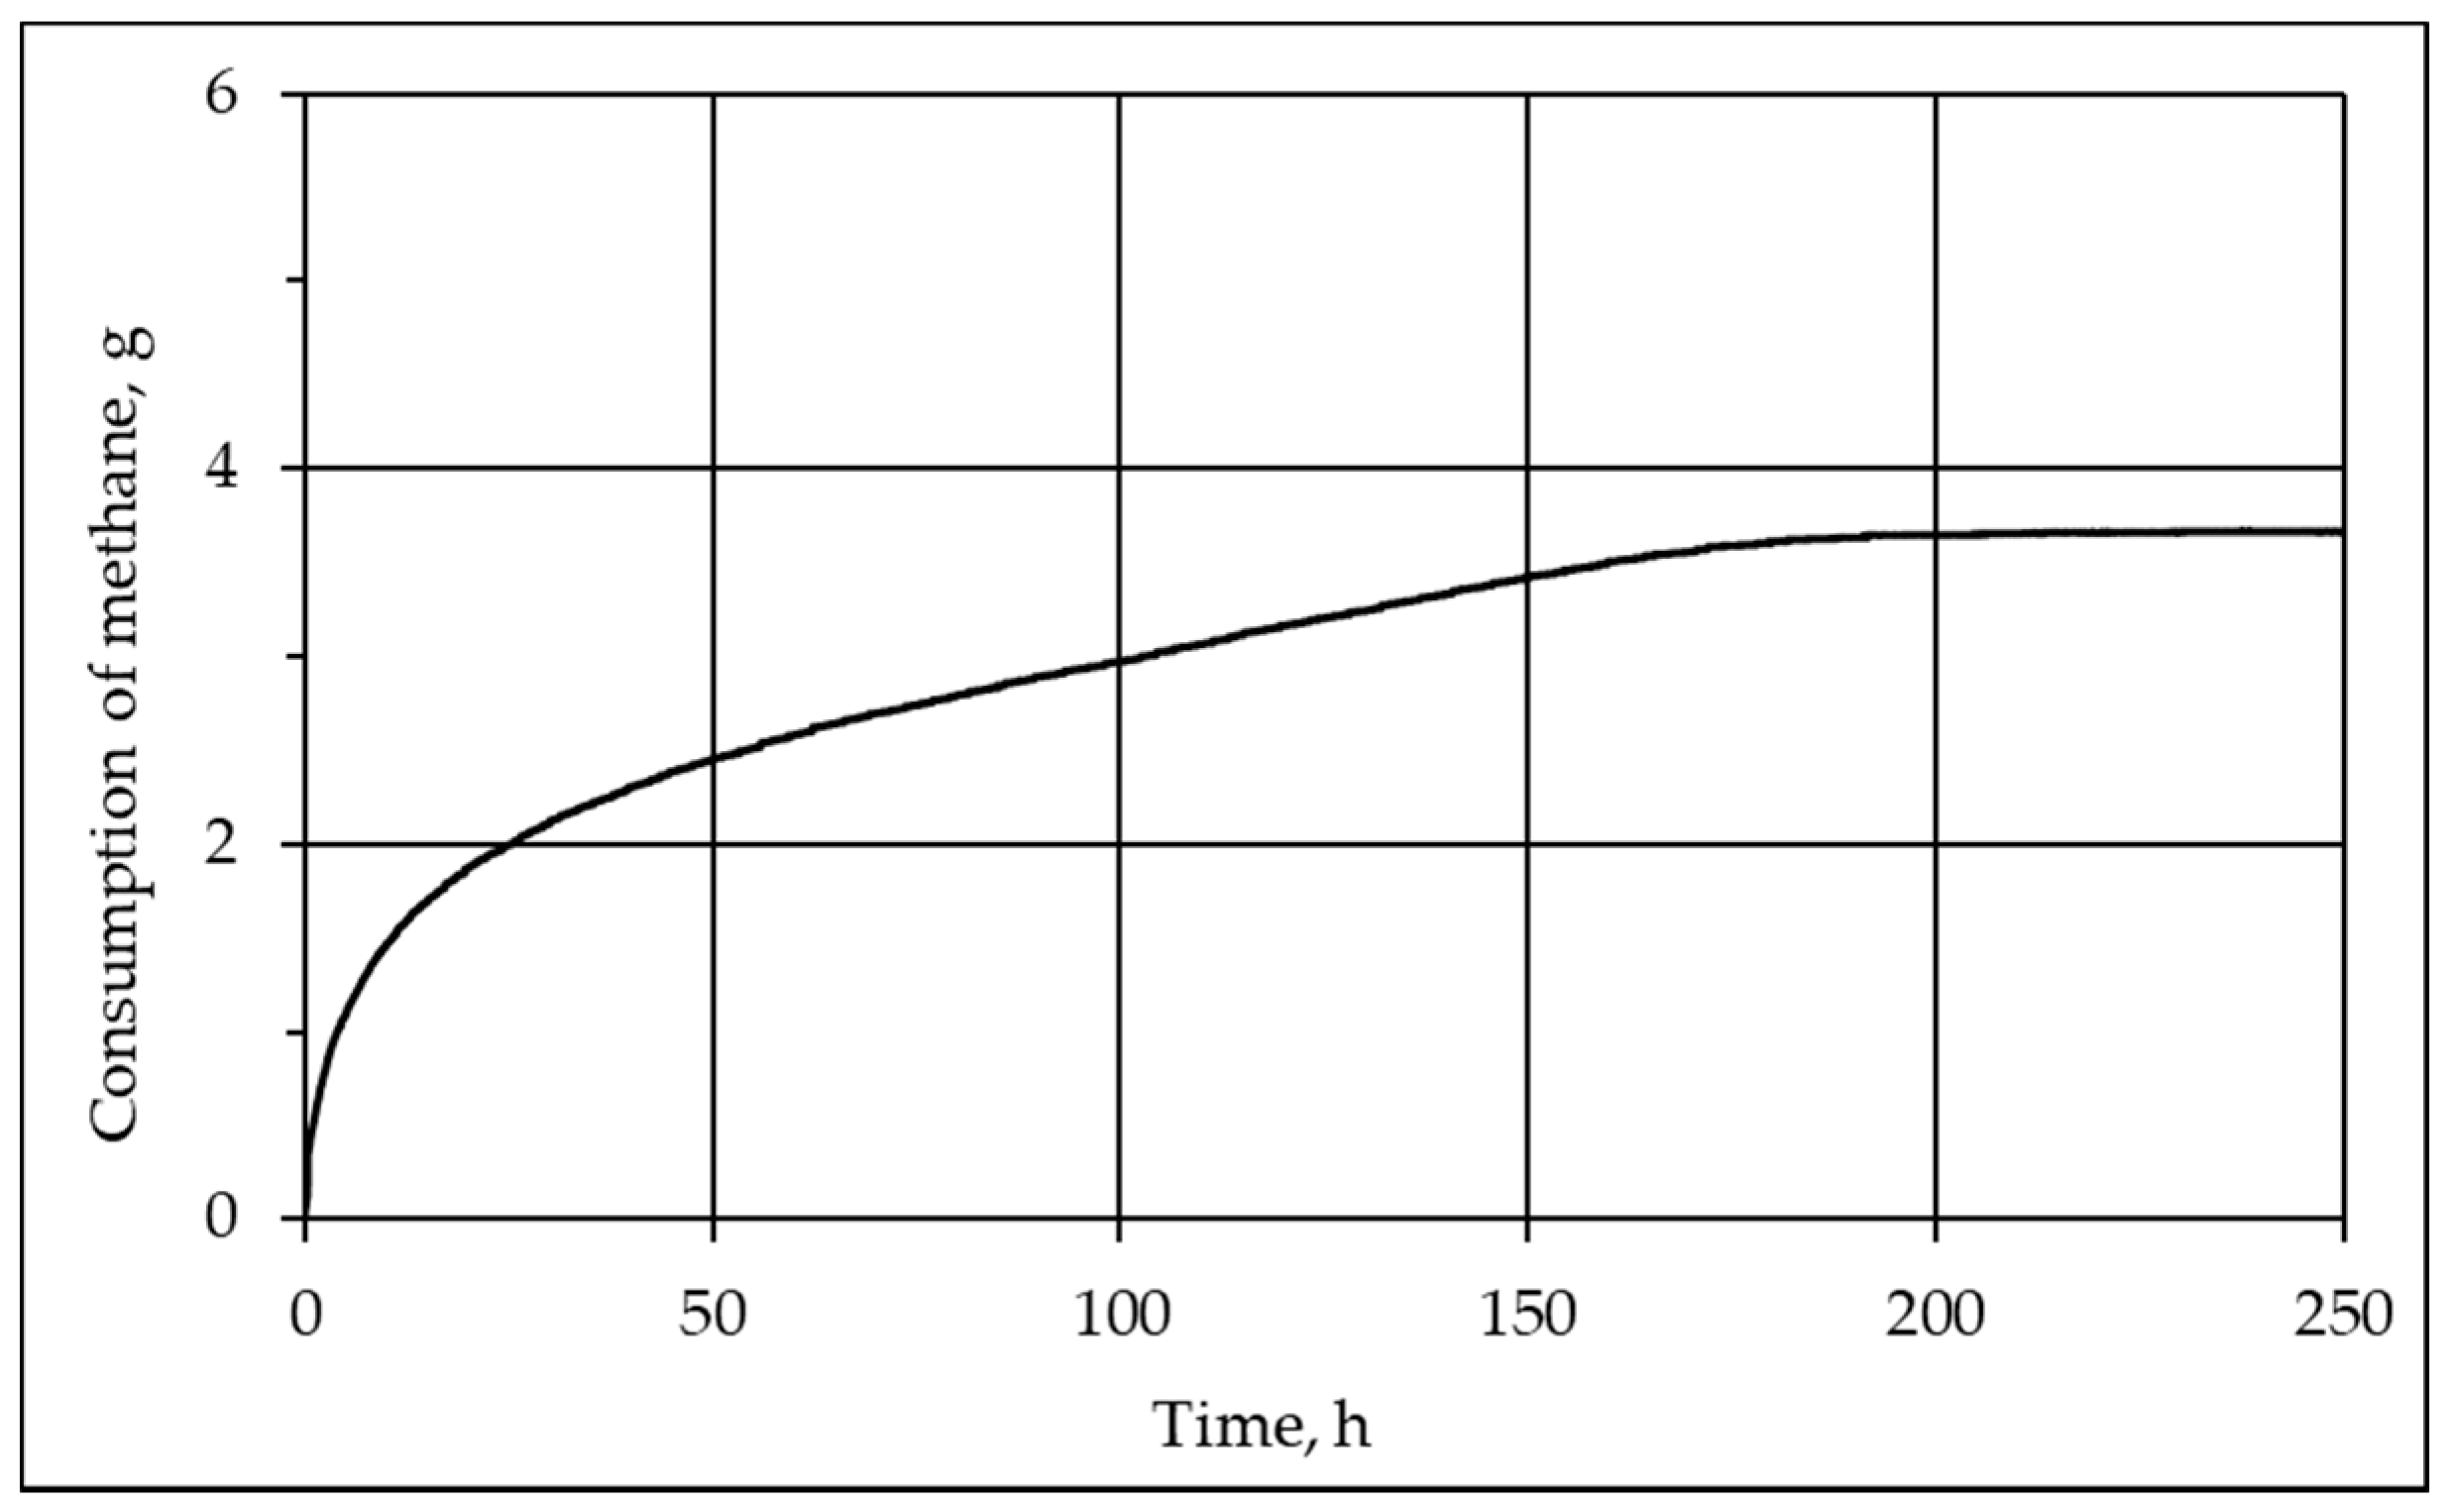
Based on this data in Equation (1), the consumption of methane during the hydrate formation was calculated (Figure 3).
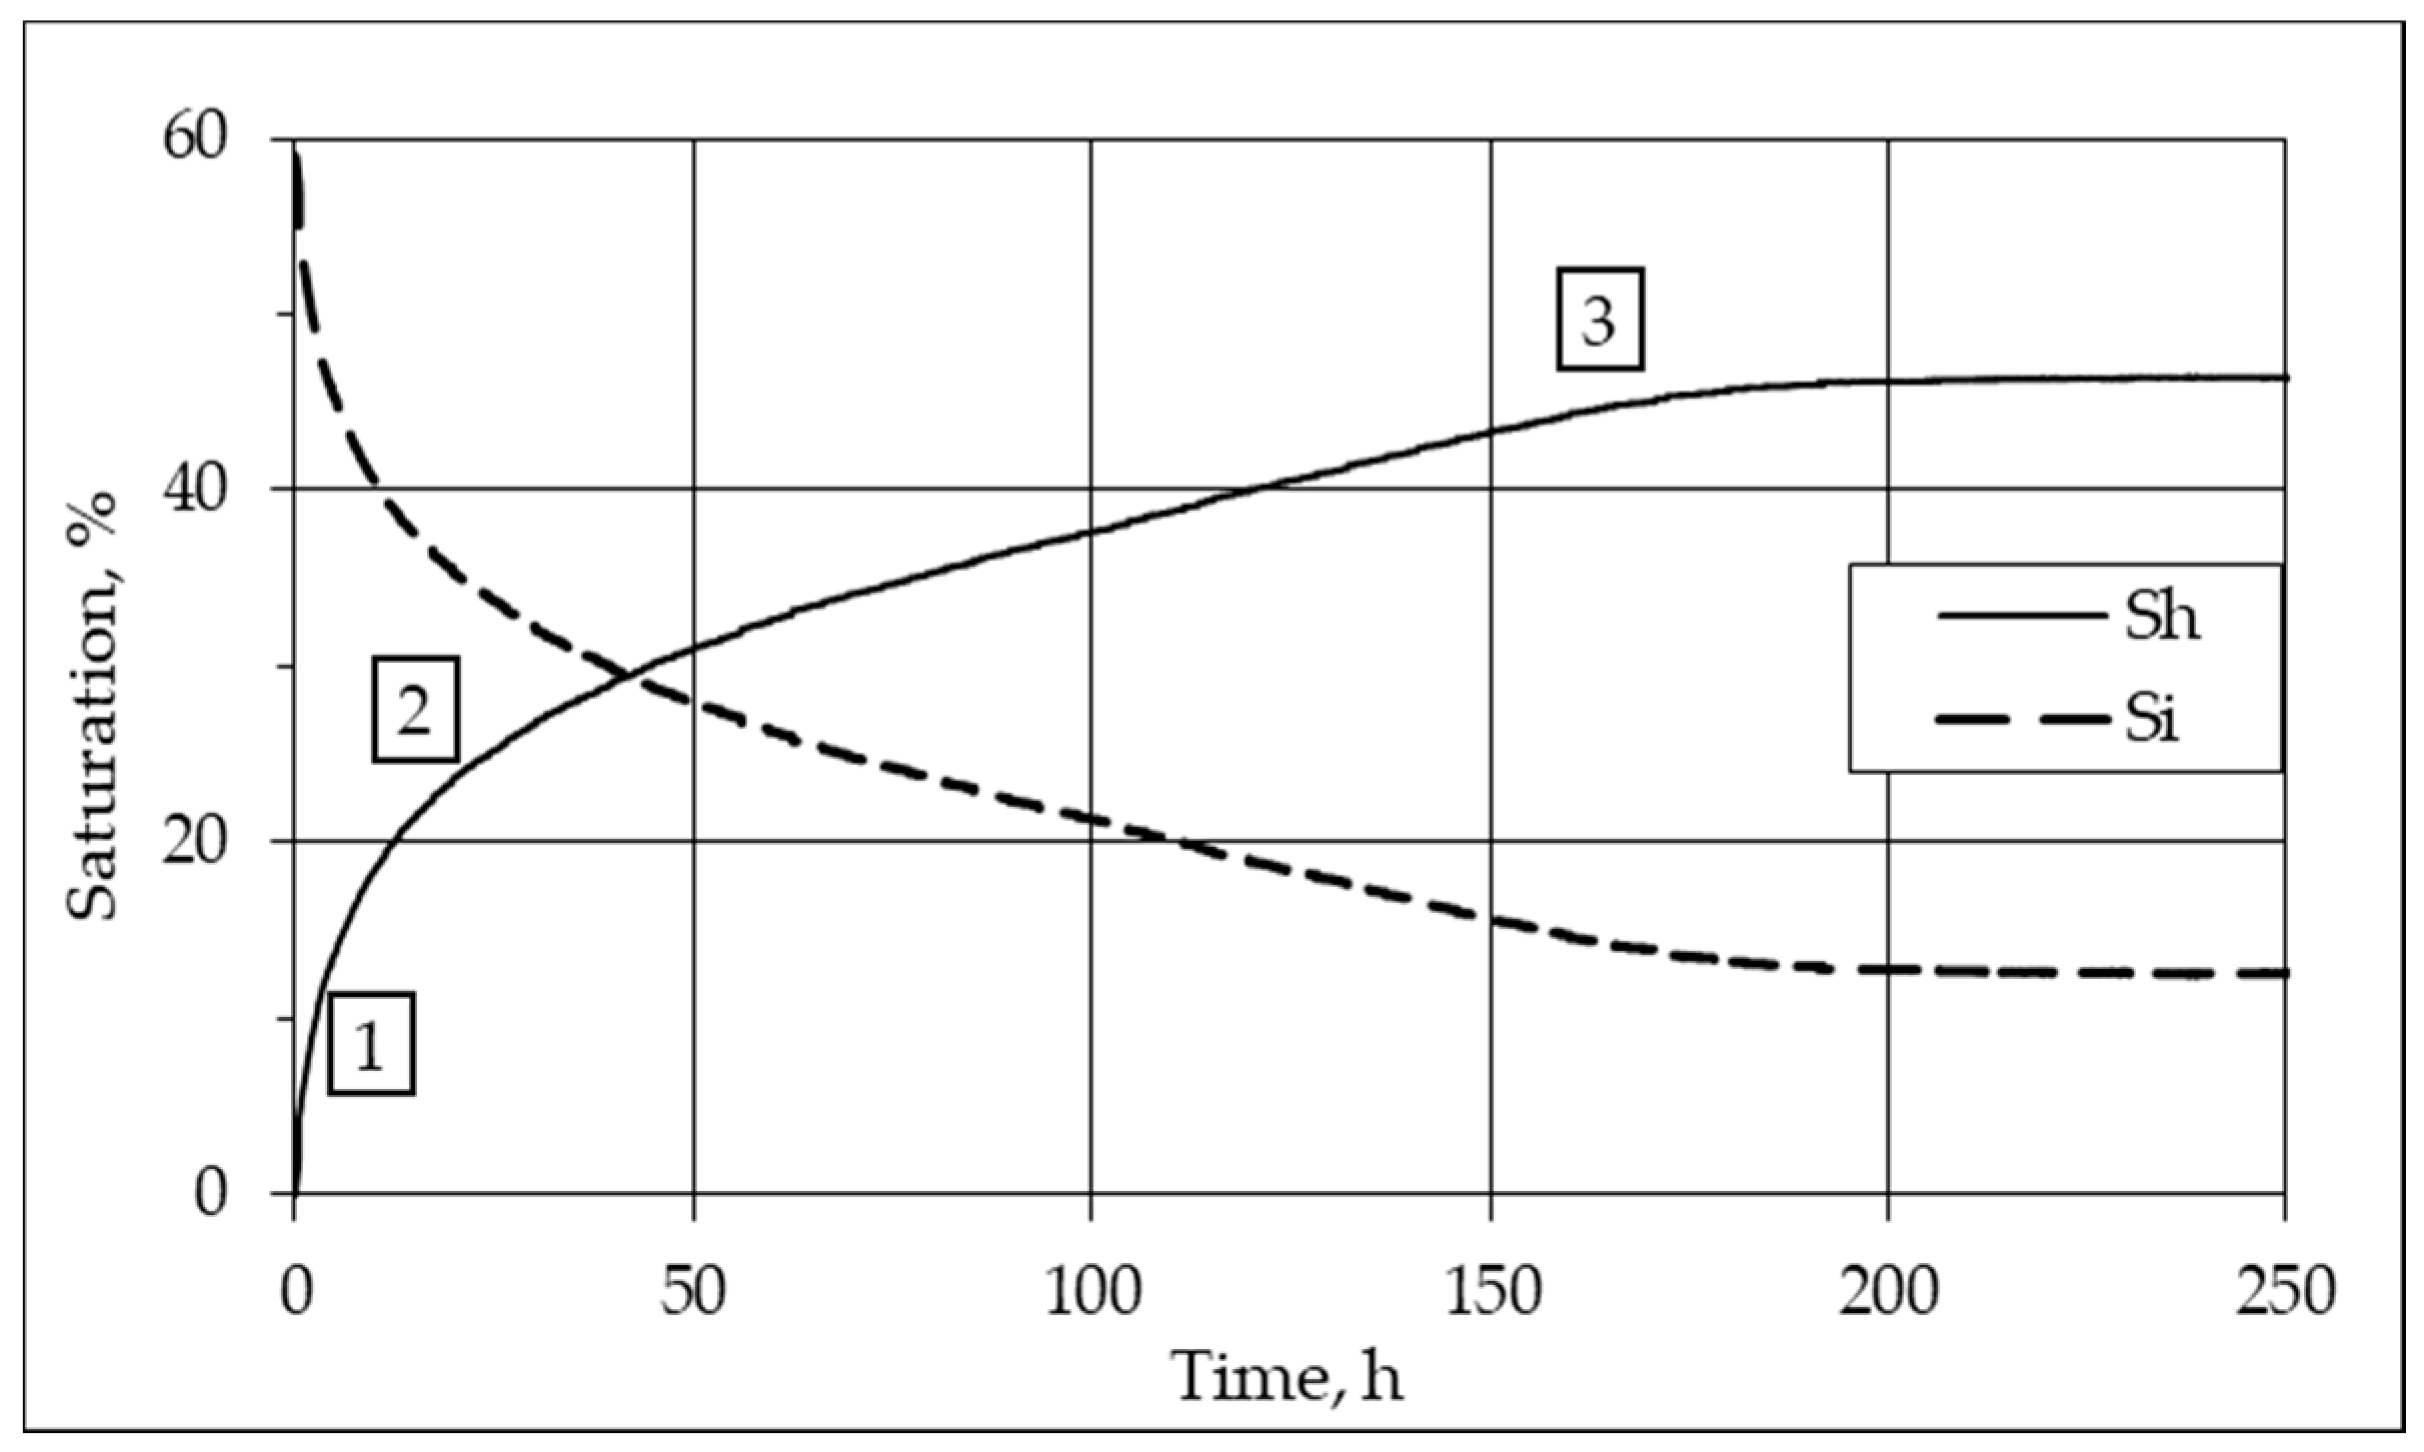
The results on the kinetics of methane consumption were further used to obtain the parameters of hydrate accumulation (Sh, Kh). The kinetics of change of pore fluids (ice and hydrate) presented as the typical curves of time-dependent hydrate and ice saturations (Sh and Si, respectively) (Figure 4). The Sh curve comprises of three segments (Figure 4): A segment corresponding to the most rapid (first 3 h) hydrate formation (1), a slow-rate (to 50 h) transitional segment (2), and a decaying segment of the final hydrate-formation stage (3).
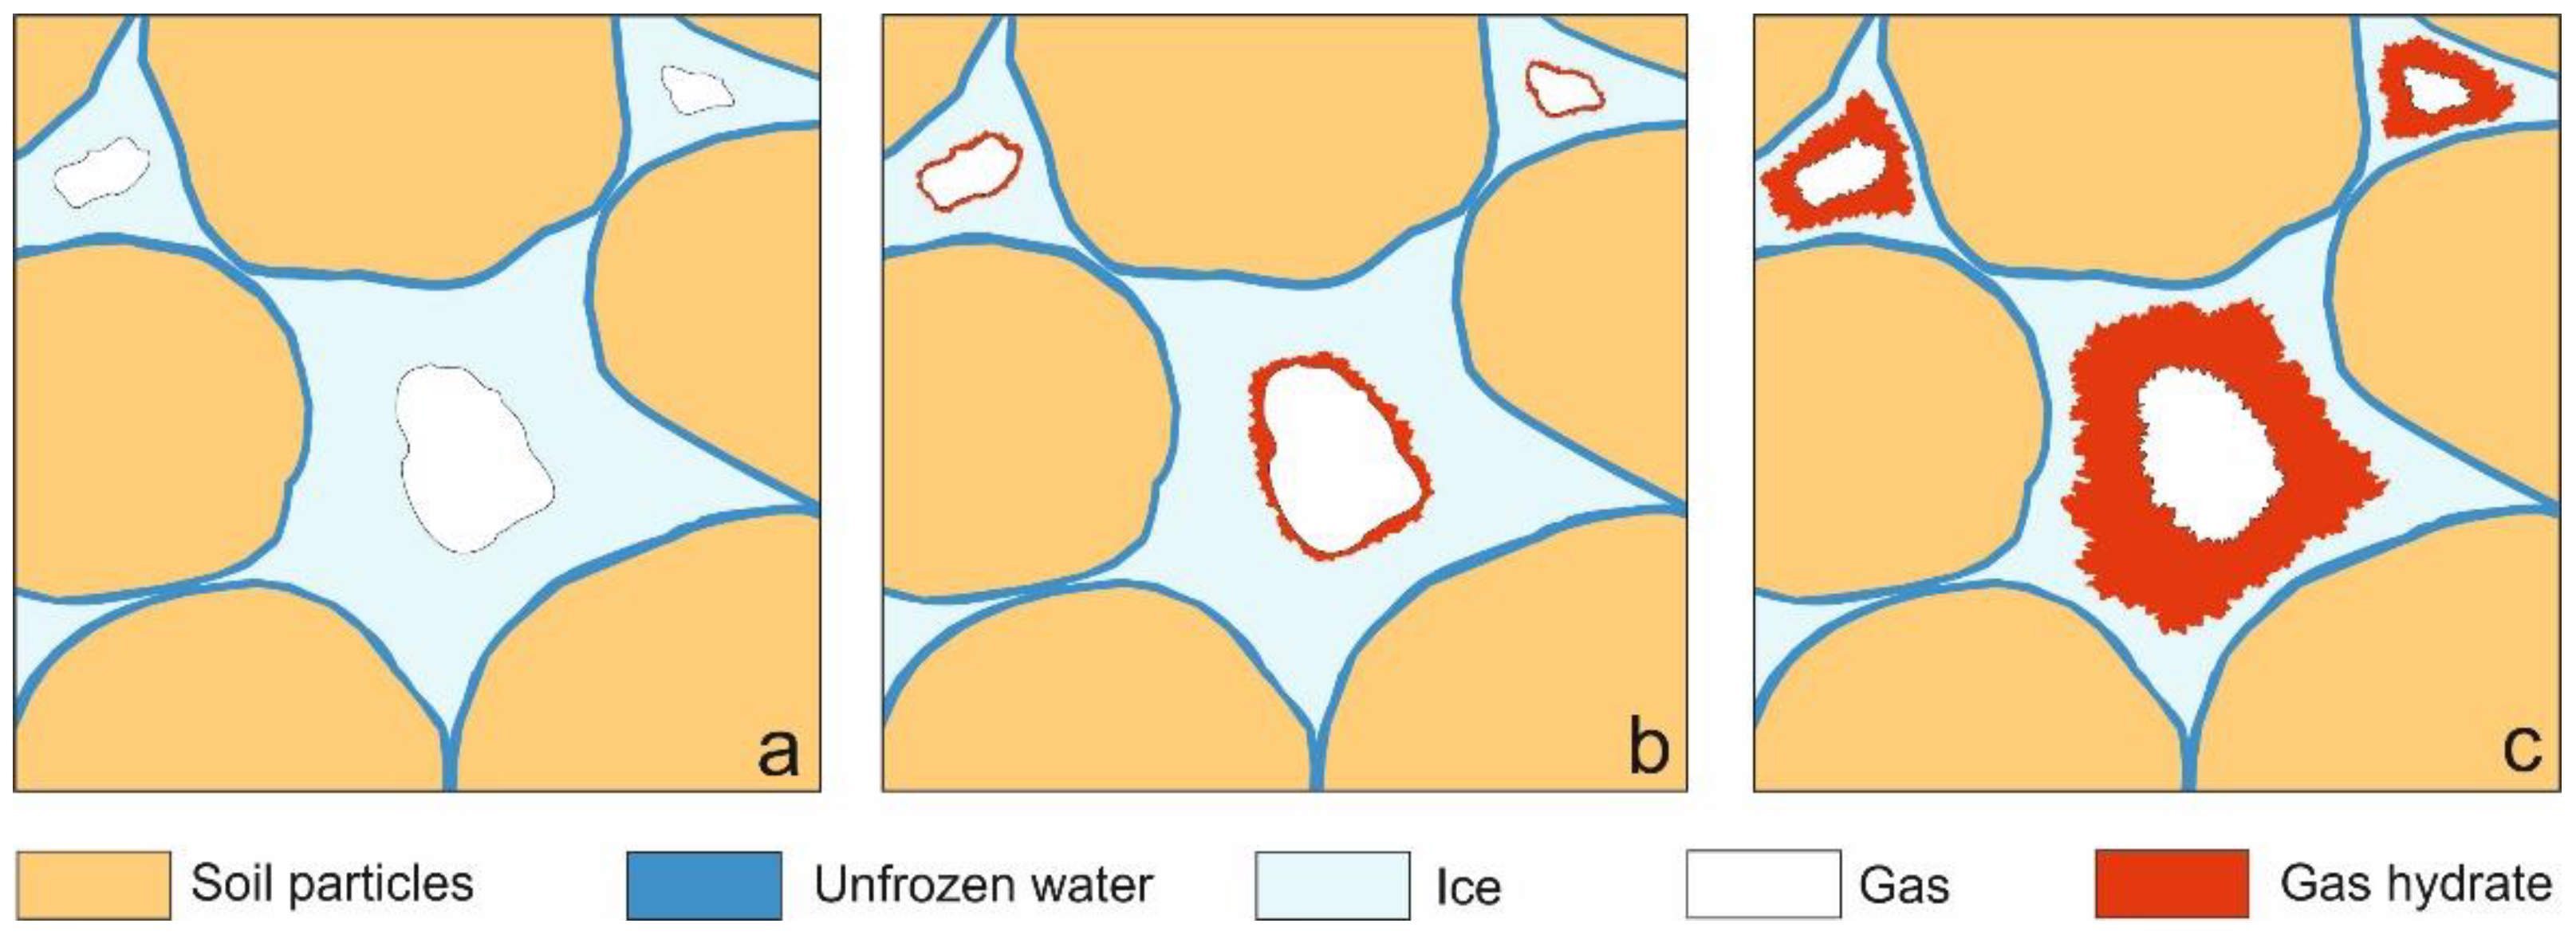
This kinetics of pore hydrate formation in frozen soil saturated with methane due to changes in the time of the mechanism of nucleation and growth of hydrate particles (Figure 5).
The process consists of three phases (Figure 5). As the P-T conditions of hydrate formation have been achieved (Figure 5a), hydrate particles form films over particles of pore ice at their contact with gas. The hydrate films block the gas–ice contacts (Figure 5b), while clathrate reaction predominates at the ice-hydrate interface. This reaction is maintained either by transport of gas molecules through the gas hydrate layer toward the ice-hydrate interface or by transport of water molecules from ice toward the outer hydrate–gas interface. Volumetric-diffusion hydrate formation at the final stage (Figure 5c) is limited by gas permeability of the gas hydrate layer on the pore ice surface [52,53,54,55].
3.2. Effect of Temperature
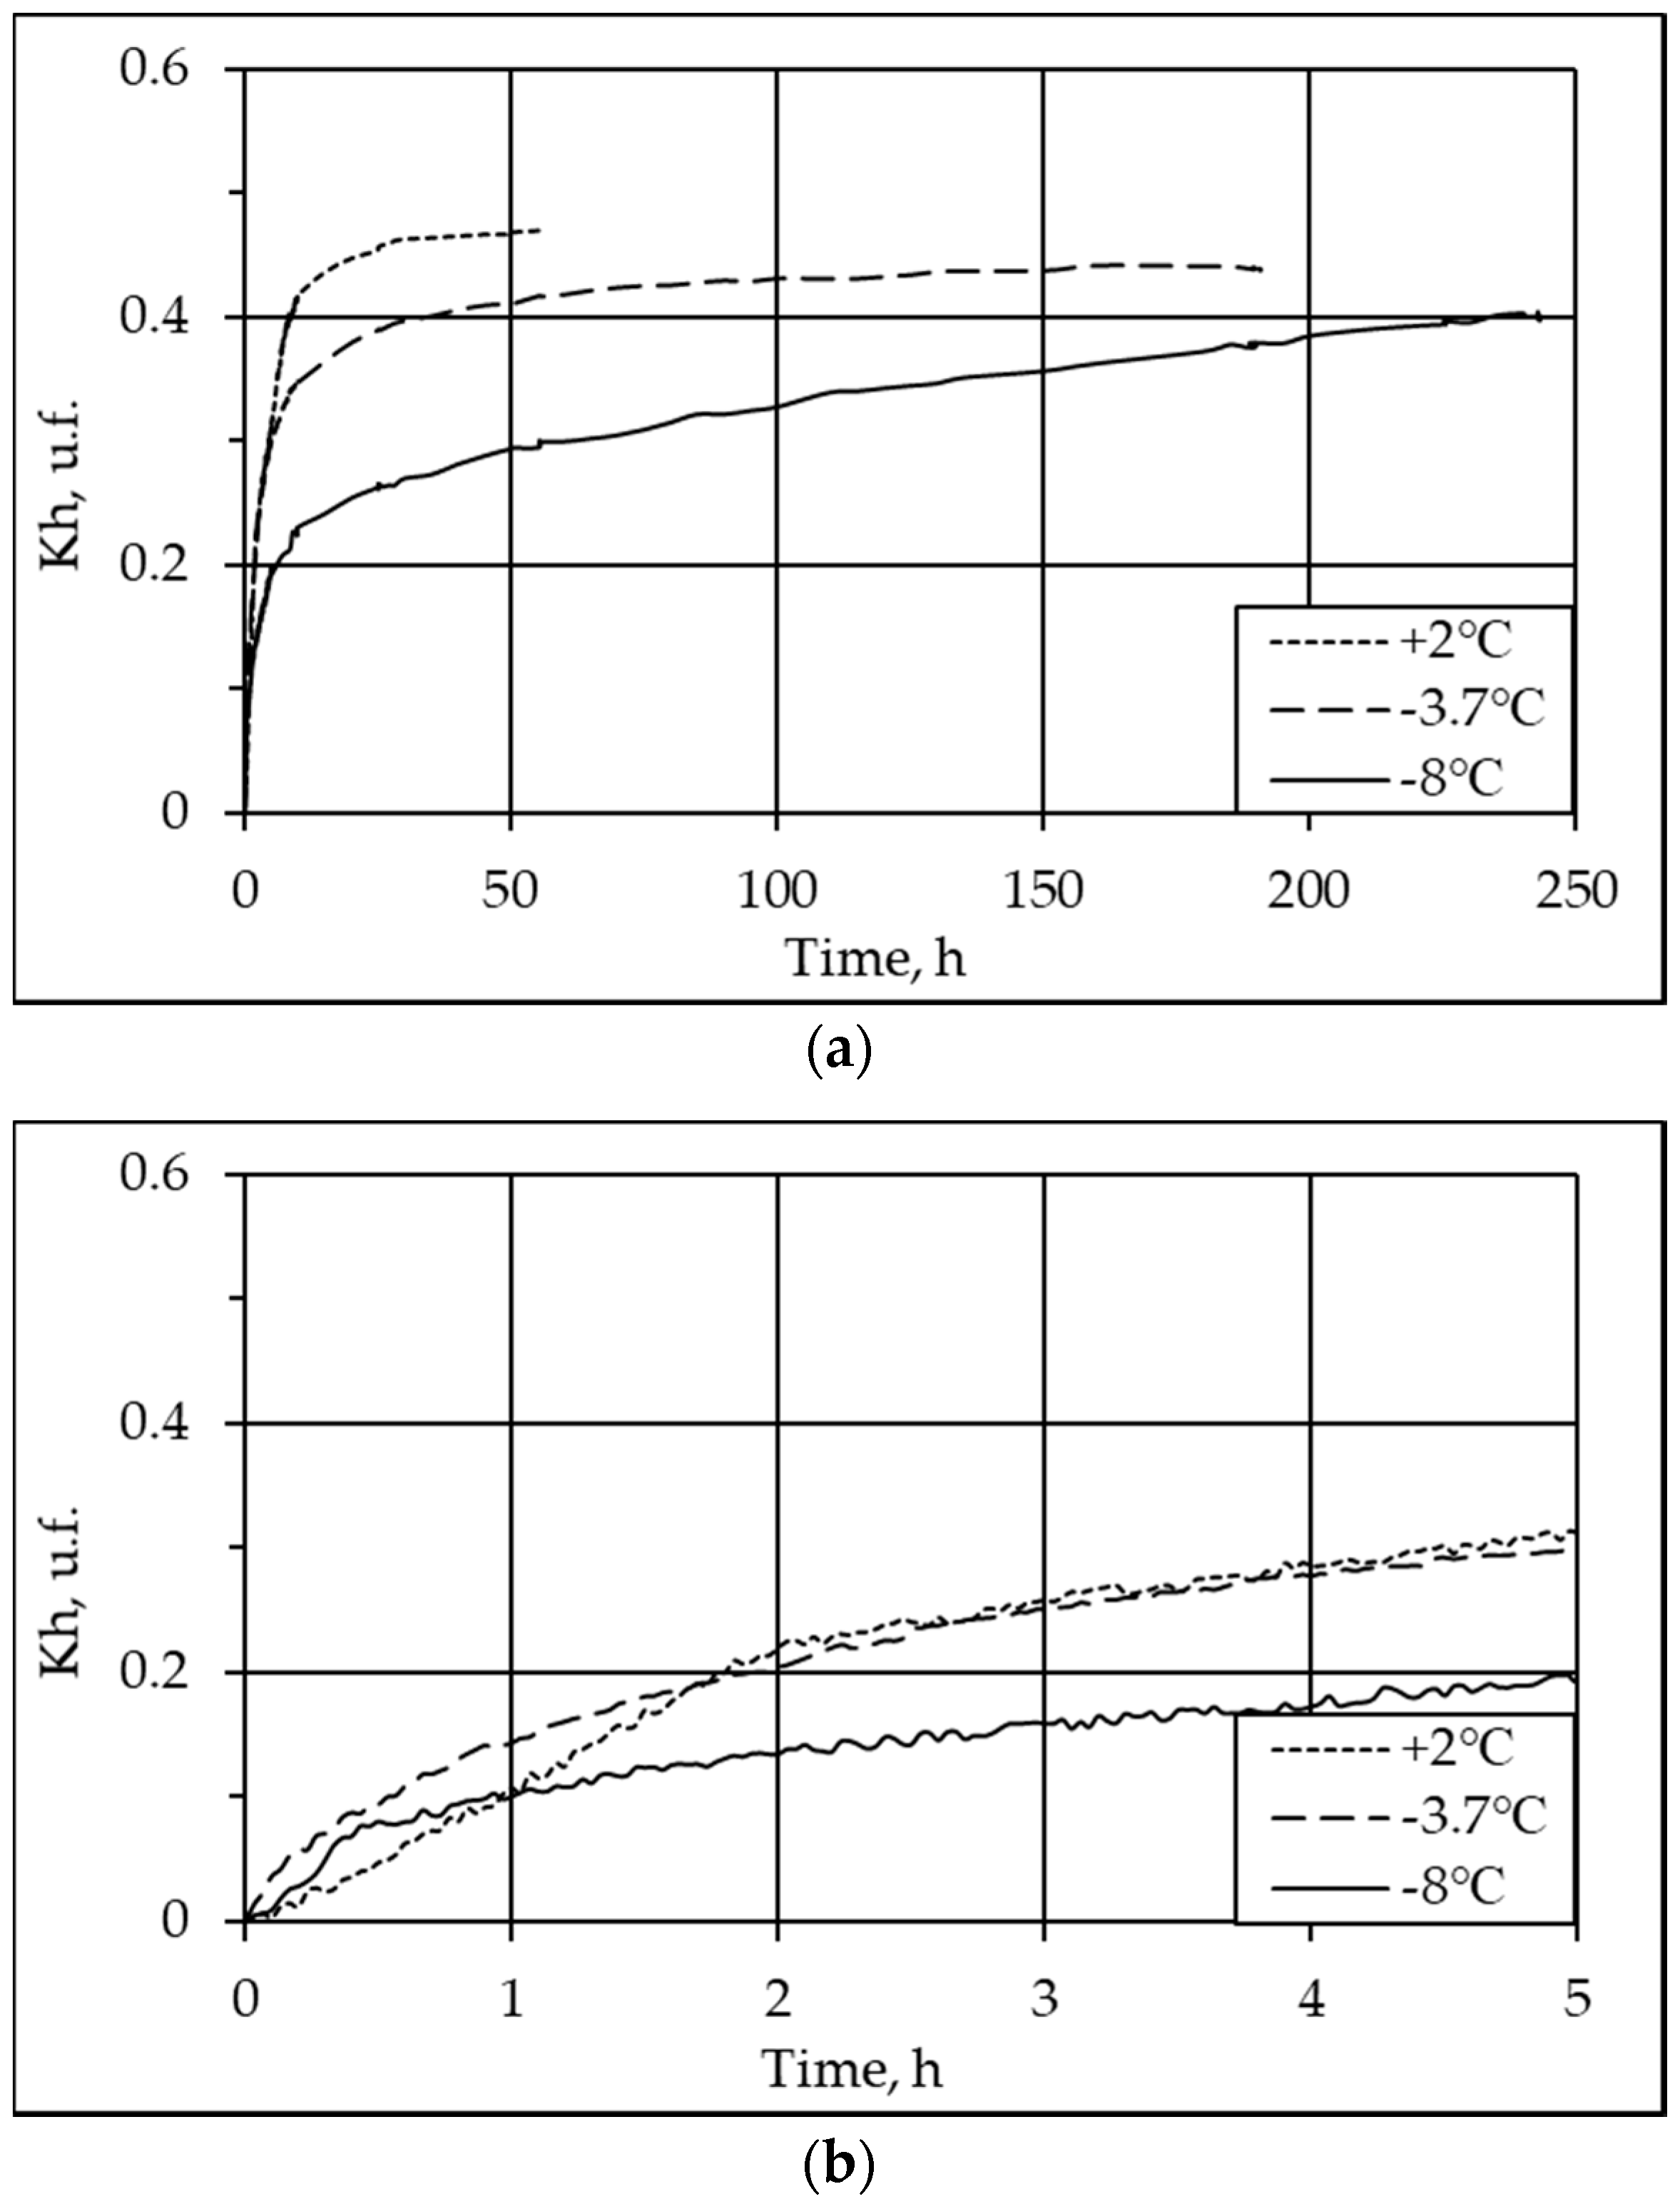
The effect of temperature on the pore hydrate formation in methane-saturated soils was studied in silt 1 with the initial water content W = 14% and the ice saturation Si ~ 69% (or water saturation about 63% at >0 °C), at the temperatures +2 °C, −3.7 °C and −8 °C. The methane pressure in the test cell was above the equilibrium value, the excess being ΔP = 2.9 MPa at −3.7 °C and 4.7 MPa at −8 °C. The fraction of water converted to hydrate (hydrate coefficient) changed with time as shown in Figure 6a,b.
Higher hydrate coefficients at <0 °C than at >0 °C in the first 30 min of the run duration (Figure 6b), at invariable pressure in the system, results from a higher gas pressure excess (ΔP) above the equilibrium at <0 °C. Then the hydrate formation at negative temperatures apparently slowed down because gas hydrates on the ice surface became less dense, which interfered with heat exchange.
At positive temperatures, the hydrate formation was slower as quite a dense hydrate film formed at the gas–water contact which reduced gas permeability [42,53,55]. Slower fading of hydrate formation at a colder temperature (−8 °C) compared to warmer temperatures may result from some features of the hydrate film microstructure, but it requires special investigation in the future. At colder temperatures, the frozen ground may be more strongly deformed and thus more permeable to gas during hydrate formation [56], or, the forming hydrate may expand the soil skeleton more and produce microcracks.
3.3. Effect of Gas Pressure
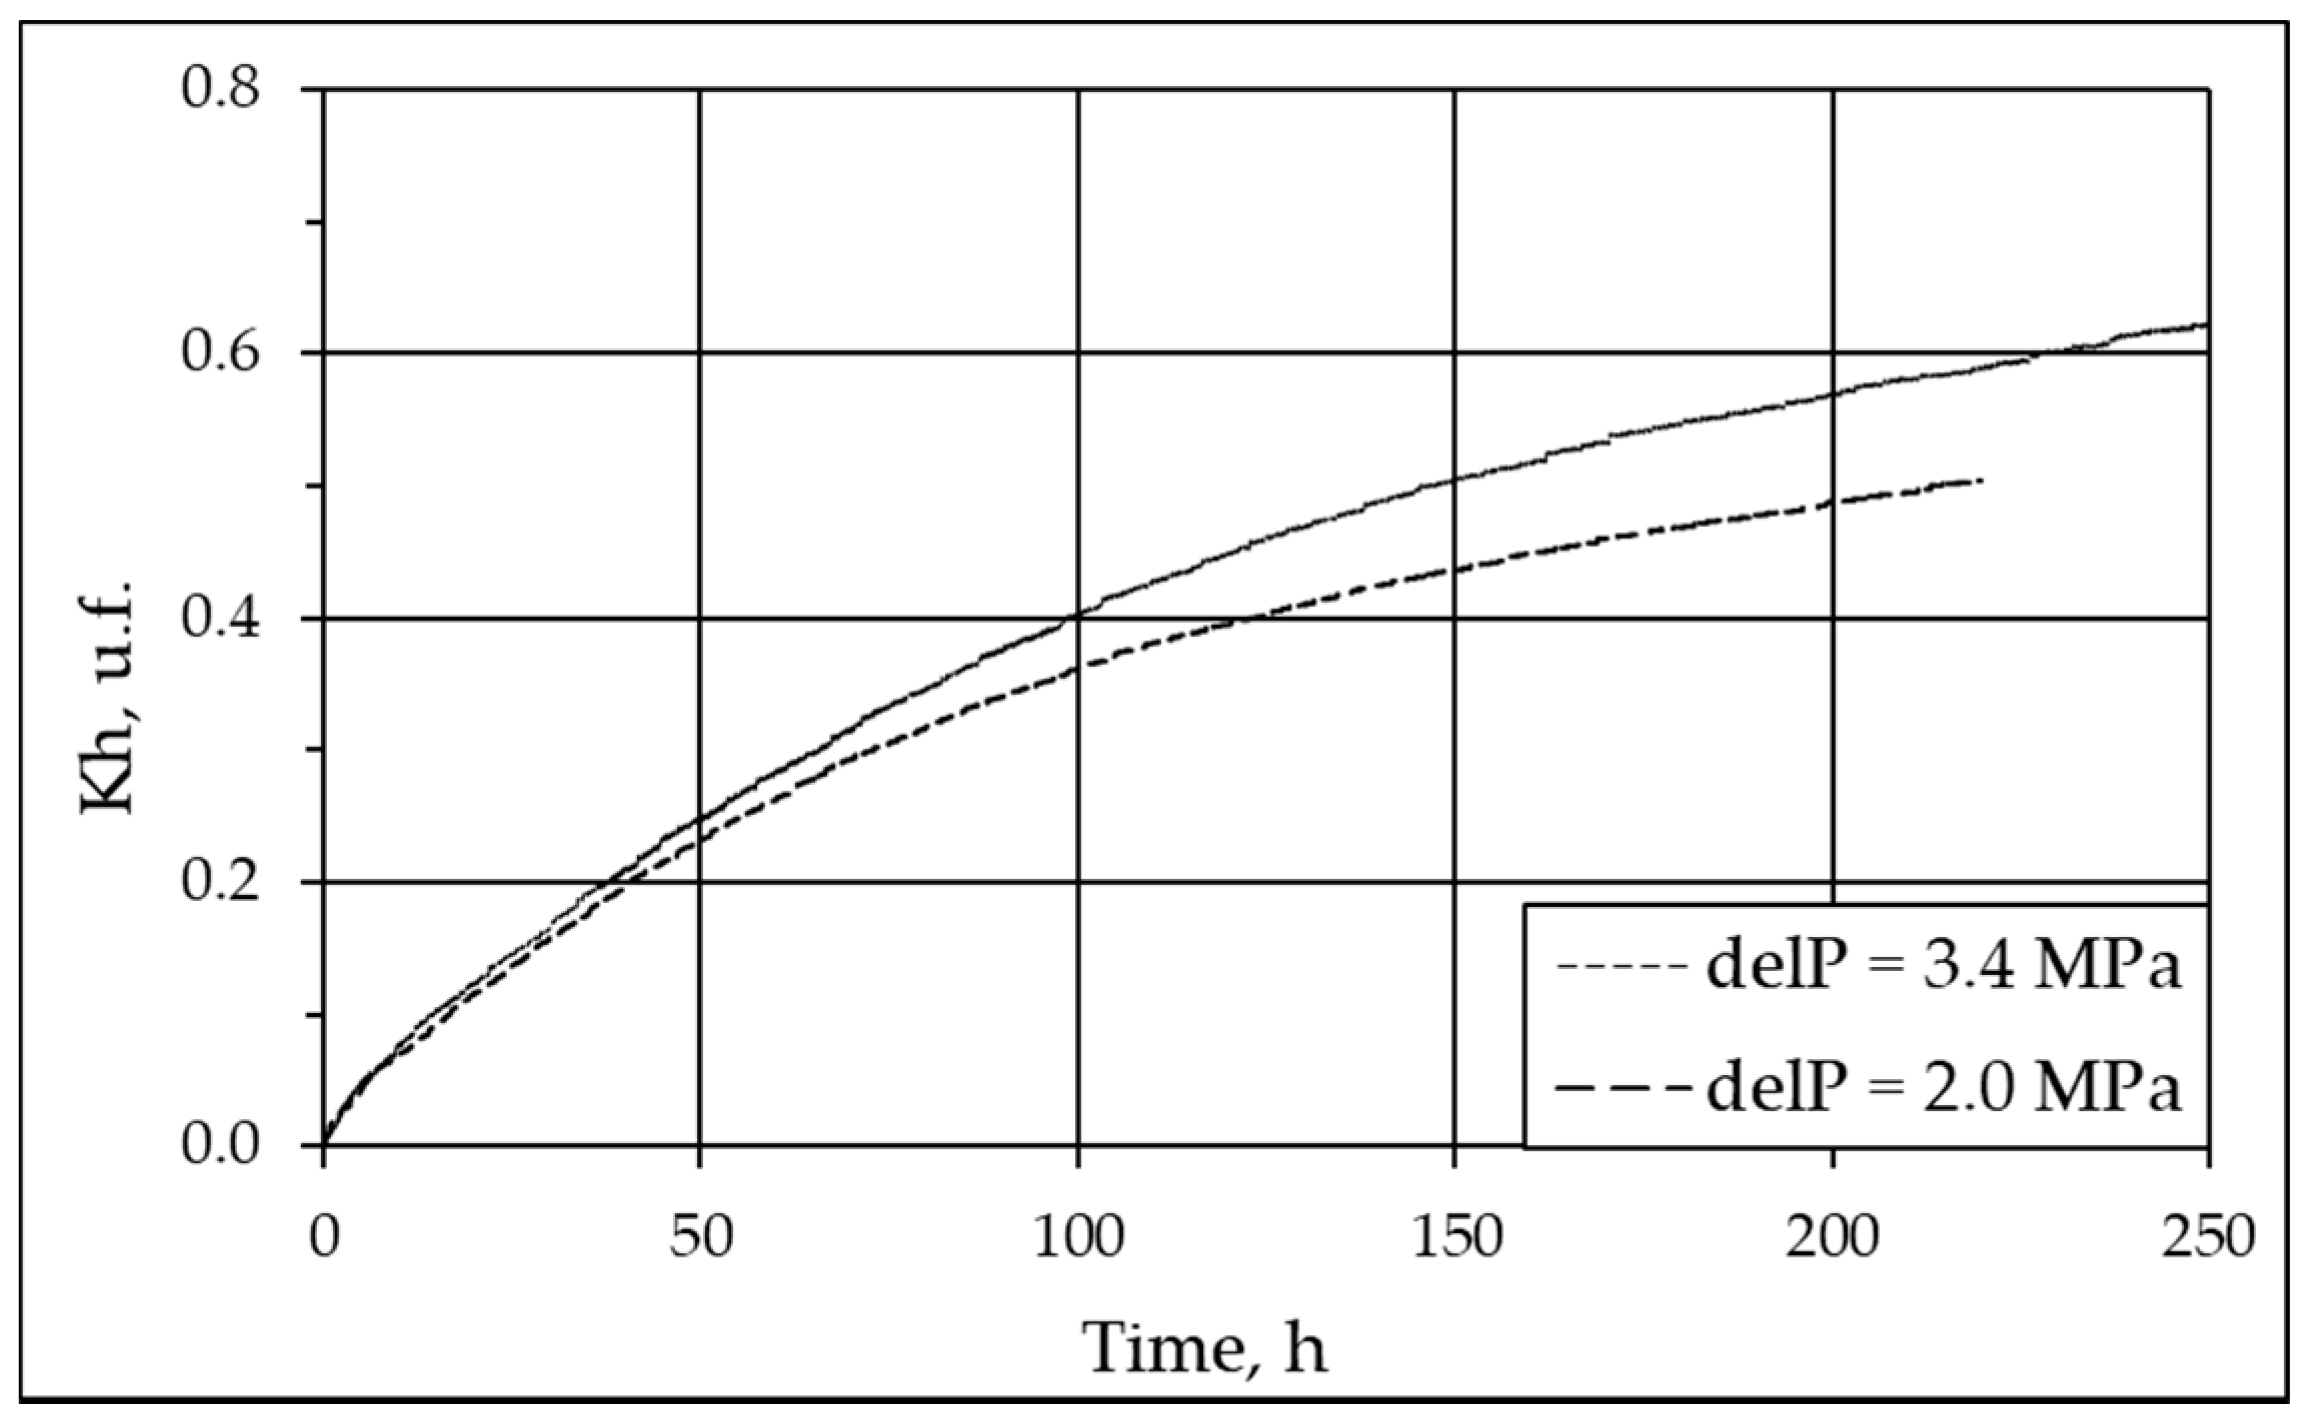
Experiments with sand 1 (W = 15% and Si = 63%) showed that the fraction of pore ice converted to hydrate increased as the gas pressure exceeded the equilibrium (ΔP) at a constant negative temperature of −3.8 °C (Figure 7).
The hydrate coefficient changed little for the first 10 h of the experiment and apparently depended only on the gas–ice contact area. As hydrate saturation increased, diffusion of gas through the newly formed hydrate film came into play, and the influence of pressure excess decreased. The fraction of pore ice converted to hydrate (Kh) 200 h after the onset of hydrate formation; it was 57% at ΔP = 3.4 MPa and 49% at ΔP = 2 MPa, i.e., 12% higher at a higher pressure excess. Thus, the fraction of pore ice converted to hydrate increases with increasing excess pressure at a constant negative temperature.
3.4. Effect of Ice Saturation
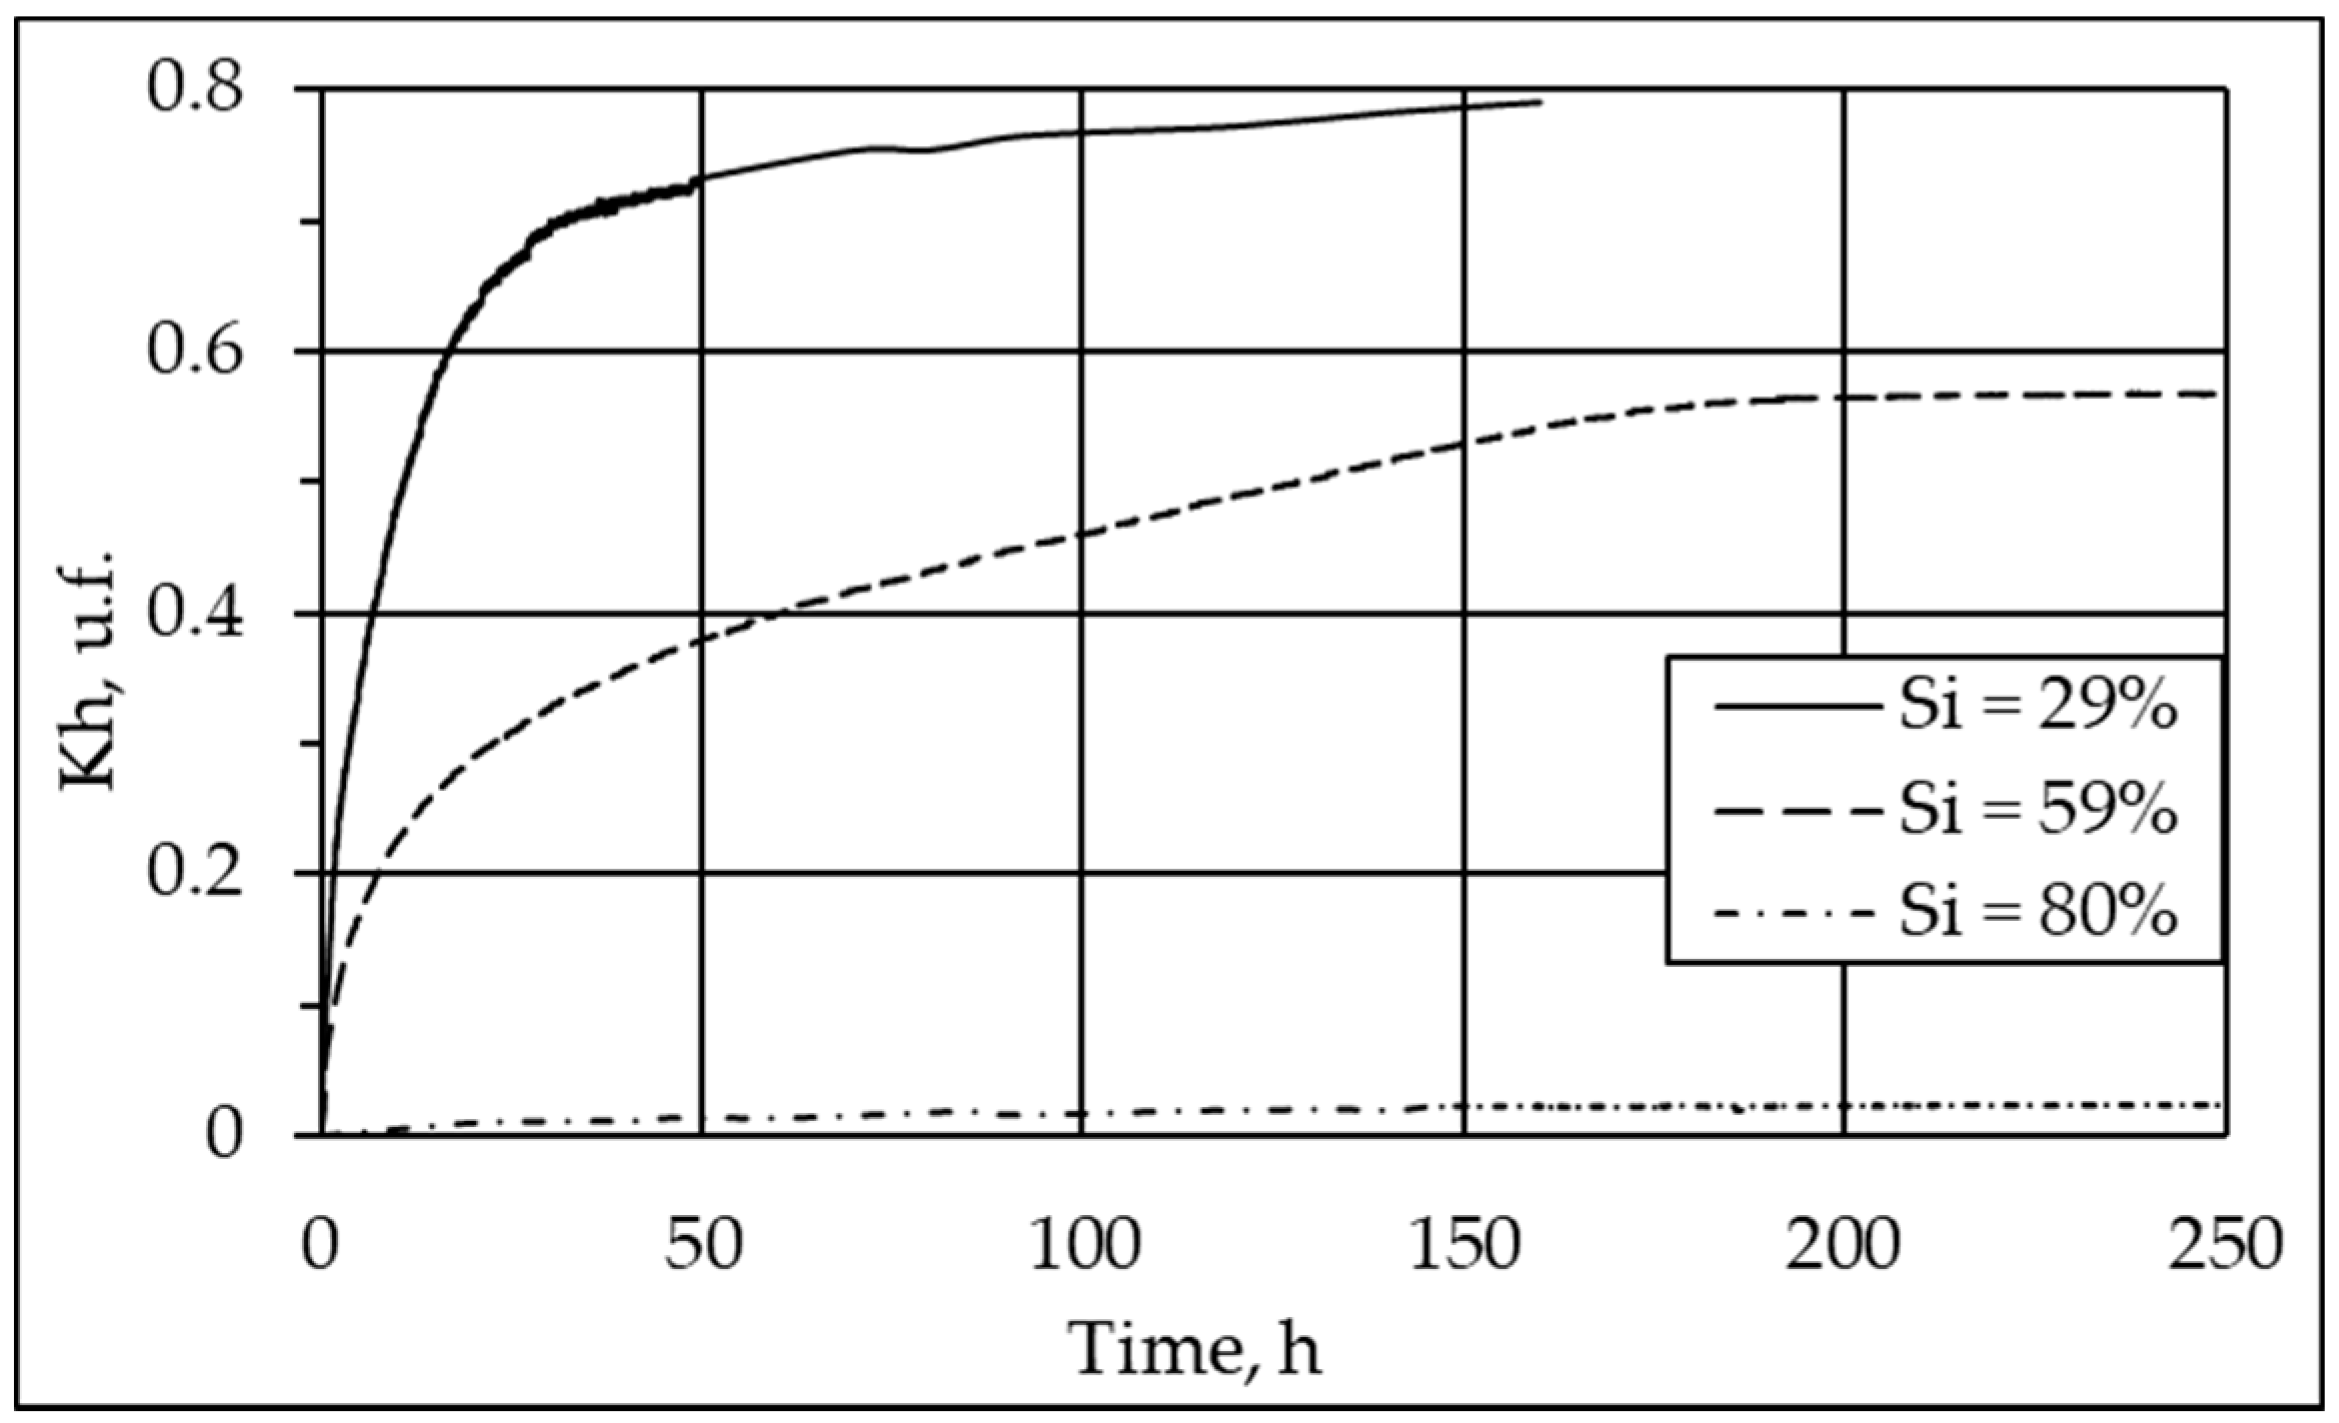
The effect of ice saturation on hydrate formation in frozen soils (Figure 8) was studied at −2.9 °C in silt 2 with different ice saturations (29, 59 and 80%).
Hydrate accumulation was faster in samples with lower ice saturation (29%) and it slowed down progressively as methane diffused toward the hydration front through the hydrate film on the pore ice surface. As a result, the hydration coefficient reached 81% at Si = 29%, 57% at Si = 59%, and only 3% at Si = 80%. The latter low value is due to decreasing gas permeability at increasing ice saturation [33].
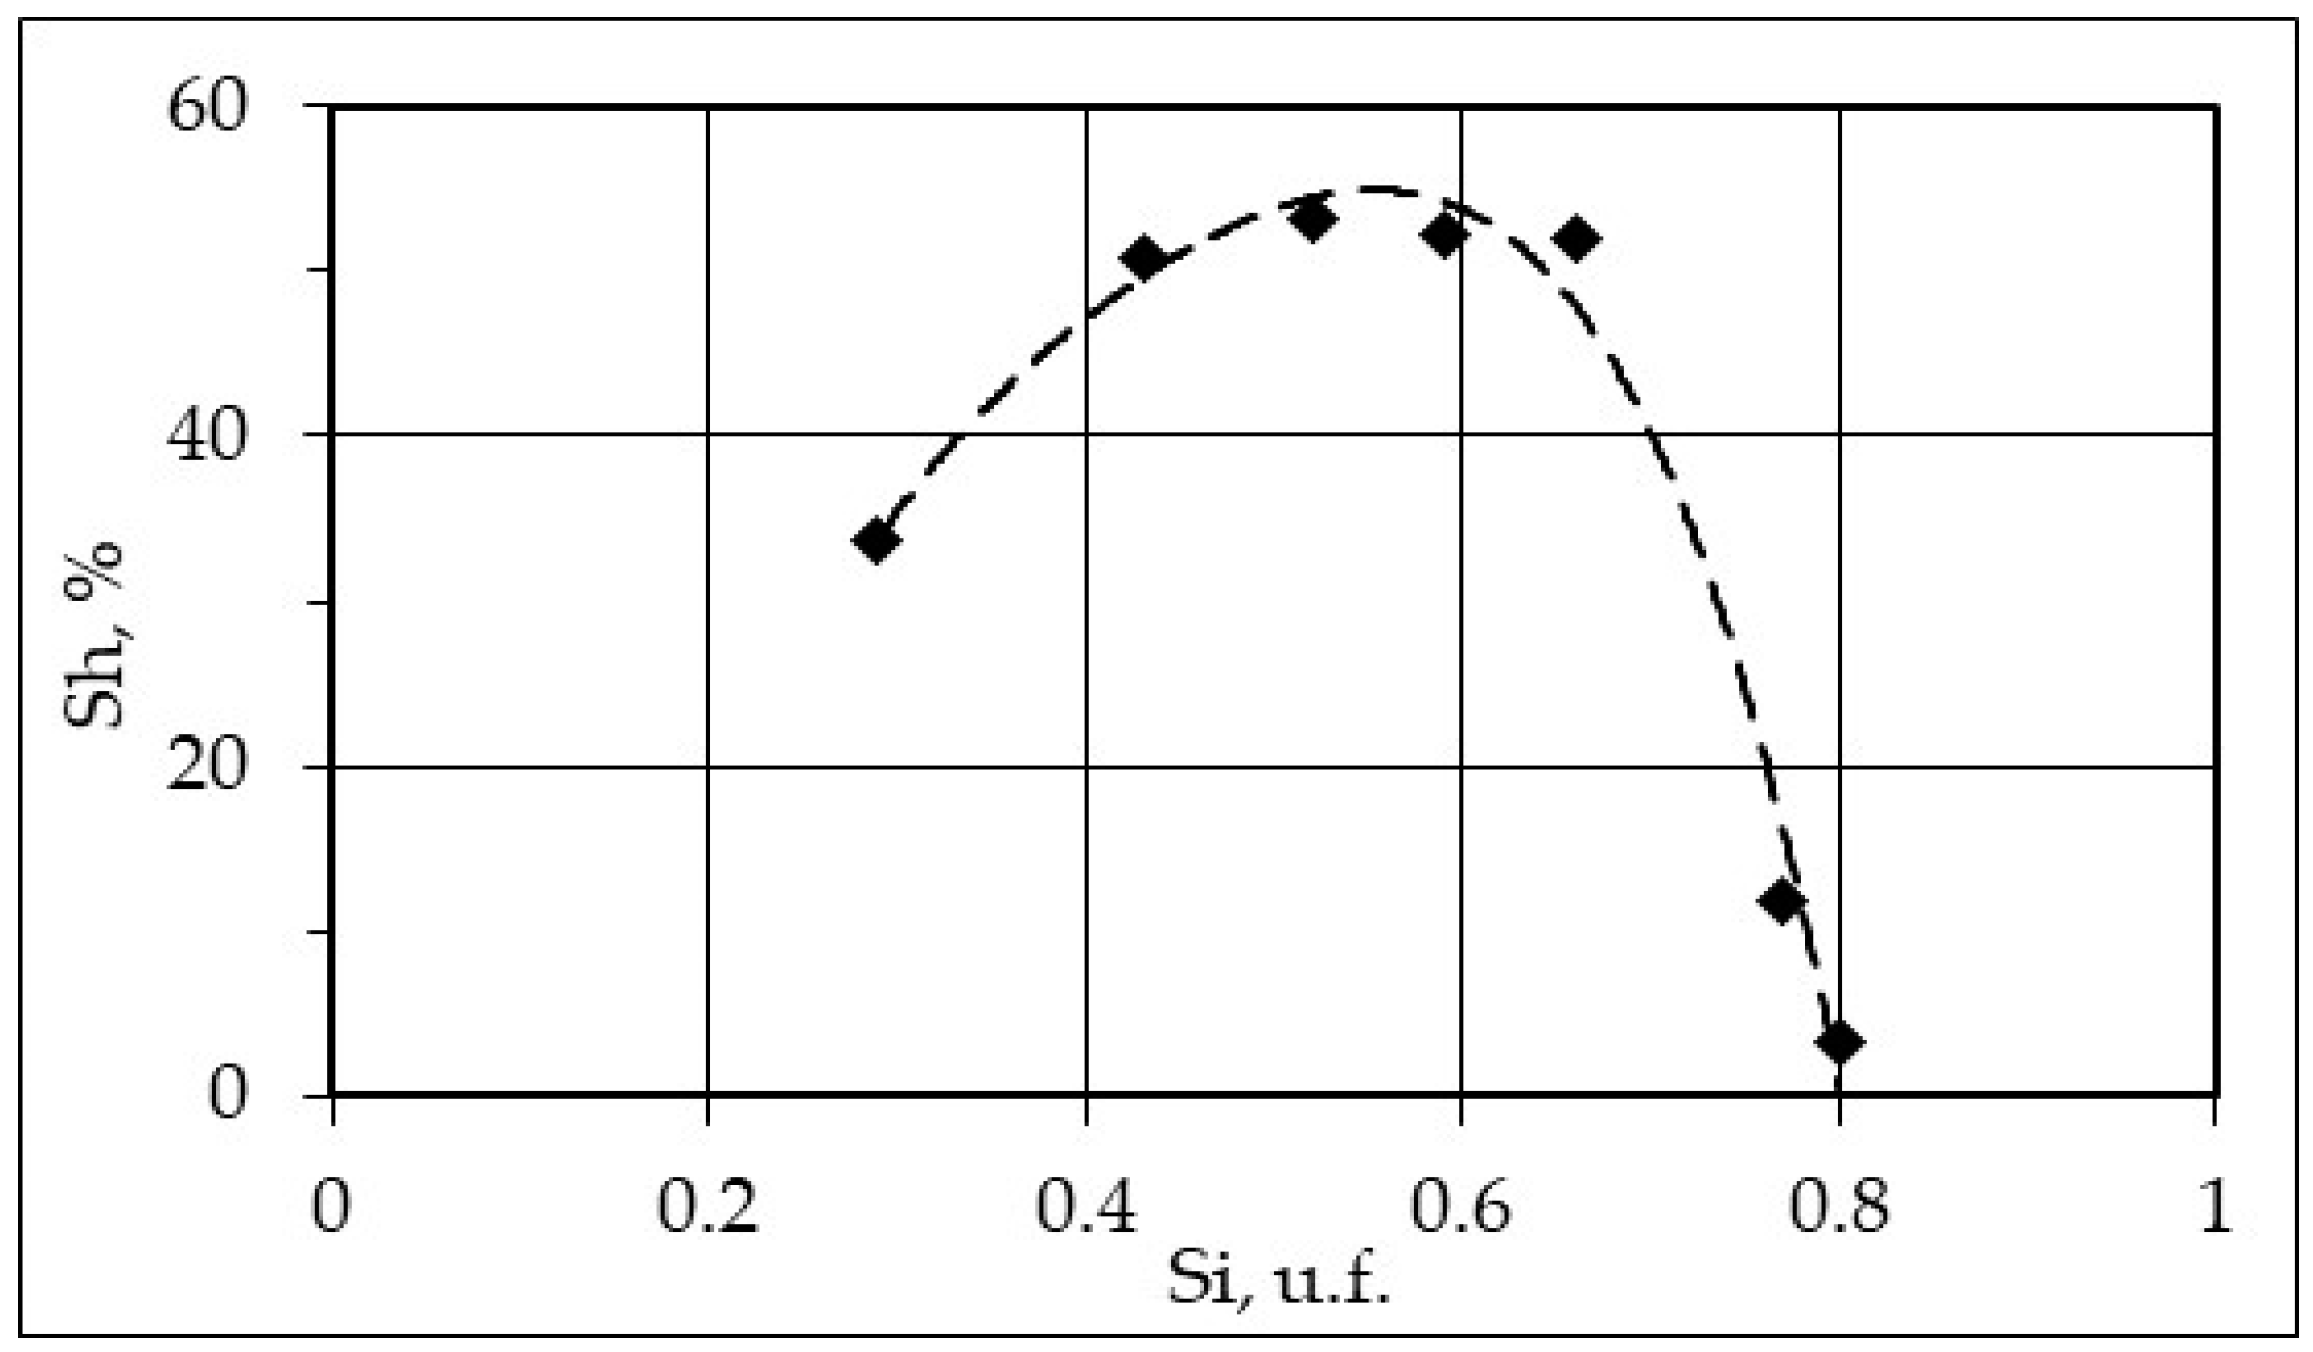
Sample silt 2 with its ice saturation increasing from 29 to 80% at −2.9 °C (Table 3) was used to find the optimal ice saturation values at which hydrate accumulation in the porous media is the highest (Figure 9).
The ice saturation between 45 and 65% was the optimal and provides up to 52–53% saturation with pore methane hydrate (Figure 9). At ice saturation as high as >80%, pore hydrate accumulation became almost completely suppressed as the amount of hydrate-forming gas was insufficient and gas permeability became too low [33]. Hydrate saturation was also low at low ice saturation (<20%), though the fraction of pore ice converted to hydrate was higher.
3.5. Effect of Soil Particle Size
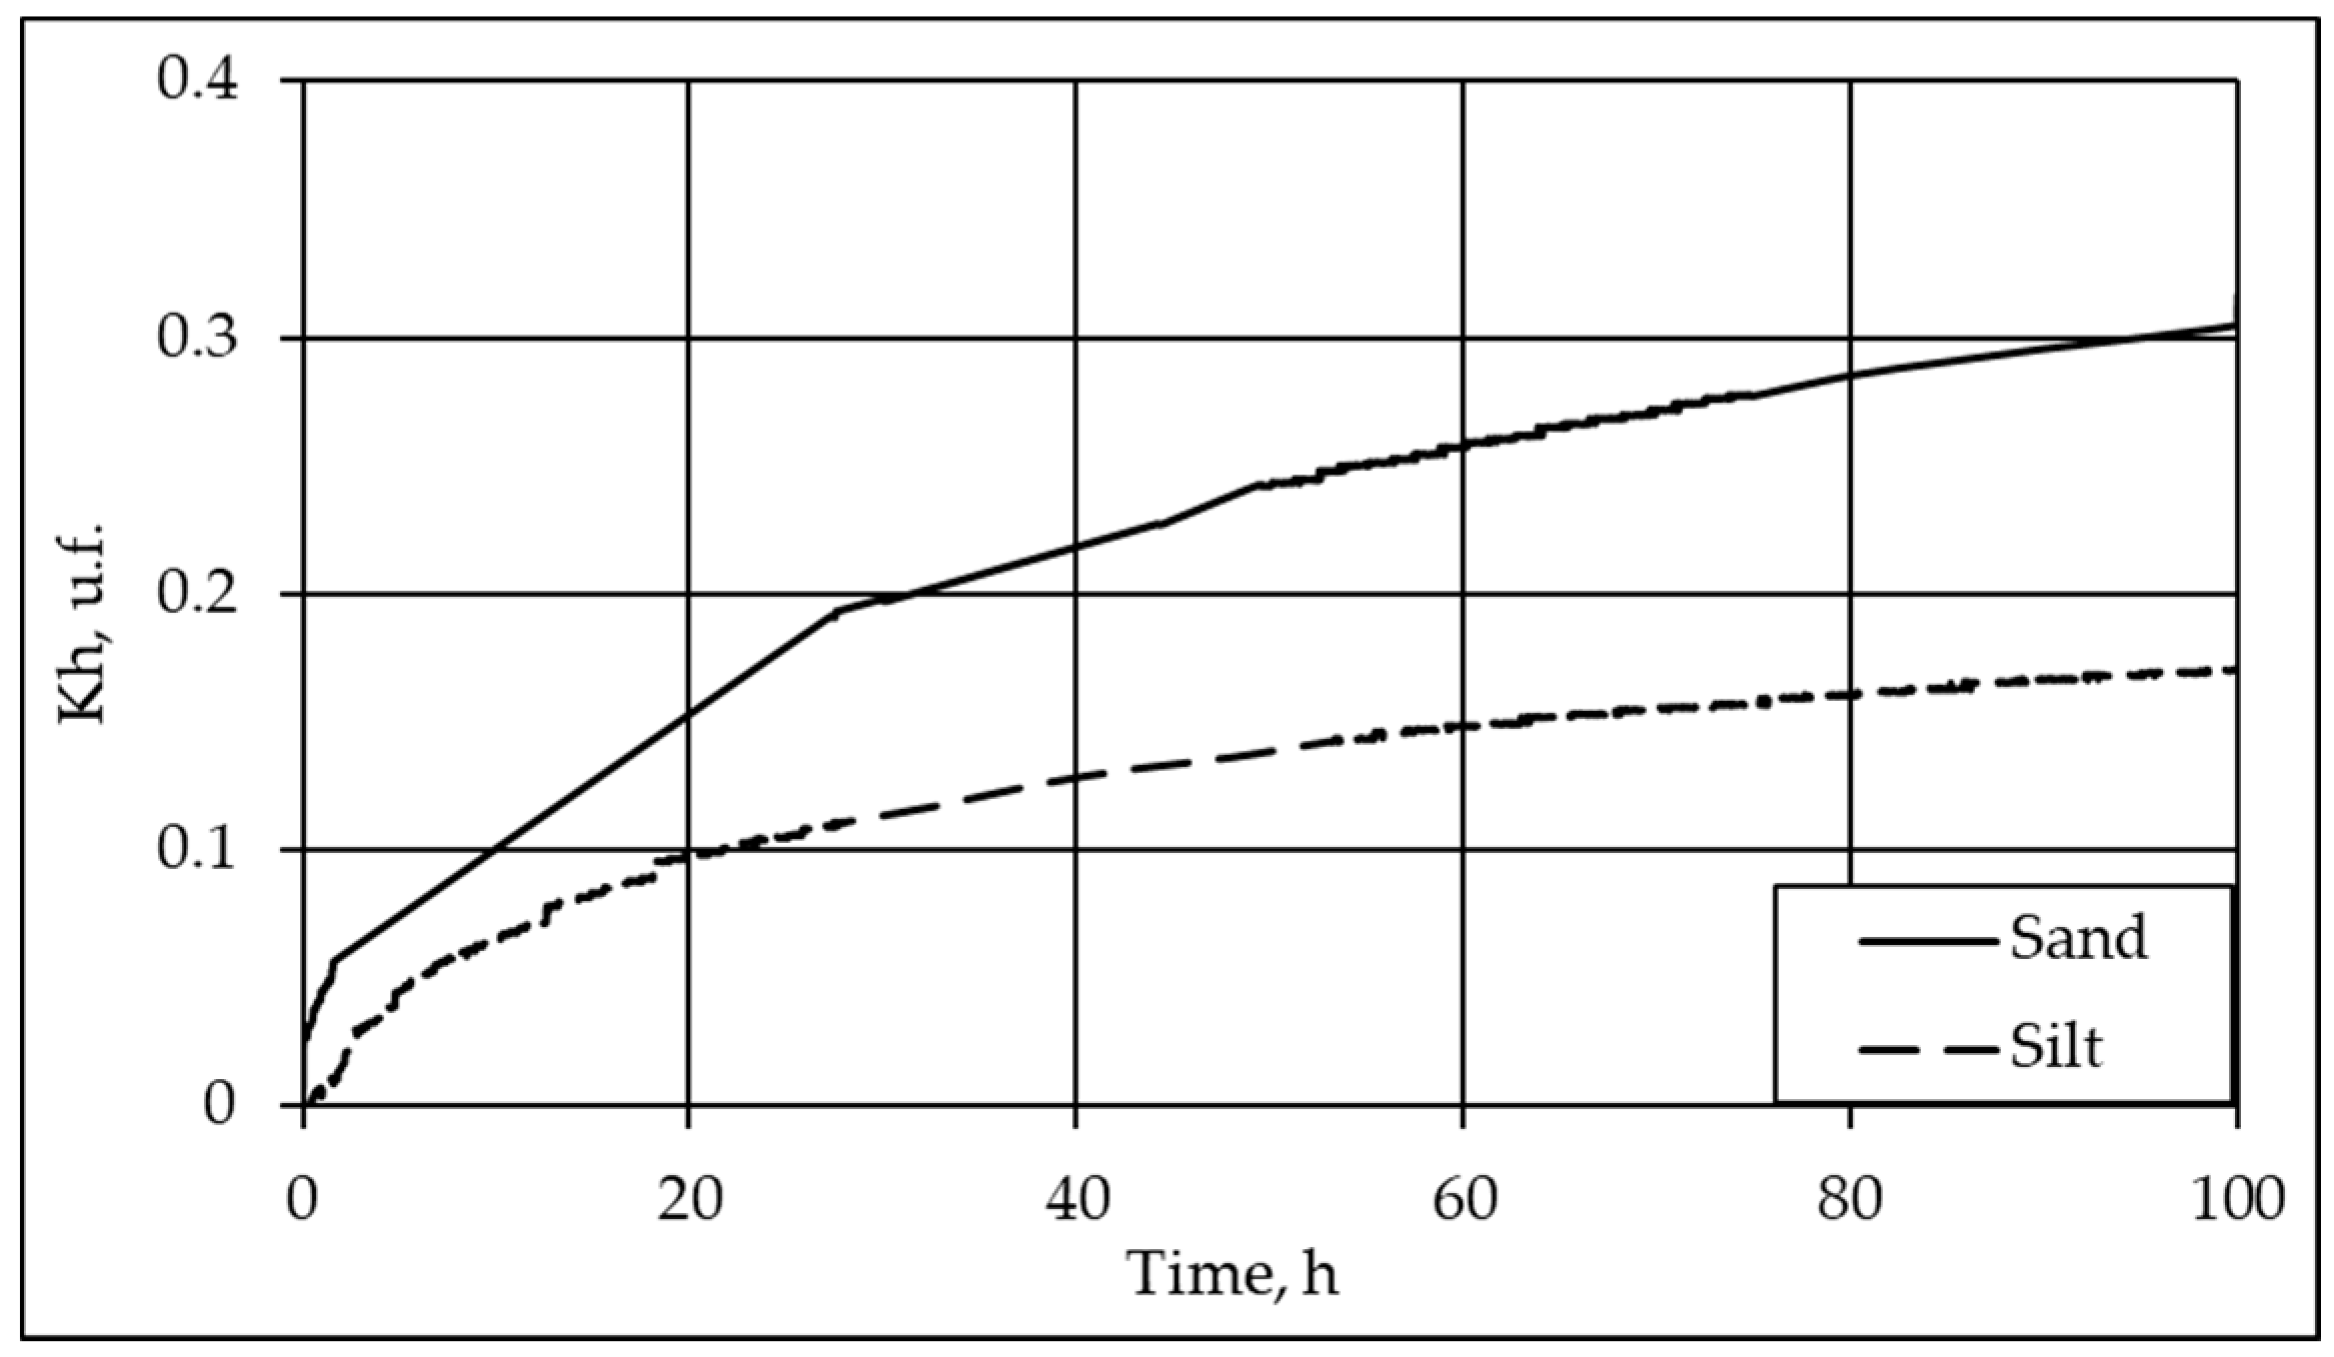
The effect of soil particle sizes on the hydrate formation kinetics is evident upon comparison of its patterns in sand 2 (W = 12%, Si = 56%) and silt 2 (W = 29%, Si = 57%) at −3 °C (Figure 10).
The fraction of ice converted to hydrate was smaller at finer grain sizes: 31% in sand 3 and 17% in silt 2, or lower by a factor of ~1.8, for about 100 h. The difference may be due to lower gas permeability and greater amounts of bound water which can hardly convert to hydrate.
3.6. Effect of Salinity
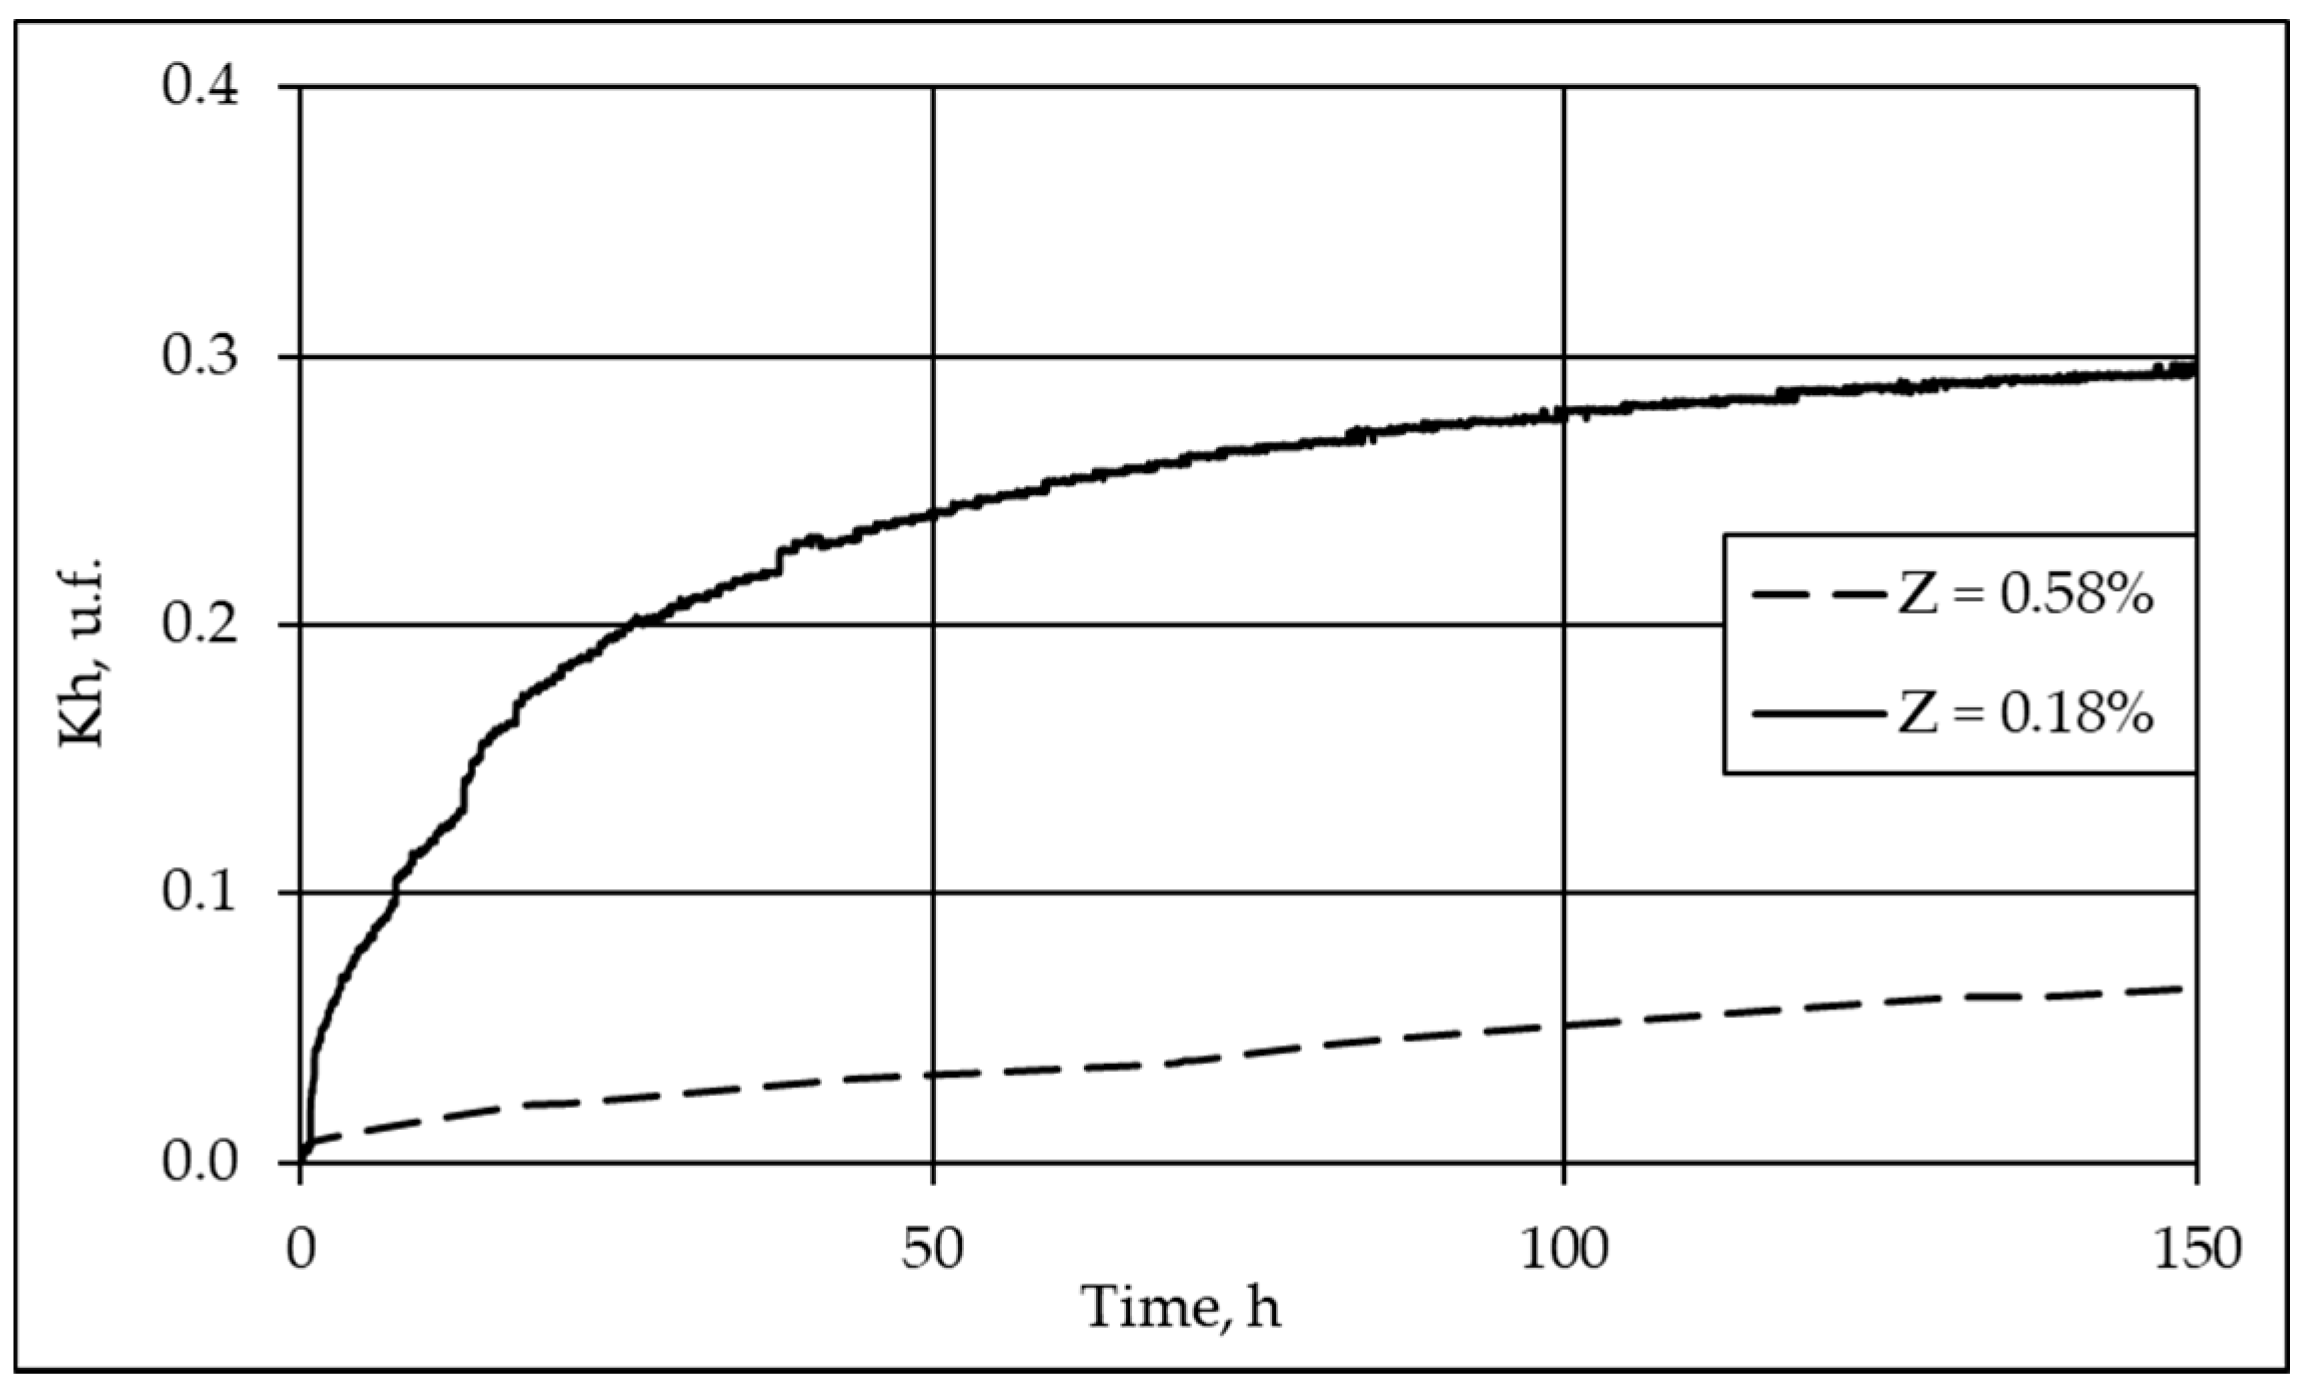
The effect of salinity on the hydrate formation kinetics (Figure 11) was studied in silt 3 with an initial natural salinity reaching 0.58% (W = 26%) and that diluted to 0.18% (W = 22%).
Hydrate formation at a negative temperature is slower in more saline samples. The hydrate coefficient became 29% higher at the end of the run (after 150 h) in the low-salinity sample but the increment was as small as 3% in the saline sample. The reason is that freezing of saline wet soil increases the pore water salinity, which impedes hydrate formation. However, slow decay of hydrate formation in the frozen saline sample may be due to the higher gas permeability of the hydrate layer that forms upon saline pore ice.
In general, the performed experiments corroborate the possibility for the formation of pore gas hydrates at negative temperatures (−2‒8 °C) in porous media of gas-bearing sandy–silty soils as the pressure is (2.5–6 MPa). These conditions of hydrate formation in frozen soils may occur at depth intervals from 250 to 600 m. In addition, in the permafrost, required pressure conditions may occur at depths below 250 m associated with freezing of methane-saturated sediments in a closed system [2,12,13,14,57], and may result from loading by overlying glaciers (thickness from 100 m) [8,11,15] or transgression of the Arctic seas [11,40,58].
Proceeding from published evidence described above and the reported experimental results, the formation of pore gas hydrates in gas-bearing permafrost can be explained with several geological models.
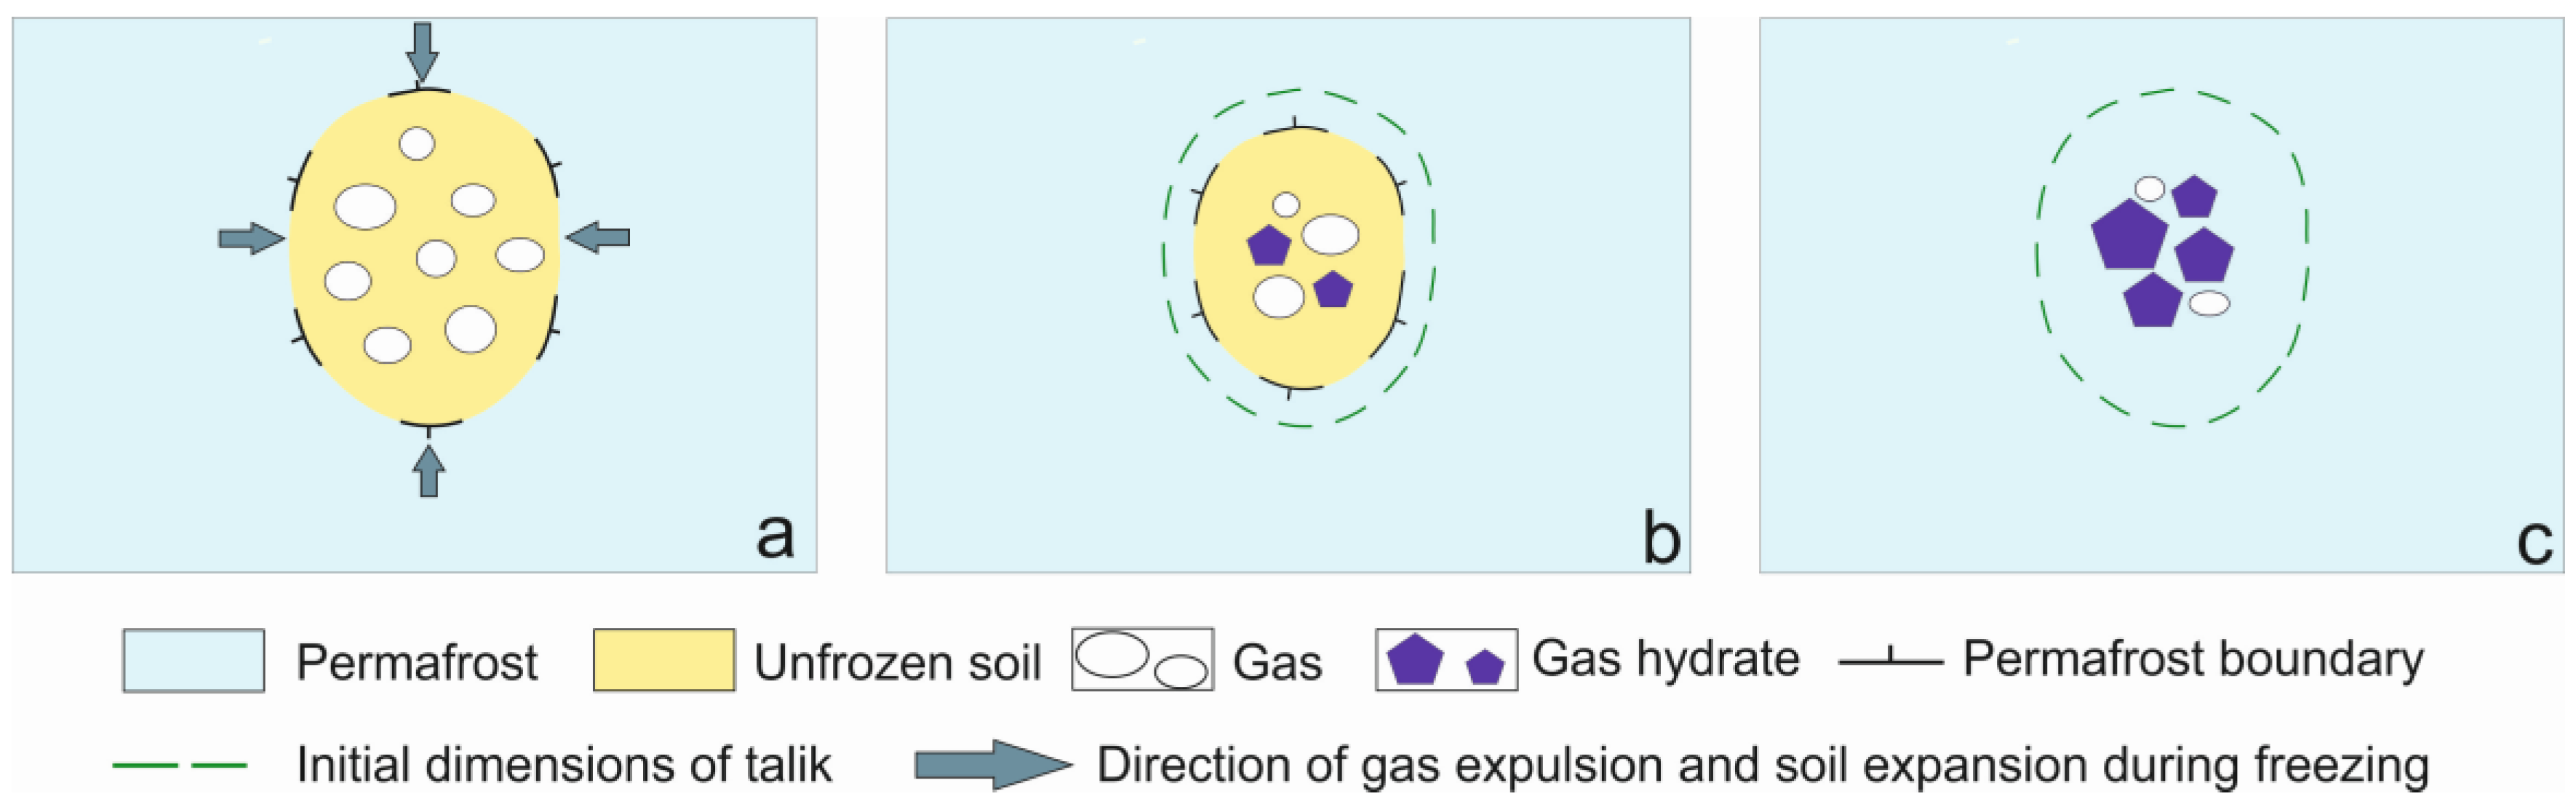
Model 1 (Figure 12): excess pressure produced by rapid freezing of closed taliks containing pore gas (mainly methane).
The process comprises three main stages: freezing of a gas-saturated closed talik in permafrost leading to cryogenic concentration of gas and related excess pressure (can reach several MPa) [57] (Figure 12a); onset of hydrate formation from some portion of pore gas in the freezing talik (Figure 12b); further cooling of the frozen talik and ensuing additional hydrate formation (Figure 12c). Thermodynamic description of this model is given in Reference [59].
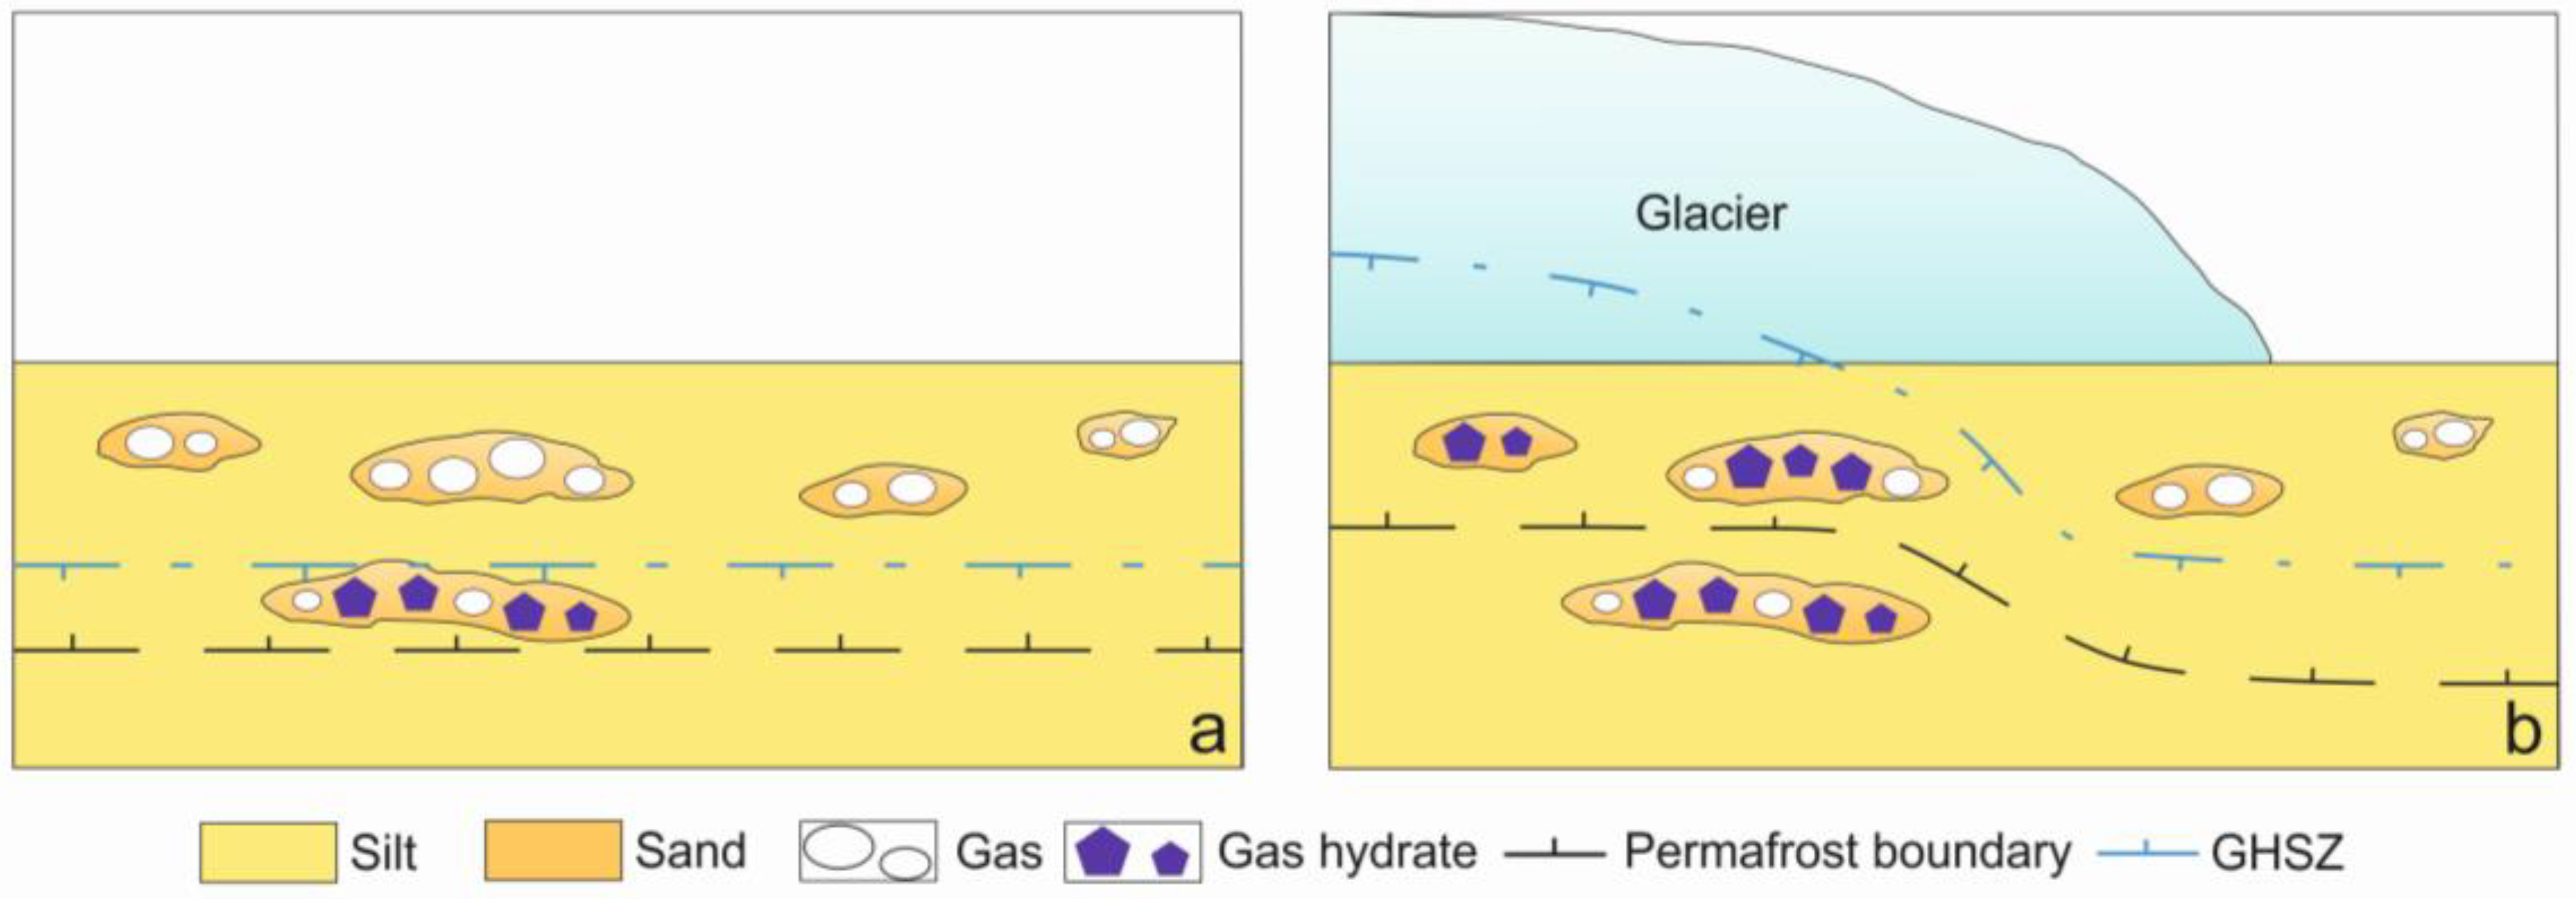
Model 2 (Figure 13): Excess pressure and temperature conditions required for hydrate formation produced by loading from ice during glaciation.
Originally (prior to glaciation), gas hydrates exist in permafrost at depths from 250–300 m (Figure 13a). Glaciation changes the temperature and pressure conditions as permafrost thickens up in the periglacial zone but it degrades from below in the subglacial zone [8,15]. The top of the hydrate stability zone becomes shallower under additional pressure in ice-loaded permafrost, whereby the gas it stores transforms into hydrate (Figure 13b).
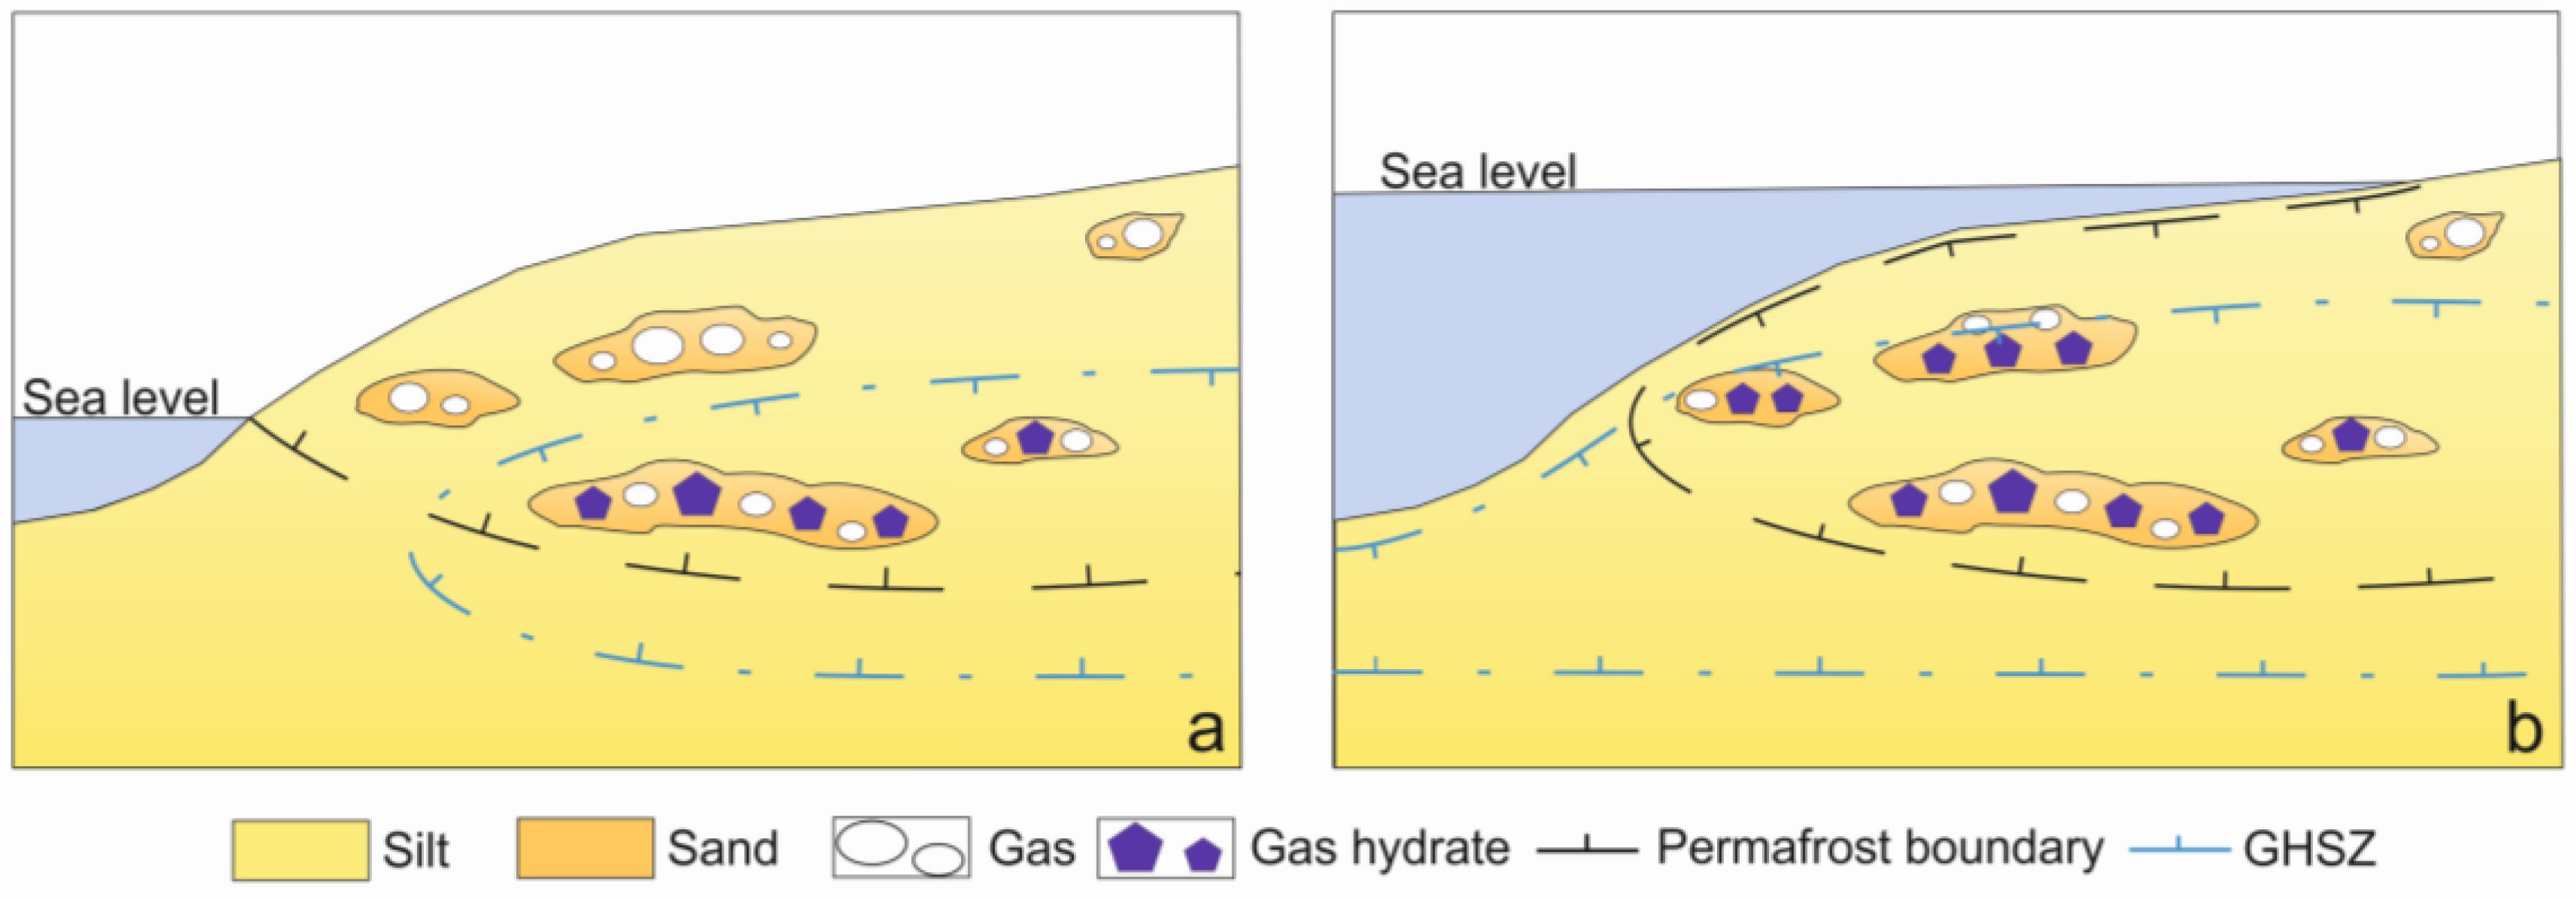
Model 3 (Figure 14): excess pressure produced by loading from water during transgression.
Long-term freezing of rocks during regression of the Arctic seas leads to the formation of permafrost with a zone of hydrate stability (Figure 14a), while partial cryogenic concentration of gas is possible above this zone in porous and permeable rocks, and local gas hydrate accumulations can form in ice-rich permafrost. Then the permafrost formed in subaerial conditions begins degrading from below during subsequent transgression events (Figure 14b), due to a heat flux from the Earth’ interior, but the permafrost degradation from above is slow because of cold water temperatures. This difference, along with excess pressure upon permafrost from high-standing water, is favorable for gas hydrate formation and both upward and downward expansion of the hydrate stability zone [40]. Further degradation of subsea relict permafrost leads to dissociation of intrapermafrost gas hydrates and to the emission of gas (methane) into the air [60,61].
4. Conclusions
Judging by the existence of intrapermafrost gas hydrates, they can form and accumulate naturally at negative temperatures.
The reported experiments reveal the mechanisms of pore methane hydrate formation at <0 °C and the kinetics of the process controlled by different factors such as the temperature, pressure, ice saturation, grain size, and salinity of gas-bearing permafrost. Pore gas hydrates form rapidly in frozen (to −8 °C) soils saturated with gas at pressures above the equilibrium, and their formation decays more slowly than at t >0 °C. The fraction of pore ice converted to hydrate (hydrate coefficient) increases progressively with excess pressure at a constant negative temperature.
Hydrate formation depends on the initial ice saturation and is the fastest at ice saturation of 45 to 65%.
The hydrate coefficient is lower in finer-grained sediments; it is 1.8 times lower in silt than in sand. Hydrate formation is also slower in saline frozen soils.
The experimental results confirm the possibility for the formation of pore gas hydrates in frozen gas-saturated rocks under favorable temperature and pressure conditions. Excess pressure necessary for the activation of hydrate formation processes in rock mass can be created by ice during glaciations or from high-standing water during transgression in the Arctic seas, as well as from freezing of gas-bearing closed taliks. This logically follows from published evidence.
Author Contributions
Conceptualization, experimental methodology, supervision, E.C.; carry out experiments, processing and analysis, writing manuscript and editing, E.C., D.D.
Funding
The research was supported by the Russian Science Foundation (grants No. 16-17-00051 and 18-77-10063) and the Russian Foundation for Basic Research (grant No. 17-05-00995).
Conflicts of Interest
The authors declare no conflict of interest.
References
- Makogon, Y.F. Hydrates of Natural Gases; NEDRA: Moscow, Russia, 1974; p. 208. ISBN 978-0878141654. (In Russian) [Google Scholar]
- Istomin, V.A.; Yakushev, V.S. Naturally Occurring Gas Hydrates; NEDRA: Moscow, Russia, 1992; p. 235. ISBN 5-247-02442-7. (In Russian) [Google Scholar]
- Sloan, E.D. Clathrate Hydrates of Natural Gases, 2nd ed.; Marcel Dekker, Inc.: New York, NY, USA, 1998; p. 705. ISBN 0824799372. [Google Scholar]
- Max, M.D. Natural Gas Hydrate in Oceanic and Permafrost Environments; Kluwer Academic Publishers: Dordrecht, The Netherlands; London, UK, 2000; p. 414. ISBN 1384-6434. [Google Scholar] [CrossRef]
- Cherskiy, N.V.; Tsarev, V.P.; Nikitin, S.P. Conditions for Gas Accumulation in Gas Hydrate Deposits: Investigation and Prediction; Academy of Sciences of the USSR Publisher: Yakutsk, Russia, 1983; p. 156. (In Russian) [Google Scholar]
- Ginsburg, G.D.; Soloviev, V.A. Geological models of gas hydrate formation. Litologiya i Poleznye Iskopaemye 1990, 2, 76–87. (In Russian) [Google Scholar]
- Are, F.E. Problem of deep gas emission into the atmosphere. Kriosfera Zemli 1998, II, 42–50. (In Russian) [Google Scholar]
- Romanovskiy, N.N. Fundamentals of Cryogenesis in the Lithosphere; Moscow University Press: Moscow, Russia, 1993; p. 336. ISBN 5-211-02379-10. (In Russian) [Google Scholar]
- Chuvilin, E.M.; Yakushev, V.S.; Perlova, E.V. Gas and possible gas hydrates in the permafrost of Bovanenkovo gas field, Yamal Peninsula, West Siberia. Polarforschung 2000, 68, 215–219. [Google Scholar]
- Yakushev, V.S. One possible cause of gas bursts in permafrost. Geol. Neft. i Gaza 1989, 14, 45–46. (In Russian) [Google Scholar]
- Yakushev, V.S. Natural Gas and Gas Hydrates in Permafrost; VNIIGAZ: Moscow, Russia, 2009; p. 192. ISBN 978-5-89754-048-8. (In Russian) [Google Scholar]
- Rivkin, F.M.; Levantovskaya, N.P. Dynamics of sub-river channel taliks and the formation of gas hydrates. Kriosfera Zemli 2002, 6, 36–42. (In Russian) [Google Scholar]
- Kraev, G.; Schulze, E.-D.; Yurova, A.; Kholodov, A.; Chuvilin, E.; Rivkina, E. Cryogenic Displacement and Accumulation of Biogenic Methane in Frozen Soils. Atmosphere 2017, 8, 105. [Google Scholar] [CrossRef]
- Istomin, V.A.; Chuvilin, E.M.; Sergeeva, D.V.; Buhkanov, B.A.; Stanilovskaya, Y.V.; Green, E.; Badetz, C. Thermodynamic calculation of freezing temperature of gas-saturated pore water in talik zones. In Proceedings of the 5th European Conference Permafrost, Chamonix, France, 23 June–1 July 2018; pp. 480–481. [Google Scholar]
- Trofimuk, A.A.; Makogon, Y.F.; Yakushev, V.S. Influence of hydrate formation zones on the temperature regime of rocks in permafrost. Geologiya i Geofizika Sov. Geol. Geophys. 1986, 27, 3–10. (In Russian) [Google Scholar]
- Bily, C.; Dick, J.W.L. Natural gas hydrates in the Mackenzie Delta, Northwest Territories. Can. Pet. Geol. Bull. 1974, 340–352. [Google Scholar]
- Dallimore, S.R.; Uchida, T.; Collett, T.S. Scientific Results from JAPEX/JNOC/GSC Mallik 2L-38 Gas Hydrate Research Well, Mackenzie Delta, Northwest Territories, Canada. Geological Survey of Canada, Bulletin 544; US Government Printing Office: Washington, DC, USA, 1999; p. 403. ISBN 0-660-17777-3.
- Collet, T.S.; Dallimore, S.R. Permafrost-associated gas hydrate. In Natural Gas Hydrates in Oceanic and Permafrost Environments; Max, M.D., Ed.; Kluwer Academic Publishers: Dordrecht, The Netherlands; London, UK, 2000; p. 414. ISBN 978-94-011-4387-5. [Google Scholar]
- Lu, Z.; Zhu, Y.; Zhang, Y.; Wen, H.; Li, Y.; Liu, C. Gas hydrate occurrences in the Qilian Mountain permafrost, Qinghai Province, China. Cold Reg. Sci. Technol. 2011, 66, 93–104. [Google Scholar] [CrossRef]
- Zhao, X.; Deng, J.; Li, J.; Lu, C.; Song, J. Gas hydrate formation and its accumulation potential in Mohe permafrost, China. Mar. Pet. Geol. 2012, 35, 166–175. [Google Scholar] [CrossRef]
- Dai, J.; Ni, Y.; Huang, S.; Peng, W.; Han, W.; Gong, D.; Wei, W. Genetic types of gas hydrates in China. Pet. Explor. Dev. 2017, 44, 837–848. [Google Scholar] [CrossRef]
- Makogon, Y.F.; Omelchenko, R.Y. Messoyakha: Gas hydrate accumulation, its role and significance. Geol. i Polezn. Iskop. Mirovogo Okeana 2012, 3, 5–19. (In Russian) [Google Scholar]
- Makogon, Y.F. Appraisal of gas resources in the hydrate form. Gazov. Delo 1966, 1, 56. (In Russian) [Google Scholar]
- Zakirov, S.N.; Dubrovskiy, D.A.; Tolkach, V.M. Influence of Hydrates Dissociation Process on Messoyakha Deposit; VNIIEgazprom: Moscow, Russia, 1989; p. 84. (In Russian) [Google Scholar]
- Ginsburg, G.D.; Novozhilov, A.A. Hydrates in the Messoyakha gas field. Gazov. Prom. 1997, 2, 18–20. (In Russian) [Google Scholar]
- Yakushev, V.S.; Perlova, E.V.; Makhonina, N.A.; Chuvilin, E.M.; Kozlova, E.V. Gas hydrates in deposits on continents and islands. Ross. Khimicheskiy Zhurnal 2003, 3, 80–90. (In Russian) [Google Scholar]
- Dallimore, S.R.; Collett, T.S. Intrapermafrost gas hydrates from a deep core hole in the Mackenzie Delta, Northwest Territories, Canada. Geology 1995, 23, 527–530. [Google Scholar] [CrossRef]
- Cherskiy, N.V.; Tsarev, V.P. Prospects for Development of Gas Hydrate Deposits. In Improvement of Subsoil Use in the Northern and Eastern USSR, Part 1; Cherskiy, N.V., Ed.; Academy of Sciences of the USSR Publisher: Yakutsk, Russia, 1973; pp. 54–60. (In Russian) [Google Scholar]
- Ershov, E.D.; Lebedenko, Y.P.; Chuvilin, E.M.; Istomin, V.A.; Yakushev, V.S. Features of gas hydrates in permafrost. Dokl. Akad. Nauk. 1991, 321, 788–791. (In Russian) [Google Scholar]
- Dallimore, S.R.; Chuvilin, E.M.; Yakushev, V.S.; Grechischev, S.E.; Ponomarev, V.; Pavlov, A. Field and laboratory characterization of intrapermafrost gas hydrates, Mackenzie Delta, N.W.T., Canada. In Proceedings of the 2nd International Conference on Natural Gas Hydrates, Toulouse, France, 2–6 June 1996; pp. 525–531. [Google Scholar]
- Chuvilin, E.M.; Yakushev, V.S. Structure and some properties of frozen hydrate-containing soils. In Proceedings of the International Symposium on Methane Hydrates Resourses in the Near Future, JNOC, Chiba City, Japan, 20–22 October 1998; pp. 239–246. [Google Scholar]
- Chuvilin, E.M.; Guryeva, O.M. Carbon dioxide gas hydrates accumulation in freezing and frozen sediments. In Proceedings of the 6th International Conference on Gas Hydrates (ICGH 2008), Vancouver, BC, Canada, 6–20 July 2008; p. 5469. [Google Scholar]
- Chuvilin, E.M.; Grebenkin, S.I. Gas permeability variations in gas-filled soils upon hydrate formation and freezing: An experimental study. Kriosf. Zemli 2015, XIX, 67–74. [Google Scholar]
- Chuvilin, E.M.; Bukhanov, B.A. Effect of hydrate accumulation conditions on thermal conductivity of gas-saturated soils. Energy Fuels 2017, 31, 5246–5254. [Google Scholar] [CrossRef]
- Chuvilin, E.M.; Bukhanov, B.A.; Grebenkin, S.I.; Doroshin, V.V.; Iospa, A.V. Shear strength of frozen sand with dissociating pore methane hydrate: An experimental study. Cold Reg. Sci. Technol. 2018, 153, 101–105. [Google Scholar] [CrossRef]
- Chuvilin, E.M.; Yakushev, V.S.; Perlova, E.V. Experimental Study of Gas Hydrate Formation in Porous Media. In Advances in Cold-Region Thermal Engineering and Sciences; Hutter, K., Wang, Y., Beer, H., Eds.; Lecture Notes in Physics; Springer: Berlin/Heidelberg, Germany, 1999; Volume 533, pp. 431–440. ISBN 978-3-540-48410-3. [Google Scholar]
- Rivkina, E.; Gilichinsky, D.; McKay, C.; Dallimore, S. Methane Distribution in Permafrost: Evidence for an Interpore Pressure Methane Hydrate. In Permafrost Response on Economic Development, Environmental Security and Natural Potential; Paepe, R., Melnikov, V., Eds.; Kluwer Academic Publ.: Dordrecht, The Netherlands, 2001; pp. 487–496. ISBN 978-94-010-0684-2. [Google Scholar]
- Wright, J.F.; Chuvilin, E.M.; Dallimore, S.R.; Yakushev, V.S.; Nixon, F.M. Methane hydrate formation and dissociation in fine sands at temperature near 0 °C. In Proceedings of the 7th International Conference on Permafrost, Yellowknife, NT, Canada, 23–27 June 1998; pp. 1147–1153. [Google Scholar]
- Komai, T.; Sakamoto, Y.; Kawamura, T. Formation kinetics of CO2 gas hydrates in sandy sediments and change in permeability during crystal growth. In Proceedings of the 6th International Conference on Gas Hydrates (ICGH 2008), Vancouver, BC, Canada, 6–20 July 2008; p. 5342. [Google Scholar]
- Chuvilin, E.M.; Lupachik, M.V. Investigation of gas hydrate formation in frozen and thawing gas saturated sediments. In Proceedings of the 7th International Conference on Gas Hydrates (ICGH 2011), Edinburgh, Scotland, UK, 17–21 July 2011. [Google Scholar]
- Chuvilin, E.M.; Kozlova, E.V. Experimental estimation of hydrate-bearing sediments stability. In Proceedings of the 5th International Conference on Gas Hydrate, Thermodynamic Aspects, Trondheim, Norway, 13–16 June 2005; Volume 3, pp. 1562–1567. [Google Scholar]
- Chuvilin, E.M.; Guryeva, O.M. Experimental investigation of CO2 gas hydrate formation in porous media of frozen and freezing sediments. Kriosf. Zemli 2009, XIII, 70–79. (In Russian) [Google Scholar]
- Chuvilin, E.M.; Petrakova, S.Y.; Guryeva, O.M.; Istomin, V.A. Formation of Carbon Dioxide Gas Hydrates in Freezing Sediments and Decomposition Kinetics of the Hydrates Formed. In Proceedings of the 11th International Conference on the Physics and Chemistry of Ice, Bremerhaven, Germany, 23–28 July 2006; pp. 147–154. [Google Scholar]
- GOST 12536-2014. Soils. Methods of Laboratory Granulometric (Grain-Size) and Microaggregate Distribution; Standards Publishing: Moscow, Russia, 2014; p. 24. [Google Scholar]
- GOST 5180-2015. Soils. Laboratory Methods for Determination of Physical Characteristics; Standardinform: Moscow, Russia, 2015; p. 23. [Google Scholar]
- SNiP 2.02.04-88. Foundation Beds and Foundations in Permafrost Soils; CITP; Gosstroy (USSR): Moscow, Russia, 1990; p. 52.
- Trofimov, V.T.; Korolev, V.A.; Voznesensky, E.A.; Golodkovskaya, G.A.; Vasilchuk, Y.K.; Ziangirov, R.S. Soil Science; Publishing House of the Moscow State University and “Science”: Moscow, Russia, 2005; p. 1024. ISBN 5-211-04848-2. [Google Scholar]
- Yang, S.H.B.; Babu, P.; Chua, S.F.S.; Linga, P. Carbon dioxide hydrate kinetics in porous media with and without salts. Appl. Energy 2014, 162, 1131–1140. [Google Scholar] [CrossRef]
- Zhang, P.; Wu, Q.; Mu, C. Influence of temperature on methane hydrate formation. Sci. Rep. 2017, 7. [Google Scholar] [CrossRef] [PubMed]
- Ruan, C.; Ding, L.; Shi, B.; Huang, Q.; Gong, J. Study of hydrate formation in gas-emulsion multiphase flow systems. R. Soc. Chem. 2017, 7, 48127–48135. [Google Scholar] [CrossRef] [Green Version]
- Sychev, V.; Vassrman, L.; Zagoruchenko, V.; Kozlov, L.; Spiridonov, G.; Tsymarny, V. Thermodynamic Properties of Methane; Standards Publishing House: Moscow, Russia, 1979; p. 348. (In Russian) [Google Scholar]
- Staykova, D.K.; Hansen, T.; Salamatin, A.N.; Kuhs, W.F. Kinetic diffraction experiments on the formation of porous gas hydrates. In Proceedings of the 4th International Conference on Gas Hydrate, Yokohama Symposia, Yokohama, Japan, 19–23 May 2002; pp. 537–542. [Google Scholar]
- Staykova, D.K.; Kuhs, W.F.; Salamatin, A.N.; Hansen, T. Formation of porous gas hydrates from ice powders: Diffraction experiments and multistage model. Phys. Chem. B 2003, 107, 10299–10311. [Google Scholar] [CrossRef]
- Genov, G.; Kuhs, W.F.; Staykova, D.K.; Goreshnik, E.; Salamatin, A.N. Experimental studies on the formation of porous gas hydrates. Am. Miner. 2004, 89, 1228–1239. [Google Scholar] [CrossRef]
- Kuhs, W.F.; Staykova, D.K.; Salamatin, A.N. Formation of methane hydrate from polydisperse ice powders. Phys. Chem. B 2006, 110, 13283–13295. [Google Scholar] [CrossRef]
- Liu, W.; Wang, L.; Yang, M.; Song, Y.; Zhang, L.; Li, Q.; Chen, Y. Experimental study on the methane hydrate formation from ice powders. In Proceedings of the 6th International Conference on Applied Energy (ICAE2014), Energy Procedia 61, Taipei, Taiwan, 30 May–2 June 2014; pp. 619–623. [Google Scholar] [CrossRef]
- Buldovicz, S.N.; Khilimonyuk, V.Z.; Bychkov, A.Y.; Ospennikov, E.N.; Vorobyev, S.A.; Gunar, A.Y.; Gorshkov, E.I.; Chuvilin, E.M.; Cherbunina, M.Y.; Kotov, P.I.; et al. Cryovolcanism on the Earth: Origin of a Spectacular Crater in the Yamal Peninsula (Russia). Sci. Rep. 2018, 8. [Google Scholar] [CrossRef]
- Romanovskii, N.N.; Hubberten, H.-W.; Gavrilov, A.V.; Eliseeva, A.A.; Tipenko, G.S.; Kholodov, A.L.; Romanovsky, V.E. Permafrost and gas hydrate stability zone evolution on the eastern part of the Eurasia Arctic sea shelf in the middle pleistocene–holocene. Kriosf. Zemli 2003, VII, 51–64. (In Russian) [Google Scholar]
- Istomin, V.A.; Chuvilin, E.M.; Sergeeva, D.V.; Bukhanov, B.A.; Stanilovskaya, Y.V.; Badetz, C. Influence of component composition and pressure of gas on ice and hydrate formation in gas-saturated pore solutions. Neftegazokhimiya 2018, 2, 33–42. [Google Scholar] [CrossRef]
- Shakhova, N.E.; Sergienko, V.I.; Semiletov, I.P. The contribution of the East Siberian shelf to the modern Methane Cycle. Her. Russ. Acad. Sci. 2009, 79, 237–246. [Google Scholar] [CrossRef]
- Shakhova, N.E.; Semiletov, I.P.; Leifer, I.; Salyuk, A.; Rekant, P.; Kosmach, D. Geochemical and geophysical evidence of methane release over the East Siberian Arctic Shelf. Geophys. Res. Oceans 2010, 115, C08007. [Google Scholar] [CrossRef]
Figure 1.
Scheme of experimental setup for modeling the formation and dissociation of pore gas hydrates. 1 = pressure cell; 2 = container with soil samples; 3 = thermistor input sleeve; 4 = hose for circulating liquid; 5 = refrigerated bath; 6 = “thermal coat”; 7 = tephlon gasket; 8 = steel lid; 9 = pressure sensors; 10 = digital pressure gage; 11 = gas bomb; 12 = gas tube; 13 = pressure regulator; and 14 = PC with ADC.

Figure 2.
Record of thermobaric conditions during the hydrate formation in sample silt 2 (W = 20%, Si = 59%) at t = −2.5 °C.
Figure 2.
Record of thermobaric conditions during the hydrate formation in sample silt 2 (W = 20%, Si = 59%) at t = −2.5 °C.

Figure 3.
Consumption of methane during the hydrate formation in sample silt 2 (W = 20%, Si = 59%) at t = −2.5 °C.
Figure 3.
Consumption of methane during the hydrate formation in sample silt 2 (W = 20%, Si = 59%) at t = −2.5 °C.

Figure 4.
Time-dependent methane hydrate and ice saturations (Sh and Si, respectively) in sample silt 2 (W = 20%, Si = 59%) at t = −2.5 °C.
Figure 4.
Time-dependent methane hydrate and ice saturations (Sh and Si, respectively) in sample silt 2 (W = 20%, Si = 59%) at t = −2.5 °C.

Figure 5.
Nucleation and growth of pore gas hydrate particles in frozen gas-saturated soil samples. (a) Initial state (frozen gas-saturated soil, low ice saturation); (b) gas hydrate films at ice-gas interface; and (c) blocked gas-ice contact and transition to volumetric-diffusion hydrate formation.

Figure 6.
Time-dependent pore methane hydrate formation in sample silt 1 (W = 14%, Si = 69%) at different temperatures: (a) whole run duration; and (b) first 5 hours.
Figure 6.
Time-dependent pore methane hydrate formation in sample silt 1 (W = 14%, Si = 69%) at different temperatures: (a) whole run duration; and (b) first 5 hours.

Figure 7.
Time-dependent pore methane hydrate formation in sand 1 (W = 15%, Si = 63%) at different excess pressures (delP) and at a constant temperature of −3.8 °C.
Figure 7.
Time-dependent pore methane hydrate formation in sand 1 (W = 15%, Si = 63%) at different excess pressures (delP) and at a constant temperature of −3.8 °C.

Figure 8.
Time-dependent pore methane hydrate formation in silt 2 at different ice saturations (Si) (29, 59 and 80%) and at −2.9℃.
Figure 8.
Time-dependent pore methane hydrate formation in silt 2 at different ice saturations (Si) (29, 59 and 80%) and at −2.9℃.

Figure 9.
Effect of initial ice saturation (Si) in silt 2 on methane hydrate saturation (Sh) at −2.9 °C.
Figure 9.
Effect of initial ice saturation (Si) in silt 2 on methane hydrate saturation (Sh) at −2.9 °C.

Figure 10.
Time-dependent pore methane hydrate formation in sand 2 (Si = 56%) and silt 2 (Si = 57%) at −3 °C.
Figure 10.
Time-dependent pore methane hydrate formation in sand 2 (Si = 56%) and silt 2 (Si = 57%) at −3 °C.

Figure 11.
Time-dependent pore methane hydrate formation in silt 3 with salinities (Z) 0.58% and 0.18% at −4 °C.
Figure 11.
Time-dependent pore methane hydrate formation in silt 3 with salinities (Z) 0.58% and 0.18% at −4 °C.

Figure 12.
Pore hydrate formation in permafrost upon rapid freezing of a gas-saturated talik: (a) onset of cryogenic concentration of gas; (b) onset of hydrate formation upon freezing; and (c) hydrate formation at negative temperature.
Figure 12.
Pore hydrate formation in permafrost upon rapid freezing of a gas-saturated talik: (a) onset of cryogenic concentration of gas; (b) onset of hydrate formation upon freezing; and (c) hydrate formation at negative temperature.

Figure 13.
Pore hydrate formation in gas-saturated permafrost under ice load: (a) prior to glaciation; and (b) after to glaciation.
Figure 13.
Pore hydrate formation in gas-saturated permafrost under ice load: (a) prior to glaciation; and (b) after to glaciation.

Figure 14.
Pore hydrate formation in gas-saturated permafrost under water load: (a) prior to transgression and (b) after to transgression.
Figure 14.
Pore hydrate formation in gas-saturated permafrost under water load: (a) prior to transgression and (b) after to transgression.


Table 1.
Characteristic of investigated sediments.
| Sample | Origin, Age | Sampling Site | Mineralogy, % | Salinity, % | |
|---|---|---|---|---|---|
| Sand 1 | mJ3 | Lubertsy | Quartz | >90 | 0.01 |
| Sand 2 | gmQII2–4 | Kharasavey OGCF | Quartz | 93.7 | 0.07 |
| Kaolinite + chlorite | 3.5 | ||||
| Microcline | 2.3 | ||||
| Silt 1 | gmQII2–4 | Vorkuta | Microcline + albite | 45 | 0.08 |
| Quartz | 38 | ||||
| Illite | 9 | ||||
| Kaolinite + chlorite | 5 | ||||
| Montmorillonite | 3 | ||||
| Silt 2 | mQIII | Zapolarnoe OGCF | Quartz | 64 | 0.20 |
| XRA | 17 | ||||
| Microcline | 9 | ||||
| Albite | 5 | ||||
| Smectite + hydromica | 3 | ||||
| Silt 3 | gmQII2–4 | Bovanenkovo GCF | Quartz | 59.5 | 0.58 |
| Microcline | 13.6 | ||||
| Albite | 22 | ||||
| Kaolinite + chlorite | 2.4 | ||||
| Illite | 1.5 | ||||
Note: GCF = gas-condensate field; OGCF = oil–gas-condensate field. The listed mineral phases have percentages >1%; XRA = X-Ray amorphous compound.
Table 2.
Particle size distribution.
| Sample | Particle size Distribution, % | Lithology * | ||
|---|---|---|---|---|
| 1–0.05 mm | 0.05–0.001 mm | <0.001 mm | ||
| Sand 1 | 94.8 | 3.1 | 2.1 | Fine sand |
| Sand 2 | 91.9 | 8.1 | 2 | Medium sand |
| Silt 1 | 41.8 | 53.7 | 4.5 | Heavy fine silt |
| Silt 2 | 88 | 4 | 8 | Heavy silt |
| Silt 3 | 59.9 | 35.1 | 5 | Heavy fine silt |
Note: * Lithology is given according to classifications of E. Sergeev (sand) and V. Okhotin (silt) [47].
Table 3.
Initial physical properties of frozen silt 2.
| Sample | Water Content | Density | Porosity | Ice Saturation |
|---|---|---|---|---|
| % | g/cm3 | % | % | |
| Silt 2 | 10 | 1.76 | 50 | 29 |
| 14 | 1.59 | 50 | 43 | |
| 18 | 1.55 | 50 | 52 | |
| 20 | 1.60 | 50 | 59 | |
| 23 | 1.56 | 53 | 66 | |
| 28 | 1.64 | 51 | 77 | |
| 27 | 1.68 | 50 | 80 |
© 2018 by the authors. Licensee MDPI, Basel, Switzerland. This article is an open access article distributed under the terms and conditions of the Creative Commons Attribution (CC BY) license (http://creativecommons.org/licenses/by/4.0/).
Share and Cite
MDPI and ACS Style
Chuvilin, E.; Davletshina, D. Formation and Accumulation of Pore Methane Hydrates in Permafrost: Experimental Modeling. Geosciences 2018, 8, 467. https://0-doi-org.brum.beds.ac.uk/10.3390/geosciences8120467
AMA Style
Chuvilin E, Davletshina D. Formation and Accumulation of Pore Methane Hydrates in Permafrost: Experimental Modeling. Geosciences. 2018; 8(12):467. https://0-doi-org.brum.beds.ac.uk/10.3390/geosciences8120467
Chicago/Turabian StyleChuvilin, Evgeny, and Dinara Davletshina. 2018. "Formation and Accumulation of Pore Methane Hydrates in Permafrost: Experimental Modeling" Geosciences 8, no. 12: 467. https://0-doi-org.brum.beds.ac.uk/10.3390/geosciences8120467
Note that from the first issue of 2016, this journal uses article numbers instead of page numbers. See further details here.