Article

A Weighted Overlay Method for Liquefaction-Related Urban Damage Detection: A Case Study of the 6 September 2018 Hokkaido Eastern Iburi Earthquake, Japan

by
Sadra Karimzadeh
1,2,* and
Masashi Matsuoka
1,3
1
Department of Architecture and Building Engineering, Tokyo Institute of Technology, Yokohama 226-8502, Japan
2
Department of GIS and Remote Sensing, University of Tabriz, Tabriz 5166616471, Iran
3
Geoinformatics Unit, RIKEN AIP, Tokyo 103-0027, Japan
*
Author to whom correspondence should be addressed.
Submission received: 23 October 2018 / Revised: 10 December 2018 / Accepted: 11 December 2018 / Published: 14 December 2018

Abstract

:
We performed interferometric synthetic aperture radar (InSAR) analyses to observe ground displacements and assess damage after the M 6.6 Hokkaido Eastern Iburi earthquake in northern Japan on 6 September 2018. A multitemporal SAR coherence map is extracted from 3-m resolution ascending (track 116) and descending (track 18) ALOS-2 Stripmap datasets to cover the entire affected area. To distinguish damaged buildings associated with liquefaction, three influential parameters from the space-based InSAR results, ground-based LiquickMap (from seismic intensities in Japanese networks) and topographic slope of the study area are considered together in a weighted overlay (WO) analysis, according to prior knowledge of the study area. The WO analysis results in liquefaction potential values that agree with our field survey results. To investigate further, we conducted microtremor measurements at 14 points in Hobetsu, in which the predominant frequency showed a negative correlation with the WO values, especially when drastic coherence decay occurred.

Graphical Abstract

1. Introduction

Generally, earthquakes are among the most disastrous natural events on Earth. Every year, hundreds to thousands of people around the world suffer because of earthquakes. Between 2010 and 2016, more than 260,000 people died as a result of moderate to severe earthquakes [1]. The types of casualties can be categorized into two groups: (1) casualties resulting from the flash effect of an earthquake, mainly due to low-quality construction and site conditions, and (2) casualties resulting from improper disaster response and passage of time. Recent improvements in remote sensing satellite observations have provided a unique opportunity for researchers and organizations to study not only different phenomena and events from space, but also health of civil structures (e.g., dams, bridges, buildings, etc.) to predict possible future damage. These techniques will help to decrease the response times of decision makers [2,3,4,5,6].
After severe earthquakes, collateral hazards, such as landslides, fires and liquefaction, can damage urban and natural environments [7,8,9]. In the liquefaction phenomenon, the stiffness and strength of soil becomes weaker due to earthquake shaking or other rapid loadings which can damage buildings and infrastructure. In the field of urban damage detection, investigations using synthetic aperture radar (SAR) imagery were promoted when the European Remote Sensing Satellites (ERS-1 and 2) and Japanese Earth Resources Satellite (JERS-1) were launched in 1991, 1995 and 1992, respectively [10,11,12,13]. For liquefaction-related damage, both optical and SAR remote-sensing methods have been developed, but because of visual interpretations of optical images, the classification of liquefaction-related urban damage is straightforward. For instance, Ramakrishnan et al. [14]. used remote-sensing multispectral data after the Bhuj earthquake in India (2001) to derive the liquefaction sensitivity index (LSeI), which is effective in the near infrared and shortwave infrared regions of the electromagnetic spectrum, as these regions are highly absorbed by soil moisture. Oommen et al. [15] investigated the same event (Bhuj earthquake) using pre- and post-event Landsat 7 (ETM+) data to hypothesize that increased moisture and spectral bands/transformations sensitive to soil moisture can be used as indicators to detect liquefaction-related areas, as liquefaction occurs in saturated granular soils due to an increase in pore pressure. Ishitsuka et al. [16] presented a methodology for soil liquefaction mapping of the Tohoku earthquake (2011) using both phase and reflective intensity information of L-band SAR images from the ALOS-1 satellite.
The main focus of this paper is combining the space-based interferometric synthetic aperture radar (InSAR) technique and ground-based observations from Japanese seismic networks after the Hokkaido Eastern Iburi earthquake to detect liquefaction-related damages at urban scales and estimate large-scale surface displacements, such as landslides, over wide areas using six ascending and descending orbit ALOS-2 images. The large-scale movements after this event are obvious and can be confirmed without ground-based observations. However, to better assess liquefaction damage and the relationships between SAR coherence and the thickness of the sedimentary layers, we conducted microtremor observations in Hobetsu.

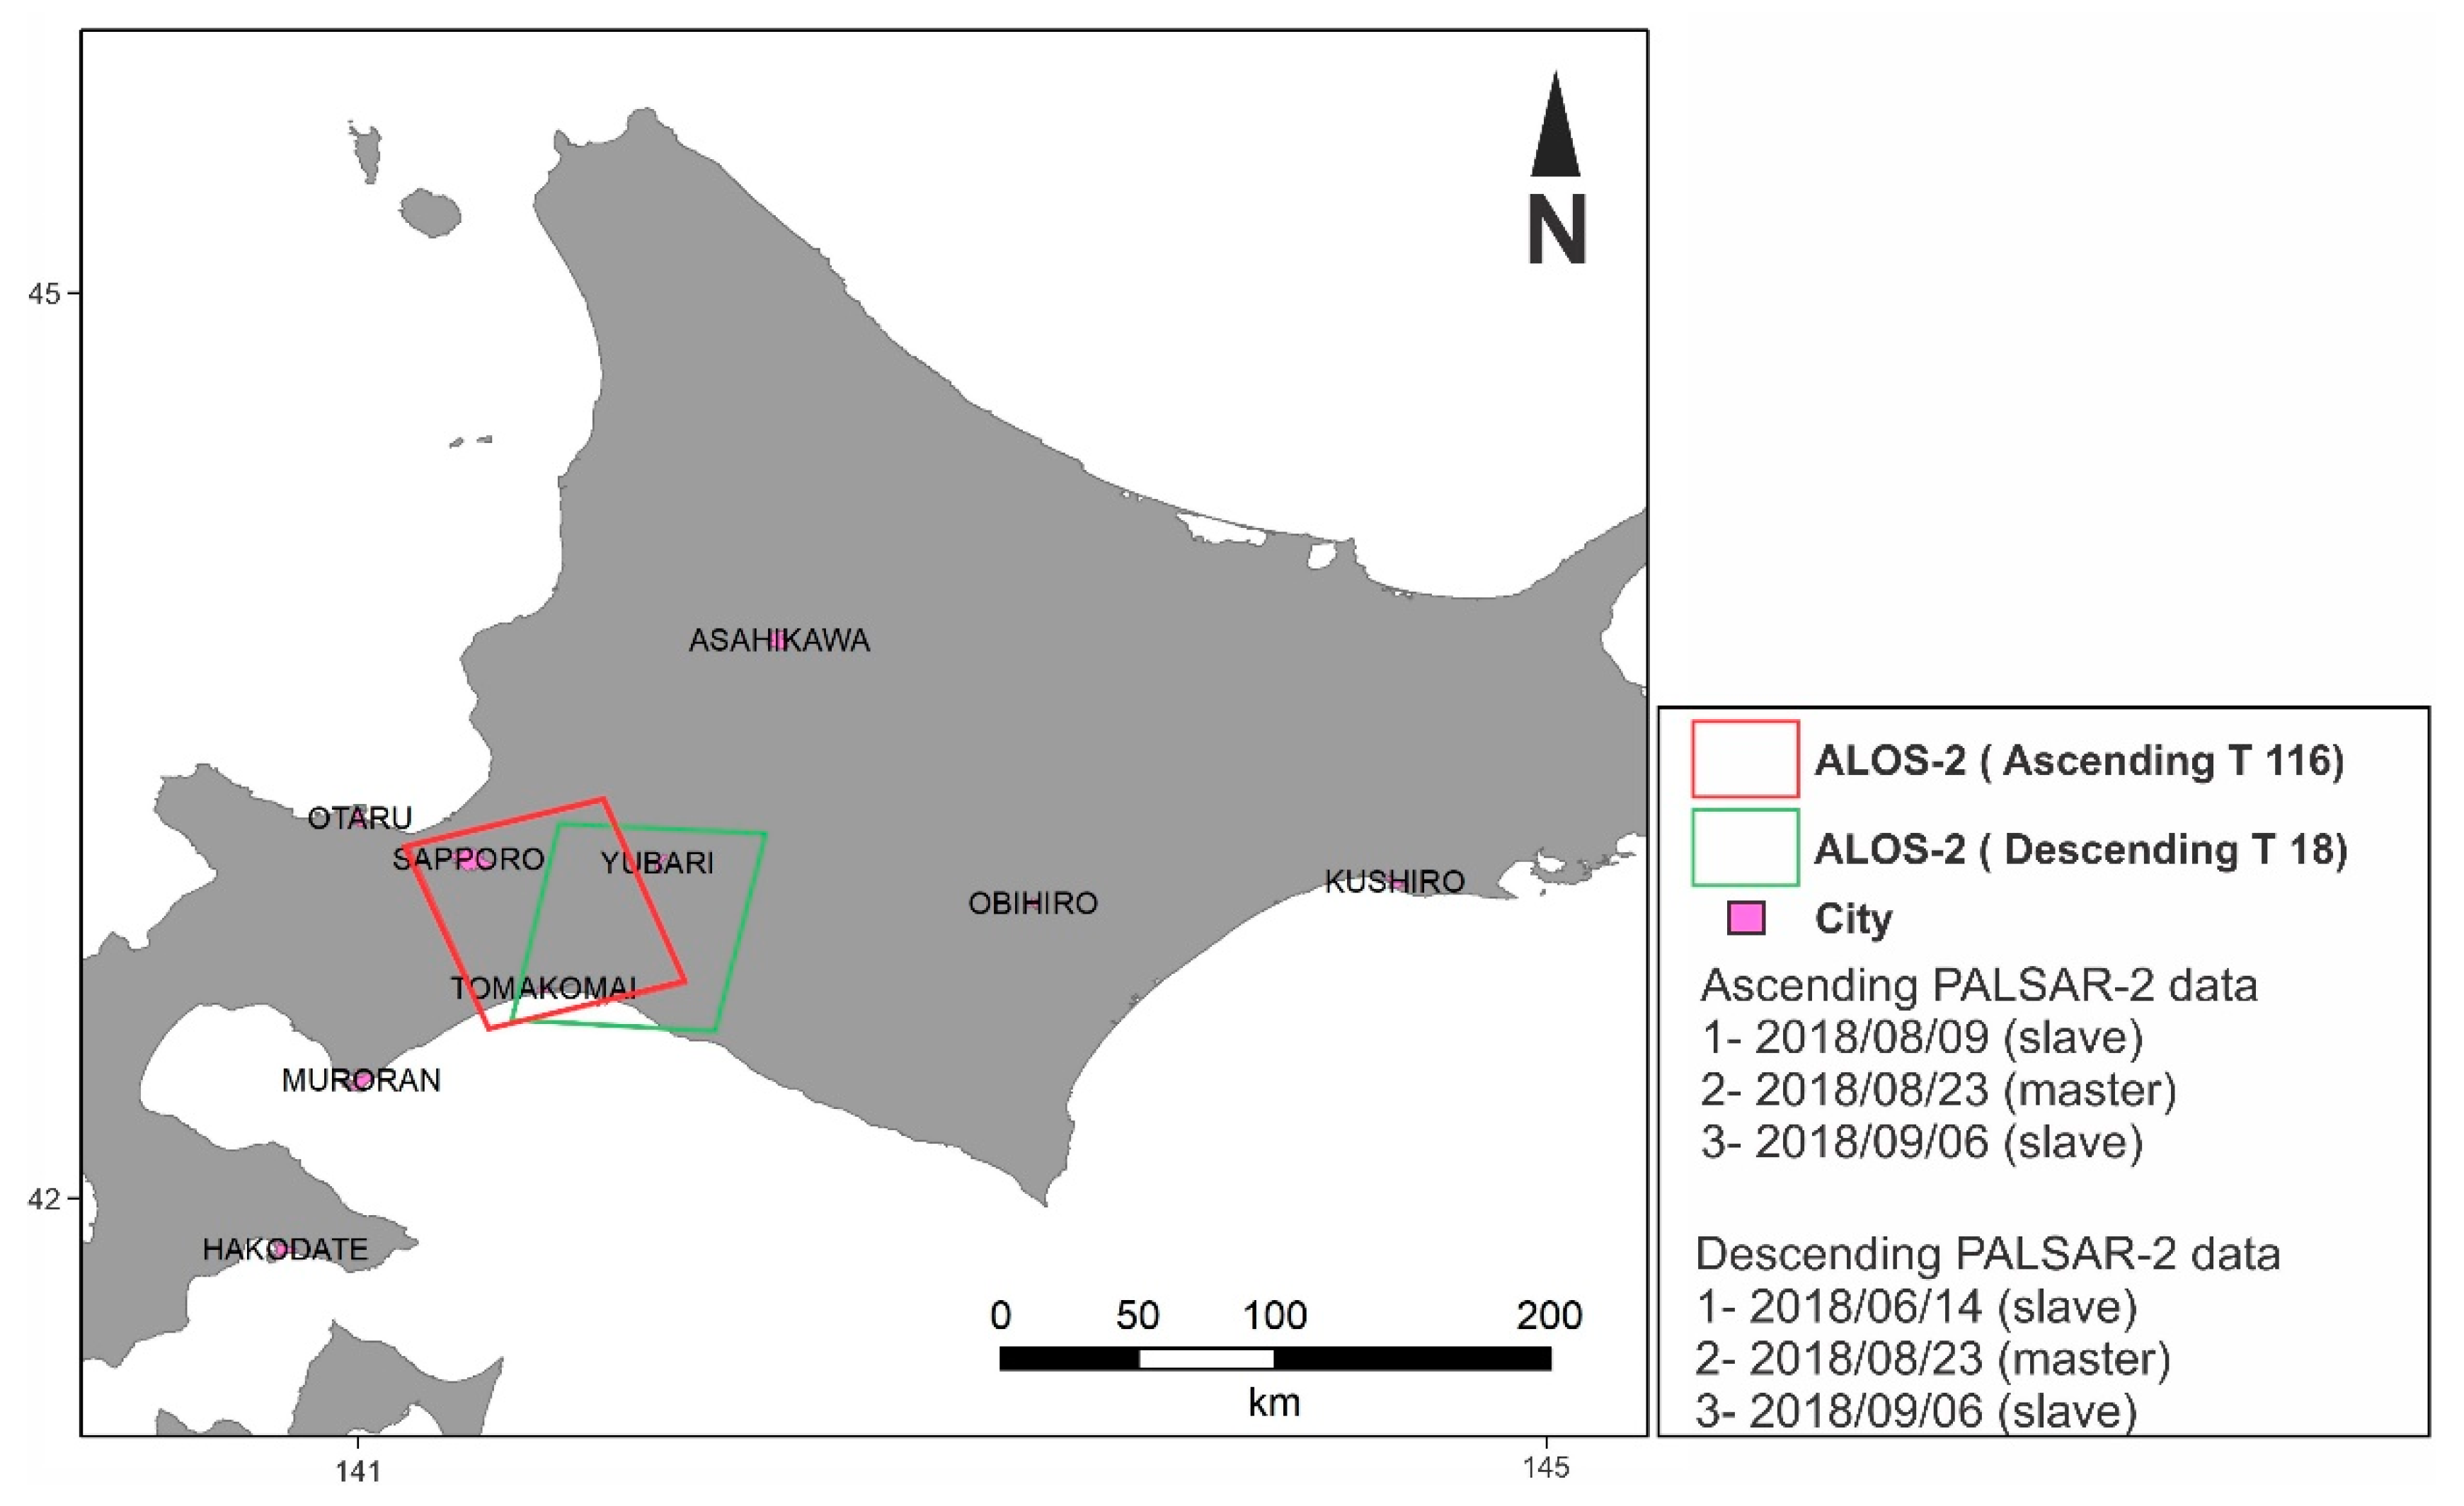
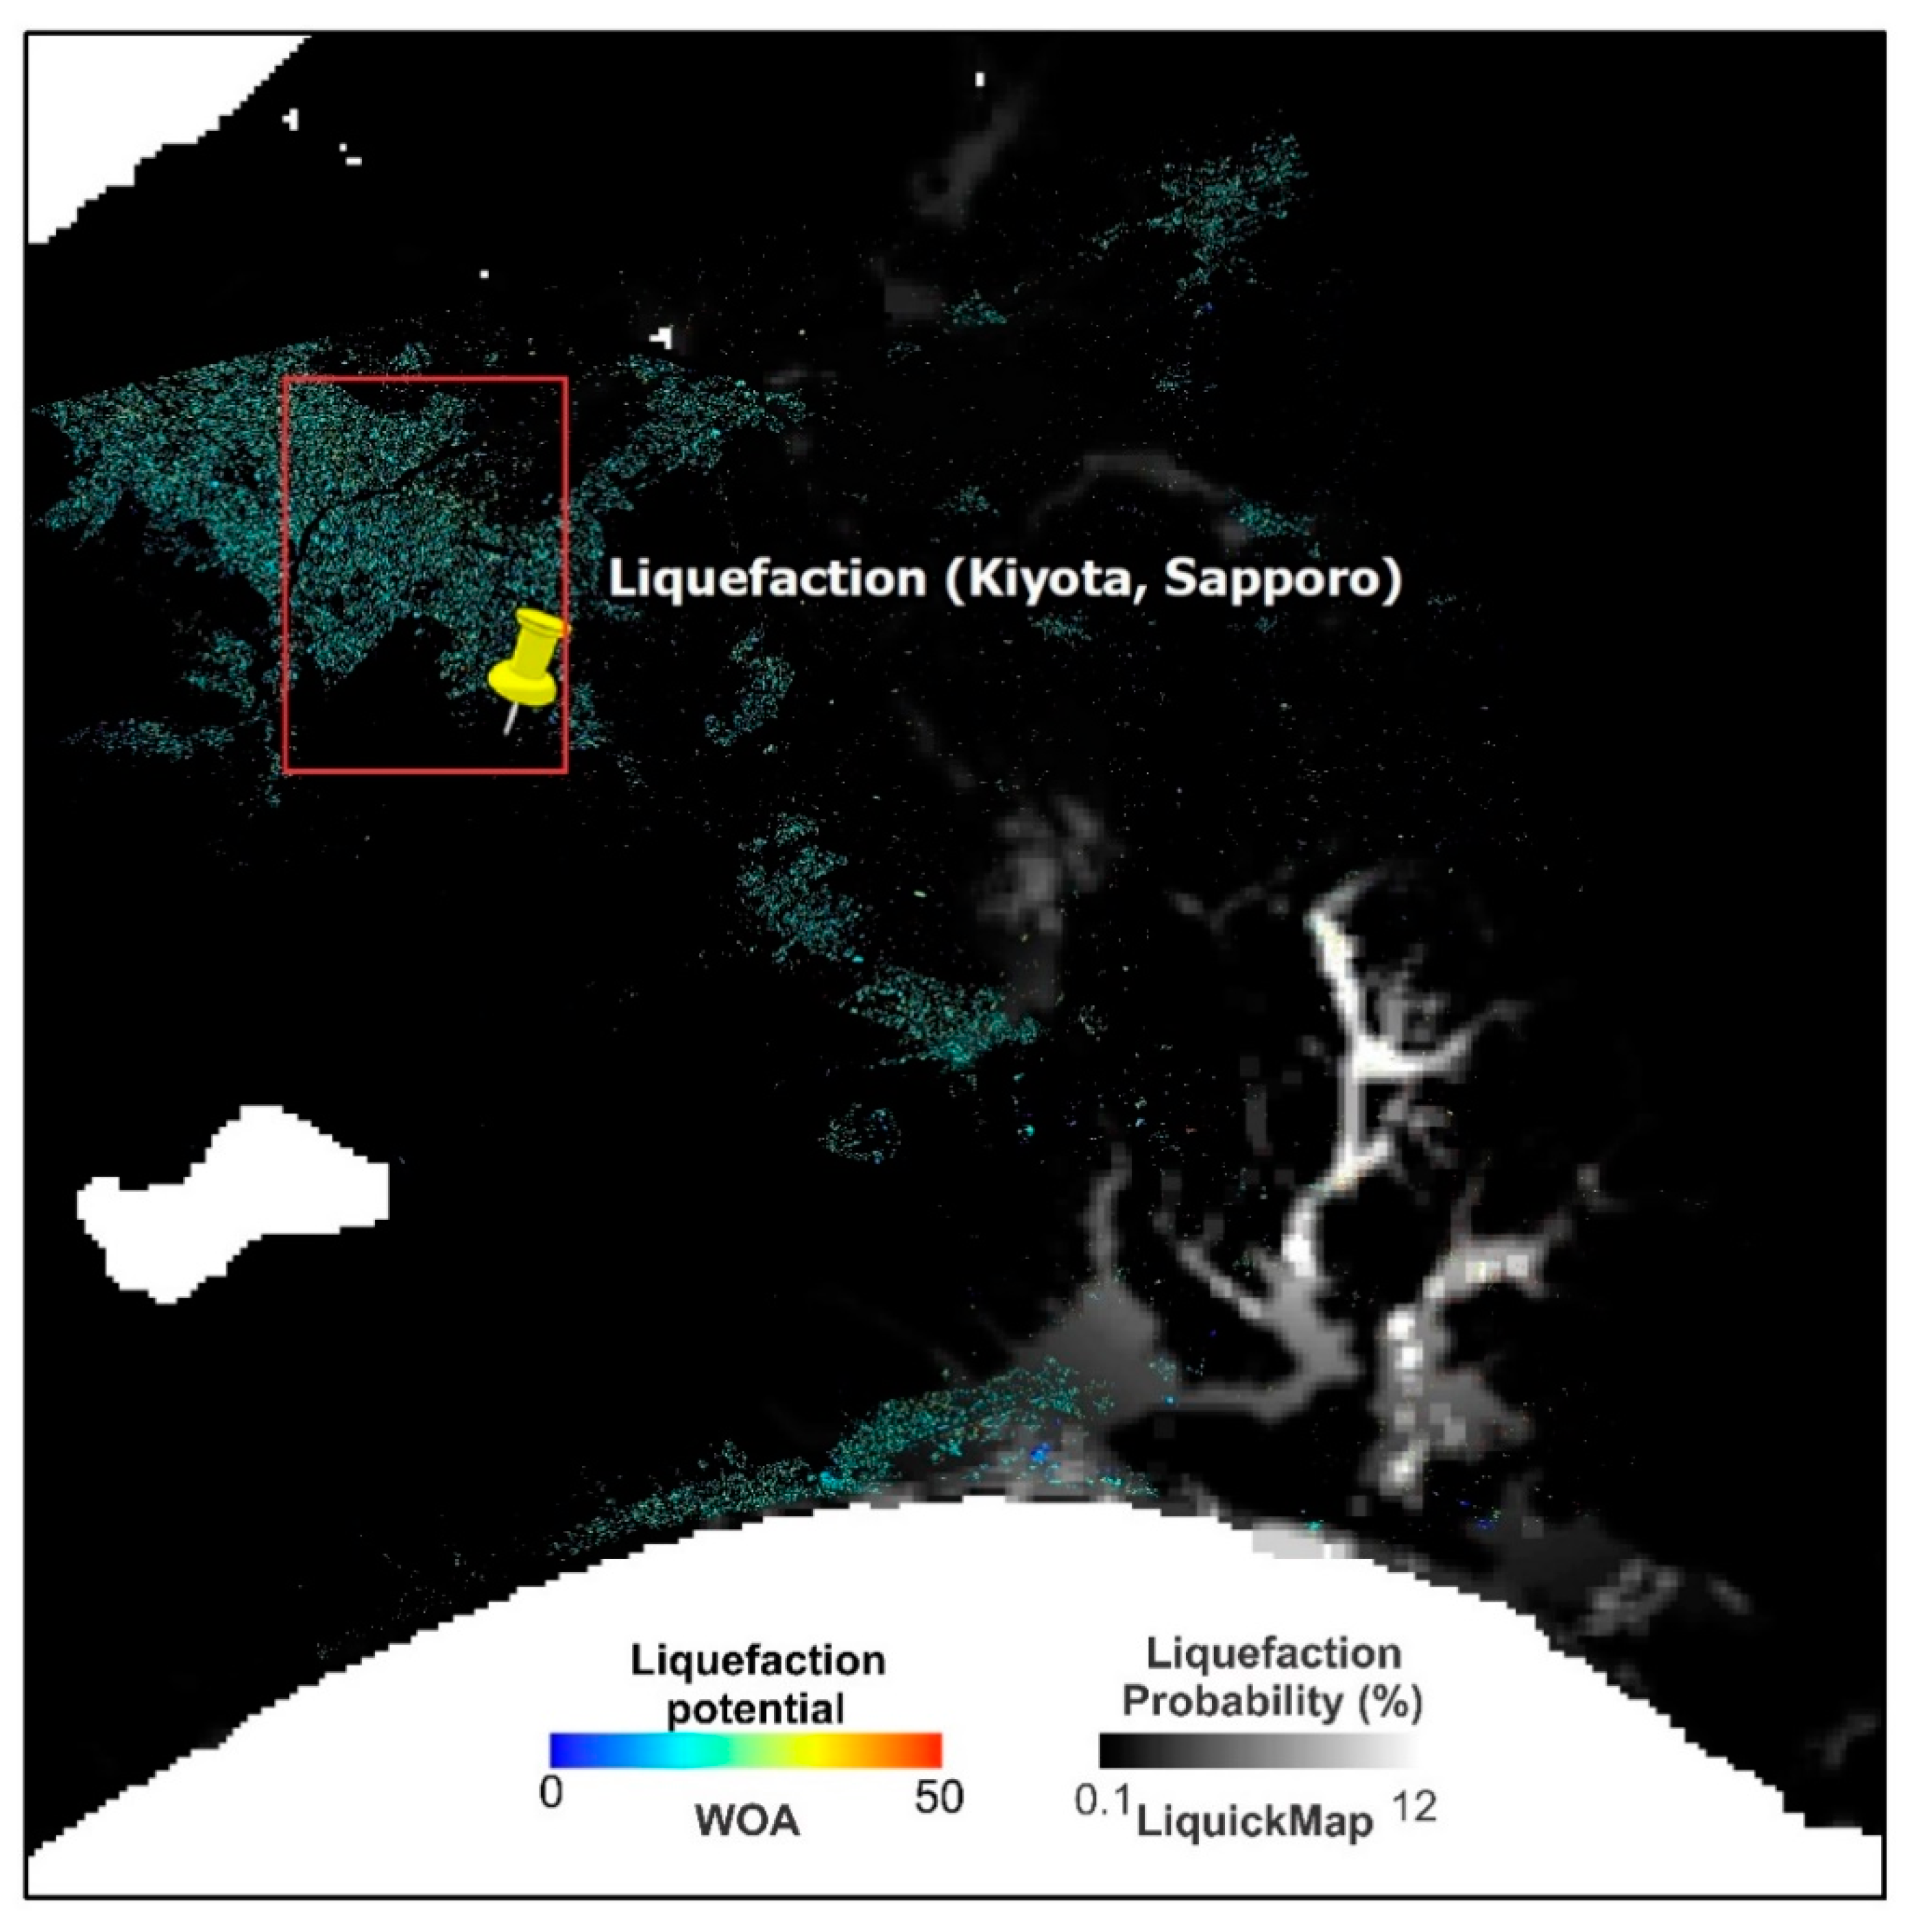
2. Study Area and LiquickMap

A powerful earthquake (M 6.6), the largest one in northern Japan, took place on 6 September 2018 near Tomakomai on the island of Hokkaido. According to the United States Geological Survey (USGS), the event occurred with a reverse mechanism at a depth of 35 km at 42.686° N, 141.929° E and resulted in 41 casualties, most of which were reported to occur in Atsuma, north of the epicenter [17,18], due to direct and indirect impacts of the earthquake. Many landslides were triggered in the surrounding areas because the soil was extremely wet after a heavy typhoon, which had occurred just a few days before the earthquake [9]. After the earthquake, PAGER (Prompt Assessment of Global Earthquakes for Response) announced that the level of loss estimation was at a “yellow” level, which meant that the number of casualties would likely be between 10 and 100. PAGER also announced that economic losses were at the “orange” level, which meant that the estimated economic losses were less than 1% of Japan’s GDP (gross domestic product) [18,19]. The Quiquake (quick estimation system for earthquakes) portal also released auxiliary information about this event, such as peak ground acceleration (PGA), peak ground velocity (PGV), and a liquefaction probability map (LiquickMap). LiquickMap is a system that evaluates the liquefaction probabilities of strong seismic events. LiquickMap is the result of overlaying Japan’s engineering geomorphologic classification map with post-event seismic intensity information, and its construction can be followed in three steps. In the first step, the spatial distributions of the instrumental seismic intensity of ten recently occurring earthquakes that were followed by the liquefaction phenomenon are calculated. Second, by comparing the results of the seismic intensity distributions with liquefied sites during an earthquake, the ratio of liquefaction occurrence is estimated. In the third step, geomorphological classes with similar liquefaction susceptibilities are merged and a regression method is applied to estimate the final liquefaction occurrence probability from the instrumental seismic intensity [20]. The seismic intensity map is also produced from QuickMap and QuakeMap, which are derived from strong-motion data at seismic stations operated by the National Research Institute for Earth Science and Disaster Prevention (NIED) [21,22,23]. LiquickMaps are helpful for decision making by local governments and companies regarding disaster responses and business continuity. LiquickMaps are generated in terms of digital numbers (DNs) that can be converted to probabilities (in percentage) using Equation (1). The DNs are cell values in which imagery represents the strength of the signal (amount of light) that is assigned to each grid cell or pixel.
L I Q   ( % ) = 10 ( 0.010244 D N ) 1
Figure 1 shows the LiquickMap of the Hokkaido Eastern Iburi earthquake (in percentage) with a spatial resolution of 7.5 arc-seconds in latitude and 11.25 arc-seconds in longitude (approximately 250 m2). Figure 1 reveals that the maximum probability of liquefaction is 12%, mainly west and NW of the epicenter where the geomorphological classes are likely alluvial fans and the seismic intensity is severe. Usually, LiquickMap results depend on the distance between sites and the epicenter; sometimes, the results underestimate liquefaction probabilities over far distances. In Tomakomai, the maximum probability of liquefaction was 4%, whereas in Sapporo, the probability was 0 or 0.1%.

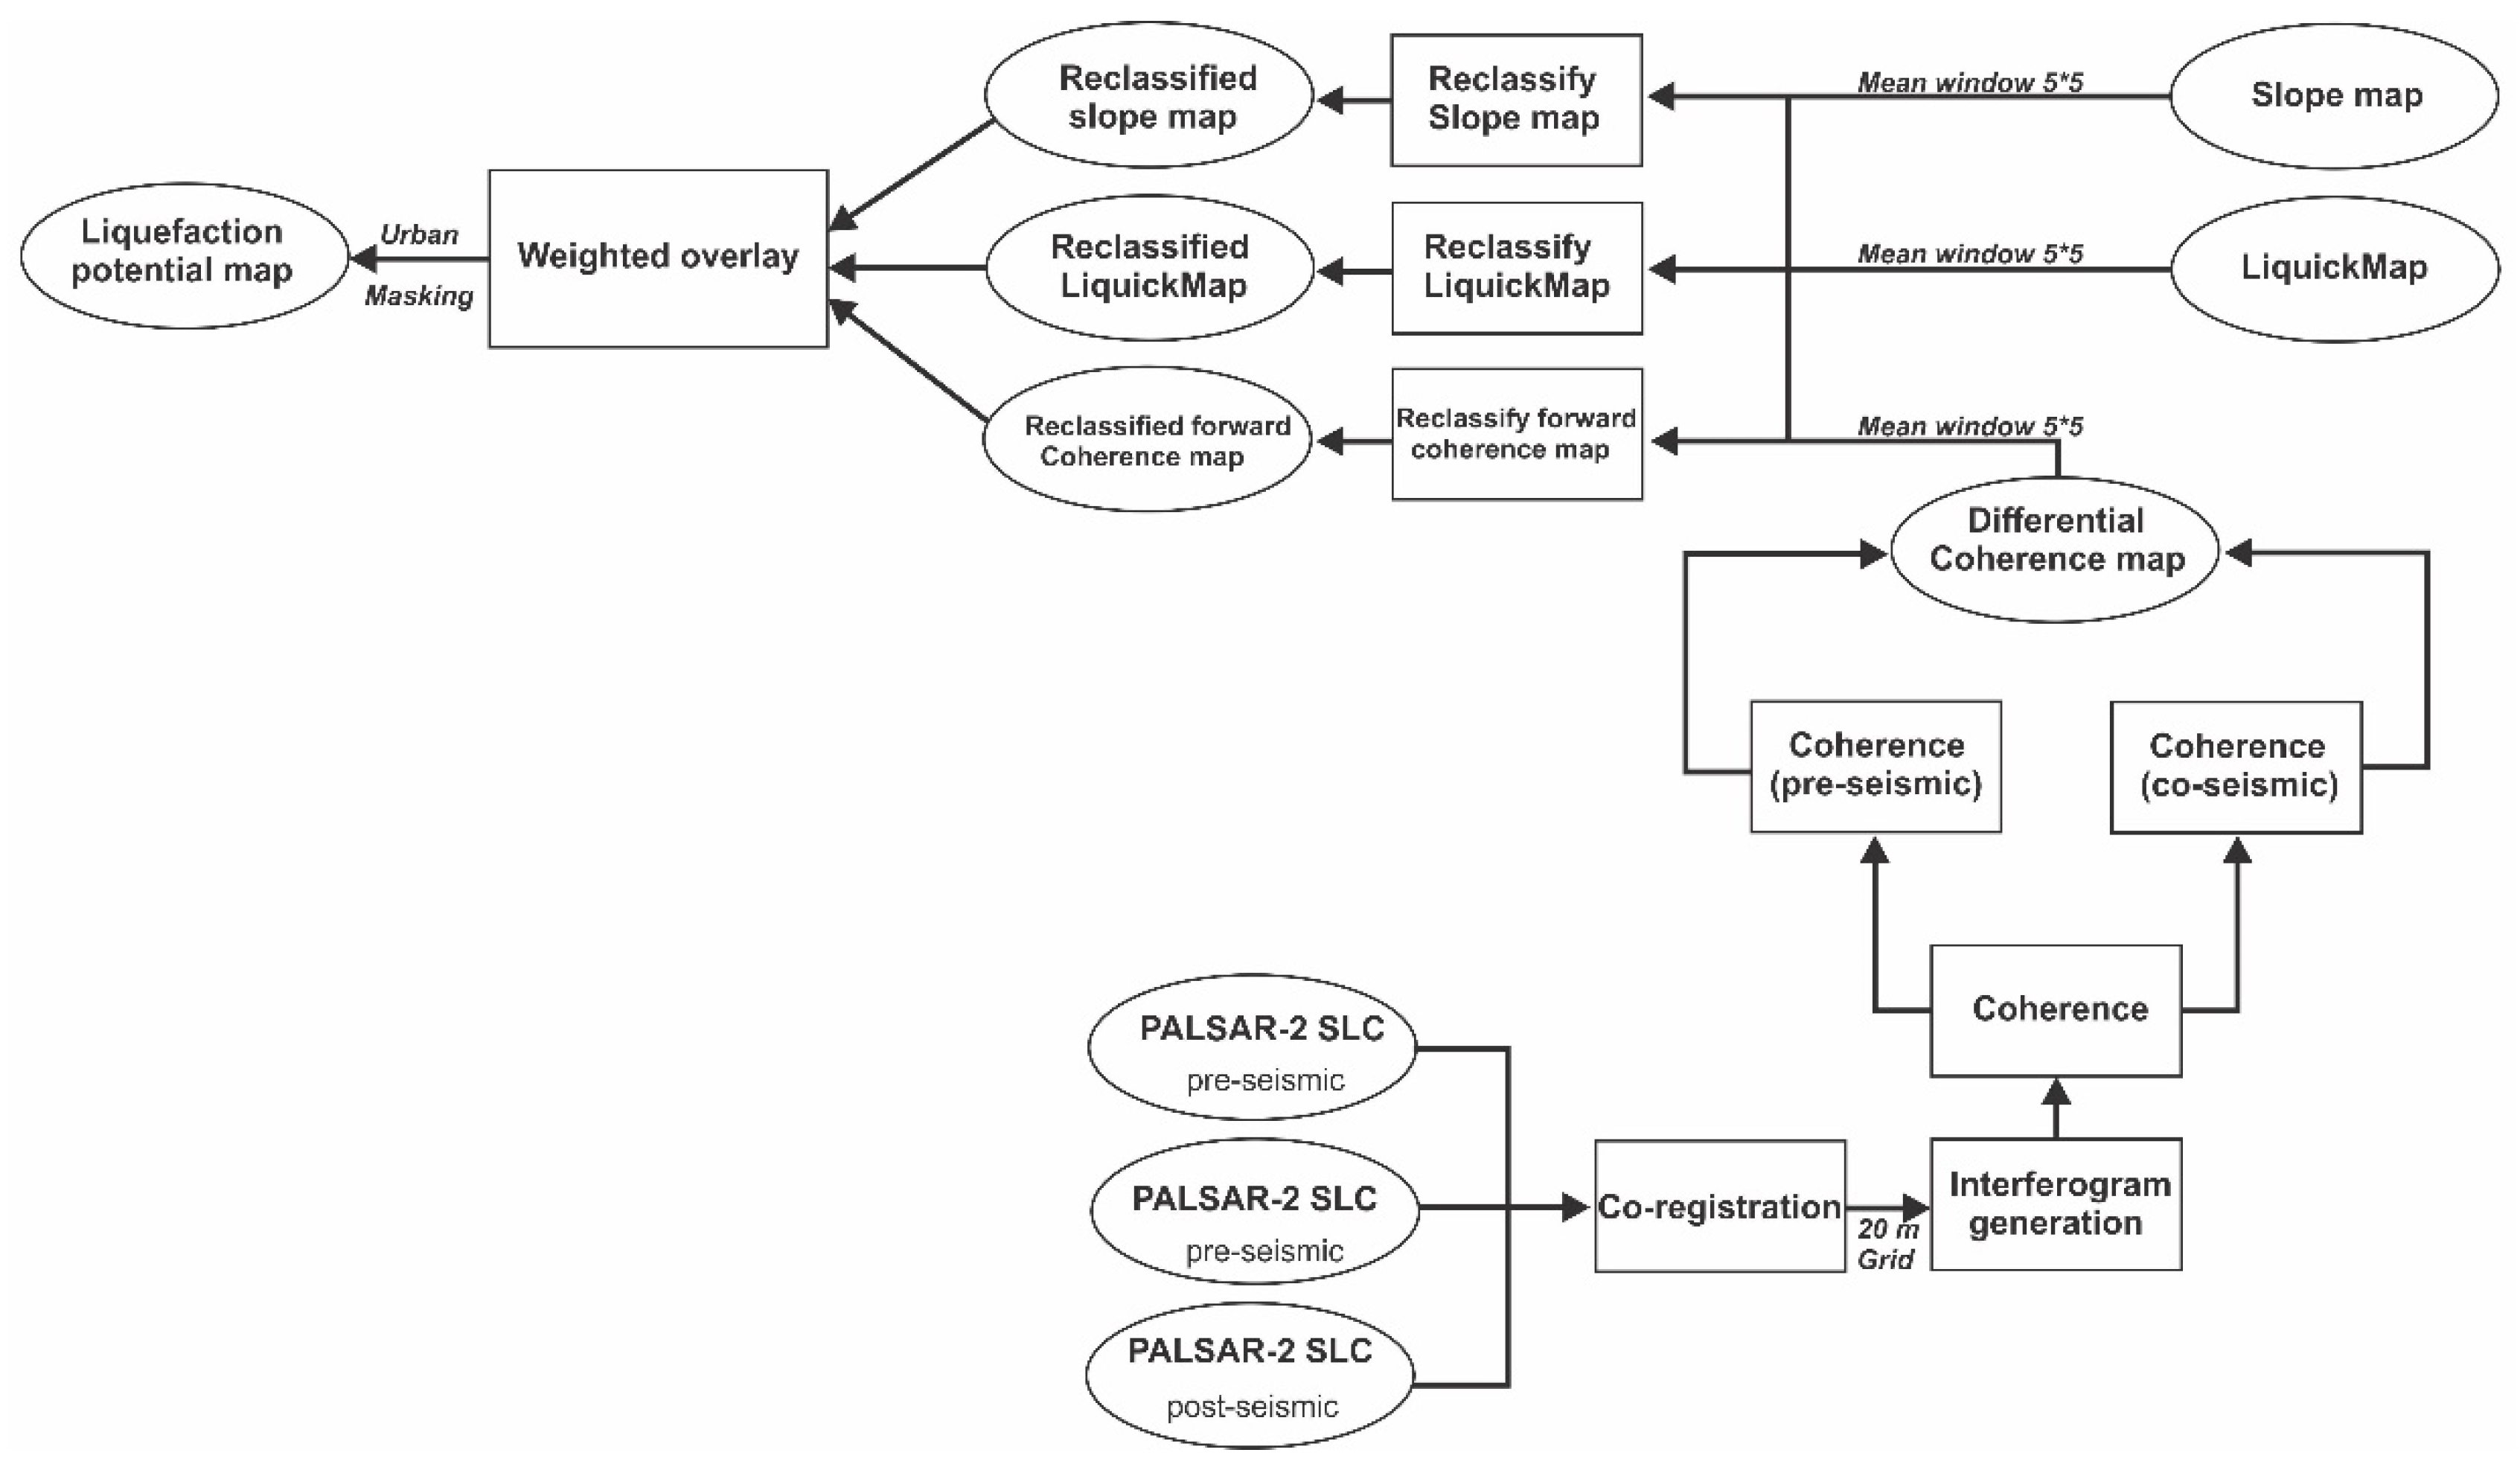
3. Materials and Methods
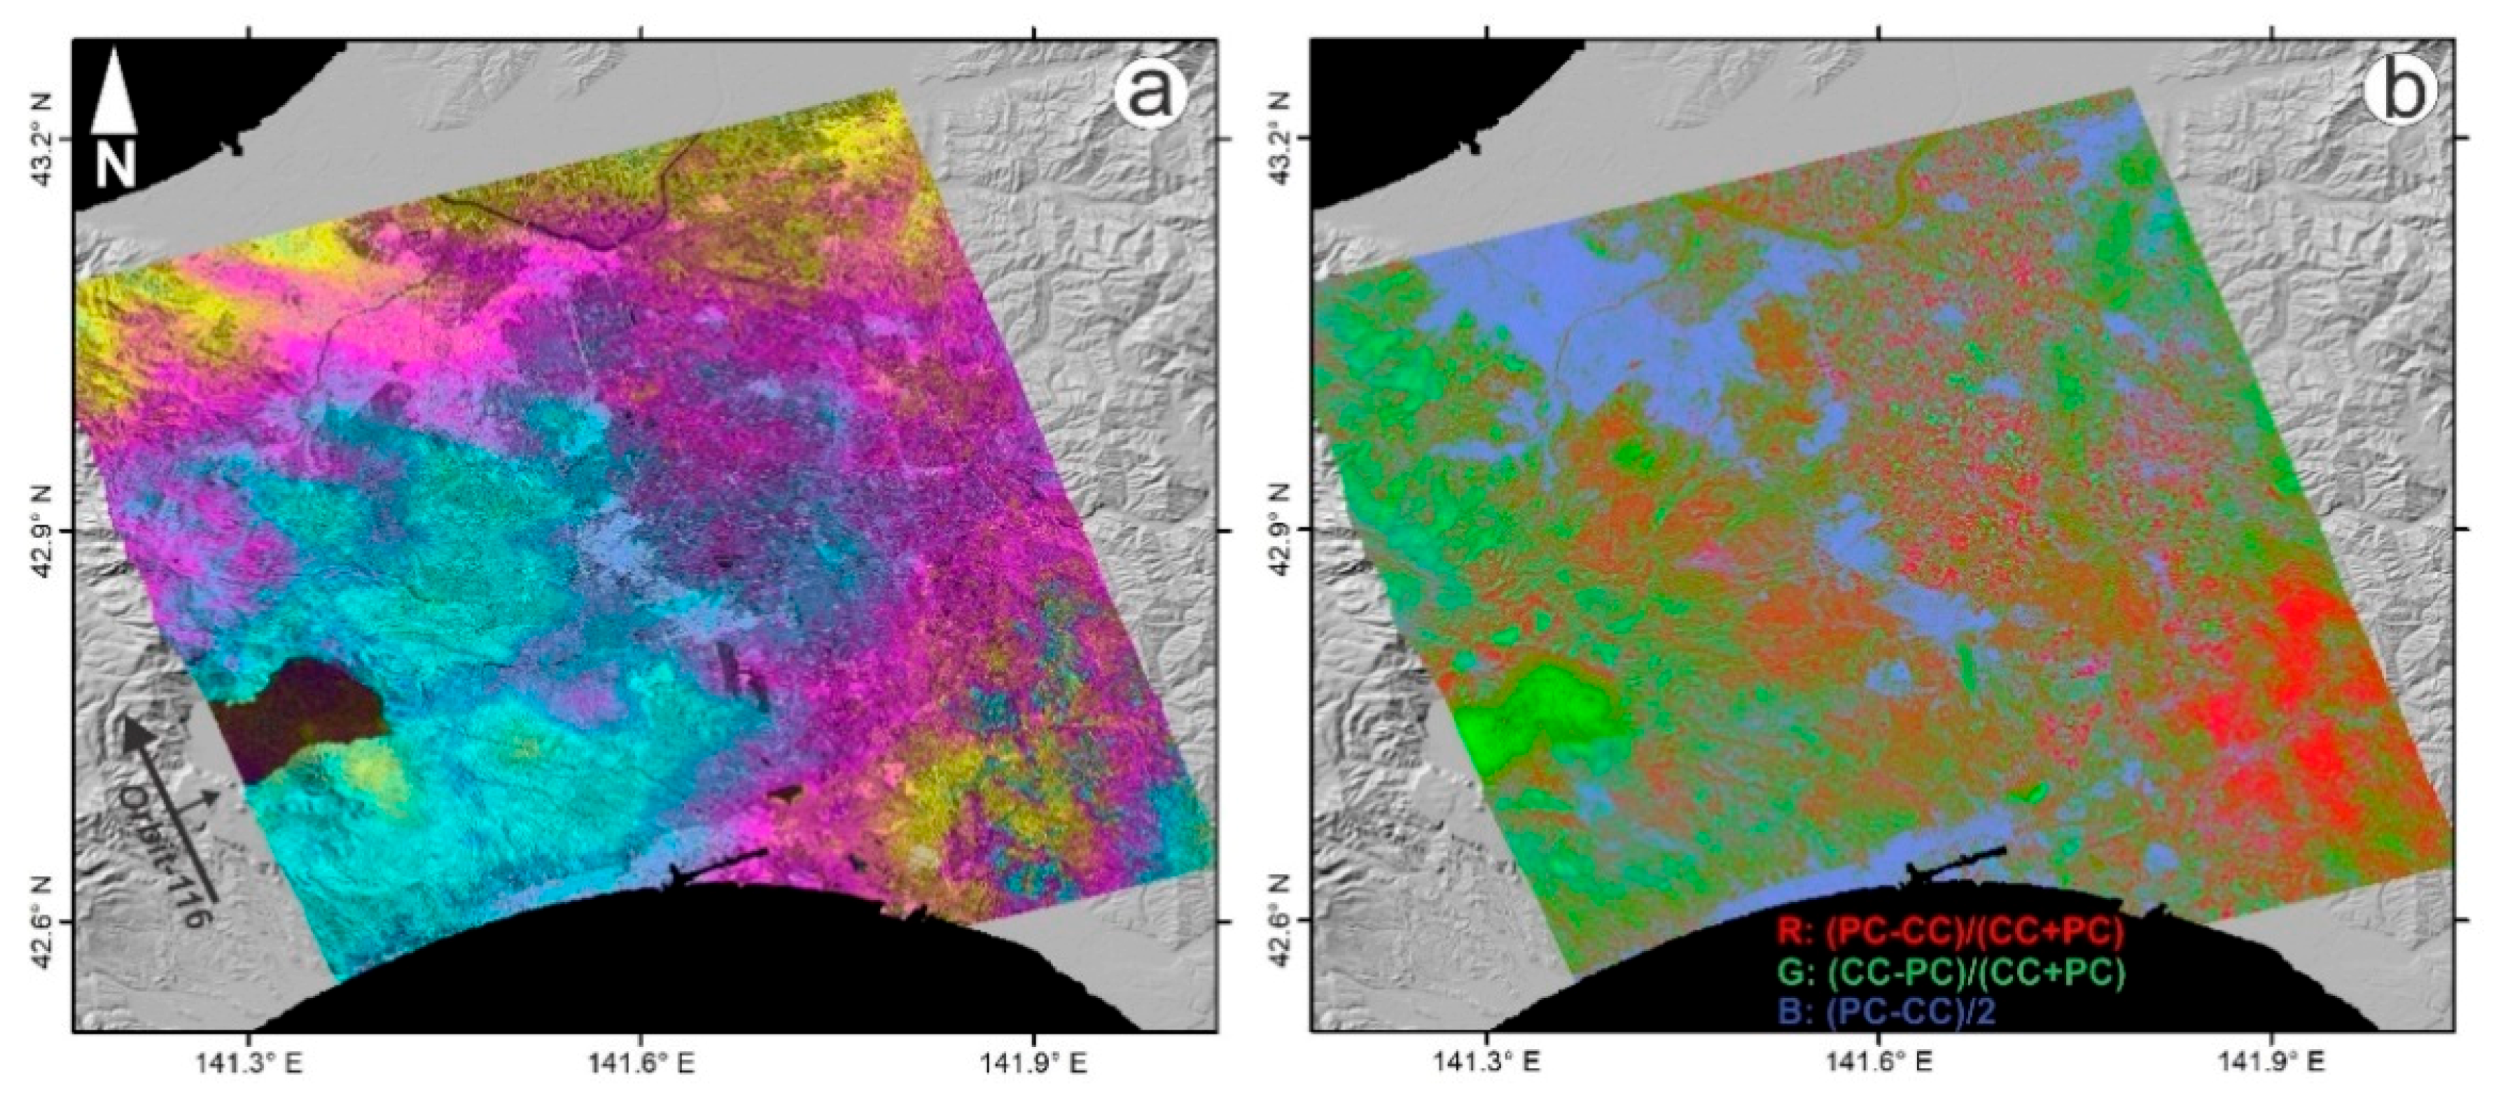
Here, to increase the quality and accuracy of the liquefaction-related damage assessment, we used a combination of several datasets including SAR coherence results, LiquickMap and digital elevation models. We obtained a total of 6 single look complex (SLC) PALSAR-2 images from the ALOS-2 satellite, which covered a 55 km × 70 km area. Three images from ascending track 116 and three images from descending track 18 with high resolution (3 m) at the 1.1 level were considered for the interferometric analysis (Figure 2). To keep the SAR image noise levels at an acceptable level, for track 116, we applied 9 and 11 looking factors in the range and azimuth directions, respectively, and for track 18, we applied 8 and 9 looking factors in the range and azimuth directions, respectively. The abovementioned looking factors produced the closest square pixel shape with a resolution of approximately 20 m × 20 m for each dataset. Both the spatial (normal) and temporal baselines of track 116 were considerably smaller than those of track 18. Therefore, we expected to obtain more reliable results in terms of displacement and damage-related changes from the InSAR results of the ascending track dataset. In addition, the differences in incidence angles for pre-seismic and co-seismic pairs of track 116 were 0.005 and 0.006, respectively, whereas in track 18, the differences in incidence angles for pre-seismic and co-seismic pairs were 0.018 and 0.010, respectively. We generated initial interferograms for both pre-seismic and co-seismic conditions. Then, we removed topographic phases using the SRTM (Shuttle Radar Topography Mission) 30 m digital elevation model and applied an interferogram filtering method to reduce phase noise [24,25]. Overall, the influential parameters of track 116 were better for coherence-based change detection. Table 1 shows the relevant parameters of the PALSAR-2 datasets. Figure 3 also shows the different steps of the InSAR analysis, including co-registration, coherence generation and contribution of differential coherence in the creation of the weighted overlay (WO) map.
As previously mentioned, due to the large temporal baseline of track 18, only the interferogram and RGB color composite map of track 116 are shown in Figure 4. The co-seismic interferogram of track 116 in Figure 4a shows that the seismic signals or fringes are unfortunately not visible from the ALOS-2 images, which is probably because of the earthquake depth of 35 km beneath the surface. Although tectonic signals were not visible in the fringes, there are some small fringes in the eastern (nonurban) part of the region, indicating that most of the fringes are gravitational movements and landslides. We applied a normalized RGB color composite method to visualize types of changes in which subtraction of pre-seismic from co-seismic coherence results in forward changes (red band), and subtraction of co-seismic from pre-seismic results in reverse changes (green band) [26,27]. Generally, forward changes are associated with earthquake-related changes. Thus, as shown in Figure 4b, the abovementioned landslides can be easily seen in red. Notably, the small, reddish areas are not landslides. Green areas are associated with vegetation growth because we defined the green band as a reverse change (subtraction of co-seismic coherence and pre-seismic coherence) on the Earth’s surface. In absence of any seismic activity, the co-seismic coherence will be larger than the pre-seismic coherence map which is mainly associated with vegetation growth. Blue areas are also considered as the mean value of co-seismic coherence and pre-seismic coherence. The mean values here reflect fair characteristics of stable areas (i.e., urban areas).
As mentioned in the previous section, LiquickMap did not detect the damage probability in the southern part of Sapporo, and thus, a new liquefaction potential map was generated using the results of forward coherence together with the slope map and initial LiquickMap. Because we used the unique value of each building’s centroid, it was better to apply an averaging 5 × 5 window size to reduce the uncertainty. WO analysis is not possible as long as the number of classes for each item is not equal. Thus, the results of the forward coherence map, slope map and LiquickMap should be reclassified. The LiquickMap, forward coherence and slope map are continuous (floating-point) rasters, and the WO analysis only accepts raster maps with integer values as input, such as a raster of land use or soil types. The reclassification process also helped to input the items with an integer modality. In this study, the classification of each map using equal intervals was not effective. This classification method does not consider how our maps are distributed along the number line. For example, we assumed that liquefaction probability should be high in low and gentle slopes, but liquefaction probability should be low in steep slopes due to low erosion and soil type. However, the equal interval method classifies the greatest percentage of steep slopes into a gentle slope class or many gentle slope areas that fall into the lower classes, resulting in an unsuitable classification method for liquefaction occurrence. Here, we reclassified each map into a common preference scale using natural break classification to determine the best arrangement of values into different classes. One advantage for natural break classification is that this method minimizes the average deviation of each class with respect to the mean values of that class while maximizing each class’s deviation from the mean values of the other classes. We reclassified all the maps into 50 classes and used prior knowledge of liquefaction damage. We applied the WO analysis to solve our multicriteria problem and assigned a percentage influence based on the importance of the inputs. If we assume that the total influence of all reclassified maps is 100%, the forward coherence map is 85%, the LiquickMap is 10% and the slope map is 5%. Here, the weight allocation was considered empirically based on the experiences and lessons of the previous events. For example, based on the contribution of each slope position (i.e., flat areas, lower slope, higher slope, etc.), we concluded that the liquefaction potential is low in higher slope positions due to the rather large size of soil or stones. The analytical hierarchy process (AHP) or other decision-making models can help us to improve weight allocation methods in future studies. Urban footprints of the Hokkaido region provided by the Geospatial Information Authority of Japan (GSI) were used to mask the final WO map.
In addition, we conducted a field survey and microtremor measurements in several parts of Hokkaido during October 2018 to evaluate the relationship between the liquefaction-related damage due to sedimentary thickness and the WO pixel value [28,29]. The measurements were completed in the Kiyota ward (Sapporo) and Hobetsu using a JU410 instrument made by the Hakusan Kogyo Corporation (Tokyo, Japan), which includes a data logger, battery and three-component accelerometer. The sampling frequency was set at 200 Hz, and the measurements were taken within 5–10 min depending on the site conditions. The ratio of the H/V spectra is calculated from the following equation:
H / V = ( N S V ) 2 × ( E W V ) 2 2
where N S and E W are the horizontal components and V represents the vertical component. We used an average value of 6 stable segments with 4096 points (20.48 s) [30], and the measurements were smoothed using a Parzen filter at 0.2 Hz to show the peak of the spectrum. The predominant frequencies of 14 points in Hobetsu were extracted and compared with the WO and forward coherence values. In the next section, the results of both the WO analysis and the microtremor measurements are presented.

4. Results

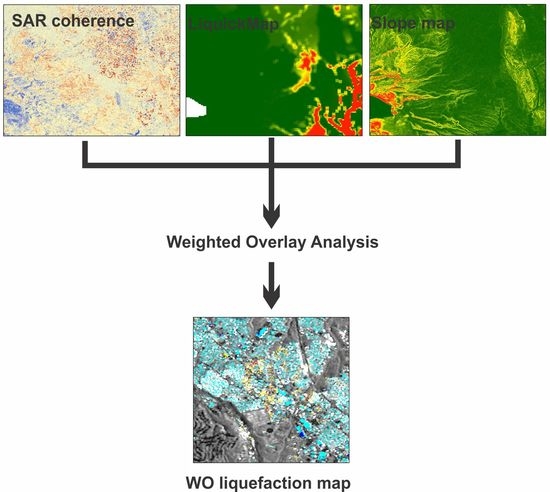
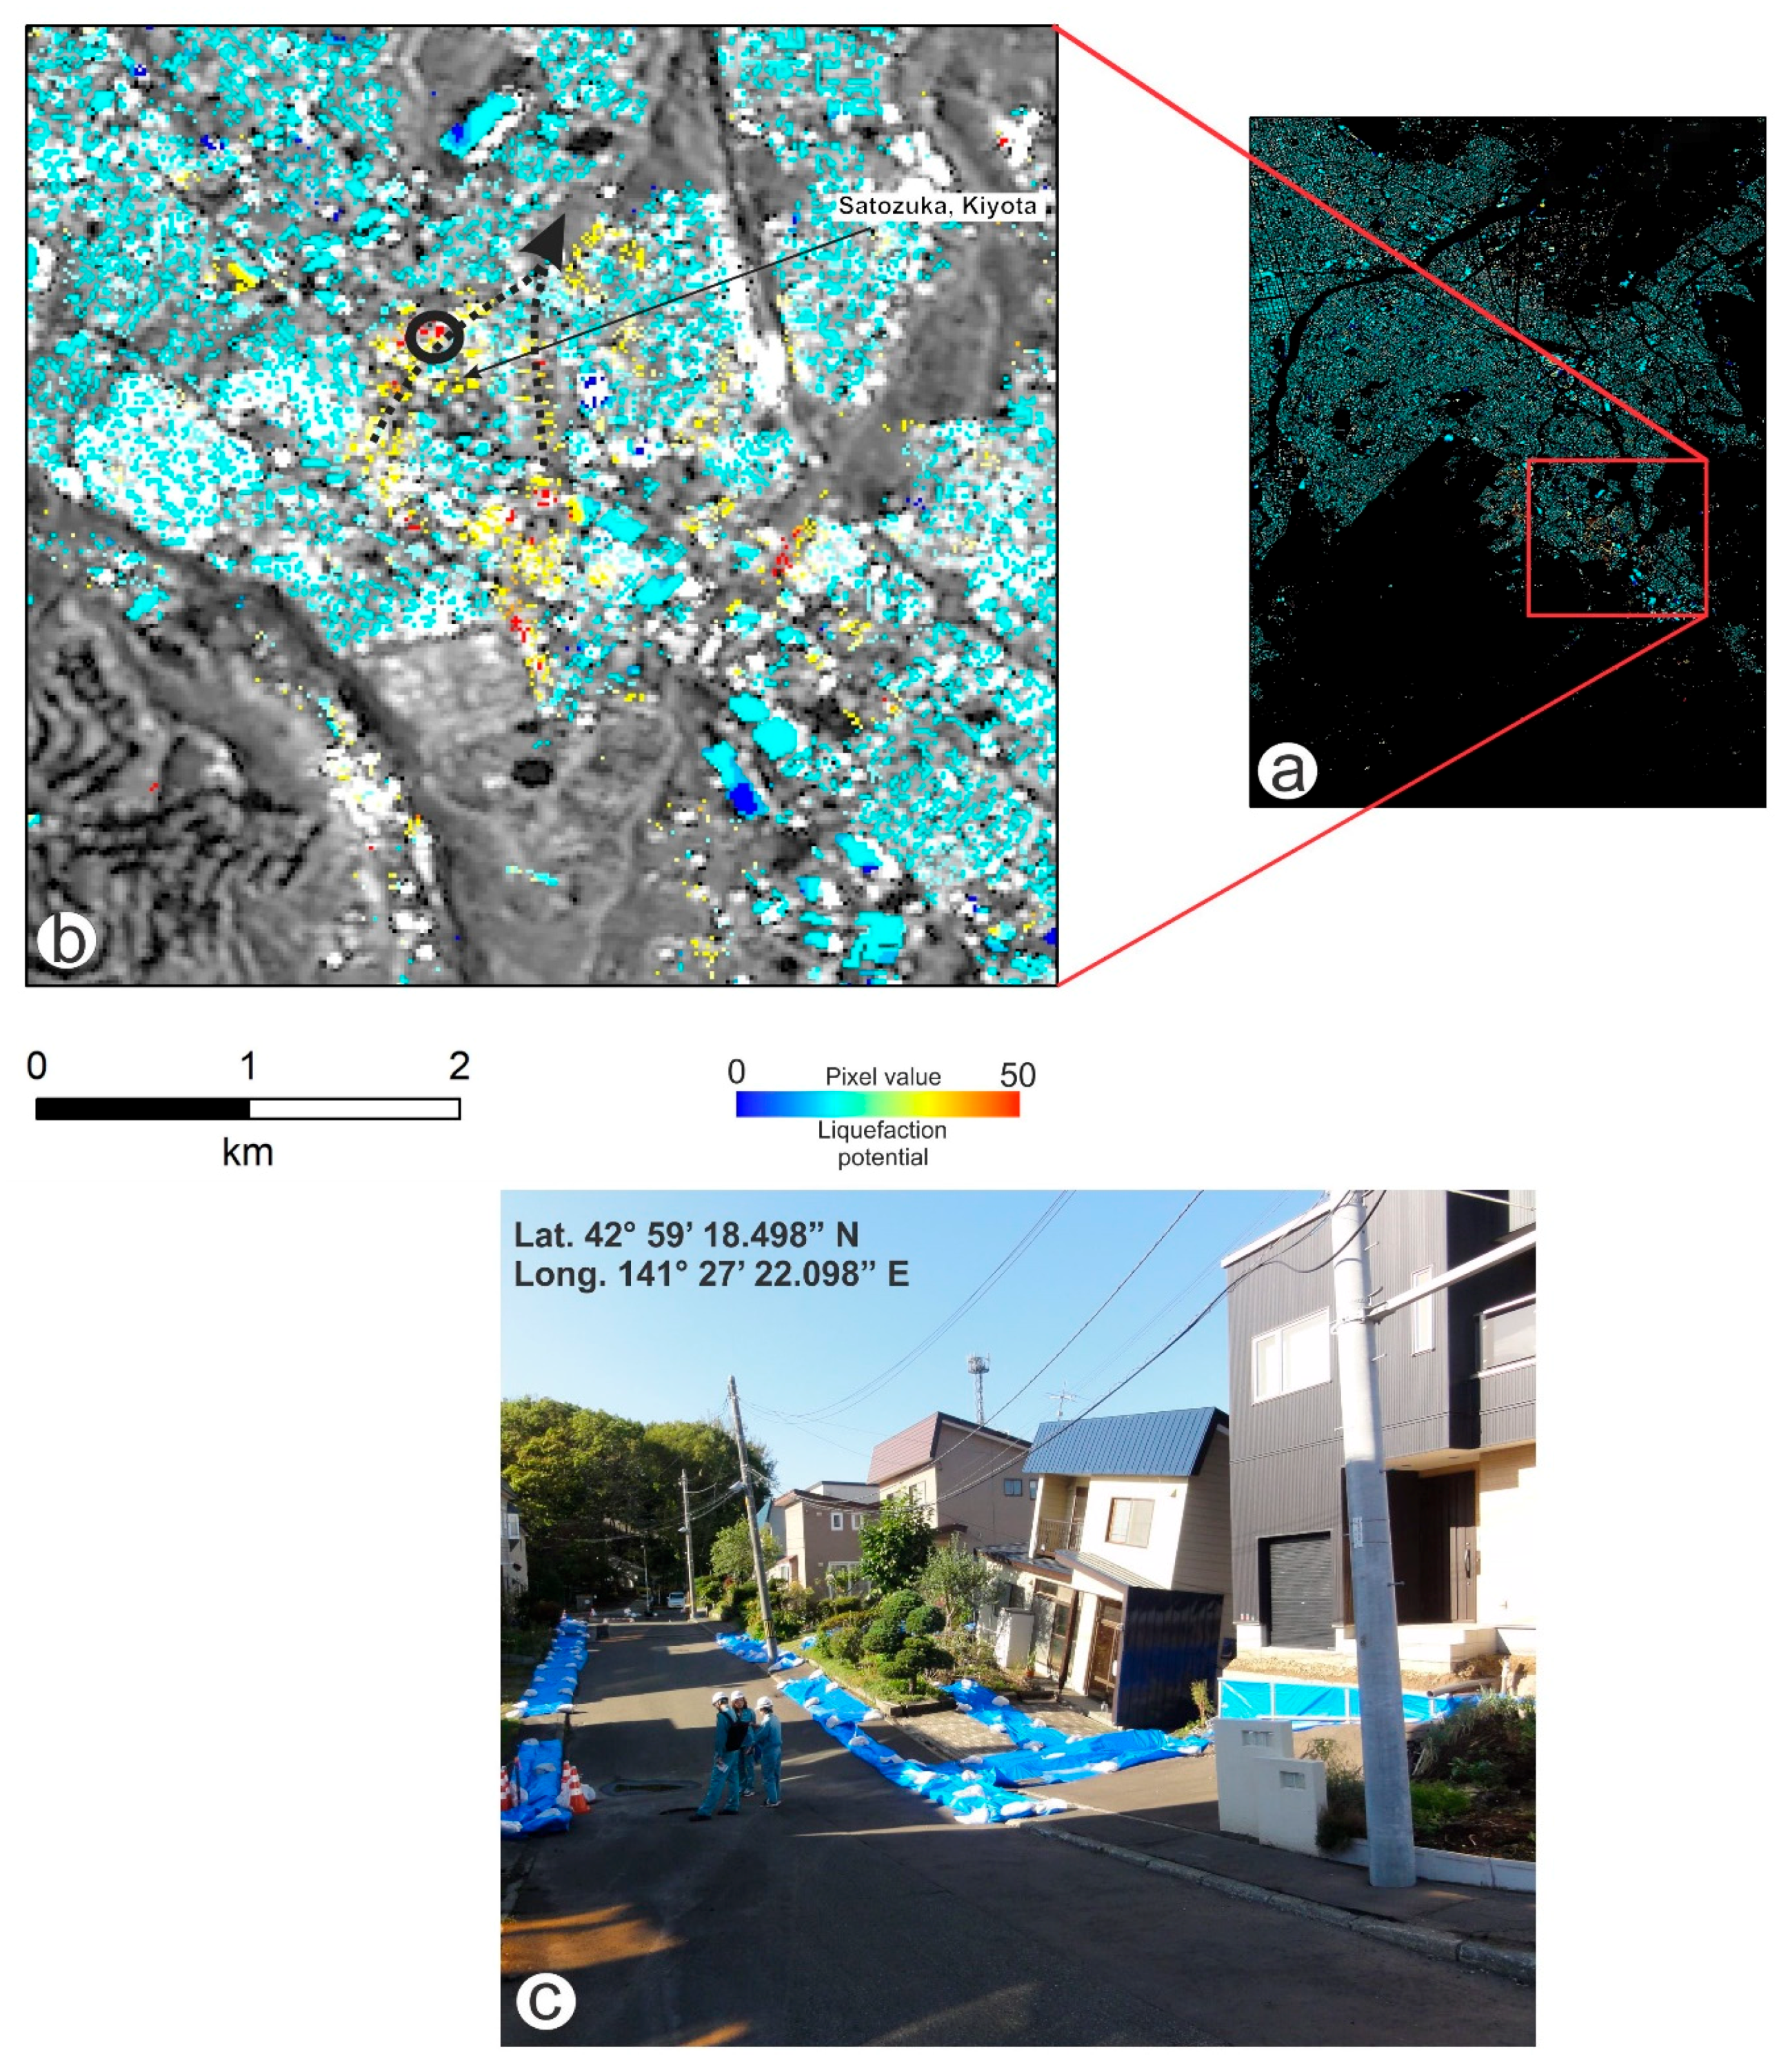
4.1. Weighted Overlay (WO) Results

Figure 5 shows the final WO map of Hokkaido overlain on the initial LiquickMap. The red box in Figure 5 shows the southern part of Sapporo, which is dark in the initial LiquickMap. This means that the initial probability of liquefaction in this city was estimated to be zero. Our field investigations in Sapporo show that extensive damage in the Kiyota ward was mainly due to liquefaction. This effect was not reflected on the LiquickMap. The main reason is that the artificial landfill of volcanic ashes caused liquefaction. The Satozuka district was covered with rice paddies and wooded lands in the past, but gradually, urban areas developed in this valley over the past four decades. Such local and manmade changes in the soil cannot be considered in the LiquickMap estimation method. Figure 6 shows the Kiyota ward and Satozuka district and the corresponding WO values of track 116. Extensive liquefaction-related urban damage in the center of the Kiyota ward can be seen with liquefaction potential values ranging from 25 to 40, probably because of the high level of underground water and fine grain soils. The traces of a valley in the Kiyota ward are extracted from old elevation contour maps. In Figure 6b, the dashed line shows the location of the valley before urban development, where a major part of the liquefaction-related damages is observed. The liquefaction potential pixel values are mainly between 20 and 25 for buildings that are intact or not affected by liquefaction. There are also some extremely low values in Satozuka shown in a navy-blue color in Figure 6b, which are large shopping centers. Since the WO analysis considers only building centroids, in some large or small building cases, the WO pixel values can be over or underestimated. Figure 7 shows the WO results of Mukawa and Hobetsu in track 18. In Mukawa, there are a few sites in the west and NE where liquefaction can be confirmed by visual inspections. However, in west Mukawa, red pixels are associated with a cement factory that is not related to liquefaction. The high amount of WO values in Mukawa is for two reasons: (1) because of the high liquefaction probability of LiquickMap and (2) because of the significant amount of manmade activities, such as large cement factory activity, which makes our interpretation difficult. As shown in Figure 7b, in Hobetsu, the potential liquefaction values stretch from the center of the town towards the NE and SW. Hobetsu is also located in a valley near a large river in the east (Mukawa River), and some small rivers pass through the town. Unlike artificially filled layers in southern Sapporo, the site effects in Hobetsu are mainly related to the deep sedimentary layers. Microtremor measurements are carried out in 14 locations of Hobetsu. Red stars in Figure 7b show the location of microtremor measurements, which were explained in the previous section.

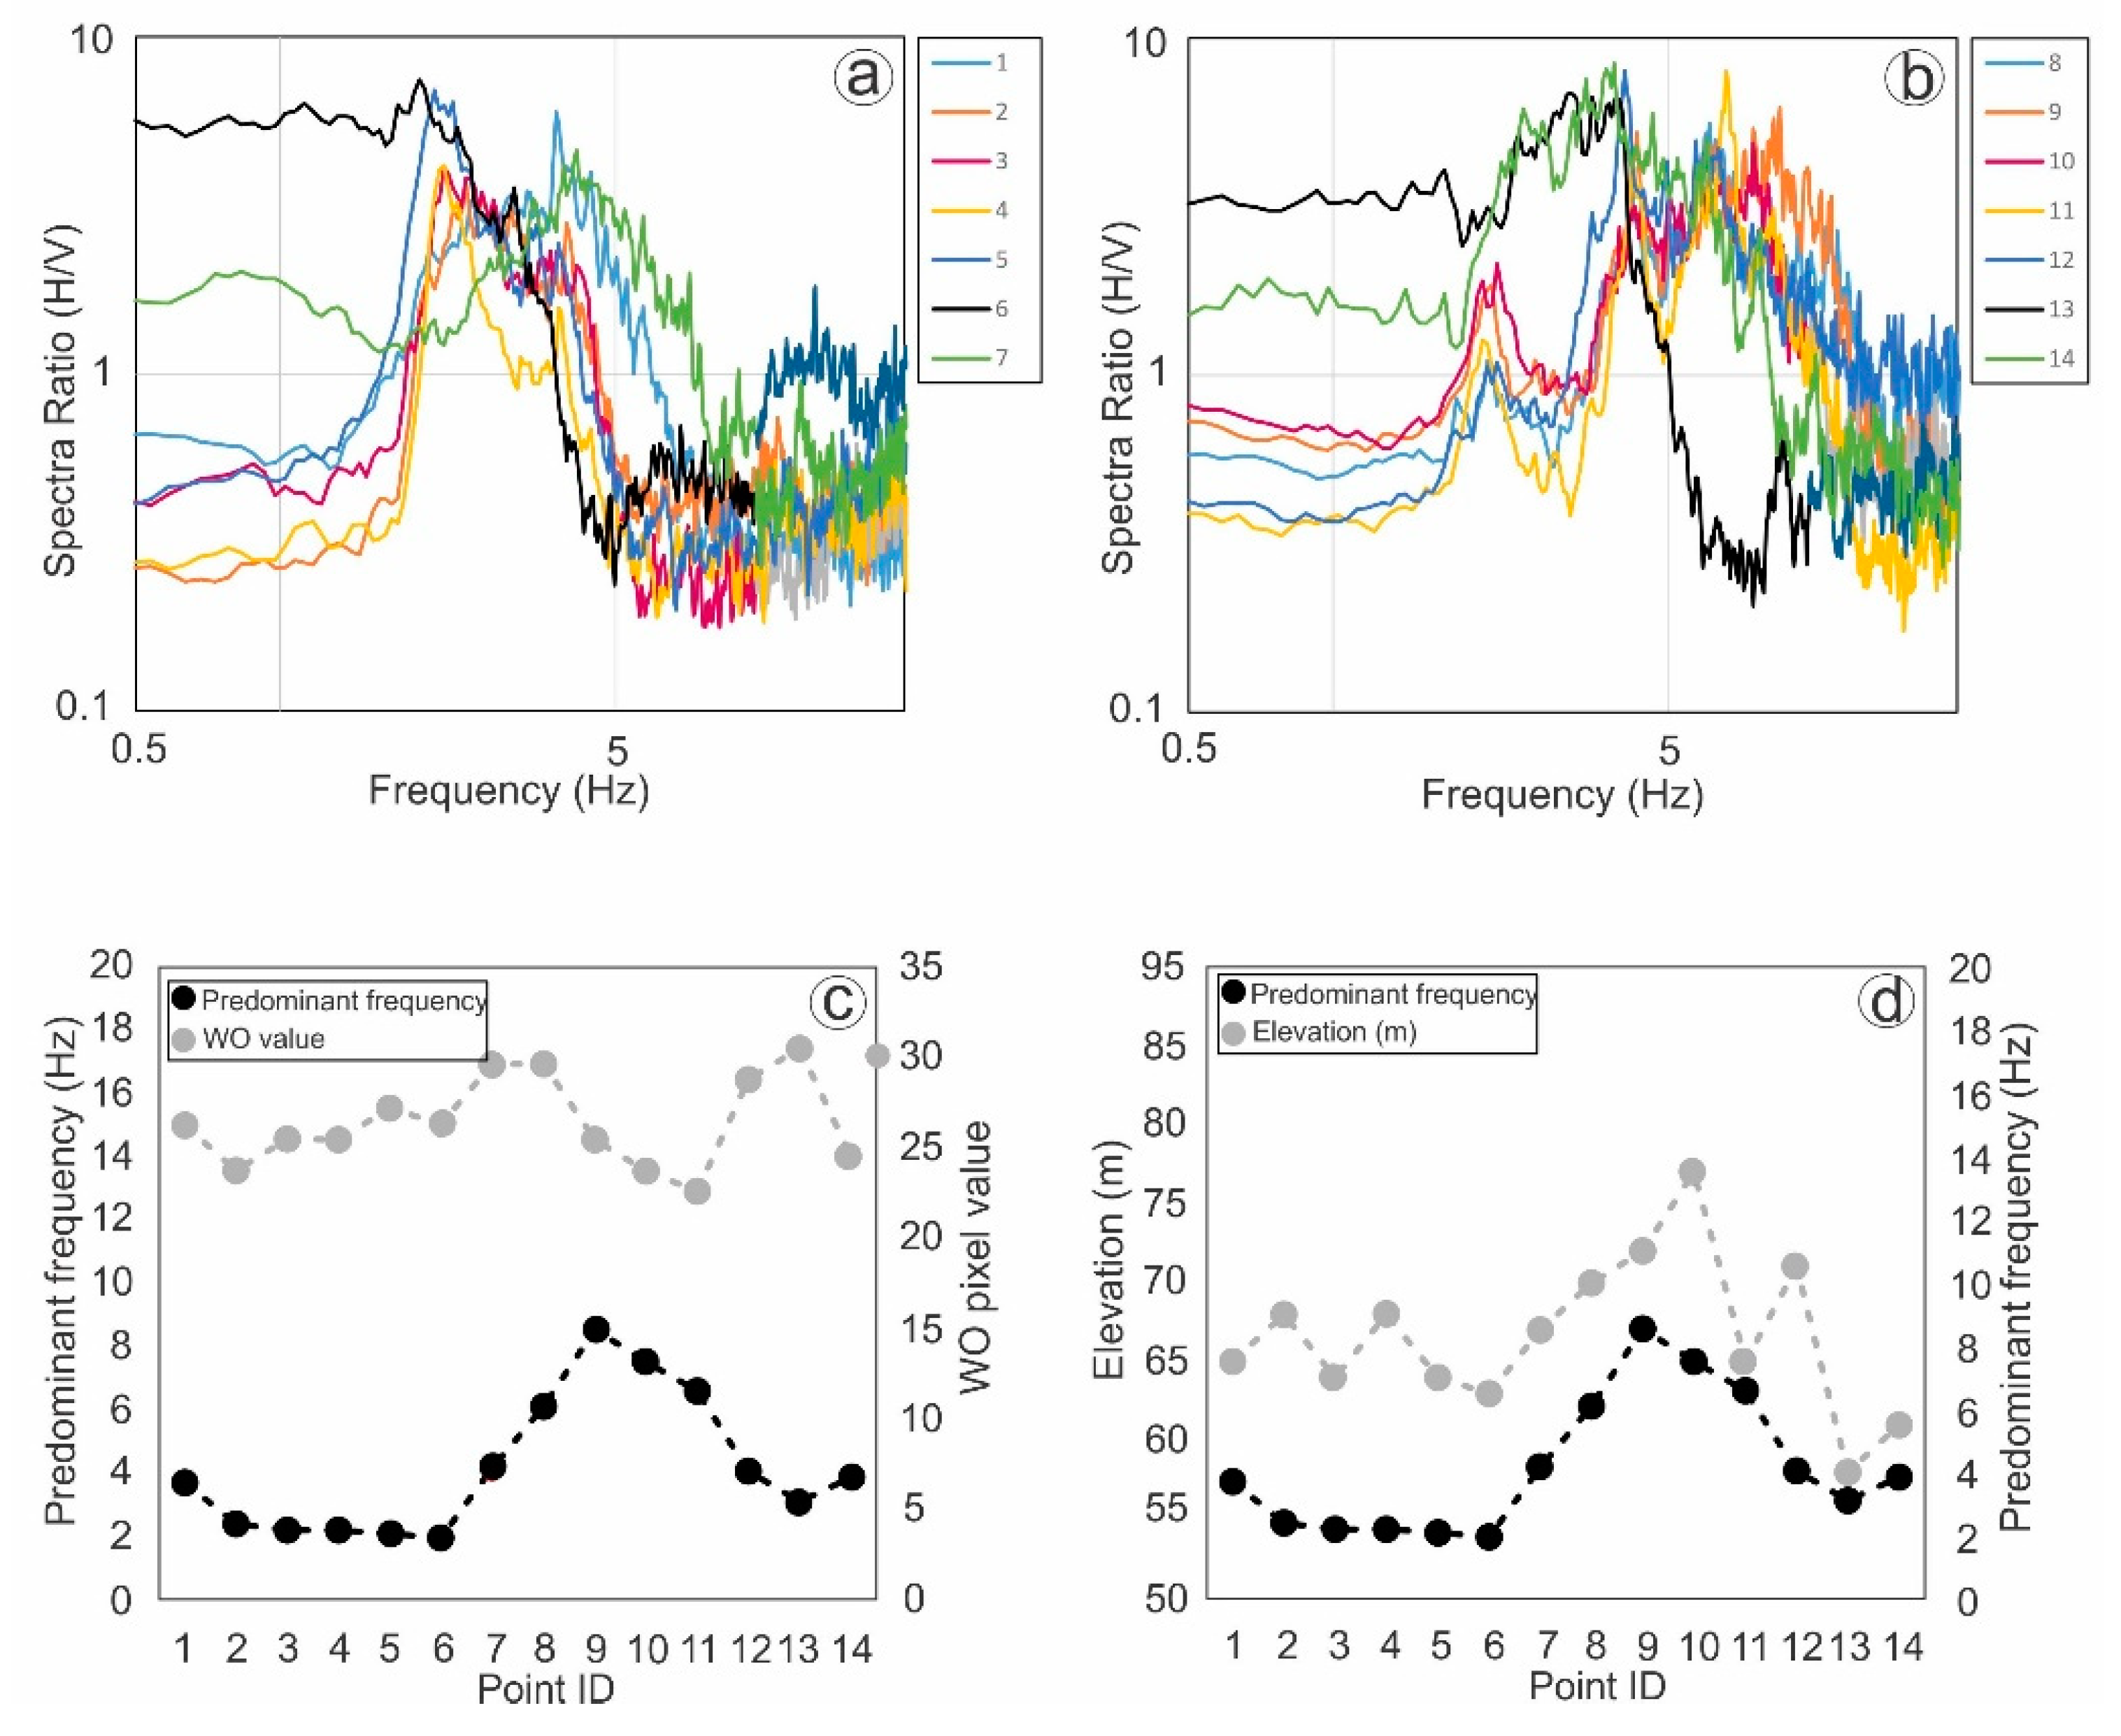
4.2. Microtremor Results

To verify the WO maps, we conducted microtremor observations in the Kiyota ward and Hobetsu. In Kiyota, there is no clear relationship between the WO values and predominant frequency. Because liquefaction in the area occurred in the shallow artificially filled layer (less than 5 m), the predominant frequency obtained by the microtremors might be affected by rather deep sedimentation soil. The area is filled mostly with the soil of surrounding mountains. Most likely, the soil of such filled layers was not well compacted, and due to the low viscosity of the soil, the liquefaction damage was high. Here, we concentrated on the results of multiple measurements (14 points in Figure 7b) in a cross-shape route within the affected area of Hobetsu. We can confirm that the major characteristics of the spectra are consistent among the measurements. All the sites have a peak point, which suggests that Hobetsu has soft soil conditions. Figure 8a,b show the calculated spectral ratio for 14 points in Hobetsu. For instance, in the northern part of the town where the damage related to the site conditions is low, the predominant frequencies of point 10 and point 11 are 7.5 Hz and 6.5 Hz, respectively, and the corresponding WO values are 23.7 and 22.6, respectively. In the central part of the town where the damage is rather severe, the predominant frequencies of point 7 and point 8 are 4.1 Hz and 6.1 Hz, respectively, and the WO values are 29.60 and 29.65, respectively. The results of the WO and predominant frequency for each point are given in Table 2. By comparing the WO values and the predominant frequencies of less-damaged and severely damaged areas, we noticed that there is a slight negative correlation (−0.20); when the WO value increases, the predominant frequency tended to decrease. The p-value (Pearson correlation coefficient) is 0.39, which is an indicator of the linear association strength between the predominant frequency and WO values. The predominant frequencies and elevation of the point extracted from the Advanced Spaceborne Thermal Emission and Reflection Radiometer Global DEM (ASTER GDEM 30 m posting) show a better relationship, where the correlation and p-values are 0.62 and 0.51, respectively. This finding implies that when the sites are located at low elevations, their contributions to site amplifications, such as liquefaction, can be high.

5. Discussion and Conclusions

Using LiquickMap, we presented a liquefaction probability map based on the Japan engineering geomorphologic classification map (JEGM) and seismic records of Japanese networks immediately after each earthquake in Japan. Due to the long distance between Sapporo and the epicenter of the Hokkaido Eastern Iburi earthquake and the coarse resolution of the LiquickMap results, the liquefaction damage at far sites, such as Kiyota, was underestimated. LiquickMap showed a low probability of liquefaction (close to zero) in most parts of Sapporo, while extensive liquefaction-related damage is observed in the forward SAR coherence map. To make LiquickMap more advantageous, we applied a new WO method that uses influential parameters, including slope map and coherence. The applied method can reveal liquefaction-related damages as soon as we receive SAR images from satellites.
Despite the good agreement of the field survey and WO results, the results of the microtremor measurements correlated slightly with the WO results. The correlation was not high, especially in the center of the town, which might be related to the coherence decay sensitivity due to a large temporal baseline in track 18, the resolution of the coherence results, and the size of the window used in the WO analysis. Another factor affecting the low correlation of the predominant frequency and WO values is the quantification strategy during the WO analysis. We assumed that high liquefaction probability values (%) in LiquickMap, high differential coherence values, and low slope values (°) should receive higher weights in the WO analysis, and, then, we reclassified all parameters into 50 classes. This strategy cannot be true for all parameters. For instance, based on this assumption that the soil erosion rate is high in lower slopes, we assigned higher weights for topographic slopes that were almost flat (slope values close to zero). However, the field survey results revealed that the majority of buildings in Kiyota on gentle slopes (middle classes in reclassification) were affected by liquefaction. Thus, straightforward classification based on our prior knowledge cannot be exclusively precise, and further direct parameters, such as underground water tables, should be included in the WO analysis. Notably, our preliminary survey was limited to several sites, and a more complete survey is necessary in the future to obtain a comprehensive assessment of the damage distribution and the sources of damage.
Liquefaction occurring beneath buildings and infrastructure is important because it can interrupt behavior of other urban components. Thus, the method suggested in this paper based on satellite imagery and refined information of seismic networks can help researchers to distinguish between shaking-related and liquefaction-related damage in a short time. Classified types of damage will provide a more realistic vision to rescue teams about the latest condition of the affected areas.

Author Contributions

S.K. analyzed the SAR data, drafted the manuscript and was responsible for the research design. M.M. carried out field surveys and analyzed the microtremor measurements. S.K. created the figures and prepared the manuscript, which has been approved by all the authors.

Funding

This research was funded by the Japan Society for the Promotion of Science (JSPS) Grants-in-Aid for scientific research (KAKENHI) number 16F16380 and 17H02050. The APC was funded by JSPS.

Acknowledgments

We would like to express our gratitude to the Japan Aerospace Exploration Agency (JAXA), which provided the ALOS-2 data through the JAXA working group. We referred to the liquefaction damage survey and its evaluation by Prof. Kazue Wakamatsu of Kanto Gakuin University.

Conflicts of Interest

The authors declare no conflicts of interest.

References

  1. The Statistics Portal. Global Death Toll due to Earthquakes from 2000 to 2015. Available online: https://0-www-statista-com.brum.beds.ac.uk/statistics/263108/global-death-toll-due-to-earthquakes-since-2000/ (accessed on 10 October 2018).
  2. Milillo, P.; Giardina, G.; DeJong, M.J.; Perissin, D.; Milillo, G. Multi-Temporal InSAR Structural Damage Assessment: The London Crossrail Case Study. Remote Sens. 2018, 10, 287. [Google Scholar] [CrossRef]
  3. Yun, S.H.; Hudnut, K.; Owen, S.; Webb, F.; Simons, M.; Sacco, P.; Milillo, P. Rapid Damage Mapping for the 2015 M w 7.8 Gorkha Earthquake Using Synthetic Aperture Radar Data from COSMO–SkyMed and ALOS-2 Satellites. Seismol. Res. Lett. 2015, 86, 1549–1556. [Google Scholar] [CrossRef] [Green Version]
  4. Milillo, P.; Porcu, M.C.; Lundgren, P.; Soccodato, F.; Salzer, J.; Fielding, E.; Biondi, F. The ongoing destabilization of the Mosul dam as observed by synthetic aperture radar interferometry. In Proceedings of the IEEE International Geoscience and Remote Sensing Symposium (IGARSS), Fort Worth, TX, USA, 23–28 July 2017; pp. 6279–6282. [Google Scholar]
  5. Karimzadeh, S.; Matsuoka, M.; Ogushi, F. Spatiotemporal deformation patterns of the Lake Urmia Causeway as characterized by multisensor InSAR analysis. Sci. Rep. 2018, 8, 5357. [Google Scholar] [CrossRef] [PubMed]
  6. Karimzadeh, S.; Samsonov, S.; Matsuoka, M. Block-based damage assessment of the 2012 Ahar-Varzaghan, Iran, earthquake through SAR remote sensing data. In Proceedings of the IEEE International Geoscience and Remote Sensing Symposium (IGARSS), Fort Worth, TX, USA, 23–28 July 2017. [Google Scholar] [CrossRef]
  7. McCalpin, J.P. Paleoseismology, 2nd ed.; Elsevier: Amsterdam, The Netherlands, 2009; Volume 95, 629p, ISBN 288 9780123735768. [Google Scholar]
  8. Reicherter, K.; Michetti, A.M.; Silva, P.G. (Eds.) Palaeoseismology: Historical and Prehistorical Records of Earthquake Ground Effects for Seismic Hazard Assessment; The Geological Society of London: London, UK, 2009; Volume 316, p. 320. [Google Scholar]
  9. Yamagishi, H.; Yamazaki, F. Landslides by the 2018 Hokkaido Iburi-Tobu Earthquake on September 6. Landslides 2018, 15, 2521. [Google Scholar] [CrossRef]
  10. Yamazaki, F.; Matsuoka, M. Remote Sensing: Assessing the Built Environment by Remote Sensing Technologies. In Proceedings of the 2nd InternationalWorkshop on Earthquakes and Megacities, Earthquakes and Megacities Initiative (EMI), Manila, Philippines, 1–3 December 1999; pp. 27–34. [Google Scholar]
  11. Yonezawa, C.; Takeuchi, S. Detection of urban damage using interferometric SAR decorrelation. In Proceedings of the International Geoscience and Remote Sensing Symposium, IGARSS’99 (Cat. No.99CH36293), Hamburg, Germany, 28 June–2 July 1999; IEEE: Hamburg, Germany, 1999; pp. 925–927. [Google Scholar]
  12. Yonezawa, C.; Takeuchi, S. Decorrelation of SAR data by urban damages caused by the 1995 Hyogoken–Nanbu earthquake. Int. J. Remote Sens. 2001, 22, 1585–1600. [Google Scholar] [CrossRef]
  13. Matsuoka, M.; Yamazaki, F. Use of satellite SAR intensity imagery for detecting building areas damaged due to earthquakes. Earthq. Spectra 2004, 20, 975–994. [Google Scholar] [CrossRef]
  14. Ramakrishnan, D.; Mohanty, K.K.; Nayak, S.R.; Chandran, R.V. Mapping the liquefaction induced soil moisture changes using remote sensing technique: An attempt to map the earthquake induced liquefaction around Bhuj, Gujarat, India. Geotech. Geol. Eng. 2006, 24, 1581–1602. [Google Scholar] [CrossRef]
  15. Oommen, T.; Baise, L.G.; Gens, R.; Prakash, A.; Gupta, R.P. Documenting earthquake-induced liquefaction using satellite remote sensing image transformations. Environ. Eng. Geosci. 2013, 19, 303–318. [Google Scholar] [CrossRef]
  16. Ishitsuka, K.; Tsuji, T.; Matsuoka, T. Detection and mapping of soil liquefaction in the 2011 Tohoku earthquake using SAR interferometry. Earth Planets Space 2012, 64, 22. [Google Scholar] [CrossRef]
  17. M 6.6–27km E of Tomakomai, Japan. United States Geological Survey. Available online: https://earthquake.usgs.gov/earthquakes/eventpage/us2000h8ty/executive (accessed on 10 October 2018).
  18. M 6.6–27km E of Tomakomai, Japan. Prompt Assessment of Global Earthquakes for Response. Available online: https://earthquake.usgs.gov/earthquakes/eventpage/us2000h8ty/pager (accessed on 10 October 2018).
  19. Wald, D.J.; Earle, P.S.; Allen, T.I.; Jaiswal, K.S.; Porter, K.A.; Hearne, M.J. Development of the U.S. Geological Survey’s PAGER system (Prompt Assessment of Global Earthquakes for Response). In Proceedings of the 14th World Conference on Earthquake Engineering, Beijing, China, 12–17 October 2008. Paper No. 10-0008. [Google Scholar]
  20. Matsuoka, M.; Wakamatsu, K.; Hashimoto, M.; Senna, S.; Midorikawa, S. Evaluation of Liquefaction Potential for Large Areas Based on Geomorphologic Classification. Earthq. Spectra 2015, 31, 2375–2395. [Google Scholar] [CrossRef]
  21. Matsuoka, M.; Yamamoto, N. Web-based quick estimation system of strong ground motion maps using engineering geomorphologic classification map and observed seismic records. In Proceedings of the 15th World Conference on Earthquake Engineering, Lisbon, Portugal, 24–28 September 2012; pp. 24–28. [Google Scholar]
  22. National Research Institute for Earth Science and Disaster Resilience (NIED). Available online: http://www.kyoshin.bosai.go.jp/kyoshin/instant/index_en.html (accessed on 10 October 2018).
  23. QuiQuake—Quick Estimation System for Earthquake Map Triggered by Observed Records. Available online: https://gbank.gsj.jp/QuiQuake/index.en.html (accessed on 10 October 2018).
  24. Goldstein, R.M.; Werner, C.L. Radar interferogram filtering for geophysical applications. Geophys. Res. Lett. 1998, 25, 4035–4038. [Google Scholar] [CrossRef] [Green Version]
  25. Baran, I.; Stewart, M.P.; Kampes, B.M.; Perski, Z.; Lilly, P. A modification to the Goldstein radar interferogram filter. IEEE Trans. Geosci. Remote Sens. 2003, 41, 2114–2118. [Google Scholar] [CrossRef]
  26. Karimzadeh, S.; Matsuoka, M. Building damage characterization for the 2016 Amatrice earthquake using ascending–descending COSMO-SkyMed data and topographic position index. IEEE J. Sel. Top. Appl. Earth Obs. Remote Sens. 2018, 11, 2668–2682. [Google Scholar] [CrossRef]
  27. Karimzadeh, S.; Matsuoka, M.; Miyajima, M.; Adriano, B.; Fallahi, A.; Karashi, J. Sequential SAR coherence method for the monitoring of buildings in Sarpole-Zahab, Iran. Remote Sens. 2018, 10, 1255. [Google Scholar] [CrossRef]
  28. Hellel, M.; Chatelain, J.-L.; Guillier, B.; Machane, D.; Salem, R.B.; Oubaiche, E.H.; Haddoum, H. Heavier damages without site effects and site effects with lighter damages: Boumerdes city (Algeria) after the May 2003 earthquake. Seismol. Res. Lett. 2010, 81, 37–43. [Google Scholar] [CrossRef]
  29. Chatelain, J.-L.; Guillier, B.; Parvez, I.A. False site effects: The Anjar case, following the 2001 Bhuj (India) earthquake. Seismol. Res. Lett. 2008, 79, 816–819. [Google Scholar] [CrossRef]
  30. Nakamura, Y. A method for dynamic characteristics estimation of subsurface using microtremor on the ground surface. Q. Rep. Railw. Technol. Res. Inst. 1989, 30, 25–33. [Google Scholar]
Figure 1. Liquefaction probability (LiquickMap) after the Hokkaido Eastern Iburi earthquake (M 6.6) on 6 September 2018. Liquefaction probability in colorful areas (blue to red) is between 0.1 and 12 percent, while black and white regions have zero percent probability of liquefaction.
Geosciences 08 00487 g001
Figure 2. Footprints of ascending (red polygon) and descending (green polygon) acquired from the ALOS-2 satellite.
Geosciences 08 00487 g002
Figure 3. Flowchart of the weighted overlay (WO) analysis using synthetic aperture radar (SAR) coherence, LiquickMap and slope map.
Geosciences 08 00487 g003
Figure 4. (a) Co-seismic interferogram of ascending orbit (116); (b) RGB change map of Hokkaido using normalized combination of pre-seismic and co-seismic coherence maps (116).
Geosciences 08 00487 g004
Figure 5. The WO map (track 116) of Hokkaido masked by urban footprints (Geospatial Information Authority of Japan, GSI) overlain on the initial LiquickMap. The yellow pin and red box (Figure 6) show the location of the Kiyota ward in Sapporo, which experienced severe liquefaction activity.
Geosciences 08 00487 g005
Figure 6. (a) WO map of Sapporo (track 116). (b) WO map of the Kiyota ward and Satozuka district overlain on the SAR intensity map (23 August 2018). Yellow-to-red pixels are mainly liquefaction-related damages, and the black circle is the location of the photograph in Figure 6c. Dashed lines show the traces of a valley in the Kiyota ward extracted from old maps prior to urban development. (c) Photograph of the Kiyota ward affected by liquefaction.
Geosciences 08 00487 g006
Figure 7. (a) WO map of Mukawa (track 18) overlain on the SAR intensity map (23 August 2018). (b) Hobetsu (track 18) overlain on the intensity map (23 August 2018). Red stars in Hobetsu are the locations of microtremor measurements, and white circles are the locations of the photographs taken: (c) example of damage to buildings in Mukawa; (d) microtremor measurement at point 1 in Hobetsu near the K-net seismic station.
Geosciences 08 00487 g007
Figure 8. (a,b) H/V spectra measured at 14 point locations in Hobetsu; (c) fluctuations of predominant frequencies and WO values of 14 points in Hobetsu; and (d) fluctuations of predominant frequencies and elevations of 14 points in Hobetsu.
Geosciences 08 00487 g008
Table 1. Detailed information of the PALSAR-2 data. θ , Δ θ , B , and T are incidence angle, difference of incidence angle, normal baseline and temporal baseline, respectively. * in both the ascending and descending datasets indicates the master image.
Date
(yyyy/mm/dd)
θ   ( ° ) Δ θ   ( ° ) PolarizationOrbit B   ( m ) T   ( days )
2018/08/0942.90.005HHA 1166814
2018/08/23 *42.9-HHA 116--
2018/09/0942.90.006HHA 116-4014
2018/06/1436.10.018HHD 1823770
2018/08/23 *36.1-HHD 18--
2018/09/0636.10.010HHD 186914
Table 2. Predominant frequency and WO values of 14 observation points in Hobetsu.
Point IDLatitudeLongitudePredominant Frequency (Hz)WO Value
142.7608142.13453.726.25
242.7619142.13552.423.75
342.7628142.13672.1925.5
442.7640142.13812.1925.45
542.7652142.13962.0927.2
642.7664142.13981.9526.3
742.7670142.14034.1529.6
842.7678142.14096.129.65
942.7689142.13878.5424.65
1042.7701142.14217.5123.7
1142.7722142.14256.5922.6
1242.7674142.13964.0528.8
1342.7663142.14123.130.5
1442.7655142.14273.8524.55

