Article

Recent Geomorphological Evolution and 3D Numerical Modelling of Soft Clastic Rock Cliffs in the Mid-Western Adriatic Sea (Abruzzo, Italy)

1
Department of Engineering and Geology, Università degli Studi “G. d’Annunzio” Chieti-Pescara, Via dei Vestini 31, 66100 Chieti Scalo, Italy
2
NLWKN-Coastal Research Station/Forschungsstelle Küste, An der Mühle 5, 26548 Norderney, Germany
3
Istituto Nazionale di Geofisica e Vulcanologia, Sezione Roma 1, Via di Vigna Murata 605, 00143 Rome, Italy
*
Author to whom correspondence should be addressed.
Submission received: 23 May 2019 / Revised: 8 July 2019 / Accepted: 10 July 2019 / Published: 12 July 2019

Abstract

:
Geomorphological evolution, erosion and retreat processes that affect the rocky coasts of the mid-western Adriatic Sea (Abruzzo, Central Italy) are the subject of this research. This coastal sector, one of the few examples of clastic soft rock coasts in the Mediterranean Sea, is characterized by active, inactive and paleo cliffs, as well as coastal slopes, composed of the clayey-sandy-arenaceous-conglomeratic marine sequence (Early-Middle Pleistocene) covered by continental deposits (Late Pleistocene-Holocene). This study provides geomorphological and 3D modelling stability analyses of the cliffs of Torre Mucchia, Punta Lunga, Punta Ferruccio (Ortona, CH) and Punta Aderci (Vasto, CH), which are popular tourist sites included in natural reserve areas. They are representative of two main types of active cliffs on soft clastic rocks: cliffs on sandstone and cliffs on conglomerate with notches. In order to evaluate the processes and factors that induce cliffs to retreat and their recent evolution, the research was based on a DEM analysis (LIDAR 2 × 2 m data), aerial photos and an orthoimages interpretation, detailed geological–geomorphological surveys, and a structural analysis; field and remote investigations were combined with numerical modelling with a FLAC3D calculation code. Geological and geomorphological field data provided reliable 3D models, and FLAC3D numerical analyses allowed the definition of the most critical and/or failure areas, and the evaluation of the controlling factors, evolution mechanisms of the slopes and the sliding kinematics of gravitational instability phenomena. Different retreat mechanisms have been observed all along the investigated coastal sectors, induced by gravitational processes due to coastal erosion cycles at the foot of the cliffs, and controlled by lithological features and joints systems. The geomorphological analysis combined with the 3D modelling (i) showed that the retreat process of the cliffs is connected to translational slides and rockfalls (cliffs on sandstone), combined rockfalls, and topples (cliffs on conglomerate), largely controlled by main joints; (ii) defined the most critical areas along the cliffs. These results are of great interest in the assessment of hazard connected to potential sliding on the cliffs. Their implementation within Geographical Information Systems provides a valuable contribution to the integrated management of coastal areas, strongly improving the identification and prediction of landscape changes and supporting a new geomorphological hazards assessment, in areas of high tourism, as well as natural and cultural landscape value.

1. Introduction

Rock coasts on soft materials are the result of a complex combination of many endogenous and exogenous factors, such as the morphostructural and stratigraphical setting, lithology, climate, wave energy, tides, and long-term sea-level changes [1,2,3,4,5,6,7]. They are of great interest due to (1) retreat rates of 10−2 to 10 m/yr, up to two orders of magnitude greater than hard rock cliffs [7,8,9,10,11,12,13,14,15]; (2) the localized and episodic nature of cliff recession over a short time span and almost parallel recession trend over a long time span [2,16,17]; (3) scattered and fast erosion cycles, consisting of toe erosion, cliff instability, mass movements, talus deposits, beach formation and erosion, and the resumption of toe erosion [2,7,12,17,18]. Due to the lithological variability and related strength parameters characterizing these types of cliffs, the mechanisms and processes inducing the fast retreat are largely variable and depend on several factors [2,7].
As well as the other coasts on clastic soft rocks (meaning those with a uniaxial compression strength of ≤ 5 MPa [2]) in the Mediterranean Sea, the mid-Western Adriatic coast is characterized by high rate changes, mostly connected to landslides induced by wave-cut erosion, meteorological events and controlled by lithological and joint features [7]. Coastal types are active, inactive and paleo cliffs, as well as coastal slopes. Additionally, these coastal areas are popular tourist destinations, included in natural reserve areas with beaches, cliffs and seaside resorts.
The present study analyzed the geomorphological evolution, erosion and retreat processes of four active cliffs of Torre Mucchia, Punta Lunga, Punta Ferruccio (Ortona, CH) and Punta Aderci (Vasto, CH). They are examples of two main types of cliffs on soft clastic rocks developed on an uplifted clay-sand-sandstone-conglomerate Lower Pleistocene sequence and affected by active geomorphological processes: cliffs on sandstone and cliffs on conglomerate with notches [7]. It is based on a combination of remote investigations (LIDAR-derived DEM processing; aerial photos and orthoimages interpretation), field investigations (detailed geological–geomorphological surveys, and a structural analysis), and FLAC3D numerical modelling. Through this combined approach, the lithological, geomorphological and structural-jointing features were investigated, focusing on their role on the stability, processes and dynamics affecting the soft clastic rock cliffs.
The geological-geomorphologic analysis, combined with the LIDAR data (point cloud derived), provided a reliable three-dimensional model (including morphological, lithological and morphostructural features) elaborated by GIS, which constitutes the basis of numerical modelling. The 3D models included the main joints and coastal notches, whose geometry and distribution resulted from the geomorphologic–structural surveys. This allowed for a better modelling response and better adherence to observed and potential phenomena. Numerical modelling using FLAC3D [19] allowed to define the role of the morpho-stratigraphic setting, main joints and notches in cliffs’ evolutionary processes [20,21,22], highlighting the landslide mechanisms and the most critical and failure areas affecting the cliffs. Analyzing each case study, it was possible to outline the expected landslides and the mechanism, in terms of the recent evolution and controlling factors on the soft clastic rock cliffs of the Abruzzo coast.
Finally, this work wants to provide a contribution to the identification, comprehension and prediction of the variable mechanisms of the fast retreat processes and the factors controlling these processes on specific soft rock cliff types (i.e., on sandstone and conglomerate). This can support the assessment of geomorphological hazards in these areas of high tourism, natural, and cultural landscape value, where coastal landslides are largely widespread and studied because of the risk connected to possible reactivations, damage to people and/or infrastructures.

2. Study Area

2.1. Regional Setting

The studied areas are located along the mid-western Adriatic Sea between the piedmont reliefs of the Apennines chain (NE-verging) and the Adriatic continental shelf (Figure 1a). The piedmont-coastal domain includes the external fronts of the central Apennine fold-and-thrust-belt buried under clastic marine-transitional-continental sedimentary sequences (Late Miocene-Pleistocene) [23,24,25,26]. The Adriatic area includes main islands recording, together with the coastal sector, the recent evolution of the landscape [7,27,28].
The landscape features a plateau and mesa relief, shaped by fluvial, slope and coastal processes. These sectors were affected by uplift since the Middle Pleistocene, up to 200 m above the present sea level, at a rate of ca. 0.2–0.4 mm/yr [29,30,31,32,33,34,35], and Middle Pleistocene-Holocene sea-level fluctuations (up to +7 a.s.l., MIS 5e, and down to −120 m b.s.l., MIS 2), which led to a strong NE-shifting of the coastline during the sea-level low-stands [36,37].
The coastal climate is mostly Mediterranean with maritime influences (in agreement with the classification of the Italy Ecoregions [38]). The average annual precipitation amounts are 600–800 mm/yr, with occasional heavy rainfall (> 100 mm/d and 30–40 mm/h) [39,40]. The coastal climate is characterized by a microtidal regime, with NW–NE significant waves, from 0.5 to 3.5–6 m in height [41,42].

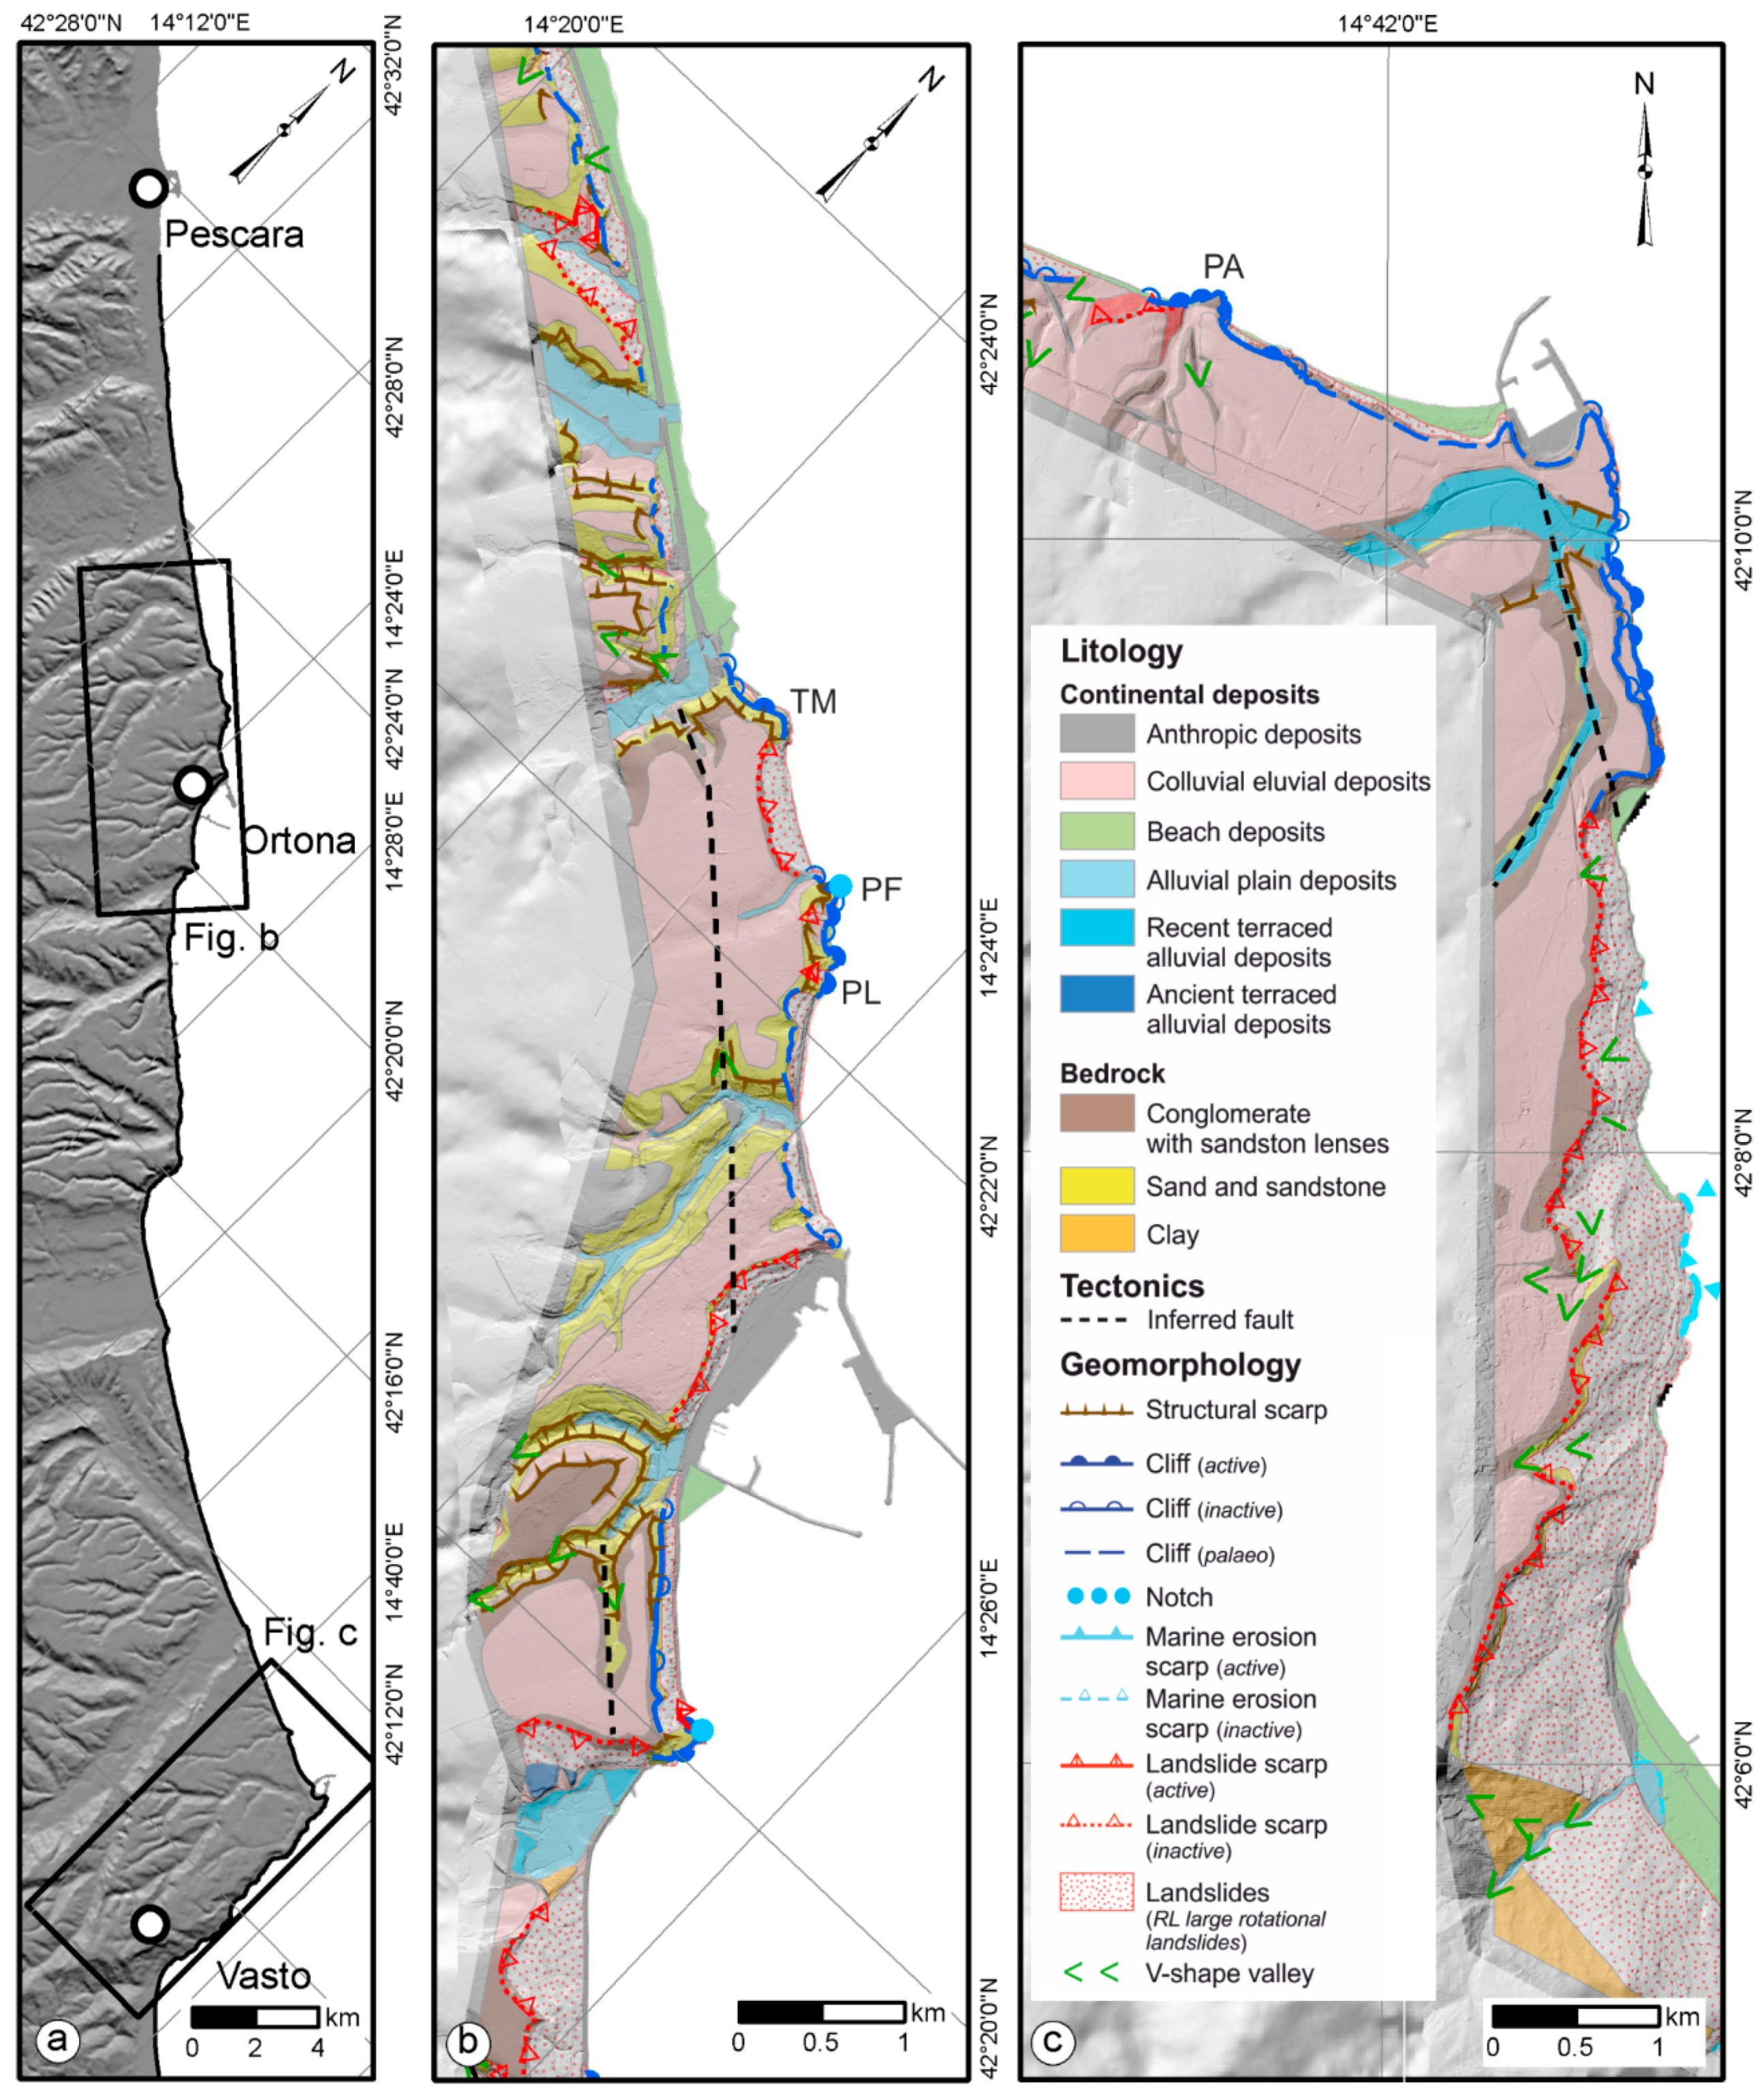
2.2. Geological and Geomorphological Features

The studied sites are on the eastern seaward side of mesas-plateaux morphostructures [23,29] shaped on a Pleistocene marine sequence, which includes different poorly consolidated clastic sediment and weak clastic rocks outcropping along the coastline [24,43,44,45,46,47]. Different retreat mechanisms are strongly controlled by gravity-induced processes due to coastal erosion cycles at the foot of the cliffs, lithological features and the geometry and distribution of joint systems [7].
This coastal sector has a large morphological variability, with ca. 22 km of coastal cliffs, ca. 28 km of coastal slopes, and ca. 16 km of alluvial plains [7,11,48]. The rock coast develops on the Early-Middle Pleistocene marine to transitional clastic sediments covered by Late Pleistocene-Holocene continental deposits (Figure 1b). The Pleistocene marine succession is made of several hundreds of meters of consolidated and stratified blue-grey clay in the lower part passing to stratified yellow sands, with a gradual transition, in the upper part. Sands include thin clay to clayey sand layers at the base, and moderately cemented sandstone (10–30 cm strata), with sand and conglomerate lenses upward. Moderate to well-cemented conglomerates (> 10 m in thickness), with a sand–sandstone and clay layer and lenses, lie on an erosive contact over the sandstone layers and close the Early-Middle Pleistocene marine sequence, passing to a transitional environment [24,43,44,45,46,47,49,50]. Another erosional contact defines the passage to the Late Pleistocene-Holocene continental sequence, which includes landslides, slope and eluvium-colluvium deposits on the cliffs and coastal slopes and beach-dune systems along the shoreline (Figure 2).
The bedrock sequence features a sub-horizontal or very gently (< 5°) seaward dipping strata arrangement, induced by the Pleistocene regional uplift with a gentle NE tilting [1,7,49,50]. Two main structural discontinuity systems affected the bedrock with NE–SW to NNE–SSW (first system) and NW–SE to WNW–ESE (second system) orientations. They are again the result of the Pleistocene uplift and NE-tilting of the clay-sand-sandstone-conglomerate sequence, which defined different structural elevations of the bedrock sequence along the coast, with the top conglomerate level ranging from the sea level to more than 100 meters a.s.l. [43,44,45,46]. The first system, pertaining to the Pliocene-Early Pleistocene, does not affect the Quaternary continental deposits, and the second, which occurred during the Middle-Late Pleistocene, affects the inner hillslope fluvial deposits, but it is mostly sealed by Holocene colluvial and slope deposits along the coast [7].
The coastal sector is characterized by active, inactive and paleo cliffs, as well as coastal slopes [7,11]. Their geomorphological features result from a close combination of the litho-structural arrangement and of marine and gravity-induced slope processes [7,51]. This work, however, is specifically focused on the active cliffs of Torre Mucchia, Punta Lunga, Punta Ferruccio (Ortona, CH) and Punta Aderci (Vasto; CH), which are characterized by cliffs on sandstone and cliffs on conglomerate, generally affected by a rapid retreat.
From a geomorphological point of view, along the studied cliffs, the main landforms are generated by coastal processes (notches, shore platforms, and beach systems) and gravity-induced slope processes (rockfalls, topples, and translational slides) [7].
Deep notches develop in poorly cemented clayey sandstone or clay sands-interbedded layers outcropping at the bases of cliffs. Due to the different hardness levels of outcropping lithotypes, notches may have variable dimensions, up to a considerable 7 m depth and 4 m height. Where a sub-horizontal shore platform is present, they are smaller (depths of few decimeters) and discontinuous, and mainly occurring on weak sandstone lenses within the conglomerates. Gravelly to sandy beaches, locally connected to dune systems, are scattered all along the bases of the cliffs. They characterize the submerged parts of the cliffs, representing the continuation of small pocket beaches below the sea level [7].
Gravity-induced processes affect the cliff bases and are mainly related to rockfalls, topples and translational landslides. The landslide and slope deposits are composed of chaotic sands, calcareous pebbles and heterometric blocks (up to 5 m on conglomerate and 3 m on sandstone). Waves may quickly remove landslide deposits or cover them with beach deposits. The main joints pervasively affect the cliffs and coastal slopes (transversal and roughly parallel to the coast, vertical or seaward dipping); the joint aperture ranges from < 1 cm to 3 cm; the persistence is of several meters, but locally they can affect the whole cliff, and the spacing is from a few decimetres to 3–5 m, generally with larger values in conglomerate than in sandstone bedrock. They are enlarged by tensile stresses and strongly control the development of landslides on these coastal sectors [7].
Anthropogenic landforms are present all along the investigated coastal area (villages, tourist facilities, roads, railroads, ports, and defense works) due to suggestive seaside resorts and the peculiar nature of the cliffs and beaches.

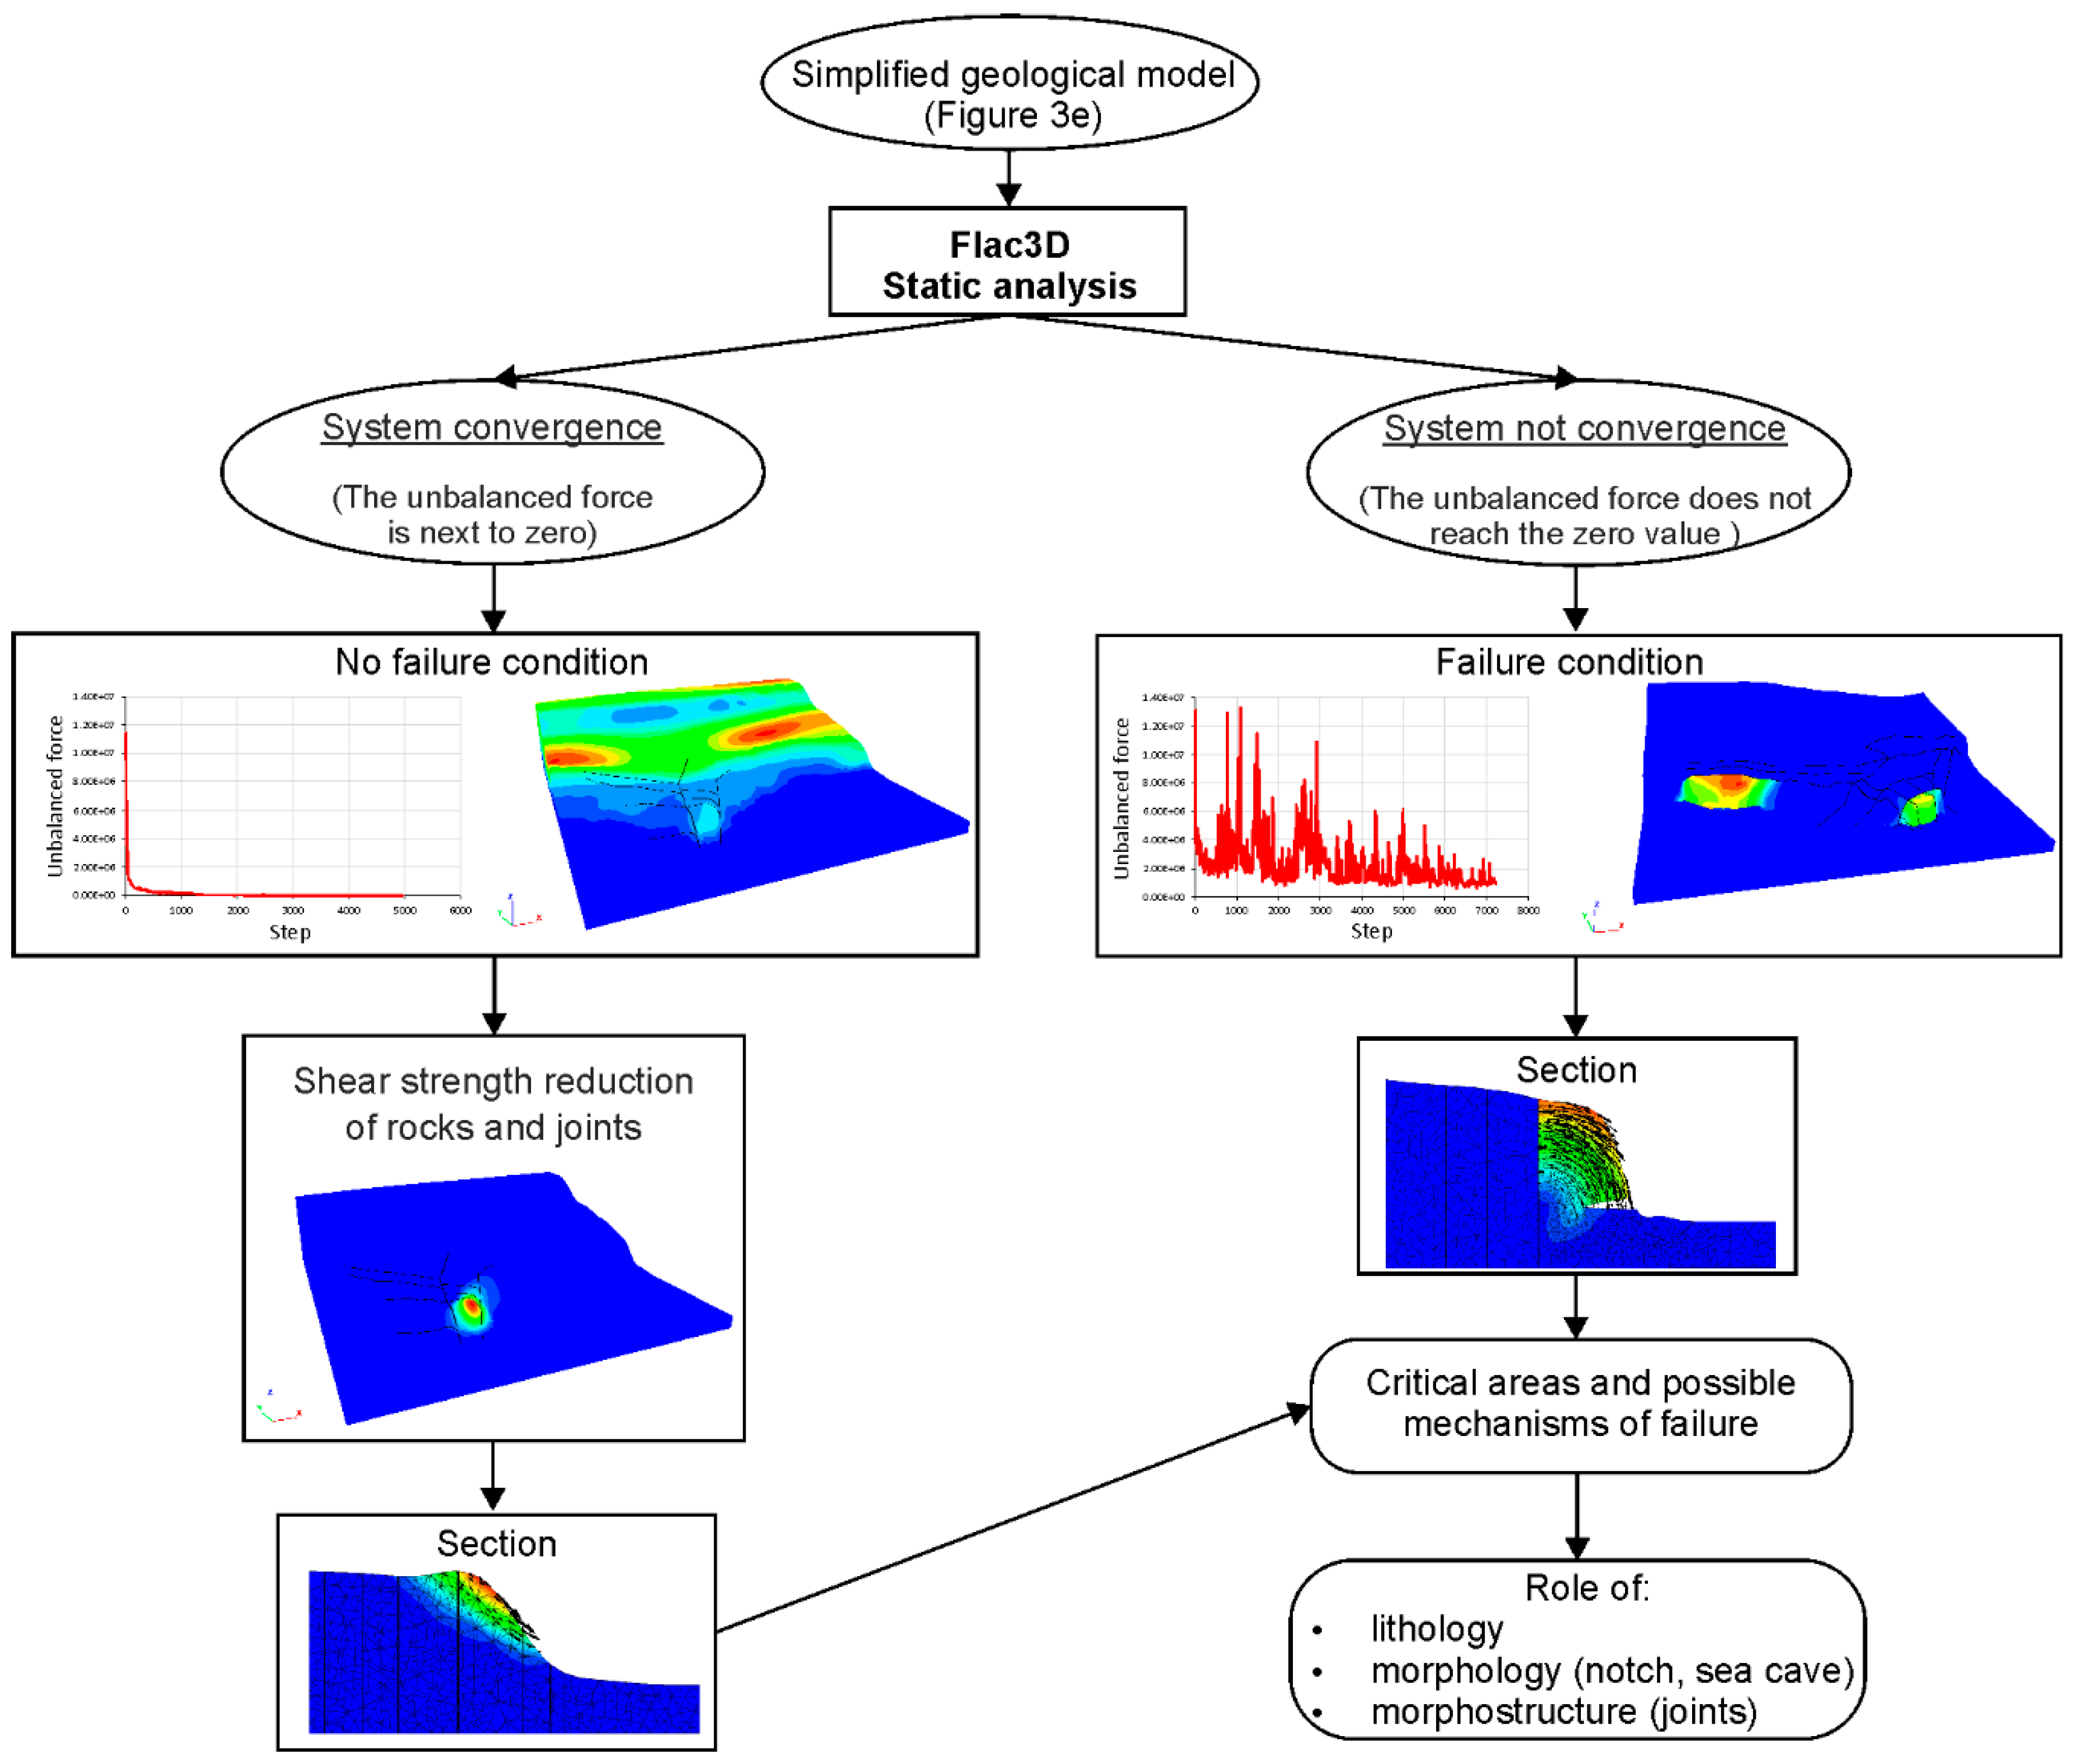
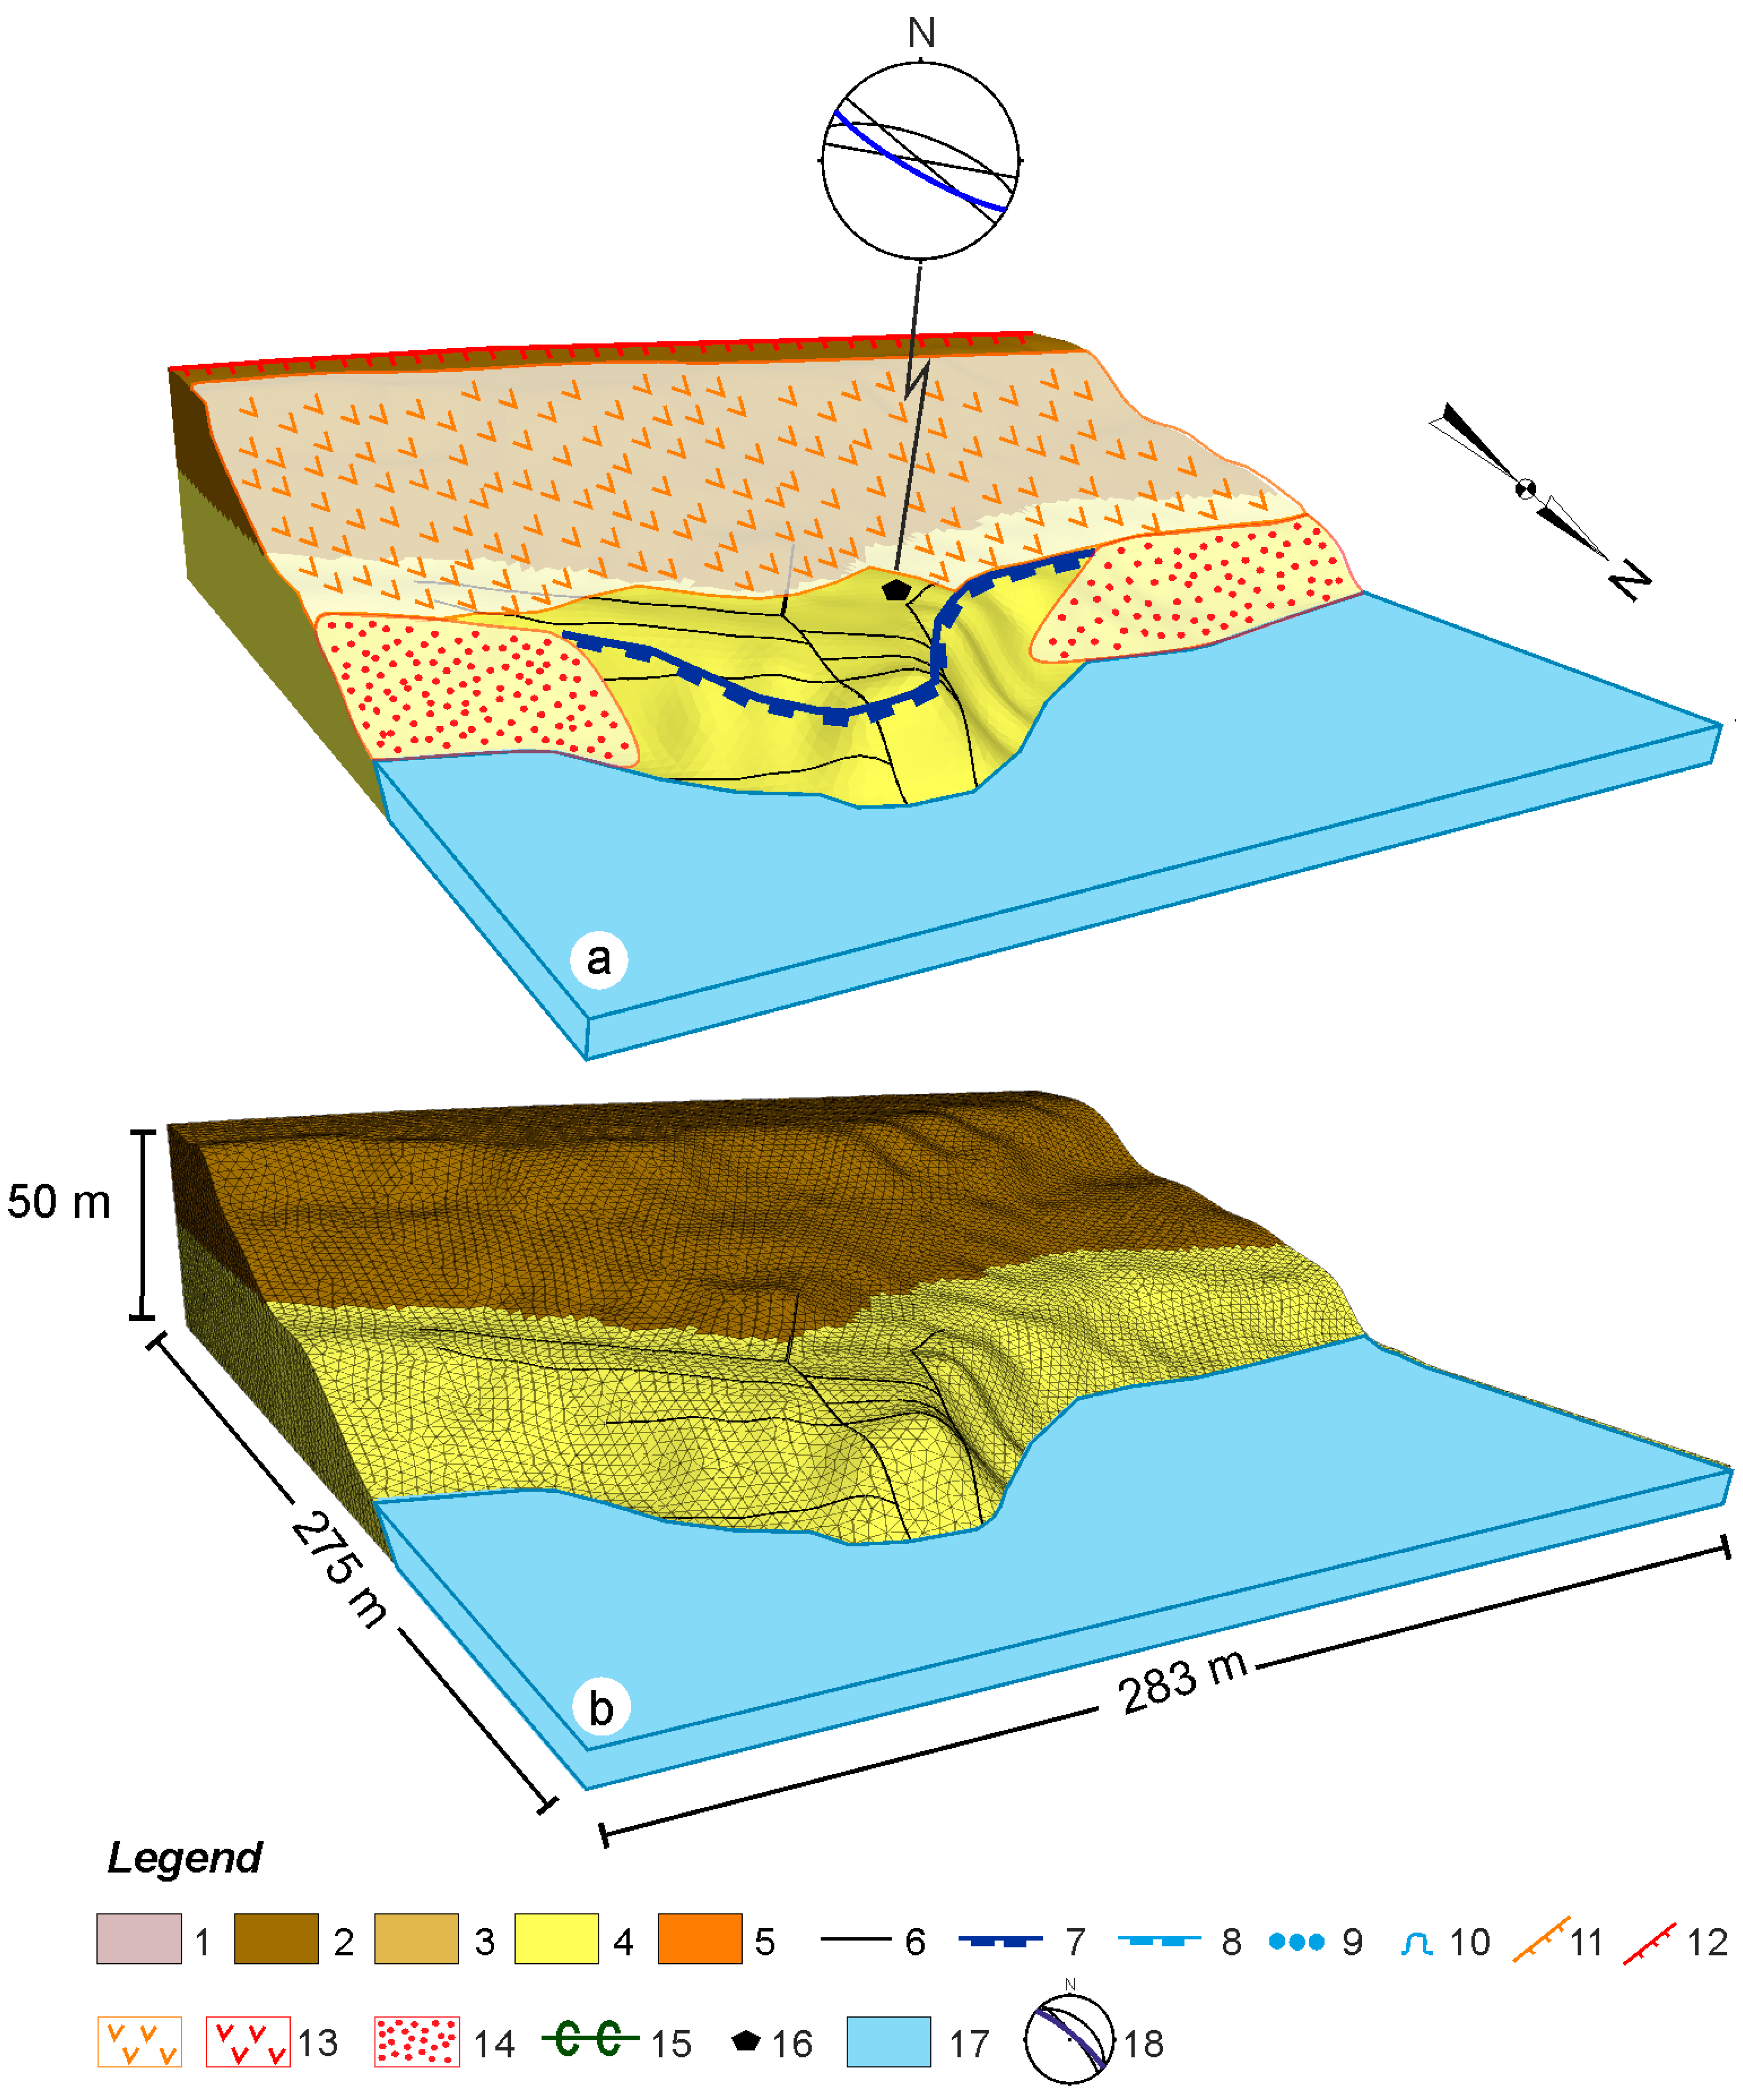
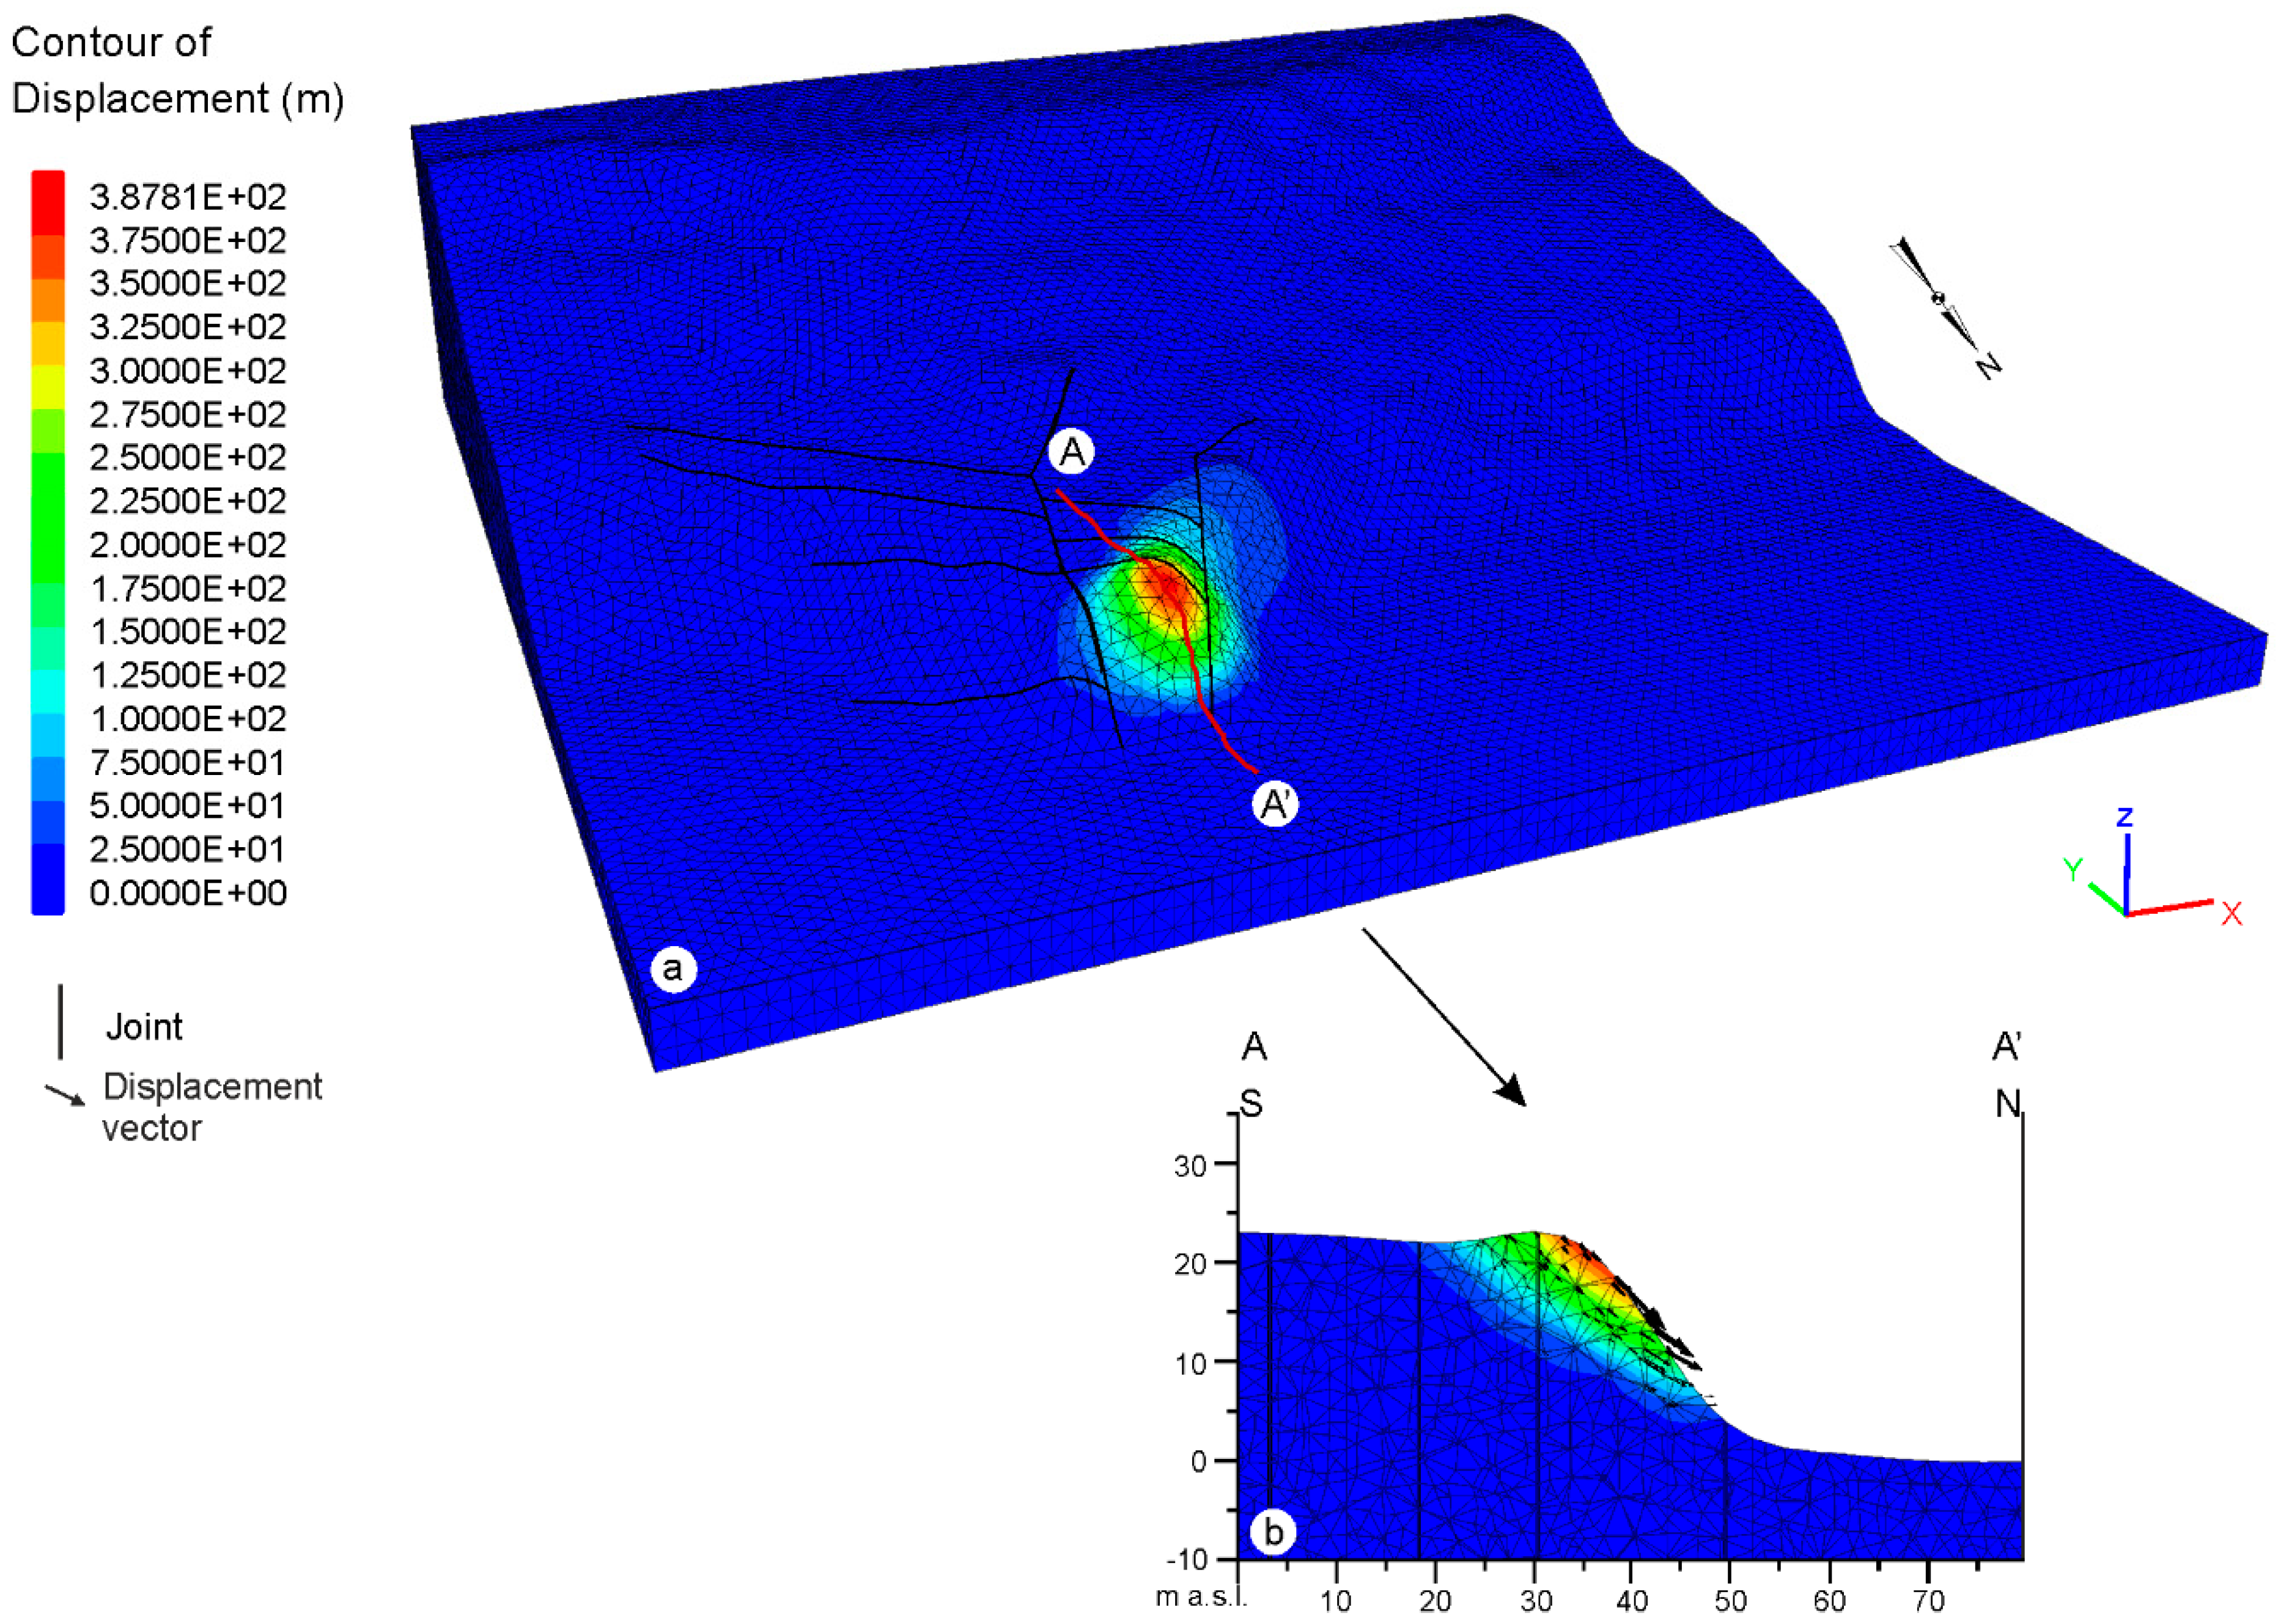
3. Material and Methods

The investigation of the coastal cliffs of Torre Mucchia, Punta Ferruccio, Punta Lunga and Punta Aderci is based on an integrated analysis incorporating topographic data and a DEM analysis (LIDAR 2 × 2 m data), aerial photos and an orthoimages interpretation, detailed geologic–geomorphologic and structural-geomechanical surveys, and numerical modelling. The analysis of each cliff site is the result of a general topographic analysis (Figure 3a), and of previous geomorphological and morphodynamic characterizations (Figure 3b,c). Detailed topographic (LIDAR) data, and geological, geomorphological and structural field surveys allowed us to define the local litho-stratigraphic and geotechnical features of the cliffs, as well as map joints, notches and sea caves, as well as allowing us to define a 3D model of the cliffs (Figure 3d and Figure 4a). Finally, minor elements not affecting the cliff dynamics were removed from the model, defining a final simplified model used for the numerical modelling (Figure 3e and Figure 4b).
A LIDAR-derived 2 m-cell DEM (raster coverage derived from a point cloud, acquired in 2011, provided by the National Geoportal of the Italian Ministry of Environment [52]) allowed the realization of the topographic models of the cliff sites. At the base of the cliffs, the models were then manually modified in order to introduce the morphology of main notches and sea caves, resulting from field data and measurements, as well as topographic profiles.
Through GIS processing, aerial photos (Flight Abruzzo Region 2009) and LIDAR data supported the field investigations of the geomorphological features of the cliffs, with a particular regard to landslide distribution and geometry and the orientation of the main joints affecting the cliffs.
Detailed field surveys were carried out at a scale of 1:1000 and provided the litho-stratigraphic characterization of the clastic marine bedrock and the overlaying continental deposits, focusing on the morpho-stratigraphic relationship between bedrock, slope and landslide deposits, and eluvium-colluvium covers [7]. The structural-geomechanical analysis of rock masses was carried out at seven locations along the main cliff areas in order to characterize the joints affecting the rock masses. Combining the field data and photogeological interpretation, the main joints (orientation, length and geometry) were defined as those affecting the geometry and morphology of the cliffs. The geotechnical parameters of the different lithotypes, required for the numerical modelling (Table 1), were derived from previous studies made available by a large national and regional project focused on the seismic microzonation of the Italian territory. The uniaxial compression strength of the materials is usually < 5 Mpa (the value considered for soft materials [2]). The parameters are average values resulting from numerous surveys carried out in the analyzed coastal sector [53,54,55]. They are assumed to be constant, and the variability due to local lithological changes and to cliff weathering is not considered at this stage. The joint parameters were obtained from the geotechnical parameters of the lithology on which they are set (Table 1).
The geomorphological field surveys (scale of 1:1000) were carried out according to the recent Geological Survey of Italy guidelines [56], identifying present and ancient landforms, as well as the morphogenetic processes affecting the cliffs focusing mainly on marine and coastal processes, as well as gravity-induced processes [57]. Moreover, periodic field observations (from 2004 to 2018), combined with aerial photo interpretation, allowed a multitemporal analysis of the active ongoing evolution in the studied coastal sites.
The overlay of topographic, geological-structural, geotechnical and geomorphological data made it possible to characterize the geometry of the analysed cliffs, focusing on the relationship between the lithology (conglomerate, sand, sandstone, and clay) and the main structural discontinuities and geomorphological elements (e.g., joints, notches, sea caves, and landslide) (Table 2). The distribution and variability of the meteo-climatic factors were neglected at this stage of the study because their effects are included in the geomorphological features of the cliffs. All these elements were analyzed in order to reproduce reliable geologic–geomorphologic 3D models of the cliffs, as well as to characterize the geotechnical parameters of the lithotypes and joints request for the numerical modelling. The final local 3D models (Figure 3d) and the related cross-sections (Figure 4a) were simplified by removing minor elements (e.g., the superficial deposit covers <3 m in thickness, and the minor joints and discontinuities, Figure 3e and Figure 4b). Thus, the models used for the numerical analyses include the features directly affecting the cliff processes (i.e., bedrock lithology, main joints, notches, and caves).
Numerical modelling was carried out with FLAC3D (Fast Lagrangian Analysis of Continua in 3 Dimensions), a three-dimensional finite differences numerical code, which is used for slope stability studies [19]. Generally applied for continuum models, FLAC3D allows for the introduction, like in the present study, of a limited number of interfaces in order to represent a physical discontinuity, as well as bedding planes, fault and joints.
All FLAC3D analyses were carried out selecting the Mohr–Coulomb constitutive model. The numerical modelling provided an estimate of the stress–strain response of the cliffs, identifying the most critical areas and deformable volumes, allowing the estimation of landslide mechanisms, triggering conditions and the possible evolution of landslide phenomena along the cliffs [20,21,22].
The three-dimensional models were discretized with a mesh of tetrahedric elements of 3 m in size (Figure 5). This enabled us to include the main lithological layers and not the minor lenses in the models, as well as the major joints (some tens of meters in length and spaced > 3 m apart) and the large coastal notches.
The analyses were performed in static conditions to specifically investigate the role of joints and notches in the different lithological features of the cliffs (Figure 6). The critical areas, the possible kinematics of the landslide and the retreat mechanism of all the cliff sites were evaluated for simulation cases where failure conditions are reached (system not convergence), showing the failure pattern and the expected landslide mechanisms. When the static analysis featured no failure conditions (system convergence), a second analysis was carried out through the strength reduction method in FLAC3D, which outlined the displacement pattern and the possible failure mechanism. This technique was executed automatically by the software, which progressively reduced the shear strength parameters (cohesion and internal friction angle) of the material and the joints to bring the slope to a state of limiting equilibrium [58,59,60]. The role of the lithology, morphology (notch, sea cave) and morphostructure (joints) was investigated for each cliff site, through the analysis of the displacement contours and vectors on the modelling results and the related sections pertaining to each cliff.
For each modelling result, the main critical areas in terms of stability were defined. The displacement pattern suggested different types of failure such as translational slide, rockfall, topple and the possible combination of these mechanisms. Through the interpretation of these results, the role of the main joints and notches, and their geometry in controlling the landslides’ mechanism and kinematics, is discussed for the different types of cliffs (on sandstone or conglomerate), outlining the overall cliff evolution. This contributed to understanding the recession of the cliffs, the related landslide mechanisms and the controlling/triggering factors.

4. Results

The analyzed active cliffs are developed on different soft clastic bedrock units of the clay-sand-sandstone-conglomerate Pleistocene sequence, with lithological variations between toes and tops. They are grouped into (1) cliffs on sandstone, Torre Mucchia and Punta Lunga (Figure 7a,b), and (2) cliffs on conglomerate, Punta Ferruccio and Punta Aderci (Figure 7c,d). The cliffs on sandstone are formed when the bedrock clay-sand-sandstone-conglomerate sequence shows a clay/sand interface that is just below the present sea level, whereas the cliffs on conglomerate are formed when the bedrock clay/sand interface is well below the present sea level [7]. Their different lithologic, structural and geomorphological features, which result from field surveys, are summarized in Table 2 and described in the following subsections.

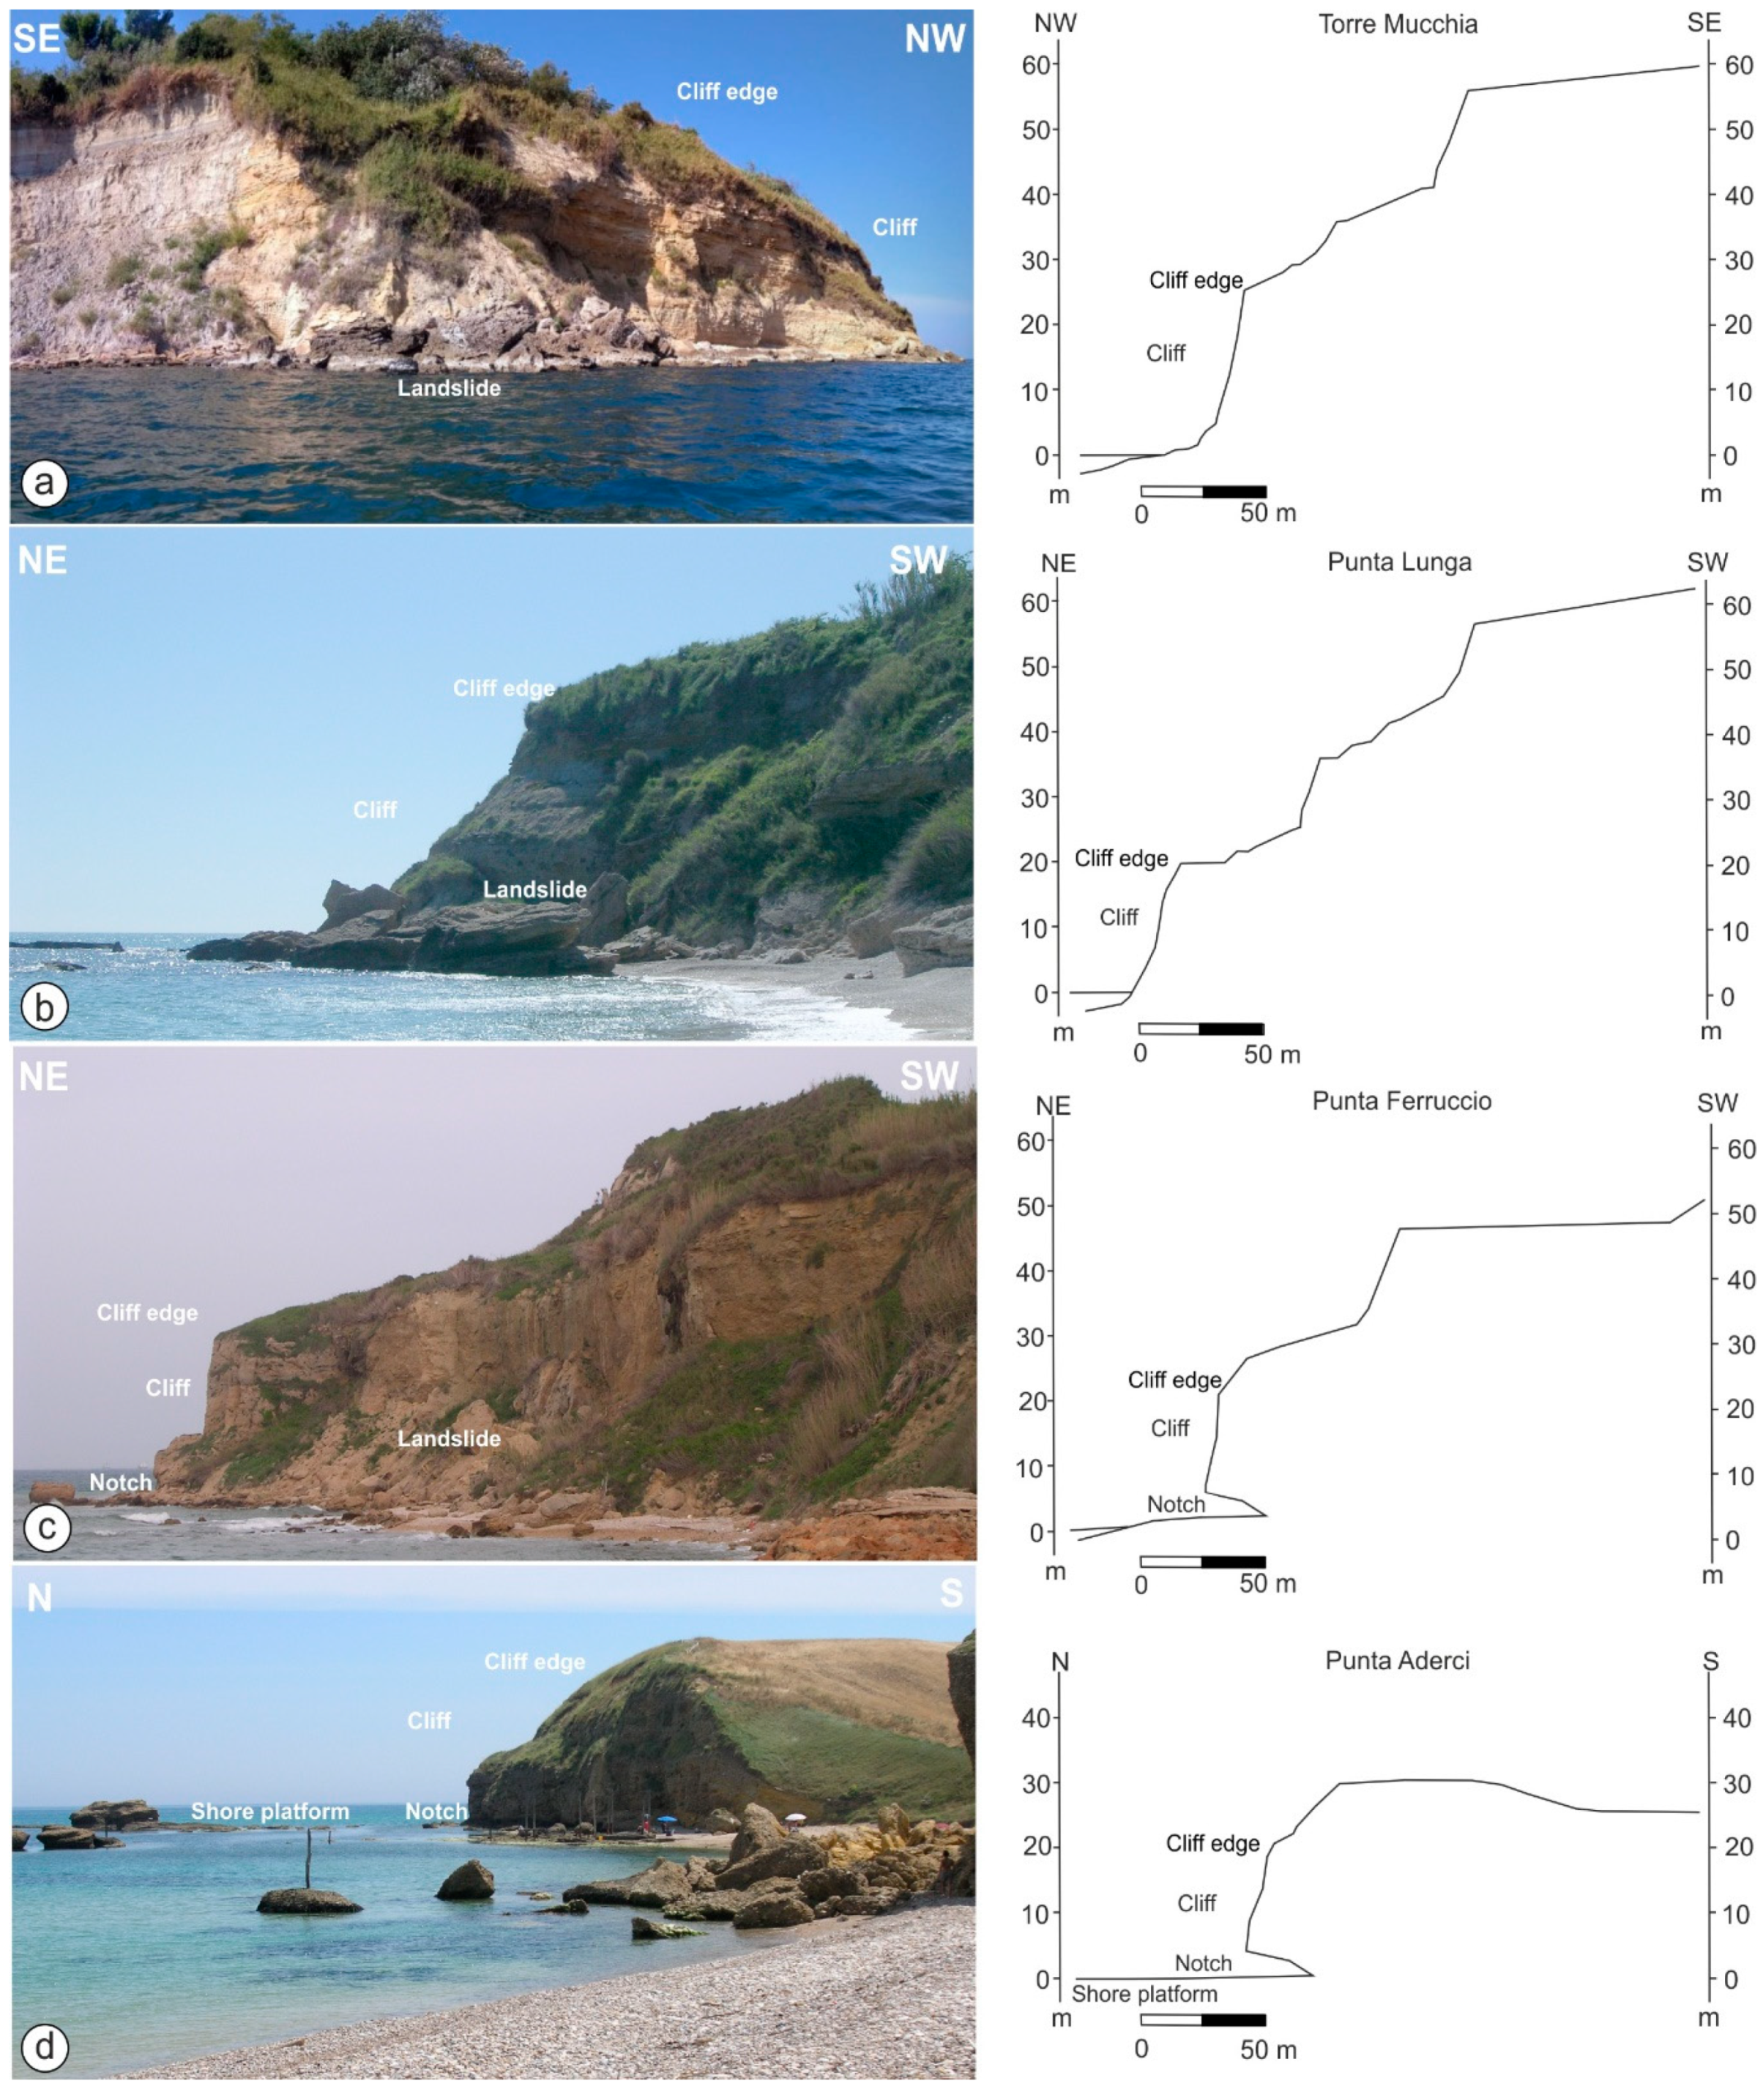
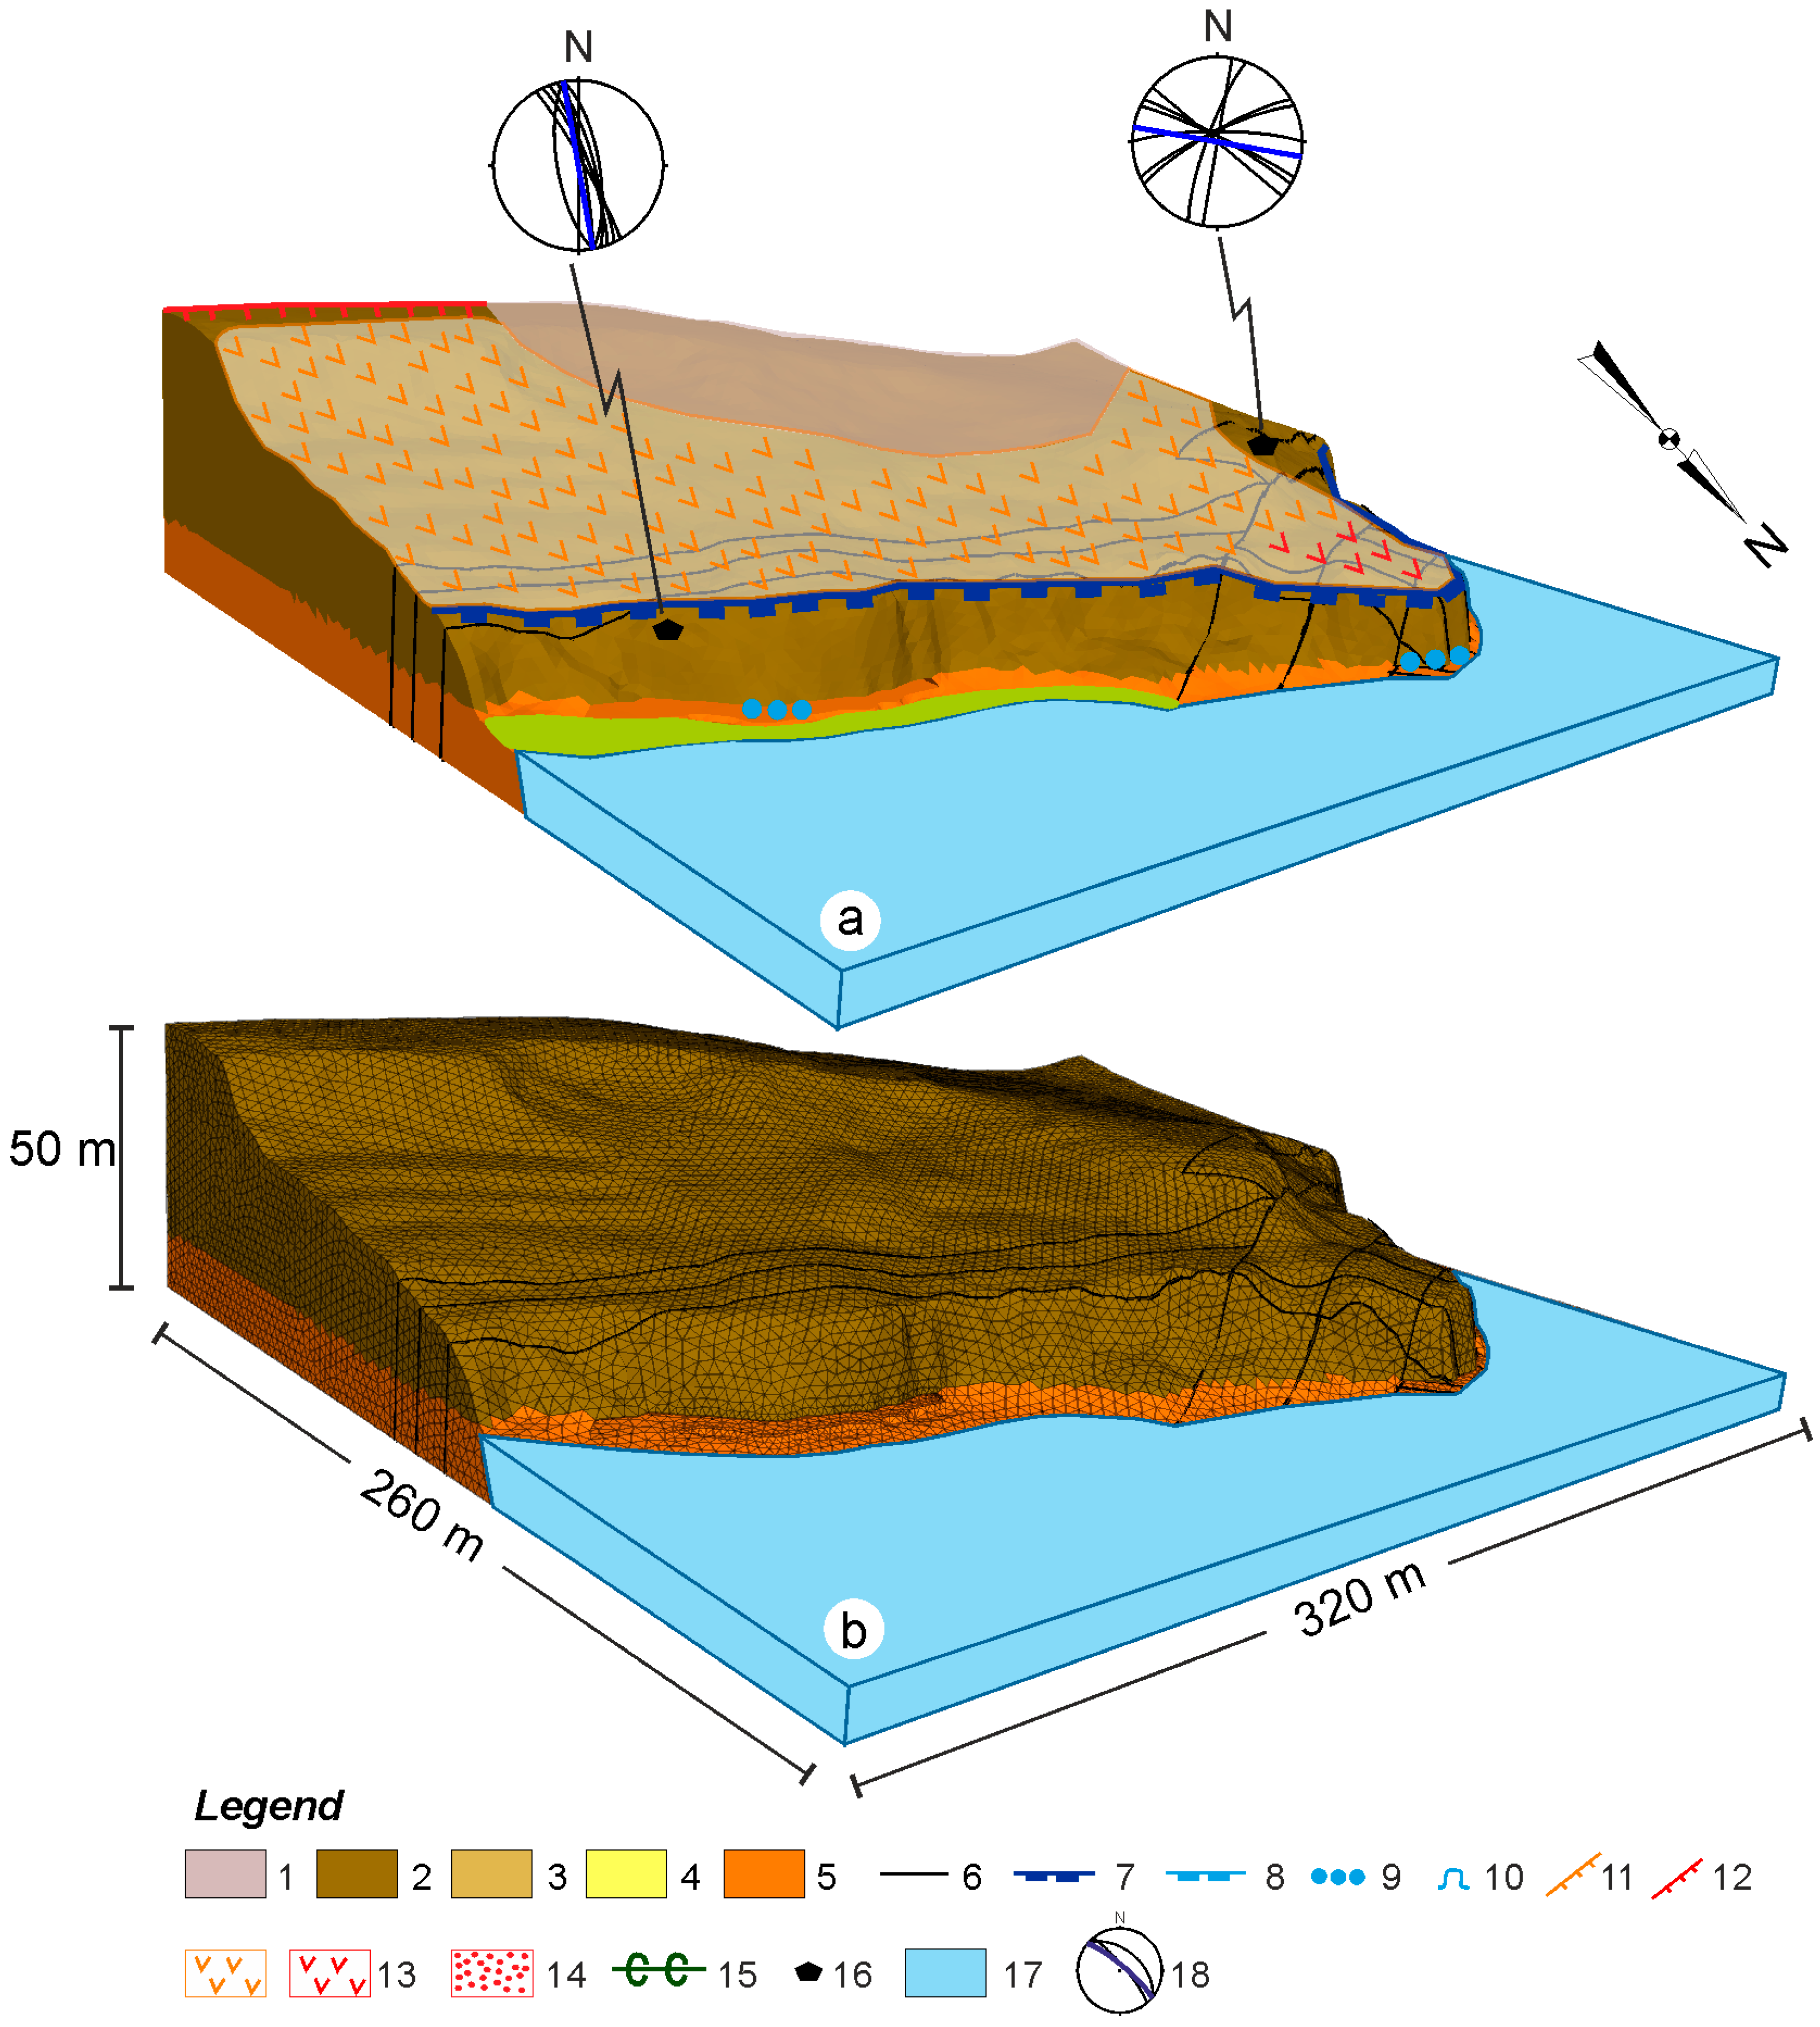
4.1. Cliffs on Sandstones: The Cases of Torre Mucchia and Punta Lunga

4.1.1. Torre Mucchia

The Torre Mucchia cliff features a double-step morphology. The lower one is the main active cliff, 25 m in height, with very steep or vertical walls; above the cliff, a gentle slope is present up to the top scarp of the entire slope. The geological bedrock of the Torre Mucchia cliff consists of tens of meters of consolidated sand and cemented sandstone, with a weakly cemented conglomerate level on top; this sequence lays over the clay unit just above the sea level (Figure 8a). The bedrock is covered by < 3 m superficial deposits consisting of eluvial and colluvial covers, which were removed in the simplified model (Figure 8b), as well as for all the other 3D models, because of their limited thickness for modelling purposes. Lithotypes are largely affected by joints that are some tens of meters in length and are spaced < 1 m to 5 m apart. Their main orientations are N90°E, 75°N; N50°W, 50°NE; and N10°E, 80°ESE (Figure 8a).
The numerical analysis performed on the simplified model highlighted some critical areas next to the main joints. In particular, the most critical area, in the eastern part of the cliff (Figure 9a), is located at the intersection of the N–S and E–W joint systems. The displacement contours originate from the joints, which control the mechanisms outlining a possible topple landslide or a combination of translational slide and topple-fall (Figure 9b).
The central-western part of the cliff (Figure 9c) shows a minor control related to the joints. The 3D model outlines a moderate displacement along the joints, while the section view outlines displacement vectors with a pseudo-circular deformation from the inner part of the cliff and not from specific joints. The displacement contours outline a possible roto-translational slide.

4.1.2. Punta Lunga

The Punta Lunga cliff shows vertical walls < 25 m in height. The geological model (Figure 10a) of the bedrock is characterized, as in Torre Mucchia, by tens of meters of consolidated sand alternating with cemented sandstone, with a weakly cemented conglomerate unit in the upper part of the slope above the cliff scarp; furthermore, it is covered by thin layers of eluvial and colluvial deposits. Due to the lithological complexity of the area, the alternation of the different outcropping lithologies has been simplified (Figure 10b). The main joints, which affect the bedrock, are spaced from < 1 m to 5 m apart, and they show N60°E, 90°; N70°W, 70°NNE; and N20°W, 90° directions.
The numerical modelling performed on the simplified model shows a single critical area at the intersection of the main joint systems (Figure 11a), which affects the cliff wall (SW–NE and NNW–SSE orientation). However, in this area, the joints show a minor control on the landslide mechanism: the displacement vectors originate from the innermost portions of the cliff, describing planar sliding surfaces (Figure 11b) connected to the translational slide, probably associated with rockfall.

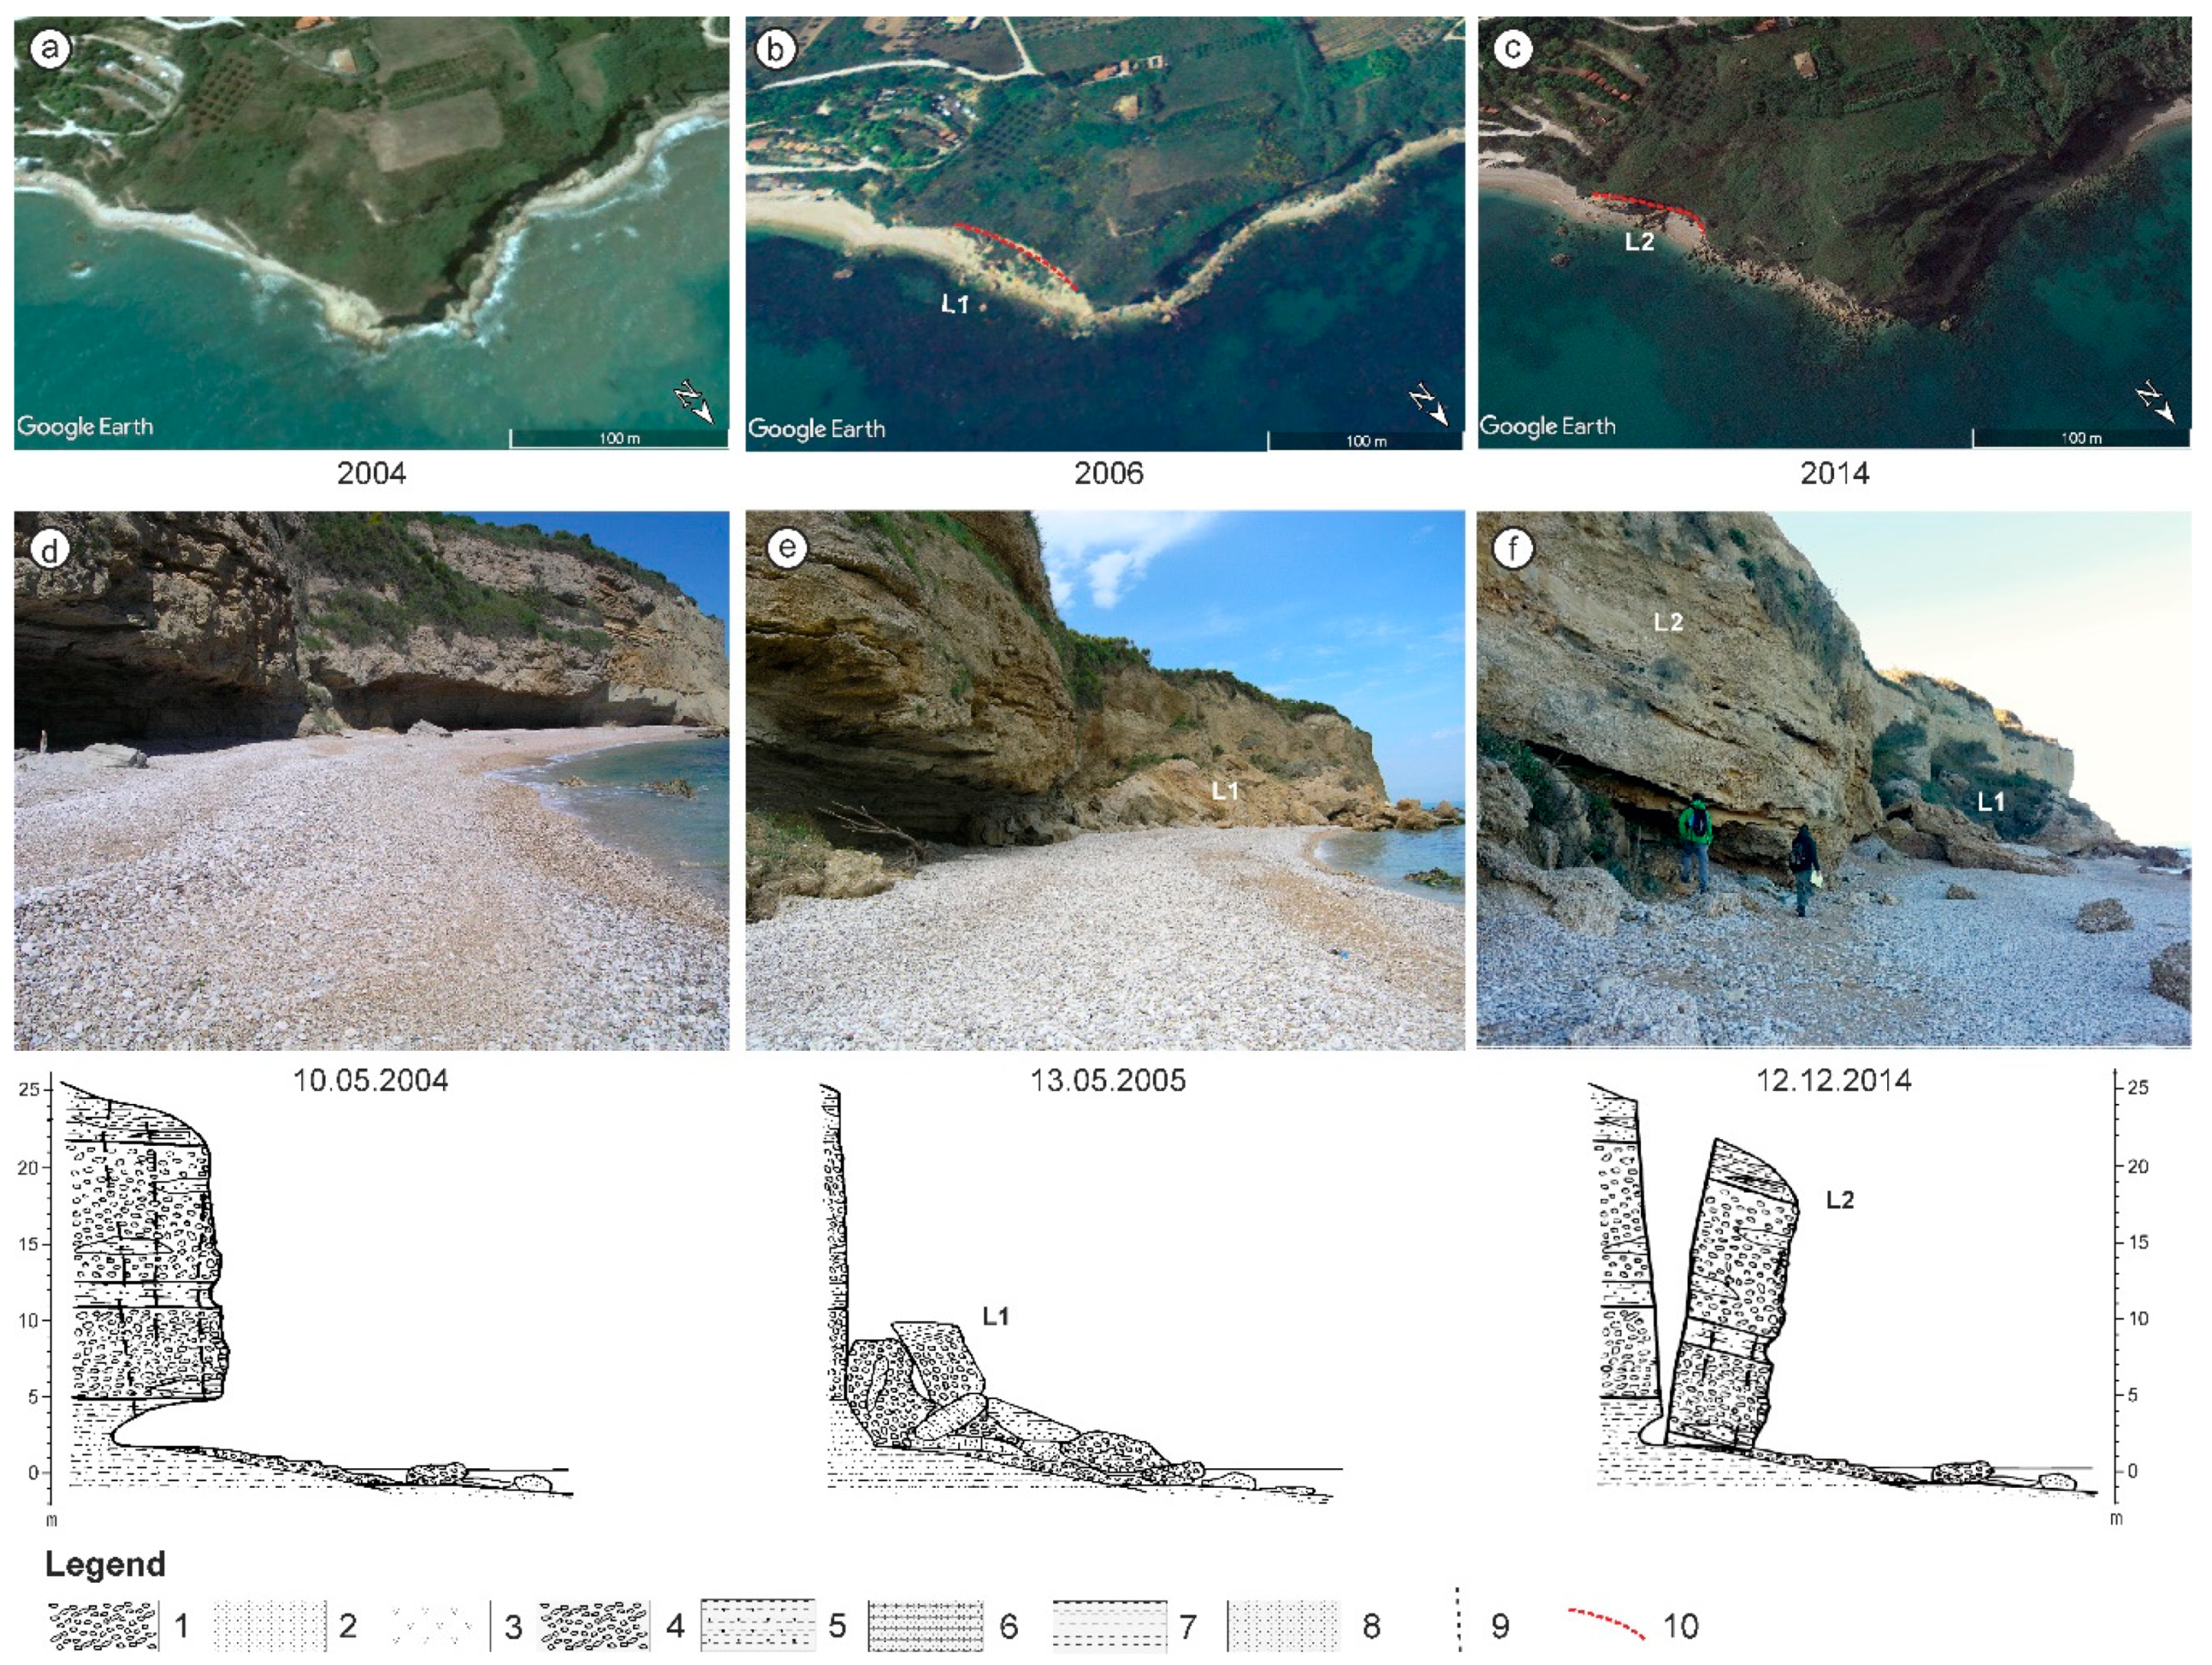
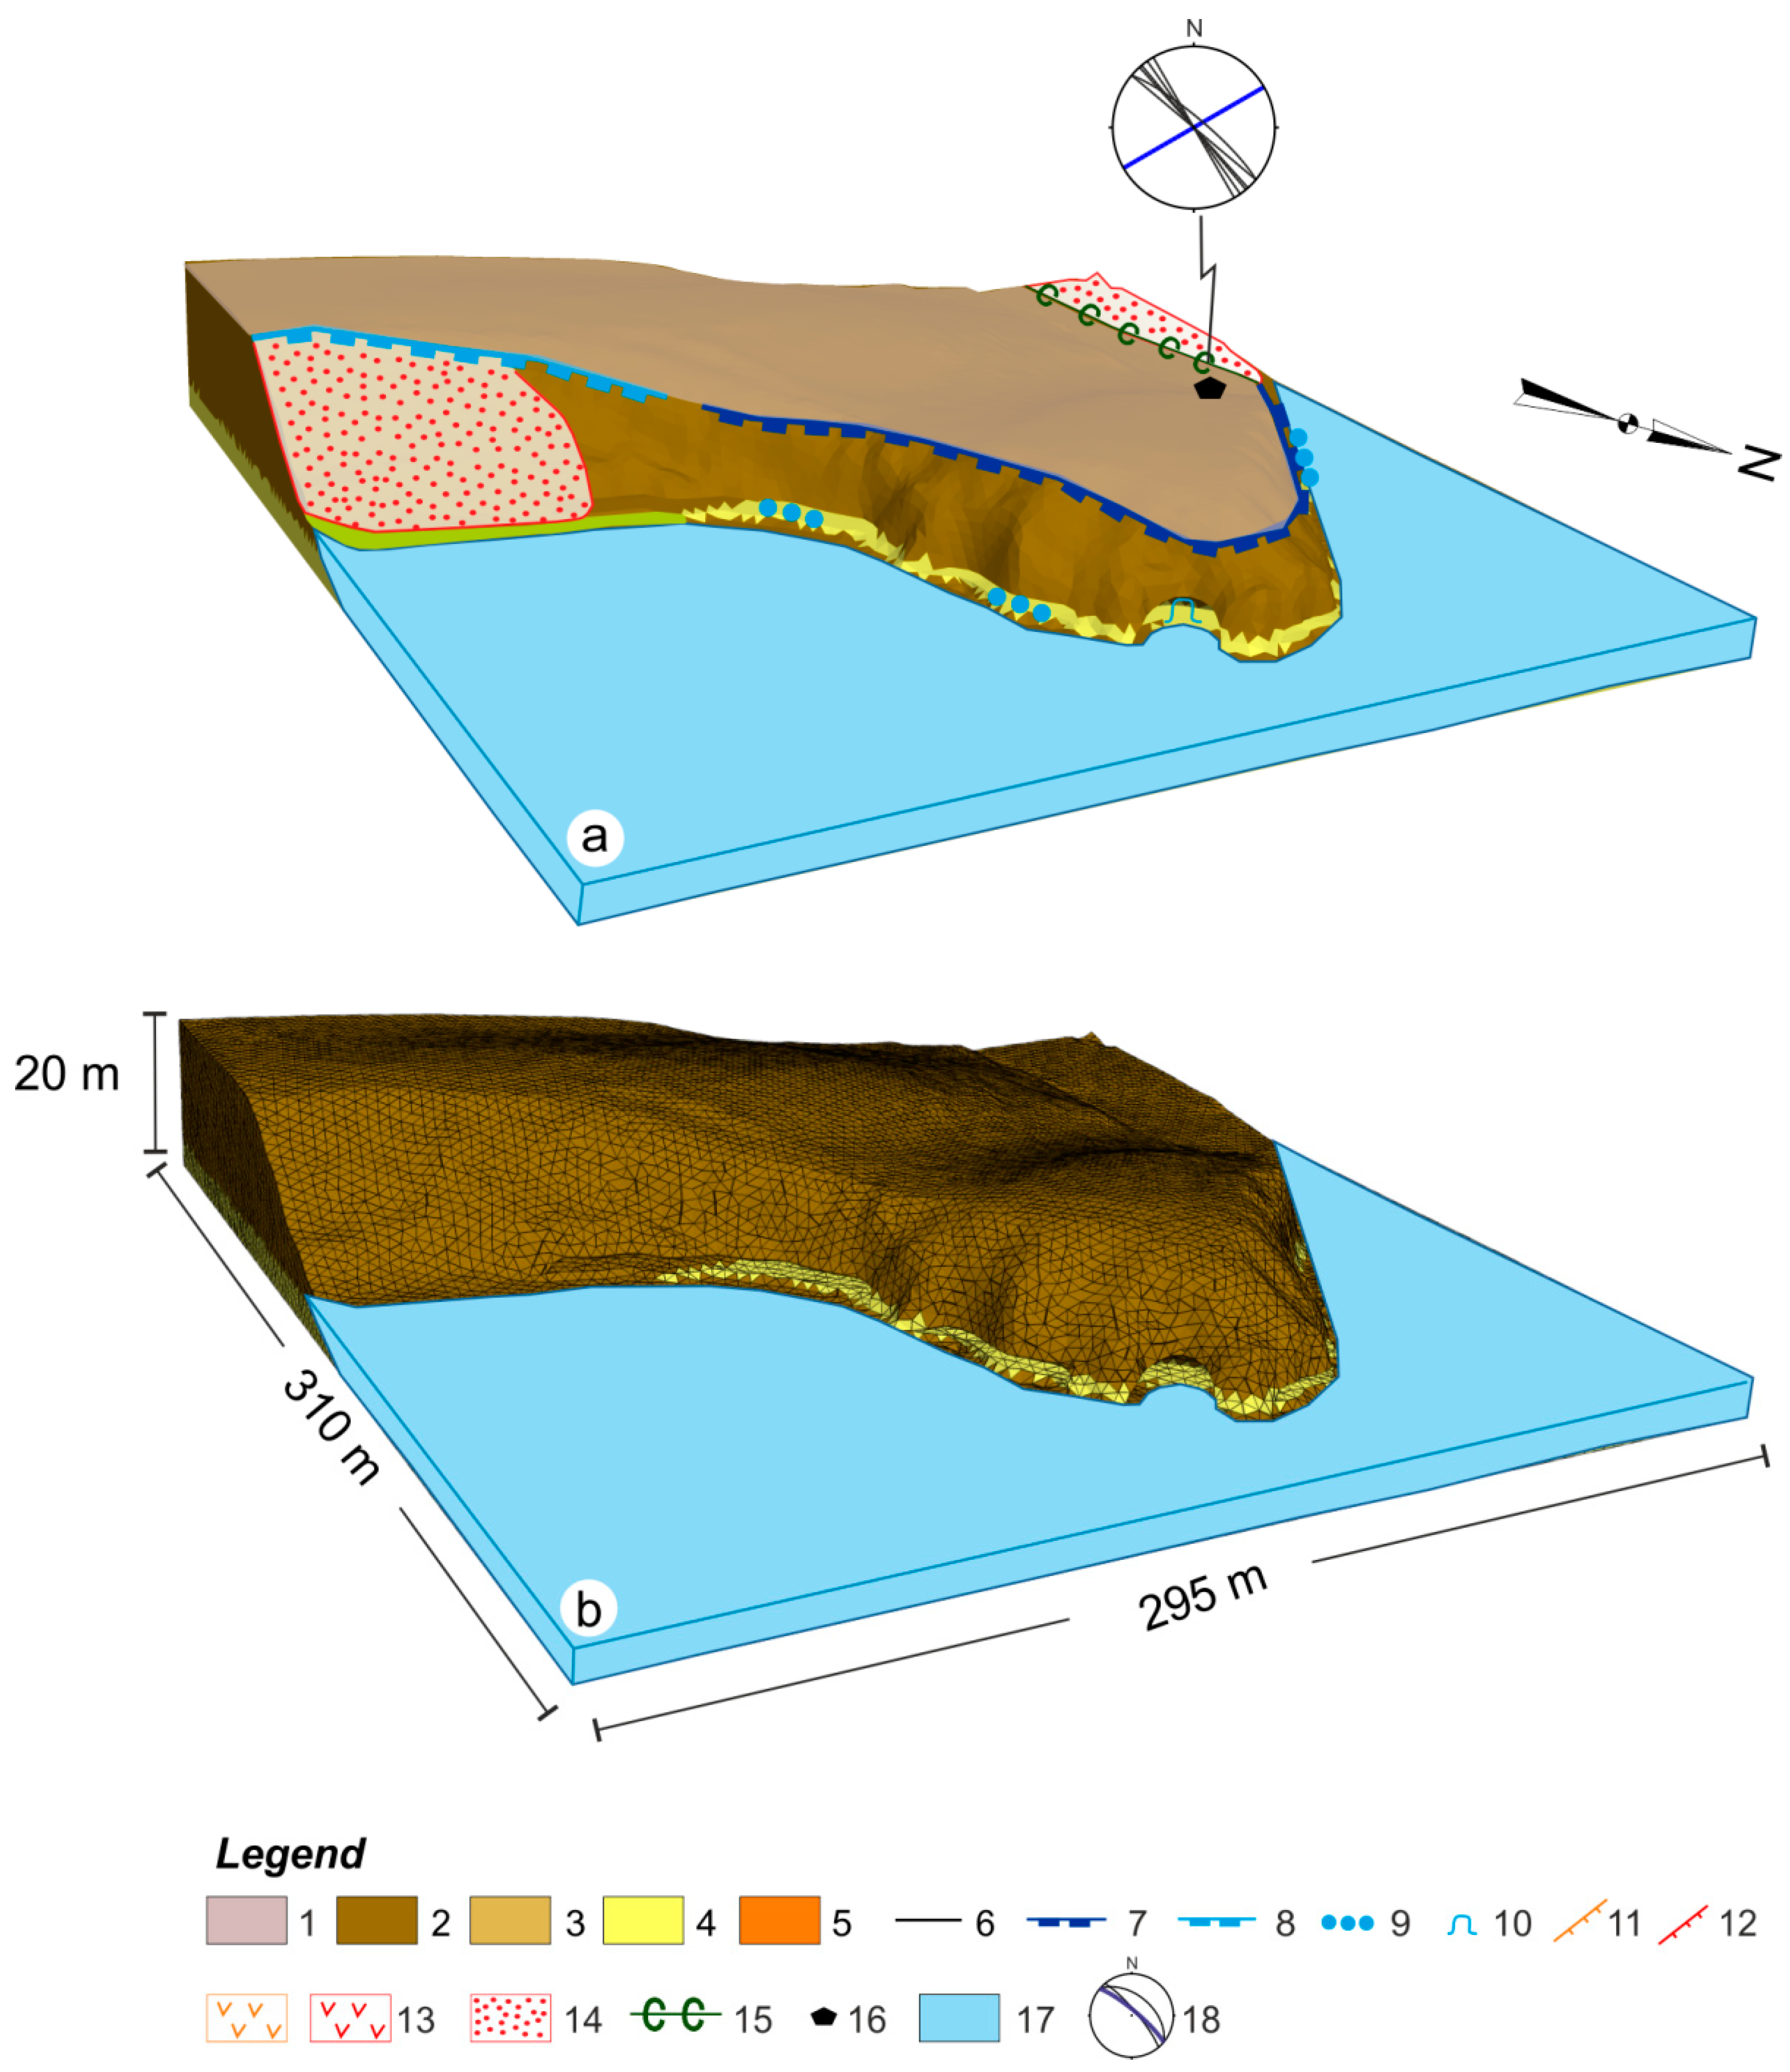
4.2. Cliffs on Conglomerates: The Case of Punta Ferruccio and Punta Aderci

4.2.1. Punta Ferruccio
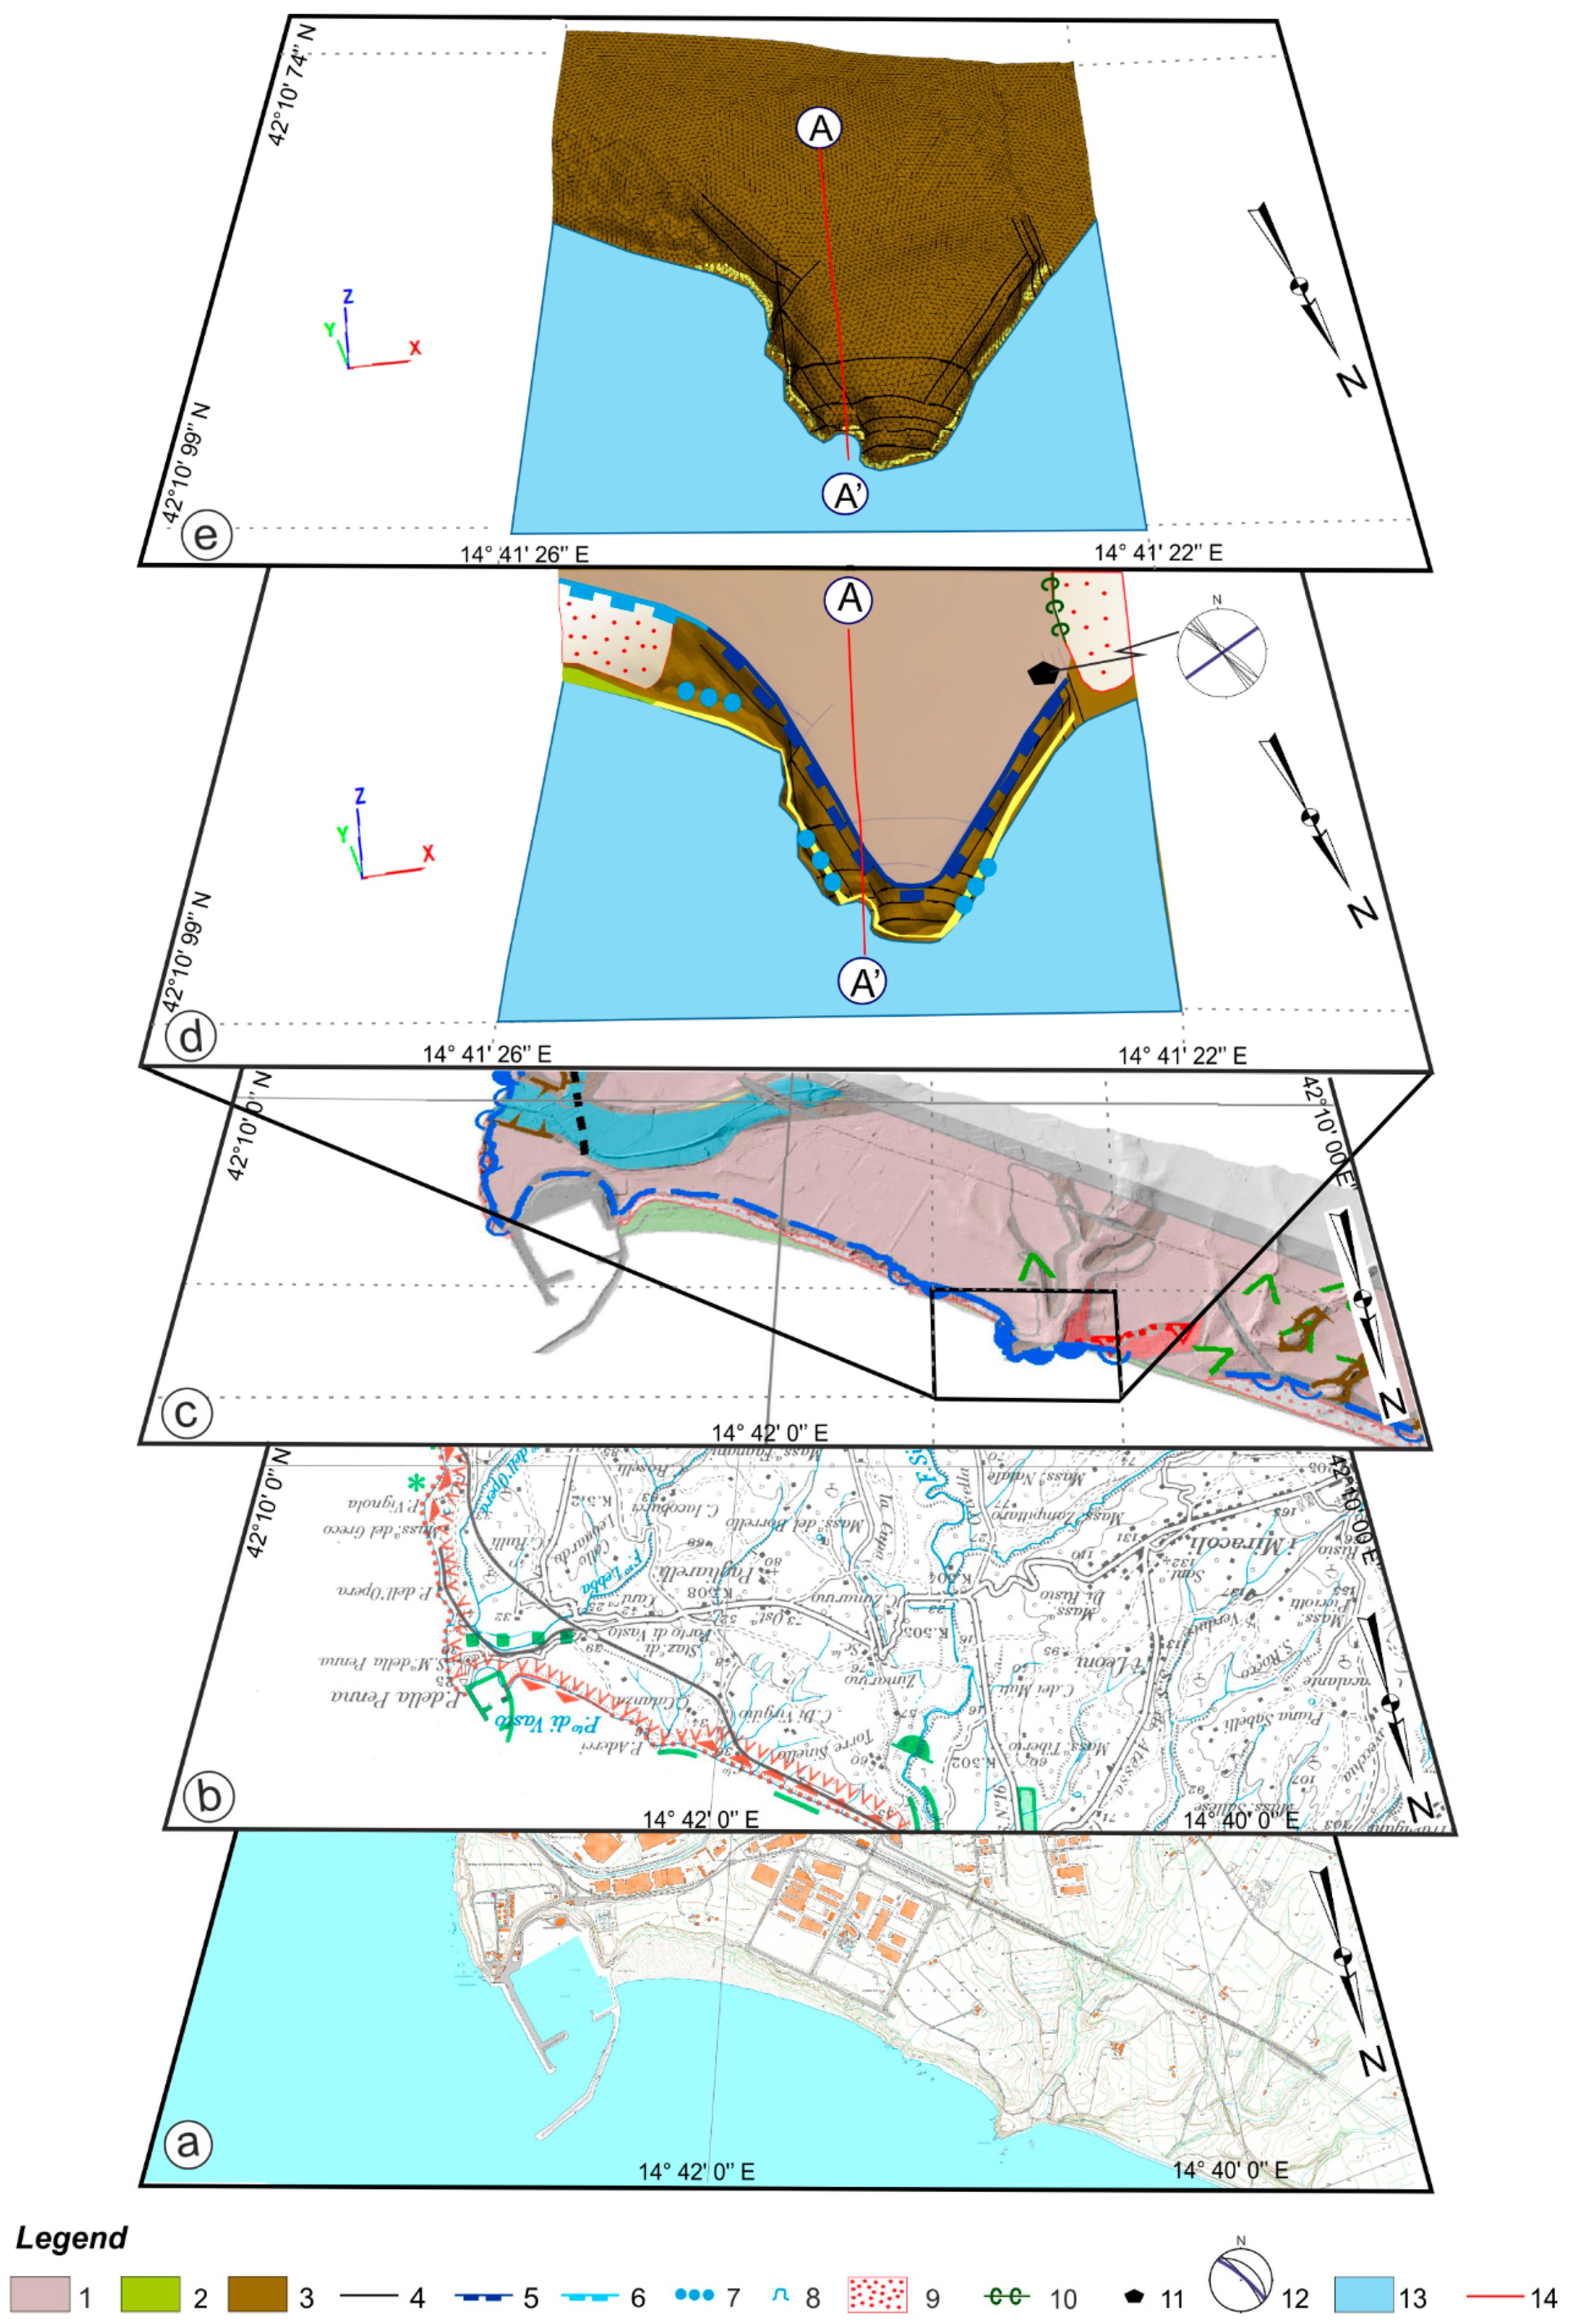
Punta Ferruccio shows vertical cliffs and an alternation of concave–convex slopes of > 25 m in height. Some notches are present at the foot of the cliff, in poorly cemented clayey sandstone-interbedded layers within conglomerates. They reach up to 7 m in depth and 4 m in height. The geological bedrock of Punta Ferruccio (Figure 12a) is made of tens of meters of conglomerate laying over sandy-clay layers. The bedrock is widely affected by some tens of meters in length and joints spaced from 3 m to 10 m apart, with N20°E, 80°WNW; N60°E, 80°NW; N90°E, 90°; N60°W, 85°SW; N60°W, 85°NE; and N20°W, 80°NNE orientations. The covers, excluded in the simplified model used for the numerical modelling (Figure 12b), include eluvial and colluvial deposits, as well as active and dormant landslides. The model is defined on the base of the LIDAR data acquired in 2011; after that, in 2014, the eastern part of the cliff above a notch was affected by a topple landslide.
The analysis carried out on the Punta Ferruccio model revealed that the cliff reaches the failure conditions in two critical areas along the main joints, with an E–W trend parallel to the cliff (eastern area) or at the intersection of two joint sets (western area) with an N–S and NE–SW orientation, specifically defining wedges over the notches bordering the foot of the cliff (Figure 13a).
Two-dimensional sections (Figure 13b,c), cutting the model in correspondence with the two failure areas, clearly outline a topple movement that involves the cliff above the notches. The major joints largely influence the failure geometry and the landslide mechanisms on the cliff: the displacement vectors originate from the more external joint (Figure 13b) or at the intersection of the two main joint systems affecting the cliff (Figure 13c). The combination of notches as deep as 7 m and major joints parallel to the cliff, along with joints intersecting and forming rock wedges, is revealed to extensively control the landslide phenomena on the cliff and its retreat. These results, obtained on the 3D model reproduced with the LIDAR data and acquired in 2011, are confirmed by repeated geomorphological surveys carried out from 2004 to 2017.
The Punta Ferruccio cliff (Figure 14) was affected by repeated large landslides in 2004–2005 (L1 in Figure 14b,e) and 2014 (L2 in Figure 14c,f). The geological model used for the numerical modelling was defined on the LIDAR data acquired in 2011. Thus, the model simulates the pre-landslide condition for the 2014 event. The field surveys revealed a large topple landslide affecting a large rock wedge along the cliff edge (L2 in Figure 14c,f). The failure involved one of the critical areas defined in the modelling. Specifically, it occurred with the same (topple) mechanism, and with the same geomorphological (above a notch) and structural (along a main joint parallel to the cliff) control resulting from the modelling. In 2004–2005, the cliff edge was already affected by a large event occurring within the same morphostructural conditions as a fall landslide followed by a collapse of the cliff, confirming the failure mechanisms outlined by the modelling for cliffs on conglomerate with a notch (L1 in Figure 14b,e,f).

4.2.2. Punta Aderci

The Punta Aderci cliff is > 25 m in height and has an undulated concave–convex or vertical slope. It has a horizontal shore platform, from 70 to 100 m in width, with rocks rising up to 1.5 m a.s.l. The cliff develops on a conglomerate bedrock with thin sand-sandstone lenses. The bedrock is covered by eluvial, colluvial and slope deposits (Figure 15a) It is widely affected by joints (spaced 3–7 m apart) with N60°W, 90°; N50°W, 80°NE; and N20°W, 90 orientations. Different from Punta Ferruccio, the notches are smaller and discontinuous, but a large sea cave is present. Both the notches and the cave, as well as the main joints and lenses, are included in the 3D simplified volume (Figure 15b).
In the 3D numerical modelling, the analysis showed a single and small area in failure conditions (Figure 16a). It is controlled by a major joint cutting the cliff model above one of the notches in a very limited area. The cross-section of the most critical area (Figure 16b) shows displacement vectors, suggesting a rockfall mechanism for the landslides affecting this coastal sector, as is largely confirmed by small rockfalls along the cliff.
A second stage of modelling was performed in order to investigate the residual stability of the cliff after removing the small outermost wedge above the notch in failure conditions at the first stage. This approach made the further evaluation of the stability of the Punta Aderci cliff possible, analyzing the influence of notches and joints on the cliff retreat processes and mechanism. In this case, the convergence of the numerical algorithm was obtained, meaning that the cliff did not reach the failure conditions. However, two critical areas were identified in the model (Figure 17a). The first one is in the same area highlighted in the first stage (Figure 16a and Figure 17a,c), and it is located at the intersection of the two main joint systems (the N–S and E–W orientations). The displacement vectors in the cross section suggest a topple mechanism for the further landslides expected in this part of the cliff. The second critical area is in the eastern portion of the model (Figure 17a,b), bordered by a notch and along two major joints parallel to the coastline. According to the displacement vectors, the outermost wedge is supposed to be involved in a rockfall mechanism, while the inner wedge is supposed to follow with a topple movement (Figure 17b).
Both the first and second stage of the modelling confirm that rockfalls followed by topples are supposed to be the main landslide mechanisms affecting the Punta Aderci cliff.

5. Discussion

The integrated analysis carried out in this work confirms that the overall evolution of the studied cliffs is connected to gravity-induced processes (cliff failure and landslides) due to coastal erosion cycles at the foot of the cliffs (coastal erosion and notch incision followed by cliff failure). The overall analysis revealed that the landslide mechanisms are mainly controlled by the distribution and geometry of major joints (> 10 m in length and spaced ~3–5 m apart), as well as notches at the base of the cliffs. The major joints that are mainly parallel to the cliffs, or couples of intersecting joint sets forming wedges on the cliffs, as well as deep notches, all act as the predisposing factor for landslide phenomena. The triggering events are not investigated in this study; however, they are supposed to be related to heavy meteorological events (i.e., heavy rainfall) or marine storms, or possibly seismic events, although the coastal area is affected by a moderate seismicity. Moreover, the integration of modelling with field and remote geomorphologic observations made it possible to outline the cliffs’ retreat mechanism, both for the active cliffs on conglomerates and sandstone (estimated in the area from 0.15 to 1 m/yr [7]). This is related to the different landslide mechanisms (rockfall, roto-translational slide, translational slide, and topple), which characterize the cliffs with a multi-annual/decadal frequency, as is also documented by repeated field surveys.
More specifically, for the different types of cliffs, the results showed that:
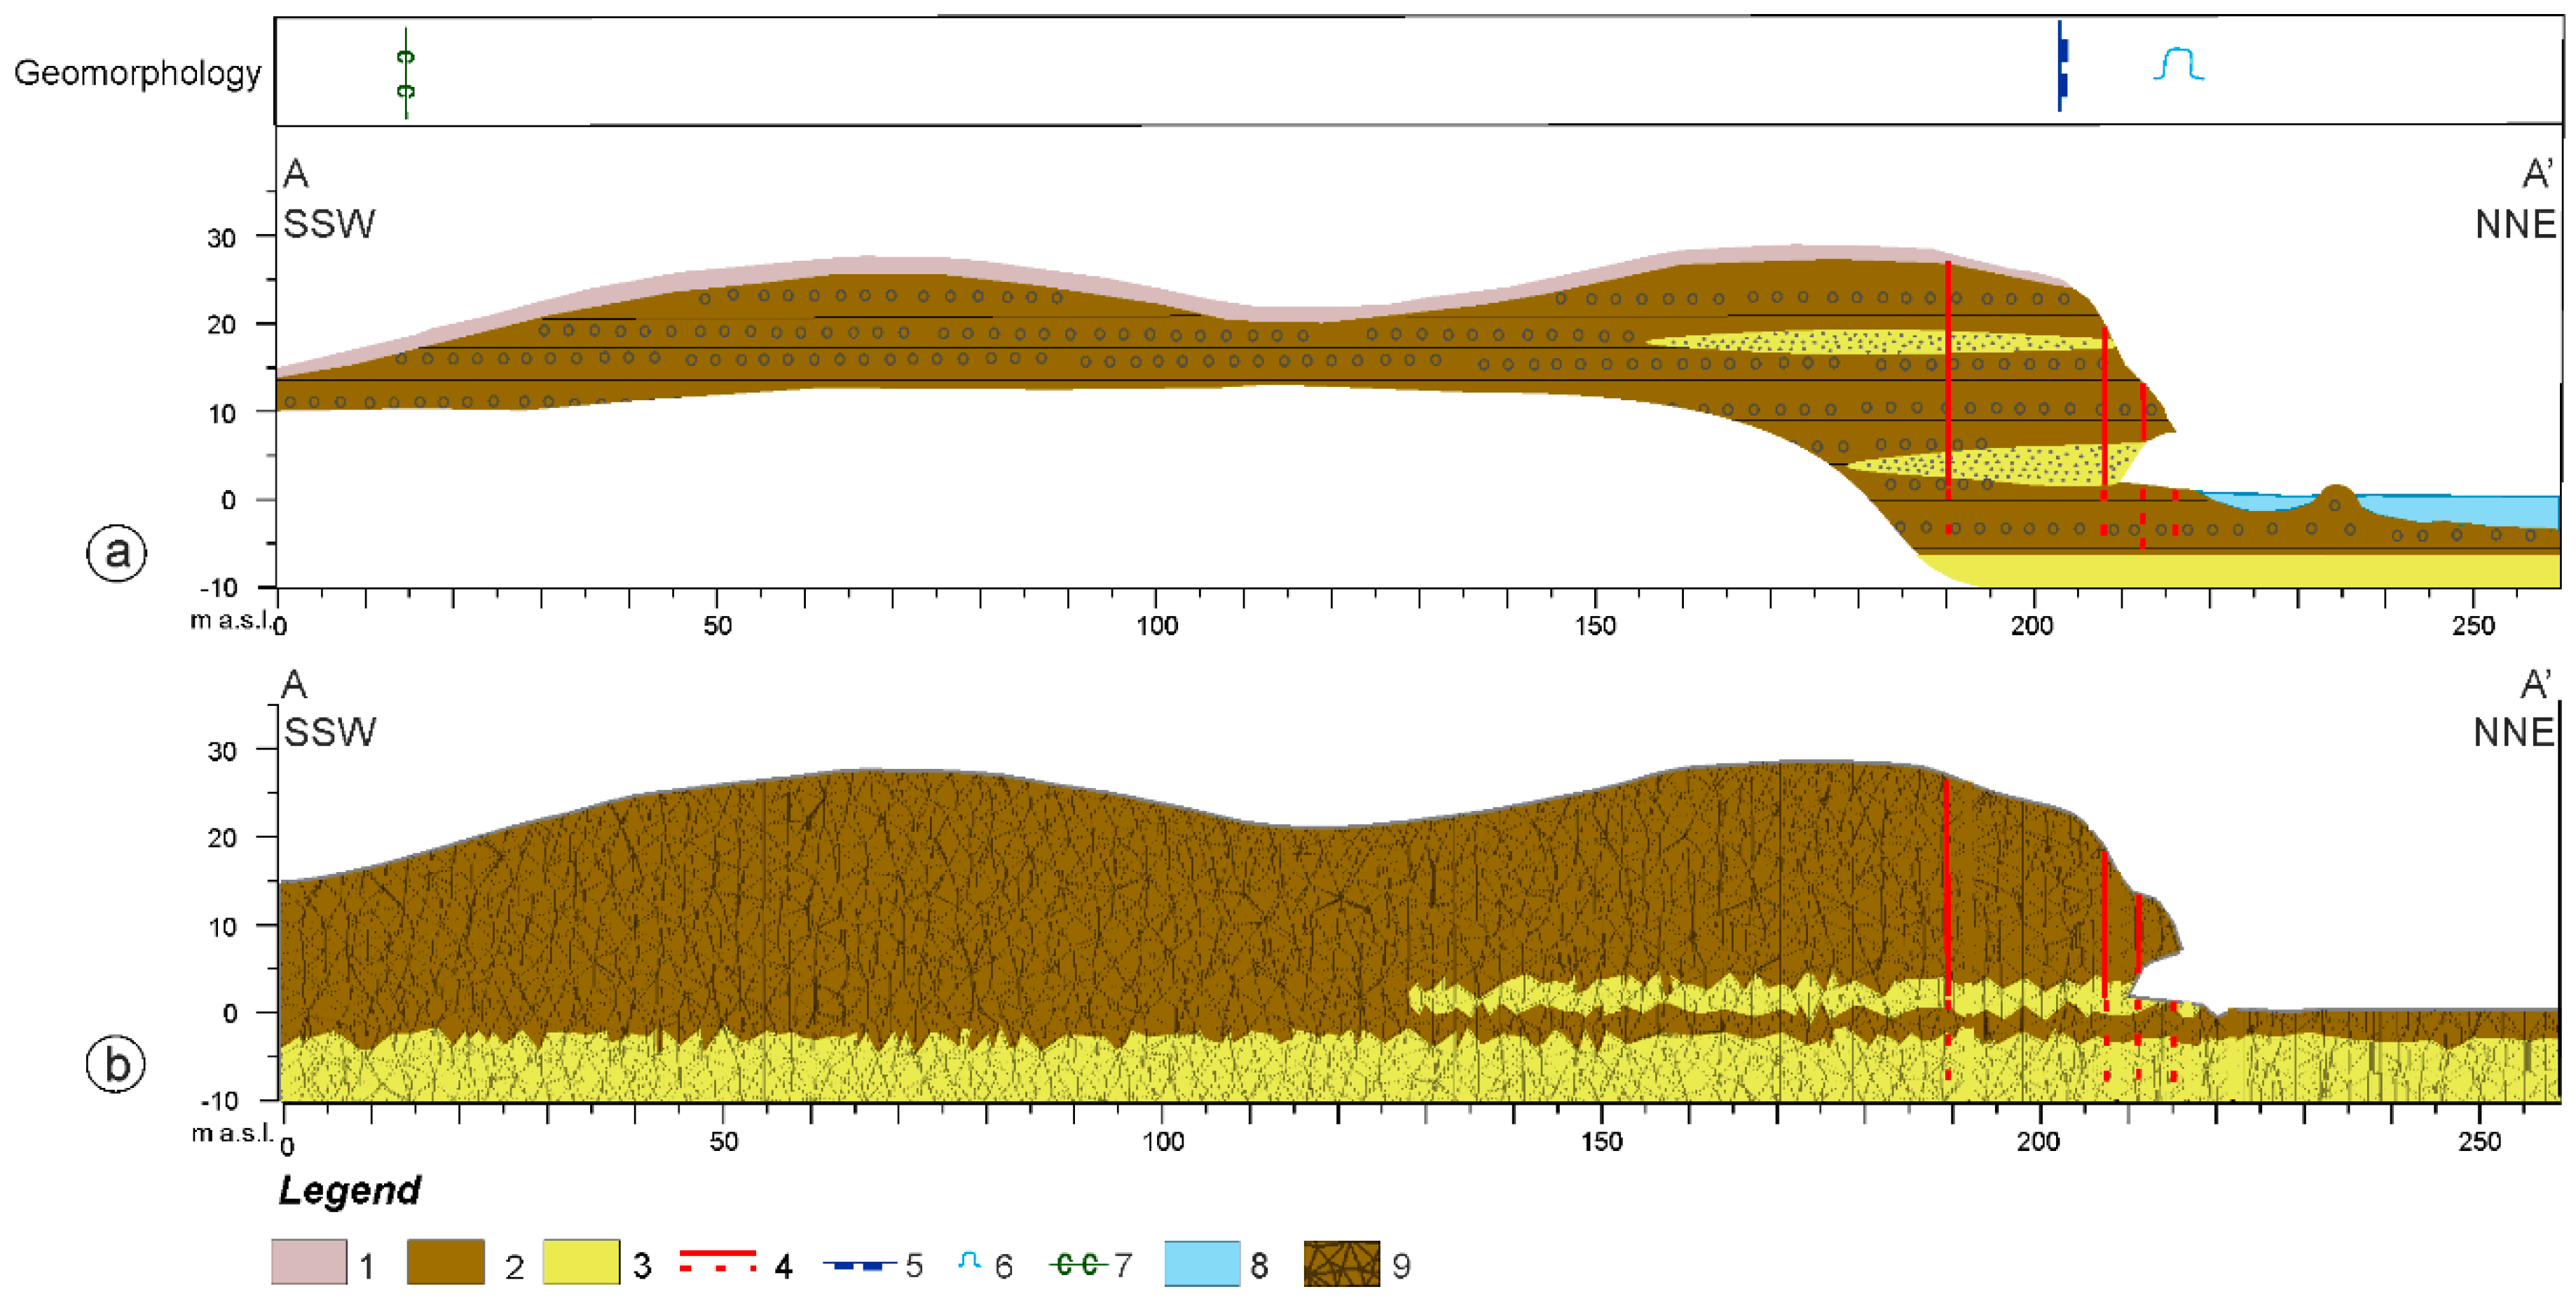
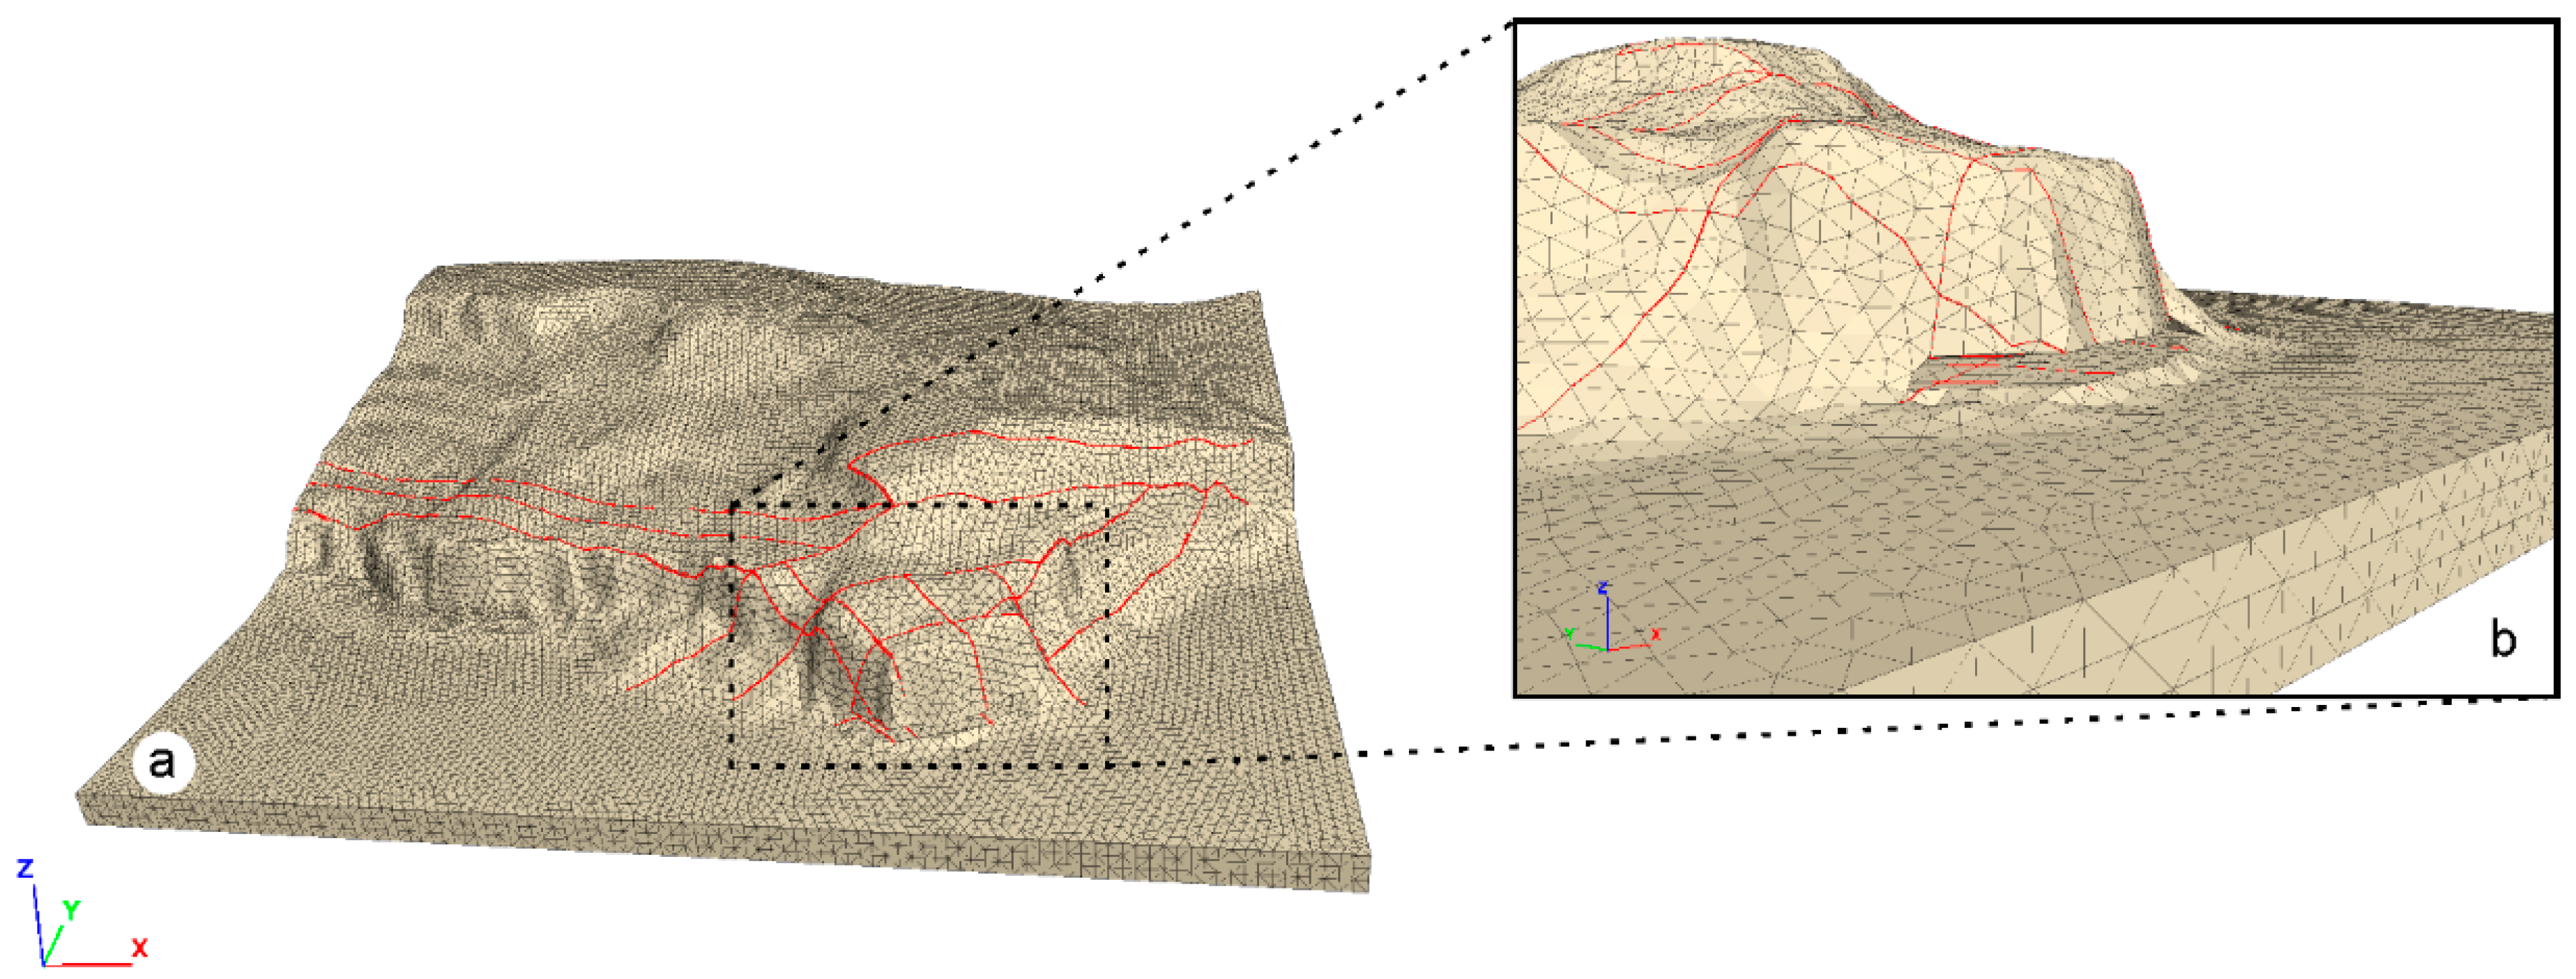
  • Cliffs on conglomerates with a notch frequently reach the failure conditions in the numerical modelling. The notch morphology, as well as the major joints’ orientation and spacing, specifically when they are roughly parallel to the cliff scarp or intersecting to form wedges on the cliff, control the location, geometry, landslide mechanisms and distribution of the failure and landslides. Two different landslide mechanisms affect and are expected on these cliffs: (i) the rockfall and/or collapse of the outer rock wedges of the cliffs where the joints are closely spaced; (ii) the topple of the main wedges bounded by major joints, where the joints are more widely spaced. The rockfalls of the outer wedges can be followed or combined with the topple of the inner wedges.
  • Cliffs on sandstone are generally in no failure conditions in the numerical modelling. In these cases, the retreat of the active cliffs is still related to gravity-induced processes connected to the local coastal undercutting of the cliffs, the local variability of the lithological features and possibly the weathering of the rocks along the cliffs. This can induce a worsening of the geotechnical parameters of the rocks, which was roughly simulated by the shear strength reduction method. The main expected landslides are connected to translational slide failure mechanisms, occasionally combined with rockfalls. The major joints show a minor control of the cliff failure mechanisms. Occasionally, they can define critical areas in the wedges at the intersections of the main joints or at the outermost joints that affect the cliffs.
The results of the numerical modelling were compared and verified with the repeated geomorphological surveys carried out along the cliffs, as well as with the results of the multitemporal photogeological analysis. This comparison outlined that some of the critical areas defined by the modelling have already been affected by failure and landslides and that the landslide mechanisms are consistent with the modelling results.
According to the specific failure mechanisms recognized for the different types of cliffs, resulting from the case studies, it is possible to outline the expected landslides and the mechanism of the recent evolution of the cliffs on soft clastic rocks of the Abruzzo coast. Thus, analyzing the influence of lithology, joints and notches, as well as landslide mechanisms, made it possible to define, within GIS, a map of the distribution of cliff types and the related landslide mechanisms and controlling factors (Figure 18). Active cliffs on sandstone without notches are characterized by translational landslides and fall with a minor control of joints, while active cliffs on conglomerate with notches are mostly affected by rockfall and/or topple with a major control of joints and notches. This connection can be extended to the entire coastal area, and it is possible to associate these types of expected landslides and mechanisms to all the cliffs that belong to these two cliff types.

6. Conclusions

A combination of field (i.e., geologic, structural, and geomorphologic) and remote (LIDAR and photogeologic analyses) investigations with 3D simulation modelling (Flac3D) supported the analysis of four case studies of cliffs on soft clastic rocks of the mid-western Adriatic Sea (Abruzzo, Italy). As they are developed on an uplifted clayey-sandy-arenaceous-conglomeratic marine sequence (Early-Middle Pleistocene) covered by continental deposits (Late Pleistocene-Holocene), they are representative of two types of cliffs [6,7]: (1) cliffs on sandstone without notches (Torre Mucchia and Punta Aderci); and (2) cliffs on conglomerates with notches (Punta Ferruccio and Punta Aderci). This study investigated the kinematics of the cliff failures, the main geomorphological and structural factors controlling these processes, as well as the mechanisms of the expected evolution and retreat. Moreover, it contributed to understanding the factors that are responsible for the high rate changes of the active cliffs on soft clastic rocks.
The analyses confirm that soft lithology and notches, combined with main joints (parallel to or intersecting to form rock wedges on the cliff edge), serve as predisposing factors for gravity-induced processes along the active cliffs, while affecting the kinematics of the landslides (translational landslides, topple and/or rockfalls). These predisposing factors, combined with failure triggering that is mostly induced by meteorological events and coastal erosion cycles at the foot of the cliffs, are responsible for the geomorphological evolution and retreat processes that affect these coastal sectors. Cliffs on conglomerates with notches show a major control of joints and notches and are mainly characterized by rockfalls and/or the collapse of the outer rock wedges of the cliffs along the main joints. The topple of the main bounded wedges are also possible, where major joints are more widely spaced. The rockfalls of the outer wedges can be followed or combined with the topple of the inner wedges. Cliffs on sandstone show a minor control of joints and notches, and the main expected landslides are connected to translational slide failure mechanisms occasionally combined with rockfalls, mostly connected to lithological features.
This approach, extended to the entire coastal cliffs (specifically active cliffs (Figure 18)), becomes a tool for supporting a new landslide hazard assessment of the coastal areas, based on detailed topographic, geological and geomorphological data and numerical modelling.
This integrated study highlighted how a detailed geological and geomorphological field survey and photogeological interpretation, combined with FLAC3D numerical modelling, provides an effective approach in the study of the cliffs, in relation to their recent evolution, the mechanism of landslides, retreat, and the hazard assessment. This approach can be extended to all the coastal areas that have similar lithological, structural and geomorphological features (i.e., coastal cliffs on soft clastic rocks); using different types of calculation codes, the same approach is largely suitable for all of the different types of rock coasts (e.g., hard rock coasts).

Author Contributions

Conceptualization and Methodology, E.M. and T.P.; Investigation, E.M., M.C., F.M, T.P. and V.M; Software, M.C. and V.M.; Supervision E.M.; Writing—Original draft, V.M and M.C.; Writing—Final version, E.M., T.P, M.C. and F.M.

Funding

This research was funded by University “G. d’Annunzio” of Chieti Pescara (Enrico Miccadei fund, Tommaso Piacentini fund and Monia Calista fund).

Acknowledgments

The authors are grateful to the anonymous reviewers and to the academic editors, whose suggestions and comments greatly improved the manuscript and the results of this work. The authors wish to thank the Cartographic Office of Abruzzo Region by means of the Open Geodata Portal (http://opendata.regione.abruzzo.it/), for providing the topographic data, aerial photos and orthophotos used for this work and also the National Geoportal of the Italian Ministry of Environment for providing LIDAR data 2x2m data.

Conflicts of Interest

The authors declare no conflict of interest.

References

  1. Sunamura, T. Geomorphology of Rocky Coasts; John Wiley and Sons: Chichester, UK, 1992; p. 302. [Google Scholar]
  2. Sunamura, T. Rocky coast processes: With special reference to the recession of soft rock cliffs. Proc. Jpn. Acad. Ser. B Phys. Biol. Sci. 2015, 91, 481–500. [Google Scholar] [CrossRef] [PubMed]
  3. Trenhaile, A.S. The Geomorphology of Rock Coasts; Clarendon Press: Oxford, UK, 1987; p. 384. [Google Scholar]
  4. Griggs, G.B.; Trenhaile, A.S. Coastal cliffs and platforms. In Coastal Evolution; Carter, R.W.G., Woodroffe, C.D., Eds.; Cambridge University Press: Cambridge, UK, 1994; pp. 425–450. [Google Scholar]
  5. Sherman, D.J.; Gares, P.A. The geomorphology of coastal environments. Geomorphology 2002, 48, 1–6. [Google Scholar] [CrossRef]
  6. Furlani, S.; Pappalardo, M.; Gómez-Pujol, L.; Chelli, A. The rock coast of theMediterranean and Black seas. Geol. Soc. Lond. Mem. 2014, 40, 89–123. [Google Scholar] [CrossRef]
  7. Miccadei, E.; Mascioli, F.; Ricci, F.; Piacentini, T. Geomorphology of soft clastic rock coasts in the mid-western Adriatic Sea (Abruzzo, Italy). Geomorphology 2019, 324, 82–94. [Google Scholar] [CrossRef]
  8. Davies, D.S.; Axelrod, E.W.; O’Conner, J.S. Erosion of the North Shore of Long Island; Center, State University of New York: Stony Brook, NY, USA, 1972; pp. 1–101. [Google Scholar]
  9. Griggs, G.; Savoy, L. Sea cliff erosion. In Living with the California Coast; Griggs, G., Savoy, L., Eds.; Duke University Press: Durham, NC, USA, 1985; pp. 29–34. [Google Scholar]
  10. Sunamura, T. Rock control in coastal geomorphic processes. Trans. Jpn. Geomorphol. Union 1994, 15, 253–272. [Google Scholar]
  11. D’Alessandro, L.; Genevois, R.; Marino, A. Dinamica recente della costa alta fra Ortona e Vasto (Abruzzo centro-meridionale). Mem. Soc. Geol. Ital. 2001, 56, 53–60. [Google Scholar]
  12. Colantoni, P.; Mencucci, D.; Nesci, O. Coastal processes and cliff recession between Gabicce and Pesaro (northern Adriatic Sea): A case history. Geomorphology 2004, 62, 257–268. [Google Scholar] [CrossRef]
  13. Quinn, J.D.; Philip, L.K.; Murphy, W. Understanding the recession of the Holderness Coast, east Yorkshire, UK: A new presentation of temporal and spatial patterns. Q. J. Eng. Geol. Hydrogeol. 2009, 42, 165–178. [Google Scholar] [CrossRef]
  14. Young, A.P. Decadal-scale coastal cliff retreat in southern and central California. Geomorphology 2018, 300, 164–175. [Google Scholar] [CrossRef]
  15. Prémaillon, M.; Regard, V.; Dewez, T.J.; Auda, Y. GlobR2C2 (Global Recession Rates of Coastal Cliffs): A global relational database to investigate coastal rocky cliff erosion rate variations. Earth Surf. Dyn. 2018, 6, 651–668. [Google Scholar] [CrossRef]
  16. Richards, K.S.; Lorriman, N.R. Basal erosion and mass movement. In Slope Stability; Anderson, M.G., Richards, K.S., Eds.; Wiley: Chichester, UK, 1987; pp. 331–357. [Google Scholar]
  17. Dornbusch, U.; Robinson, D.A.; Moses, C.A.; Williams, R.B.G. Temporal and spatial variations of chalk cliff retreat in East Sussex, 1873 to 2001. Mar. Geol. 2008, 249, 271–282. [Google Scholar] [CrossRef]
  18. Brooks, S.M.; Spencer, T. Temporal and spatial variations in recession rates and sediment release from soft rock cliffs, Suffolk coast, UK. Geomorphology 2010, 124, 26–41. [Google Scholar] [CrossRef] [Green Version]
  19. Itasca, F.L. Fast Lagrangian Analysis of Continua in 3-Dimension (FLAC3D V 5.01); Itasca Consulting Group: Minneapolis, MN, USA, 2012. [Google Scholar]
  20. Calista, M.; Miccadei, E.; Piacentini, T.; Sciarra, N. Morphostructural, Meteorological and Seismic Factors Controlling Landslides in Weak Rocks: The Case Studies of Castelnuovo and Ponzano (North East Abruzzo, Central Italy). Geosciences 2019, 9, 122. [Google Scholar] [CrossRef]
  21. Marchetti, D.; D’Amato Avanzi, G.; Pochini, A.; Puccinelli, A.; Sciarra, N.; Calista, M. Geomechanical characterization and 3d numerical modelling of complex rock masses: A study case in Italy. In Proceedings of the ISRM International Symposium on Rock Mechanics-SINOROCK 2009-“Rock Characterization, Modelling and Engineering Design Methods, International Society for Rock Mechanics and Rock Engineering, Hong Kong, China, 19–22 May 2009; pp. 216–220. [Google Scholar]
  22. Aringoli, D.; Calista, M.; Gentili, B.; Pambianchi, G.; Sciarra, N. Geomorphological features and 3d modelling of Montelparo mass movement (Central Italy). Eng. Geol. 2008, 99, 70–84. [Google Scholar] [CrossRef]
  23. Miccadei, E.; Piacentini, T.; Buccolini, M. Long-term geomorphological evolution in the Abruzzo area (Central Apennines, Italy): Twenty years of research. Geol. Carpathica 2017, 68, 19–28. [Google Scholar] [CrossRef]
  24. Cantalamessa, G.; Di Celma, C. Sequence Response to Syndepositional Regional Uplift: Insights from High-Resolution Sequence Stratigraphy of Late Early Pleistocene Strata, Periadriatic Basin, Central Italy. Sediment. Sediment. Geol. 2004, 164, 283–309. [Google Scholar] [CrossRef]
  25. Ori, G.G.; Roveri, M.; Vannoni, F. Plio—Pleistocene sedimentation in the Apenninic foredeep (Central Adriatic Sea, Italy). In Foreland Basins; Allen, P.A., Homewood, P., Eds.; IAS Special Publication 8 Blackwell: Oxford, UK, 1986; pp. 183–198. [Google Scholar]
  26. Bigi, S.; Conti, A.; Casero, P.; Ruggiero, L.; Recanati, R.; Lipparini, L. Geological model of the central Periadriatic basin (Apennines, Italy). Mar. Pet. Geol. 2013, 42, 107–121. [Google Scholar] [CrossRef]
  27. Miccadei, E.; Mascioli, F.; Piacentini, T. Quaternary geomorphological evolution of the Tremiti Islands (Puglia, Italy). Quat. Int. 2011, 232, 3–15. [Google Scholar] [CrossRef]
  28. Calista, M.; Miccadei, E.; Pasculli, A.; Piacentini, T.; Sciarra, M.; Sciarra, N. Geomorphological features of the Montebello sul Sangro large landslide (Abruzzo, Central Italy). J. Maps 2016, 12, 882–891. [Google Scholar] [CrossRef]
  29. D’Alessandro, L.; Miccadei, E.; Piacentini, T. Morphostructural elements of central-eastern Abruzzi: Contributions to the study of the role of tectonics on the morphogenesis of the Apennine chain. Quat. Int. 2003, 101, 115–124. [Google Scholar] [CrossRef]
  30. Demangeot, J. Geomorphologie des Abruzzes Adriatiques; Memoires et Documentes; Centre de Reserches et Documentation Cartografiques et Geographiques: The Hague, The Netherlands, 1965; p. 403. [Google Scholar]
  31. Dramis, F. Il ruolo dei sollevamenti tettonici a largo raggio nella genesi del rilievo appenninico. Studi Geol. Camerti 1993, 1992/1, 9–15. [Google Scholar]
  32. Ascione, A.; Cinque, A.; Miccadei, E.; Villani, F.; Berti, C. The Plio-Quaternary uplift of the Apennine chain: New data from the analysis of topography and river valleys in Central Italy. Geomorphology 2008, 102, 105–118. [Google Scholar] [CrossRef]
  33. D’Alessandro, L.; Miccadei, E.; Piacentini, T. Morphotectonic study of the lower Sangro River valley (Abruzzi, Central Italy). Geomorphology 2008, 102, 145–158. [Google Scholar] [CrossRef]
  34. Buccolini, M.; Gentili, B.; Materazzi, M.; Piacentini, T. Late Quaternary geomorphological evolution and erosion rates in the clayey peri-Adriatic belt (central Italy). Geomorphology 2010, 116, 145–161. [Google Scholar] [CrossRef]
  35. Piacentini, T.; Miccadei, E. The role of drainage systems and intermontane basins in the Quaternary landscape of the Central Apennines chain (Italy). Rend. Lincei Sci. Fis. Nat. 2014, 25, 139–150. [Google Scholar] [CrossRef]
  36. Parlagreco, L.; Mascioli, F.; Miccadei, E.; Antonioli, F.; Gianolla, D.; Devoti, S.; Leoni, G. New data on Holocene Relative Sea Level along the Abruzzo coast (central Adriatic, Italy). Quat. Int. 2011, 232, 179–186. [Google Scholar] [CrossRef]
  37. Antonioli, F. Sea level change in Western-Central Mediterranean since 300 Kyr: Comparing global sea level curves with observed data. Alp. Mediterr. Quat. 2012, 25, 15–23. [Google Scholar]
  38. The Ecoregions of Italy, Ministry of the Environment, Land and Sea Protection, Nature Protection Directorate. 2010. Available online: https://www.minambiente.it/sites/default/files/archivio/biblioteca/protezione_natura/ecoregioni_italia_eng.pdf (accessed on 25 May 2019).
  39. Piacentini, T.; Galli, A.; Marsala, V.; Miccadei, E. Analysis of soil erosion induced by heavy rainfall: A case study from the NE Abruzzo hills area in Central Italy. Water 2018, 10, 1314. [Google Scholar] [CrossRef]
  40. Region Abruzzo Hydrographic Service. 2011. Available online: https://www.regione.abruzzo.it/content/idrografico-mareografico (accessed on 15 September 2018).
  41. GNRAC (Gruppo Nazionale pel la Ricerca sull’Ambiente Costiero). Lo stato dei litorali italiani. Studi Costieri. 2006, 10, 3–113. [Google Scholar]
  42. ISPRA. RON, Rete Ondametrica Nazionale. ISPRA, Dipartimento Difesa del Suolo, Servizio Geologico d’Italia. 2018. Available online: http://www.mareografico.it (accessed on 10 May 2018).
  43. Chiocchini, U.; Barbieri, M.; Madonna, S.; Di Stefano, A.P.M. I depositi del Pleistocene tra Ortona e la stazione ferroviaria di Casalbordino (provincia di Chieti). Soc. Geol. Ital. 2006, 2, 3–14. [Google Scholar]
  44. ISPRA. Carta Geologica d’Italia, alla scala 1:50.000—Foglio 351 “Pescara”; ISPRA, Dipartimento Difesa del Suolo, Servizio Geologico d’Italia: Rome, Italy, 2012. [Google Scholar]
  45. ISPRA. Carta Geologica d’Italia, alla scala 1:50.000—Foglio 361 “Chieti”; ISPRA, Dipartimento Difesa del Suolo, Servizio Geologico d’Italia: Rome, Italy, 2012. [Google Scholar]
  46. ISPRA. Carta Geologica d’Italia, alla scala 1:50.000—Foglio 372 “Vasto”; ISPRA, Dipartimento Difesa del Suolo, Servizio Geologico d’Italia: Rome, Italy, 2012. [Google Scholar]
  47. Di Celma, C.; Ragaini, L.; Caffau, M. Marine and nonmarine deposition in a longterm low-accommodation setting: An example from the middle Pleistocene Qm2 unit, eastern central Italy. Mar. Pet. Geol. 2016, 72, 234–253. [Google Scholar] [CrossRef]
  48. C.N.R. (Consiglio Nazionale delle Ricerche). Neotectonic Map of Italy—Carta Neotettonica d’Italia. Progetto Finalizzato Geodinamica (Consiglio Nazionale delle Ricerche). Quad. Ric. Sci. 1983, 114. [Google Scholar]
  49. Miccadei, E.; Piacentini, T.; Dal Pozzo, A.; La Corte, M.; Sciarra, M. Morphotectonic map of the Aventino-Lower Sangro valley (Abruzzo, Italy), scale 1:50,000. J. Maps 2013, 9, 390–409. [Google Scholar] [CrossRef] [Green Version]
  50. Miccadei, E.; Piacentini, T.; Gerbasi, F.; Daverio, F. Morphotectonic map of the Osento River basin (Abruzzo, Italy), scale 1:30,000. J. Maps 2012, 8, 62–73. [Google Scholar] [CrossRef]
  51. Miccadei, E.; Mascioli, F.; Piacentini, T.; Ricci, F. Geomorphological features of coastal dunes along the central Adriatic coast (Abruzzo, Italy). J. Coast. Res. 2011, 277, 1122–1136. [Google Scholar] [CrossRef]
  52. National Geoportal of the Italian Ministry of Environment. 2011. Available online: http://www.pcn.minambiente.it/ (accessed on 10 September 2018).
  53. Calista, M.; Di Giandomenico, B.; Mangifesta, M. Modellazione numerica finalizzata allo studio del comportamento meccanico delle terre: Applicazioni 3D per l’analisi della stabilità dell’area orientale dell’Abitato di Ortona (CH). G. Geol. Appl. 2007, 6, 81–91. [Google Scholar]
  54. Microzonazione Sismica Regione Abruzzo, Dipartimento di Protezione Civile, Comune di Ortona. 2016. Available online: http://hosting.soluzionipa.it/ortona/trasparenza/pagina.php?id=108 (accessed on 15 October 2018).
  55. Microzonazione Sismica Regione Abruzzo, Dipartimento di Protezione Civile, Comune di Vasto. Available online: http://www.comune.vasto.ch.it/index.php/strumenti-urbanistici (accessed on 15 October 2018).
  56. Chelli, A.; Aringoli, D.; Aucelli, P.; Baldassarre, M.A.; Bellotti, P.; Bini, M.; Biolchi, S.; Bontempi, S.; Brandolini, P.; Davoli, L.; et al. Coastal morphodynamics AIGeo-WG: The new geomorphological legend of the Italian coast. In Proceedings of the 88° Congresso della Società Geologica Italiana, Napoli, Italy, 7–9 September 2016. [Google Scholar]
  57. Miccadei, E.; Orrù, P.; Piacentini, T.; Mascioli, F.; Puliga, G. Geomorphological map of Tremiti Islands Archipelago (Puglia, Southern Adriatic Sea, Italy), scale 1:15.000. J. Maps 2012, 8, 74–87. [Google Scholar] [CrossRef]
  58. Microzonazione Sismica Regione Abruzzo, Dipartimento di Protezione Civile, Comune di Chieti. 2014. Available online: http://ww2.gazzettaamministrativa.it/opencms/export/sites/default/_gazzetta_amministrativa/amministrazione_trasparente/_abruzzo/_chieti/190_pia_gov_ter/2016/2016_Documenti_1462183255712/1462183258625_relazione_illustrativa.pdf (accessed on 15 October 2018).
  59. Naylor, D.J. Finite elements and slope stability. In Numerical Methods in Geomechanics; Martins, J.B., Ed.; D. Reidel Publishing Company: Dordrecht, The Netherlands, 1982; pp. 229–244. [Google Scholar]
  60. Zienkiewicz, O.C.; Humpheson, C.; Lewis, R.W. Associated and non-associated viscoplasticity and plasticity in soil mechanics. Géotechnique 1975, 25, 671–689. [Google Scholar] [CrossRef]
Figure 1. (a) The main physiographic domains of the Abruzzo region (according to the morphotectonic landscape classification, D’Alessandro et al. 2003 [29]). The black polygon indicates the study area. (b) The lithological scheme of the study area and location of the cliff sites (modified from Miccadei et al. 2019 [7]).
Geosciences 09 00309 g001
Figure 2. (a) Location of the studied areas; (b) schematic geomorphological map of the Ortona coastal sector; (c) schematic geomorphological map of the Vasto coastal sector (modified from Miccadei et al. [7]). Legend: TM: Torre Mucchia cliff; PF: Punta Ferruccio cliff; PL: Punta Lunga cliff; PA: Punta Aderci cliff.
Geosciences 09 00309 g002
Figure 3. Methodological workflow for the reconstruction of the geological–geomorphological 3D models. (a) topographic map; (b) CNR atlas of beaches; (c) geomorphological map; (d) 3D real model; (e) 3D simplified model. Legend: 1. Colluvial, eluvial deposits; 2. Beach deposits; 3. Conglomerate with sandstone lenses; 4. Joint; 5. Active cliff; 6. Inactive cliff; 7. Notch; 8. Sea cave; 9. Landslide and slope deposits; 10. U-shaped valley; 11. Geomechanical station; 12. Geomechanical analysis (blue line = coastline; black line = main joints); 13. Sea; and 14. Section.
Geosciences 09 00309 g003
Figure 4. (a) Geological–geomorphological section and (b) interpolated-simplified section for the numerical modelling. Legend: 1. Colluvial, eluvial deposits; 2. Conglomerate; 3. Sandstone; 4. Joint (discontinuous line = probable prosecution); 4. Active cliff; 5. Sea cave; 6. U-shaped valley; 7. Sea; and 8. FLAC3D mesh.
Geosciences 09 00309 g004
Figure 5. (a) Discretization mesh used for the numerical modelling; and (b) detail of the grid next to a notch. The red lines indicate the main joints.
Geosciences 09 00309 g005
Figure 6. Workflow for the numerical modelling steps.
Geosciences 09 00309 g006
Figure 7. The landscape and topographic profile of: (a) Torre Mucchia; (b) Punta Lunga; (c) Punta Ferruccio; and (d) Punta Aderci.
Geosciences 09 00309 g007
Figure 8. (a) The geological and geomorphological features of Torre Mucchia; (b) the simplified model for the numerical modelling (removing superficial deposits < 3 m in thickness). Legend: 1. Colluvial, eluvial deposits; 2. Conglomerate; 3. Cemented sandstone; 4. Consistent sand; 5. Clay; 6. Joint; 7. Active cliff; 8. Inactive cliff; 9. Notch; 10. Sea cave; 11. Dormant landslide scarp; 12. Active landslide scarp; 13. Landslide; 14. Landslide and slope deposits; 15. U-shaped valley; 16. Geomechanical station; 17. Sea; and 18. Geomechanical analysis stereonet diagrams (blue line = cliff; black line = main joints).
Geosciences 09 00309 g008
Figure 9. (a) Displacement contours and vectors of the Torre Mucchia cliff; (b) the A-A’ section; and (c) the B-B’ section.
Geosciences 09 00309 g009
Figure 10. (a) The geological and geomorphological model of the Punta Lunga cliff; and (b) the simplified model for the numerical modelling (removing superficial deposits < 3m in thickness). Legend: 1. Colluvial, eluvial deposits; 2. Conglomerate; 3. Cemented sandstone; 4. Consistent sand; 5. Clay; 6. Joint; 7. Active cliff; 8. Inactive cliff; 9. Notch; 10. Sea cave; 11. Dormant landslide scarp; 12. Active landslide scarp; 13. Landslide; 14. Landslide and slope deposits; 15. U-shaped valley; 16. Geomechanical station; 17. Sea; and 18. Geomechanical analysis stereonet diagrams (blue line = cliff; black line = main joints).
Geosciences 09 00309 g010
Figure 11. (a) The displacement contours and vectors of the Punta Lunga cliff; (b) the A-A’ section; and (c) the B-B’ section.
Geosciences 09 00309 g011
Figure 12. (a) The geological and geomorphological model of the Punta Ferruccio cliff; and (b) the simplified model for the numerical modelling (removing superficial deposits < 3 m in thickness). Legend: 1. Colluvial, eluvial deposits; 2. Conglomerate; 3. Cemented sandstone; 4. Consistent sand; 5. Clay; 6. Joint; 7. Active cliff; 8. Inactive cliff; 9. Notch; 10. Sea cave; 11. Dormant landslide scarp; 12. Active landslide scarp; 13. Landslide; 14. Landslide and slope deposits; 15. U-shaped valley; 16. Geomechanical station; 17. Sea; and 18. Geomechanical analysis stereonet diagrams (blue line = cliff; black line = main joints).
Geosciences 09 00309 g012
Figure 13. (a) The displacement contours and vectors of the Punta Ferruccio cliff; (b) the A-A’ section; and (c) the B-B’ section.
Geosciences 09 00309 g013
Figure 14. The Punta Ferruccio cliff. Aerial images from (a) 2004, (b) 2006, and (c) 2014 (source Google Earth); cliff image and geomorphological sections from (d) 2004, (e) 2005, and (f) 2014 outlining the rockfall that occurred in 2004–2005 (L1) and the topple that occurred in 2014 (L2), controlled by the main joints and notch. Legend: 1. Gravel, 2. Sand, 3. Landslide deposits, 4. Conglomerate, 5. Sandy clay, 6. Sandstone, 7. Clay, 8. Sand, 9. Main joint, and 10. Landslide scarp. L1, 2004–2005 rockfall; and L2, 2014 topple.
Geosciences 09 00309 g014
Figure 15. (a) The geological and geomorphological features of the Punta Aderci cliff; and (b) the simplified model for the numerical modelling (removing superficial deposits < 3 m in thickness). Legend: 1. Colluvial, eluvial deposits; 2. Conglomerate; 3. Cemented sandstone; 4. Consistent sand; 5. Clay; 6. Joint; 7. Active cliff; 8. Inactive cliff; 9. Notch; 10. Sea cave; 11. Dormant landslide scarp; 12. Active landslide scarp; 13. Landslide; 14. Landslide and slope deposits; 15. U-shaped valley; 16. Geomechanical station; 17. Sea; and 18. Geomechanical analysis stereonet diagrams (blue line = cliff; black line = main joints).
Geosciences 09 00309 g015
Figure 16. (a) The displacement contours and vectors of the pre-landslide model of the Punta Aderci cliff; and (b) the A-A’ section.
Geosciences 09 00309 g016
Figure 17. (a) The displacement contours and vectors of the pre-landslide model of the Punta Lunga cliff; (b) the A-A’ section; and (c) the B-B’ section.
Geosciences 09 00309 g017
Figure 18. (a) The planimetric distribution of the cliff types and coastal slopes in the studied coastal area (modified from Miccadei et al. [7]); (b) the distribution of the cliff types and landslide mechanisms in the Ortona area; and (c) the distribution of the cliff types and landslide mechanisms on the Vasto area. Legend—Cliffs: 1. active cliff; 2. inactive cliff; 3. paleo cliff; 4. coastal slope; landslide mechanism: 5. roto-translational slide; 6. translational slide and topple-fall controlled by joints; 7. translational slide; and 8. topple and rockfall controlled by joints. A. active cliff on continental deposits; D. active cliff on sandstone with notch; E. active cliff on sandstone without notch; F. inactive cliff on sandstone and conglomerate; G. paleocliff on sandstone and conglomerate; H. coastal slope on clay-sandstone-conglomerate; TM. Torre Mucchia; PF. Punta Ferruccio; PL. Punta Lunga; PAB. Punta dell’Acquabella; and PA. Punta Aderci.
Geosciences 09 00309 g018
Table 1. Physical mechanical parameters of the lithotypes. Legend: γ volume weight (kg/m3); φ’ internal friction angle (°); c’ apparent cohesion (Pa); K bulk modulus (Pa); G shear modulus (Pa); and Ϭtmax tension strength (c’/ tan φ’) (Pa).
LithotypeConglomerateSandstoneSandClay
γ (kg/m3)2100210020802050
φ’ (°)45383424
K (Pa)2.00 × 1084.94 × 1075.56 × 1061.60 × 107
G (Pa)1.20 × 1083.25 × 1071.85 × 1069.60 × 106
c’ (Pa)3.80 × 1052.00 × 1051.67 × 1043.68 × 104
Ϭtmax (Pa)3.80 × 1052.56 × 1052.48 × 1048.27 × 104
jkn = jks (Pa/m)1.20 × 1083.09 × 1072.67 × 106
jc’ (Pa)1.00 × 1041.00 × 1041.00 × 104
Jφ’ (°)303030
Table 2. The lithological, structural and geomorphological features of the four surveyed cliffs (locations in Figure 1) (modified from Miccadei et al. [7]). Features: Hc: cliff height; Hs: coastal slope height; Sty: slope type; Lf: lithotypes at the cliff foot; Le: lithotypes at the cliff upper edge; G: structural strata setting; Fr: joint orientation; L: landforms; SP: shore platform, following Sunamura’s classification [1]; N: notch; and R: average retreat rate.
FeatureTorre Mucchia (TM)Punta Lunga (PL)Punta Ferruccio (PF)Punta Aderci (PA)
Morphological Features
Hc> 25 m< 25 m> 25 m> 25m
Hs60 m60 m60 m---
StyVerticalVerticalVertical and Vertical + concave convexUndulated concave–convex Vertical
Lithological Features
LfSandSilty sandsConglomerate
Silty sands
Conglomerate
LeSandstoneSilty sandsConglomerateConglomerate
Structural features
GSub-horizontalSub-horizontalSub-horizontalSub-horizontal
FrN60°E, 75° NW
N90°E, 75°N
N40°W, 80°NE
N50°W, 50°NE
N10°E, 80°ESE
N60°E, 90°
N70°W, 70° NNE
N20°W, 90°
N20°E, 80°WNW
N60°E, 80°NW
N90°E, 90°
N60°W, 85°SW
N60°W, 85°NE
N20°W, 80°ENE
N60°W, 90°
N50°W, 80°NE
N20°W, 90°
Geomorphological features
LRockfalls, translational sliding, wave erosionRockfalls, translational sliding, wave erosionRockfalls, translational sliding, wave erosion, notchRockfalls, rainwash, notch, shore platform
SP---- --Horizontal
N----On silty sandOn conglomerate
R0.63 m/yr0.76 m/yr0.85 m/yr0.15 m/yr

