A Multidisciplinary Approach to the Study of the Temple of Athena in Poseidonia-Paestum (Southern Italy): New Geomorphological, Geophysical and Archaeological Data

 , ,
, ,
Abstract
:1. Introduction
2. Previous Knowledge
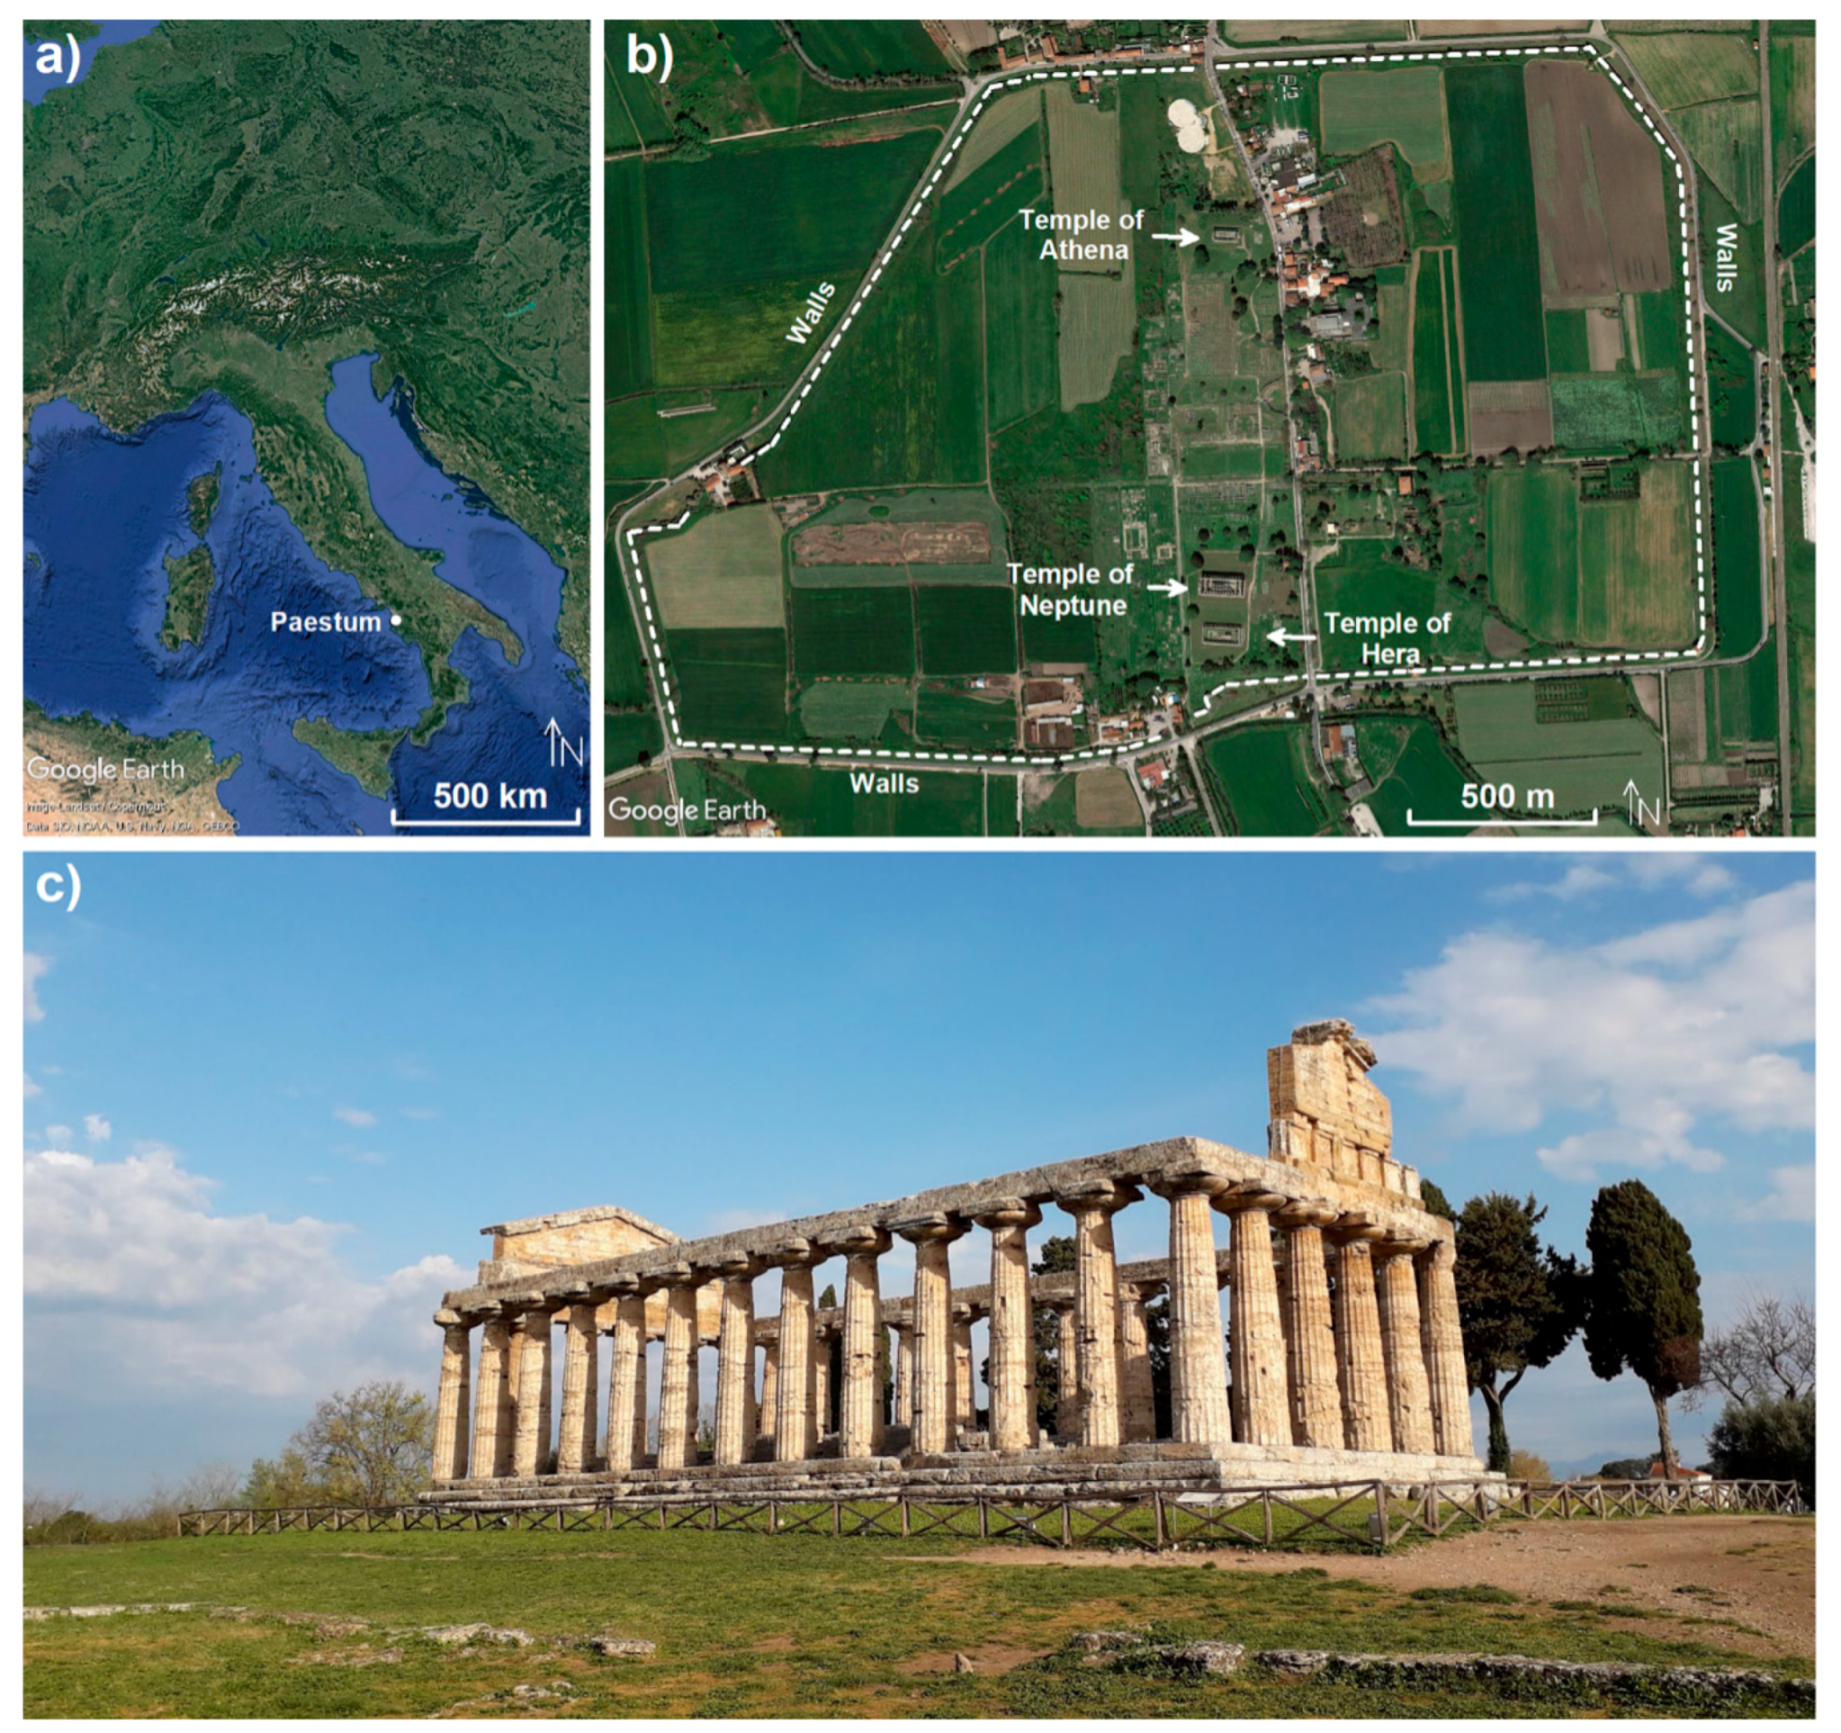
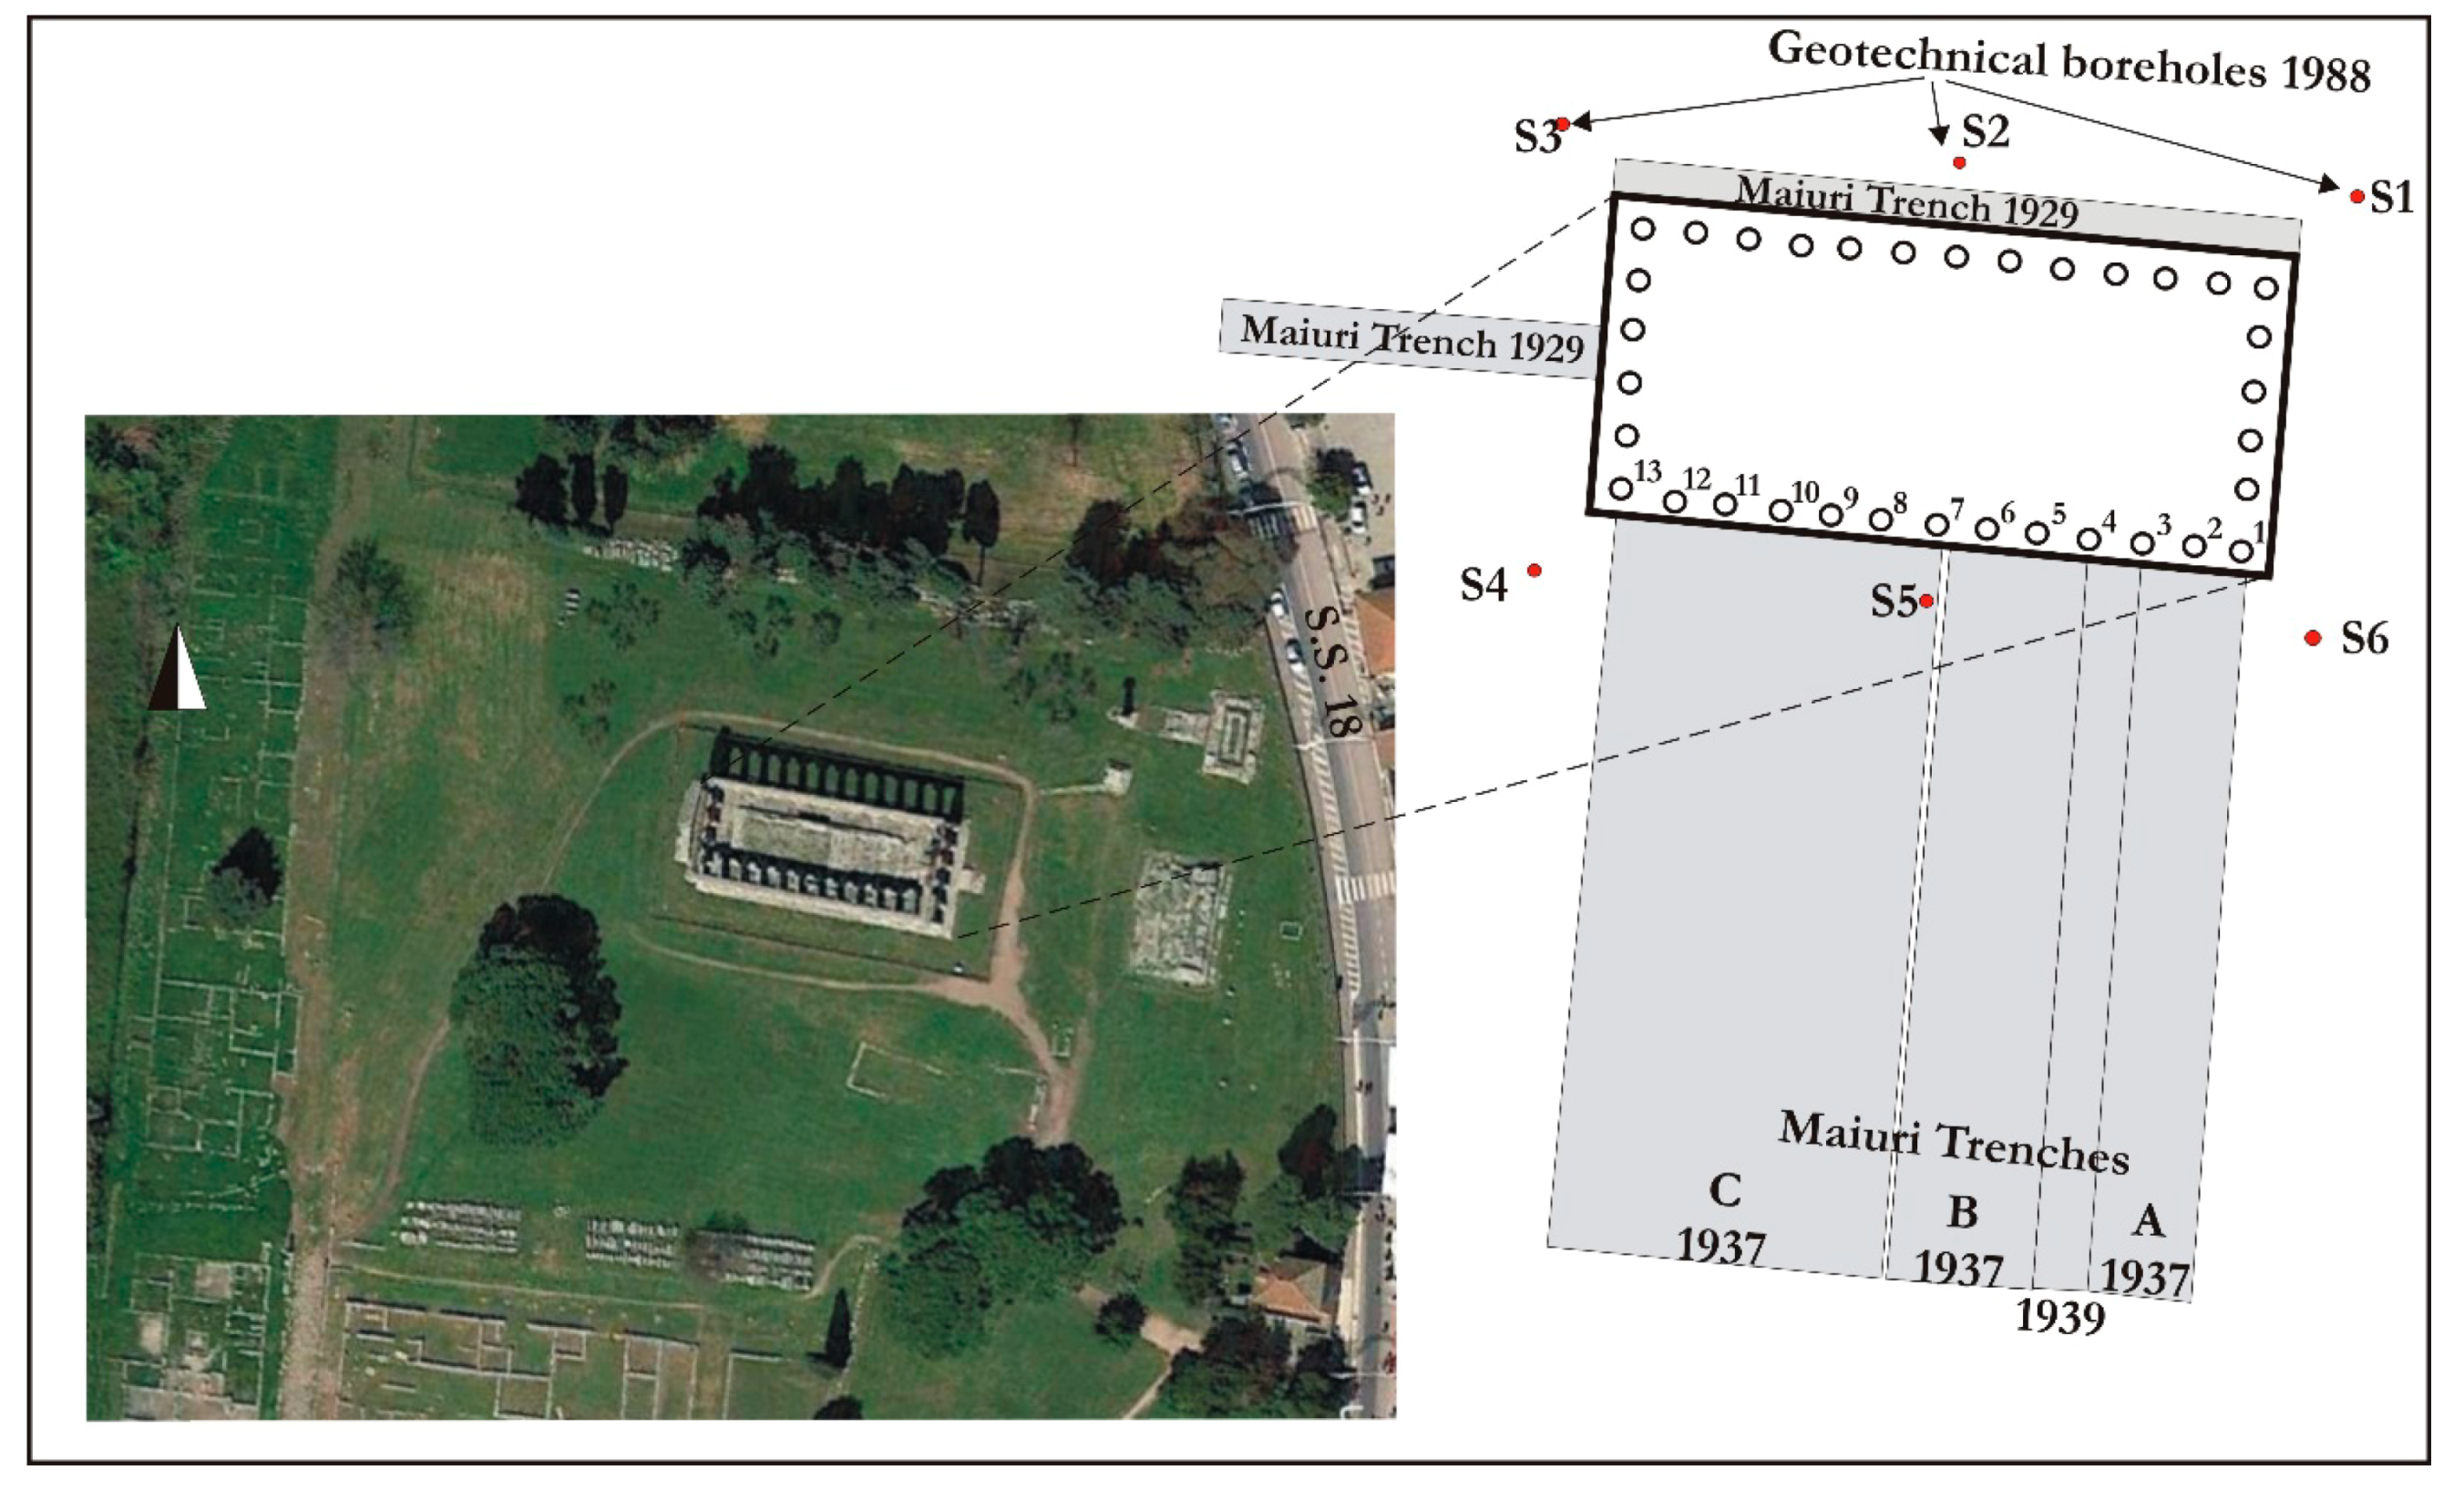
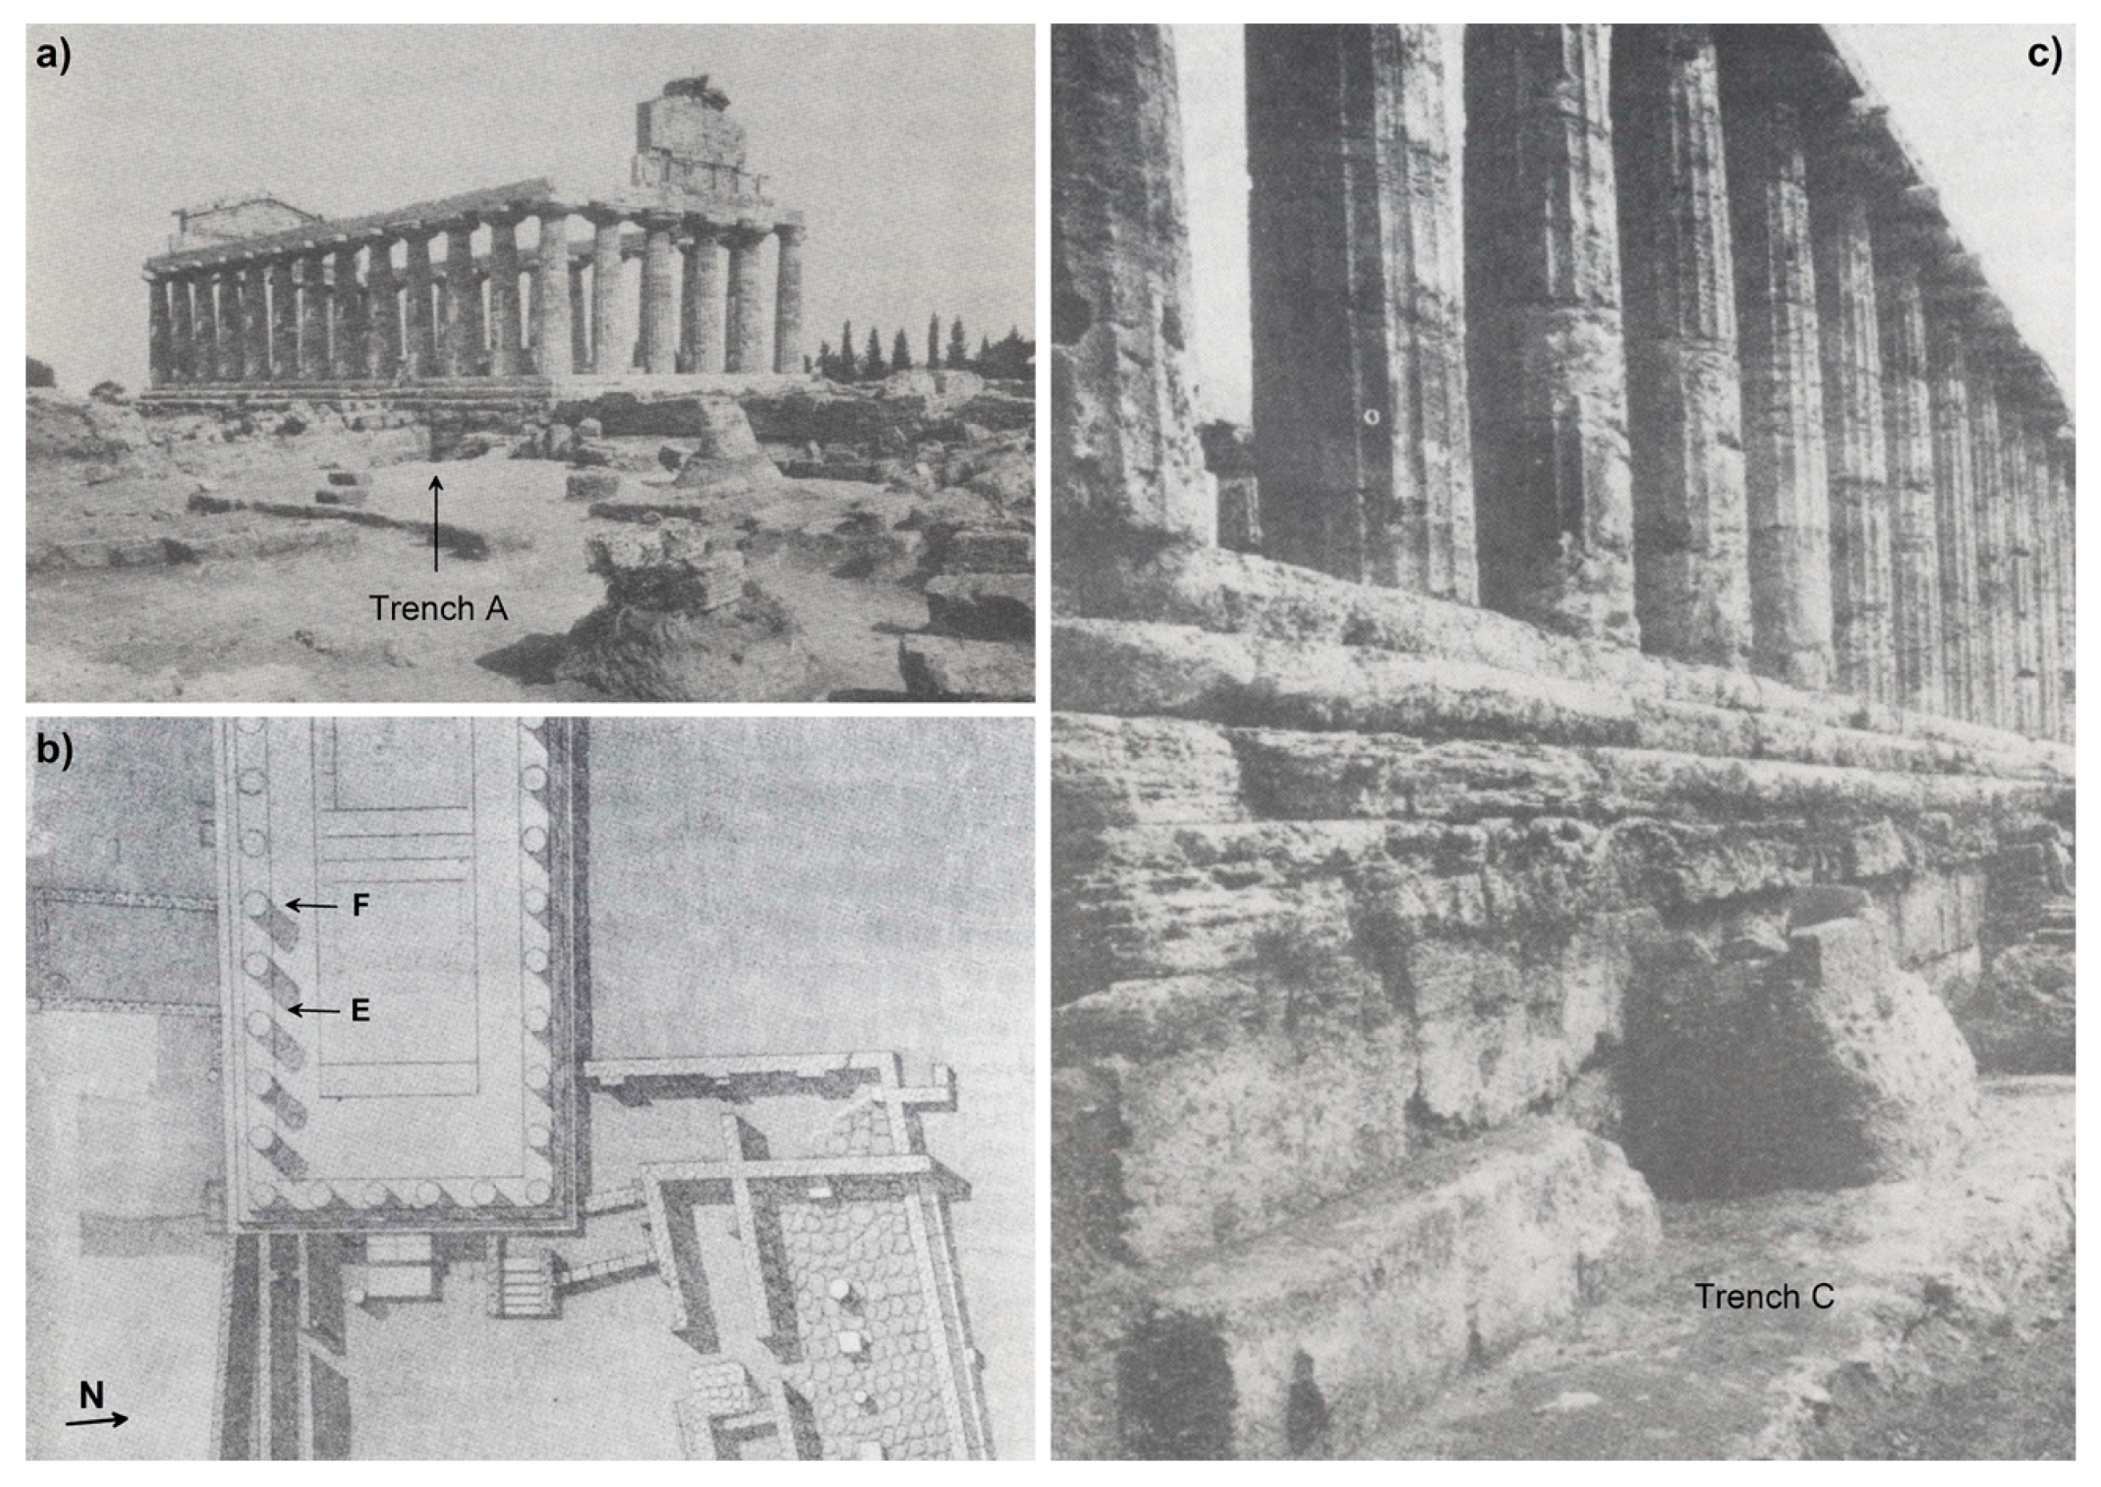
2.1. Historical and Archaeological Background
2.2. Geological and Geomorphological Context
3. Material and Methods
3.1. Geomorphological Approach
3.2. Geophysical Approach
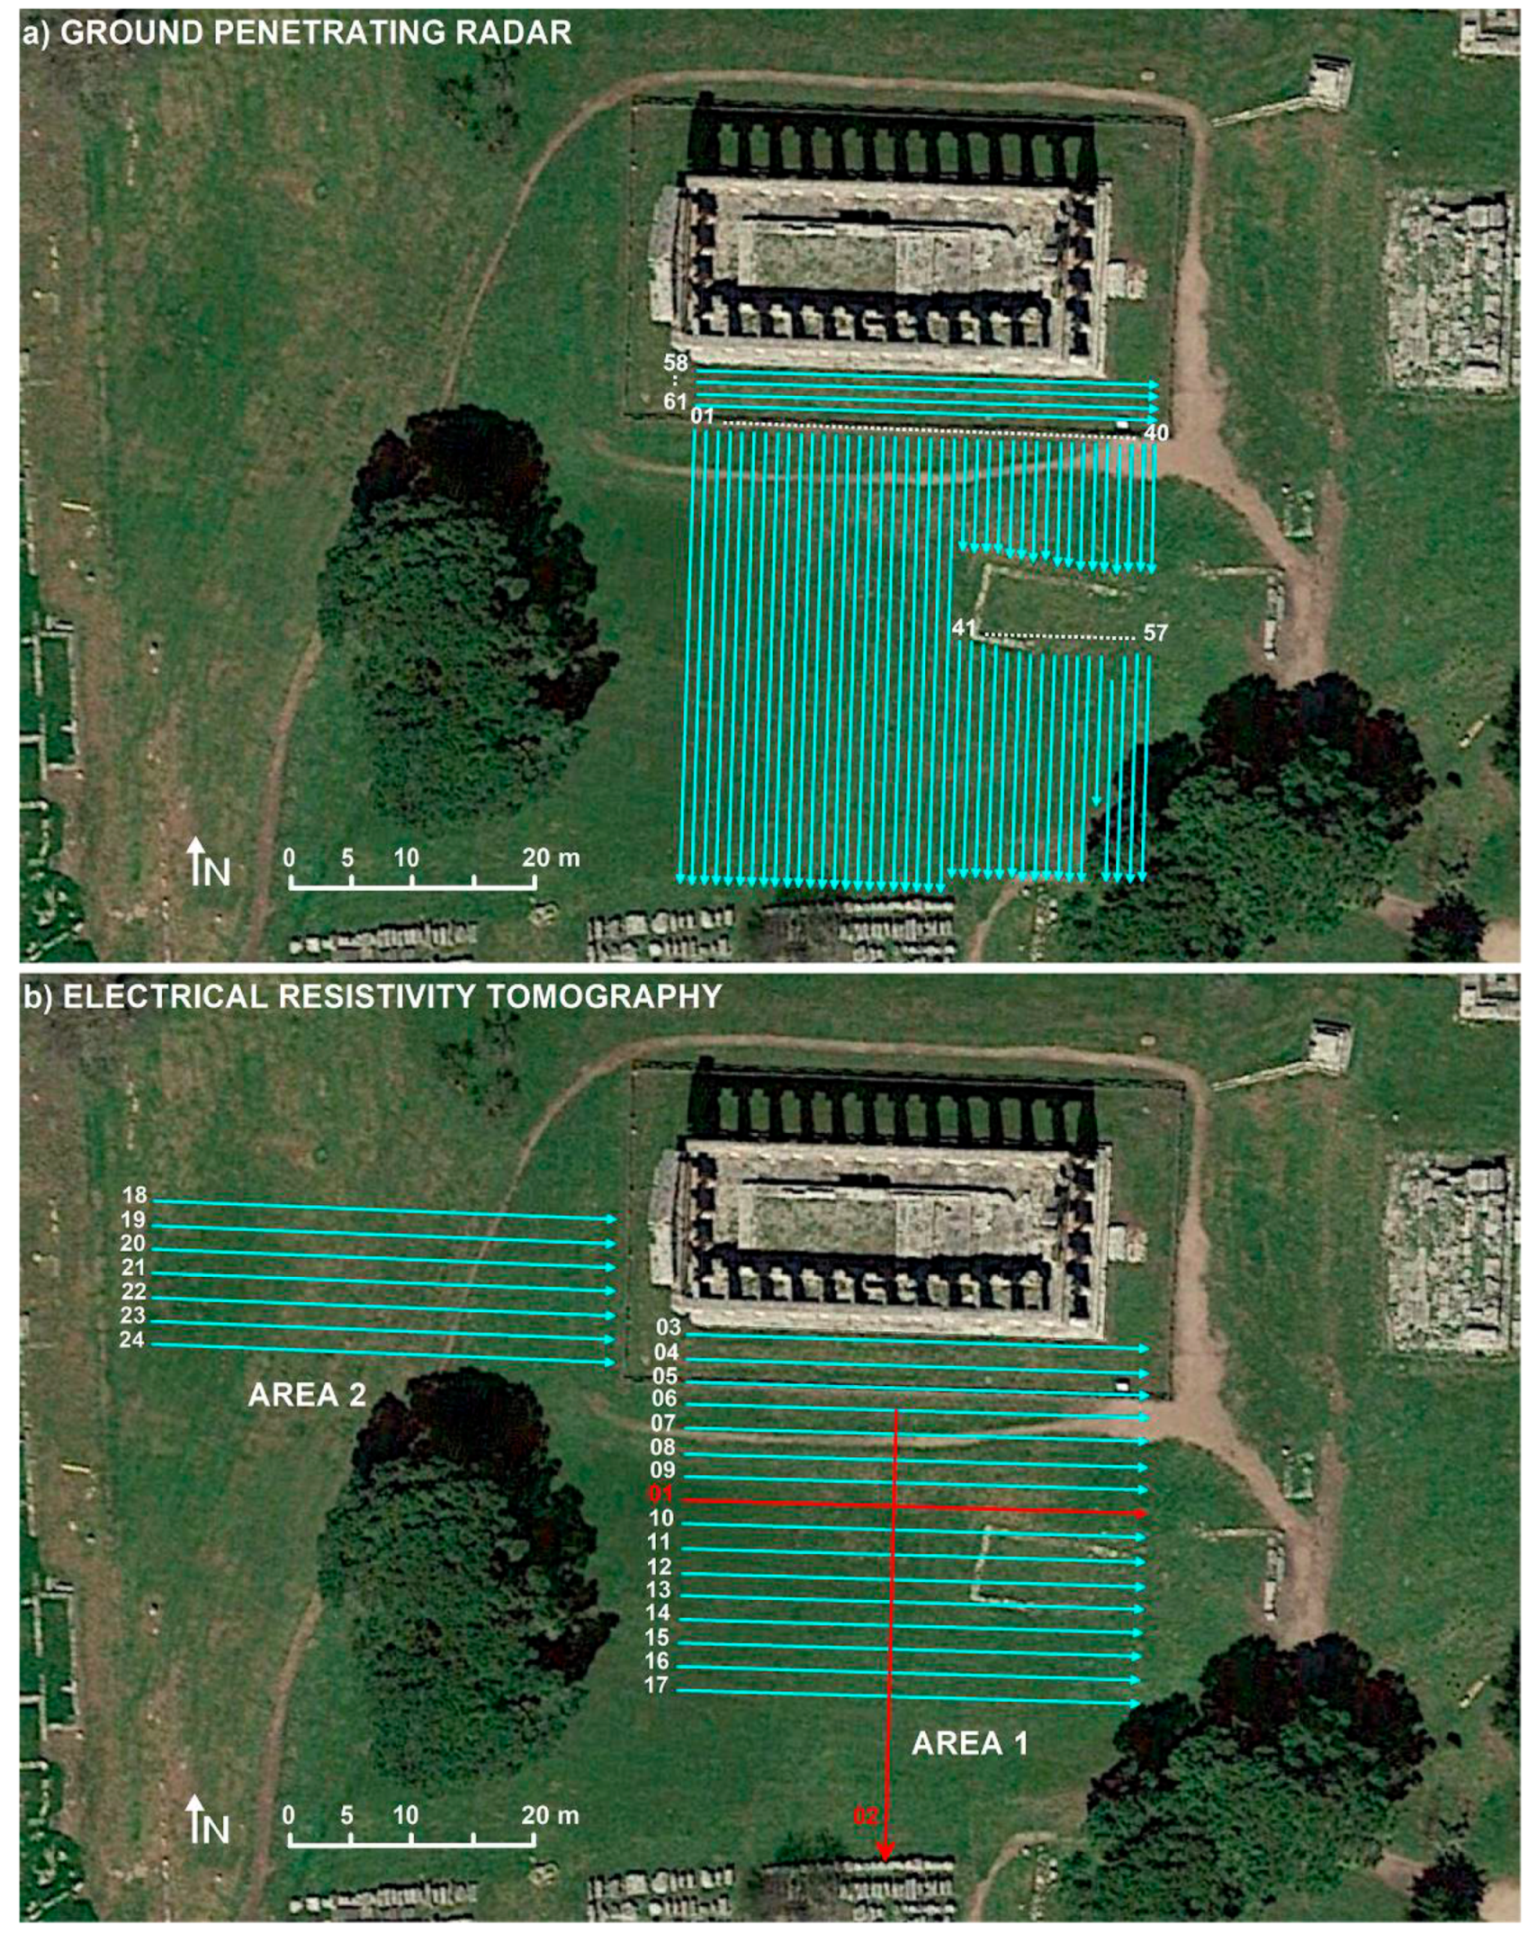
3.2.1. Ground Penetrating Radar (GPR)
3.2.2. Electrical Resistivity Tomography (ERT)
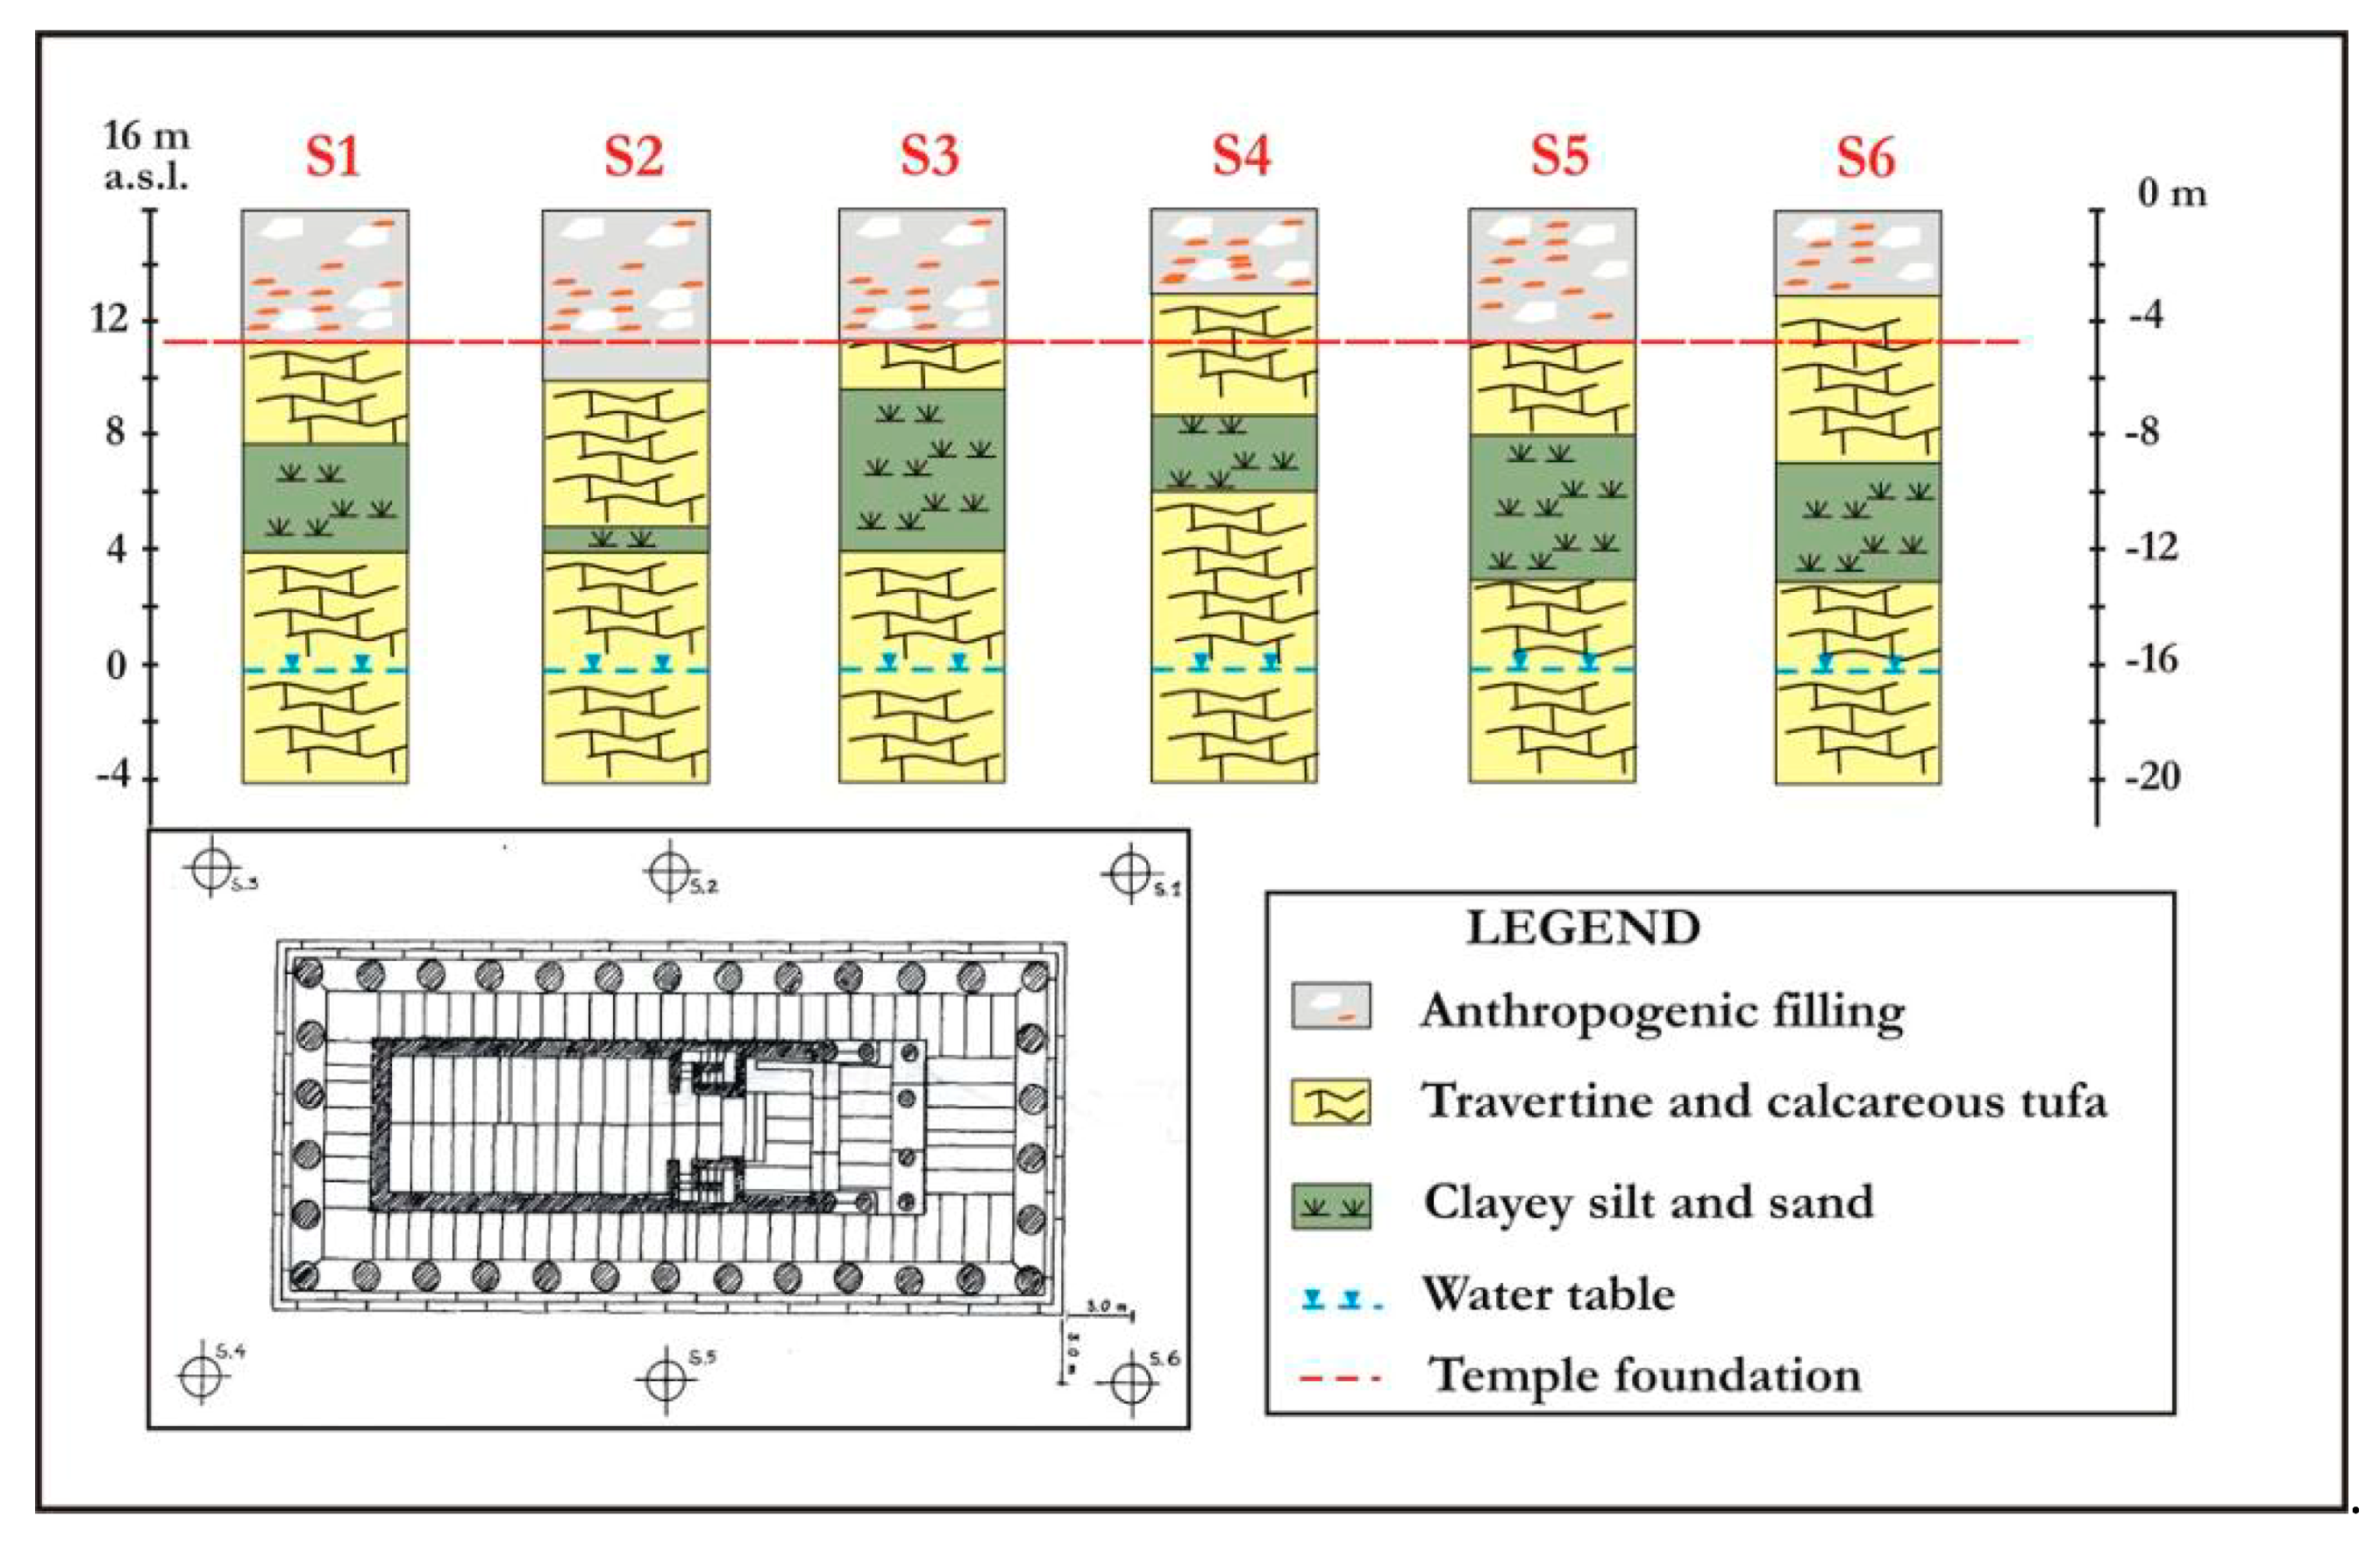
3.3. Archaeo-Stratigraphical Surveys
4. Results and Discussion
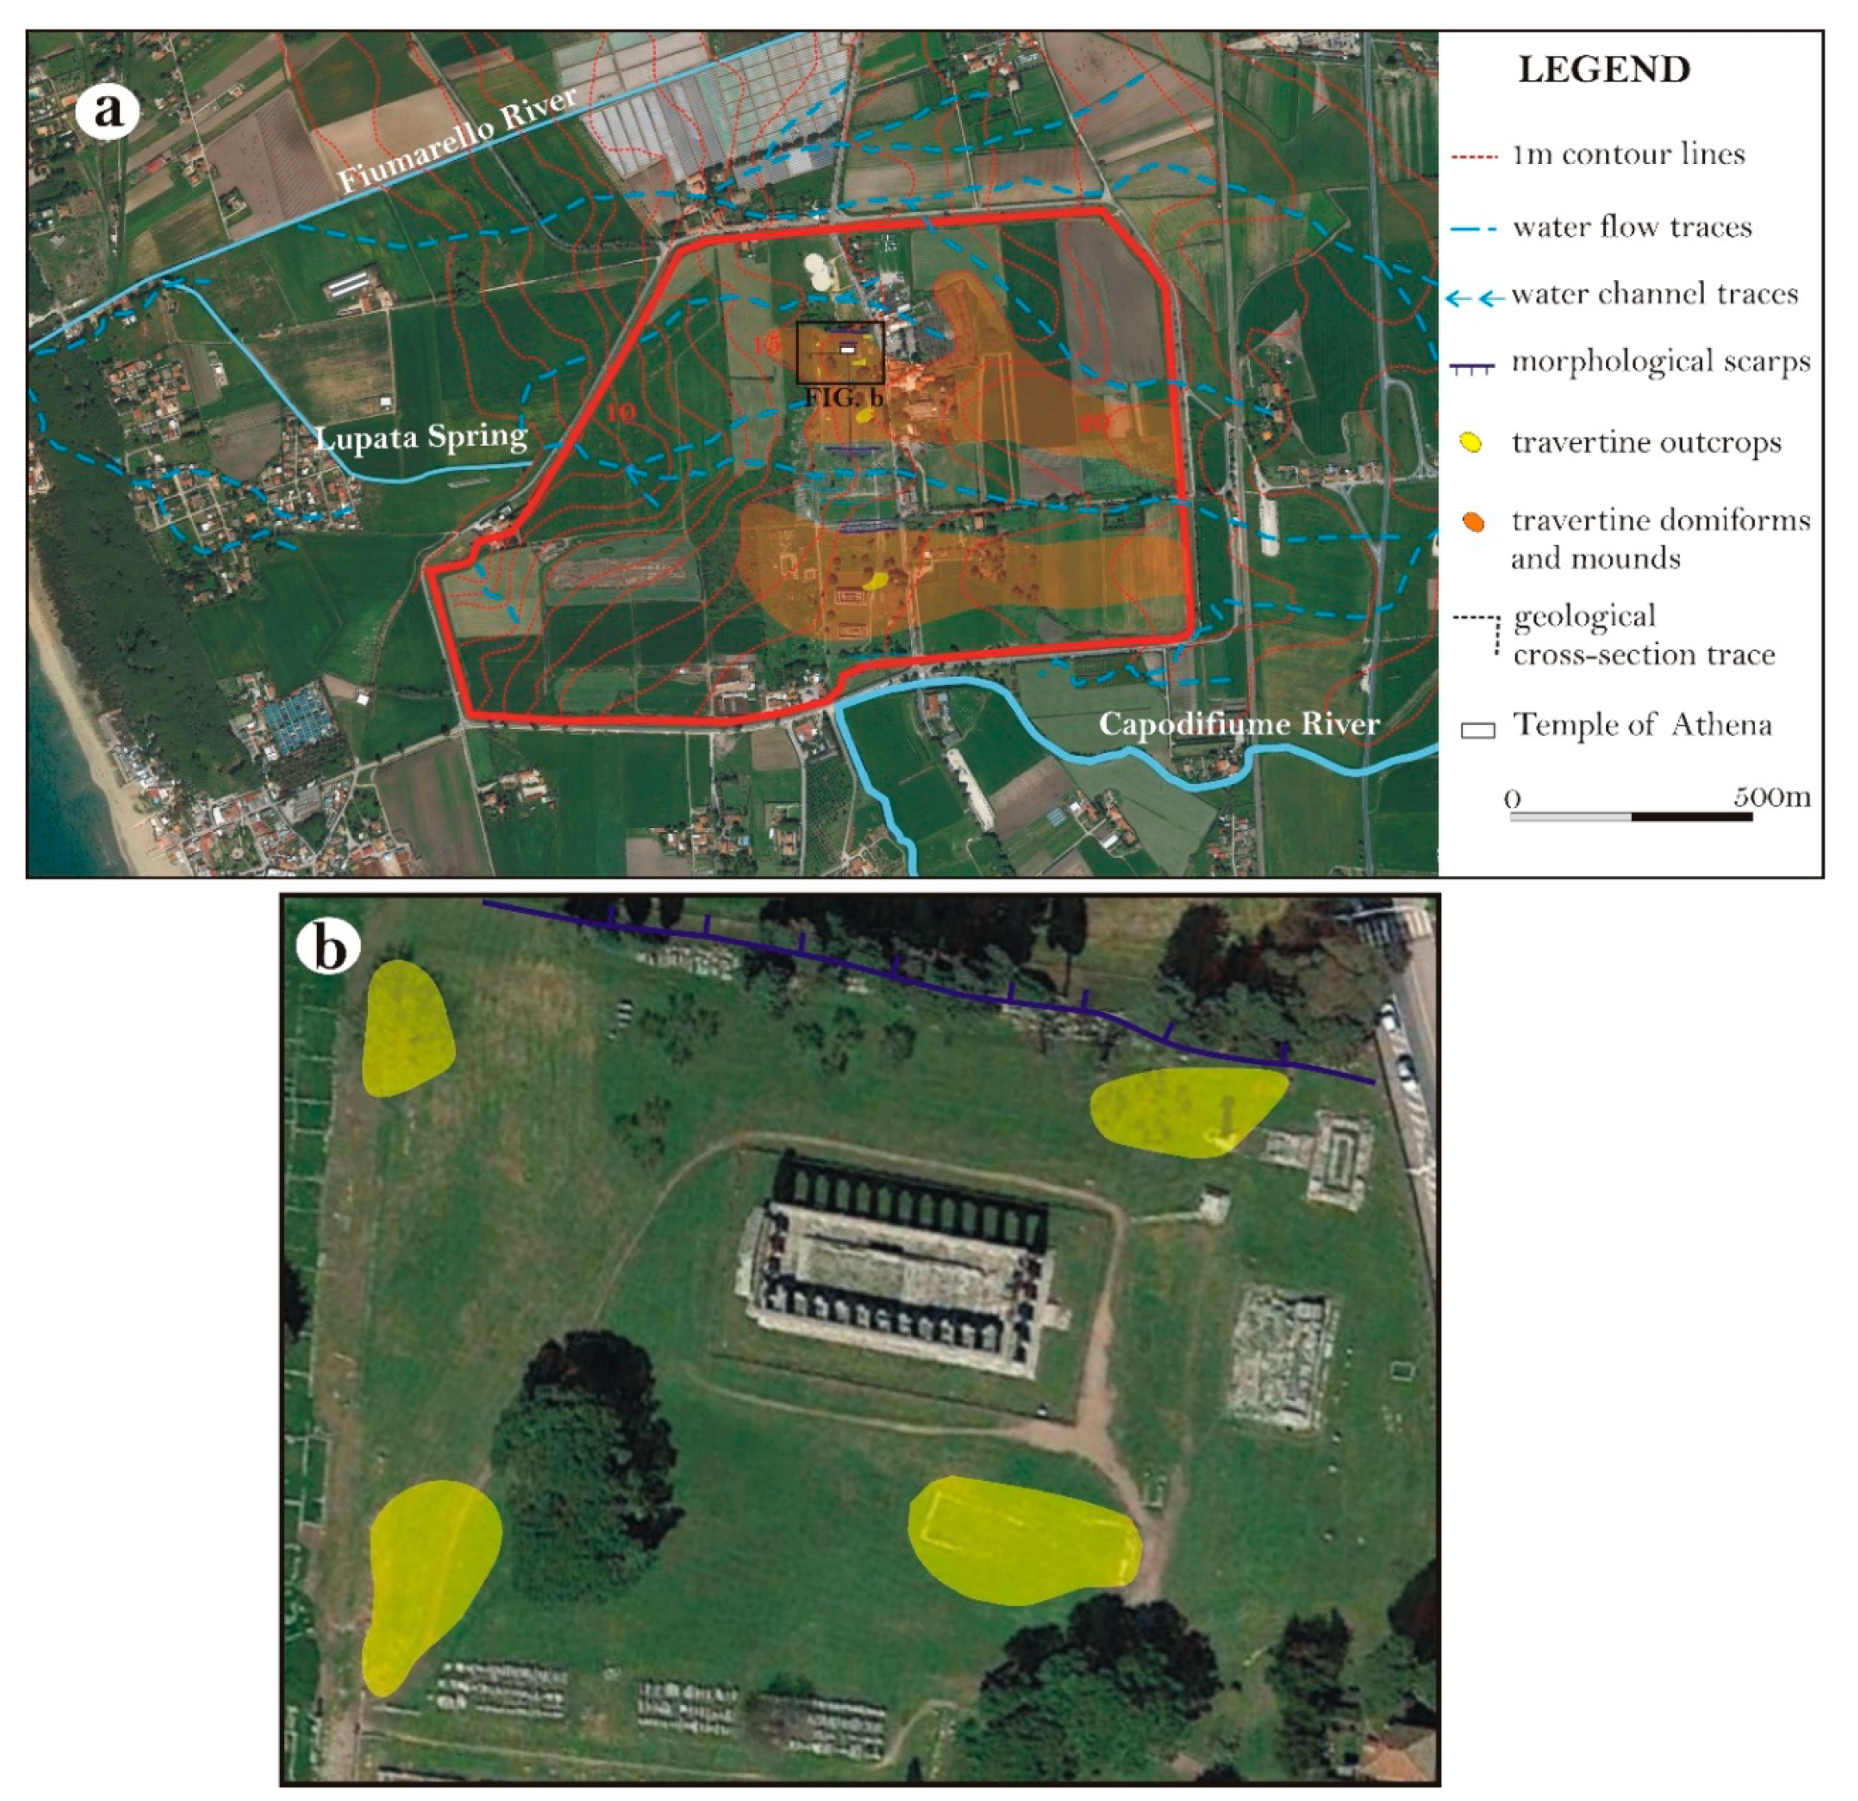
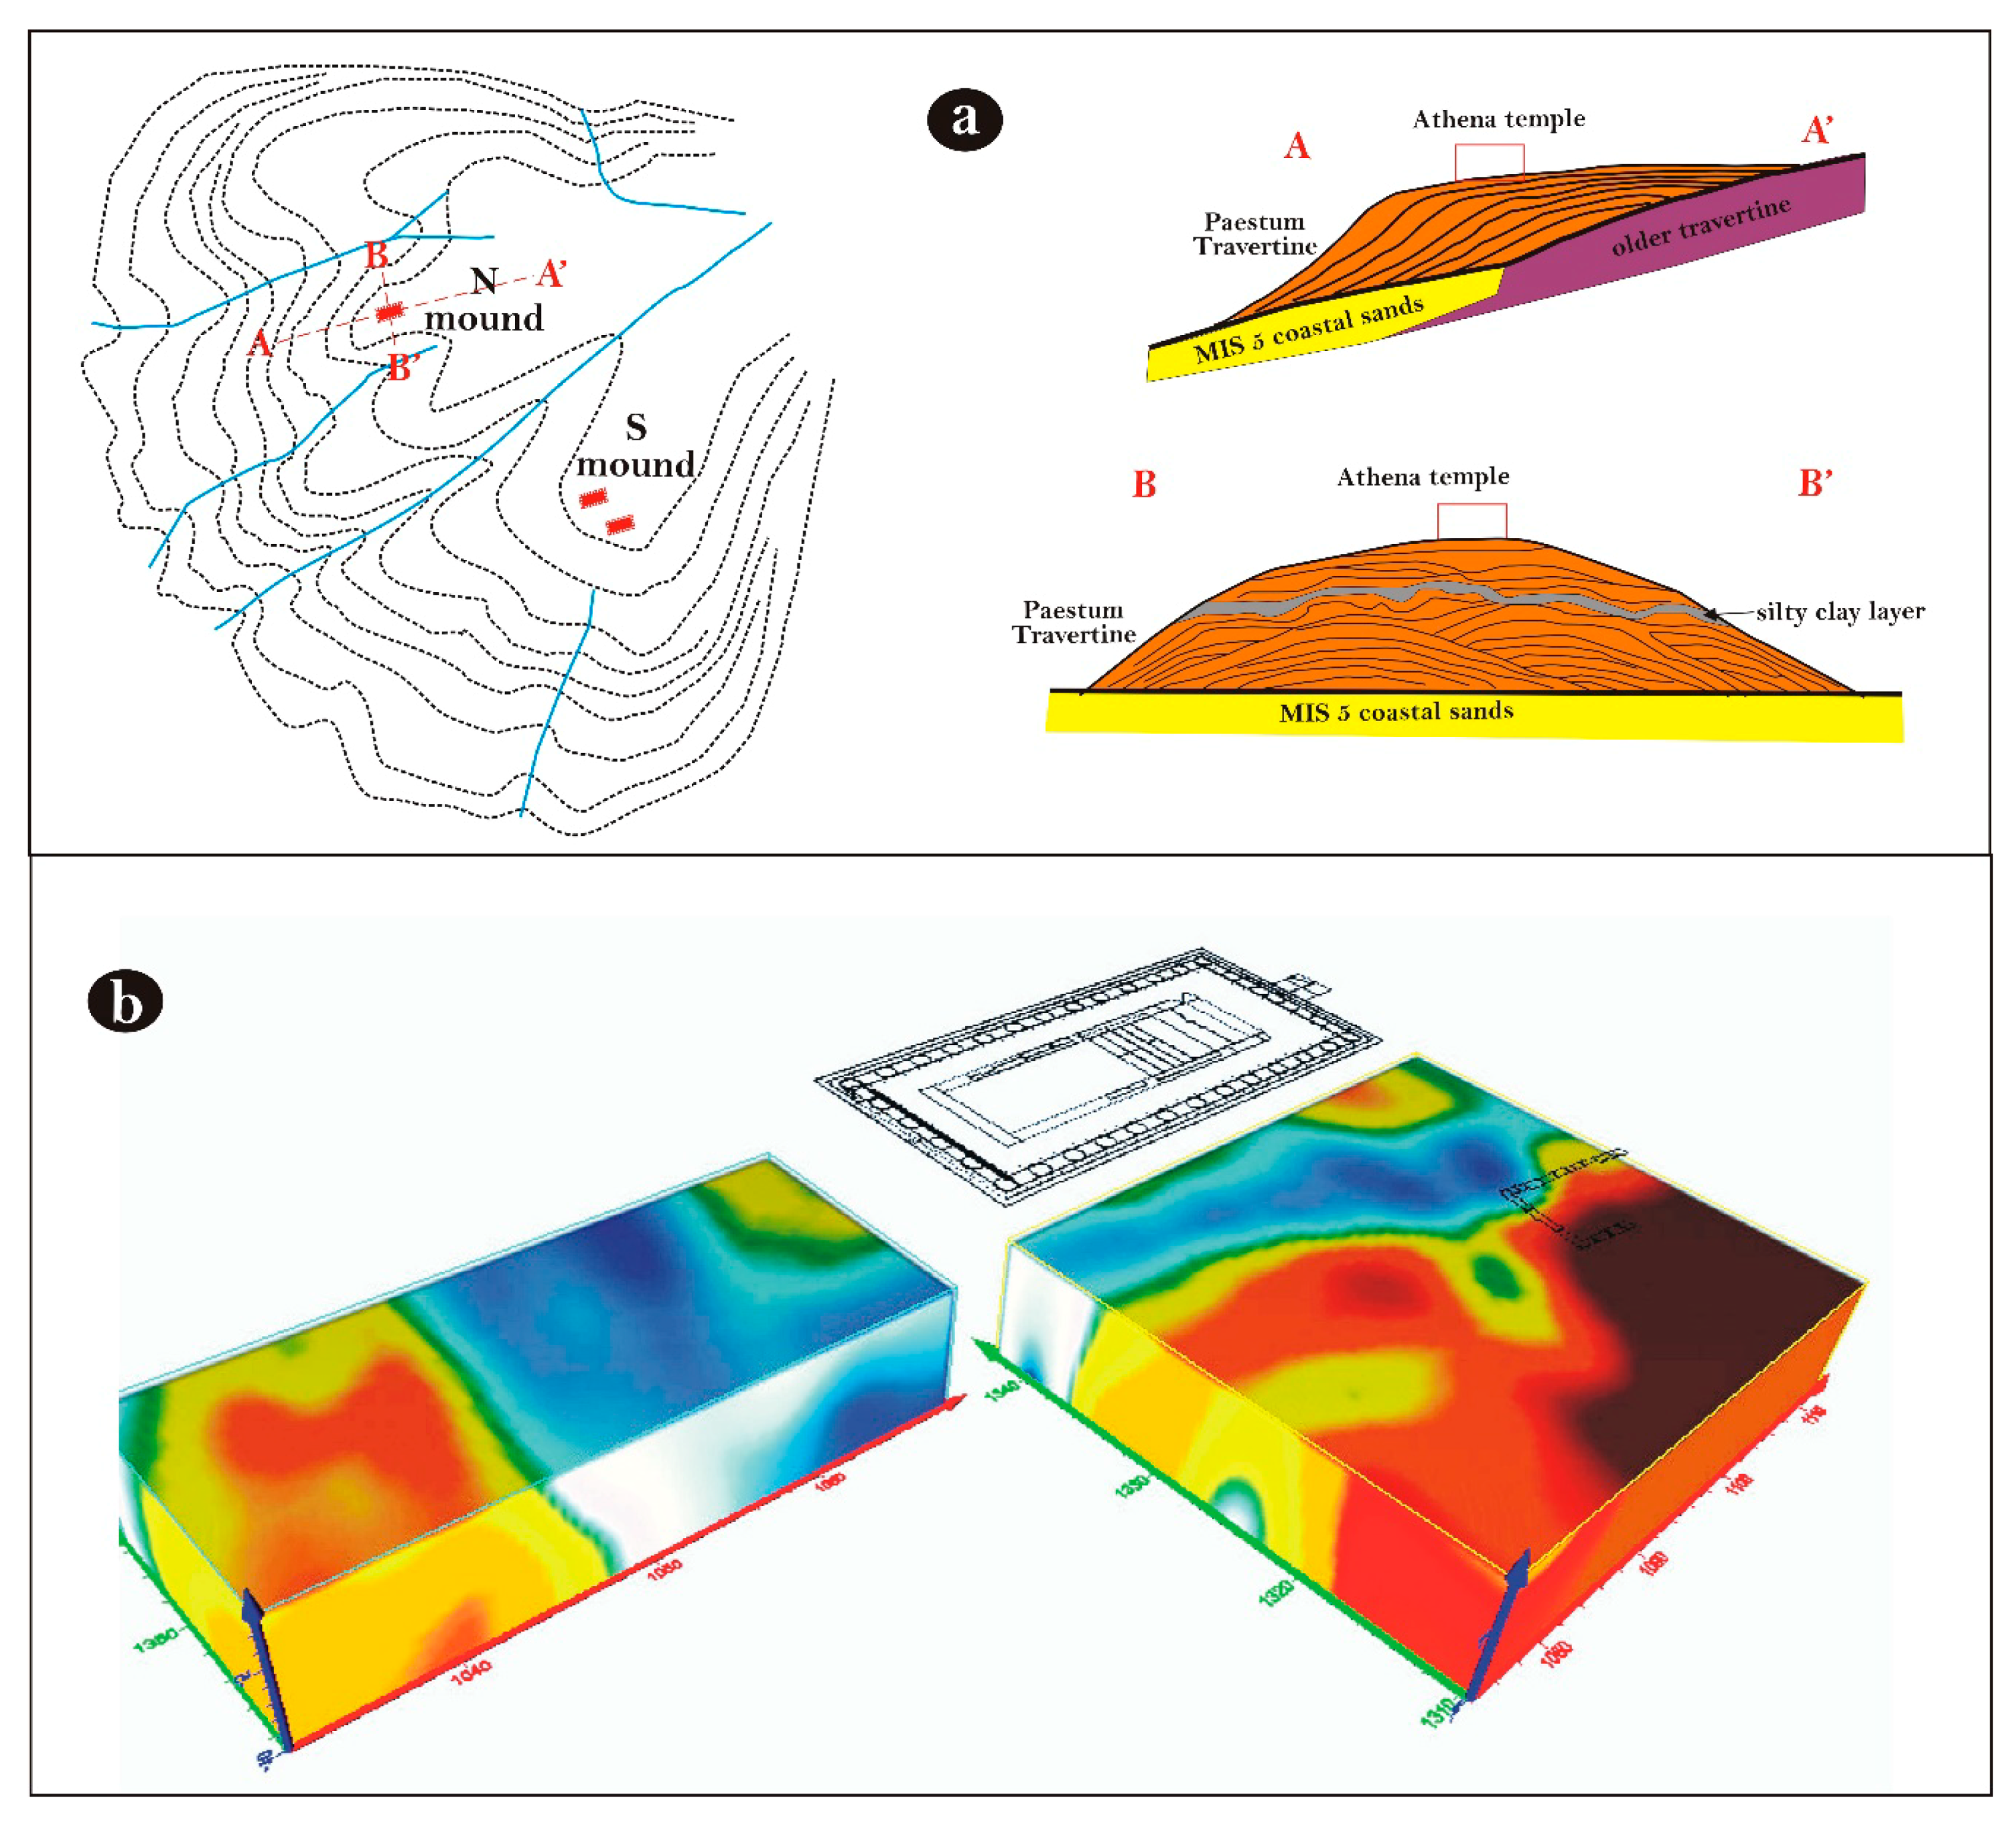
4.1. Geomorphological and Geological Features of the Site
4.2. Geophysical Results
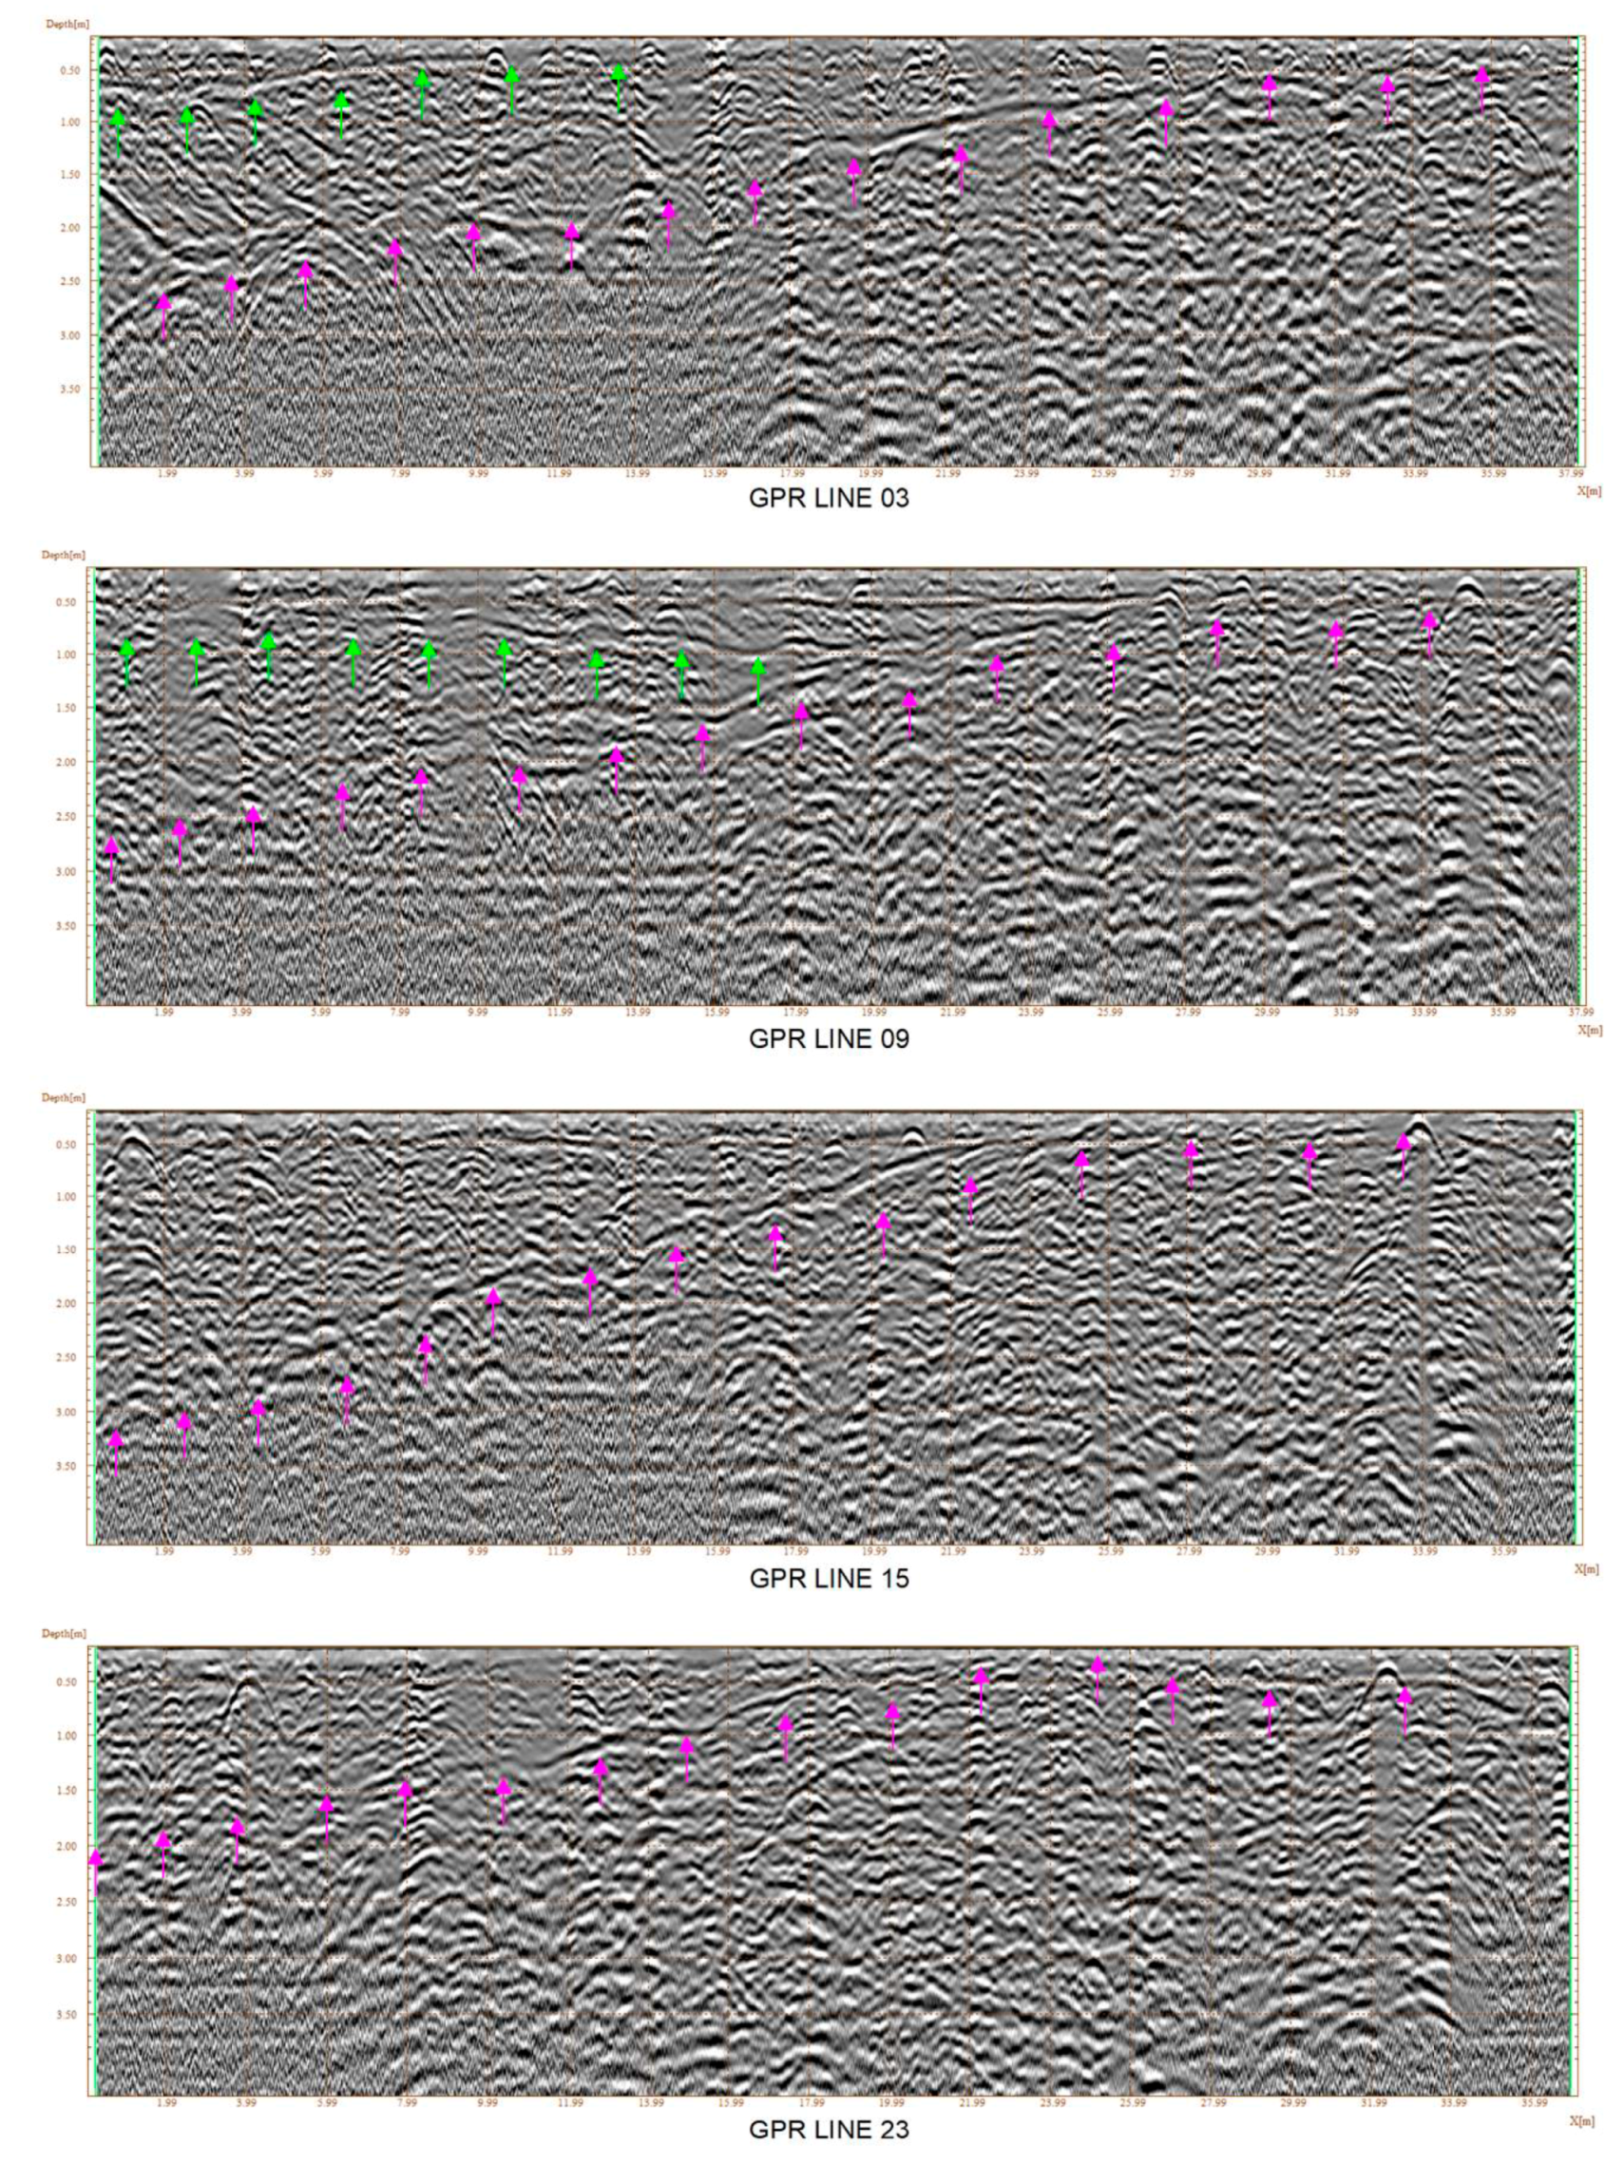
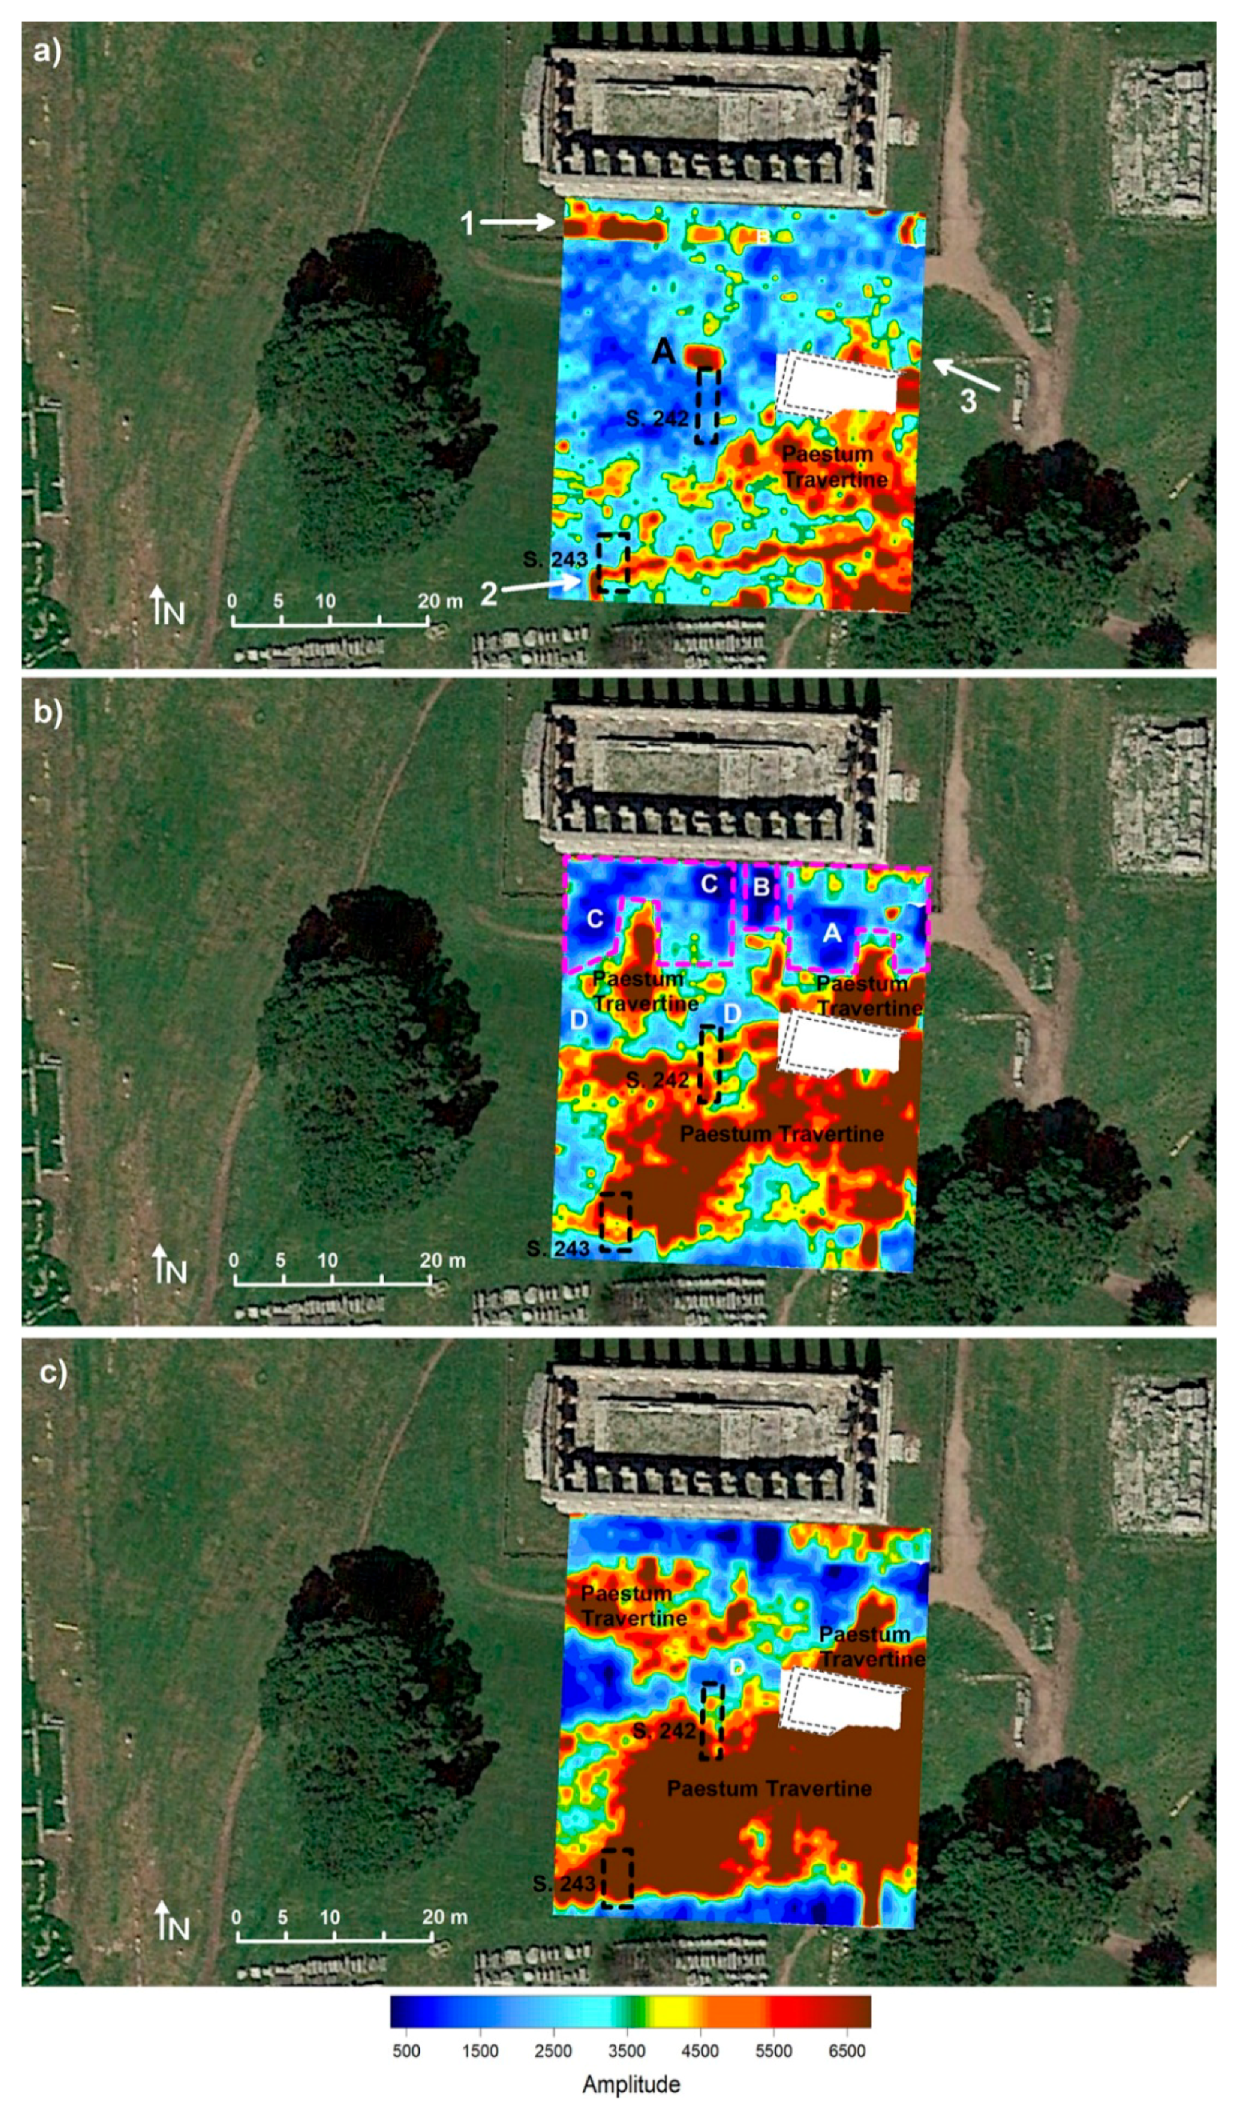
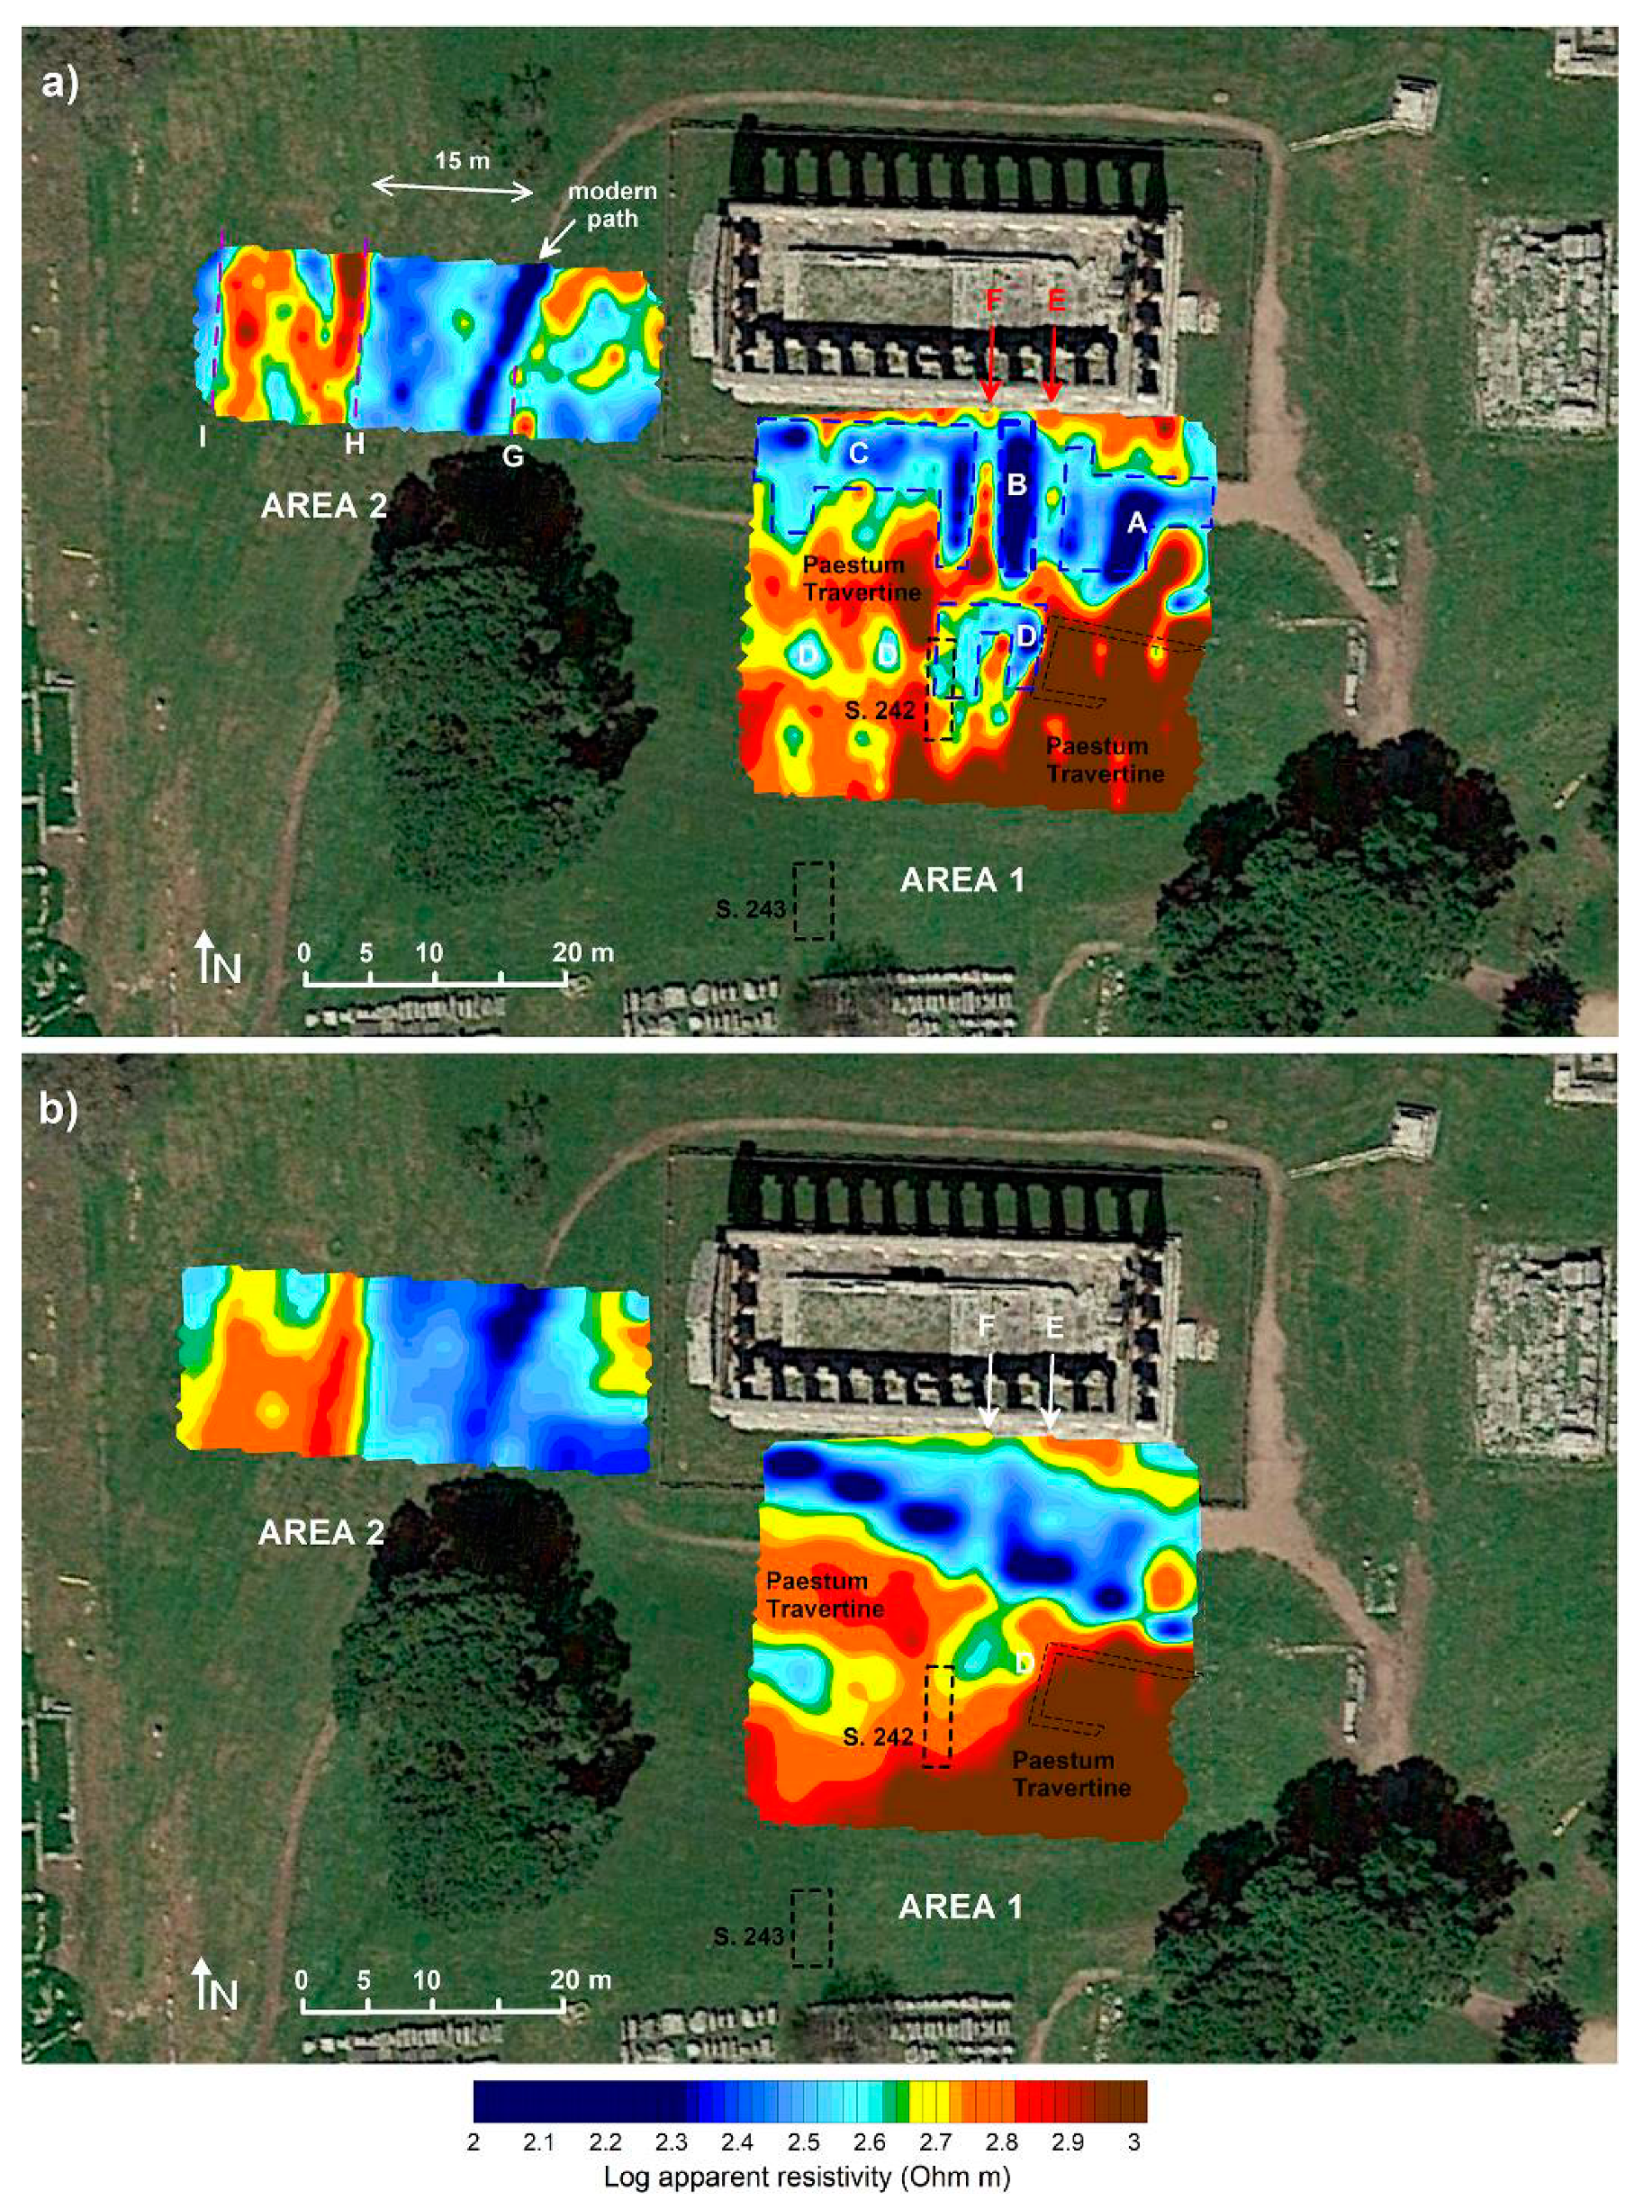
4.2.1. GPR
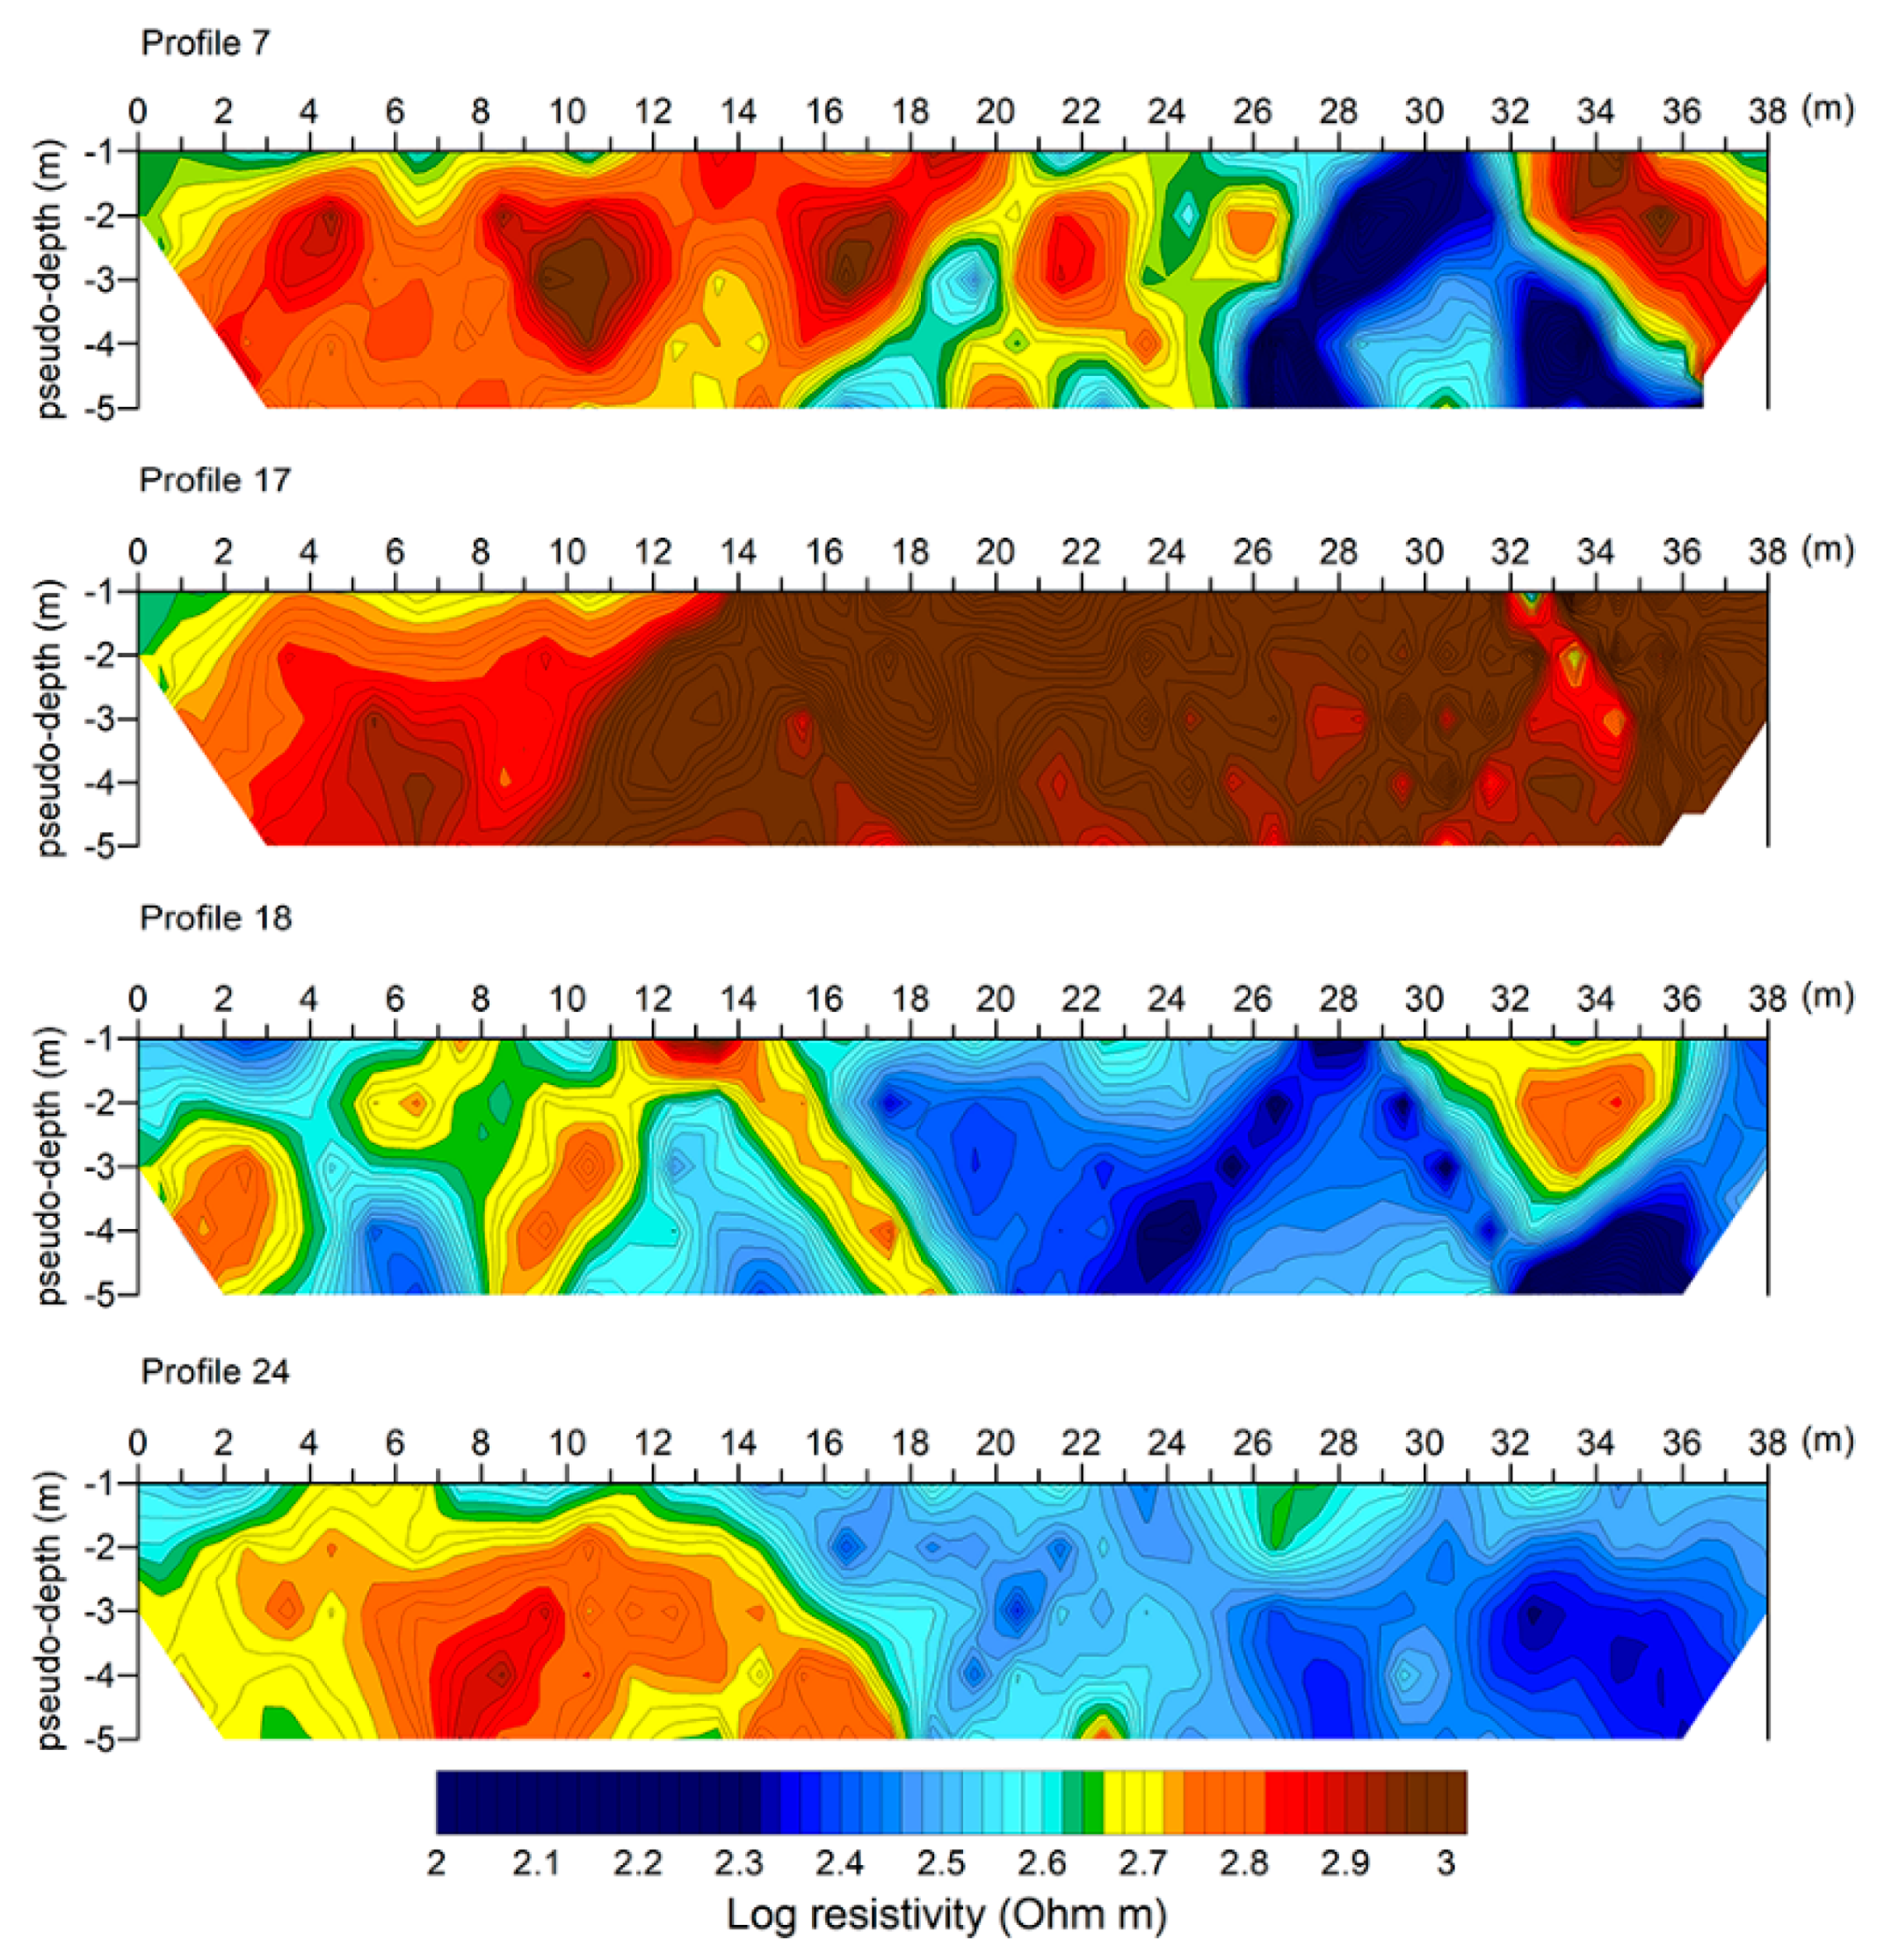
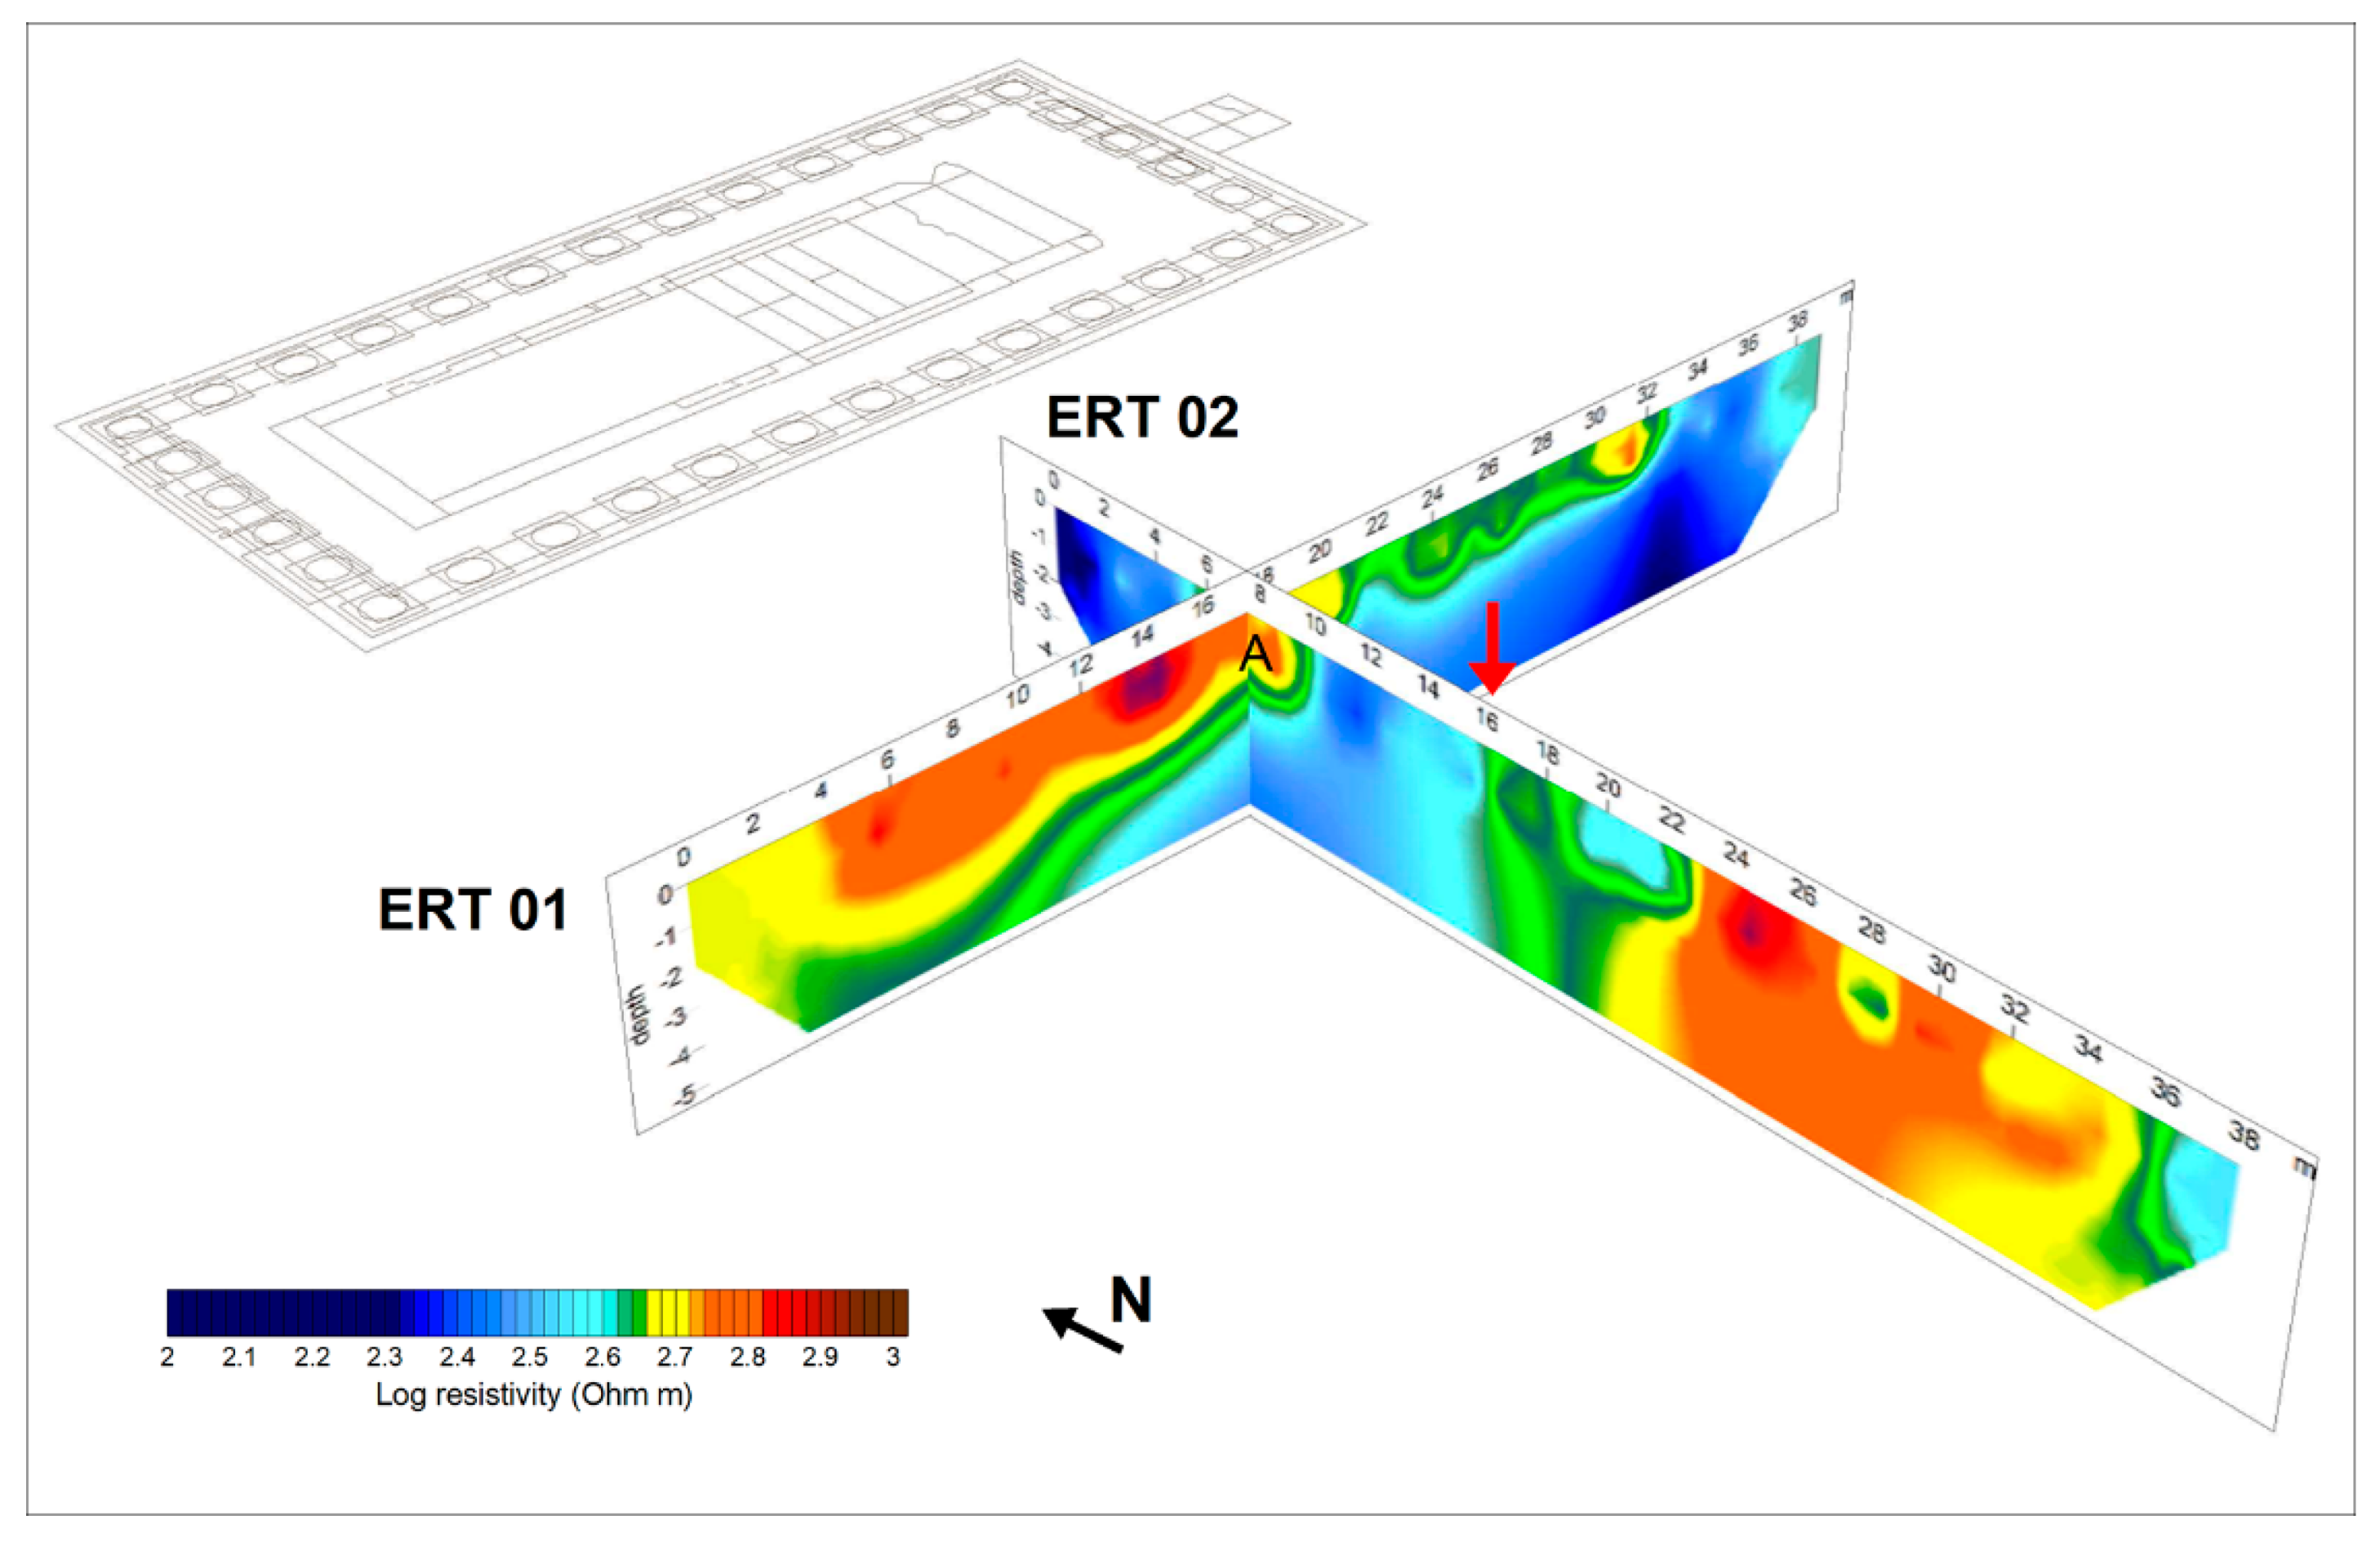
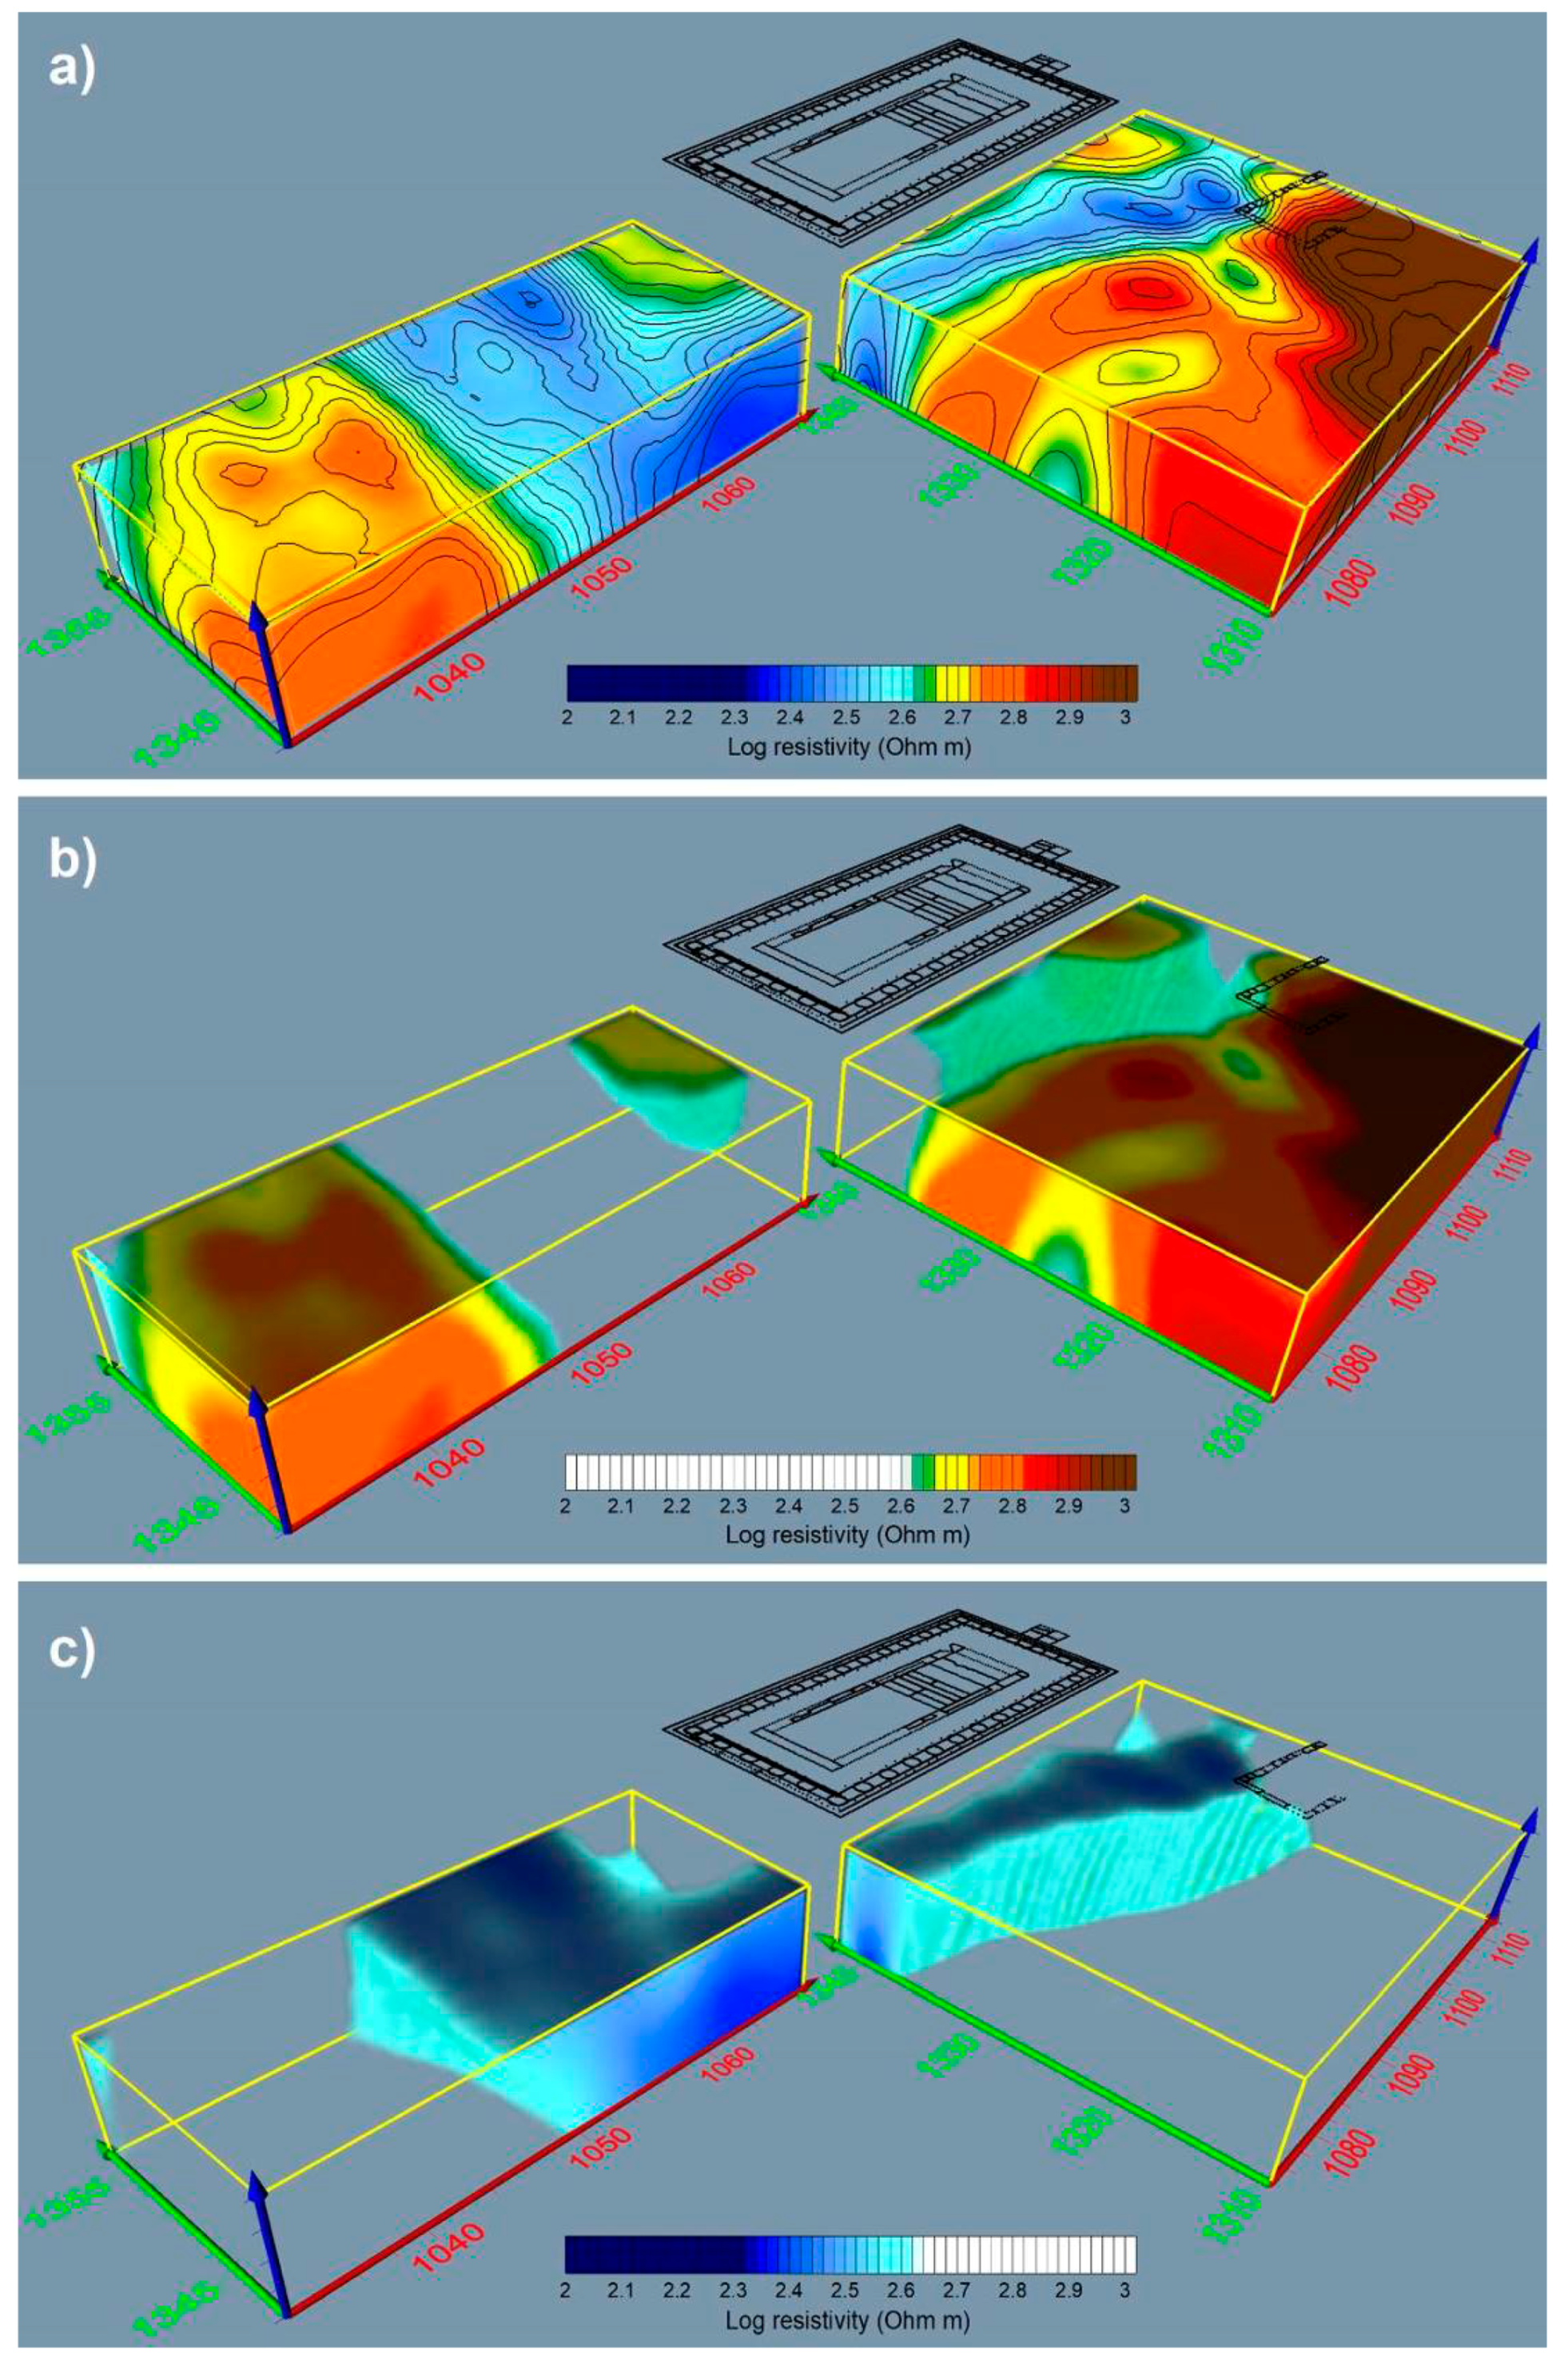
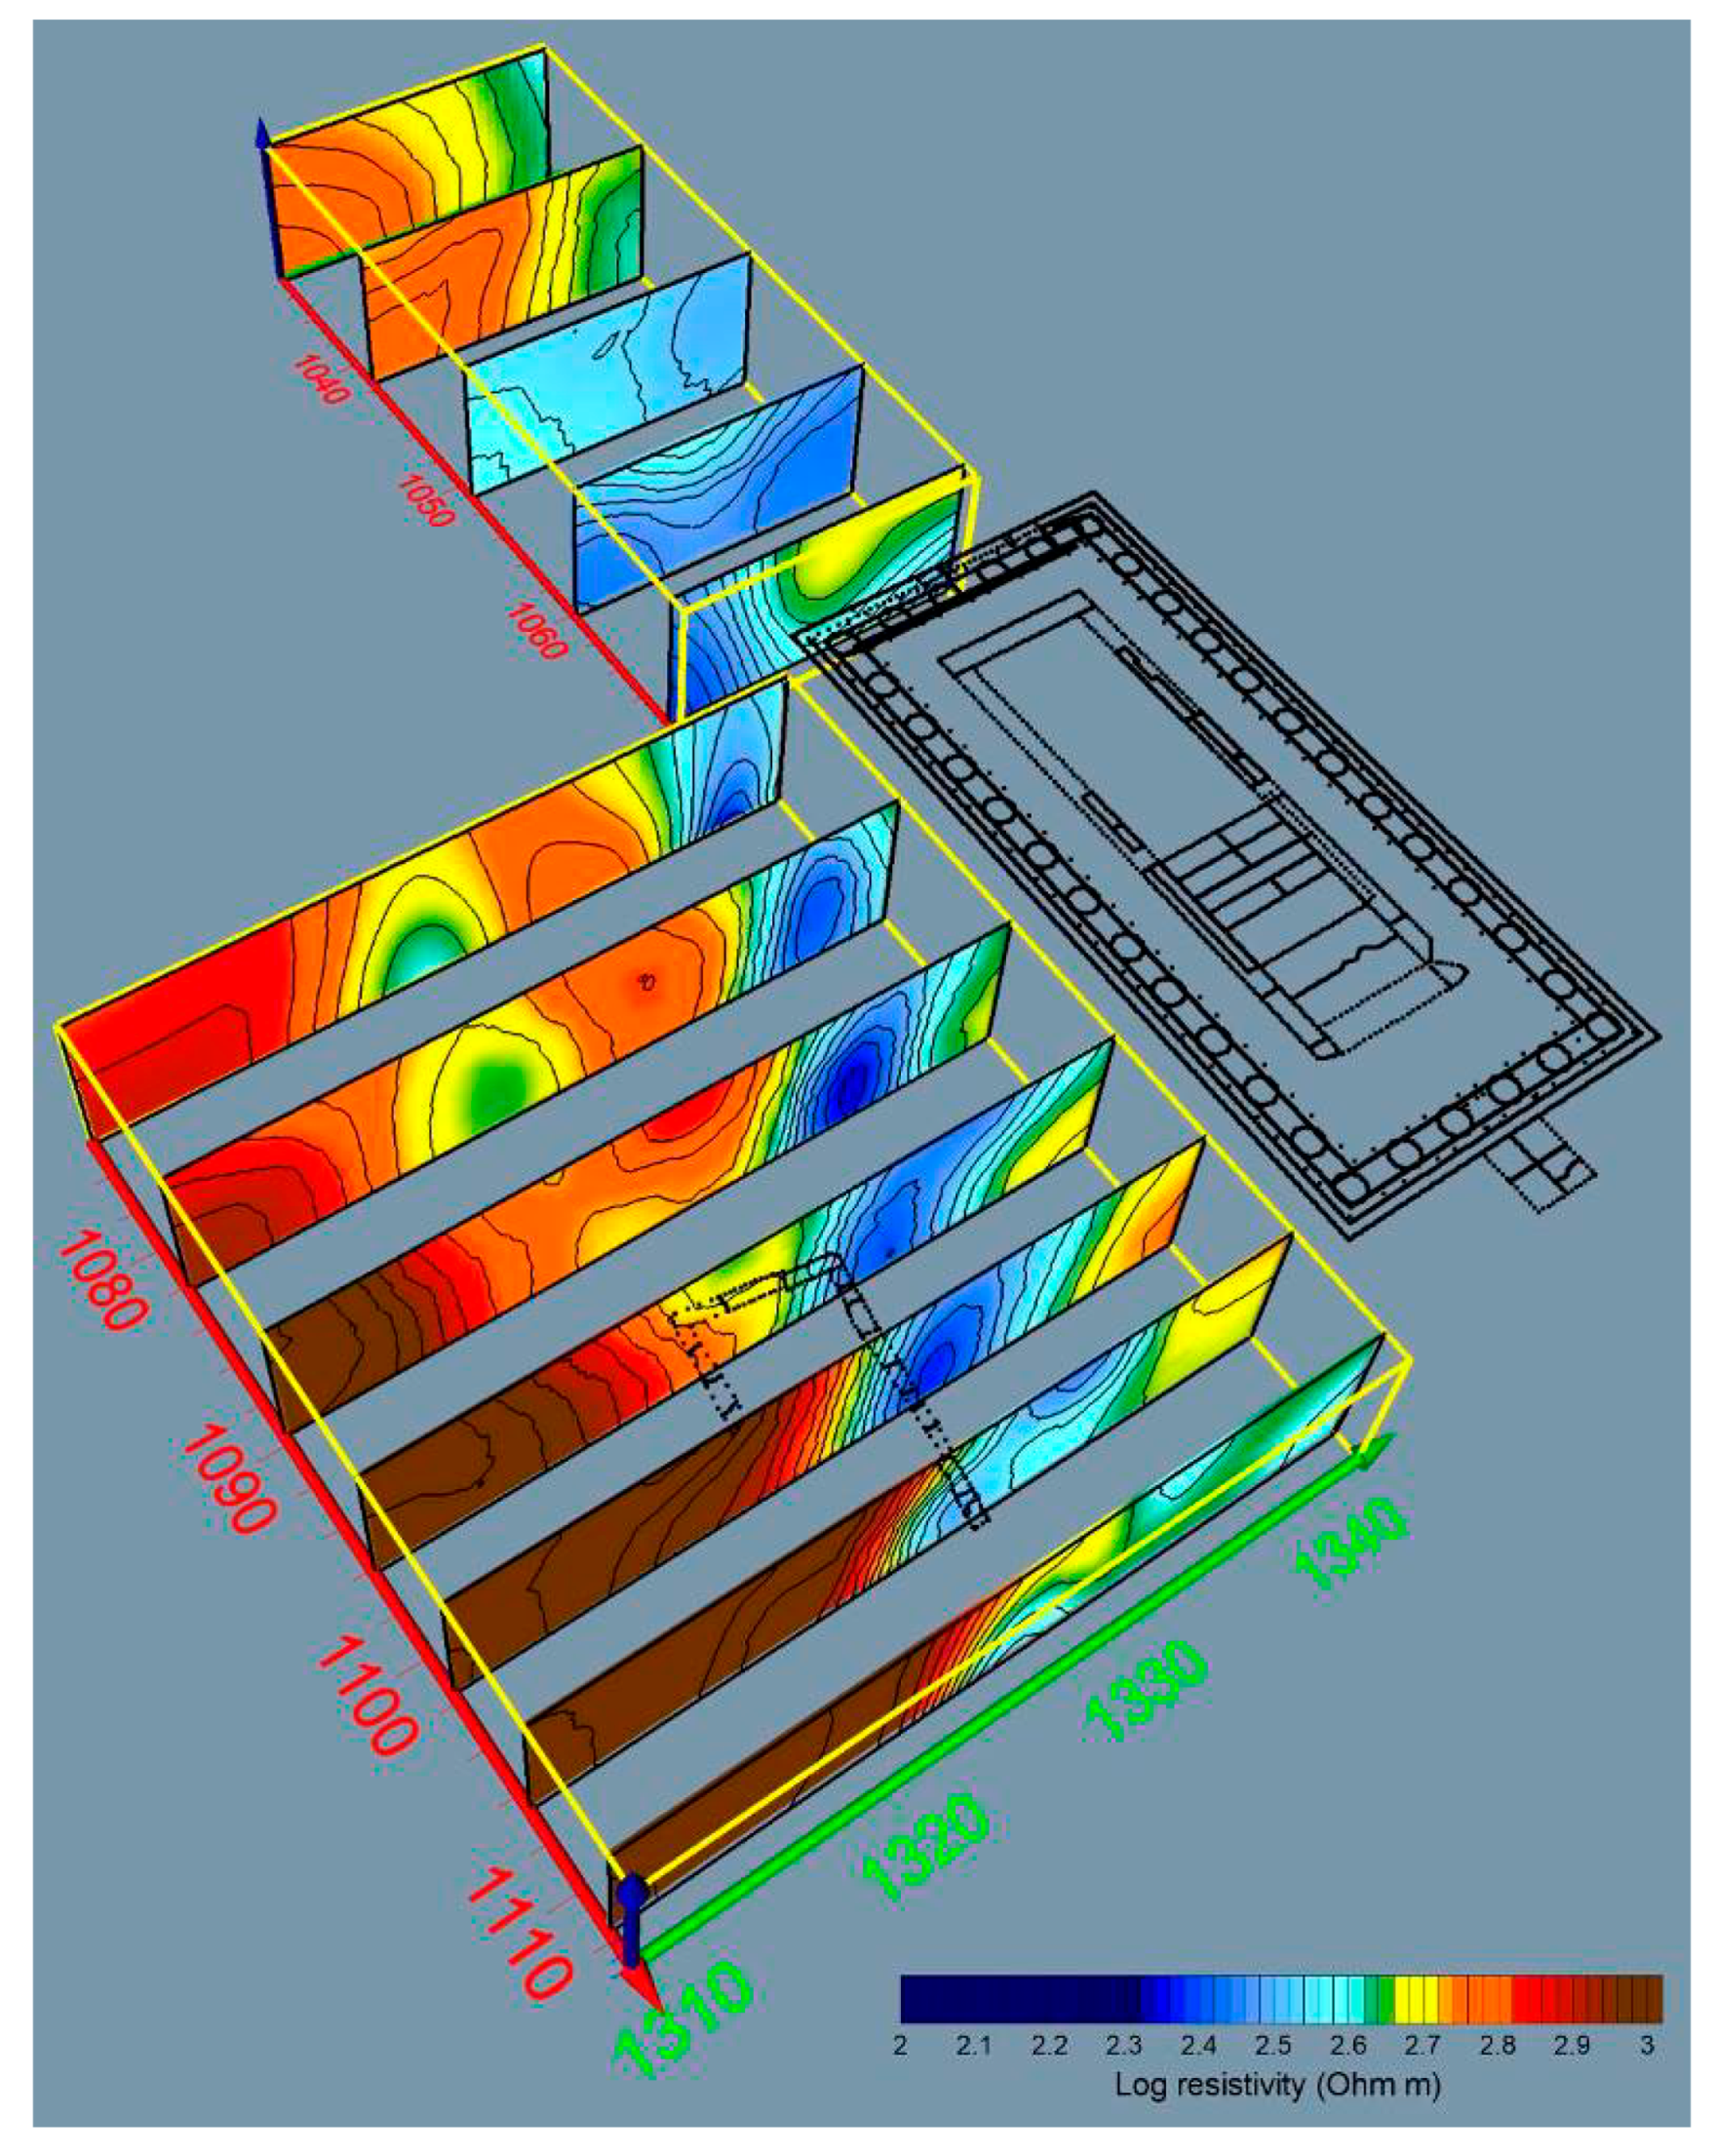
4.2.2. ERT
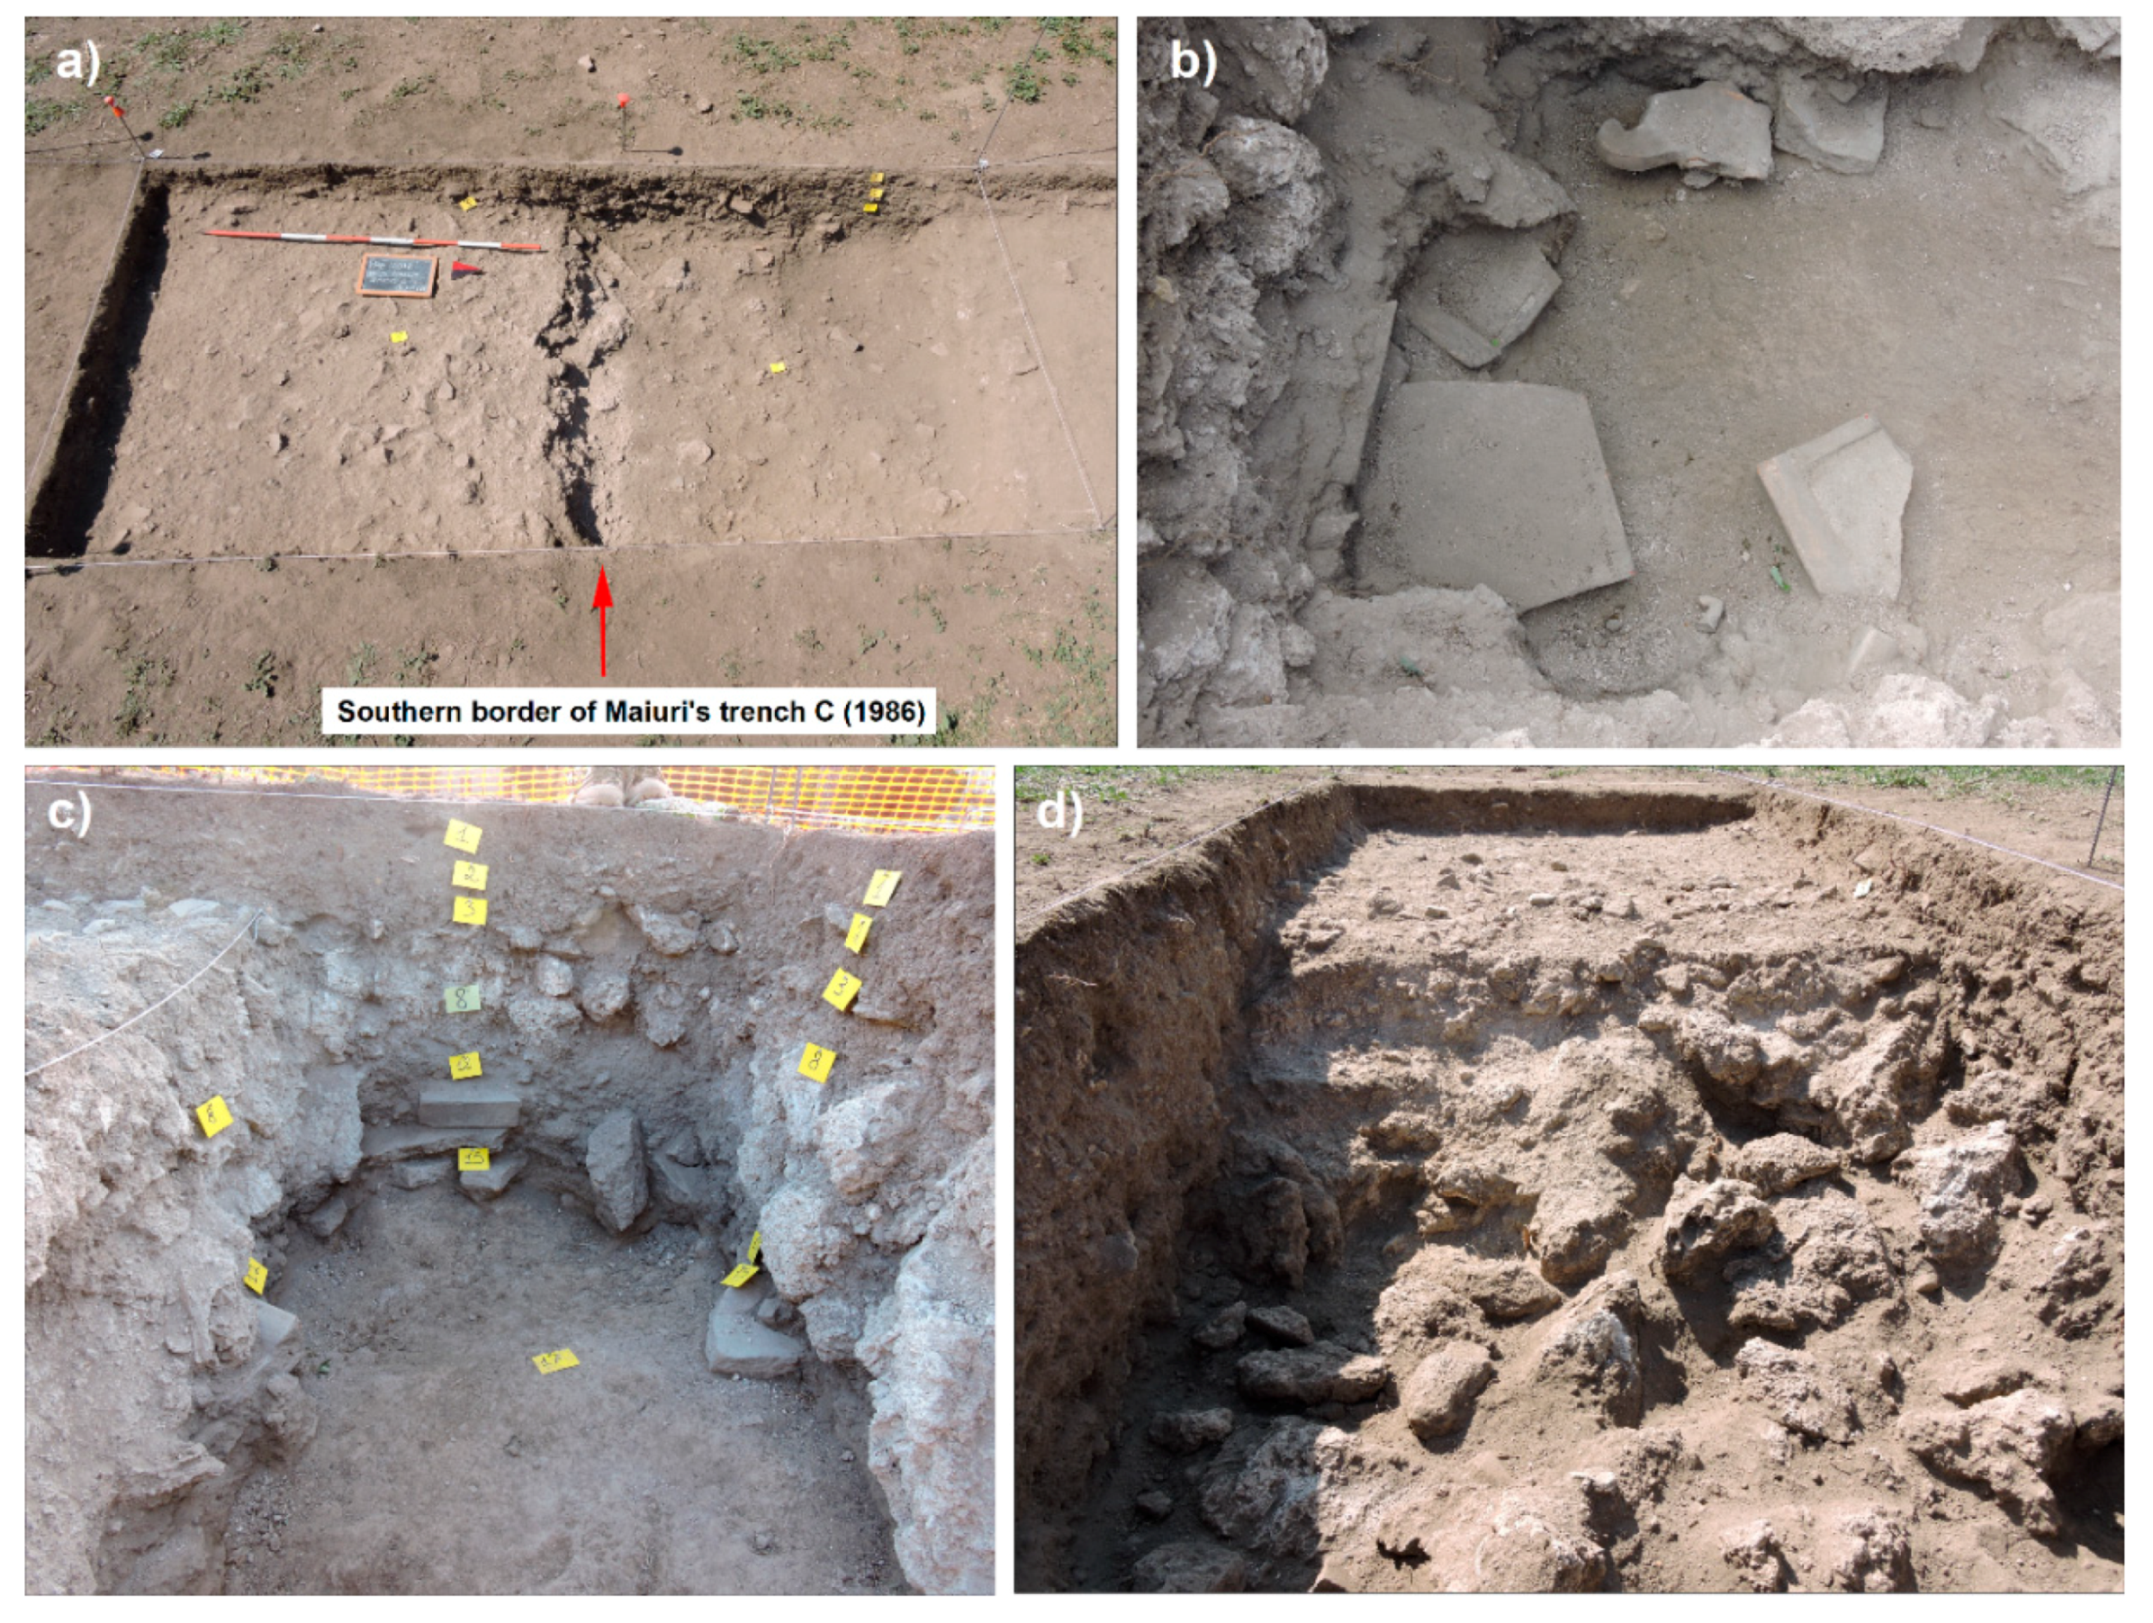
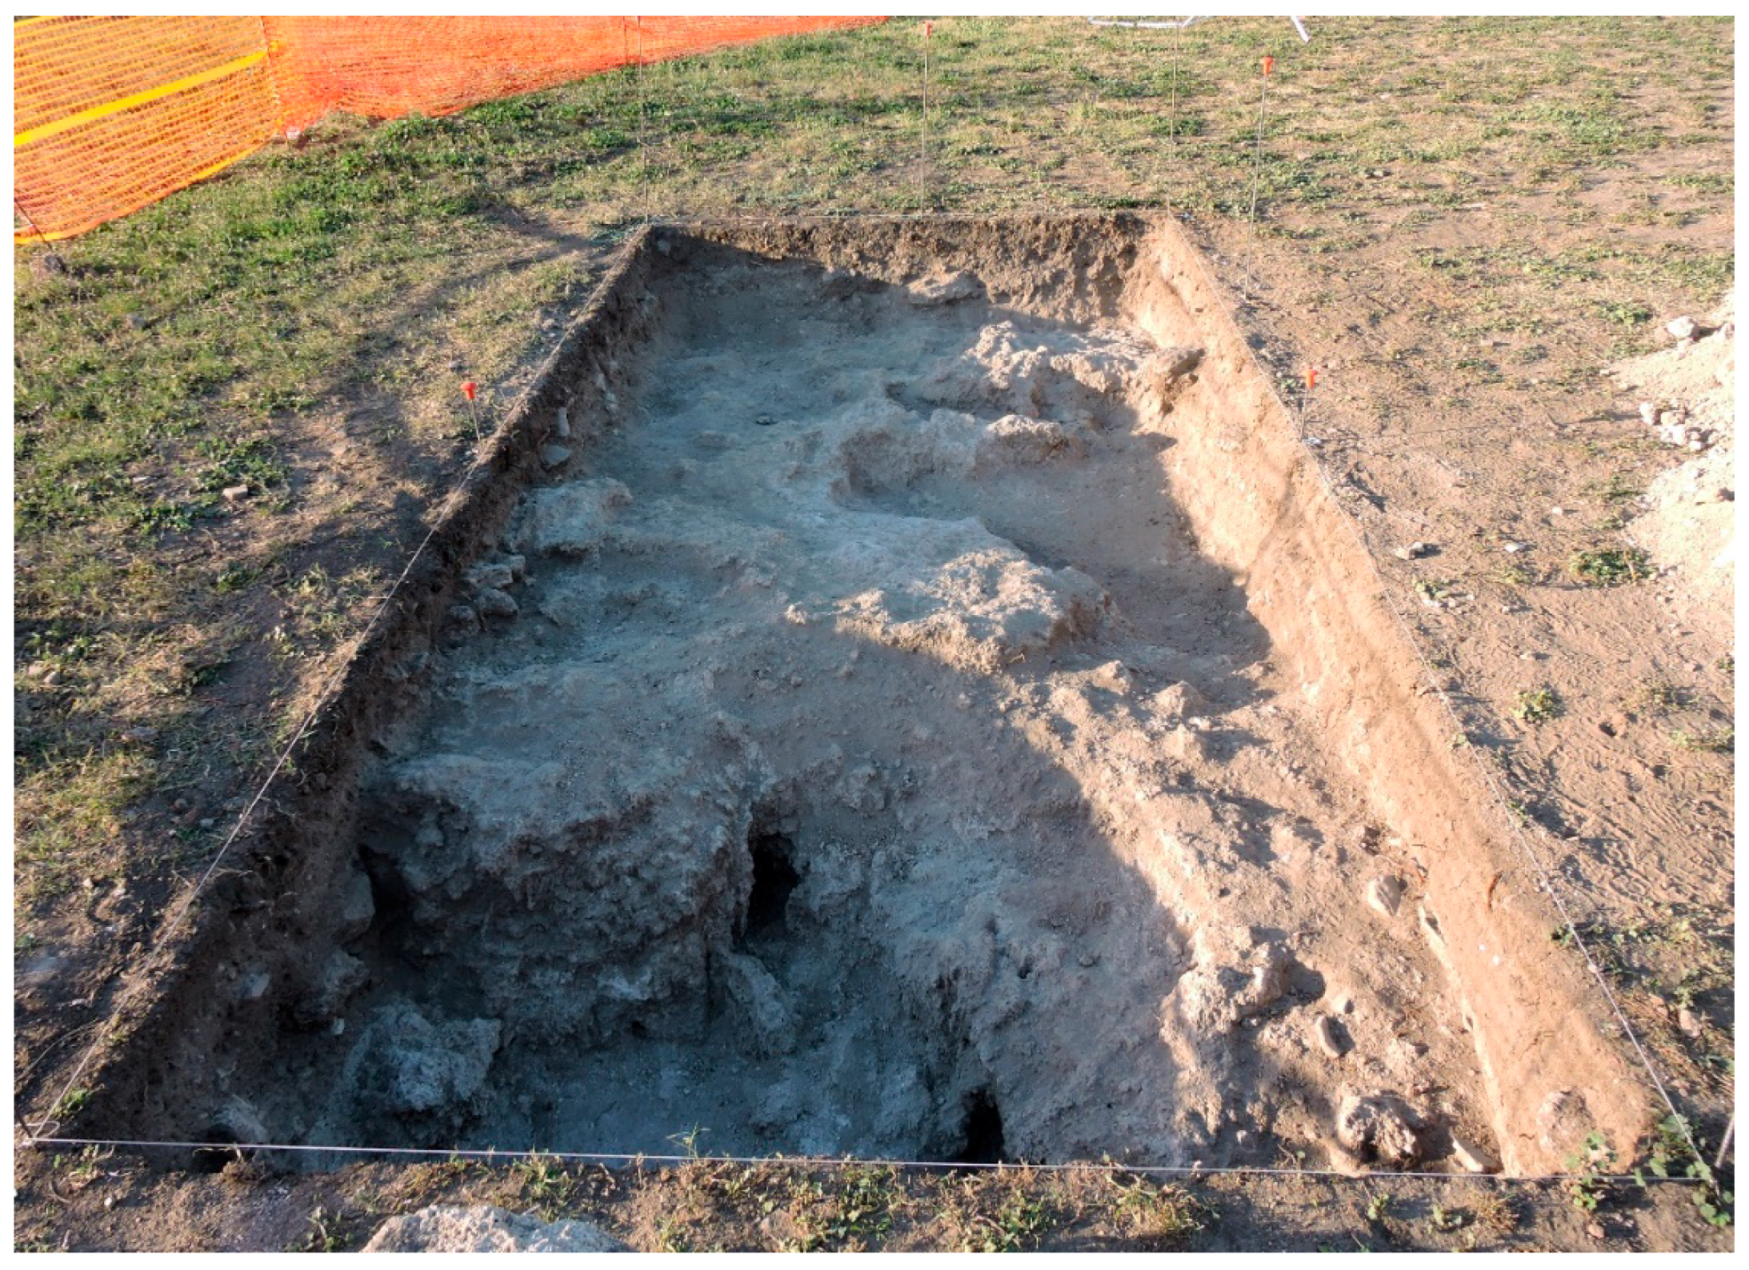
4.3. Archaeological Data from New Trenches
4.3.1. Stratigraphic Survey No. 242
4.3.2. Stratigraphic Survey No. 243
5. Conclusions and Implications for Future Studies
Author Contributions
Funding
Acknowledgments
Conflicts of Interest
References
- Greco, E.; Theodorescou, D. Poseidonia-Paestum I. La Curia; École française de Rome: Rome, Italy, 1980; p. (a)86, (In Italian and French). [Google Scholar]
- Greco, E.; Theodorescou, D. Poseidonia-Paestum II. L’Agorà; École française de Rome: Rome, Italy, 1983; pp. 1–256, (In Italian and French). [Google Scholar]
- Greco, E.; Theodorescou, D. Poseidonia-Paestum III. Forum Nord; École française de Rome: Rome, Italy, 1987; pp. 1–294, (In Italian and French). [Google Scholar]
- Greco, E.; Theodorescou, D. Poseidonia-Paestum IV. Forum Ovest-sudest; École française de Rome: Rome, Italy, 1999; pp. 1–237, (In Italian and French). [Google Scholar]
- Bragantini, I.V.; Fe Bonis, R.; Lemaire, A.; Robert, R. Poseidonia-Paestum V. Le Maisons Romaines De L’ilot Nord; École française de Rome: Rome, Italy, 2008; (In Italian and French). [Google Scholar]
- Greco, E.; Longo, F. (Eds.) Paestum. Studi, Scavi E Ricerche. Bilancio Di Un Decennio. 1988–1998; Pandemos: Paestum, Italy, 2000; (In Italian and French). [Google Scholar]
- Guy, M. Le Rivage Marittime et la «Lagune» de Poseidonia-Paestum. In Volcanologie et Archeologie; Albore Livadie, C., Widemann, F., Eds.; PACT 25 Volcanologie et Archeologie: Ravello, Italy, 1990; pp. 257–270. (In Italian) [Google Scholar]
- Longo, F. Poseidonia. Istituzioni, Società e Forme Urbane. In La Città; Greco, E., Ed.; Donzelli: Roma, Italy, 1999; pp. 365–384. (In French) [Google Scholar]
- Longo, F. Poseidonia. La CittàLucana e Romana: Continuità e Trasformazioni. In Immaginando Città. Racconti di Fondazione Mitiche, Forma e Funzioni Delle Città Campane; Rescigno, C., Sirano, F., Eds.; Soprintendenza per i Beni Archeologici di Salerno, Avellino, Benevento e Caserta prismi editrice politecnica srl: Napoli, Italy, 2014; pp. 254–257. (In Italian) [Google Scholar]
- Longo, F. Alcune riflessioni su Poseidonia in Età Arcaica: Il Teichos dei sibariti e l’apoikia Trafondazioni e rifondazioni. In Percorsi. Scritti di e per Angela Pontrandolfo; De Caro, S., Longo, F., Scafuro, M., Serritella, A., Eds.; Pandemos: Paestum, Italy, 2017; pp. 199–214. (In Italian) [Google Scholar]
- Rescigno, C. Il Santuario Di Athena: Il tempio e Le Sue Fasidi Vita. In Learmi di Athena, Graellsi; Fabregat, R., Longo, F., Zuchtriegel, G., Eds.; Arte’m: Napoli, Italy, 2017; pp. 45–51. (In Italian) [Google Scholar]
- Graells, R.; Longo, F.; Zuchtriegel, G. Le armi di Athena. Il SantuarioSettentrionale di Paestum; Arte’m: Napoli, Italy, 2017. (In Italian) [Google Scholar]
- Longo, F. Le Armi di ATena. I dati Dall’athenaion Di Poseidonia tra Greci e Lucani. In ArmivotIVeiN Magna Grecia; GRaellS, R., Longo, F., Eds.; RGZM: Mainz, Italy, 2018; pp. 25–42. (In Italian) [Google Scholar]
- Longo, F. From Poseidonia to Poseidonia. Reflections on the Origins and Early Decades in the Life of the Achaean Apoikia. In Gli Achei in Grecia e in Magna Grecia: Nuove Scoperte e Nuove Prospettive; Greco, E., Rizakis, A.D., Eds.; Annuario della Scuola di Atene, Monografie; All’insegna del Giglio: Firenze, Italy, 2019. [Google Scholar]
- Longo, F.; D’Antonio, A. I Materiali in Metallo Dell’athenaion di Paestum: Un Quadro di SintesiPreliminare. In Atti del II Convegno Internazionale di Studi—Dialoghi sull’Archeologia Della Magna Grecia e del Mediterraneo; Pandemos: Paestum, Italy, 2018; pp. 755–765. (In Italian) [Google Scholar]
- Longo, F.; Pontrandolfo, A. Da Cerere ad Athena: Per Una Storia Della Ricerca del Santuario Settentrionale. In Le armi di Athena. Il santuariosettentrionale di Paestum, GraellsiFabregat, Longo, Zuchtriegel; Arte’m: Napoli, Italy, 2017; pp. 31–44. (In Italian) [Google Scholar]
- Longo, F. Le Mura di Paestum.Antologia di Testi, Dipinti, Stampe grafiche e Fotografiche dal Cinquecento Agli Anni Trenta del Novecento, (Tekmeria 12); Pandemos: Paestum, Italy, 2012. (In Italian) [Google Scholar]
- Bamonte, G. Le Antichità Pestane; Stamperia della Biblioteca Analitica: Napoli, Italy, 1819. (In Italian) [Google Scholar]
- Maiuri, A. Dieci Anni di Scavo a Paestum (1929–1939). In I PrimiScavi di Paestum; Aurigemma, S., Spinazzola, V., Maiuri, A., Eds.; Ente alle Antichità e ai Monumenti della Provincia di Salerno: Salerno, Italy, 1986; pp. 35–80. (In Italian) [Google Scholar]
- Longo, F.; D’Antonio, A. I Metalli del Santuario Urbano Settentrionale di Poseidonia; Pandemos: Paestum, Italy, 2019. (In Italian) [Google Scholar]
- Brandonisio, M. Il Santuario Settentrionale di Poseidonia-Paestum: I monumenti. In Le Armi di Athena Greciai; GraellsiFabregat, R., Longo, F., Zuchtriegel, G., Eds.; Arte’m: Napoli, Italy, 2017; pp. 23–30. (In Italian) [Google Scholar]
- Krauss, F. Die Tempel von Paestum. I. der Athena Tempel und di Sogenante Basilika. 1Lieferung; Der Athena tempel: Berlin, Germany, 1959. (In German) [Google Scholar]
- Amato, V.; Aucelli, P.P.C.; Ciampo, G.; Cinque, A.; Di Donato, V.; Pappone, G.; Petrosino, P.; Romano, P.; Rosskopf, C.; Russo Ermolli, E. Relative sea level changes and paleogeographical evolution of the southern Sele plain (Italy) during the Holocene. Quat. Int. 2013, 288, 112–128. [Google Scholar] [CrossRef]
- Amato, V.; Anzalone, E.; Aucelli, P.P.C.; D’argenio, B.; Ferreri, V.; Rosskopf, C.M. Sedimentology and depositional history of the travertine outcropping in the Poseidonia-Paestum archaeological area. Rend. LinceiSci. Fis. 2012, 23, 61–68. [Google Scholar] [CrossRef]
- Amato, V.; Aucelli, P.P.C.; D’Argenio, B.; Daprato, S.; Ferraro, L.; Pappone, G.; Petrosino, P.; Rosskopf, C.M.; Russo Ermolli, E. Holocene environmental evolution of the coastal sector in front of the Poseidonia-Paestum archaeological area (Sele plain, Southern Italy). Rend. Lincei Sci. Fis. 2012, 23, 45–60. [Google Scholar] [CrossRef]
- Guy, M. La Costa, La Laguna e L’insediamento di Poseidonia-Paestum. In Paestum e La città e Il Territorio; Quaderno di Documentazione Dell’istituto Della Enciclopedia Italiana Treccani: Roma, Italy, 1990; pp. 67–77. (In Italian) [Google Scholar]
- D’Argenio, B.; Ferreri, V. Travertines as self regulating carbonate systems. Evolutionary trends and classification. FoldtaniKozlony 2004, 1343, 209–218. [Google Scholar]
- Budillon, F.; Pescatore, T.; Senatore, M.R. Cicli deposizionali del Pleistocene superiore-Olocene sulla piattaforma continentale del Golfo di Salerno (Tirreno meridionale). Boll. Soc. Geol. Ital. 1994, 113, 303–316. (In Italian) [Google Scholar]
- Aiello, G.; Barra, D.; De Pippo, T.; Donadio, C. Pleistocene Foraminiferida and Ostracoda from the Island of Procida (Bay of Naples, Italy). Boll. Soc. Geol. Ital. 2012, 51, 49–62. [Google Scholar]
- IdsGred Software. Available online: https://idsgeoradar.com/products/ground-penetrating-radar (accessed on 21 July 2019).
- GPR-SLICE7.0 Software. Available online: https://gpr-survey.com/ (accessed on 21 July 2019).
- Conyers, L.B.; Goodman, D. Ground Penetrating Radar: An Introduction for Archaeologists; AltaMira Press: Walnut Creek, CA, USA, 1997. [Google Scholar]
- Goodman, D.; Piro, S. GPR Remote Sensing in Archaeology; Geotechnologies and the Environment; Springer: Berlin, Germany, 2013. [Google Scholar]
- Mauriello, P.; Patella, D. A data-adaptive probability based fast ERT inversion method. Prog. Electromagn. Res. 2009, 97, 275–290. [Google Scholar] [CrossRef]
- Patella, D. Introduction to ground surface selfpotential tomography. Geophys. Prospect. 1997, 45, 653–681. [Google Scholar] [CrossRef]
- Mauriello, P.; Patella, D. Resistivity anomaly imaging by probability tomography. Geophys. Prospect. 1999, 47, 411–429. [Google Scholar] [CrossRef]
- Amato, V.; Cozzolino, M.; De Benedittis, G.; Di Paola, G.; Gentile, V.; Giordano, C.; Marino, P.; Rosskopf, C.M.; Valente, E. An integrated quantitative approach to assess the archaeological heritage in highly anthropized areas: the case study of Aesernia (southern Italy). ACTA IMECO 2016, 5, 33–43. [Google Scholar] [CrossRef]
- Compare, V.; Cozzolino, M.; Mauriello, P.; Patella, D. Resistivity probability tomography at the Castle of Zena (Italy). EURASIP J. Image Video 2009, 2009, 693274. [Google Scholar] [CrossRef]
- Cozzolino, M.; Di Giovanni, E.; Mauriello, P.; Vanni Desideri, A.; Patella, D. Resistivity tomography in the Park of Pratolino at Vaglia (Florence, Italy). Archaeol. Prospect. 2012, 19, 253–260. [Google Scholar] [CrossRef]
- Cozzolino, M.; Mauriello, P.; Patella, D. Resistivity Tomography Imaging of the substratum of the Bedestan Monumental Complex at Nicosia, Cyprus. Archaeometry 2014, 56, 331–350. [Google Scholar] [CrossRef]
- Rose, D.; Cozzolino, M.; Mauriello, P. Preliminary notes of the research on the Roman aqueduct of Alba Fucens (AQ) in Italy. The geophysical prospecting in the study of the free-flowing channel and the inverted siphon. Babesch 2015, 27, 107–112. [Google Scholar]
- Rizzo, M. Aree e Quartieri Artigianali in Magna Grecia; Pandemos: Paestum, Italy, forthcoming 2020. (In Italian)
- Pescatore, T.S.; Viggiani, C. La geologia della Piana dei Sele e caratteri del sottosuolo dell’area di Paestum. PACT 1989, 32, 29–42. (In Italian) [Google Scholar]
- Carando, E.; De Bonis, R.; Ficuciello, L. IndaginiStratigrafiche Sulla Plateia B: Il LatoOvest. In Paestum. Scavi, Studi, Ricerche. Bilancio di un Decennio (1988–1998); Greco, E., Longo, F., Eds.; Pandemos: Paestum, Italy, 2000; pp. 177–180. (In Italian) [Google Scholar]
- Jannelli, L. Il Settore Nord-Orientale. In Paestum Scavi, Studi, Ricerche. Bilancio di un Decennio (1988–1998); Greco, E., Longo, F., Eds.; Pandemos: Paestum, Italy, 2000; pp. 91–96. (In Italian) [Google Scholar]


| Area | Profile | ρa, Min | ρa, Max | ρa, Mean |
|---|---|---|---|---|
| 1 | 01 | 89.72 | 1246.45 | 583.35 |
| 1 | 02 | 55.84 | 2886.83 | 1296.42 |
| 1 | 03 | 215.09 | 1342.13 | 525.23 |
| 1 | 04 | 116.23 | 774.08 | 386.52 |
| 1 | 05 | 85.76 | 604.75 | 343.01 |
| 1 | 06 | 58.05 | 718.79 | 332.50 |
| 1 | 07 | 123.75 | 671.18 | 364.03 |
| 1 | 08 | 82.10 | 856.77 | 434.46 |
| 1 | 09 | 89.84 | 1023.57 | 516.03 |
| 1 | 10 | 213.00 | 1837.72 | 691.69 |
| 1 | 11 | 188.91 | 2603.75 | 708.92 |
| 1 | 12 | 296.77 | 3421.57 | 747.52 |
| 1 | 13 | 200.55 | 4448.58 | 747.27 |
| 1 | 14 | 345.07 | 2094.18 | 841.12 |
| 1 | 15 | 346.03 | 1683.64 | 860.03 |
| 1 | 16 | 406.33 | 1749.84 | 946.32 |
| 1 | 17 | 333.61 | 2186.82 | 995.31 |
| 2 | 18 | 203.78 | 840.94 | 407.26 |
| 2 | 19 | 200.43 | 829.80 | 396.37 |
| 2 | 20 | 200.56 | 743.30 | 414.36 |
| 2 | 21 | 191.32 | 810.94 | 418.76 |
| 2 | 22 | 181.20 | 760.47 | 407.63 |
| 2 | 23 | 182.52 | 773.87 | 393.24 |
| 2 | 24 | 100.21 | 977.64 | 373.25 |
© 2019 by the authors. Licensee MDPI, Basel, Switzerland. This article is an open access article distributed under the terms and conditions of the Creative Commons Attribution (CC BY) license (http://creativecommons.org/licenses/by/4.0/).
Share and Cite
Cozzolino, M.; Longo, F.; Pizzano, N.; Rizzo, M.L.; Voza, O.; Amato, V. A Multidisciplinary Approach to the Study of the Temple of Athena in Poseidonia-Paestum (Southern Italy): New Geomorphological, Geophysical and Archaeological Data. Geosciences 2019, 9, 324. https://0-doi-org.brum.beds.ac.uk/10.3390/geosciences9080324
Cozzolino M, Longo F, Pizzano N, Rizzo ML, Voza O, Amato V. A Multidisciplinary Approach to the Study of the Temple of Athena in Poseidonia-Paestum (Southern Italy): New Geomorphological, Geophysical and Archaeological Data. Geosciences. 2019; 9(8):324. https://0-doi-org.brum.beds.ac.uk/10.3390/geosciences9080324
Chicago/Turabian StyleCozzolino, Marilena, Fausto Longo, Natascia Pizzano, Maria Luigia Rizzo, Ottavia Voza, and Vincenzo Amato. 2019. "A Multidisciplinary Approach to the Study of the Temple of Athena in Poseidonia-Paestum (Southern Italy): New Geomorphological, Geophysical and Archaeological Data" Geosciences 9, no. 8: 324. https://0-doi-org.brum.beds.ac.uk/10.3390/geosciences9080324